Kenton, OH Map & Demographics
Kenton Map
Kenton Overview
$25,281
PER CAPITA INCOME
$53,293
AVG FAMILY INCOME
$46,809
AVG HOUSEHOLD INCOME
47.2%
WAGE / INCOME GAP [ % ]
52.8¢/ $1
WAGE / INCOME GAP [ $ ]
0.43
INEQUALITY / GINI INDEX
7,685
TOTAL POPULATION
3,861
MALE POPULATION
3,824
FEMALE POPULATION
100.97
MALES / 100 FEMALES
99.04
FEMALES / 100 MALES
40.1
MEDIAN AGE
2.9
AVG FAMILY SIZE
2.3
AVG HOUSEHOLD SIZE
3,245
LABOR FORCE [ PEOPLE ]
53.8%
PERCENT IN LABOR FORCE
8.3%
UNEMPLOYMENT RATE
Kenton Zip Codes
Income in Kenton
Income Overview in Kenton
Per Capita Income in Kenton is $25,281, while median incomes of families and households are $53,293 and $46,809 respectively.
| Characteristic | Number | Measure |
| Per Capita Income | 7,685 | $25,281 |
| Median Family Income | 2,007 | $53,293 |
| Mean Family Income | 2,007 | $69,741 |
| Median Household Income | 3,298 | $46,809 |
| Mean Household Income | 3,298 | $57,058 |
| Income Deficit | 2,007 | $0 |
| Wage / Income Gap (%) | 7,685 | 47.21% |
| Wage / Income Gap ($) | 7,685 | 52.79¢ per $1 |
| Gini / Inequality Index | 7,685 | 0.43 |
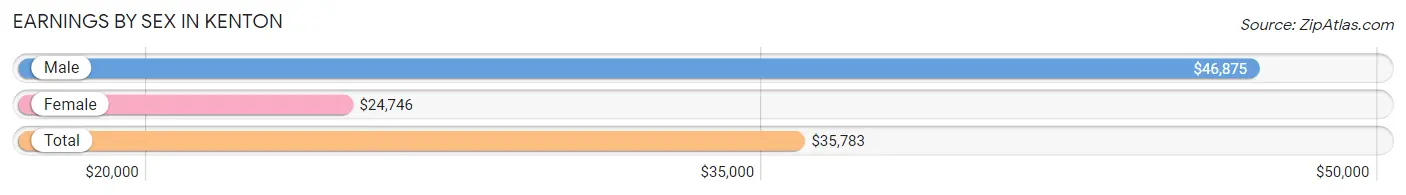
Earnings by Sex in Kenton
Average Earnings in Kenton are $35,783, $46,875 for men and $24,746 for women, a difference of 47.2%.
| Sex | Number | Average Earnings |
| Male | 1,876 (55.0%) | $46,875 |
| Female | 1,536 (45.0%) | $24,746 |
| Total | 3,412 (100.0%) | $35,783 |
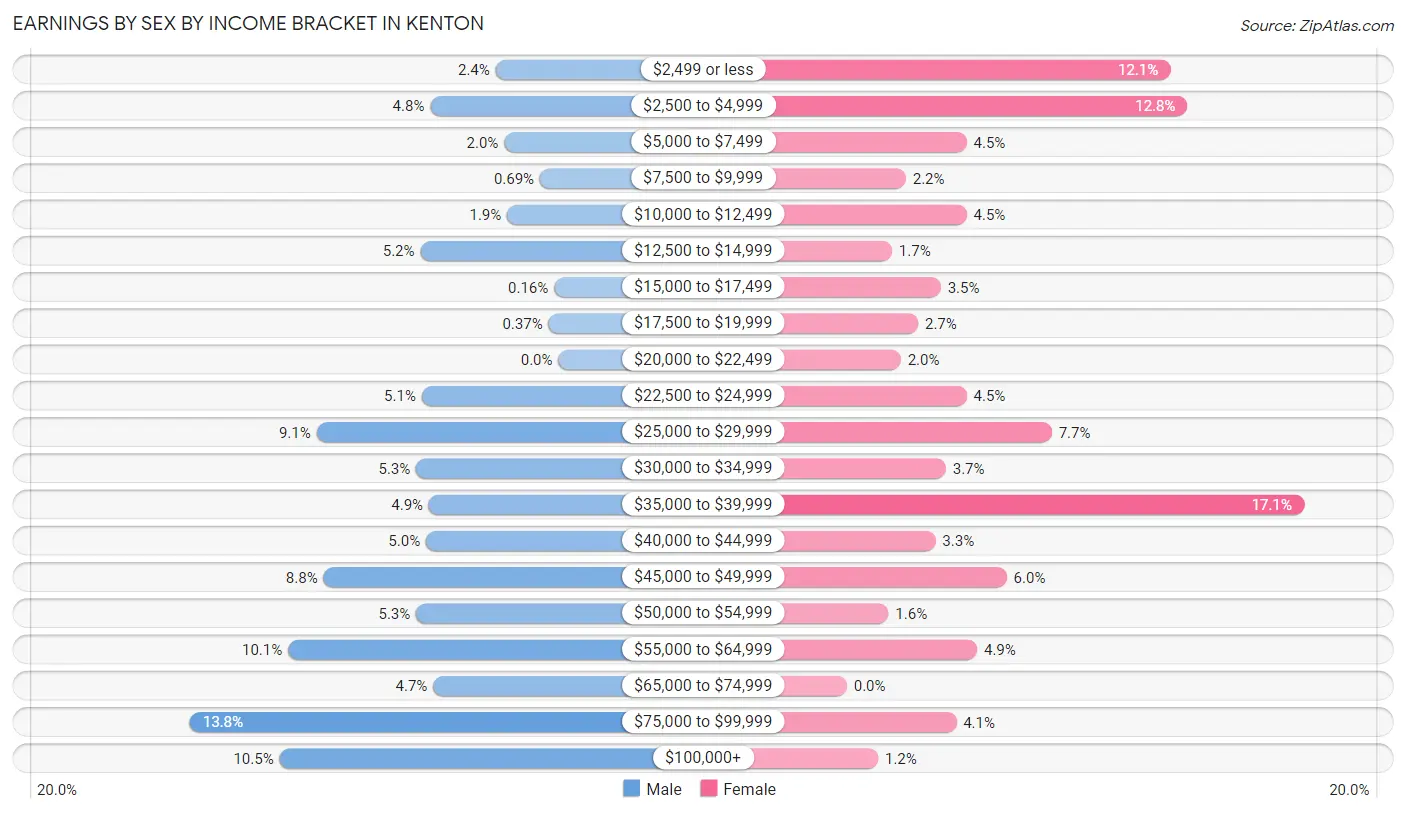
Earnings by Sex by Income Bracket in Kenton
The most common earnings brackets in Kenton are $75,000 to $99,999 for men (259 | 13.8%) and $35,000 to $39,999 for women (263 | 17.1%).
| Income | Male | Female |
| $2,499 or less | 44 (2.4%) | 186 (12.1%) |
| $2,500 to $4,999 | 90 (4.8%) | 196 (12.8%) |
| $5,000 to $7,499 | 38 (2.0%) | 69 (4.5%) |
| $7,500 to $9,999 | 13 (0.7%) | 34 (2.2%) |
| $10,000 to $12,499 | 36 (1.9%) | 69 (4.5%) |
| $12,500 to $14,999 | 97 (5.2%) | 26 (1.7%) |
| $15,000 to $17,499 | 3 (0.2%) | 54 (3.5%) |
| $17,500 to $19,999 | 7 (0.4%) | 41 (2.7%) |
| $20,000 to $22,499 | 0 (0.0%) | 31 (2.0%) |
| $22,500 to $24,999 | 96 (5.1%) | 69 (4.5%) |
| $25,000 to $29,999 | 170 (9.1%) | 118 (7.7%) |
| $30,000 to $34,999 | 100 (5.3%) | 57 (3.7%) |
| $35,000 to $39,999 | 91 (4.9%) | 263 (17.1%) |
| $40,000 to $44,999 | 93 (5.0%) | 51 (3.3%) |
| $45,000 to $49,999 | 165 (8.8%) | 92 (6.0%) |
| $50,000 to $54,999 | 100 (5.3%) | 24 (1.6%) |
| $55,000 to $64,999 | 190 (10.1%) | 75 (4.9%) |
| $65,000 to $74,999 | 88 (4.7%) | 0 (0.0%) |
| $75,000 to $99,999 | 259 (13.8%) | 63 (4.1%) |
| $100,000+ | 196 (10.4%) | 18 (1.2%) |
| Total | 1,876 (100.0%) | 1,536 (100.0%) |
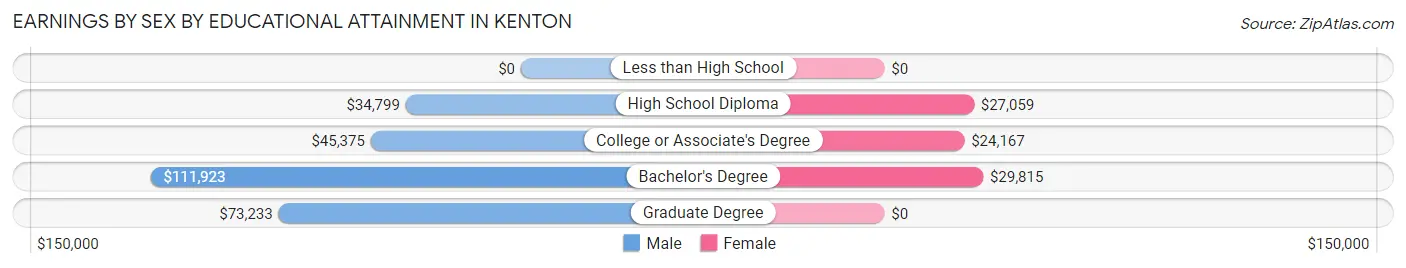
Earnings by Sex by Educational Attainment in Kenton
Average earnings in Kenton are $47,031 for men and $26,698 for women, a difference of 43.2%. Men with an educational attainment of bachelor's degree enjoy the highest average annual earnings of $111,923, while those with high school diploma education earn the least with $34,799. Women with an educational attainment of bachelor's degree earn the most with the average annual earnings of $29,815, while those with college or associate's degree education have the smallest earnings of $24,167.
| Educational Attainment | Male Income | Female Income |
| Less than High School | - | - |
| High School Diploma | $34,799 | $27,059 |
| College or Associate's Degree | $45,375 | $24,167 |
| Bachelor's Degree | $111,923 | $29,815 |
| Graduate Degree | $73,233 | $0 |
| Total | $47,031 | $26,698 |
Family Income in Kenton
Family Income Brackets in Kenton
According to the Kenton family income data, there are 462 families falling into the $50,000 to $74,999 income range, which is the most common income bracket and makes up 23.0% of all families. Conversely, the $10,000 to $14,999 income bracket is the least frequent group with only 28 families (1.4%) belonging to this category.
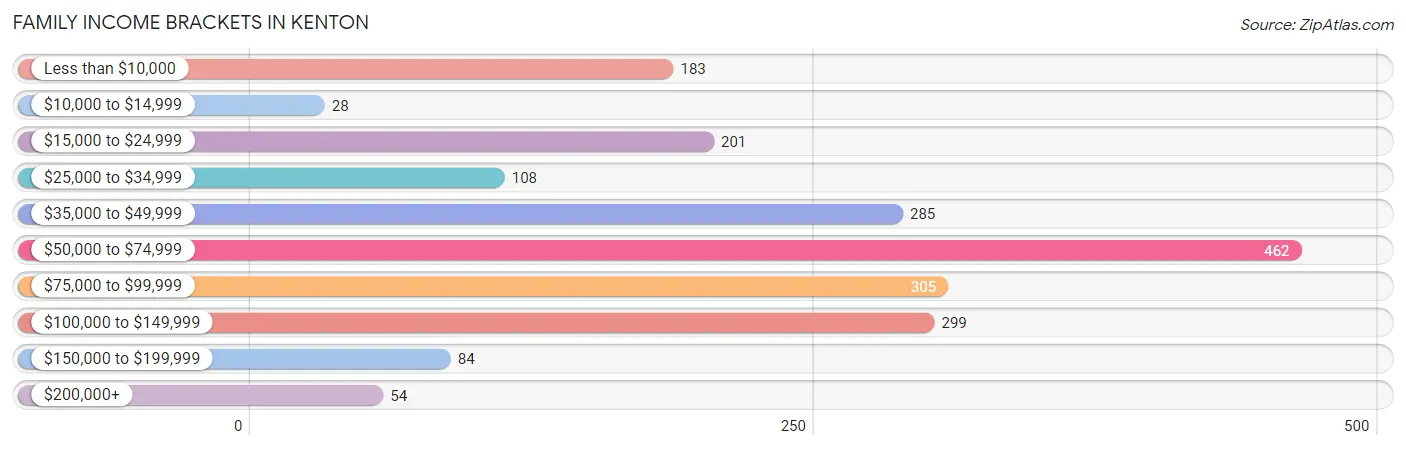
| Income Bracket | # Families | % Families |
| Less than $10,000 | 183 | 9.1% |
| $10,000 to $14,999 | 28 | 1.4% |
| $15,000 to $24,999 | 201 | 10.0% |
| $25,000 to $34,999 | 108 | 5.4% |
| $35,000 to $49,999 | 285 | 14.2% |
| $50,000 to $74,999 | 462 | 23.0% |
| $75,000 to $99,999 | 305 | 15.2% |
| $100,000 to $149,999 | 299 | 14.9% |
| $150,000 to $199,999 | 84 | 4.2% |
| $200,000+ | 54 | 2.7% |
Family Income by Famaliy Size in Kenton
5-person families (185 | 9.2%) account for the highest median family income in Kenton with $55,547 per family, while 2-person families (969 | 48.3%) have the highest median income of $25,956 per family member.
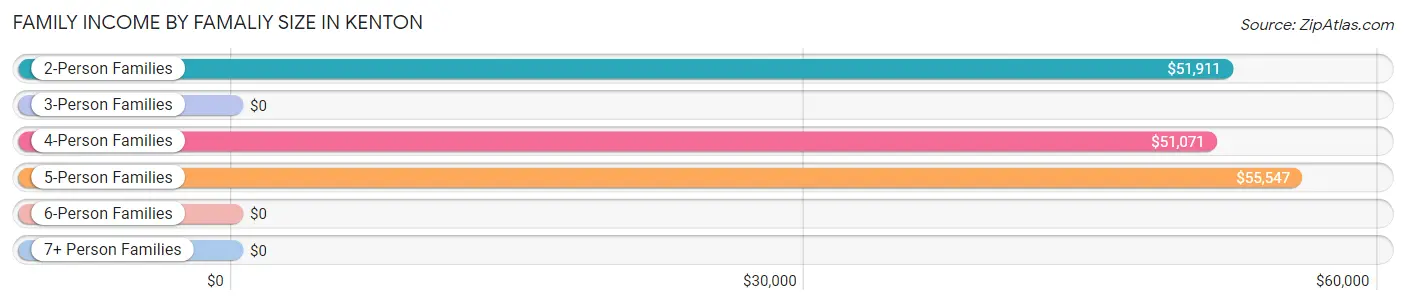
| Income Bracket | # Families | Median Income |
| 2-Person Families | 969 (48.3%) | $51,911 |
| 3-Person Families | 435 (21.7%) | $0 |
| 4-Person Families | 350 (17.4%) | $51,071 |
| 5-Person Families | 185 (9.2%) | $55,547 |
| 6-Person Families | 18 (0.9%) | $0 |
| 7+ Person Families | 50 (2.5%) | $0 |
| Total | 2,007 (100.0%) | $53,293 |
Family Income by Number of Earners in Kenton
The median family income in Kenton is $53,293, with families comprising 3+ earners (104) having the highest median family income of $140,000, while families with no earners (492) have the lowest median family income of $22,500, accounting for 5.2% and 24.5% of families, respectively.
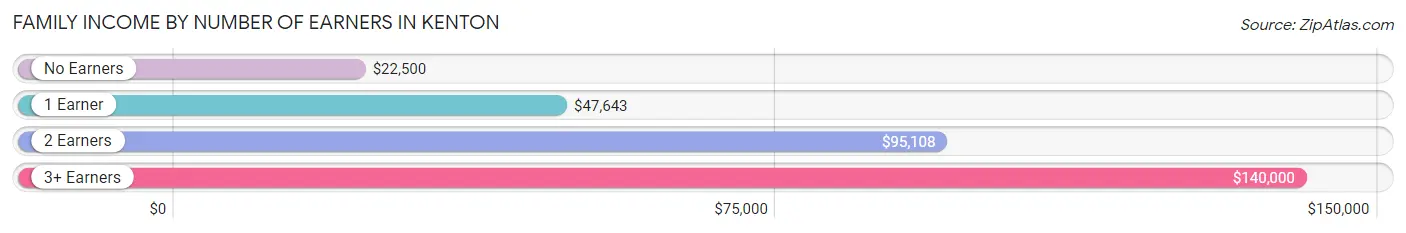
| Number of Earners | # Families | Median Income |
| No Earners | 492 (24.5%) | $22,500 |
| 1 Earner | 540 (26.9%) | $47,643 |
| 2 Earners | 871 (43.4%) | $95,108 |
| 3+ Earners | 104 (5.2%) | $140,000 |
| Total | 2,007 (100.0%) | $53,293 |
Household Income in Kenton
Household Income Brackets in Kenton
With 676 households falling in the category, the $50,000 to $74,999 income range is the most frequent in Kenton, accounting for 20.5% of all households. In contrast, only 53 households (1.6%) fall into the $200,000+ income bracket, making it the least populous group.
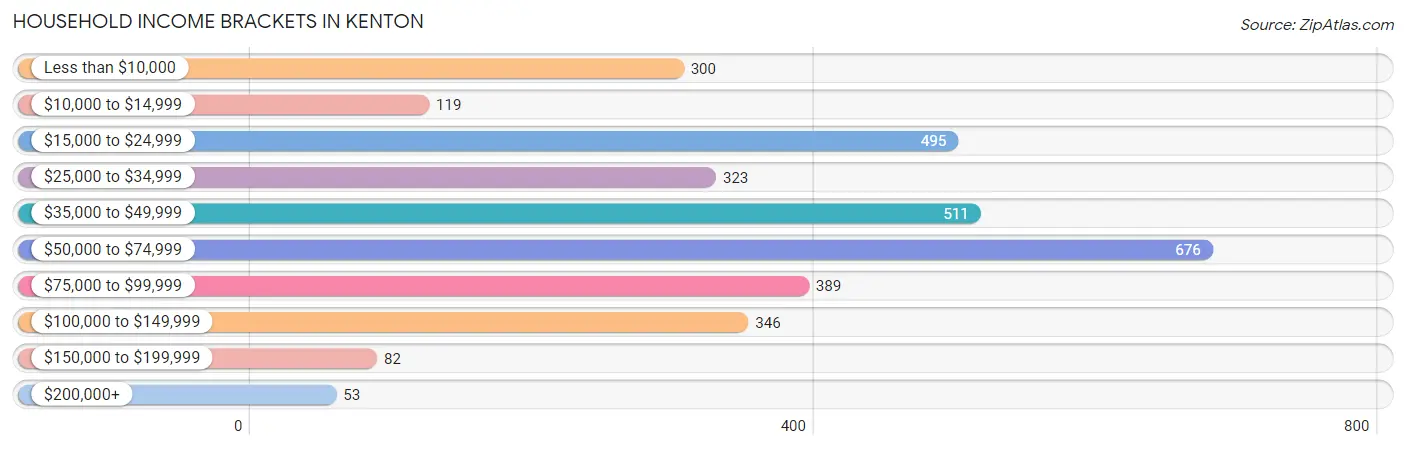
| Income Bracket | # Households | % Households |
| Less than $10,000 | 300 | 9.1% |
| $10,000 to $14,999 | 119 | 3.6% |
| $15,000 to $24,999 | 495 | 15.0% |
| $25,000 to $34,999 | 323 | 9.8% |
| $35,000 to $49,999 | 511 | 15.5% |
| $50,000 to $74,999 | 676 | 20.5% |
| $75,000 to $99,999 | 389 | 11.8% |
| $100,000 to $149,999 | 346 | 10.5% |
| $150,000 to $199,999 | 82 | 2.5% |
| $200,000+ | 53 | 1.6% |
Household Income by Householder Age in Kenton
The median household income in Kenton is $46,809, with the highest median household income of $69,954 found in the 15 to 24 years age bracket for the primary householder. A total of 325 households (9.9%) fall into this category. Meanwhile, the 65+ years age bracket for the primary householder has the lowest median household income of $35,810, with 1,072 households (32.5%) in this group.
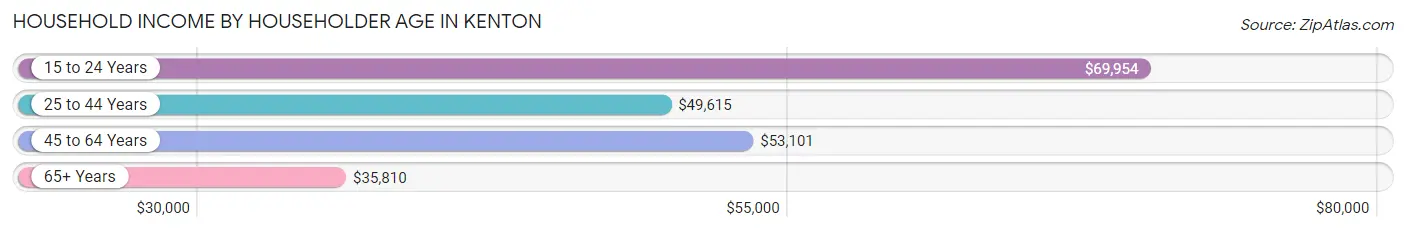
| Income Bracket | # Households | Median Income |
| 15 to 24 Years | 325 (9.9%) | $69,954 |
| 25 to 44 Years | 936 (28.4%) | $49,615 |
| 45 to 64 Years | 965 (29.3%) | $53,101 |
| 65+ Years | 1,072 (32.5%) | $35,810 |
| Total | 3,298 (100.0%) | $46,809 |
Poverty in Kenton
Income Below Poverty by Sex and Age in Kenton
With 15.7% poverty level for males and 24.9% for females among the residents of Kenton, 6 to 11 year old males and 5 year old females are the most vulnerable to poverty, with 157 males (40.2%) and 33 females (67.3%) in their respective age groups living below the poverty level.
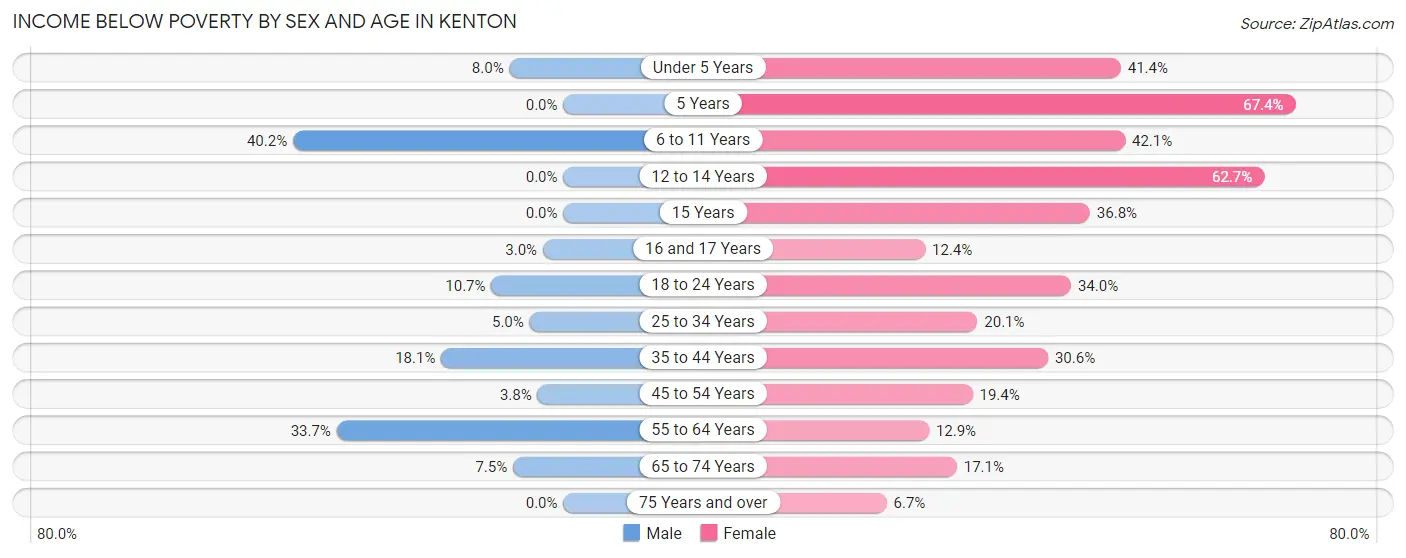
| Age Bracket | Male | Female |
| Under 5 Years | 10 (8.0%) | 104 (41.4%) |
| 5 Years | 0 (0.0%) | 33 (67.3%) |
| 6 to 11 Years | 157 (40.2%) | 143 (42.1%) |
| 12 to 14 Years | 0 (0.0%) | 42 (62.7%) |
| 15 Years | 0 (0.0%) | 28 (36.8%) |
| 16 and 17 Years | 2 (3.0%) | 12 (12.4%) |
| 18 to 24 Years | 59 (10.7%) | 131 (34.0%) |
| 25 to 34 Years | 17 (5.0%) | 62 (20.1%) |
| 35 to 44 Years | 103 (18.1%) | 154 (30.6%) |
| 45 to 54 Years | 10 (3.8%) | 46 (19.4%) |
| 55 to 64 Years | 205 (33.7%) | 70 (12.9%) |
| 65 to 74 Years | 23 (7.5%) | 55 (17.1%) |
| 75 Years and over | 0 (0.0%) | 33 (6.7%) |
| Total | 586 (15.7%) | 913 (24.9%) |
Income Above Poverty by Sex and Age in Kenton
According to the poverty statistics in Kenton, males aged 5 years and females aged 75 years and over are the age groups that are most secure financially, with 100.0% of males and 93.3% of females in these age groups living above the poverty line.
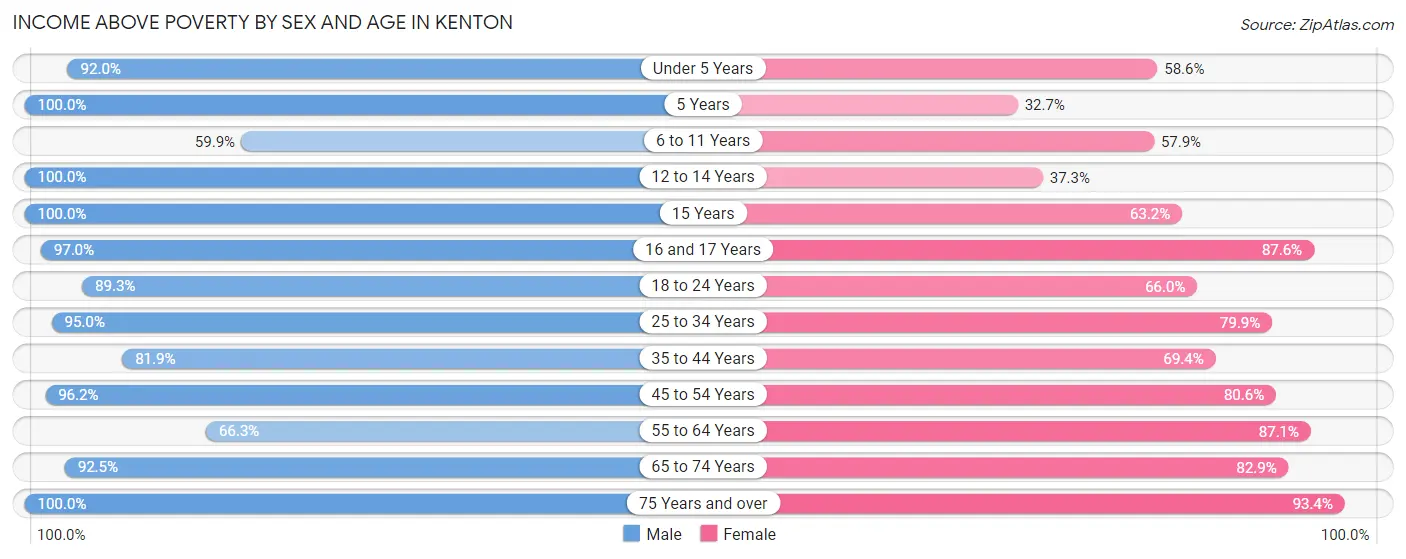
| Age Bracket | Male | Female |
| Under 5 Years | 115 (92.0%) | 147 (58.6%) |
| 5 Years | 139 (100.0%) | 16 (32.7%) |
| 6 to 11 Years | 234 (59.9%) | 197 (57.9%) |
| 12 to 14 Years | 53 (100.0%) | 25 (37.3%) |
| 15 Years | 76 (100.0%) | 48 (63.2%) |
| 16 and 17 Years | 64 (97.0%) | 85 (87.6%) |
| 18 to 24 Years | 493 (89.3%) | 254 (66.0%) |
| 25 to 34 Years | 322 (95.0%) | 246 (79.9%) |
| 35 to 44 Years | 465 (81.9%) | 349 (69.4%) |
| 45 to 54 Years | 251 (96.2%) | 191 (80.6%) |
| 55 to 64 Years | 404 (66.3%) | 471 (87.1%) |
| 65 to 74 Years | 285 (92.5%) | 267 (82.9%) |
| 75 Years and over | 253 (100.0%) | 463 (93.3%) |
| Total | 3,154 (84.3%) | 2,759 (75.1%) |
Income Below Poverty Among Married-Couple Families in Kenton
The poverty statistics for married-couple families in Kenton show that 10.7% or 142 of the total 1,325 families live below the poverty line. Families with 3 or 4 children have the highest poverty rate of 44.3%, comprising of 62 families. On the other hand, families with 1 or 2 children have the lowest poverty rate of 0.0%, which includes 0 families.
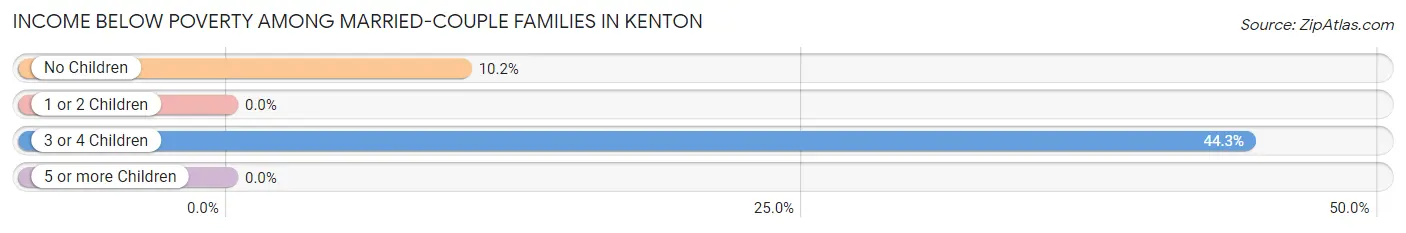
| Children | Above Poverty | Below Poverty |
| No Children | 707 (89.8%) | 80 (10.2%) |
| 1 or 2 Children | 348 (100.0%) | 0 (0.0%) |
| 3 or 4 Children | 78 (55.7%) | 62 (44.3%) |
| 5 or more Children | 50 (100.0%) | 0 (0.0%) |
| Total | 1,183 (89.3%) | 142 (10.7%) |
Income Below Poverty Among Single-Parent Households in Kenton
According to the poverty data in Kenton, 18.4% or 45 single-father households and 33.6% or 147 single-mother households are living below the poverty line. Among single-father households, those with 1 or 2 children have the highest poverty rate, with 45 households (21.8%) experiencing poverty. Likewise, among single-mother households, those with 3 or 4 children have the highest poverty rate, with 63 households (100.0%) falling below the poverty line.
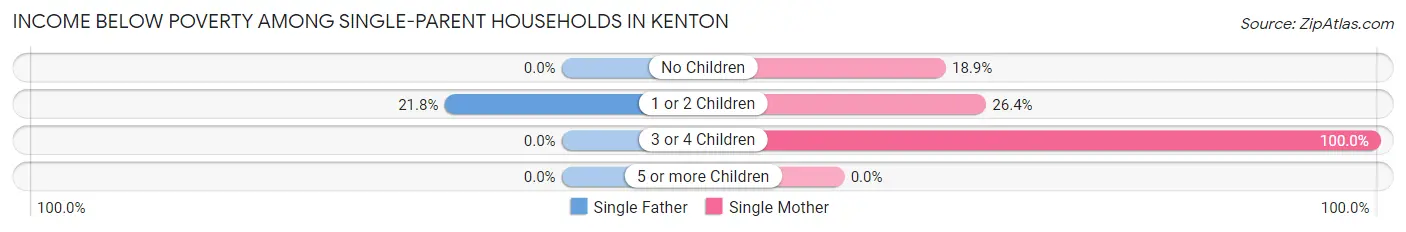
| Children | Single Father | Single Mother |
| No Children | 0 (0.0%) | 37 (18.9%) |
| 1 or 2 Children | 45 (21.8%) | 47 (26.4%) |
| 3 or 4 Children | 0 (0.0%) | 63 (100.0%) |
| 5 or more Children | 0 (0.0%) | 0 (0.0%) |
| Total | 45 (18.4%) | 147 (33.6%) |
Income Below Poverty Among Married-Couple vs Single-Parent Households in Kenton
The poverty data for Kenton shows that 142 of the married-couple family households (10.7%) and 192 of the single-parent households (28.1%) are living below the poverty level. Within the married-couple family households, those with 3 or 4 children have the highest poverty rate, with 62 households (44.3%) falling below the poverty line. Among the single-parent households, those with 3 or 4 children have the highest poverty rate, with 63 household (75.0%) living below poverty.
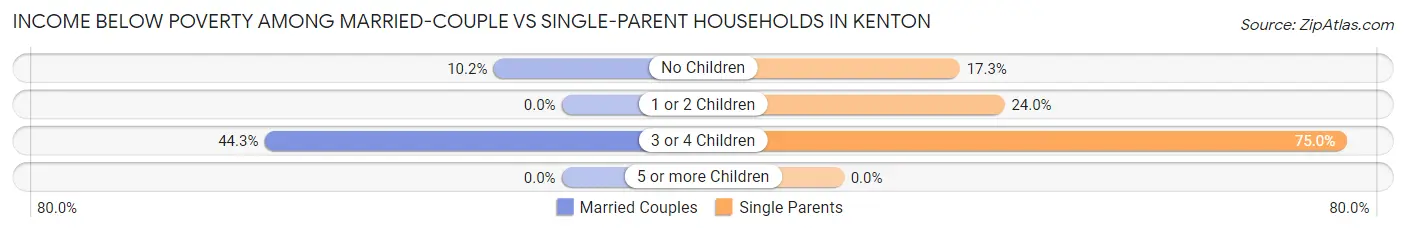
| Children | Married-Couple Families | Single-Parent Households |
| No Children | 80 (10.2%) | 37 (17.3%) |
| 1 or 2 Children | 0 (0.0%) | 92 (24.0%) |
| 3 or 4 Children | 62 (44.3%) | 63 (75.0%) |
| 5 or more Children | 0 (0.0%) | 0 (0.0%) |
| Total | 142 (10.7%) | 192 (28.1%) |
Race in Kenton
The most populous races in Kenton are White / Caucasian (7,294 | 94.9%), Two or more Races (247 | 3.2%), and Hispanic or Latino (77 | 1.0%).
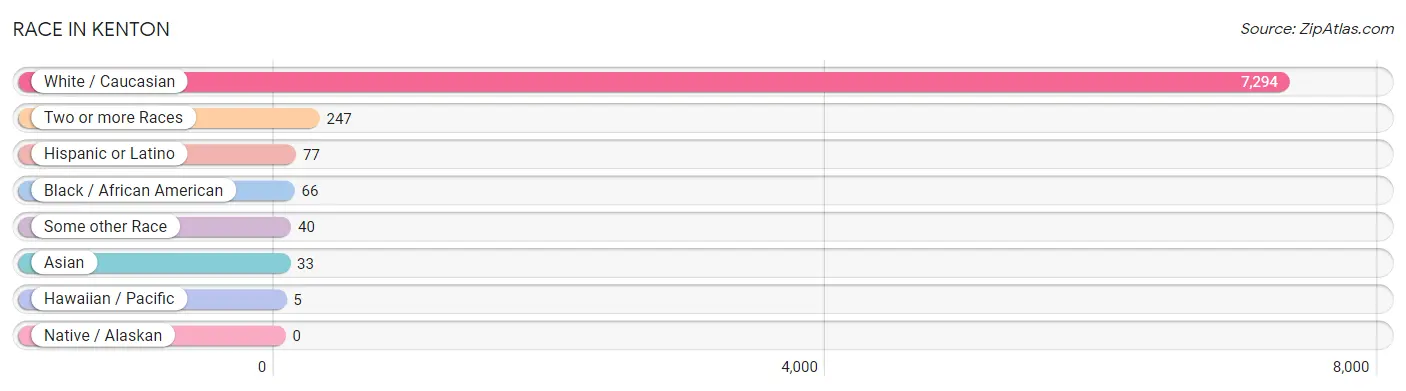
| Race | # Population | % Population |
| Asian | 33 | 0.4% |
| Black / African American | 66 | 0.9% |
| Hawaiian / Pacific | 5 | 0.1% |
| Hispanic or Latino | 77 | 1.0% |
| Native / Alaskan | 0 | 0.0% |
| White / Caucasian | 7,294 | 94.9% |
| Two or more Races | 247 | 3.2% |
| Some other Race | 40 | 0.5% |
| Total | 7,685 | 100.0% |
Ancestry in Kenton
The most populous ancestries reported in Kenton are German (1,575 | 20.5%), Irish (1,074 | 14.0%), English (979 | 12.7%), American (859 | 11.2%), and Dutch (341 | 4.4%), together accounting for 62.8% of all Kenton residents.
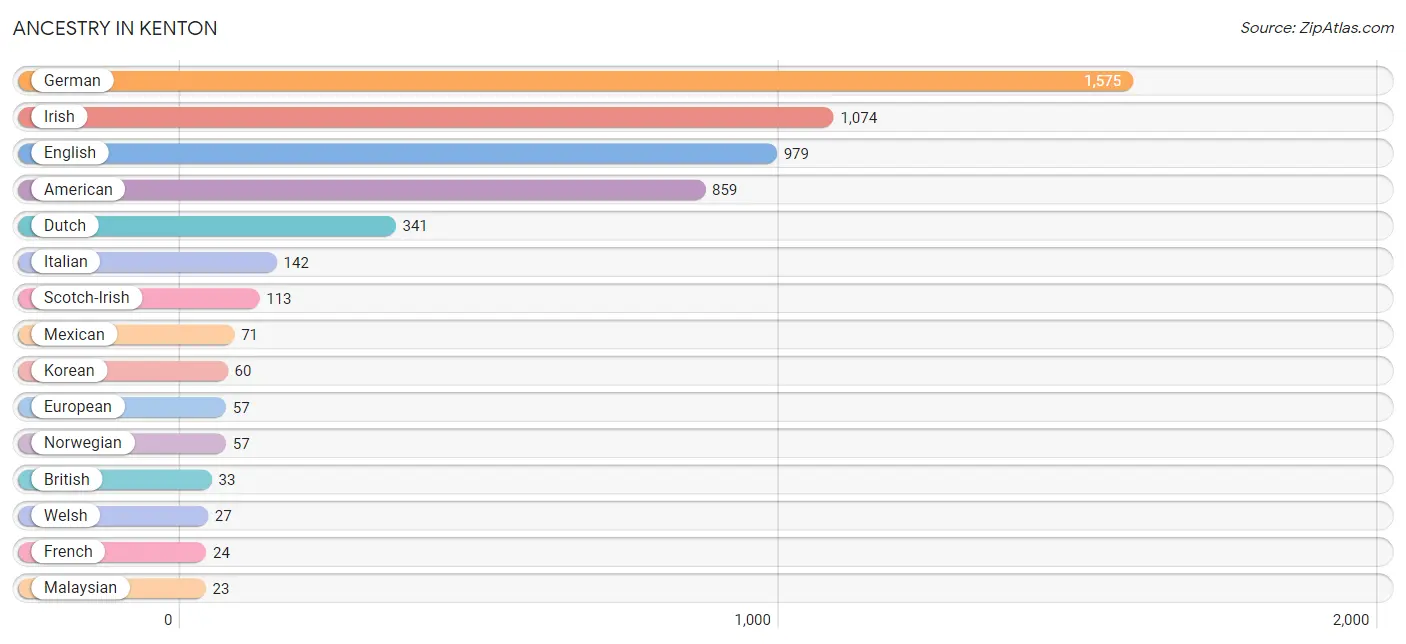
| Ancestry | # Population | % Population |
| American | 859 | 11.2% |
| Blackfeet | 11 | 0.1% |
| British | 33 | 0.4% |
| Cherokee | 15 | 0.2% |
| Crow | 4 | 0.1% |
| Cuban | 6 | 0.1% |
| Czechoslovakian | 14 | 0.2% |
| Danish | 22 | 0.3% |
| Dutch | 341 | 4.4% |
| Eastern European | 8 | 0.1% |
| English | 979 | 12.7% |
| European | 57 | 0.7% |
| French | 24 | 0.3% |
| German | 1,575 | 20.5% |
| Greek | 5 | 0.1% |
| Irish | 1,074 | 14.0% |
| Italian | 142 | 1.8% |
| Korean | 60 | 0.8% |
| Malaysian | 23 | 0.3% |
| Mexican | 71 | 0.9% |
| Native Hawaiian | 5 | 0.1% |
| Northern European | 22 | 0.3% |
| Norwegian | 57 | 0.7% |
| Polish | 16 | 0.2% |
| Samoan | 5 | 0.1% |
| Scotch-Irish | 113 | 1.5% |
| Scottish | 9 | 0.1% |
| Swedish | 4 | 0.1% |
| Swiss | 8 | 0.1% |
| Ukrainian | 22 | 0.3% |
| Welsh | 27 | 0.4% | View All 31 Rows |
Immigrants in Kenton
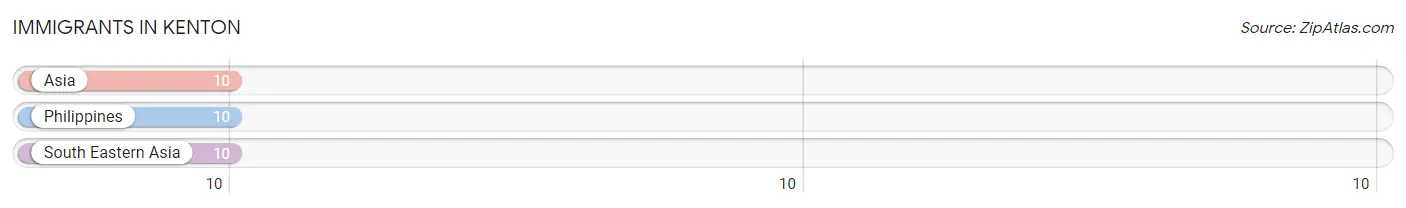
The most numerous immigrant groups reported in Kenton came from Asia (10 | 0.1%), Philippines (10 | 0.1%), and South Eastern Asia (10 | 0.1%), together accounting for 0.4% of all Kenton residents.
| Immigration Origin | # Population | % Population |
| Asia | 10 | 0.1% |
| Philippines | 10 | 0.1% |
| South Eastern Asia | 10 | 0.1% | View All 3 Rows |
Sex and Age in Kenton
Sex and Age in Kenton
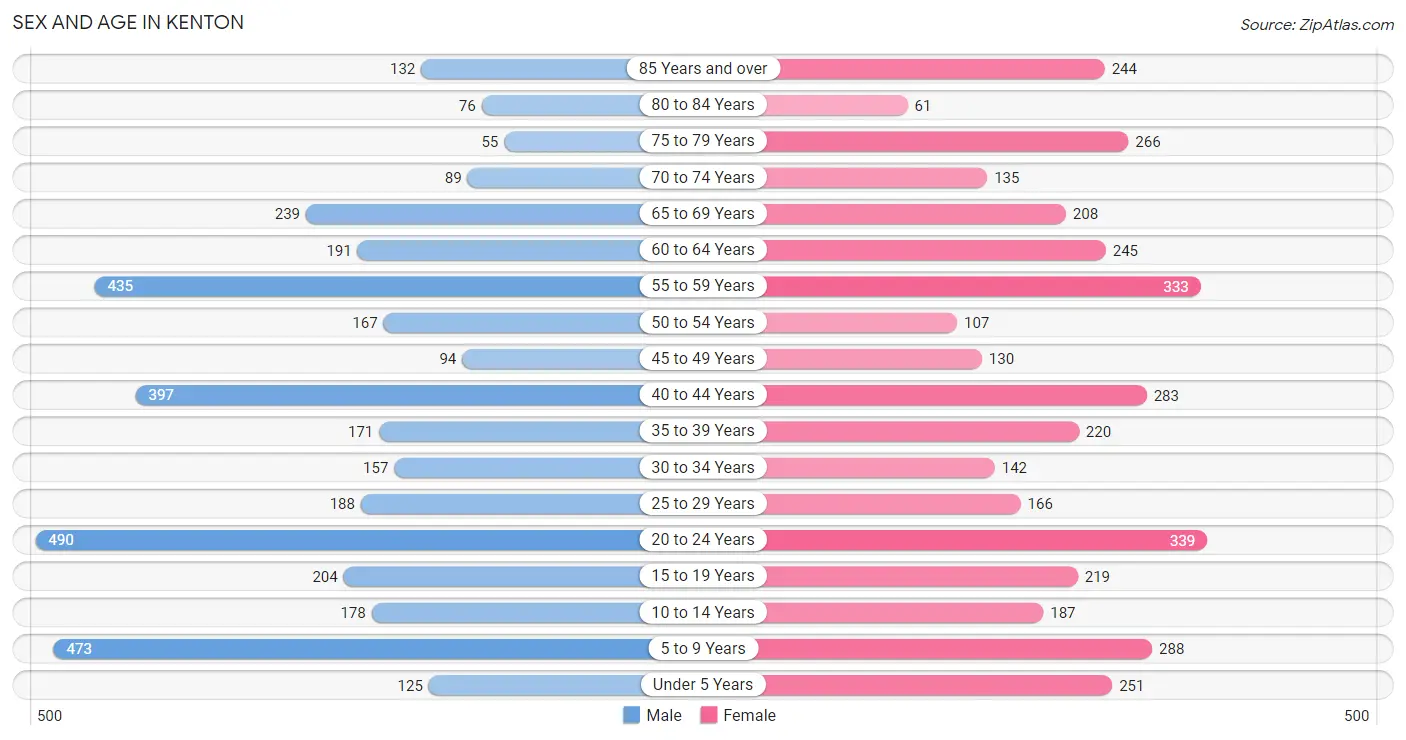
The most populous age groups in Kenton are 20 to 24 Years (490 | 12.7%) for men and 20 to 24 Years (339 | 8.9%) for women.
| Age Bracket | Male | Female |
| Under 5 Years | 125 (3.2%) | 251 (6.6%) |
| 5 to 9 Years | 473 (12.2%) | 288 (7.5%) |
| 10 to 14 Years | 178 (4.6%) | 187 (4.9%) |
| 15 to 19 Years | 204 (5.3%) | 219 (5.7%) |
| 20 to 24 Years | 490 (12.7%) | 339 (8.9%) |
| 25 to 29 Years | 188 (4.9%) | 166 (4.3%) |
| 30 to 34 Years | 157 (4.1%) | 142 (3.7%) |
| 35 to 39 Years | 171 (4.4%) | 220 (5.8%) |
| 40 to 44 Years | 397 (10.3%) | 283 (7.4%) |
| 45 to 49 Years | 94 (2.4%) | 130 (3.4%) |
| 50 to 54 Years | 167 (4.3%) | 107 (2.8%) |
| 55 to 59 Years | 435 (11.3%) | 333 (8.7%) |
| 60 to 64 Years | 191 (5.0%) | 245 (6.4%) |
| 65 to 69 Years | 239 (6.2%) | 208 (5.4%) |
| 70 to 74 Years | 89 (2.3%) | 135 (3.5%) |
| 75 to 79 Years | 55 (1.4%) | 266 (7.0%) |
| 80 to 84 Years | 76 (2.0%) | 61 (1.6%) |
| 85 Years and over | 132 (3.4%) | 244 (6.4%) |
| Total | 3,861 (100.0%) | 3,824 (100.0%) |
Families and Households in Kenton
Median Family Size in Kenton
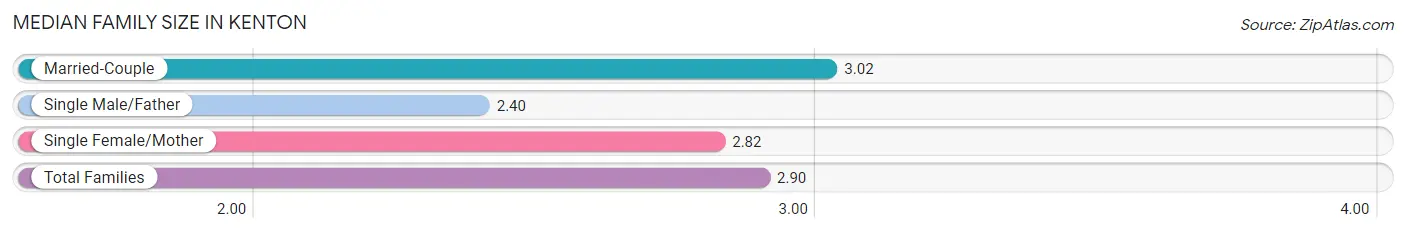
The median family size in Kenton is 2.90 persons per family, with married-couple families (1,325 | 66.0%) accounting for the largest median family size of 3.02 persons per family. On the other hand, single male/father families (245 | 12.2%) represent the smallest median family size with 2.40 persons per family.
| Family Type | # Families | Family Size |
| Married-Couple | 1,325 (66.0%) | 3.02 |
| Single Male/Father | 245 (12.2%) | 2.40 |
| Single Female/Mother | 437 (21.8%) | 2.82 |
| Total Families | 2,007 (100.0%) | 2.90 |
Median Household Size in Kenton
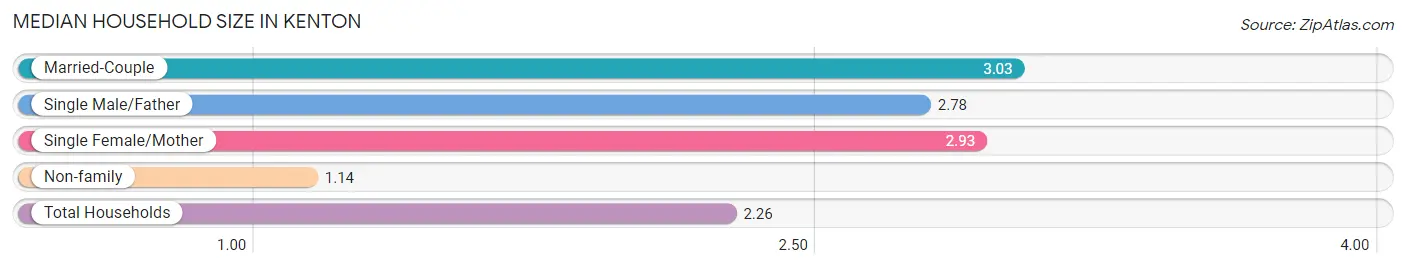
The median household size in Kenton is 2.26 persons per household, with married-couple households (1,325 | 40.2%) accounting for the largest median household size of 3.03 persons per household. non-family households (1,291 | 39.1%) represent the smallest median household size with 1.14 persons per household.
| Household Type | # Households | Household Size |
| Married-Couple | 1,325 (40.2%) | 3.03 |
| Single Male/Father | 245 (7.4%) | 2.78 |
| Single Female/Mother | 437 (13.3%) | 2.93 |
| Non-family | 1,291 (39.1%) | 1.14 |
| Total Households | 3,298 (100.0%) | 2.26 |
Household Size by Marriage Status in Kenton
Out of a total of 3,298 households in Kenton, 2,007 (60.9%) are family households, while 1,291 (39.1%) are nonfamily households. The most numerous type of family households are 2-person households, comprising 938, and the most common type of nonfamily households are 1-person households, comprising 1,123.
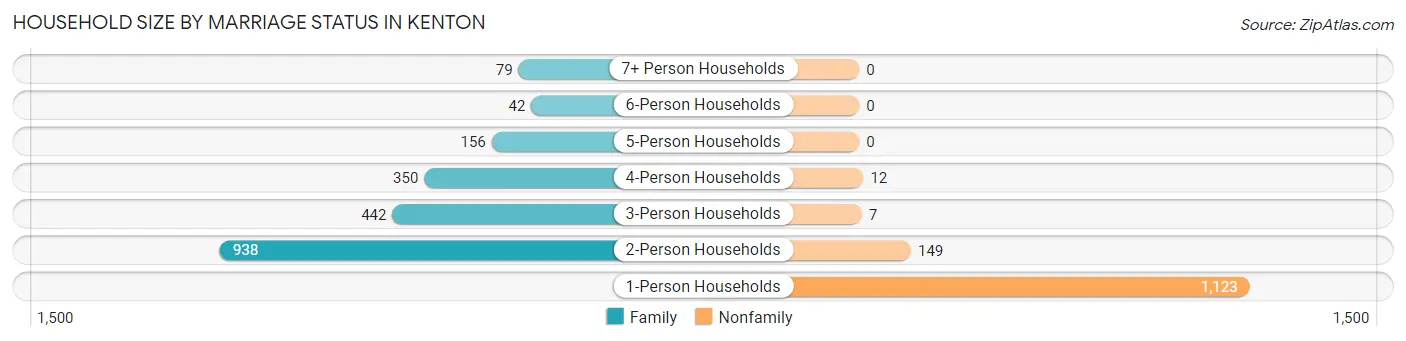
| Household Size | Family Households | Nonfamily Households |
| 1-Person Households | - | 1,123 (34.1%) |
| 2-Person Households | 938 (28.4%) | 149 (4.5%) |
| 3-Person Households | 442 (13.4%) | 7 (0.2%) |
| 4-Person Households | 350 (10.6%) | 12 (0.4%) |
| 5-Person Households | 156 (4.7%) | 0 (0.0%) |
| 6-Person Households | 42 (1.3%) | 0 (0.0%) |
| 7+ Person Households | 79 (2.4%) | 0 (0.0%) |
| Total | 2,007 (60.9%) | 1,291 (39.1%) |
Female Fertility in Kenton
Fertility by Age in Kenton
Average fertility rate in Kenton is 69.0 births per 1,000 women. Women in the age bracket of 20 to 34 years have the highest fertility rate with 164.0 births per 1,000 women. Women in the age bracket of 20 to 34 years acount for 100.0% of all women with births.
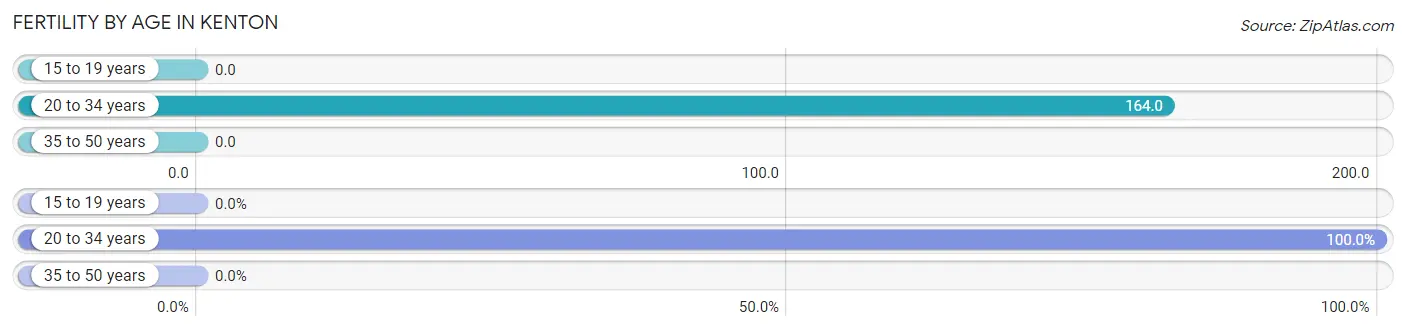
| Age Bracket | Women with Births | Births / 1,000 Women |
| 15 to 19 years | 0 (0.0%) | 0.0 |
| 20 to 34 years | 106 (100.0%) | 164.0 |
| 35 to 50 years | 0 (0.0%) | 0.0 |
| Total | 106 (100.0%) | 69.0 |
Fertility by Age by Marriage Status in Kenton
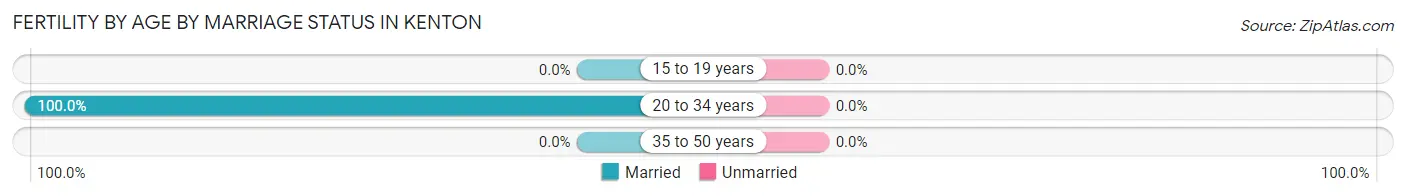
| Age Bracket | Married | Unmarried |
| 15 to 19 years | 0 (0.0%) | 0 (0.0%) |
| 20 to 34 years | 106 (100.0%) | 0 (0.0%) |
| 35 to 50 years | 0 (0.0%) | 0 (0.0%) |
| Total | 106 (100.0%) | 0 (0.0%) |
Fertility by Education in Kenton
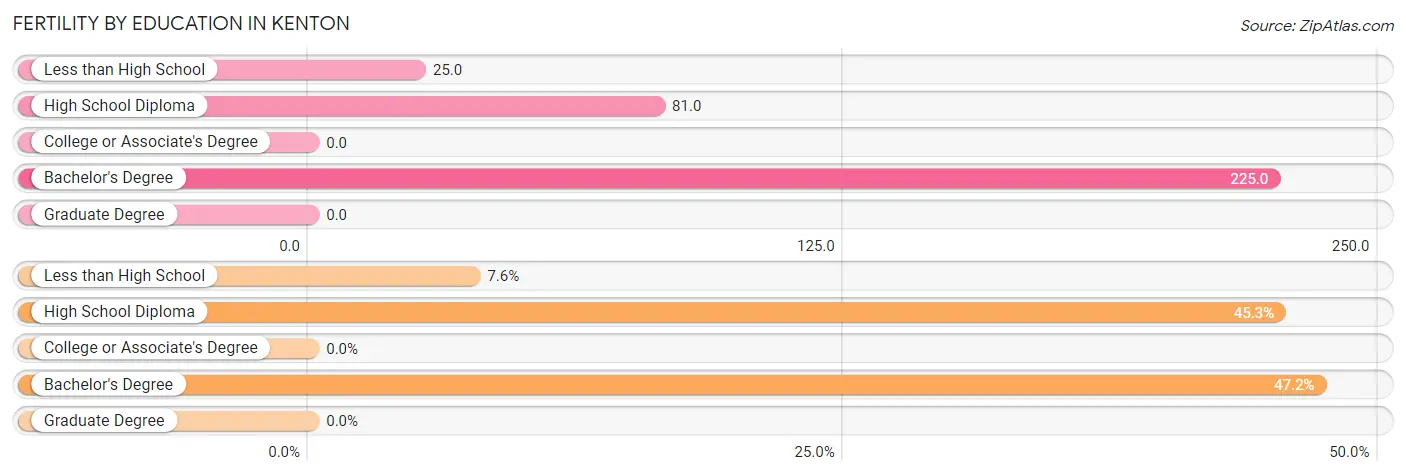
| Educational Attainment | Women with Births | Births / 1,000 Women |
| Less than High School | 8 (7.5%) | 25.0 |
| High School Diploma | 48 (45.3%) | 81.0 |
| College or Associate's Degree | 0 (0.0%) | 0.0 |
| Bachelor's Degree | 50 (47.2%) | 225.0 |
| Graduate Degree | 0 (0.0%) | 0.0 |
| Total | 106 (100.0%) | 69.0 |
Fertility by Education by Marriage Status in Kenton
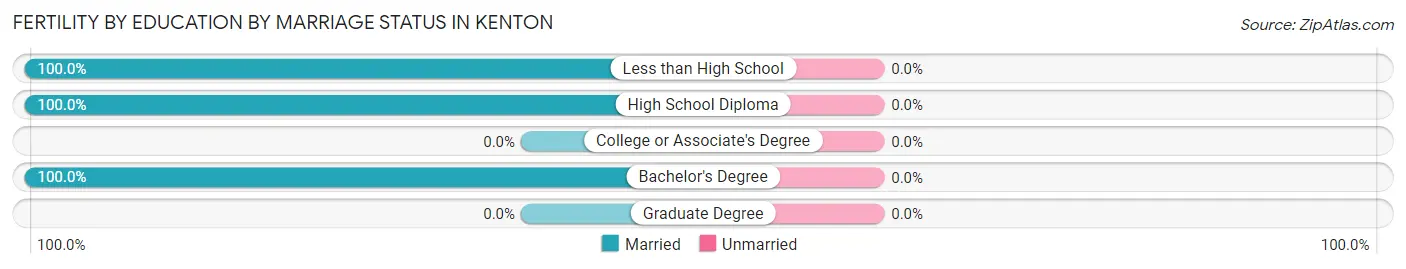
| Educational Attainment | Married | Unmarried |
| Less than High School | 8 (100.0%) | 0 (0.0%) |
| High School Diploma | 48 (100.0%) | 0 (0.0%) |
| College or Associate's Degree | 0 (0.0%) | 0 (0.0%) |
| Bachelor's Degree | 50 (100.0%) | 0 (0.0%) |
| Graduate Degree | 0 (0.0%) | 0 (0.0%) |
| Total | 106 (100.0%) | 0 (0.0%) |
Employment Characteristics in Kenton
Employment by Class of Employer in Kenton
Among the 2,945 employed individuals in Kenton, private company employees (1,938 | 65.8%), local government employees (422 | 14.3%), and not-for-profit organizations (178 | 6.0%) make up the most common classes of employment.
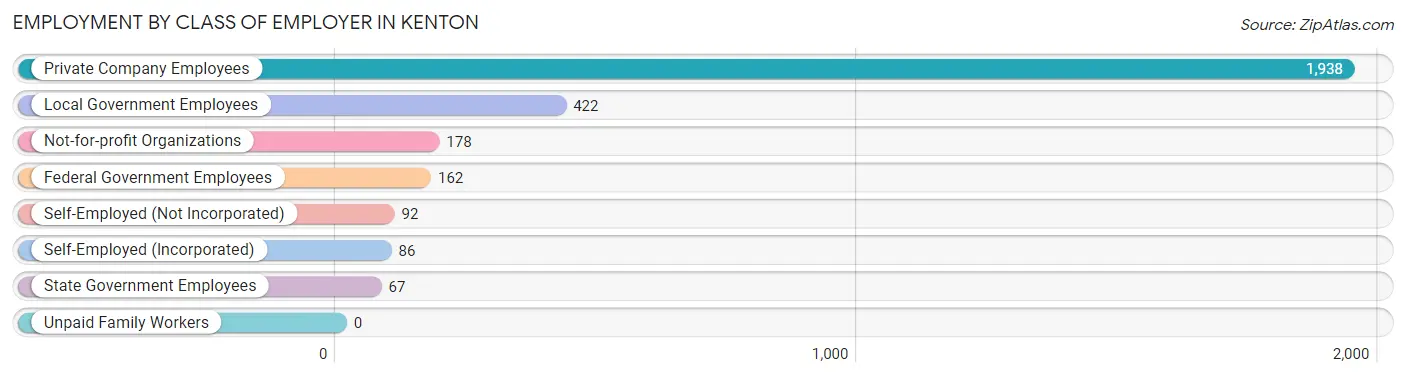
| Employer Class | # Employees | % Employees |
| Private Company Employees | 1,938 | 65.8% |
| Self-Employed (Incorporated) | 86 | 2.9% |
| Self-Employed (Not Incorporated) | 92 | 3.1% |
| Not-for-profit Organizations | 178 | 6.0% |
| Local Government Employees | 422 | 14.3% |
| State Government Employees | 67 | 2.3% |
| Federal Government Employees | 162 | 5.5% |
| Unpaid Family Workers | 0 | 0.0% |
| Total | 2,945 | 100.0% |
Employment Status by Age in Kenton
According to the labor force statistics for Kenton, out of the total population over 16 years of age (6,031), 53.8% or 3,245 individuals are in the labor force, with 8.3% or 269 of them unemployed. The age group with the highest labor force participation rate is 25 to 29 years, with 97.2% or 344 individuals in the labor force. Within the labor force, the 25 to 29 years age range has the highest percentage of unemployed individuals, with 26.7% or 92 of them being unemployed.
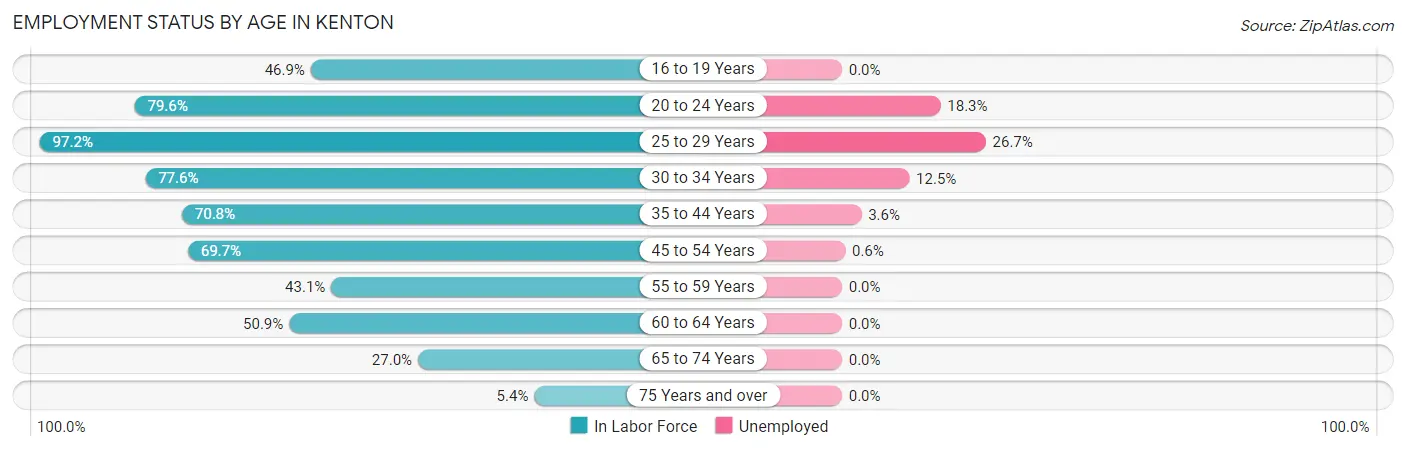
| Age Bracket | In Labor Force | Unemployed |
| 16 to 19 Years | 127 (46.9%) | 0 (0.0%) |
| 20 to 24 Years | 660 (79.6%) | 121 (18.3%) |
| 25 to 29 Years | 344 (97.2%) | 92 (26.7%) |
| 30 to 34 Years | 232 (77.6%) | 29 (12.5%) |
| 35 to 44 Years | 758 (70.8%) | 27 (3.6%) |
| 45 to 54 Years | 347 (69.7%) | 2 (0.6%) |
| 55 to 59 Years | 331 (43.1%) | 0 (0.0%) |
| 60 to 64 Years | 222 (50.9%) | 0 (0.0%) |
| 65 to 74 Years | 181 (27.0%) | 0 (0.0%) |
| 75 Years and over | 45 (5.4%) | 0 (0.0%) |
| Total | 3,245 (53.8%) | 269 (8.3%) |
Employment Status by Educational Attainment in Kenton
According to labor force statistics for Kenton, 65.2% of individuals (2,234) out of the total population between 25 and 64 years of age (3,426) are in the labor force, with 6.7% or 150 of them being unemployed. The group with the highest labor force participation rate are those with the educational attainment of college / associate degree, with 82.3% or 719 individuals in the labor force. Within the labor force, individuals with less than high school education have the highest percentage of unemployment, with 23.5% or 16 of them being unemployed.
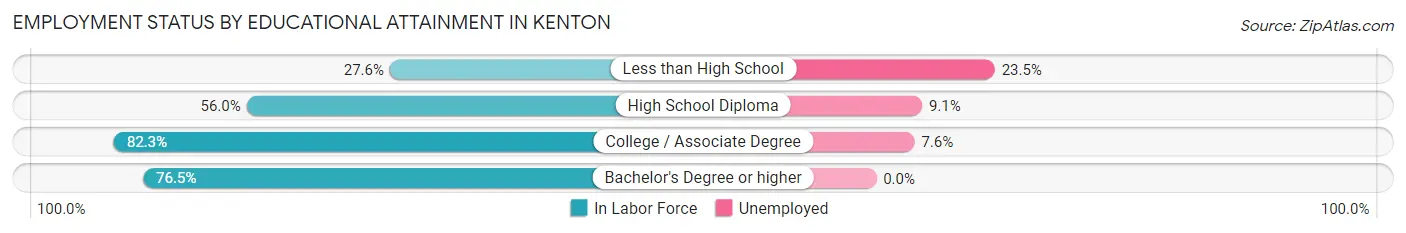
| Educational Attainment | In Labor Force | Unemployed |
| Less than High School | 68 (27.6%) | 58 (23.5%) |
| High School Diploma | 867 (56.0%) | 141 (9.1%) |
| College / Associate Degree | 719 (82.3%) | 66 (7.6%) |
| Bachelor's Degree or higher | 580 (76.5%) | 0 (0.0%) |
| Total | 2,234 (65.2%) | 230 (6.7%) |
Employment Occupations by Sex in Kenton
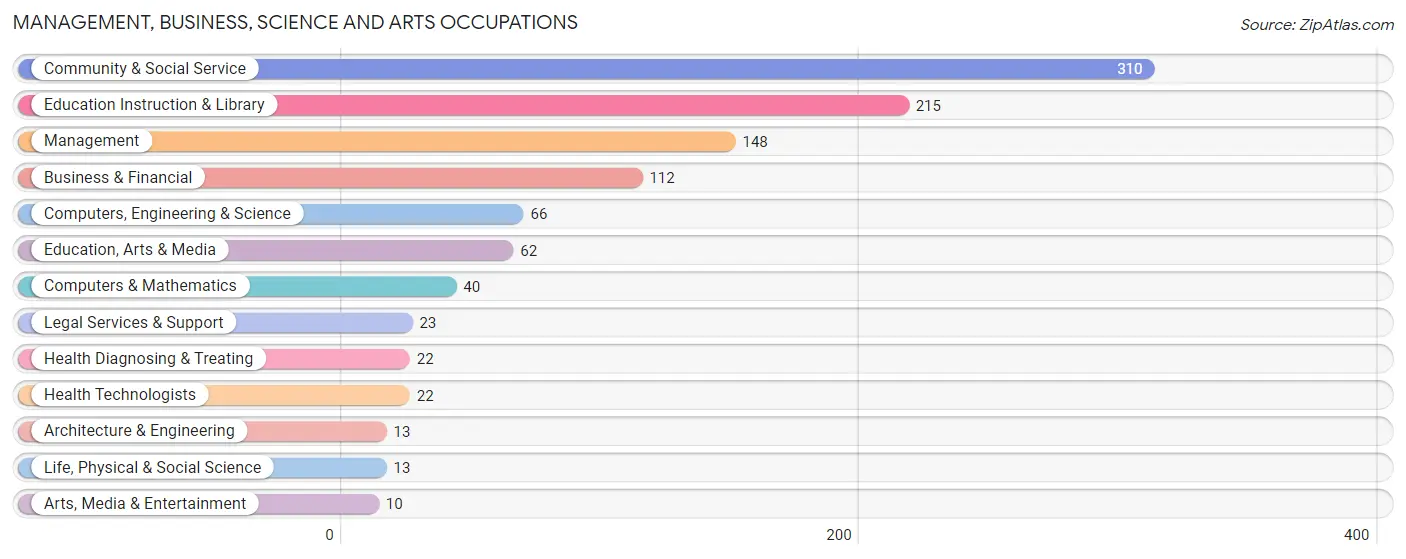
Management, Business, Science and Arts Occupations
The most common Management, Business, Science and Arts occupations in Kenton are Community & Social Service (310 | 10.4%), Education Instruction & Library (215 | 7.2%), Management (148 | 5.0%), Business & Financial (112 | 3.8%), and Computers, Engineering & Science (66 | 2.2%).
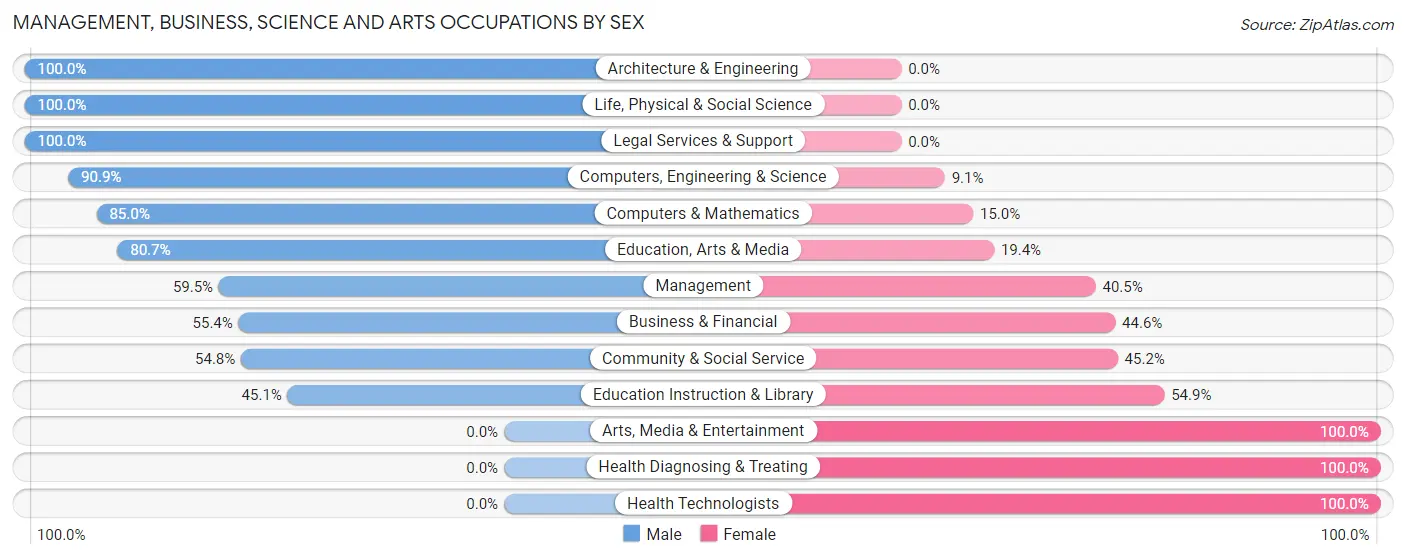
Management, Business, Science and Arts Occupations by Sex
Within the Management, Business, Science and Arts occupations in Kenton, the most male-oriented occupations are Architecture & Engineering (100.0%), Life, Physical & Social Science (100.0%), and Legal Services & Support (100.0%), while the most female-oriented occupations are Arts, Media & Entertainment (100.0%), Health Diagnosing & Treating (100.0%), and Health Technologists (100.0%).
| Occupation | Male | Female |
| Management | 88 (59.5%) | 60 (40.5%) |
| Business & Financial | 62 (55.4%) | 50 (44.6%) |
| Computers, Engineering & Science | 60 (90.9%) | 6 (9.1%) |
| Computers & Mathematics | 34 (85.0%) | 6 (15.0%) |
| Architecture & Engineering | 13 (100.0%) | 0 (0.0%) |
| Life, Physical & Social Science | 13 (100.0%) | 0 (0.0%) |
| Community & Social Service | 170 (54.8%) | 140 (45.2%) |
| Education, Arts & Media | 50 (80.6%) | 12 (19.4%) |
| Legal Services & Support | 23 (100.0%) | 0 (0.0%) |
| Education Instruction & Library | 97 (45.1%) | 118 (54.9%) |
| Arts, Media & Entertainment | 0 (0.0%) | 10 (100.0%) |
| Health Diagnosing & Treating | 0 (0.0%) | 22 (100.0%) |
| Health Technologists | 0 (0.0%) | 22 (100.0%) |
| Total (Category) | 380 (57.8%) | 278 (42.2%) |
| Total (Overall) | 1,738 (58.4%) | 1,238 (41.6%) |
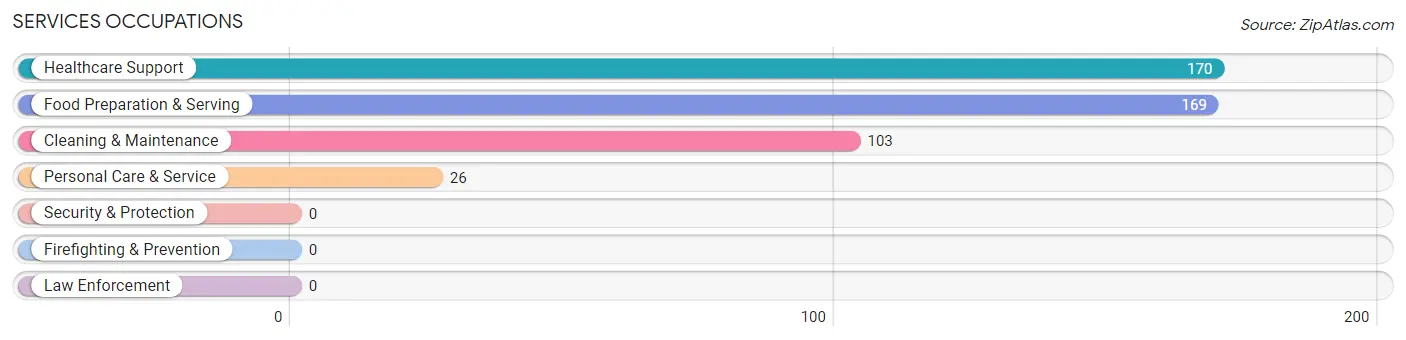
Services Occupations
The most common Services occupations in Kenton are Healthcare Support (170 | 5.7%), Food Preparation & Serving (169 | 5.7%), Cleaning & Maintenance (103 | 3.5%), and Personal Care & Service (26 | 0.9%).
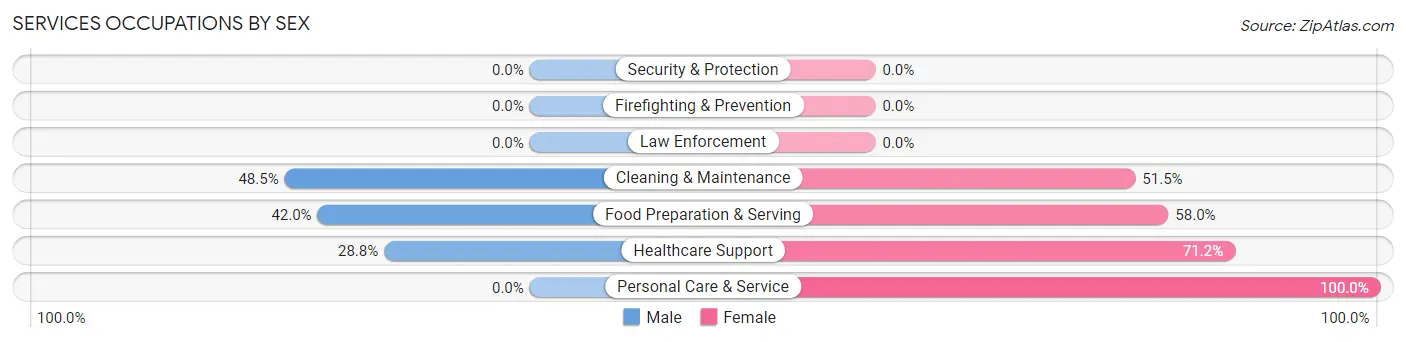
Services Occupations by Sex
Within the Services occupations in Kenton, the most male-oriented occupations are Cleaning & Maintenance (48.5%), Food Preparation & Serving (42.0%), and Healthcare Support (28.8%), while the most female-oriented occupations are Personal Care & Service (100.0%), Healthcare Support (71.2%), and Food Preparation & Serving (58.0%).
| Occupation | Male | Female |
| Healthcare Support | 49 (28.8%) | 121 (71.2%) |
| Security & Protection | 0 (0.0%) | 0 (0.0%) |
| Firefighting & Prevention | 0 (0.0%) | 0 (0.0%) |
| Law Enforcement | 0 (0.0%) | 0 (0.0%) |
| Food Preparation & Serving | 71 (42.0%) | 98 (58.0%) |
| Cleaning & Maintenance | 50 (48.5%) | 53 (51.5%) |
| Personal Care & Service | 0 (0.0%) | 26 (100.0%) |
| Total (Category) | 170 (36.3%) | 298 (63.7%) |
| Total (Overall) | 1,738 (58.4%) | 1,238 (41.6%) |
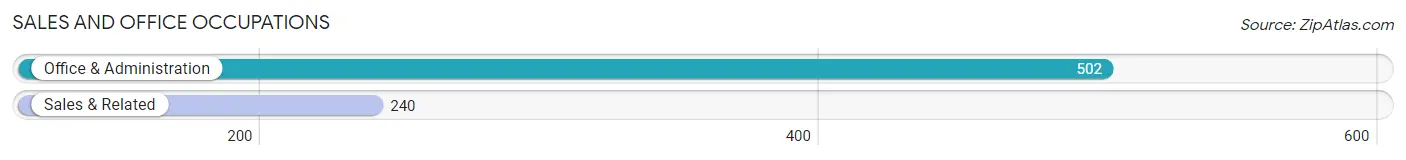
Sales and Office Occupations
The most common Sales and Office occupations in Kenton are Office & Administration (502 | 16.9%), and Sales & Related (240 | 8.1%).
Sales and Office Occupations by Sex
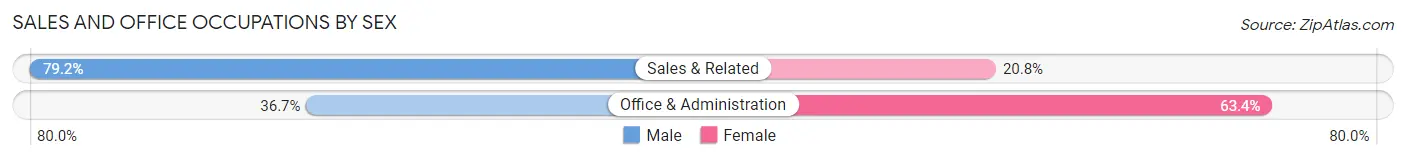
| Occupation | Male | Female |
| Sales & Related | 190 (79.2%) | 50 (20.8%) |
| Office & Administration | 184 (36.6%) | 318 (63.3%) |
| Total (Category) | 374 (50.4%) | 368 (49.6%) |
| Total (Overall) | 1,738 (58.4%) | 1,238 (41.6%) |
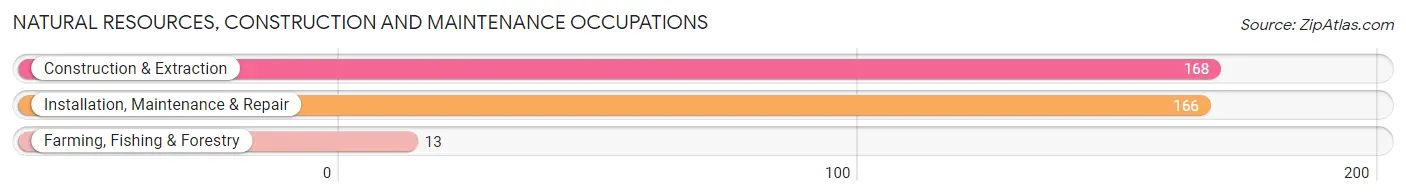
Natural Resources, Construction and Maintenance Occupations
The most common Natural Resources, Construction and Maintenance occupations in Kenton are Construction & Extraction (168 | 5.7%), Installation, Maintenance & Repair (166 | 5.6%), and Farming, Fishing & Forestry (13 | 0.4%).
Natural Resources, Construction and Maintenance Occupations by Sex
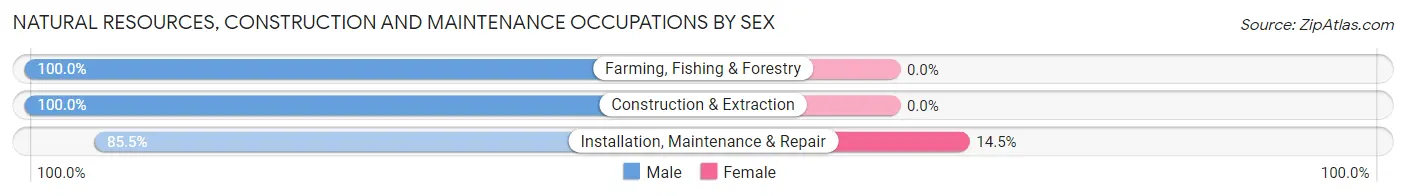
| Occupation | Male | Female |
| Farming, Fishing & Forestry | 13 (100.0%) | 0 (0.0%) |
| Construction & Extraction | 168 (100.0%) | 0 (0.0%) |
| Installation, Maintenance & Repair | 142 (85.5%) | 24 (14.5%) |
| Total (Category) | 323 (93.1%) | 24 (6.9%) |
| Total (Overall) | 1,738 (58.4%) | 1,238 (41.6%) |
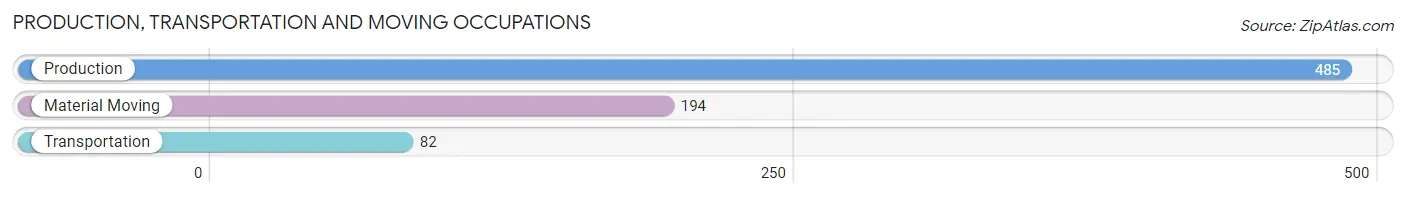
Production, Transportation and Moving Occupations
The most common Production, Transportation and Moving occupations in Kenton are Production (485 | 16.3%), Material Moving (194 | 6.5%), and Transportation (82 | 2.8%).
Production, Transportation and Moving Occupations by Sex
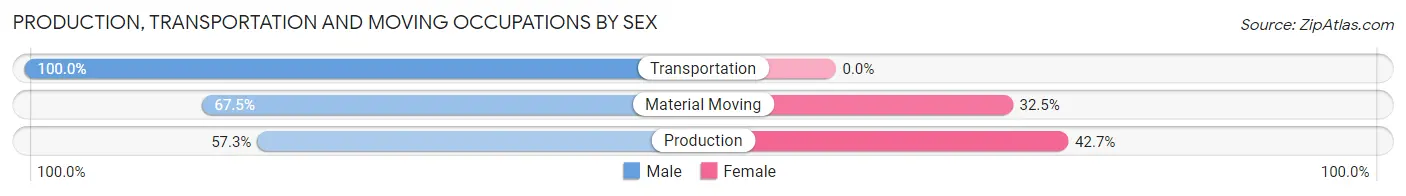
| Occupation | Male | Female |
| Production | 278 (57.3%) | 207 (42.7%) |
| Transportation | 82 (100.0%) | 0 (0.0%) |
| Material Moving | 131 (67.5%) | 63 (32.5%) |
| Total (Category) | 491 (64.5%) | 270 (35.5%) |
| Total (Overall) | 1,738 (58.4%) | 1,238 (41.6%) |
Employment Industries by Sex in Kenton
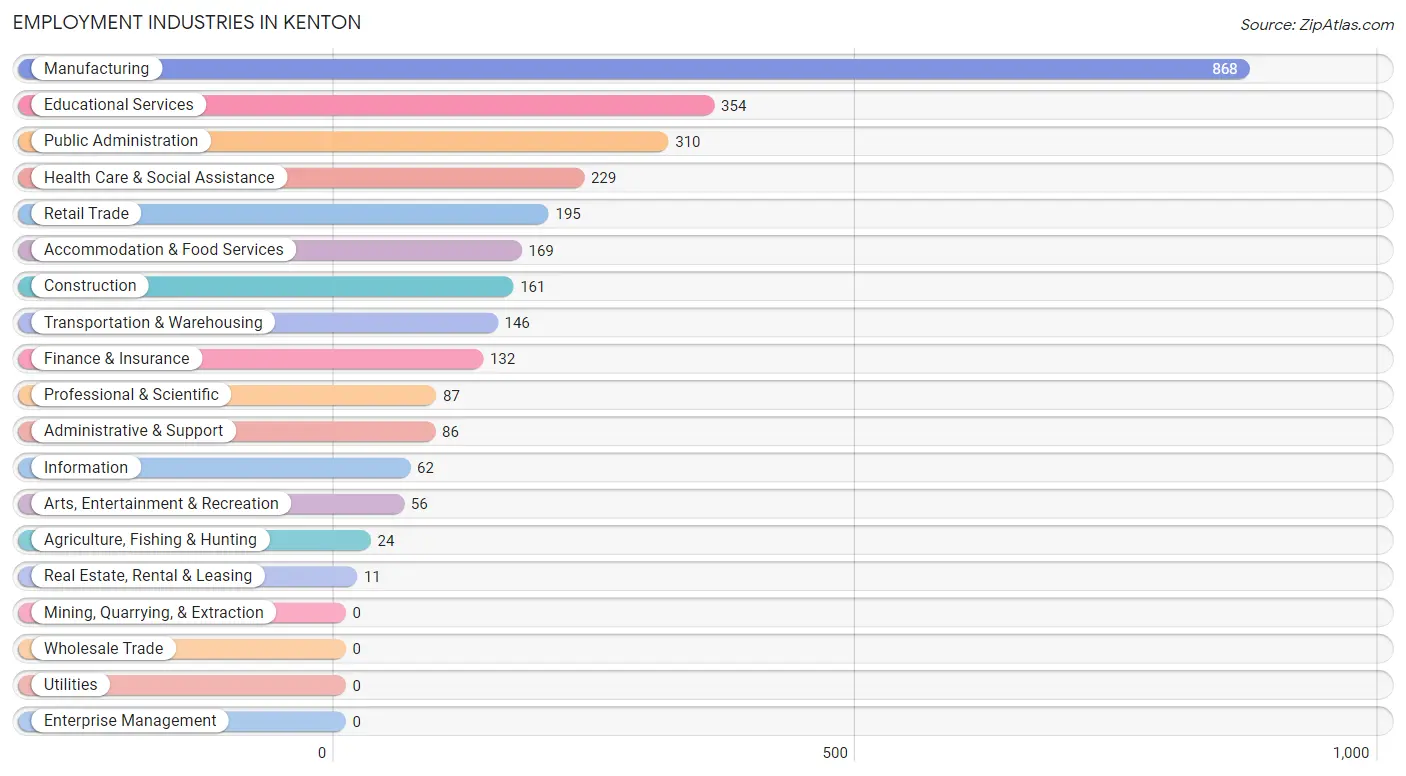
Employment Industries in Kenton
The major employment industries in Kenton include Manufacturing (868 | 29.2%), Educational Services (354 | 11.9%), Public Administration (310 | 10.4%), Health Care & Social Assistance (229 | 7.7%), and Retail Trade (195 | 6.6%).
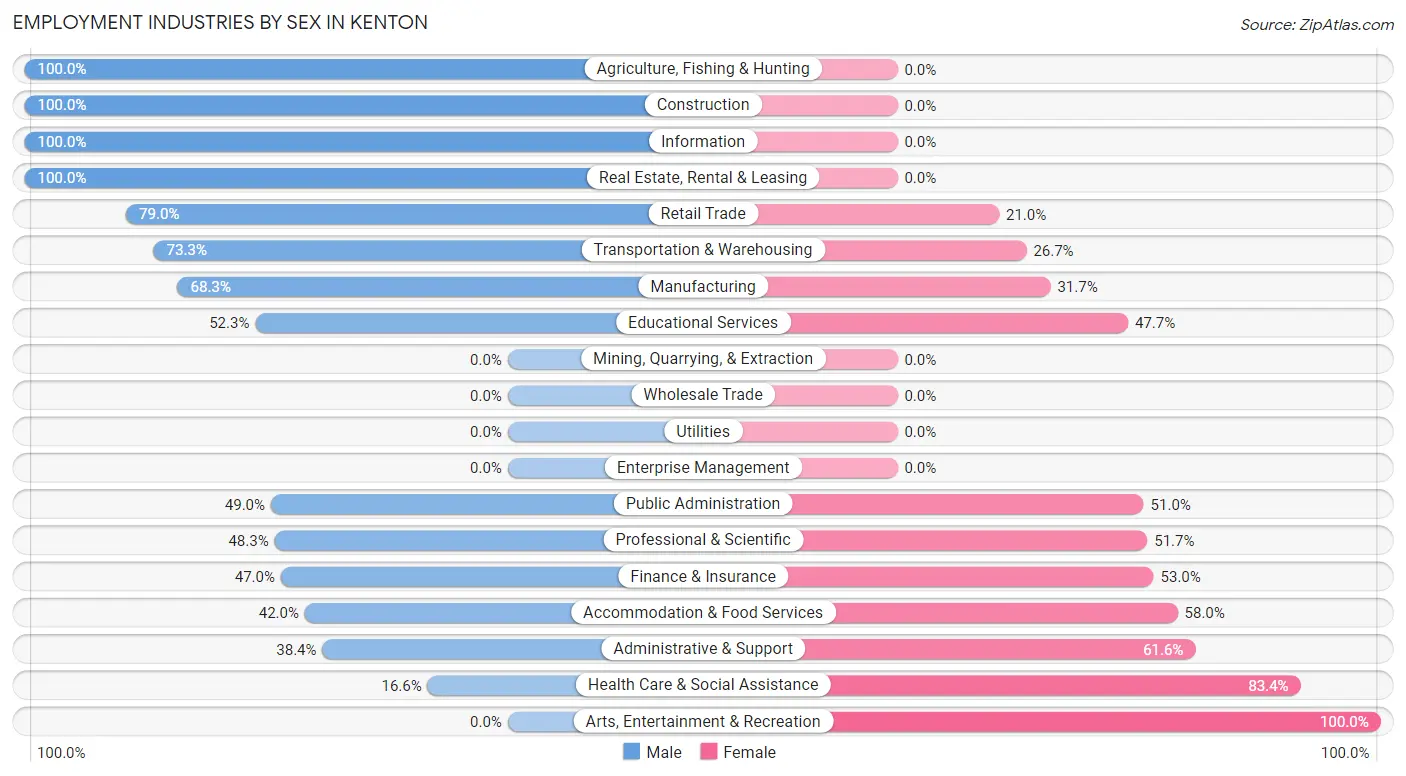
Employment Industries by Sex in Kenton
The Kenton industries that see more men than women are Agriculture, Fishing & Hunting (100.0%), Construction (100.0%), and Information (100.0%), whereas the industries that tend to have a higher number of women are Arts, Entertainment & Recreation (100.0%), Health Care & Social Assistance (83.4%), and Administrative & Support (61.6%).
| Industry | Male | Female |
| Agriculture, Fishing & Hunting | 24 (100.0%) | 0 (0.0%) |
| Mining, Quarrying, & Extraction | 0 (0.0%) | 0 (0.0%) |
| Construction | 161 (100.0%) | 0 (0.0%) |
| Manufacturing | 593 (68.3%) | 275 (31.7%) |
| Wholesale Trade | 0 (0.0%) | 0 (0.0%) |
| Retail Trade | 154 (79.0%) | 41 (21.0%) |
| Transportation & Warehousing | 107 (73.3%) | 39 (26.7%) |
| Utilities | 0 (0.0%) | 0 (0.0%) |
| Information | 62 (100.0%) | 0 (0.0%) |
| Finance & Insurance | 62 (47.0%) | 70 (53.0%) |
| Real Estate, Rental & Leasing | 11 (100.0%) | 0 (0.0%) |
| Professional & Scientific | 42 (48.3%) | 45 (51.7%) |
| Enterprise Management | 0 (0.0%) | 0 (0.0%) |
| Administrative & Support | 33 (38.4%) | 53 (61.6%) |
| Educational Services | 185 (52.3%) | 169 (47.7%) |
| Health Care & Social Assistance | 38 (16.6%) | 191 (83.4%) |
| Arts, Entertainment & Recreation | 0 (0.0%) | 56 (100.0%) |
| Accommodation & Food Services | 71 (42.0%) | 98 (58.0%) |
| Public Administration | 152 (49.0%) | 158 (51.0%) |
| Total | 1,738 (58.4%) | 1,238 (41.6%) |
Education in Kenton
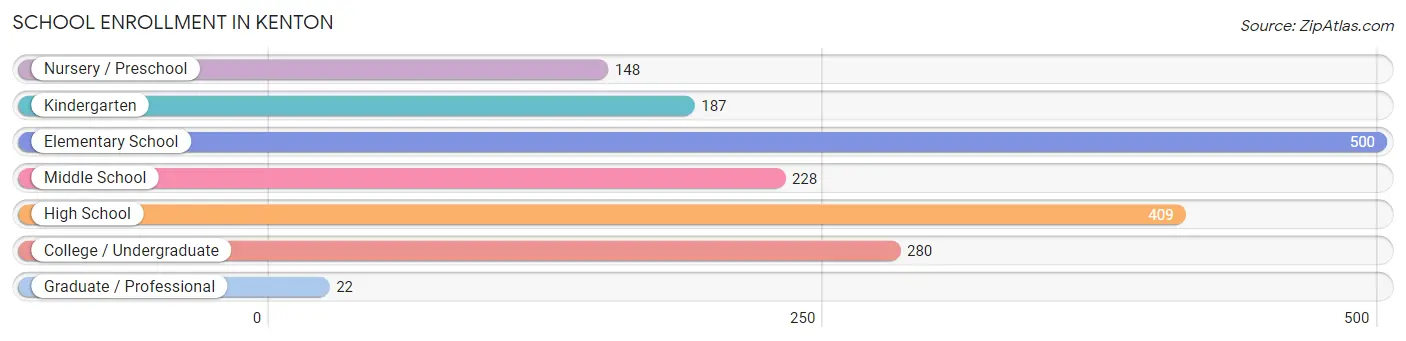
School Enrollment in Kenton
The most common levels of schooling among the 1,774 students in Kenton are elementary school (500 | 28.2%), high school (409 | 23.1%), and college / undergraduate (280 | 15.8%).
| School Level | # Students | % Students |
| Nursery / Preschool | 148 | 8.3% |
| Kindergarten | 187 | 10.5% |
| Elementary School | 500 | 28.2% |
| Middle School | 228 | 12.9% |
| High School | 409 | 23.1% |
| College / Undergraduate | 280 | 15.8% |
| Graduate / Professional | 22 | 1.2% |
| Total | 1,774 | 100.0% |
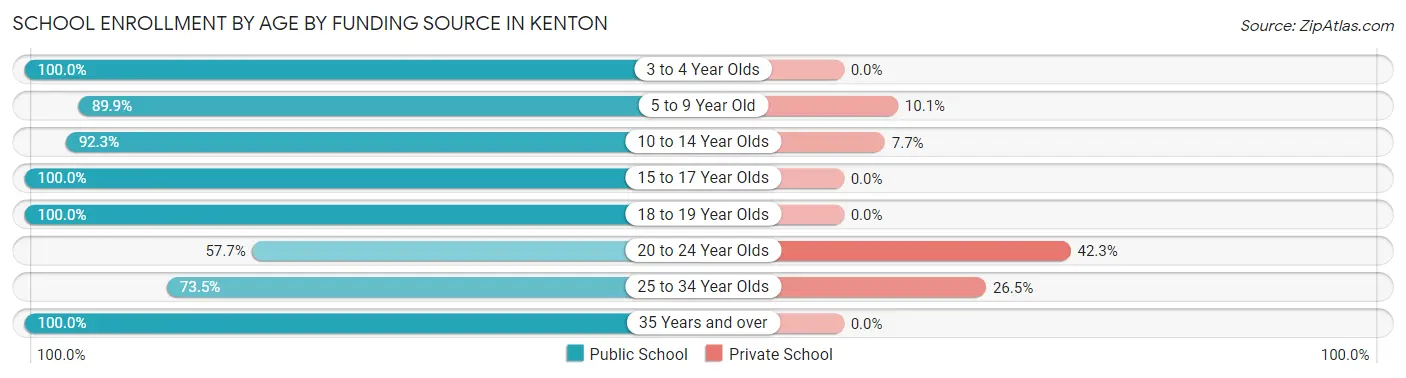
School Enrollment by Age by Funding Source in Kenton
Out of a total of 1,774 students who are enrolled in schools in Kenton, 192 (10.8%) attend a private institution, while the remaining 1,582 (89.2%) are enrolled in public schools. The age group of 20 to 24 year olds has the highest likelihood of being enrolled in private schools, with 71 (42.3% in the age bracket) enrolled. Conversely, the age group of 3 to 4 year olds has the lowest likelihood of being enrolled in a private school, with 33 (100.0% in the age bracket) attending a public institution.
| Age Bracket | Public School | Private School |
| 3 to 4 Year Olds | 33 (100.0%) | 0 (0.0%) |
| 5 to 9 Year Old | 623 (89.9%) | 70 (10.1%) |
| 10 to 14 Year Olds | 337 (92.3%) | 28 (7.7%) |
| 15 to 17 Year Olds | 313 (100.0%) | 0 (0.0%) |
| 18 to 19 Year Olds | 95 (100.0%) | 0 (0.0%) |
| 20 to 24 Year Olds | 97 (57.7%) | 71 (42.3%) |
| 25 to 34 Year Olds | 61 (73.5%) | 22 (26.5%) |
| 35 Years and over | 24 (100.0%) | 0 (0.0%) |
| Total | 1,582 (89.2%) | 192 (10.8%) |
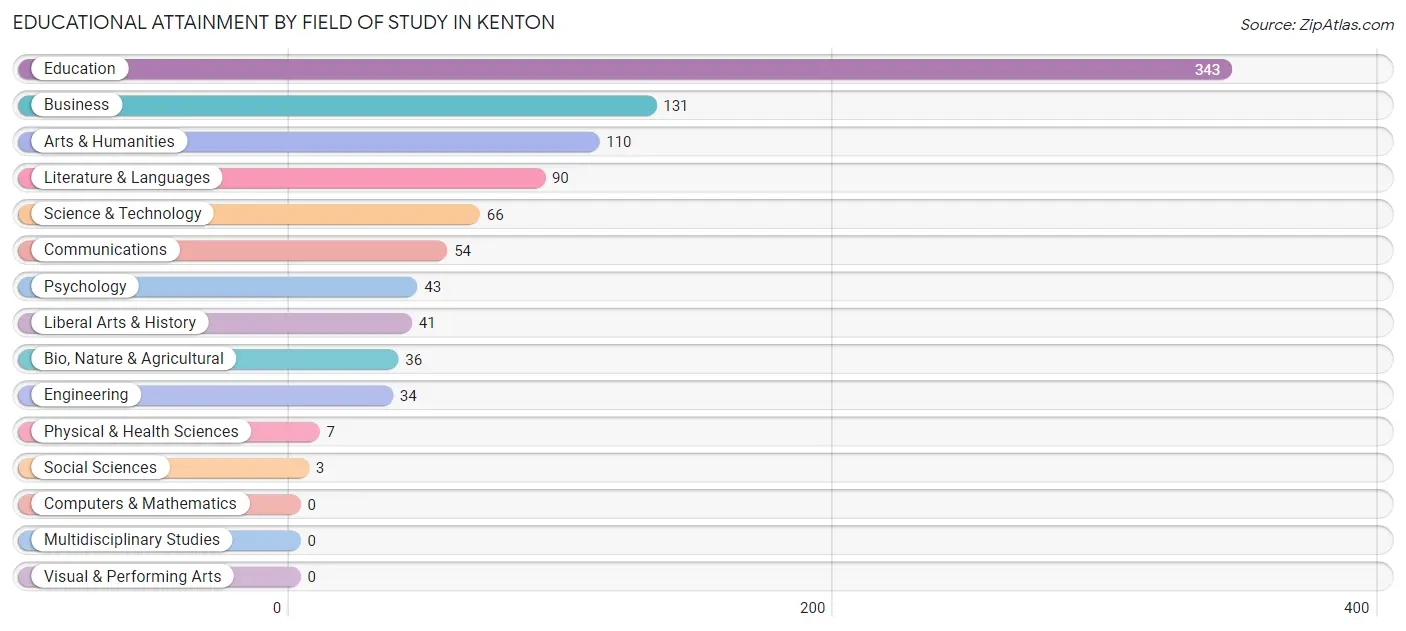
Educational Attainment by Field of Study in Kenton
Education (343 | 35.8%), business (131 | 13.7%), arts & humanities (110 | 11.5%), literature & languages (90 | 9.4%), and science & technology (66 | 6.9%) are the most common fields of study among 958 individuals in Kenton who have obtained a bachelor's degree or higher.
| Field of Study | # Graduates | % Graduates |
| Computers & Mathematics | 0 | 0.0% |
| Bio, Nature & Agricultural | 36 | 3.8% |
| Physical & Health Sciences | 7 | 0.7% |
| Psychology | 43 | 4.5% |
| Social Sciences | 3 | 0.3% |
| Engineering | 34 | 3.5% |
| Multidisciplinary Studies | 0 | 0.0% |
| Science & Technology | 66 | 6.9% |
| Business | 131 | 13.7% |
| Education | 343 | 35.8% |
| Literature & Languages | 90 | 9.4% |
| Liberal Arts & History | 41 | 4.3% |
| Visual & Performing Arts | 0 | 0.0% |
| Communications | 54 | 5.6% |
| Arts & Humanities | 110 | 11.5% |
| Total | 958 | 100.0% |
Transportation & Commute in Kenton
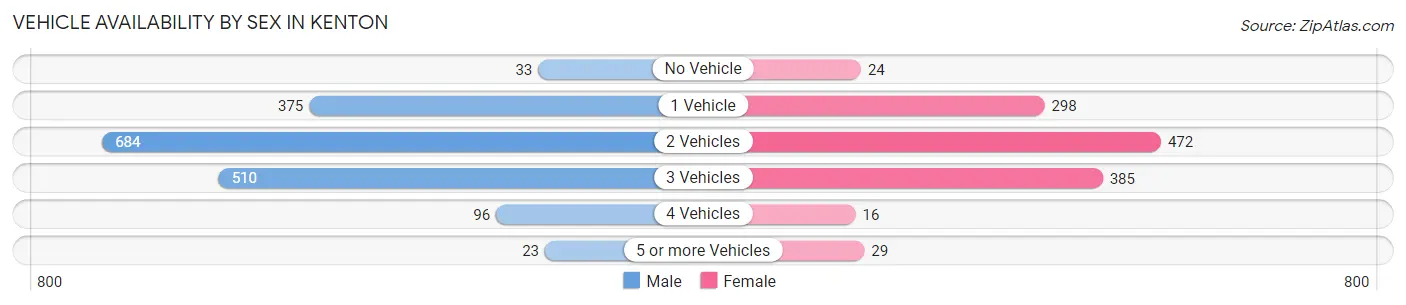
Vehicle Availability by Sex in Kenton
The most prevalent vehicle ownership categories in Kenton are males with 2 vehicles (684, accounting for 39.7%) and females with 2 vehicles (472, making up 55.9%).
| Vehicles Available | Male | Female |
| No Vehicle | 33 (1.9%) | 24 (2.0%) |
| 1 Vehicle | 375 (21.8%) | 298 (24.3%) |
| 2 Vehicles | 684 (39.7%) | 472 (38.6%) |
| 3 Vehicles | 510 (29.6%) | 385 (31.5%) |
| 4 Vehicles | 96 (5.6%) | 16 (1.3%) |
| 5 or more Vehicles | 23 (1.3%) | 29 (2.4%) |
| Total | 1,721 (100.0%) | 1,224 (100.0%) |
Commute Time in Kenton
The most frequently occuring commute durations in Kenton are 5 to 9 minutes (705 commuters, 24.2%), 10 to 14 minutes (528 commuters, 18.2%), and less than 5 minutes (356 commuters, 12.2%).
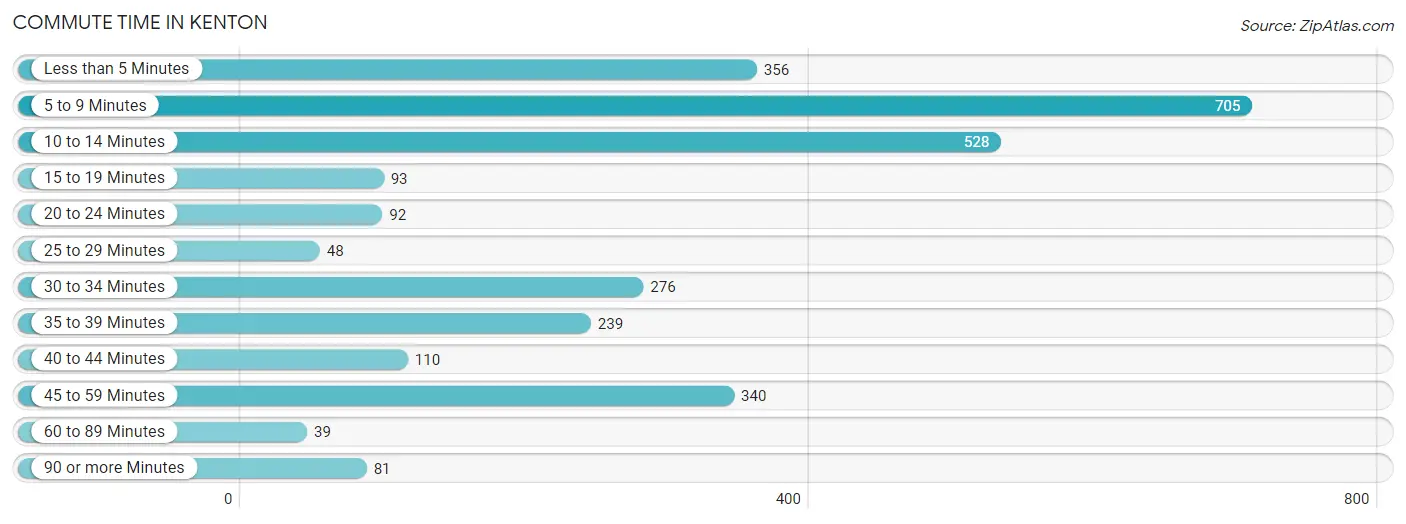
| Commute Time | # Commuters | % Commuters |
| Less than 5 Minutes | 356 | 12.2% |
| 5 to 9 Minutes | 705 | 24.2% |
| 10 to 14 Minutes | 528 | 18.2% |
| 15 to 19 Minutes | 93 | 3.2% |
| 20 to 24 Minutes | 92 | 3.2% |
| 25 to 29 Minutes | 48 | 1.7% |
| 30 to 34 Minutes | 276 | 9.5% |
| 35 to 39 Minutes | 239 | 8.2% |
| 40 to 44 Minutes | 110 | 3.8% |
| 45 to 59 Minutes | 340 | 11.7% |
| 60 to 89 Minutes | 39 | 1.3% |
| 90 or more Minutes | 81 | 2.8% |
Commute Time by Sex in Kenton
The most common commute times in Kenton are 5 to 9 minutes (333 commuters, 19.4%) for males and 5 to 9 minutes (372 commuters, 31.3%) for females.
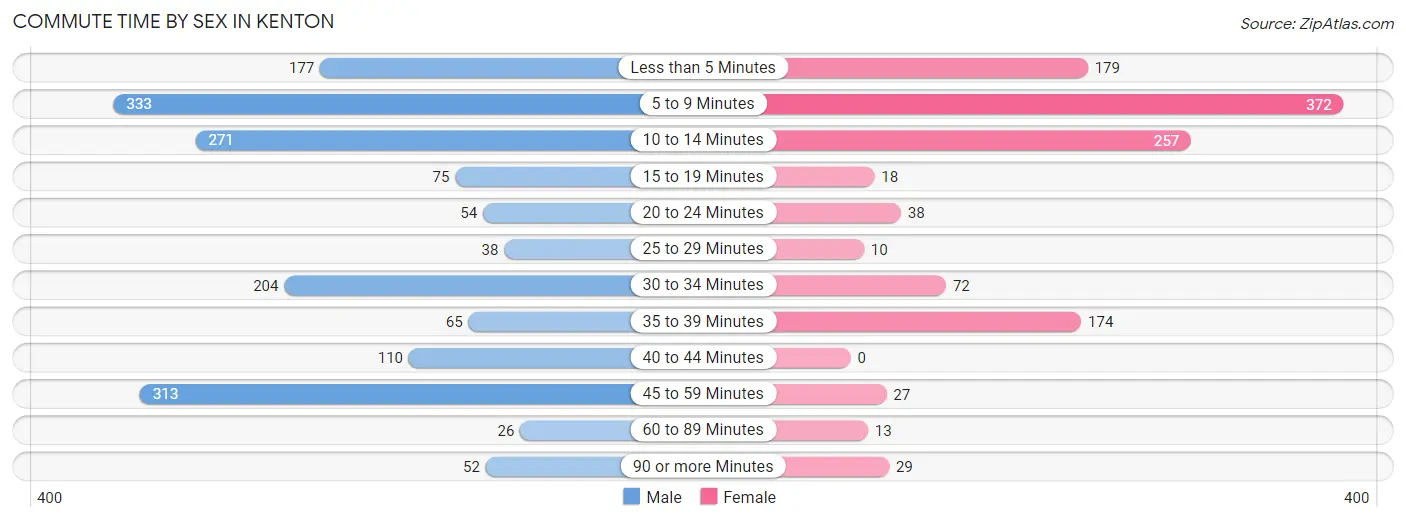
| Commute Time | Male | Female |
| Less than 5 Minutes | 177 (10.3%) | 179 (15.0%) |
| 5 to 9 Minutes | 333 (19.4%) | 372 (31.3%) |
| 10 to 14 Minutes | 271 (15.8%) | 257 (21.6%) |
| 15 to 19 Minutes | 75 (4.4%) | 18 (1.5%) |
| 20 to 24 Minutes | 54 (3.1%) | 38 (3.2%) |
| 25 to 29 Minutes | 38 (2.2%) | 10 (0.8%) |
| 30 to 34 Minutes | 204 (11.9%) | 72 (6.1%) |
| 35 to 39 Minutes | 65 (3.8%) | 174 (14.6%) |
| 40 to 44 Minutes | 110 (6.4%) | 0 (0.0%) |
| 45 to 59 Minutes | 313 (18.2%) | 27 (2.3%) |
| 60 to 89 Minutes | 26 (1.5%) | 13 (1.1%) |
| 90 or more Minutes | 52 (3.0%) | 29 (2.4%) |
Time of Departure to Work by Sex in Kenton
The most frequent times of departure to work in Kenton are 4:00 PM to 11:59 PM (276, 16.1%) for males and 7:30 AM to 7:59 AM (238, 20.0%) for females.
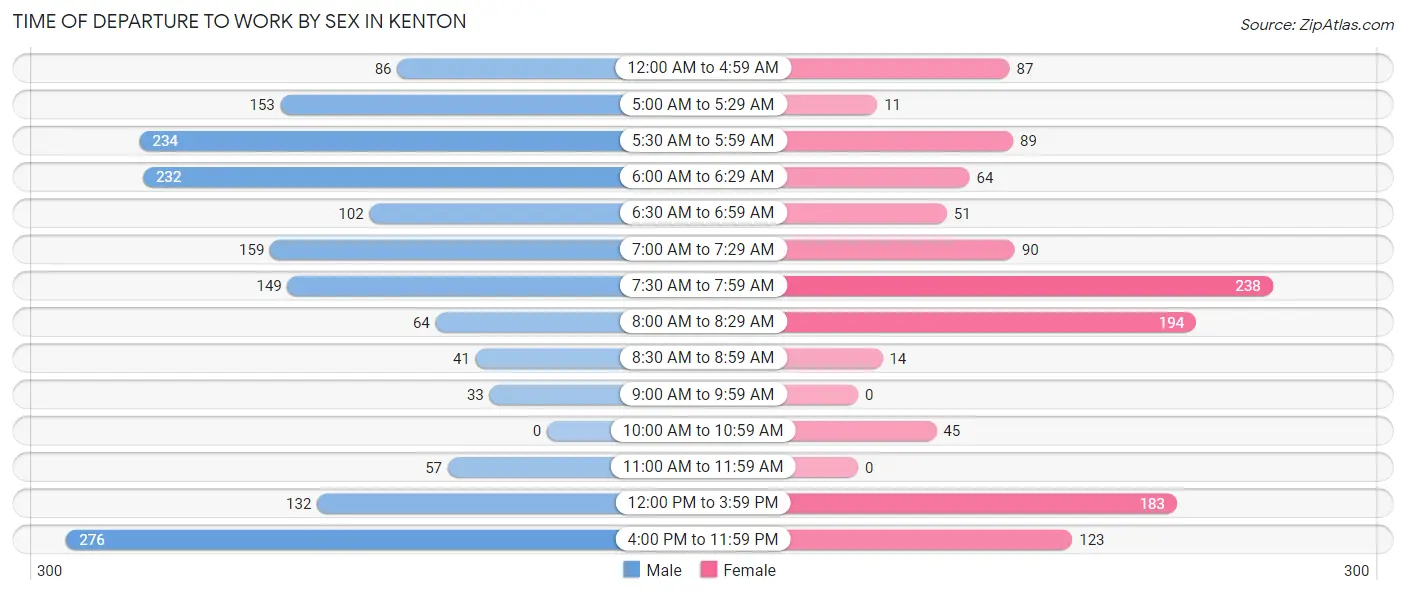
| Time of Departure | Male | Female |
| 12:00 AM to 4:59 AM | 86 (5.0%) | 87 (7.3%) |
| 5:00 AM to 5:29 AM | 153 (8.9%) | 11 (0.9%) |
| 5:30 AM to 5:59 AM | 234 (13.6%) | 89 (7.5%) |
| 6:00 AM to 6:29 AM | 232 (13.5%) | 64 (5.4%) |
| 6:30 AM to 6:59 AM | 102 (5.9%) | 51 (4.3%) |
| 7:00 AM to 7:29 AM | 159 (9.2%) | 90 (7.6%) |
| 7:30 AM to 7:59 AM | 149 (8.7%) | 238 (20.0%) |
| 8:00 AM to 8:29 AM | 64 (3.7%) | 194 (16.3%) |
| 8:30 AM to 8:59 AM | 41 (2.4%) | 14 (1.2%) |
| 9:00 AM to 9:59 AM | 33 (1.9%) | 0 (0.0%) |
| 10:00 AM to 10:59 AM | 0 (0.0%) | 45 (3.8%) |
| 11:00 AM to 11:59 AM | 57 (3.3%) | 0 (0.0%) |
| 12:00 PM to 3:59 PM | 132 (7.7%) | 183 (15.4%) |
| 4:00 PM to 11:59 PM | 276 (16.1%) | 123 (10.3%) |
| Total | 1,718 (100.0%) | 1,189 (100.0%) |
Housing Occupancy in Kenton
Occupancy by Ownership in Kenton
Of the total 3,298 dwellings in Kenton, owner-occupied units account for 2,216 (67.2%), while renter-occupied units make up 1,082 (32.8%).
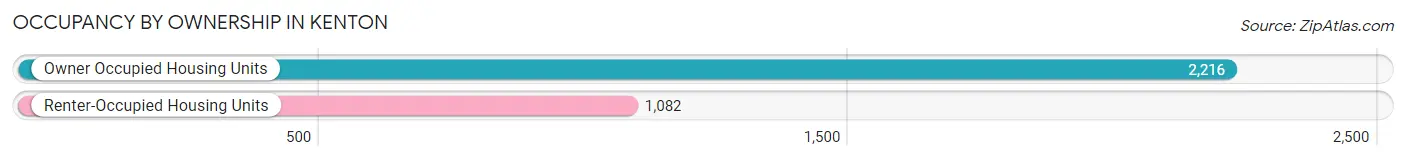
| Occupancy | # Housing Units | % Housing Units |
| Owner Occupied Housing Units | 2,216 | 67.2% |
| Renter-Occupied Housing Units | 1,082 | 32.8% |
| Total Occupied Housing Units | 3,298 | 100.0% |
Occupancy by Household Size in Kenton
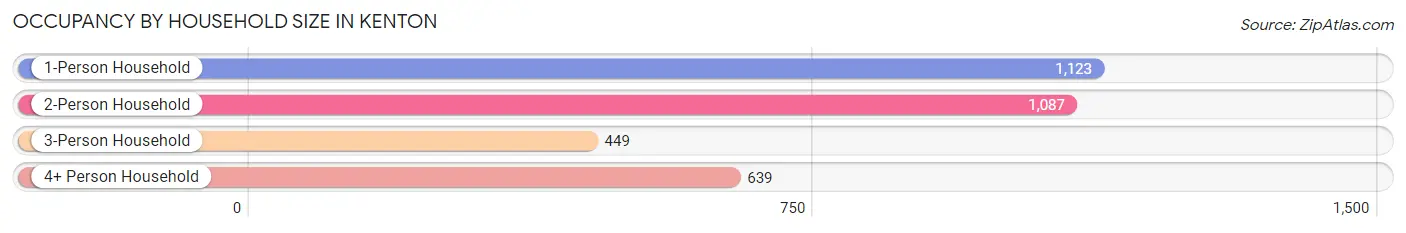
| Household Size | # Housing Units | % Housing Units |
| 1-Person Household | 1,123 | 34.1% |
| 2-Person Household | 1,087 | 33.0% |
| 3-Person Household | 449 | 13.6% |
| 4+ Person Household | 639 | 19.4% |
| Total Housing Units | 3,298 | 100.0% |
Occupancy by Ownership by Household Size in Kenton
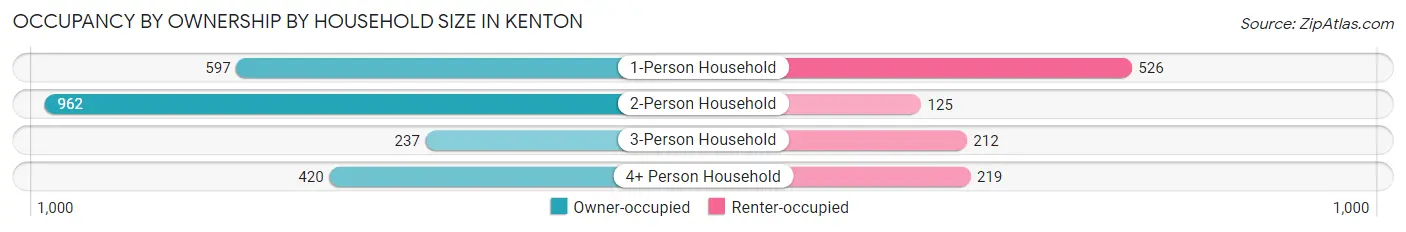
| Household Size | Owner-occupied | Renter-occupied |
| 1-Person Household | 597 (53.2%) | 526 (46.8%) |
| 2-Person Household | 962 (88.5%) | 125 (11.5%) |
| 3-Person Household | 237 (52.8%) | 212 (47.2%) |
| 4+ Person Household | 420 (65.7%) | 219 (34.3%) |
| Total Housing Units | 2,216 (67.2%) | 1,082 (32.8%) |
Occupancy by Educational Attainment in Kenton
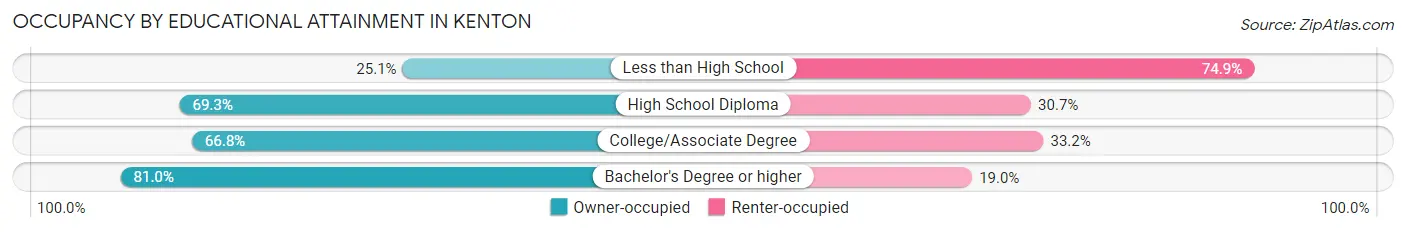
| Household Size | Owner-occupied | Renter-occupied |
| Less than High School | 67 (25.1%) | 200 (74.9%) |
| High School Diploma | 1,084 (69.3%) | 481 (30.7%) |
| College/Associate Degree | 576 (66.8%) | 286 (33.2%) |
| Bachelor's Degree or higher | 489 (81.0%) | 115 (19.0%) |
Occupancy by Age of Householder in Kenton
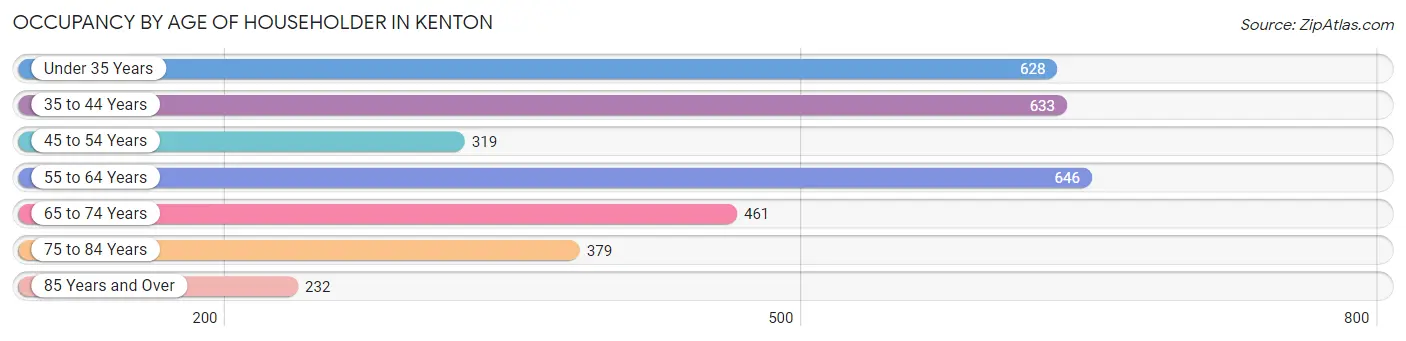
| Age Bracket | # Households | % Households |
| Under 35 Years | 628 | 19.0% |
| 35 to 44 Years | 633 | 19.2% |
| 45 to 54 Years | 319 | 9.7% |
| 55 to 64 Years | 646 | 19.6% |
| 65 to 74 Years | 461 | 14.0% |
| 75 to 84 Years | 379 | 11.5% |
| 85 Years and Over | 232 | 7.0% |
| Total | 3,298 | 100.0% |
Housing Finances in Kenton
Median Income by Occupancy in Kenton
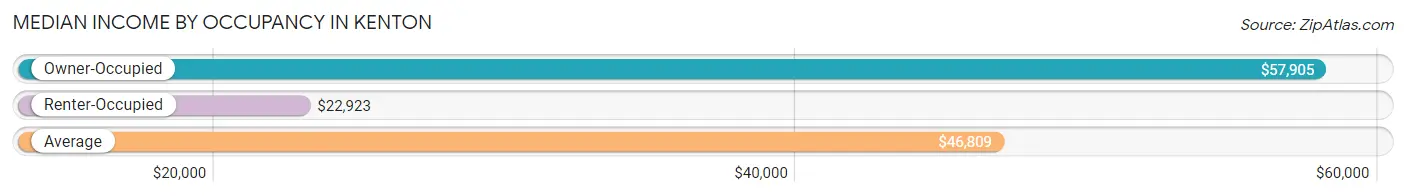
| Occupancy Type | # Households | Median Income |
| Owner-Occupied | 2,216 (67.2%) | $57,905 |
| Renter-Occupied | 1,082 (32.8%) | $22,923 |
| Average | 3,298 (100.0%) | $46,809 |
Occupancy by Householder Income Bracket in Kenton
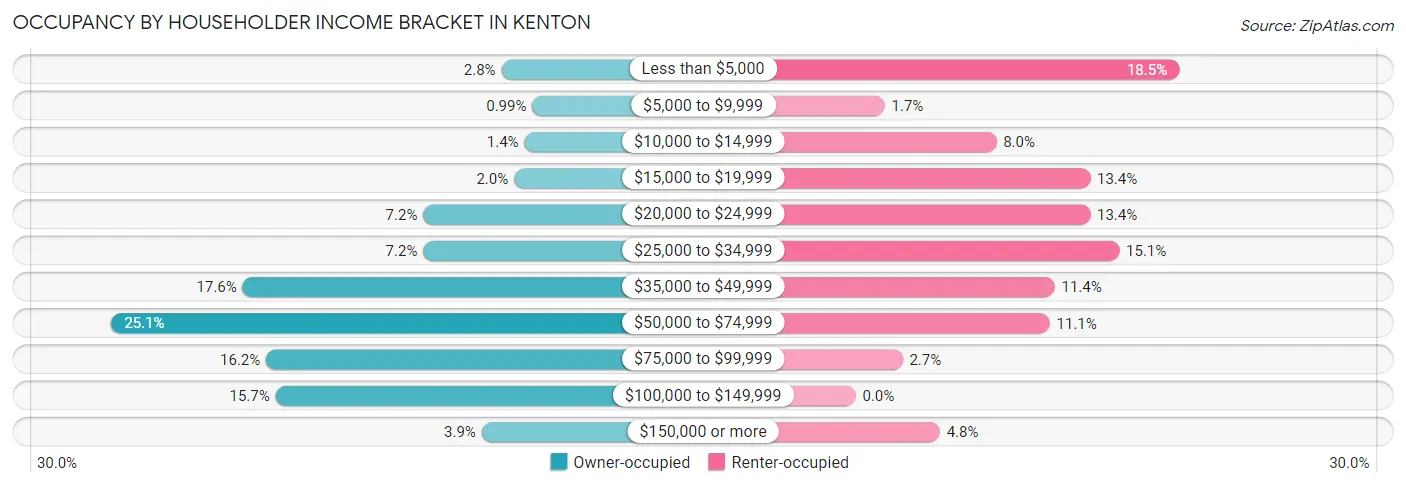
| Income Bracket | Owner-occupied | Renter-occupied |
| Less than $5,000 | 61 (2.8%) | 200 (18.5%) |
| $5,000 to $9,999 | 22 (1.0%) | 18 (1.7%) |
| $10,000 to $14,999 | 32 (1.4%) | 87 (8.0%) |
| $15,000 to $19,999 | 45 (2.0%) | 145 (13.4%) |
| $20,000 to $24,999 | 160 (7.2%) | 145 (13.4%) |
| $25,000 to $34,999 | 160 (7.2%) | 163 (15.1%) |
| $35,000 to $49,999 | 389 (17.5%) | 123 (11.4%) |
| $50,000 to $74,999 | 555 (25.1%) | 120 (11.1%) |
| $75,000 to $99,999 | 359 (16.2%) | 29 (2.7%) |
| $100,000 to $149,999 | 347 (15.7%) | 0 (0.0%) |
| $150,000 or more | 86 (3.9%) | 52 (4.8%) |
| Total | 2,216 (100.0%) | 1,082 (100.0%) |
Monthly Housing Cost Tiers in Kenton
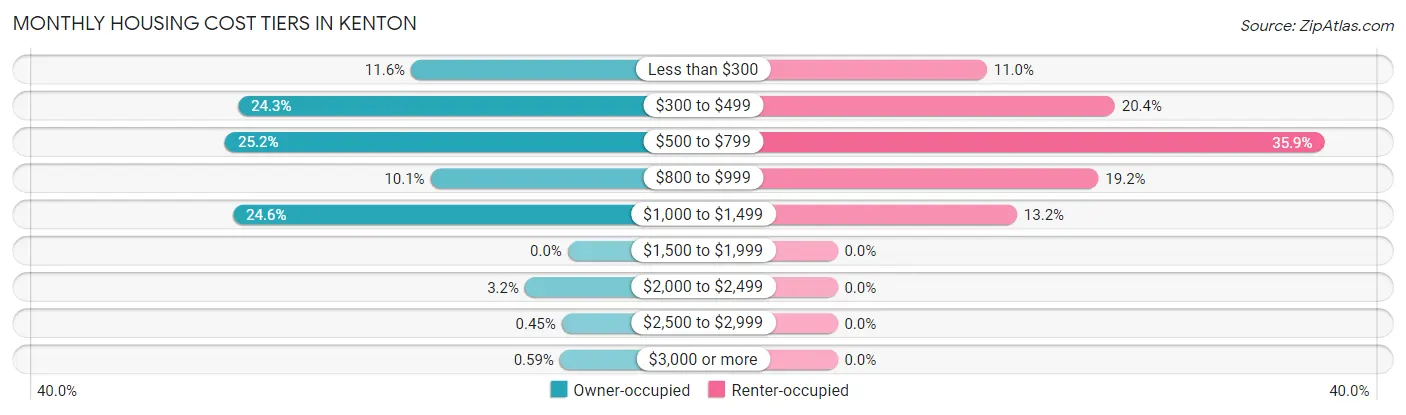
| Monthly Cost | Owner-occupied | Renter-occupied |
| Less than $300 | 256 (11.6%) | 119 (11.0%) |
| $300 to $499 | 538 (24.3%) | 221 (20.4%) |
| $500 to $799 | 559 (25.2%) | 388 (35.9%) |
| $800 to $999 | 224 (10.1%) | 208 (19.2%) |
| $1,000 to $1,499 | 546 (24.6%) | 143 (13.2%) |
| $1,500 to $1,999 | 0 (0.0%) | 0 (0.0%) |
| $2,000 to $2,499 | 70 (3.2%) | 0 (0.0%) |
| $2,500 to $2,999 | 10 (0.4%) | 0 (0.0%) |
| $3,000 or more | 13 (0.6%) | 0 (0.0%) |
| Total | 2,216 (100.0%) | 1,082 (100.0%) |
Physical Housing Characteristics in Kenton
Housing Structures in Kenton
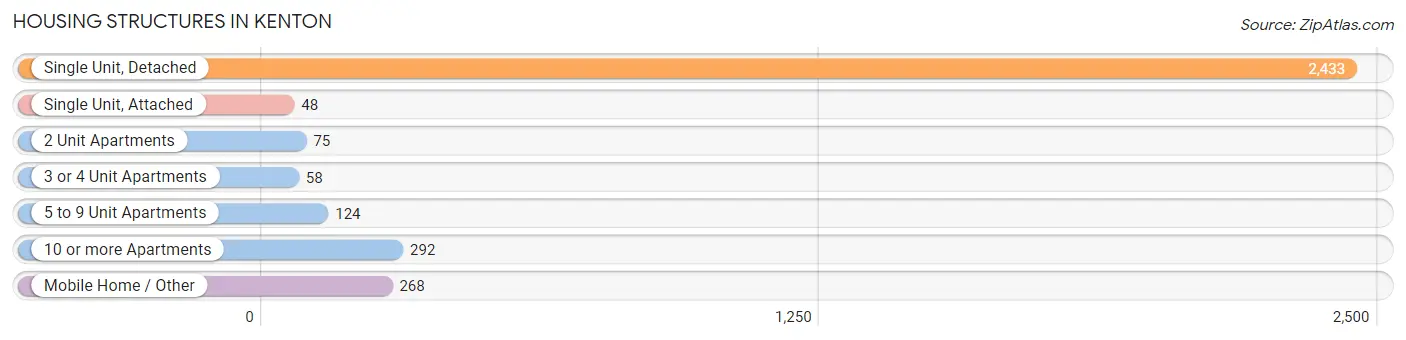
| Structure Type | # Housing Units | % Housing Units |
| Single Unit, Detached | 2,433 | 73.8% |
| Single Unit, Attached | 48 | 1.5% |
| 2 Unit Apartments | 75 | 2.3% |
| 3 or 4 Unit Apartments | 58 | 1.8% |
| 5 to 9 Unit Apartments | 124 | 3.8% |
| 10 or more Apartments | 292 | 8.8% |
| Mobile Home / Other | 268 | 8.1% |
| Total | 3,298 | 100.0% |
Housing Structures by Occupancy in Kenton
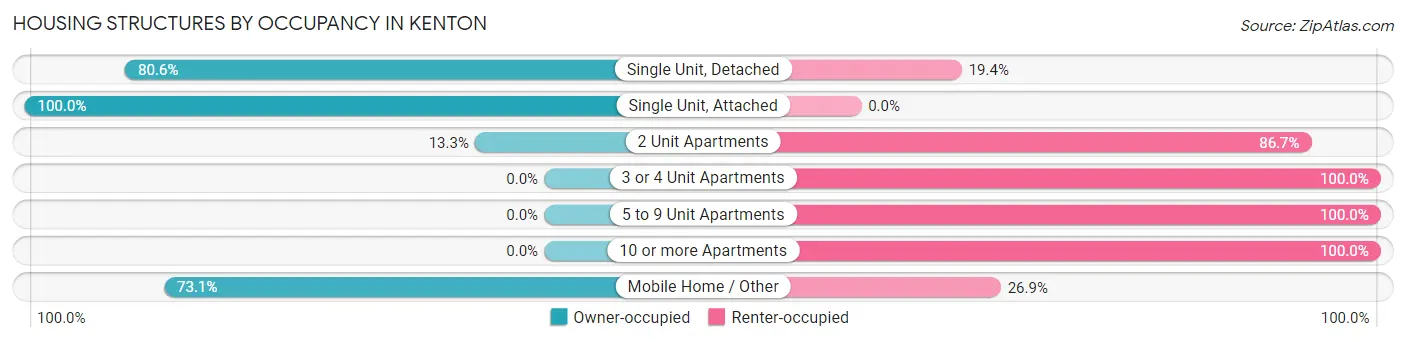
| Structure Type | Owner-occupied | Renter-occupied |
| Single Unit, Detached | 1,962 (80.6%) | 471 (19.4%) |
| Single Unit, Attached | 48 (100.0%) | 0 (0.0%) |
| 2 Unit Apartments | 10 (13.3%) | 65 (86.7%) |
| 3 or 4 Unit Apartments | 0 (0.0%) | 58 (100.0%) |
| 5 to 9 Unit Apartments | 0 (0.0%) | 124 (100.0%) |
| 10 or more Apartments | 0 (0.0%) | 292 (100.0%) |
| Mobile Home / Other | 196 (73.1%) | 72 (26.9%) |
| Total | 2,216 (67.2%) | 1,082 (32.8%) |
Housing Structures by Number of Rooms in Kenton
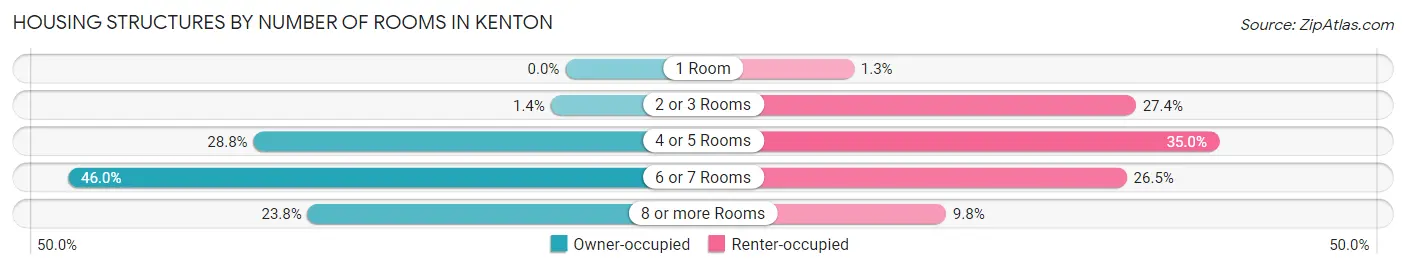
| Number of Rooms | Owner-occupied | Renter-occupied |
| 1 Room | 0 (0.0%) | 14 (1.3%) |
| 2 or 3 Rooms | 30 (1.3%) | 296 (27.4%) |
| 4 or 5 Rooms | 639 (28.8%) | 379 (35.0%) |
| 6 or 7 Rooms | 1,019 (46.0%) | 287 (26.5%) |
| 8 or more Rooms | 528 (23.8%) | 106 (9.8%) |
| Total | 2,216 (100.0%) | 1,082 (100.0%) |
Housing Structure by Heating Type in Kenton
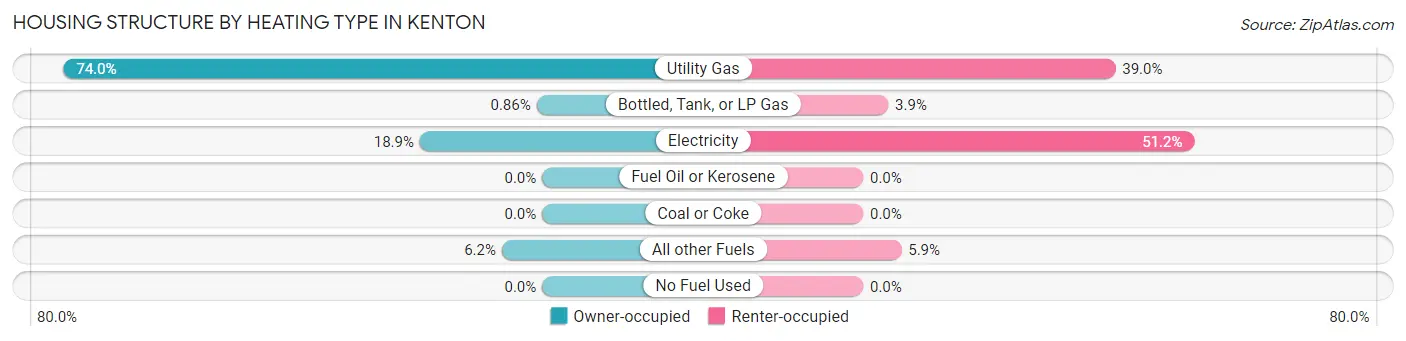
| Heating Type | Owner-occupied | Renter-occupied |
| Utility Gas | 1,640 (74.0%) | 422 (39.0%) |
| Bottled, Tank, or LP Gas | 19 (0.9%) | 42 (3.9%) |
| Electricity | 419 (18.9%) | 554 (51.2%) |
| Fuel Oil or Kerosene | 0 (0.0%) | 0 (0.0%) |
| Coal or Coke | 0 (0.0%) | 0 (0.0%) |
| All other Fuels | 138 (6.2%) | 64 (5.9%) |
| No Fuel Used | 0 (0.0%) | 0 (0.0%) |
| Total | 2,216 (100.0%) | 1,082 (100.0%) |
Household Vehicle Usage in Kenton
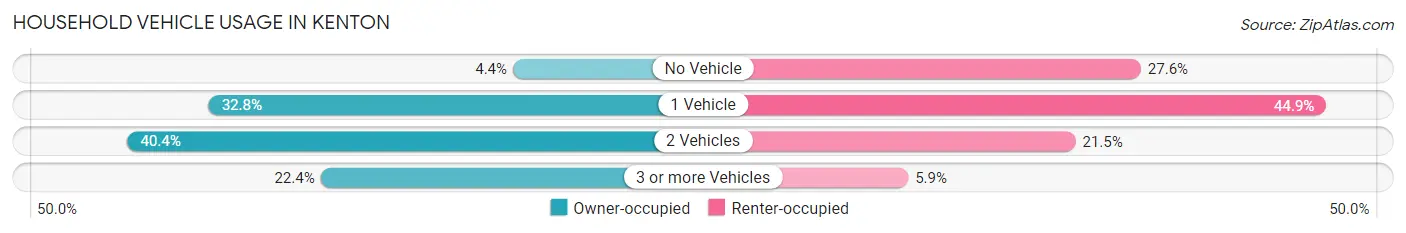
| Vehicles per Household | Owner-occupied | Renter-occupied |
| No Vehicle | 98 (4.4%) | 299 (27.6%) |
| 1 Vehicle | 727 (32.8%) | 486 (44.9%) |
| 2 Vehicles | 895 (40.4%) | 233 (21.5%) |
| 3 or more Vehicles | 496 (22.4%) | 64 (5.9%) |
| Total | 2,216 (100.0%) | 1,082 (100.0%) |
Real Estate & Mortgages in Kenton
Real Estate and Mortgage Overview in Kenton
| Characteristic | Without Mortgage | With Mortgage |
| Housing Units | 1,062 | 1,154 |
| Median Property Value | $78,800 | $101,400 |
| Median Household Income | $50,203 | $67 |
| Monthly Housing Costs | $387 | $13 |
| Real Estate Taxes | $984 | $55 |
Property Value by Mortgage Status in Kenton
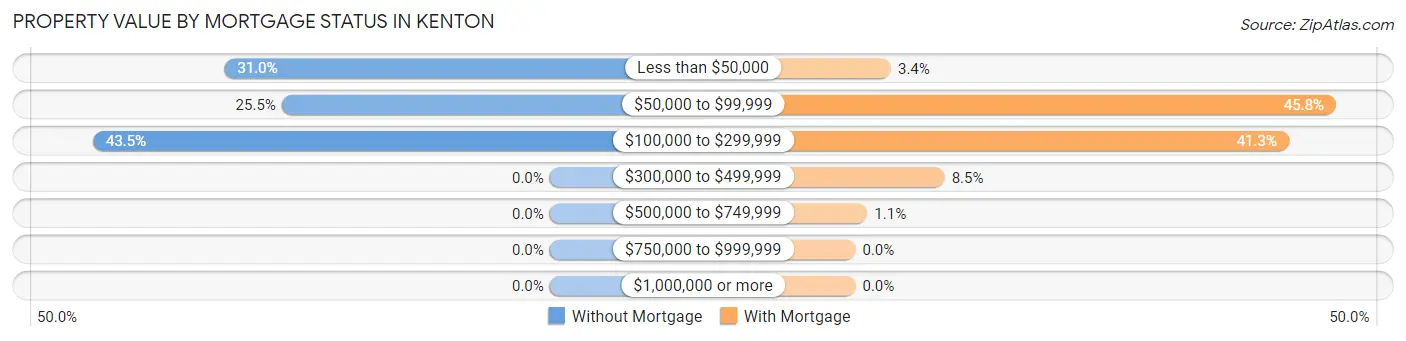
| Property Value | Without Mortgage | With Mortgage |
| Less than $50,000 | 329 (31.0%) | 39 (3.4%) |
| $50,000 to $99,999 | 271 (25.5%) | 528 (45.8%) |
| $100,000 to $299,999 | 462 (43.5%) | 476 (41.2%) |
| $300,000 to $499,999 | 0 (0.0%) | 98 (8.5%) |
| $500,000 to $749,999 | 0 (0.0%) | 13 (1.1%) |
| $750,000 to $999,999 | 0 (0.0%) | 0 (0.0%) |
| $1,000,000 or more | 0 (0.0%) | 0 (0.0%) |
| Total | 1,062 (100.0%) | 1,154 (100.0%) |
Household Income by Mortgage Status in Kenton
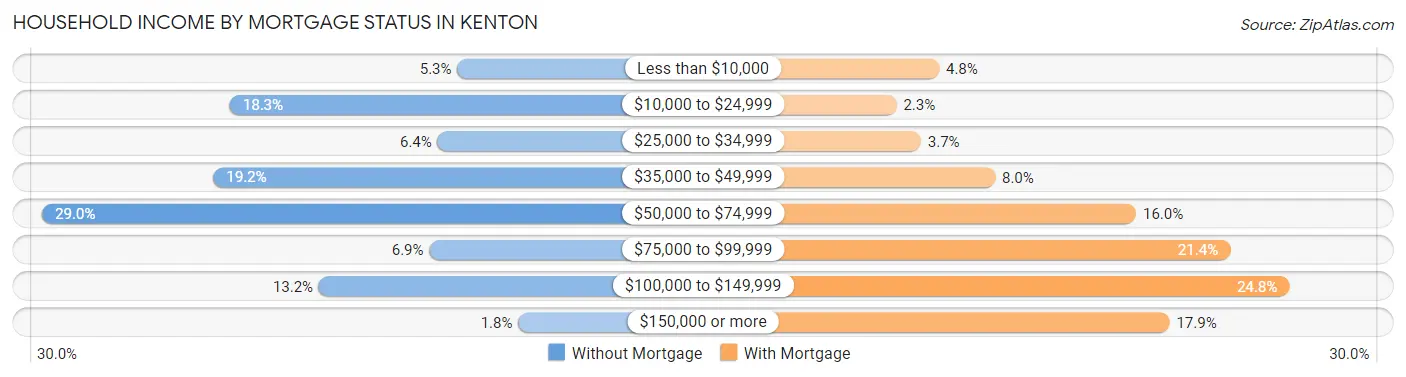
| Household Income | Without Mortgage | With Mortgage |
| Less than $10,000 | 56 (5.3%) | 55 (4.8%) |
| $10,000 to $24,999 | 194 (18.3%) | 27 (2.3%) |
| $25,000 to $34,999 | 68 (6.4%) | 43 (3.7%) |
| $35,000 to $49,999 | 204 (19.2%) | 92 (8.0%) |
| $50,000 to $74,999 | 308 (29.0%) | 185 (16.0%) |
| $75,000 to $99,999 | 73 (6.9%) | 247 (21.4%) |
| $100,000 to $149,999 | 140 (13.2%) | 286 (24.8%) |
| $150,000 or more | 19 (1.8%) | 207 (17.9%) |
| Total | 1,062 (100.0%) | 1,154 (100.0%) |
Property Value to Household Income Ratio in Kenton
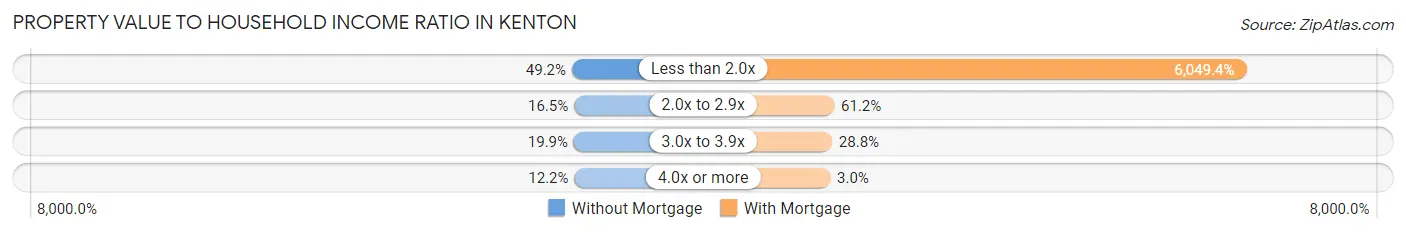
| Value-to-Income Ratio | Without Mortgage | With Mortgage |
| Less than 2.0x | 522 (49.1%) | 69,810 (6,049.4%) |
| 2.0x to 2.9x | 175 (16.5%) | 706 (61.2%) |
| 3.0x to 3.9x | 211 (19.9%) | 332 (28.8%) |
| 4.0x or more | 130 (12.2%) | 34 (2.9%) |
| Total | 1,062 (100.0%) | 1,154 (100.0%) |
Real Estate Taxes by Mortgage Status in Kenton
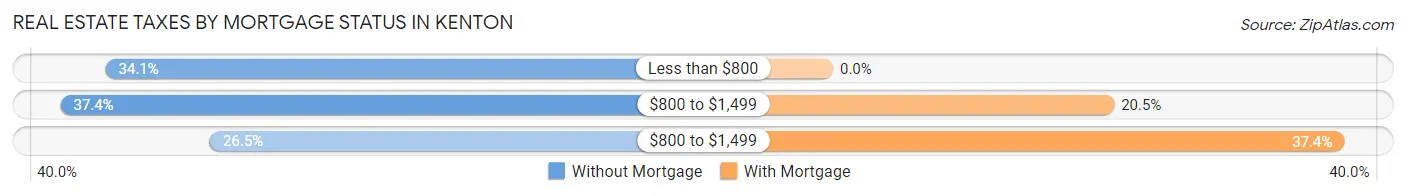
| Property Taxes | Without Mortgage | With Mortgage |
| Less than $800 | 362 (34.1%) | 0 (0.0%) |
| $800 to $1,499 | 397 (37.4%) | 237 (20.5%) |
| $800 to $1,499 | 281 (26.5%) | 431 (37.3%) |
| Total | 1,062 (100.0%) | 1,154 (100.0%) |
Health & Disability in Kenton
Health Insurance Coverage by Age in Kenton
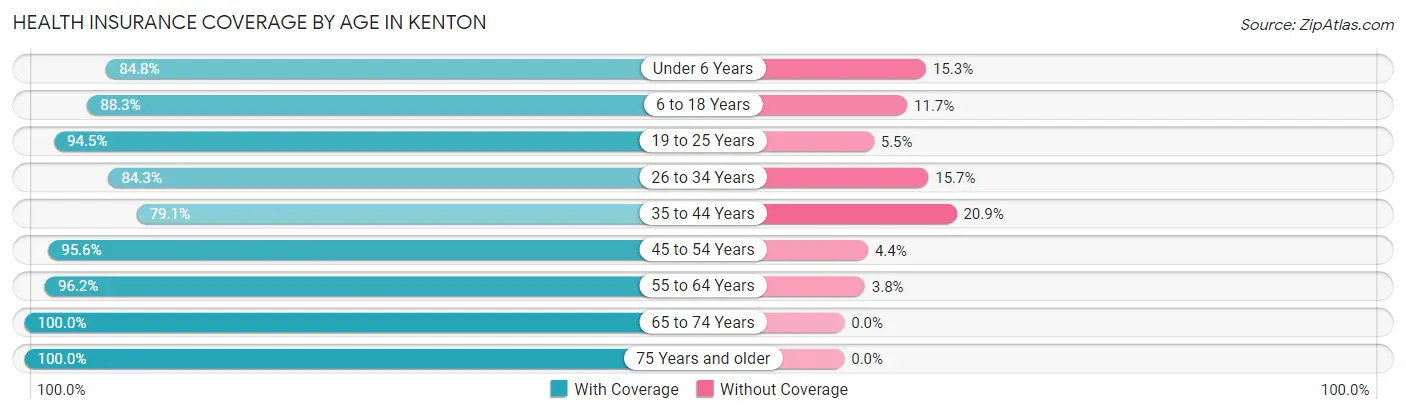
| Age Bracket | With Coverage | Without Coverage |
| Under 6 Years | 478 (84.8%) | 86 (15.2%) |
| 6 to 18 Years | 1,176 (88.3%) | 156 (11.7%) |
| 19 to 25 Years | 825 (94.5%) | 48 (5.5%) |
| 26 to 34 Years | 533 (84.3%) | 99 (15.7%) |
| 35 to 44 Years | 847 (79.1%) | 224 (20.9%) |
| 45 to 54 Years | 476 (95.6%) | 22 (4.4%) |
| 55 to 64 Years | 1,106 (96.2%) | 44 (3.8%) |
| 65 to 74 Years | 630 (100.0%) | 0 (0.0%) |
| 75 Years and older | 749 (100.0%) | 0 (0.0%) |
| Total | 6,820 (90.9%) | 679 (9.0%) |
Health Insurance Coverage by Citizenship Status in Kenton
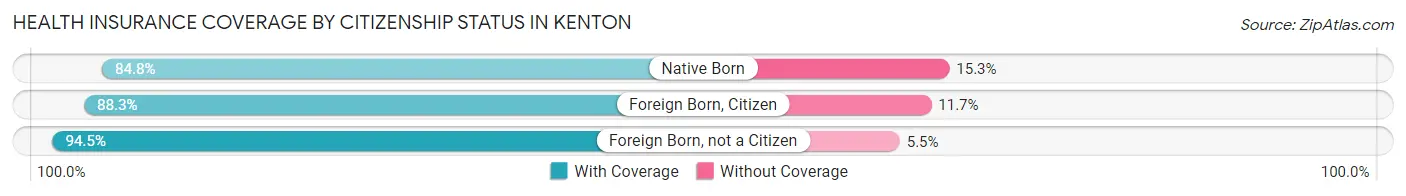
| Citizenship Status | With Coverage | Without Coverage |
| Native Born | 478 (84.8%) | 86 (15.2%) |
| Foreign Born, Citizen | 1,176 (88.3%) | 156 (11.7%) |
| Foreign Born, not a Citizen | 825 (94.5%) | 48 (5.5%) |
Health Insurance Coverage by Household Income in Kenton
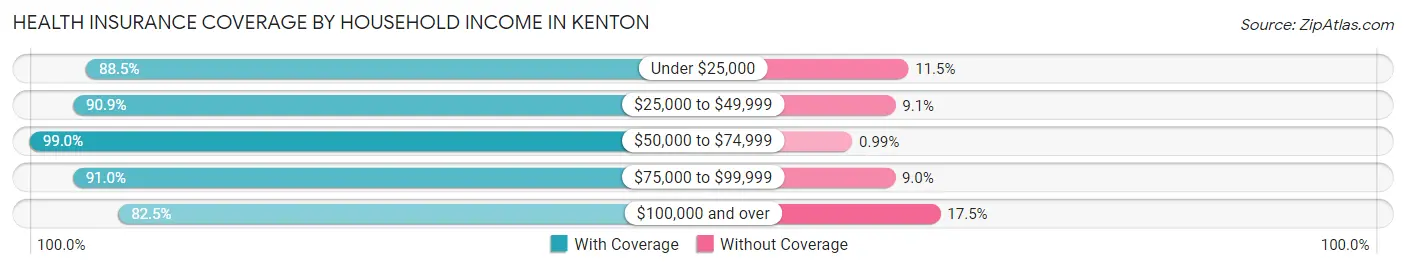
| Household Income | With Coverage | Without Coverage |
| Under $25,000 | 1,390 (88.5%) | 181 (11.5%) |
| $25,000 to $49,999 | 1,598 (90.9%) | 160 (9.1%) |
| $50,000 to $74,999 | 1,802 (99.0%) | 18 (1.0%) |
| $75,000 to $99,999 | 888 (91.0%) | 88 (9.0%) |
| $100,000 and over | 1,091 (82.5%) | 232 (17.5%) |
Public vs Private Health Insurance Coverage by Age in Kenton
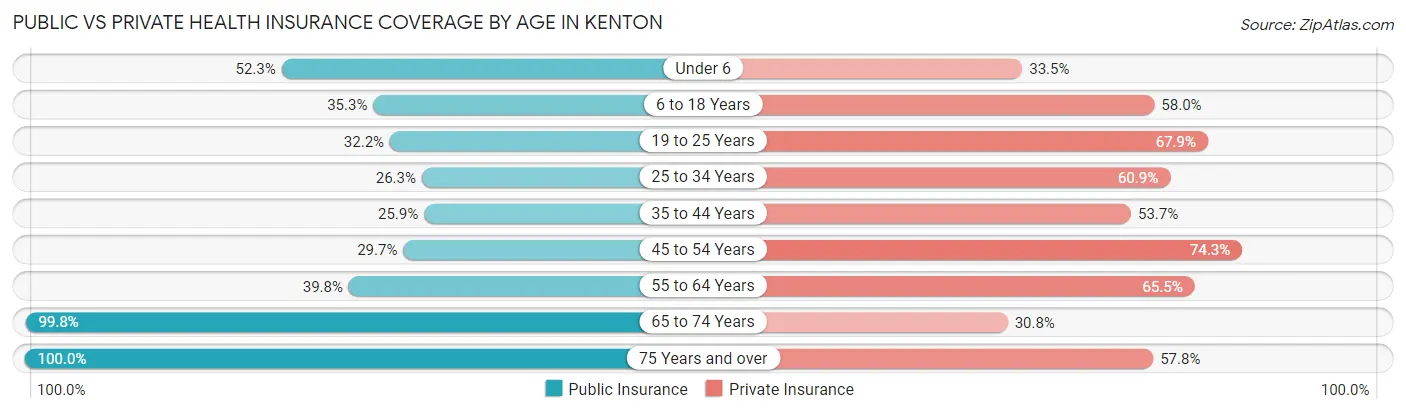
| Age Bracket | Public Insurance | Private Insurance |
| Under 6 | 295 (52.3%) | 189 (33.5%) |
| 6 to 18 Years | 470 (35.3%) | 773 (58.0%) |
| 19 to 25 Years | 281 (32.2%) | 593 (67.9%) |
| 25 to 34 Years | 166 (26.3%) | 385 (60.9%) |
| 35 to 44 Years | 277 (25.9%) | 575 (53.7%) |
| 45 to 54 Years | 148 (29.7%) | 370 (74.3%) |
| 55 to 64 Years | 458 (39.8%) | 753 (65.5%) |
| 65 to 74 Years | 629 (99.8%) | 194 (30.8%) |
| 75 Years and over | 749 (100.0%) | 433 (57.8%) |
| Total | 3,473 (46.3%) | 4,265 (56.9%) |
Disability Status by Sex by Age in Kenton
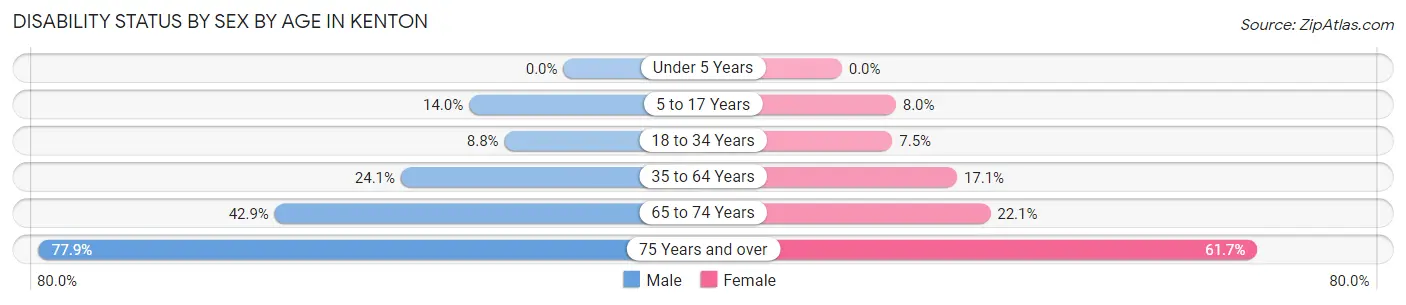
| Age Bracket | Male | Female |
| Under 5 Years | 0 (0.0%) | 0 (0.0%) |
| 5 to 17 Years | 111 (14.0%) | 52 (8.0%) |
| 18 to 34 Years | 78 (8.7%) | 52 (7.5%) |
| 35 to 64 Years | 347 (24.1%) | 219 (17.1%) |
| 65 to 74 Years | 132 (42.9%) | 71 (22.1%) |
| 75 Years and over | 197 (77.9%) | 306 (61.7%) |
Disability Class by Sex by Age in Kenton
Disability Class: Hearing Difficulty
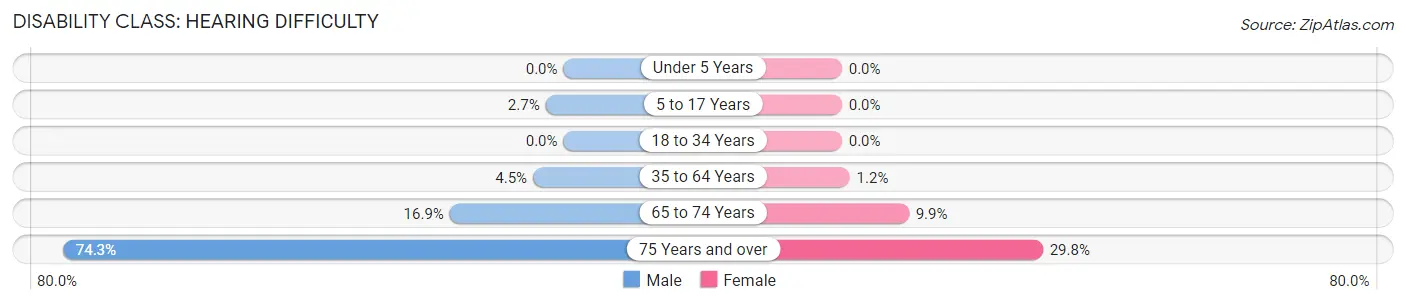
| Age Bracket | Male | Female |
| Under 5 Years | 0 (0.0%) | 0 (0.0%) |
| 5 to 17 Years | 21 (2.6%) | 0 (0.0%) |
| 18 to 34 Years | 0 (0.0%) | 0 (0.0%) |
| 35 to 64 Years | 65 (4.5%) | 15 (1.2%) |
| 65 to 74 Years | 52 (16.9%) | 32 (9.9%) |
| 75 Years and over | 188 (74.3%) | 148 (29.8%) |
Disability Class: Vision Difficulty
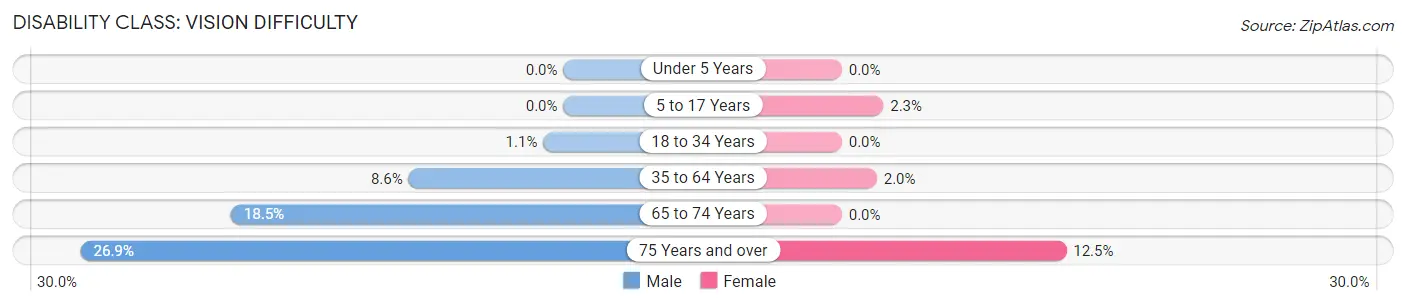
| Age Bracket | Male | Female |
| Under 5 Years | 0 (0.0%) | 0 (0.0%) |
| 5 to 17 Years | 0 (0.0%) | 15 (2.3%) |
| 18 to 34 Years | 10 (1.1%) | 0 (0.0%) |
| 35 to 64 Years | 124 (8.6%) | 25 (1.9%) |
| 65 to 74 Years | 57 (18.5%) | 0 (0.0%) |
| 75 Years and over | 68 (26.9%) | 62 (12.5%) |
Disability Class: Cognitive Difficulty
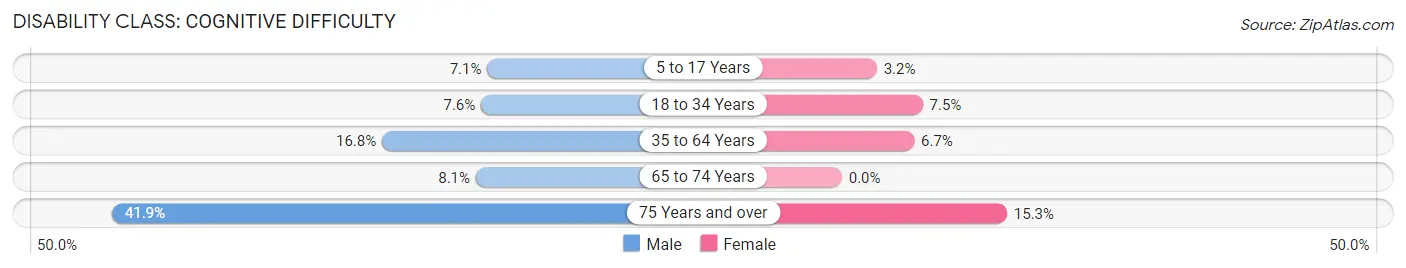
| Age Bracket | Male | Female |
| 5 to 17 Years | 56 (7.1%) | 21 (3.2%) |
| 18 to 34 Years | 68 (7.6%) | 52 (7.5%) |
| 35 to 64 Years | 242 (16.8%) | 86 (6.7%) |
| 65 to 74 Years | 25 (8.1%) | 0 (0.0%) |
| 75 Years and over | 106 (41.9%) | 76 (15.3%) |
Disability Class: Ambulatory Difficulty
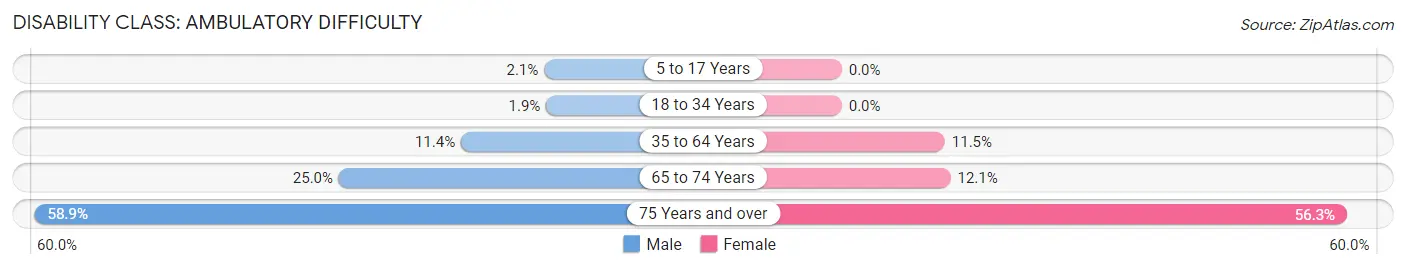
| Age Bracket | Male | Female |
| 5 to 17 Years | 17 (2.1%) | 0 (0.0%) |
| 18 to 34 Years | 17 (1.9%) | 0 (0.0%) |
| 35 to 64 Years | 164 (11.4%) | 147 (11.5%) |
| 65 to 74 Years | 77 (25.0%) | 39 (12.1%) |
| 75 Years and over | 149 (58.9%) | 279 (56.2%) |
Disability Class: Self-Care Difficulty
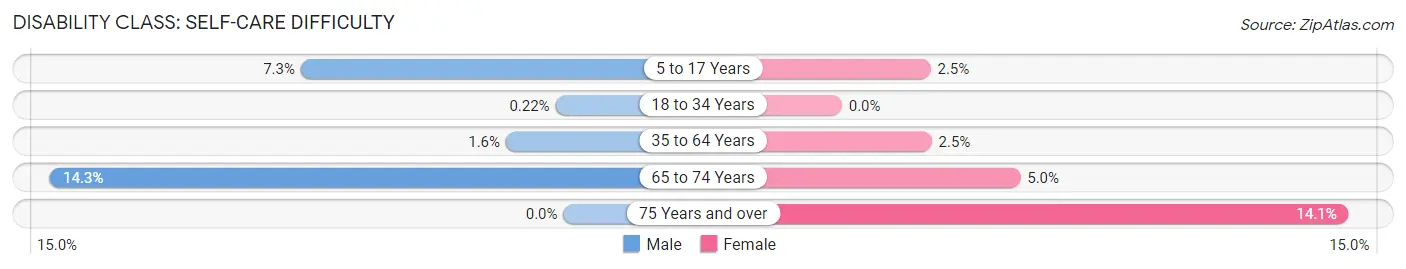
| Age Bracket | Male | Female |
| 5 to 17 Years | 58 (7.3%) | 16 (2.5%) |
| 18 to 34 Years | 2 (0.2%) | 0 (0.0%) |
| 35 to 64 Years | 23 (1.6%) | 32 (2.5%) |
| 65 to 74 Years | 44 (14.3%) | 16 (5.0%) |
| 75 Years and over | 0 (0.0%) | 70 (14.1%) |
Technology Access in Kenton
Computing Device Access in Kenton
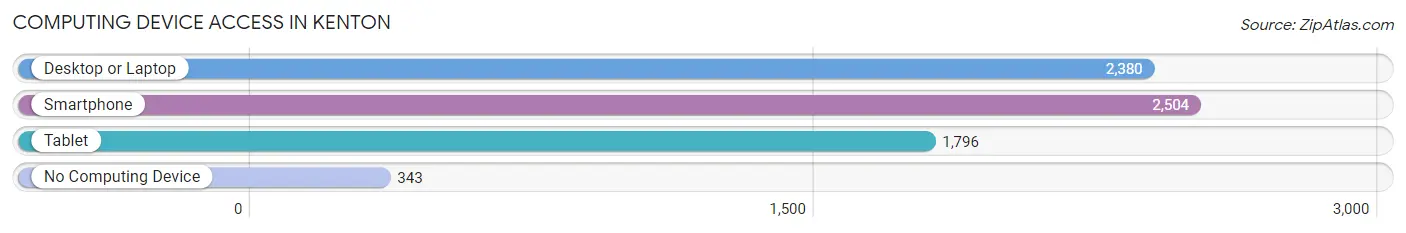
| Device Type | # Households | % Households |
| Desktop or Laptop | 2,380 | 72.2% |
| Smartphone | 2,504 | 75.9% |
| Tablet | 1,796 | 54.5% |
| No Computing Device | 343 | 10.4% |
| Total | 3,298 | 100.0% |
Internet Access in Kenton
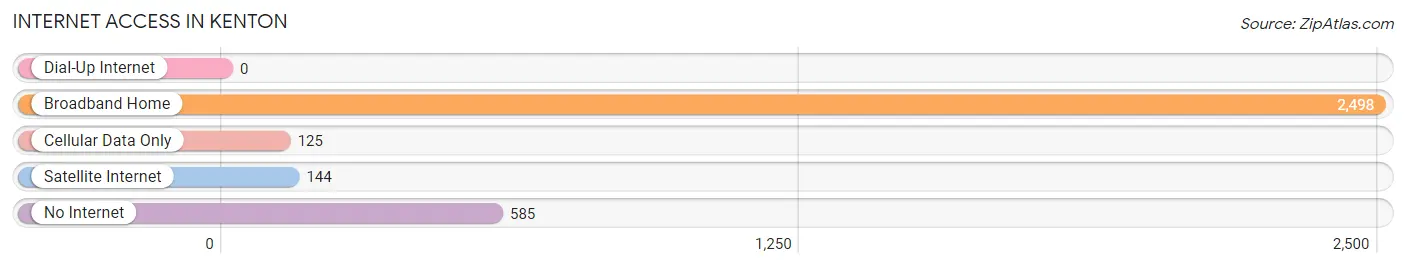
| Internet Type | # Households | % Households |
| Dial-Up Internet | 0 | 0.0% |
| Broadband Home | 2,498 | 75.7% |
| Cellular Data Only | 125 | 3.8% |
| Satellite Internet | 144 | 4.4% |
| No Internet | 585 | 17.7% |
| Total | 3,298 | 100.0% |
Kenton Summary
Kenton, Ohio is a small city located in Hardin County in the northwest corner of the state. It is situated on the banks of the Scioto River and is the county seat of Hardin County. The city has a population of 8,000 people and is part of the Lima Metropolitan Statistical Area.
History
Kenton was founded in 1831 by William Kenton, a Revolutionary War veteran. The city was originally known as Kenton Station, as it was a stop on the Mad River and Lake Erie Railroad. The city was incorporated in 1867 and was named after William Kenton.
Kenton was an important stop on the Underground Railroad, with many slaves escaping to freedom in Canada. The city was also a major center for the oil industry in the late 19th and early 20th centuries.
Geography
Kenton is located in Hardin County in the northwest corner of Ohio. It is situated on the banks of the Scioto River and is the county seat of Hardin County. The city has a total area of 4.2 square miles, all of which is land.
The city is located in the humid continental climate zone, with hot summers and cold winters. The average annual temperature is around 50 degrees Fahrenheit.
Economy
Kenton’s economy is largely based on manufacturing and agriculture. The city is home to several manufacturing companies, including Kenton Manufacturing, which produces industrial equipment, and Kenton Tool and Die, which produces tools and dies.
Agriculture is also an important part of the local economy. The city is home to several farms, including the Kenton Dairy Farm, which produces milk and other dairy products.
Demographics
Kenton has a population of 8,000 people, with a median age of 38. The city is predominantly white, with a small African American population. The median household income is $37,000, and the median home value is $90,000.
The city is served by the Kenton City School District, which includes two elementary schools, one middle school, and one high school. The city is also home to several churches, including the First United Methodist Church and the First Presbyterian Church.
Conclusion
Kenton, Ohio is a small city located in Hardin County in the northwest corner of the state. It is situated on the banks of the Scioto River and is the county seat of Hardin County. The city has a population of 8,000 people and is part of the Lima Metropolitan Statistical Area. The city’s economy is largely based on manufacturing and agriculture, and the median household income is $37,000. The city is served by the Kenton City School District and is home to several churches.
Common Questions
What is Per Capita Income in Kenton?
Per Capita income in Kenton is $25,281.
What is the Median Family Income in Kenton?
Median Family Income in Kenton is $53,293.
What is the Median Household income in Kenton?
Median Household Income in Kenton is $46,809.
What is Income or Wage Gap in Kenton?
Income or Wage Gap in Kenton is 47.2%.
Women in Kenton earn 52.8 cents for every dollar earned by a man.
What is Inequality or Gini Index in Kenton?
Inequality or Gini Index in Kenton is 0.43.
What is the Total Population of Kenton?
Total Population of Kenton is 7,685.
What is the Total Male Population of Kenton?
Total Male Population of Kenton is 3,861.
What is the Total Female Population of Kenton?
Total Female Population of Kenton is 3,824.
What is the Ratio of Males per 100 Females in Kenton?
There are 100.97 Males per 100 Females in Kenton.
What is the Ratio of Females per 100 Males in Kenton?
There are 99.04 Females per 100 Males in Kenton.
What is the Median Population Age in Kenton?
Median Population Age in Kenton is 40.1 Years.
What is the Average Family Size in Kenton
Average Family Size in Kenton is 2.9 People.
What is the Average Household Size in Kenton
Average Household Size in Kenton is 2.3 People.
How Large is the Labor Force in Kenton?
There are 3,245 People in the Labor Forcein in Kenton.
What is the Percentage of People in the Labor Force in Kenton?
53.8% of People are in the Labor Force in Kenton.
What is the Unemployment Rate in Kenton?
Unemployment Rate in Kenton is 8.3%.