Crestline, OH Map & Demographics
Crestline Map
Crestline Overview
$25,213
PER CAPITA INCOME
$63,484
AVG FAMILY INCOME
$49,471
AVG HOUSEHOLD INCOME
43.5%
WAGE / INCOME GAP [ % ]
56.5¢/ $1
WAGE / INCOME GAP [ $ ]
$12,170
FAMILY INCOME DEFICIT
0.44
INEQUALITY / GINI INDEX
4,490
TOTAL POPULATION
2,237
MALE POPULATION
2,253
FEMALE POPULATION
99.29
MALES / 100 FEMALES
100.72
FEMALES / 100 MALES
41.7
MEDIAN AGE
2.9
AVG FAMILY SIZE
2.4
AVG HOUSEHOLD SIZE
2,240
LABOR FORCE [ PEOPLE ]
63.6%
PERCENT IN LABOR FORCE
5.5%
UNEMPLOYMENT RATE
Crestline Zip Codes
Income in Crestline
Income Overview in Crestline
Per Capita Income in Crestline is $25,213, while median incomes of families and households are $63,484 and $49,471 respectively.
| Characteristic | Number | Measure |
| Per Capita Income | 4,490 | $25,213 |
| Median Family Income | 1,279 | $63,484 |
| Mean Family Income | 1,279 | $73,529 |
| Median Household Income | 1,828 | $49,471 |
| Mean Household Income | 1,828 | $62,184 |
| Income Deficit | 1,279 | $12,170 |
| Wage / Income Gap (%) | 4,490 | 43.50% |
| Wage / Income Gap ($) | 4,490 | 56.50¢ per $1 |
| Gini / Inequality Index | 4,490 | 0.44 |
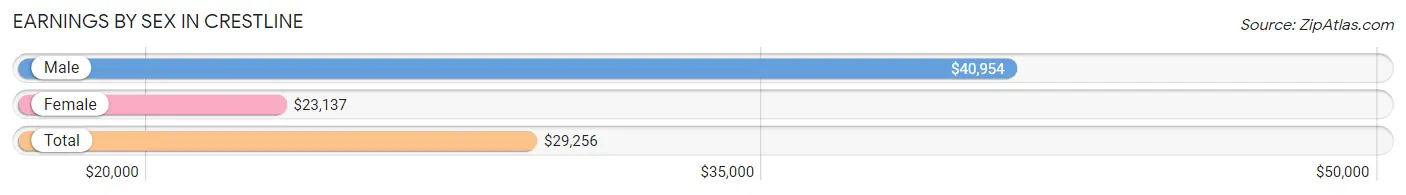
Earnings by Sex in Crestline
Average Earnings in Crestline are $29,256, $40,954 for men and $23,137 for women, a difference of 43.5%.
| Sex | Number | Average Earnings |
| Male | 1,143 (48.1%) | $40,954 |
| Female | 1,233 (51.9%) | $23,137 |
| Total | 2,376 (100.0%) | $29,256 |
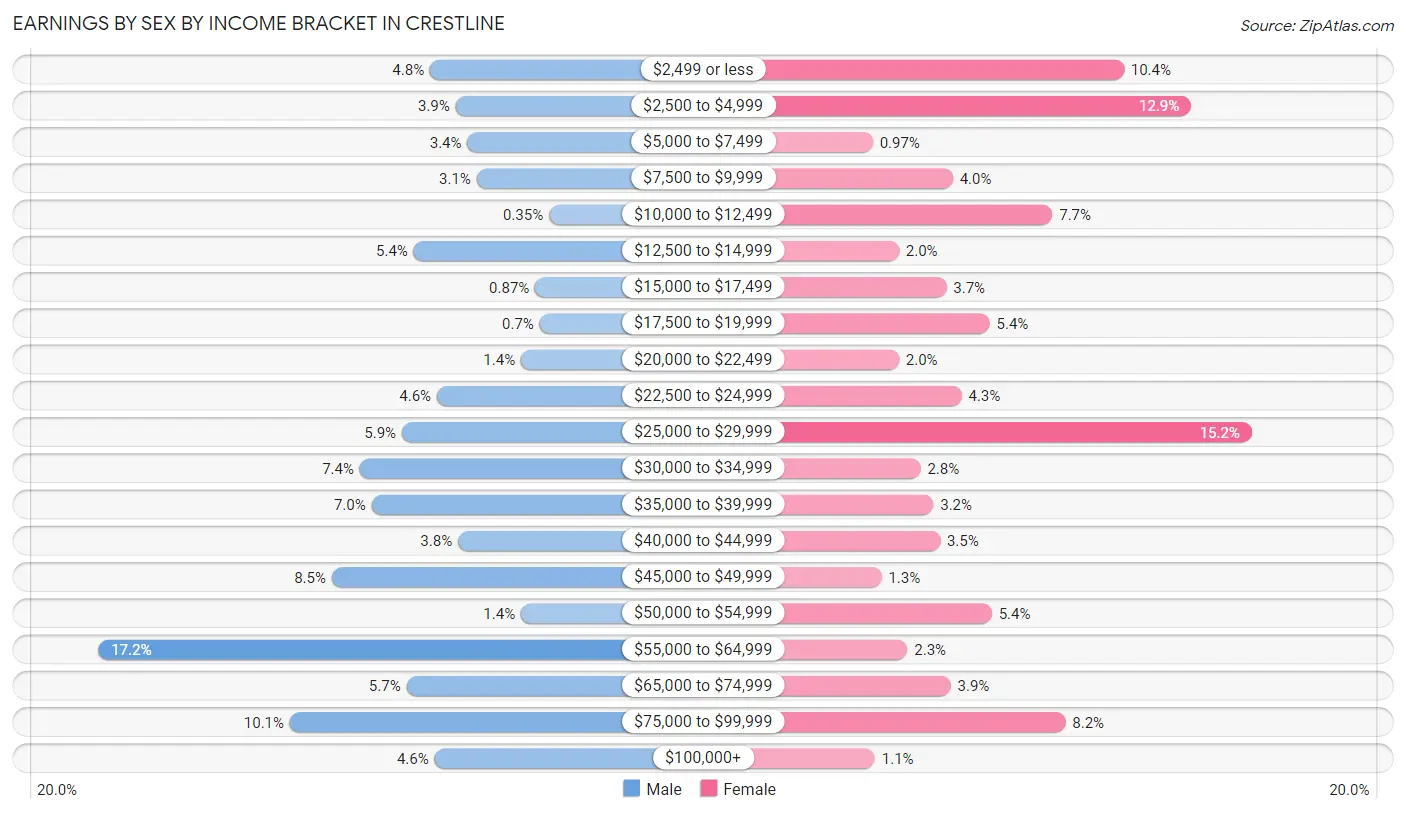
Earnings by Sex by Income Bracket in Crestline
The most common earnings brackets in Crestline are $55,000 to $64,999 for men (197 | 17.2%) and $25,000 to $29,999 for women (187 | 15.2%).
| Income | Male | Female |
| $2,499 or less | 55 (4.8%) | 128 (10.4%) |
| $2,500 to $4,999 | 44 (3.8%) | 159 (12.9%) |
| $5,000 to $7,499 | 39 (3.4%) | 12 (1.0%) |
| $7,500 to $9,999 | 35 (3.1%) | 49 (4.0%) |
| $10,000 to $12,499 | 4 (0.4%) | 95 (7.7%) |
| $12,500 to $14,999 | 62 (5.4%) | 24 (1.9%) |
| $15,000 to $17,499 | 10 (0.9%) | 46 (3.7%) |
| $17,500 to $19,999 | 8 (0.7%) | 66 (5.3%) |
| $20,000 to $22,499 | 16 (1.4%) | 24 (1.9%) |
| $22,500 to $24,999 | 52 (4.5%) | 53 (4.3%) |
| $25,000 to $29,999 | 67 (5.9%) | 187 (15.2%) |
| $30,000 to $34,999 | 85 (7.4%) | 34 (2.8%) |
| $35,000 to $39,999 | 80 (7.0%) | 40 (3.2%) |
| $40,000 to $44,999 | 43 (3.8%) | 43 (3.5%) |
| $45,000 to $49,999 | 97 (8.5%) | 16 (1.3%) |
| $50,000 to $54,999 | 16 (1.4%) | 67 (5.4%) |
| $55,000 to $64,999 | 197 (17.2%) | 28 (2.3%) |
| $65,000 to $74,999 | 65 (5.7%) | 48 (3.9%) |
| $75,000 to $99,999 | 115 (10.1%) | 101 (8.2%) |
| $100,000+ | 53 (4.6%) | 13 (1.1%) |
| Total | 1,143 (100.0%) | 1,233 (100.0%) |
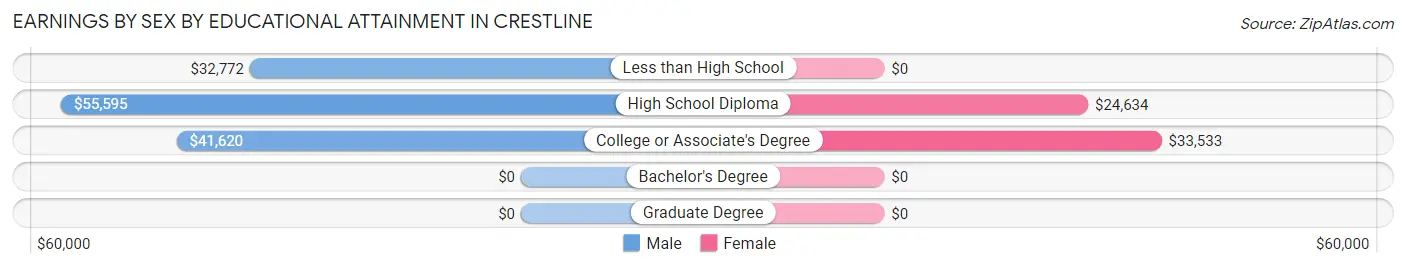
Earnings by Sex by Educational Attainment in Crestline
Average earnings in Crestline are $45,880 for men and $25,511 for women, a difference of 44.4%. Men with an educational attainment of high school diploma enjoy the highest average annual earnings of $55,595, while those with less than high school education earn the least with $32,772. Women with an educational attainment of college or associate's degree earn the most with the average annual earnings of $33,533, while those with high school diploma education have the smallest earnings of $24,634.
| Educational Attainment | Male Income | Female Income |
| Less than High School | $32,772 | $0 |
| High School Diploma | $55,595 | $24,634 |
| College or Associate's Degree | $41,620 | $33,533 |
| Bachelor's Degree | - | - |
| Graduate Degree | - | - |
| Total | $45,880 | $25,511 |
Family Income in Crestline
Family Income Brackets in Crestline
According to the Crestline family income data, there are 294 families falling into the $100,000 to $149,999 income range, which is the most common income bracket and makes up 23.0% of all families. Conversely, the $200,000+ income bracket is the least frequent group with only 35 families (2.7%) belonging to this category.
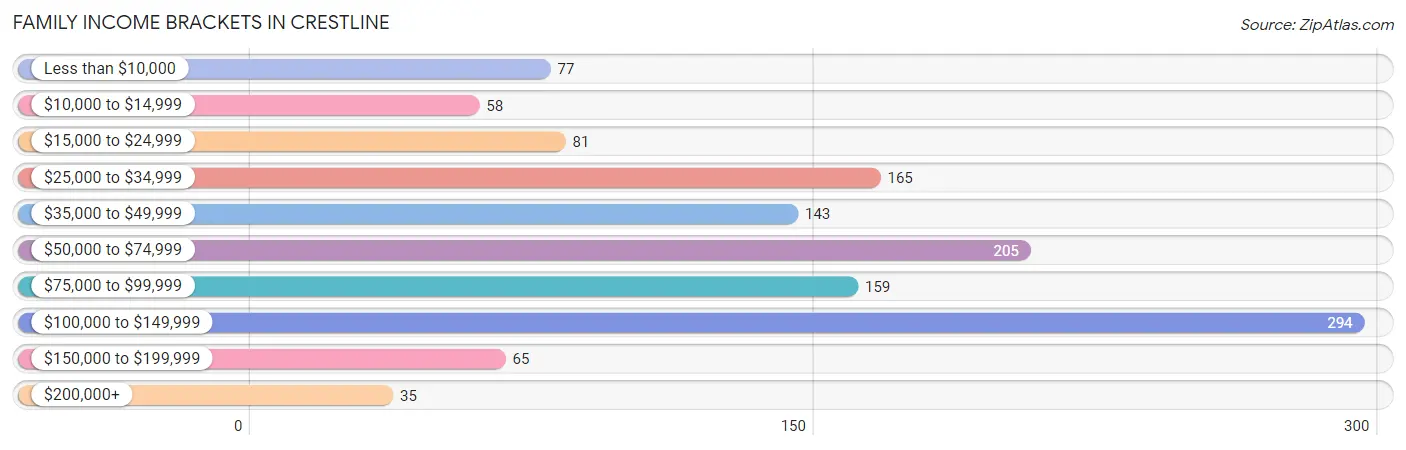
| Income Bracket | # Families | % Families |
| Less than $10,000 | 77 | 6.0% |
| $10,000 to $14,999 | 58 | 4.5% |
| $15,000 to $24,999 | 81 | 6.3% |
| $25,000 to $34,999 | 165 | 12.9% |
| $35,000 to $49,999 | 143 | 11.2% |
| $50,000 to $74,999 | 205 | 16.0% |
| $75,000 to $99,999 | 159 | 12.4% |
| $100,000 to $149,999 | 294 | 23.0% |
| $150,000 to $199,999 | 65 | 5.1% |
| $200,000+ | 35 | 2.7% |
Family Income by Famaliy Size in Crestline
6-person families (39 | 3.0%) account for the highest median family income in Crestline with $100,875 per family, while 3-person families (360 | 28.1%) have the highest median income of $23,073 per family member.
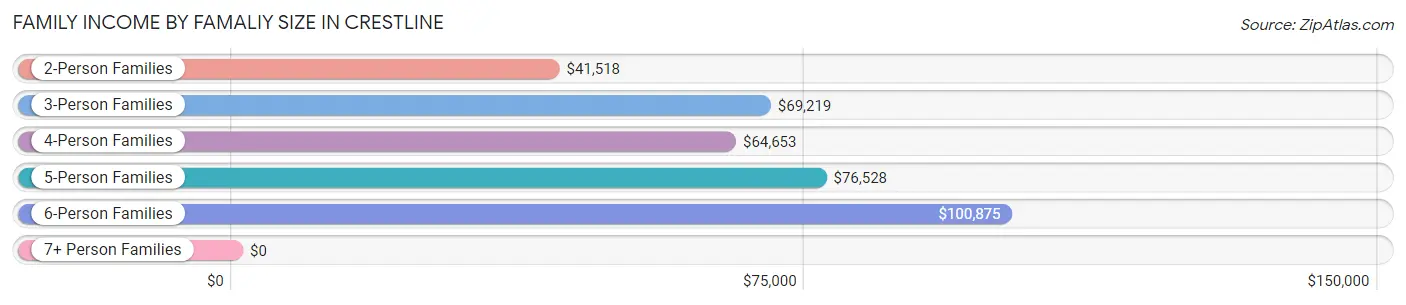
| Income Bracket | # Families | Median Income |
| 2-Person Families | 535 (41.8%) | $41,518 |
| 3-Person Families | 360 (28.1%) | $69,219 |
| 4-Person Families | 248 (19.4%) | $64,653 |
| 5-Person Families | 97 (7.6%) | $76,528 |
| 6-Person Families | 39 (3.0%) | $100,875 |
| 7+ Person Families | 0 (0.0%) | $0 |
| Total | 1,279 (100.0%) | $63,484 |
Family Income by Number of Earners in Crestline
The median family income in Crestline is $63,484, with families comprising 3+ earners (194) having the highest median family income of $117,011, while families with 1 earner (425) have the lowest median family income of $31,047, accounting for 15.2% and 33.2% of families, respectively.
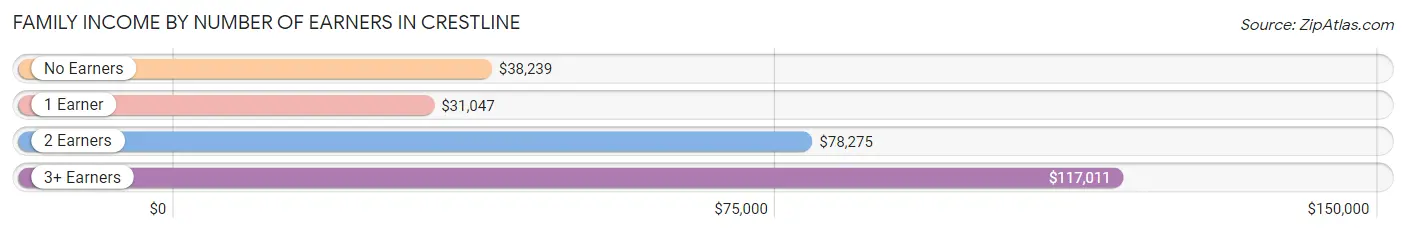
| Number of Earners | # Families | Median Income |
| No Earners | 159 (12.4%) | $38,239 |
| 1 Earner | 425 (33.2%) | $31,047 |
| 2 Earners | 501 (39.2%) | $78,275 |
| 3+ Earners | 194 (15.2%) | $117,011 |
| Total | 1,279 (100.0%) | $63,484 |
Household Income in Crestline
Household Income Brackets in Crestline
With 316 households falling in the category, the $100,000 to $149,999 income range is the most frequent in Crestline, accounting for 17.3% of all households. In contrast, only 35 households (1.9%) fall into the $200,000+ income bracket, making it the least populous group.
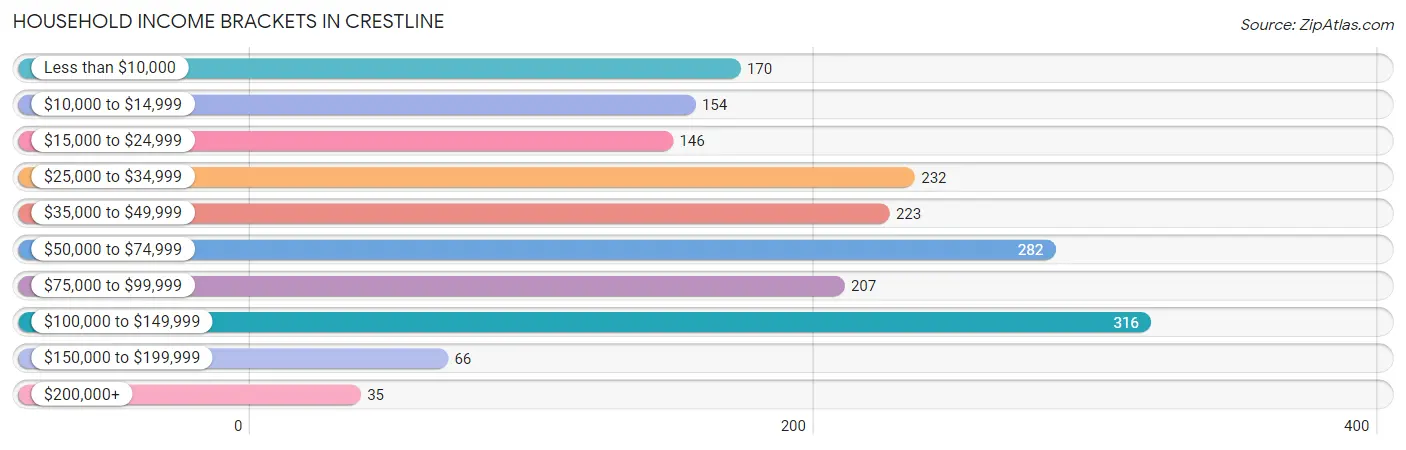
| Income Bracket | # Households | % Households |
| Less than $10,000 | 170 | 9.3% |
| $10,000 to $14,999 | 154 | 8.4% |
| $15,000 to $24,999 | 146 | 8.0% |
| $25,000 to $34,999 | 232 | 12.7% |
| $35,000 to $49,999 | 223 | 12.2% |
| $50,000 to $74,999 | 282 | 15.4% |
| $75,000 to $99,999 | 207 | 11.3% |
| $100,000 to $149,999 | 316 | 17.3% |
| $150,000 to $199,999 | 66 | 3.6% |
| $200,000+ | 35 | 1.9% |
Household Income by Householder Age in Crestline
The median household income in Crestline is $49,471, with the highest median household income of $62,212 found in the 25 to 44 years age bracket for the primary householder. A total of 481 households (26.3%) fall into this category. Meanwhile, the 15 to 24 years age bracket for the primary householder has the lowest median household income of $0, with 137 households (7.5%) in this group.
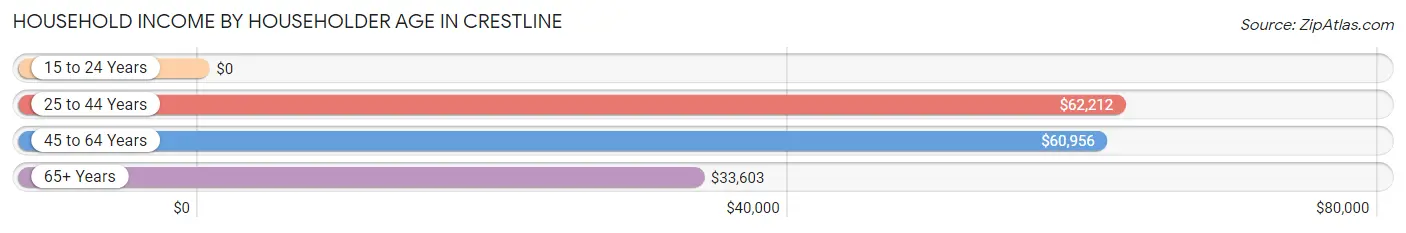
| Income Bracket | # Households | Median Income |
| 15 to 24 Years | 137 (7.5%) | $0 |
| 25 to 44 Years | 481 (26.3%) | $62,212 |
| 45 to 64 Years | 781 (42.7%) | $60,956 |
| 65+ Years | 429 (23.5%) | $33,603 |
| Total | 1,828 (100.0%) | $49,471 |
Poverty in Crestline
Income Below Poverty by Sex and Age in Crestline
With 15.5% poverty level for males and 14.5% for females among the residents of Crestline, under 5 year old males and under 5 year old females are the most vulnerable to poverty, with 43 males (33.3%) and 53 females (51.5%) in their respective age groups living below the poverty level.
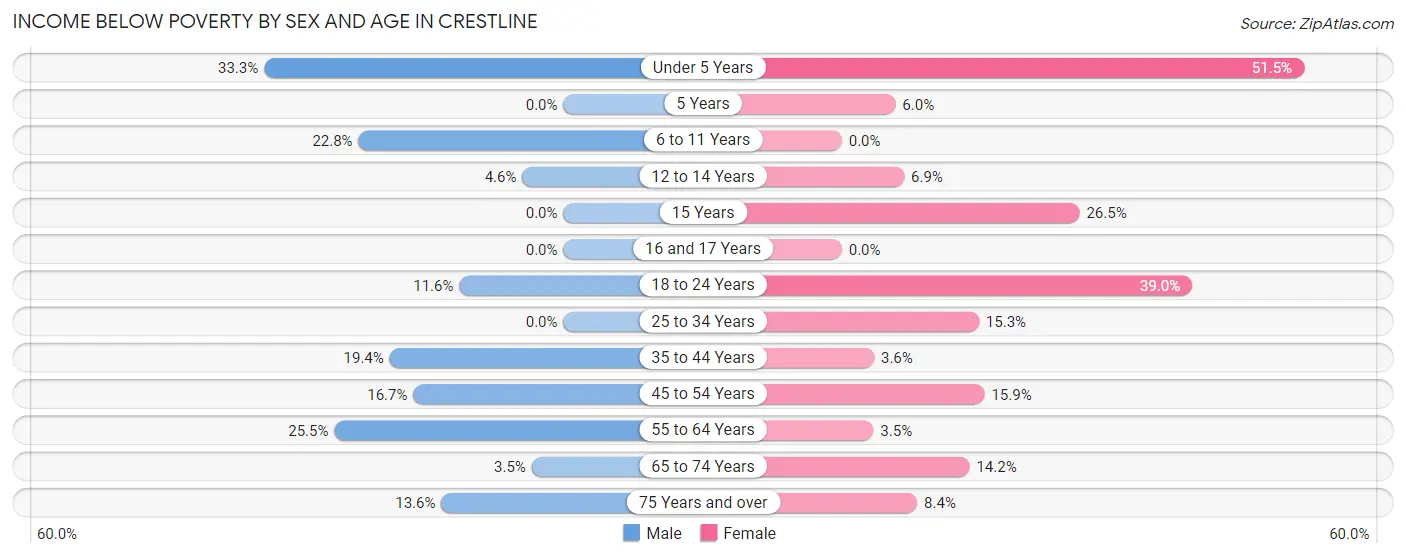
| Age Bracket | Male | Female |
| Under 5 Years | 43 (33.3%) | 53 (51.5%) |
| 5 Years | 0 (0.0%) | 4 (6.0%) |
| 6 to 11 Years | 47 (22.8%) | 0 (0.0%) |
| 12 to 14 Years | 8 (4.6%) | 5 (6.9%) |
| 15 Years | 0 (0.0%) | 9 (26.5%) |
| 16 and 17 Years | 0 (0.0%) | 0 (0.0%) |
| 18 to 24 Years | 19 (11.6%) | 87 (39.0%) |
| 25 to 34 Years | 0 (0.0%) | 42 (15.3%) |
| 35 to 44 Years | 48 (19.4%) | 8 (3.6%) |
| 45 to 54 Years | 71 (16.7%) | 68 (15.9%) |
| 55 to 64 Years | 88 (25.5%) | 8 (3.5%) |
| 65 to 74 Years | 6 (3.5%) | 29 (14.2%) |
| 75 Years and over | 14 (13.6%) | 12 (8.4%) |
| Total | 344 (15.5%) | 325 (14.5%) |
Income Above Poverty by Sex and Age in Crestline
According to the poverty statistics in Crestline, males aged 5 years and females aged 6 to 11 years are the age groups that are most secure financially, with 100.0% of males and 100.0% of females in these age groups living above the poverty line.
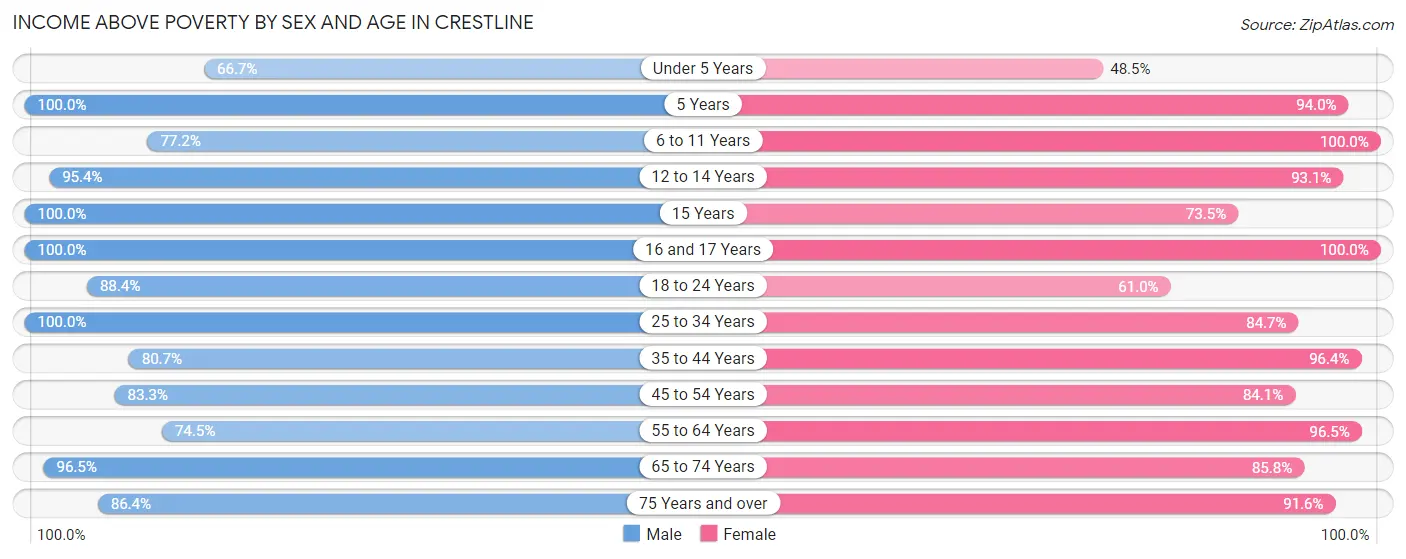
| Age Bracket | Male | Female |
| Under 5 Years | 86 (66.7%) | 50 (48.5%) |
| 5 Years | 9 (100.0%) | 63 (94.0%) |
| 6 to 11 Years | 159 (77.2%) | 149 (100.0%) |
| 12 to 14 Years | 167 (95.4%) | 67 (93.1%) |
| 15 Years | 24 (100.0%) | 25 (73.5%) |
| 16 and 17 Years | 60 (100.0%) | 93 (100.0%) |
| 18 to 24 Years | 145 (88.4%) | 136 (61.0%) |
| 25 to 34 Years | 163 (100.0%) | 233 (84.7%) |
| 35 to 44 Years | 200 (80.6%) | 215 (96.4%) |
| 45 to 54 Years | 354 (83.3%) | 360 (84.1%) |
| 55 to 64 Years | 257 (74.5%) | 219 (96.5%) |
| 65 to 74 Years | 164 (96.5%) | 175 (85.8%) |
| 75 Years and over | 89 (86.4%) | 131 (91.6%) |
| Total | 1,877 (84.5%) | 1,916 (85.5%) |
Income Below Poverty Among Married-Couple Families in Crestline
The poverty statistics for married-couple families in Crestline show that 4.1% or 37 of the total 910 families live below the poverty line. Families with no children have the highest poverty rate of 5.4%, comprising of 28 families. On the other hand, families with 1 or 2 children have the lowest poverty rate of 1.7%, which includes 5 families.
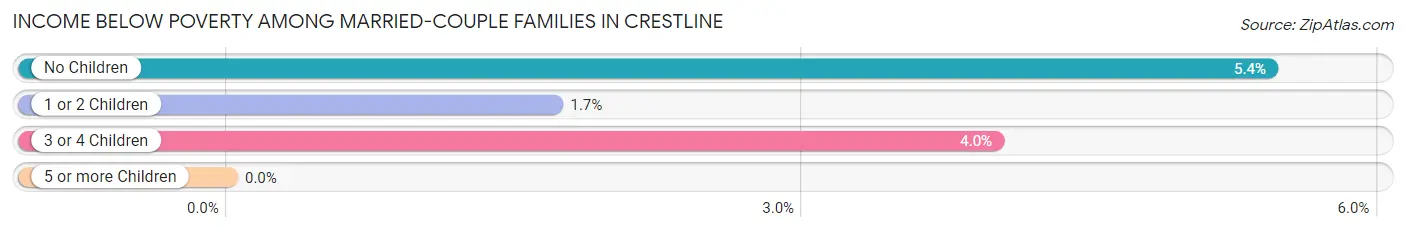
| Children | Above Poverty | Below Poverty |
| No Children | 488 (94.6%) | 28 (5.4%) |
| 1 or 2 Children | 289 (98.3%) | 5 (1.7%) |
| 3 or 4 Children | 96 (96.0%) | 4 (4.0%) |
| 5 or more Children | 0 (0.0%) | 0 (0.0%) |
| Total | 873 (95.9%) | 37 (4.1%) |
Income Below Poverty Among Single-Parent Households in Crestline
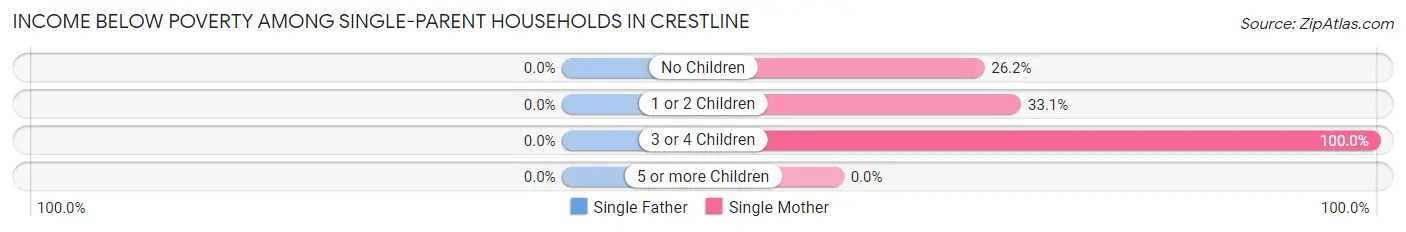
| Children | Single Father | Single Mother |
| No Children | 0 (0.0%) | 22 (26.2%) |
| 1 or 2 Children | 0 (0.0%) | 77 (33.1%) |
| 3 or 4 Children | 0 (0.0%) | 32 (100.0%) |
| 5 or more Children | 0 (0.0%) | 0 (0.0%) |
| Total | 0 (0.0%) | 131 (37.5%) |
Income Below Poverty Among Married-Couple vs Single-Parent Households in Crestline
The poverty data for Crestline shows that 37 of the married-couple family households (4.1%) and 131 of the single-parent households (35.5%) are living below the poverty level. Within the married-couple family households, those with no children have the highest poverty rate, with 28 households (5.4%) falling below the poverty line. Among the single-parent households, those with 3 or 4 children have the highest poverty rate, with 32 household (100.0%) living below poverty.
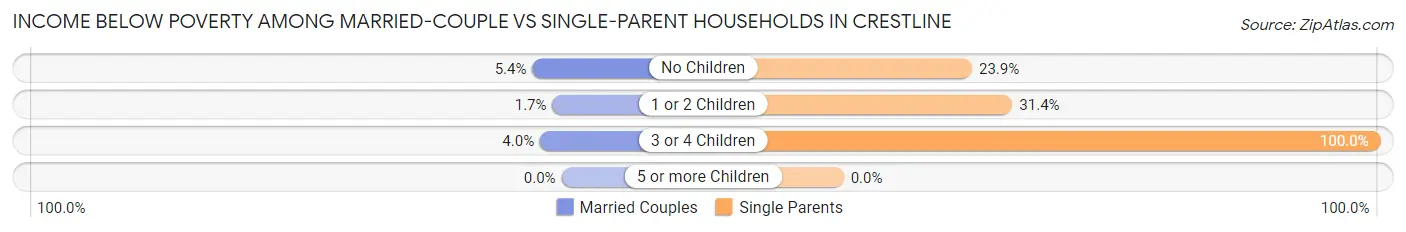
| Children | Married-Couple Families | Single-Parent Households |
| No Children | 28 (5.4%) | 22 (23.9%) |
| 1 or 2 Children | 5 (1.7%) | 77 (31.4%) |
| 3 or 4 Children | 4 (4.0%) | 32 (100.0%) |
| 5 or more Children | 0 (0.0%) | 0 (0.0%) |
| Total | 37 (4.1%) | 131 (35.5%) |
Race in Crestline
The most populous races in Crestline are White / Caucasian (4,035 | 89.9%), Two or more Races (263 | 5.9%), and Black / African American (153 | 3.4%).
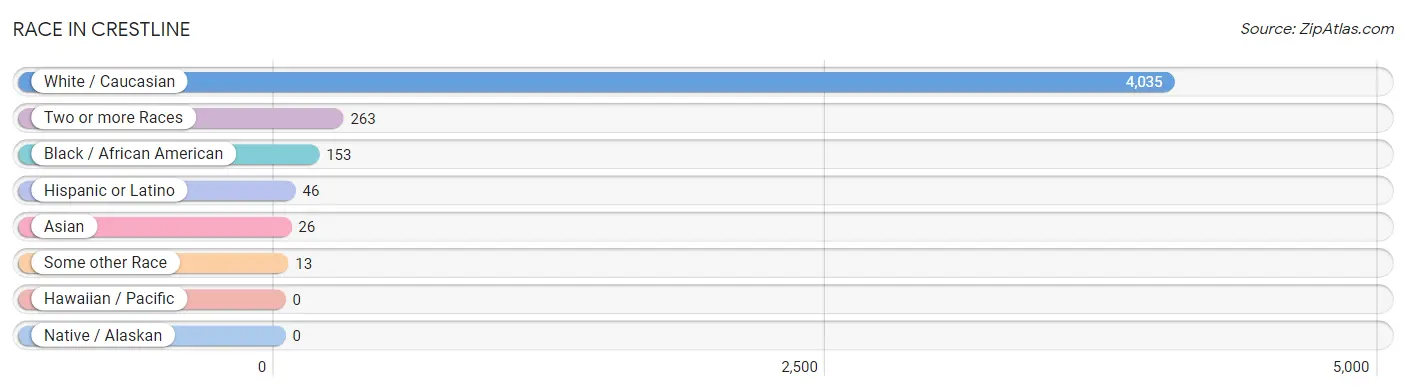
| Race | # Population | % Population |
| Asian | 26 | 0.6% |
| Black / African American | 153 | 3.4% |
| Hawaiian / Pacific | 0 | 0.0% |
| Hispanic or Latino | 46 | 1.0% |
| Native / Alaskan | 0 | 0.0% |
| White / Caucasian | 4,035 | 89.9% |
| Two or more Races | 263 | 5.9% |
| Some other Race | 13 | 0.3% |
| Total | 4,490 | 100.0% |
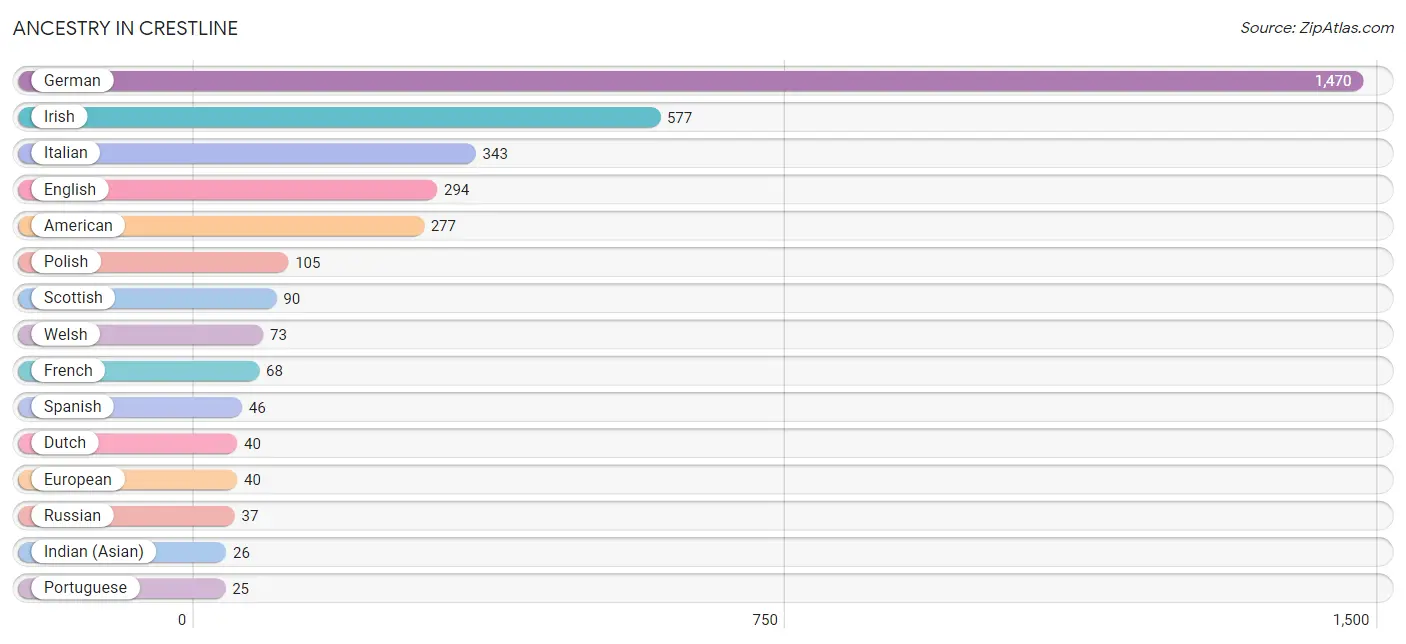
Ancestry in Crestline
The most populous ancestries reported in Crestline are German (1,470 | 32.7%), Irish (577 | 12.9%), Italian (343 | 7.6%), English (294 | 6.6%), and American (277 | 6.2%), together accounting for 65.9% of all Crestline residents.
| Ancestry | # Population | % Population |
| Albanian | 11 | 0.2% |
| American | 277 | 6.2% |
| Arab | 11 | 0.2% |
| Barbadian | 3 | 0.1% |
| Bhutanese | 13 | 0.3% |
| Blackfeet | 2 | 0.0% |
| British | 13 | 0.3% |
| Canadian | 9 | 0.2% |
| Czech | 4 | 0.1% |
| Czechoslovakian | 5 | 0.1% |
| Dutch | 40 | 0.9% |
| Eastern European | 15 | 0.3% |
| English | 294 | 6.6% |
| European | 40 | 0.9% |
| French | 68 | 1.5% |
| French Canadian | 5 | 0.1% |
| German | 1,470 | 32.7% |
| Greek | 24 | 0.5% |
| Indian (Asian) | 26 | 0.6% |
| Irish | 577 | 12.9% |
| Italian | 343 | 7.6% |
| Native Hawaiian | 13 | 0.3% |
| Pennsylvania German | 9 | 0.2% |
| Polish | 105 | 2.3% |
| Portuguese | 25 | 0.6% |
| Romanian | 7 | 0.2% |
| Russian | 37 | 0.8% |
| Scotch-Irish | 19 | 0.4% |
| Scottish | 90 | 2.0% |
| South African | 8 | 0.2% |
| Spanish | 46 | 1.0% |
| Subsaharan African | 12 | 0.3% |
| Swedish | 6 | 0.1% |
| Welsh | 73 | 1.6% | View All 34 Rows |
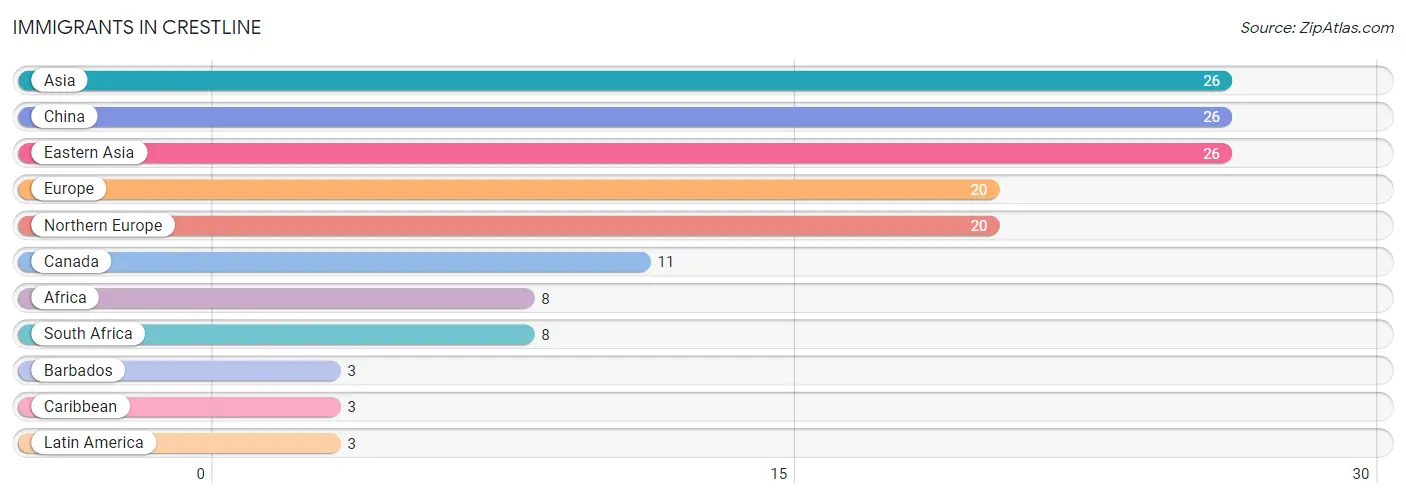
Immigrants in Crestline
The most numerous immigrant groups reported in Crestline came from Asia (26 | 0.6%), China (26 | 0.6%), Eastern Asia (26 | 0.6%), Europe (20 | 0.4%), and Northern Europe (20 | 0.4%), together accounting for 2.6% of all Crestline residents.
| Immigration Origin | # Population | % Population |
| Africa | 8 | 0.2% |
| Asia | 26 | 0.6% |
| Barbados | 3 | 0.1% |
| Canada | 11 | 0.2% |
| Caribbean | 3 | 0.1% |
| China | 26 | 0.6% |
| Eastern Asia | 26 | 0.6% |
| Europe | 20 | 0.4% |
| Latin America | 3 | 0.1% |
| Northern Europe | 20 | 0.4% |
| South Africa | 8 | 0.2% | View All 11 Rows |
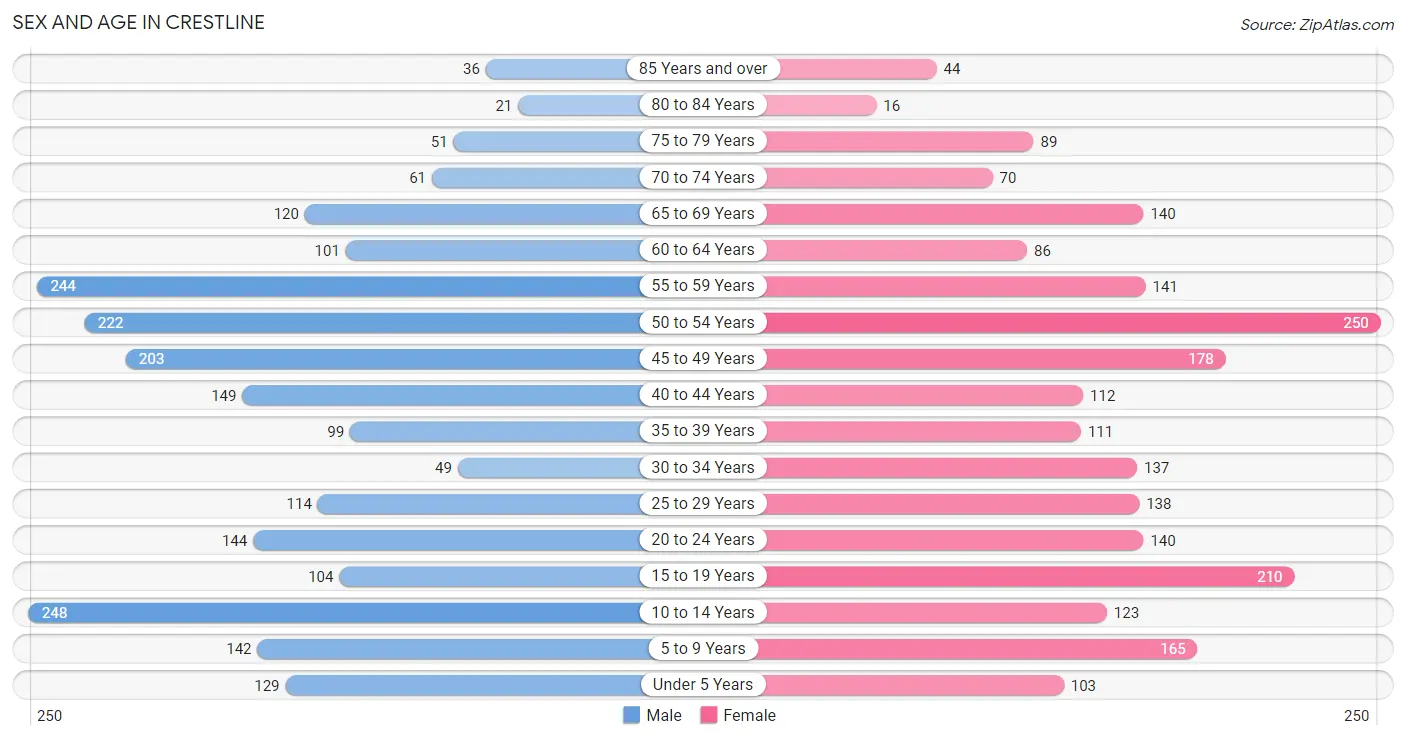
Sex and Age in Crestline
Sex and Age in Crestline
The most populous age groups in Crestline are 10 to 14 Years (248 | 11.1%) for men and 50 to 54 Years (250 | 11.1%) for women.
| Age Bracket | Male | Female |
| Under 5 Years | 129 (5.8%) | 103 (4.6%) |
| 5 to 9 Years | 142 (6.4%) | 165 (7.3%) |
| 10 to 14 Years | 248 (11.1%) | 123 (5.5%) |
| 15 to 19 Years | 104 (4.6%) | 210 (9.3%) |
| 20 to 24 Years | 144 (6.4%) | 140 (6.2%) |
| 25 to 29 Years | 114 (5.1%) | 138 (6.1%) |
| 30 to 34 Years | 49 (2.2%) | 137 (6.1%) |
| 35 to 39 Years | 99 (4.4%) | 111 (4.9%) |
| 40 to 44 Years | 149 (6.7%) | 112 (5.0%) |
| 45 to 49 Years | 203 (9.1%) | 178 (7.9%) |
| 50 to 54 Years | 222 (9.9%) | 250 (11.1%) |
| 55 to 59 Years | 244 (10.9%) | 141 (6.3%) |
| 60 to 64 Years | 101 (4.5%) | 86 (3.8%) |
| 65 to 69 Years | 120 (5.4%) | 140 (6.2%) |
| 70 to 74 Years | 61 (2.7%) | 70 (3.1%) |
| 75 to 79 Years | 51 (2.3%) | 89 (4.0%) |
| 80 to 84 Years | 21 (0.9%) | 16 (0.7%) |
| 85 Years and over | 36 (1.6%) | 44 (1.9%) |
| Total | 2,237 (100.0%) | 2,253 (100.0%) |
Families and Households in Crestline
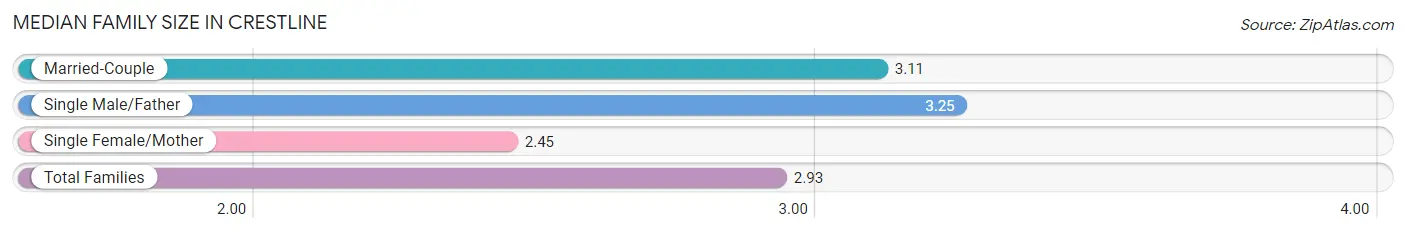
Median Family Size in Crestline
The median family size in Crestline is 2.93 persons per family, with single male/father families (20 | 1.6%) accounting for the largest median family size of 3.25 persons per family. On the other hand, single female/mother families (349 | 27.3%) represent the smallest median family size with 2.45 persons per family.
| Family Type | # Families | Family Size |
| Married-Couple | 910 (71.2%) | 3.11 |
| Single Male/Father | 20 (1.6%) | 3.25 |
| Single Female/Mother | 349 (27.3%) | 2.45 |
| Total Families | 1,279 (100.0%) | 2.93 |
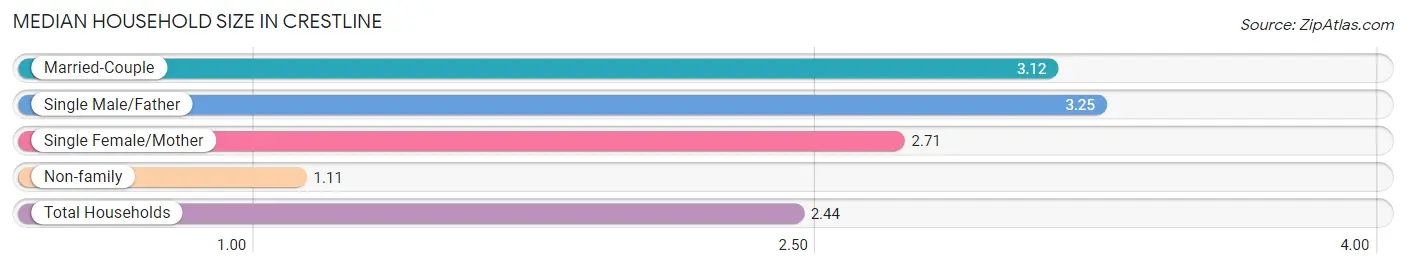
Median Household Size in Crestline
The median household size in Crestline is 2.44 persons per household, with single male/father households (20 | 1.1%) accounting for the largest median household size of 3.25 persons per household. non-family households (549 | 30.0%) represent the smallest median household size with 1.11 persons per household.
| Household Type | # Households | Household Size |
| Married-Couple | 910 (49.8%) | 3.12 |
| Single Male/Father | 20 (1.1%) | 3.25 |
| Single Female/Mother | 349 (19.1%) | 2.71 |
| Non-family | 549 (30.0%) | 1.11 |
| Total Households | 1,828 (100.0%) | 2.44 |
Household Size by Marriage Status in Crestline
Out of a total of 1,828 households in Crestline, 1,279 (70.0%) are family households, while 549 (30.0%) are nonfamily households. The most numerous type of family households are 2-person households, comprising 482, and the most common type of nonfamily households are 1-person households, comprising 487.
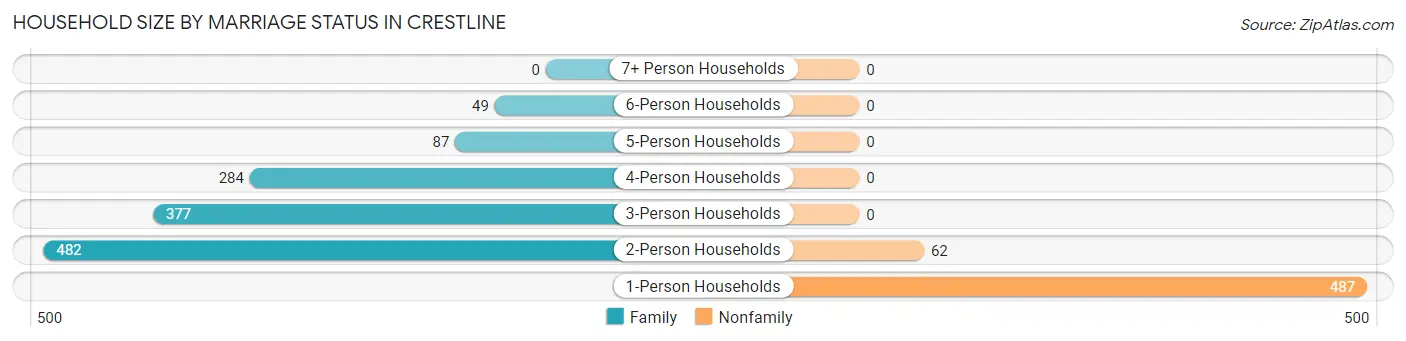
| Household Size | Family Households | Nonfamily Households |
| 1-Person Households | - | 487 (26.6%) |
| 2-Person Households | 482 (26.4%) | 62 (3.4%) |
| 3-Person Households | 377 (20.6%) | 0 (0.0%) |
| 4-Person Households | 284 (15.5%) | 0 (0.0%) |
| 5-Person Households | 87 (4.8%) | 0 (0.0%) |
| 6-Person Households | 49 (2.7%) | 0 (0.0%) |
| 7+ Person Households | 0 (0.0%) | 0 (0.0%) |
| Total | 1,279 (70.0%) | 549 (30.0%) |
Female Fertility in Crestline
Fertility by Age in Crestline
Average fertility rate in Crestline is 69.0 births per 1,000 women. Women in the age bracket of 15 to 19 years have the highest fertility rate with 157.0 births per 1,000 women. Women in the age bracket of 20 to 34 years acount for 47.9% of all women with births.
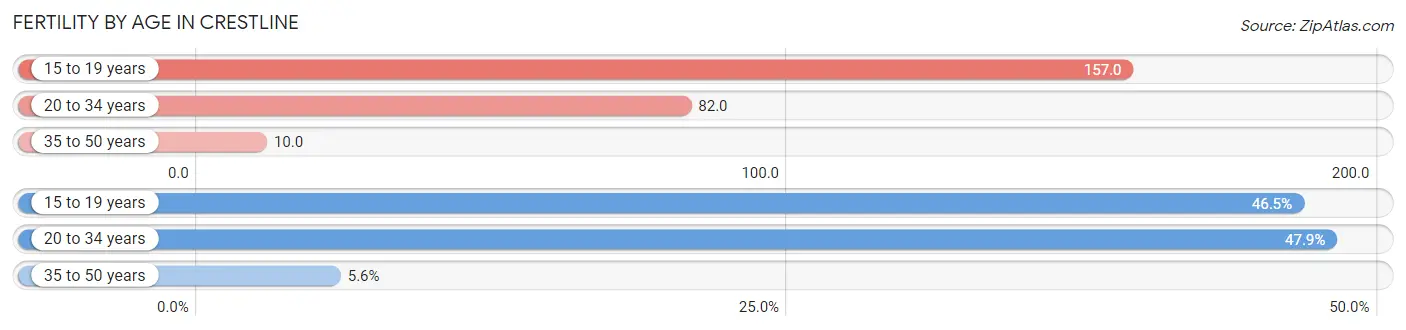
| Age Bracket | Women with Births | Births / 1,000 Women |
| 15 to 19 years | 33 (46.5%) | 157.0 |
| 20 to 34 years | 34 (47.9%) | 82.0 |
| 35 to 50 years | 4 (5.6%) | 10.0 |
| Total | 71 (100.0%) | 69.0 |
Fertility by Age by Marriage Status in Crestline
23.9% of women with births (71) in Crestline are married. The highest percentage of unmarried women with births falls into 15 to 19 years age bracket with 100.0% of them unmarried at the time of birth, while the lowest percentage of unmarried women with births belong to 35 to 50 years age bracket with 0.0% of them unmarried.
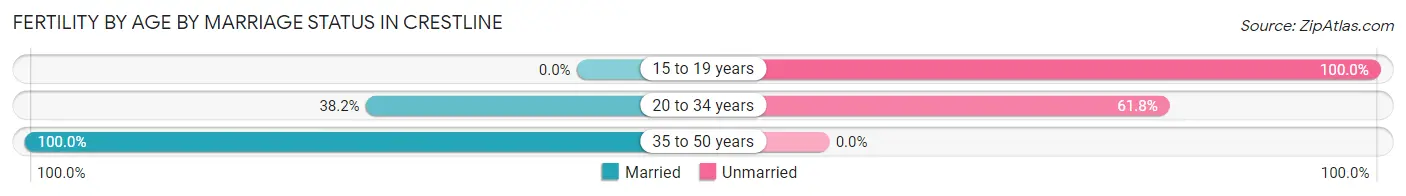
| Age Bracket | Married | Unmarried |
| 15 to 19 years | 0 (0.0%) | 33 (100.0%) |
| 20 to 34 years | 13 (38.2%) | 21 (61.8%) |
| 35 to 50 years | 4 (100.0%) | 0 (0.0%) |
| Total | 17 (23.9%) | 54 (76.1%) |
Fertility by Education in Crestline
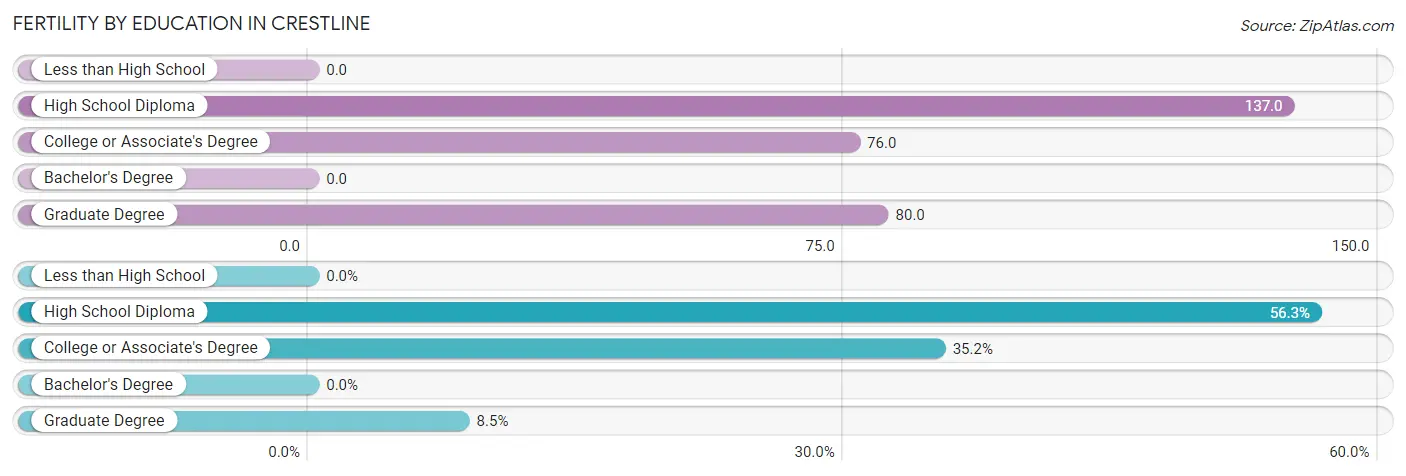
| Educational Attainment | Women with Births | Births / 1,000 Women |
| Less than High School | 0 (0.0%) | 0.0 |
| High School Diploma | 40 (56.3%) | 137.0 |
| College or Associate's Degree | 25 (35.2%) | 76.0 |
| Bachelor's Degree | 0 (0.0%) | 0.0 |
| Graduate Degree | 6 (8.5%) | 80.0 |
| Total | 71 (100.0%) | 69.0 |
Fertility by Education by Marriage Status in Crestline
76.1% of women with births in Crestline are unmarried. Women with the educational attainment of graduate degree are most likely to be married with 100.0% of them married at childbirth, while women with the educational attainment of college or associate's degree are least likely to be married with 84.0% of them unmarried at childbirth.
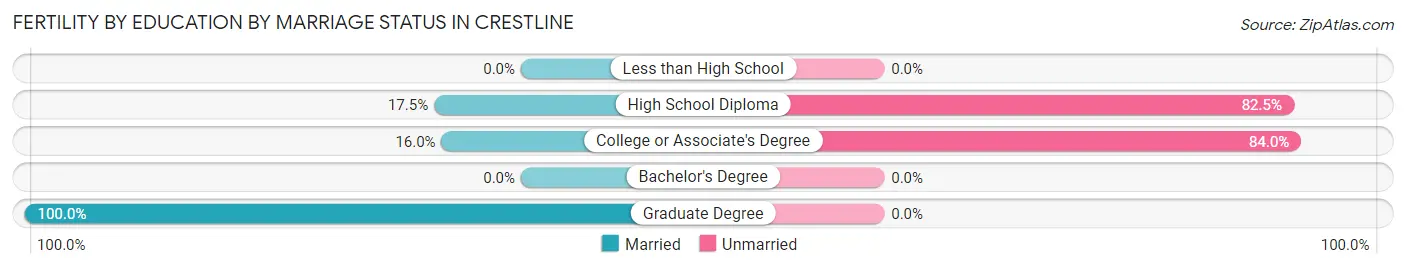
| Educational Attainment | Married | Unmarried |
| Less than High School | 0 (0.0%) | 0 (0.0%) |
| High School Diploma | 7 (17.5%) | 33 (82.5%) |
| College or Associate's Degree | 4 (16.0%) | 21 (84.0%) |
| Bachelor's Degree | 0 (0.0%) | 0 (0.0%) |
| Graduate Degree | 6 (100.0%) | 0 (0.0%) |
| Total | 17 (23.9%) | 54 (76.1%) |
Employment Characteristics in Crestline
Employment by Class of Employer in Crestline
Among the 2,056 employed individuals in Crestline, private company employees (1,385 | 67.4%), not-for-profit organizations (250 | 12.2%), and self-employed (not incorporated) (171 | 8.3%) make up the most common classes of employment.
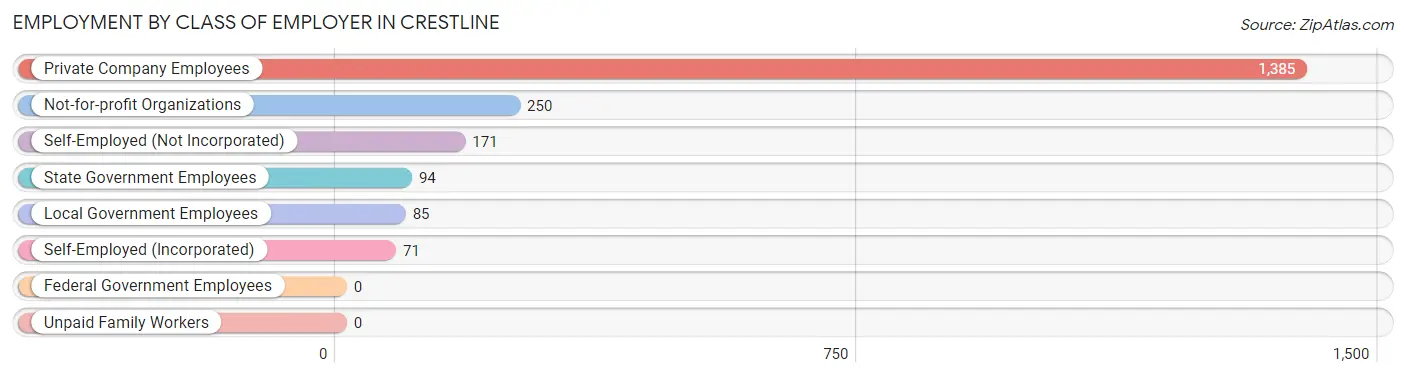
| Employer Class | # Employees | % Employees |
| Private Company Employees | 1,385 | 67.4% |
| Self-Employed (Incorporated) | 71 | 3.5% |
| Self-Employed (Not Incorporated) | 171 | 8.3% |
| Not-for-profit Organizations | 250 | 12.2% |
| Local Government Employees | 85 | 4.1% |
| State Government Employees | 94 | 4.6% |
| Federal Government Employees | 0 | 0.0% |
| Unpaid Family Workers | 0 | 0.0% |
| Total | 2,056 | 100.0% |
Employment Status by Age in Crestline
According to the labor force statistics for Crestline, out of the total population over 16 years of age (3,522), 63.6% or 2,240 individuals are in the labor force, with 5.5% or 123 of them unemployed. The age group with the highest labor force participation rate is 30 to 34 years, with 89.2% or 166 individuals in the labor force. Within the labor force, the 35 to 44 years age range has the highest percentage of unemployed individuals, with 8.6% or 32 of them being unemployed.
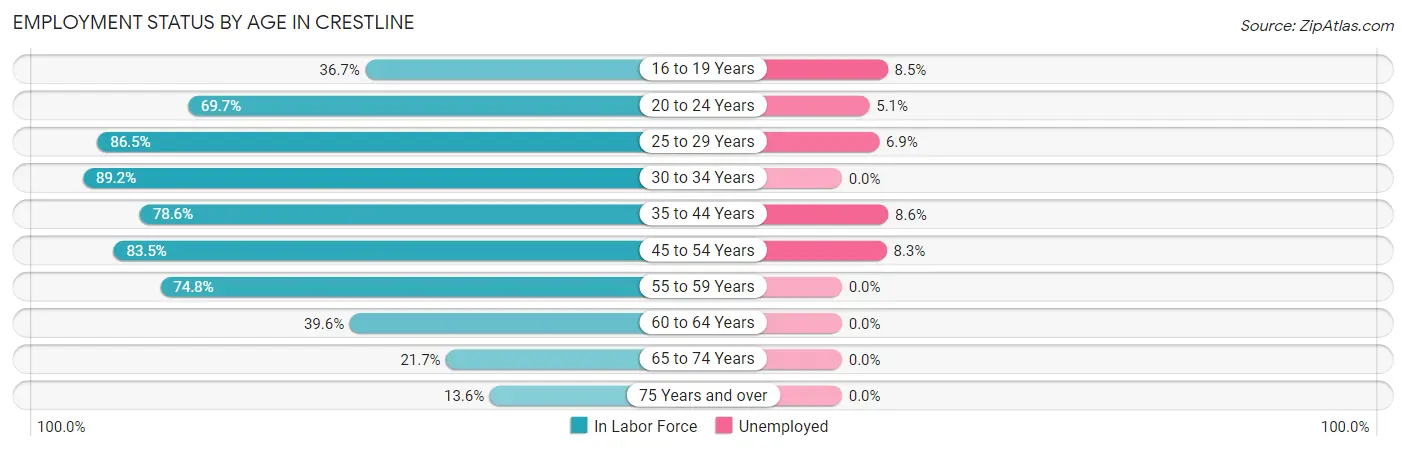
| Age Bracket | In Labor Force | Unemployed |
| 16 to 19 Years | 94 (36.7%) | 8 (8.5%) |
| 20 to 24 Years | 198 (69.7%) | 10 (5.1%) |
| 25 to 29 Years | 218 (86.5%) | 15 (6.9%) |
| 30 to 34 Years | 166 (89.2%) | 0 (0.0%) |
| 35 to 44 Years | 370 (78.6%) | 32 (8.6%) |
| 45 to 54 Years | 712 (83.5%) | 59 (8.3%) |
| 55 to 59 Years | 288 (74.8%) | 0 (0.0%) |
| 60 to 64 Years | 74 (39.6%) | 0 (0.0%) |
| 65 to 74 Years | 85 (21.7%) | 0 (0.0%) |
| 75 Years and over | 35 (13.6%) | 0 (0.0%) |
| Total | 2,240 (63.6%) | 123 (5.5%) |
Employment Status by Educational Attainment in Crestline
According to labor force statistics for Crestline, 78.3% of individuals (1,828) out of the total population between 25 and 64 years of age (2,334) are in the labor force, with 5.8% or 106 of them being unemployed. The group with the highest labor force participation rate are those with the educational attainment of bachelor's degree or higher, with 91.2% or 354 individuals in the labor force. Within the labor force, individuals with college / associate degree education have the highest percentage of unemployment, with 7.9% or 55 of them being unemployed.
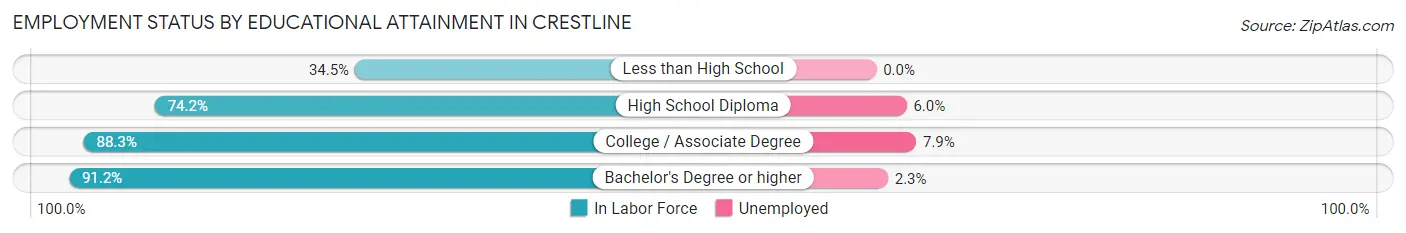
| Educational Attainment | In Labor Force | Unemployed |
| Less than High School | 70 (34.5%) | 0 (0.0%) |
| High School Diploma | 711 (74.2%) | 57 (6.0%) |
| College / Associate Degree | 693 (88.3%) | 62 (7.9%) |
| Bachelor's Degree or higher | 354 (91.2%) | 9 (2.3%) |
| Total | 1,828 (78.3%) | 135 (5.8%) |
Employment Occupations by Sex in Crestline
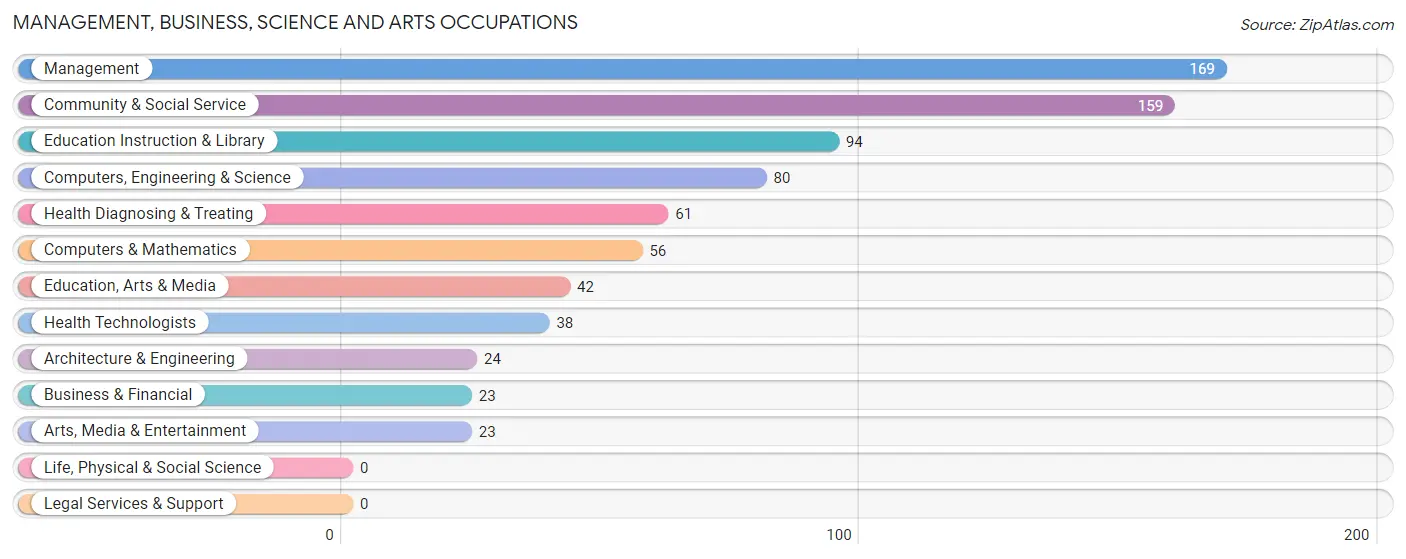
Management, Business, Science and Arts Occupations
The most common Management, Business, Science and Arts occupations in Crestline are Management (169 | 8.0%), Community & Social Service (159 | 7.5%), Education Instruction & Library (94 | 4.4%), Computers, Engineering & Science (80 | 3.8%), and Health Diagnosing & Treating (61 | 2.9%).
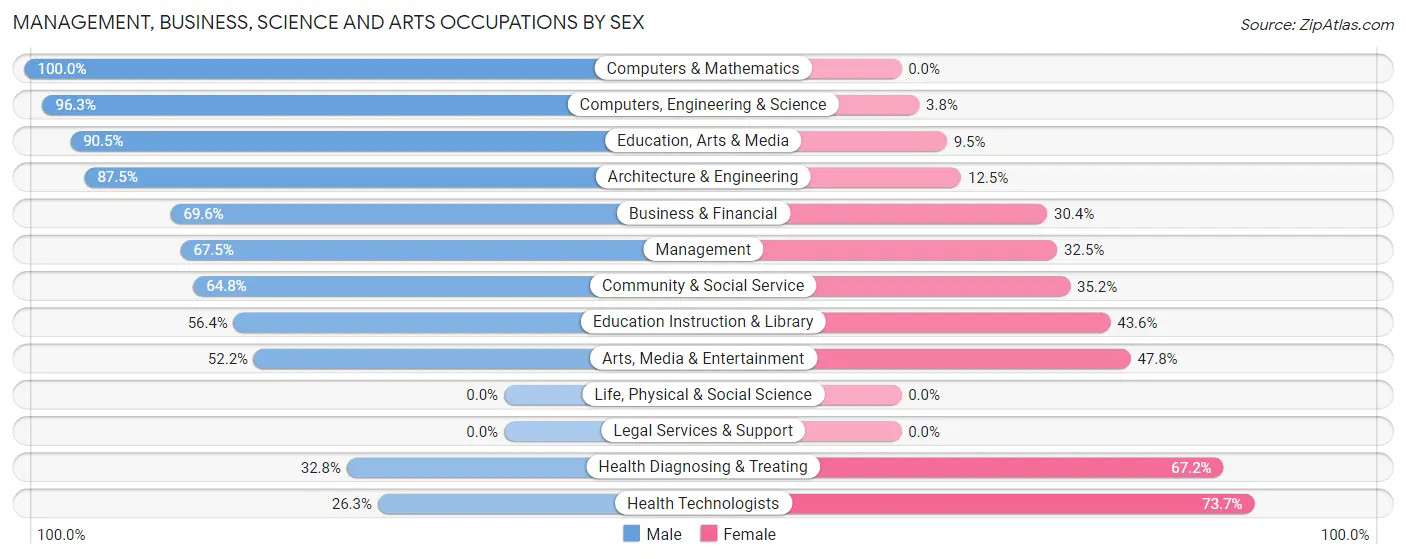
Management, Business, Science and Arts Occupations by Sex
Within the Management, Business, Science and Arts occupations in Crestline, the most male-oriented occupations are Computers & Mathematics (100.0%), Computers, Engineering & Science (96.3%), and Education, Arts & Media (90.5%), while the most female-oriented occupations are Health Technologists (73.7%), Health Diagnosing & Treating (67.2%), and Arts, Media & Entertainment (47.8%).
| Occupation | Male | Female |
| Management | 114 (67.5%) | 55 (32.5%) |
| Business & Financial | 16 (69.6%) | 7 (30.4%) |
| Computers, Engineering & Science | 77 (96.3%) | 3 (3.7%) |
| Computers & Mathematics | 56 (100.0%) | 0 (0.0%) |
| Architecture & Engineering | 21 (87.5%) | 3 (12.5%) |
| Life, Physical & Social Science | 0 (0.0%) | 0 (0.0%) |
| Community & Social Service | 103 (64.8%) | 56 (35.2%) |
| Education, Arts & Media | 38 (90.5%) | 4 (9.5%) |
| Legal Services & Support | 0 (0.0%) | 0 (0.0%) |
| Education Instruction & Library | 53 (56.4%) | 41 (43.6%) |
| Arts, Media & Entertainment | 12 (52.2%) | 11 (47.8%) |
| Health Diagnosing & Treating | 20 (32.8%) | 41 (67.2%) |
| Health Technologists | 10 (26.3%) | 28 (73.7%) |
| Total (Category) | 330 (67.1%) | 162 (32.9%) |
| Total (Overall) | 1,061 (50.1%) | 1,055 (49.9%) |
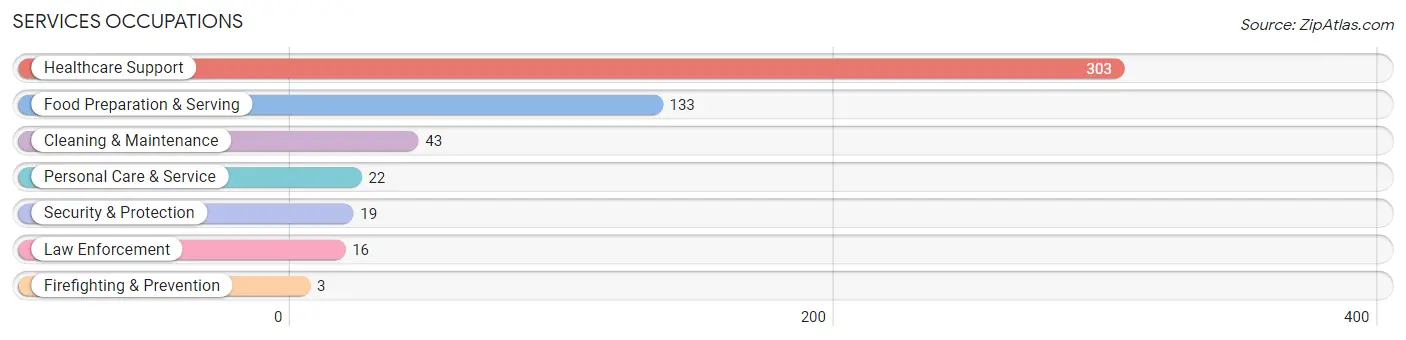
Services Occupations
The most common Services occupations in Crestline are Healthcare Support (303 | 14.3%), Food Preparation & Serving (133 | 6.3%), Cleaning & Maintenance (43 | 2.0%), Personal Care & Service (22 | 1.0%), and Security & Protection (19 | 0.9%).
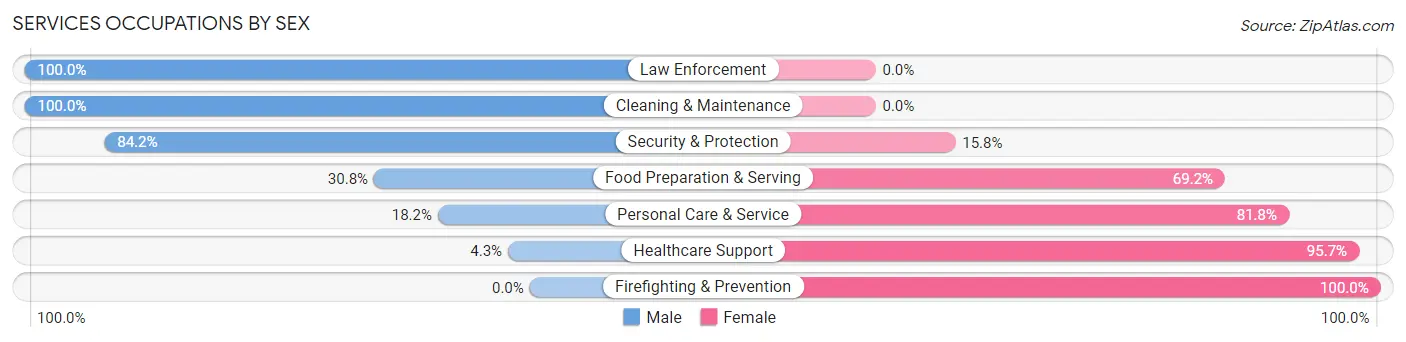
Services Occupations by Sex
Within the Services occupations in Crestline, the most male-oriented occupations are Law Enforcement (100.0%), Cleaning & Maintenance (100.0%), and Security & Protection (84.2%), while the most female-oriented occupations are Firefighting & Prevention (100.0%), Healthcare Support (95.7%), and Personal Care & Service (81.8%).
| Occupation | Male | Female |
| Healthcare Support | 13 (4.3%) | 290 (95.7%) |
| Security & Protection | 16 (84.2%) | 3 (15.8%) |
| Firefighting & Prevention | 0 (0.0%) | 3 (100.0%) |
| Law Enforcement | 16 (100.0%) | 0 (0.0%) |
| Food Preparation & Serving | 41 (30.8%) | 92 (69.2%) |
| Cleaning & Maintenance | 43 (100.0%) | 0 (0.0%) |
| Personal Care & Service | 4 (18.2%) | 18 (81.8%) |
| Total (Category) | 117 (22.5%) | 403 (77.5%) |
| Total (Overall) | 1,061 (50.1%) | 1,055 (49.9%) |
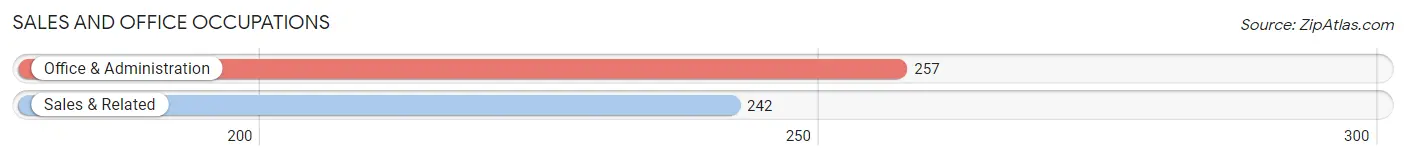
Sales and Office Occupations
The most common Sales and Office occupations in Crestline are Office & Administration (257 | 12.1%), and Sales & Related (242 | 11.4%).
Sales and Office Occupations by Sex
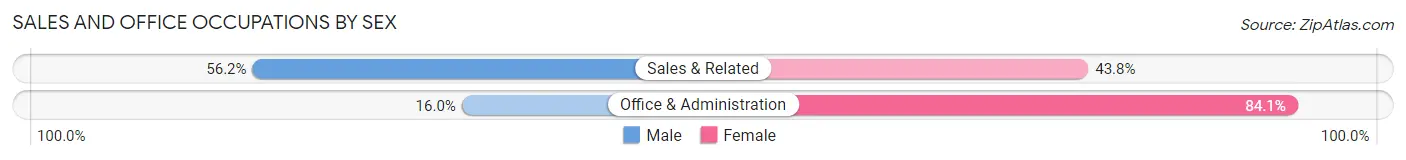
| Occupation | Male | Female |
| Sales & Related | 136 (56.2%) | 106 (43.8%) |
| Office & Administration | 41 (16.0%) | 216 (84.1%) |
| Total (Category) | 177 (35.5%) | 322 (64.5%) |
| Total (Overall) | 1,061 (50.1%) | 1,055 (49.9%) |
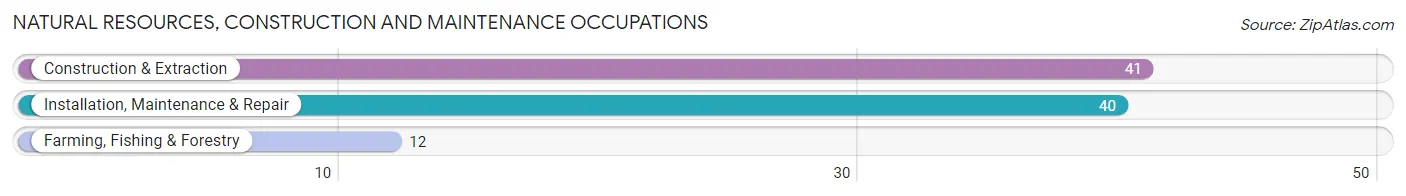
Natural Resources, Construction and Maintenance Occupations
The most common Natural Resources, Construction and Maintenance occupations in Crestline are Construction & Extraction (41 | 1.9%), Installation, Maintenance & Repair (40 | 1.9%), and Farming, Fishing & Forestry (12 | 0.6%).
Natural Resources, Construction and Maintenance Occupations by Sex
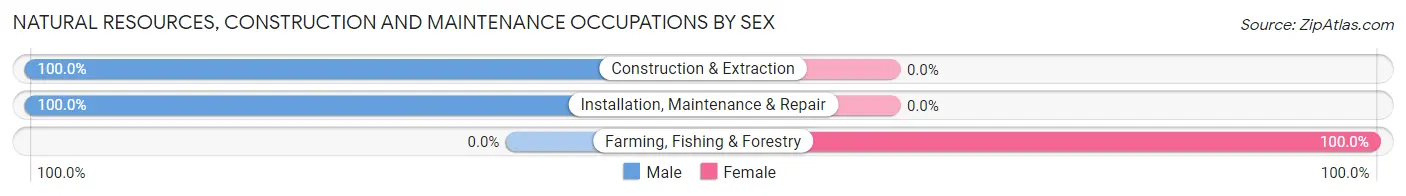
| Occupation | Male | Female |
| Farming, Fishing & Forestry | 0 (0.0%) | 12 (100.0%) |
| Construction & Extraction | 41 (100.0%) | 0 (0.0%) |
| Installation, Maintenance & Repair | 40 (100.0%) | 0 (0.0%) |
| Total (Category) | 81 (87.1%) | 12 (12.9%) |
| Total (Overall) | 1,061 (50.1%) | 1,055 (49.9%) |
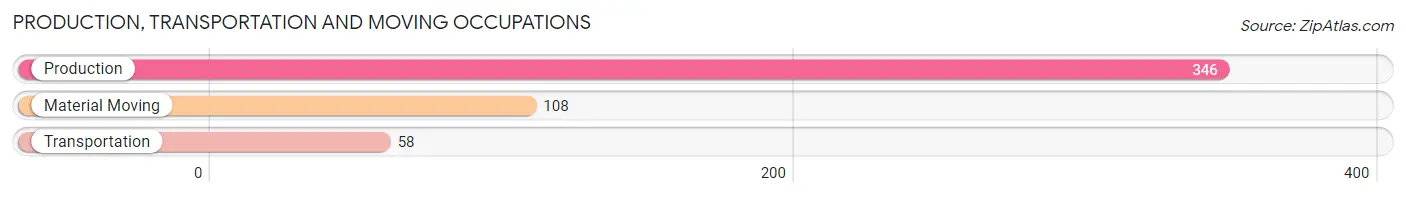
Production, Transportation and Moving Occupations
The most common Production, Transportation and Moving occupations in Crestline are Production (346 | 16.4%), Material Moving (108 | 5.1%), and Transportation (58 | 2.7%).
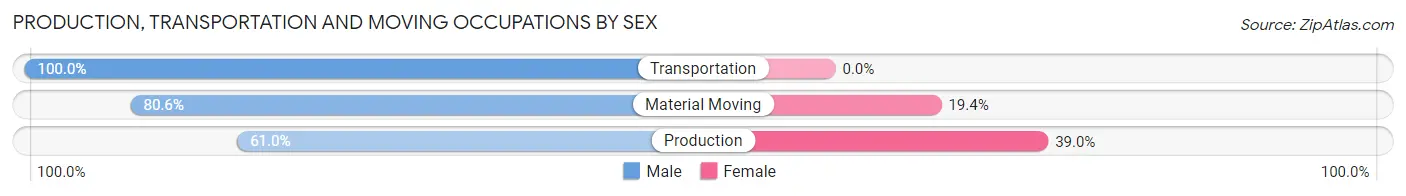
Production, Transportation and Moving Occupations by Sex
| Occupation | Male | Female |
| Production | 211 (61.0%) | 135 (39.0%) |
| Transportation | 58 (100.0%) | 0 (0.0%) |
| Material Moving | 87 (80.6%) | 21 (19.4%) |
| Total (Category) | 356 (69.5%) | 156 (30.5%) |
| Total (Overall) | 1,061 (50.1%) | 1,055 (49.9%) |
Employment Industries by Sex in Crestline
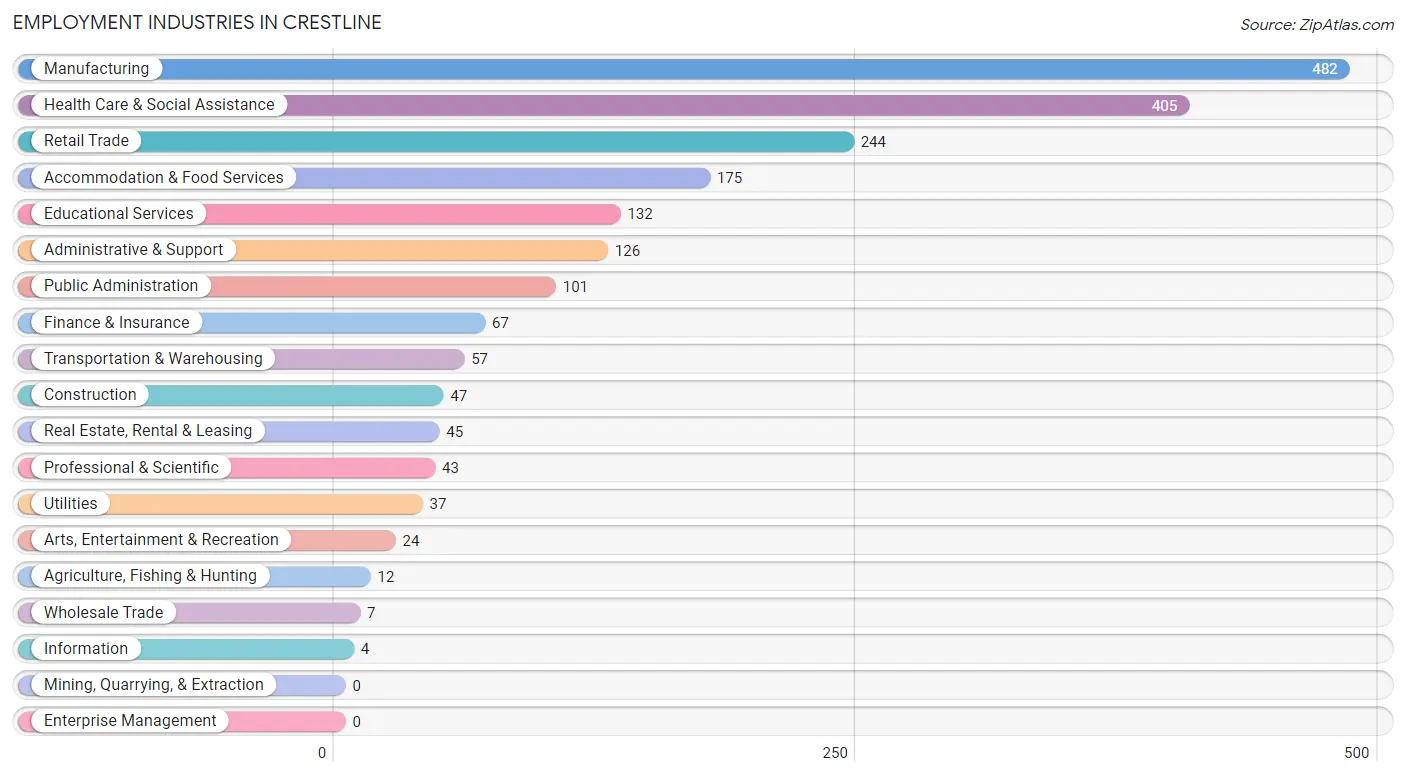
Employment Industries in Crestline
The major employment industries in Crestline include Manufacturing (482 | 22.8%), Health Care & Social Assistance (405 | 19.1%), Retail Trade (244 | 11.5%), Accommodation & Food Services (175 | 8.3%), and Educational Services (132 | 6.2%).
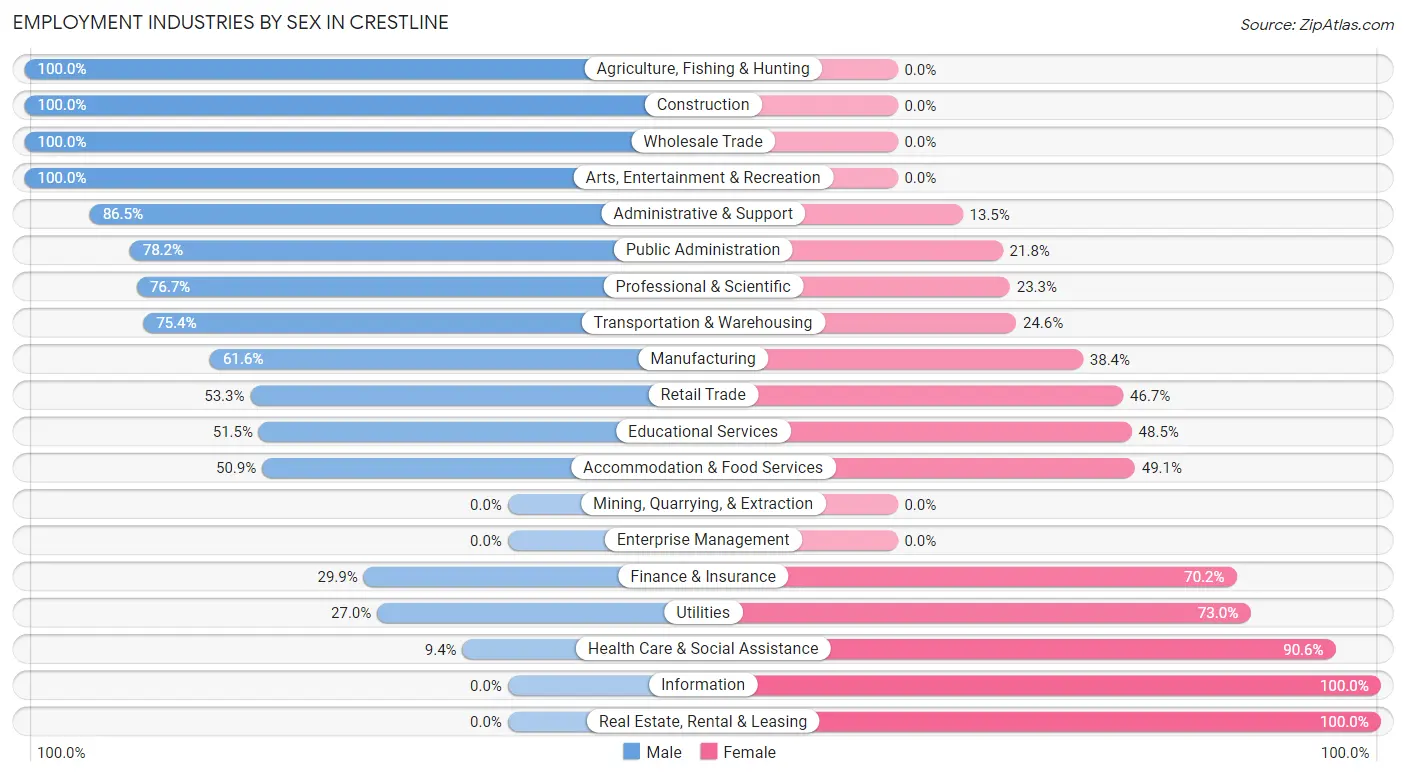
Employment Industries by Sex in Crestline
The Crestline industries that see more men than women are Agriculture, Fishing & Hunting (100.0%), Construction (100.0%), and Wholesale Trade (100.0%), whereas the industries that tend to have a higher number of women are Information (100.0%), Real Estate, Rental & Leasing (100.0%), and Health Care & Social Assistance (90.6%).
| Industry | Male | Female |
| Agriculture, Fishing & Hunting | 12 (100.0%) | 0 (0.0%) |
| Mining, Quarrying, & Extraction | 0 (0.0%) | 0 (0.0%) |
| Construction | 47 (100.0%) | 0 (0.0%) |
| Manufacturing | 297 (61.6%) | 185 (38.4%) |
| Wholesale Trade | 7 (100.0%) | 0 (0.0%) |
| Retail Trade | 130 (53.3%) | 114 (46.7%) |
| Transportation & Warehousing | 43 (75.4%) | 14 (24.6%) |
| Utilities | 10 (27.0%) | 27 (73.0%) |
| Information | 0 (0.0%) | 4 (100.0%) |
| Finance & Insurance | 20 (29.8%) | 47 (70.2%) |
| Real Estate, Rental & Leasing | 0 (0.0%) | 45 (100.0%) |
| Professional & Scientific | 33 (76.7%) | 10 (23.3%) |
| Enterprise Management | 0 (0.0%) | 0 (0.0%) |
| Administrative & Support | 109 (86.5%) | 17 (13.5%) |
| Educational Services | 68 (51.5%) | 64 (48.5%) |
| Health Care & Social Assistance | 38 (9.4%) | 367 (90.6%) |
| Arts, Entertainment & Recreation | 24 (100.0%) | 0 (0.0%) |
| Accommodation & Food Services | 89 (50.9%) | 86 (49.1%) |
| Public Administration | 79 (78.2%) | 22 (21.8%) |
| Total | 1,061 (50.1%) | 1,055 (49.9%) |
Education in Crestline
School Enrollment in Crestline
The most common levels of schooling among the 1,113 students in Crestline are high school (301 | 27.0%), elementary school (273 | 24.5%), and middle school (260 | 23.4%).
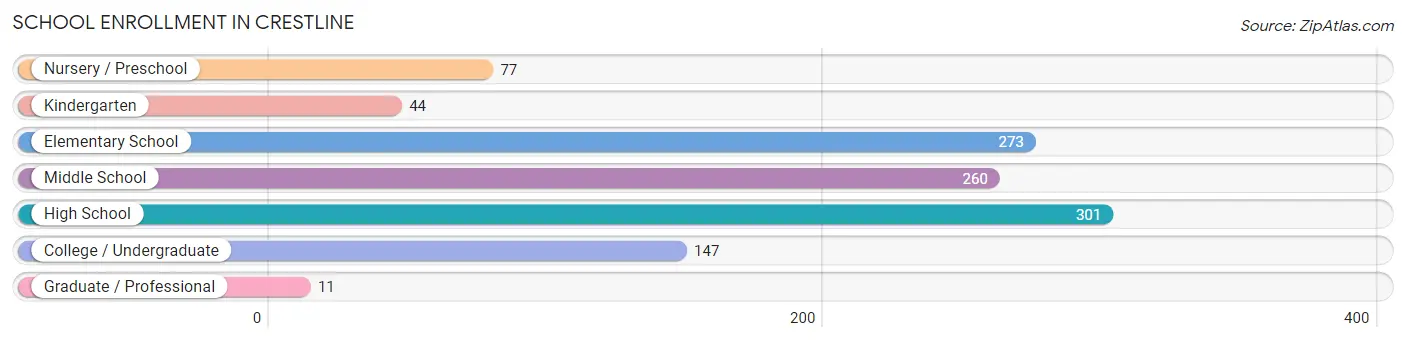
| School Level | # Students | % Students |
| Nursery / Preschool | 77 | 6.9% |
| Kindergarten | 44 | 4.0% |
| Elementary School | 273 | 24.5% |
| Middle School | 260 | 23.4% |
| High School | 301 | 27.0% |
| College / Undergraduate | 147 | 13.2% |
| Graduate / Professional | 11 | 1.0% |
| Total | 1,113 | 100.0% |
School Enrollment by Age by Funding Source in Crestline
Out of a total of 1,113 students who are enrolled in schools in Crestline, 197 (17.7%) attend a private institution, while the remaining 916 (82.3%) are enrolled in public schools. The age group of 35 years and over has the highest likelihood of being enrolled in private schools, with 12 (48.0% in the age bracket) enrolled. Conversely, the age group of 15 to 17 year olds has the lowest likelihood of being enrolled in a private school, with 206 (97.6% in the age bracket) attending a public institution.
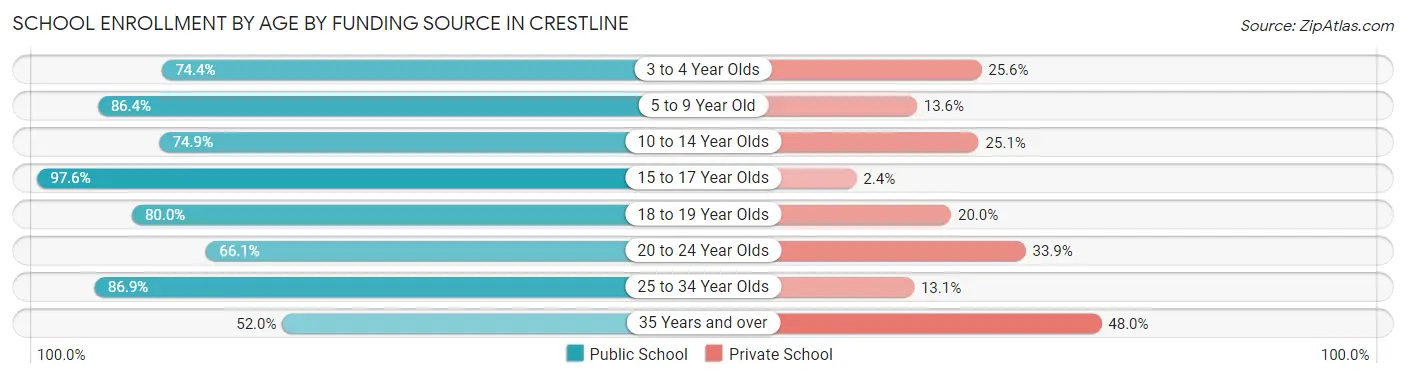
| Age Bracket | Public School | Private School |
| 3 to 4 Year Olds | 29 (74.4%) | 10 (25.6%) |
| 5 to 9 Year Old | 260 (86.4%) | 41 (13.6%) |
| 10 to 14 Year Olds | 274 (74.9%) | 92 (25.1%) |
| 15 to 17 Year Olds | 206 (97.6%) | 5 (2.4%) |
| 18 to 19 Year Olds | 20 (80.0%) | 5 (20.0%) |
| 20 to 24 Year Olds | 41 (66.1%) | 21 (33.9%) |
| 25 to 34 Year Olds | 73 (86.9%) | 11 (13.1%) |
| 35 Years and over | 13 (52.0%) | 12 (48.0%) |
| Total | 916 (82.3%) | 197 (17.7%) |
Educational Attainment by Field of Study in Crestline
Business (141 | 25.3%), literature & languages (105 | 18.8%), education (84 | 15.0%), bio, nature & agricultural (59 | 10.6%), and science & technology (55 | 9.9%) are the most common fields of study among 558 individuals in Crestline who have obtained a bachelor's degree or higher.
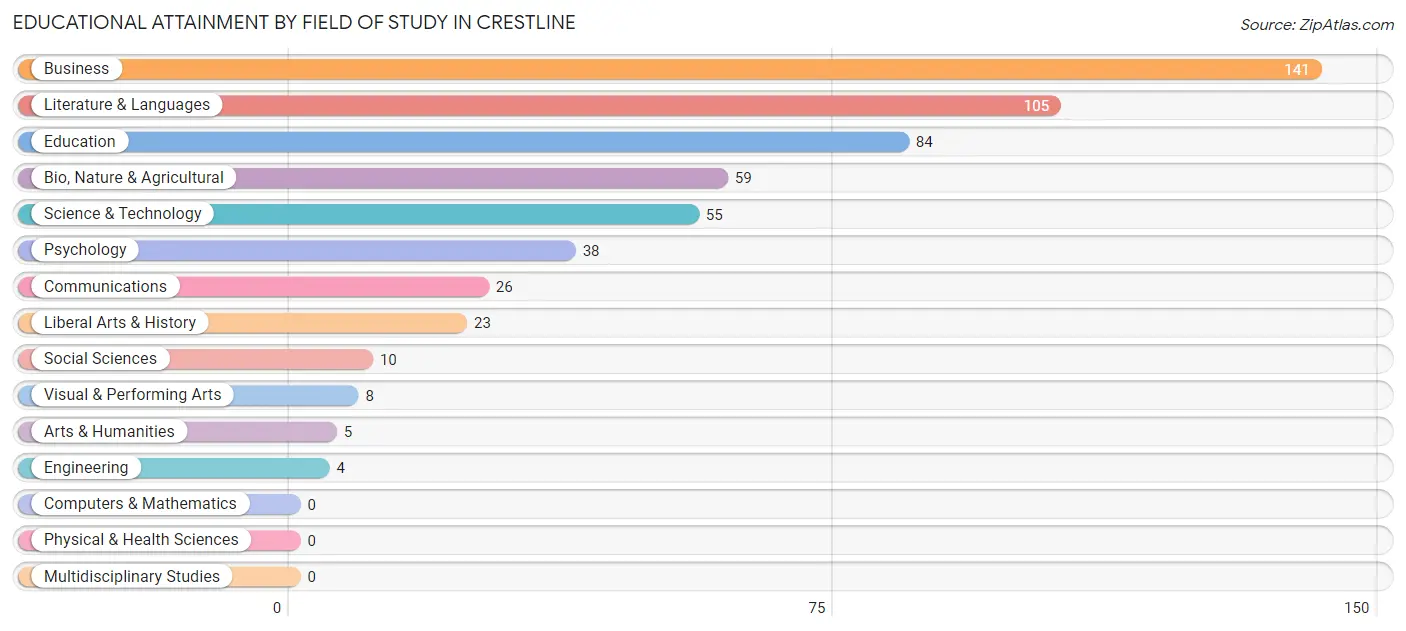
| Field of Study | # Graduates | % Graduates |
| Computers & Mathematics | 0 | 0.0% |
| Bio, Nature & Agricultural | 59 | 10.6% |
| Physical & Health Sciences | 0 | 0.0% |
| Psychology | 38 | 6.8% |
| Social Sciences | 10 | 1.8% |
| Engineering | 4 | 0.7% |
| Multidisciplinary Studies | 0 | 0.0% |
| Science & Technology | 55 | 9.9% |
| Business | 141 | 25.3% |
| Education | 84 | 15.0% |
| Literature & Languages | 105 | 18.8% |
| Liberal Arts & History | 23 | 4.1% |
| Visual & Performing Arts | 8 | 1.4% |
| Communications | 26 | 4.7% |
| Arts & Humanities | 5 | 0.9% |
| Total | 558 | 100.0% |
Transportation & Commute in Crestline
Vehicle Availability by Sex in Crestline
The most prevalent vehicle ownership categories in Crestline are males with 2 vehicles (463, accounting for 44.8%) and females with 2 vehicles (388, making up 45.3%).
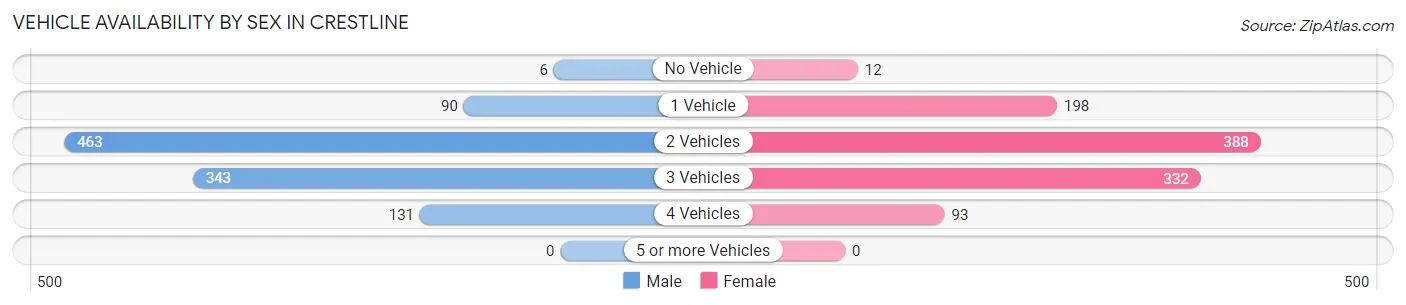
| Vehicles Available | Male | Female |
| No Vehicle | 6 (0.6%) | 12 (1.2%) |
| 1 Vehicle | 90 (8.7%) | 198 (19.4%) |
| 2 Vehicles | 463 (44.8%) | 388 (37.9%) |
| 3 Vehicles | 343 (33.2%) | 332 (32.5%) |
| 4 Vehicles | 131 (12.7%) | 93 (9.1%) |
| 5 or more Vehicles | 0 (0.0%) | 0 (0.0%) |
| Total | 1,033 (100.0%) | 1,023 (100.0%) |
Commute Time in Crestline
The most frequently occuring commute durations in Crestline are 15 to 19 minutes (488 commuters, 26.0%), 20 to 24 minutes (385 commuters, 20.5%), and 5 to 9 minutes (228 commuters, 12.1%).
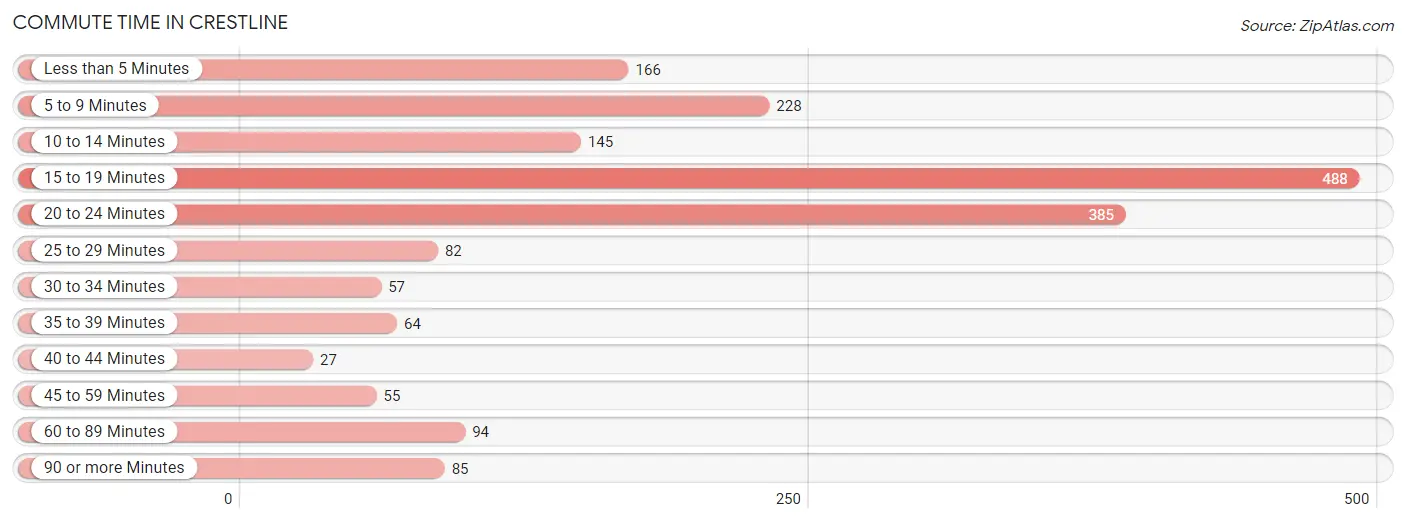
| Commute Time | # Commuters | % Commuters |
| Less than 5 Minutes | 166 | 8.8% |
| 5 to 9 Minutes | 228 | 12.1% |
| 10 to 14 Minutes | 145 | 7.7% |
| 15 to 19 Minutes | 488 | 26.0% |
| 20 to 24 Minutes | 385 | 20.5% |
| 25 to 29 Minutes | 82 | 4.4% |
| 30 to 34 Minutes | 57 | 3.0% |
| 35 to 39 Minutes | 64 | 3.4% |
| 40 to 44 Minutes | 27 | 1.4% |
| 45 to 59 Minutes | 55 | 2.9% |
| 60 to 89 Minutes | 94 | 5.0% |
| 90 or more Minutes | 85 | 4.5% |
Commute Time by Sex in Crestline
The most common commute times in Crestline are 15 to 19 minutes (282 commuters, 28.7%) for males and 15 to 19 minutes (206 commuters, 23.1%) for females.
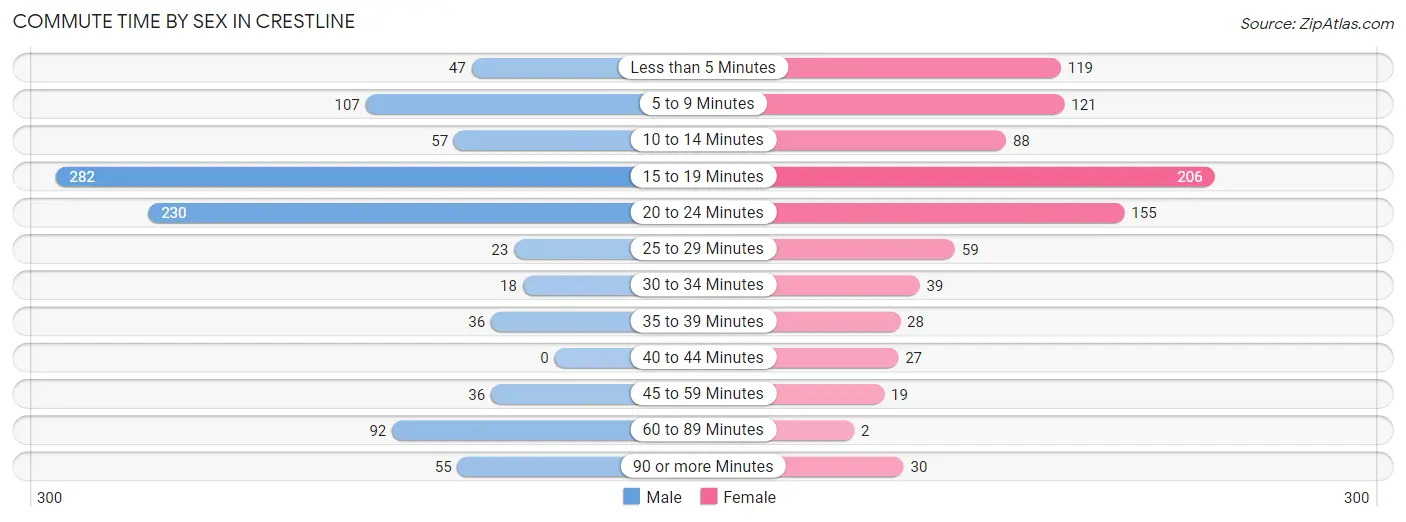
| Commute Time | Male | Female |
| Less than 5 Minutes | 47 (4.8%) | 119 (13.3%) |
| 5 to 9 Minutes | 107 (10.9%) | 121 (13.6%) |
| 10 to 14 Minutes | 57 (5.8%) | 88 (9.9%) |
| 15 to 19 Minutes | 282 (28.7%) | 206 (23.1%) |
| 20 to 24 Minutes | 230 (23.4%) | 155 (17.4%) |
| 25 to 29 Minutes | 23 (2.3%) | 59 (6.6%) |
| 30 to 34 Minutes | 18 (1.8%) | 39 (4.4%) |
| 35 to 39 Minutes | 36 (3.7%) | 28 (3.1%) |
| 40 to 44 Minutes | 0 (0.0%) | 27 (3.0%) |
| 45 to 59 Minutes | 36 (3.7%) | 19 (2.1%) |
| 60 to 89 Minutes | 92 (9.4%) | 2 (0.2%) |
| 90 or more Minutes | 55 (5.6%) | 30 (3.4%) |
Time of Departure to Work by Sex in Crestline
The most frequent times of departure to work in Crestline are 12:00 PM to 3:59 PM (160, 16.3%) for males and 7:30 AM to 7:59 AM (263, 29.4%) for females.
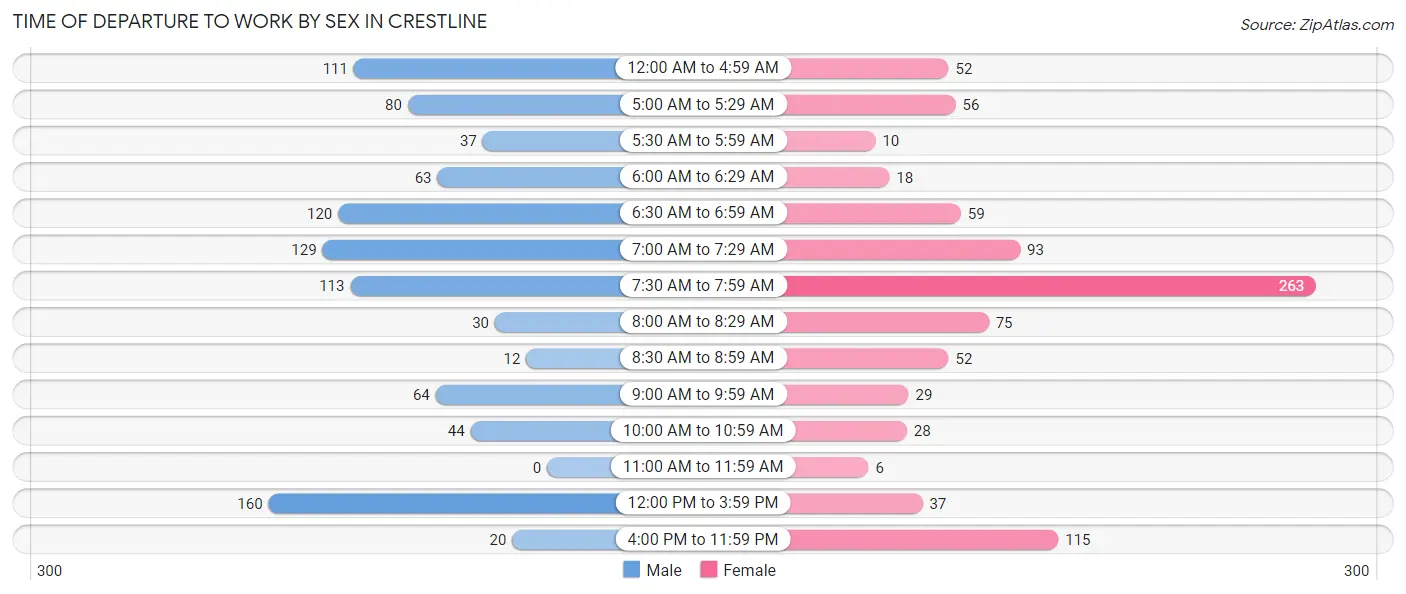
| Time of Departure | Male | Female |
| 12:00 AM to 4:59 AM | 111 (11.3%) | 52 (5.8%) |
| 5:00 AM to 5:29 AM | 80 (8.1%) | 56 (6.3%) |
| 5:30 AM to 5:59 AM | 37 (3.8%) | 10 (1.1%) |
| 6:00 AM to 6:29 AM | 63 (6.4%) | 18 (2.0%) |
| 6:30 AM to 6:59 AM | 120 (12.2%) | 59 (6.6%) |
| 7:00 AM to 7:29 AM | 129 (13.1%) | 93 (10.4%) |
| 7:30 AM to 7:59 AM | 113 (11.5%) | 263 (29.4%) |
| 8:00 AM to 8:29 AM | 30 (3.0%) | 75 (8.4%) |
| 8:30 AM to 8:59 AM | 12 (1.2%) | 52 (5.8%) |
| 9:00 AM to 9:59 AM | 64 (6.5%) | 29 (3.3%) |
| 10:00 AM to 10:59 AM | 44 (4.5%) | 28 (3.1%) |
| 11:00 AM to 11:59 AM | 0 (0.0%) | 6 (0.7%) |
| 12:00 PM to 3:59 PM | 160 (16.3%) | 37 (4.1%) |
| 4:00 PM to 11:59 PM | 20 (2.0%) | 115 (12.9%) |
| Total | 983 (100.0%) | 893 (100.0%) |
Housing Occupancy in Crestline
Occupancy by Ownership in Crestline
Of the total 1,828 dwellings in Crestline, owner-occupied units account for 1,209 (66.1%), while renter-occupied units make up 619 (33.9%).
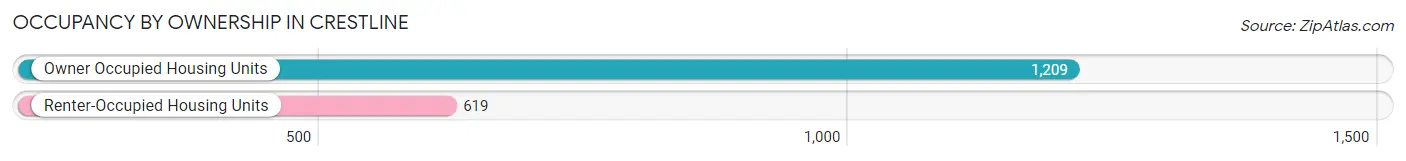
| Occupancy | # Housing Units | % Housing Units |
| Owner Occupied Housing Units | 1,209 | 66.1% |
| Renter-Occupied Housing Units | 619 | 33.9% |
| Total Occupied Housing Units | 1,828 | 100.0% |
Occupancy by Household Size in Crestline
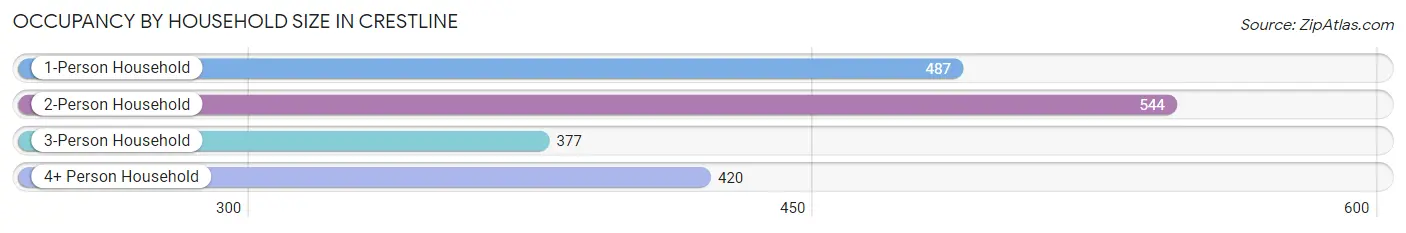
| Household Size | # Housing Units | % Housing Units |
| 1-Person Household | 487 | 26.6% |
| 2-Person Household | 544 | 29.8% |
| 3-Person Household | 377 | 20.6% |
| 4+ Person Household | 420 | 23.0% |
| Total Housing Units | 1,828 | 100.0% |
Occupancy by Ownership by Household Size in Crestline
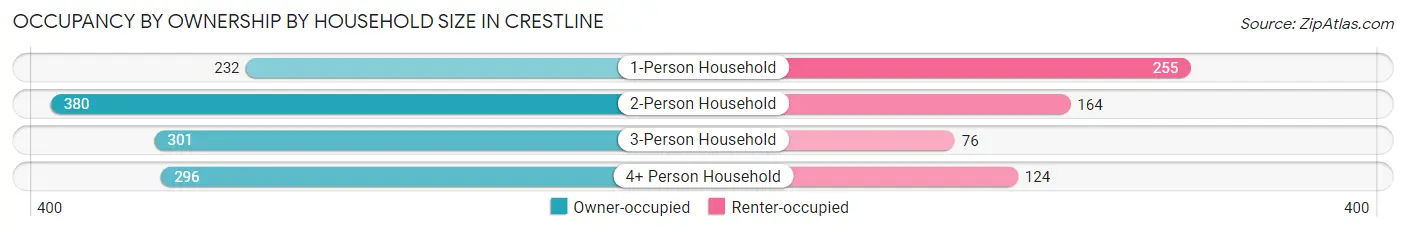
| Household Size | Owner-occupied | Renter-occupied |
| 1-Person Household | 232 (47.6%) | 255 (52.4%) |
| 2-Person Household | 380 (69.9%) | 164 (30.1%) |
| 3-Person Household | 301 (79.8%) | 76 (20.2%) |
| 4+ Person Household | 296 (70.5%) | 124 (29.5%) |
| Total Housing Units | 1,209 (66.1%) | 619 (33.9%) |
Occupancy by Educational Attainment in Crestline
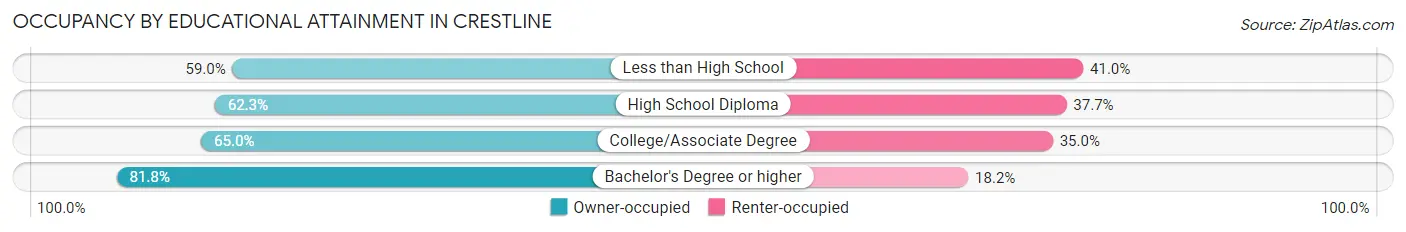
| Household Size | Owner-occupied | Renter-occupied |
| Less than High School | 69 (59.0%) | 48 (41.0%) |
| High School Diploma | 497 (62.3%) | 301 (37.7%) |
| College/Associate Degree | 401 (65.0%) | 216 (35.0%) |
| Bachelor's Degree or higher | 242 (81.8%) | 54 (18.2%) |
Occupancy by Age of Householder in Crestline
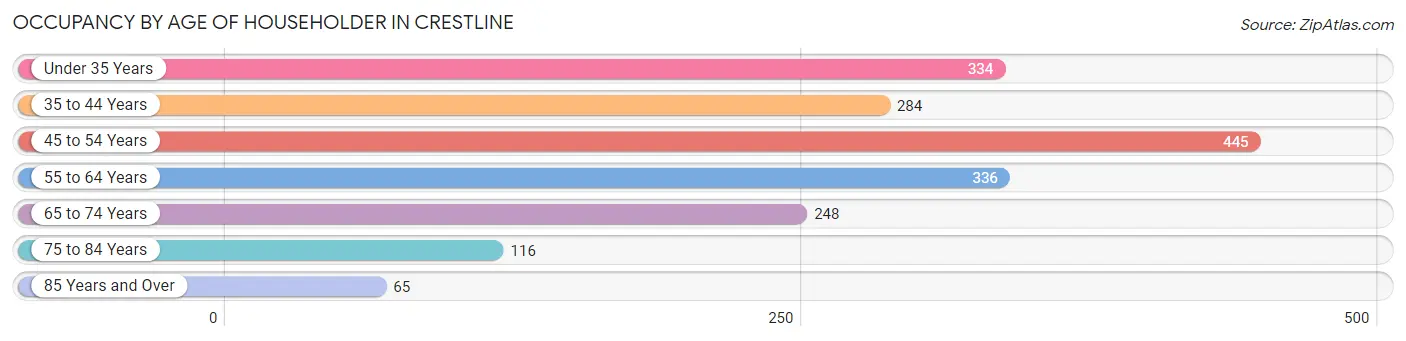
| Age Bracket | # Households | % Households |
| Under 35 Years | 334 | 18.3% |
| 35 to 44 Years | 284 | 15.5% |
| 45 to 54 Years | 445 | 24.3% |
| 55 to 64 Years | 336 | 18.4% |
| 65 to 74 Years | 248 | 13.6% |
| 75 to 84 Years | 116 | 6.4% |
| 85 Years and Over | 65 | 3.6% |
| Total | 1,828 | 100.0% |
Housing Finances in Crestline
Median Income by Occupancy in Crestline
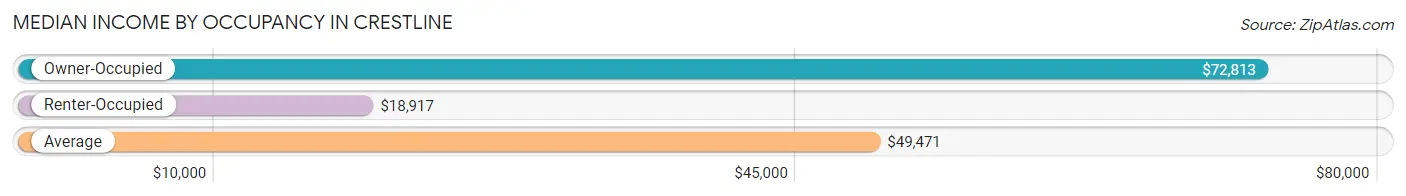
| Occupancy Type | # Households | Median Income |
| Owner-Occupied | 1,209 (66.1%) | $72,813 |
| Renter-Occupied | 619 (33.9%) | $18,917 |
| Average | 1,828 (100.0%) | $49,471 |
Occupancy by Householder Income Bracket in Crestline
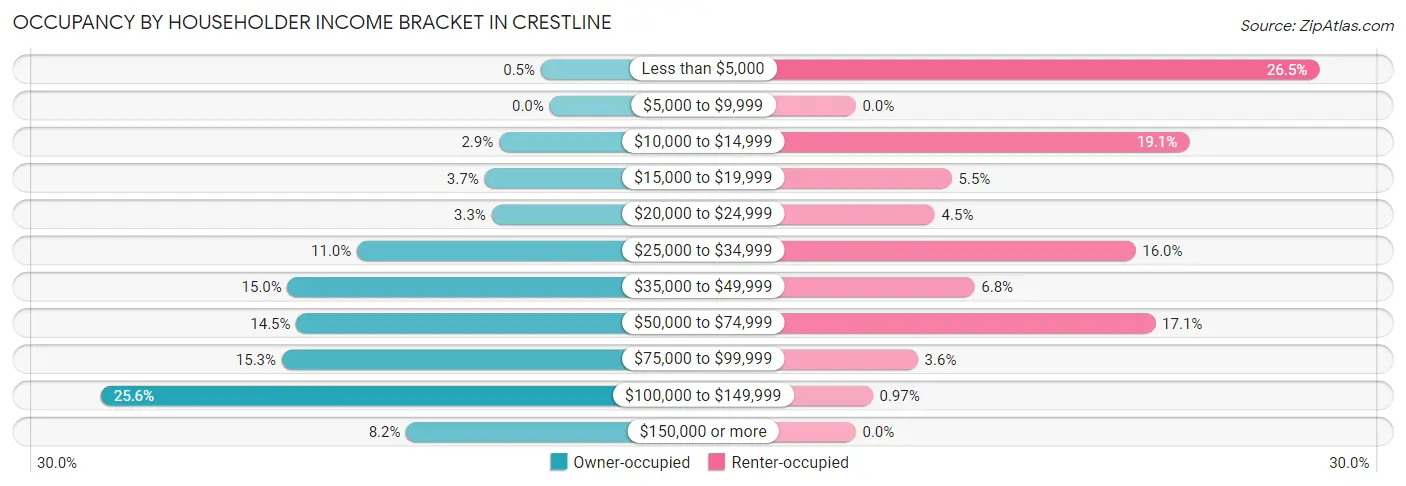
| Income Bracket | Owner-occupied | Renter-occupied |
| Less than $5,000 | 6 (0.5%) | 164 (26.5%) |
| $5,000 to $9,999 | 0 (0.0%) | 0 (0.0%) |
| $10,000 to $14,999 | 35 (2.9%) | 118 (19.1%) |
| $15,000 to $19,999 | 45 (3.7%) | 34 (5.5%) |
| $20,000 to $24,999 | 40 (3.3%) | 28 (4.5%) |
| $25,000 to $34,999 | 133 (11.0%) | 99 (16.0%) |
| $35,000 to $49,999 | 181 (15.0%) | 42 (6.8%) |
| $50,000 to $74,999 | 175 (14.5%) | 106 (17.1%) |
| $75,000 to $99,999 | 185 (15.3%) | 22 (3.5%) |
| $100,000 to $149,999 | 310 (25.6%) | 6 (1.0%) |
| $150,000 or more | 99 (8.2%) | 0 (0.0%) |
| Total | 1,209 (100.0%) | 619 (100.0%) |
Monthly Housing Cost Tiers in Crestline
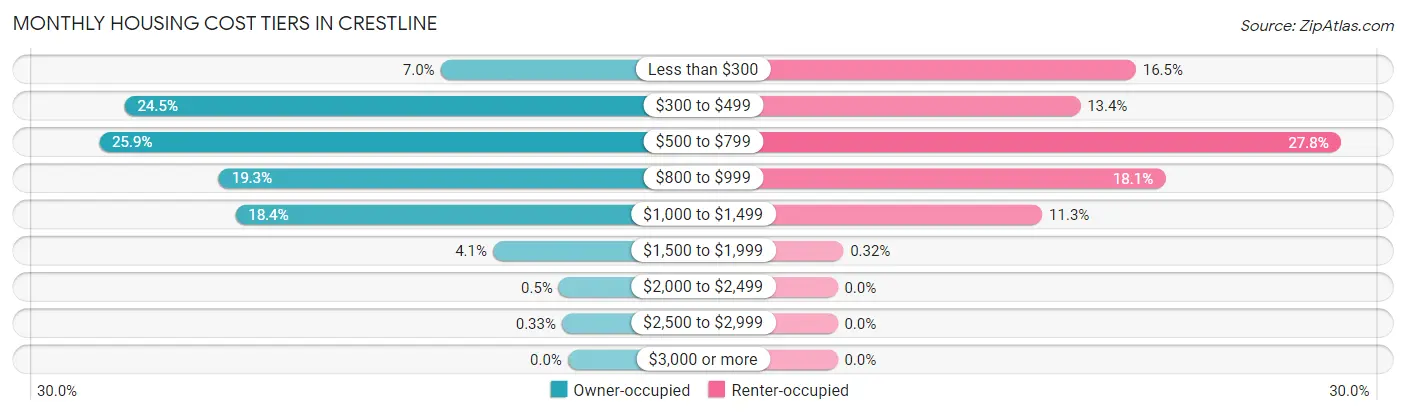
| Monthly Cost | Owner-occupied | Renter-occupied |
| Less than $300 | 85 (7.0%) | 102 (16.5%) |
| $300 to $499 | 296 (24.5%) | 83 (13.4%) |
| $500 to $799 | 313 (25.9%) | 172 (27.8%) |
| $800 to $999 | 233 (19.3%) | 112 (18.1%) |
| $1,000 to $1,499 | 222 (18.4%) | 70 (11.3%) |
| $1,500 to $1,999 | 50 (4.1%) | 2 (0.3%) |
| $2,000 to $2,499 | 6 (0.5%) | 0 (0.0%) |
| $2,500 to $2,999 | 4 (0.3%) | 0 (0.0%) |
| $3,000 or more | 0 (0.0%) | 0 (0.0%) |
| Total | 1,209 (100.0%) | 619 (100.0%) |
Physical Housing Characteristics in Crestline
Housing Structures in Crestline
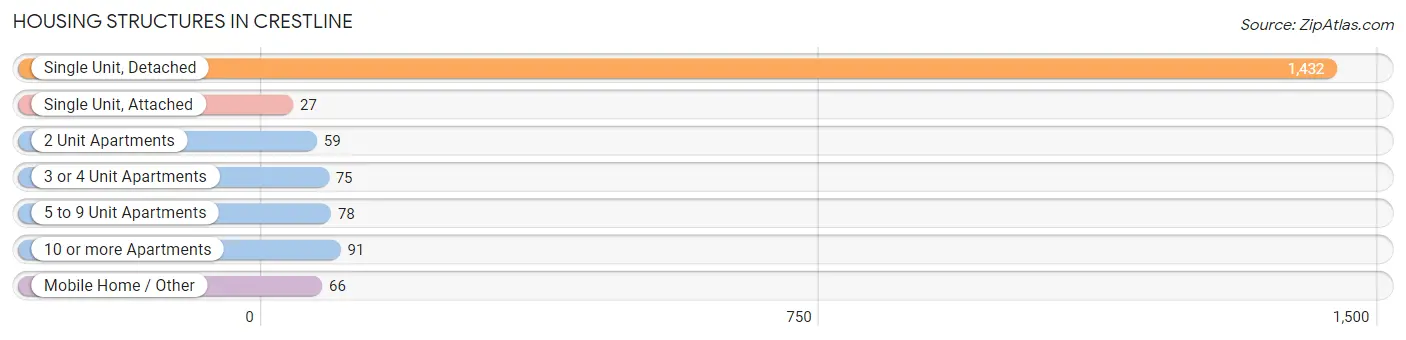
| Structure Type | # Housing Units | % Housing Units |
| Single Unit, Detached | 1,432 | 78.3% |
| Single Unit, Attached | 27 | 1.5% |
| 2 Unit Apartments | 59 | 3.2% |
| 3 or 4 Unit Apartments | 75 | 4.1% |
| 5 to 9 Unit Apartments | 78 | 4.3% |
| 10 or more Apartments | 91 | 5.0% |
| Mobile Home / Other | 66 | 3.6% |
| Total | 1,828 | 100.0% |
Housing Structures by Occupancy in Crestline
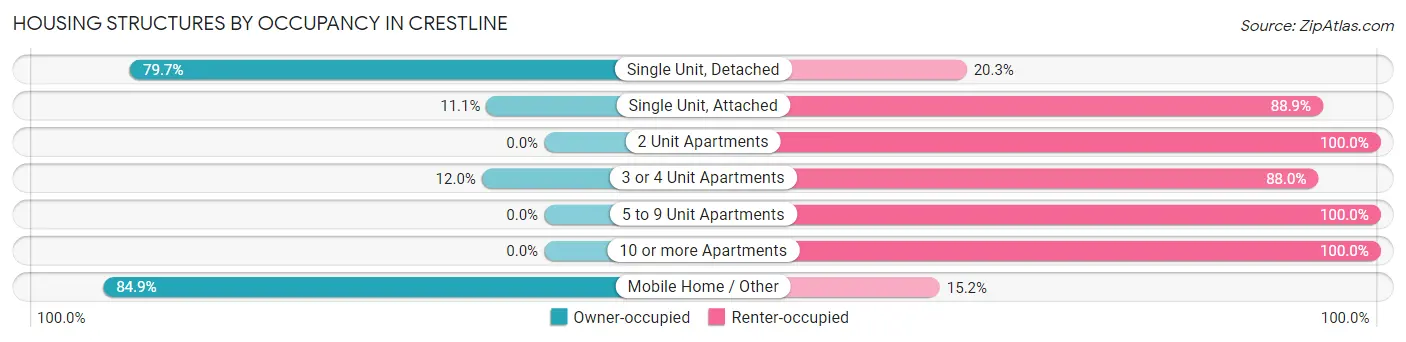
| Structure Type | Owner-occupied | Renter-occupied |
| Single Unit, Detached | 1,141 (79.7%) | 291 (20.3%) |
| Single Unit, Attached | 3 (11.1%) | 24 (88.9%) |
| 2 Unit Apartments | 0 (0.0%) | 59 (100.0%) |
| 3 or 4 Unit Apartments | 9 (12.0%) | 66 (88.0%) |
| 5 to 9 Unit Apartments | 0 (0.0%) | 78 (100.0%) |
| 10 or more Apartments | 0 (0.0%) | 91 (100.0%) |
| Mobile Home / Other | 56 (84.9%) | 10 (15.1%) |
| Total | 1,209 (66.1%) | 619 (33.9%) |
Housing Structures by Number of Rooms in Crestline
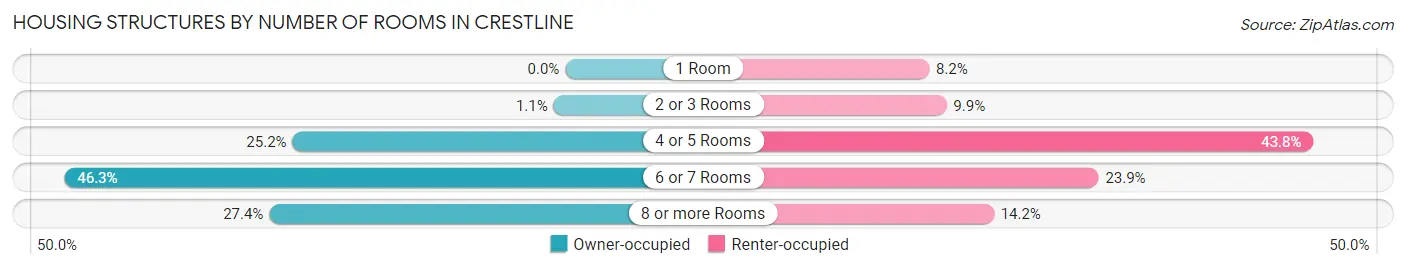
| Number of Rooms | Owner-occupied | Renter-occupied |
| 1 Room | 0 (0.0%) | 51 (8.2%) |
| 2 or 3 Rooms | 13 (1.1%) | 61 (9.9%) |
| 4 or 5 Rooms | 305 (25.2%) | 271 (43.8%) |
| 6 or 7 Rooms | 560 (46.3%) | 148 (23.9%) |
| 8 or more Rooms | 331 (27.4%) | 88 (14.2%) |
| Total | 1,209 (100.0%) | 619 (100.0%) |
Housing Structure by Heating Type in Crestline
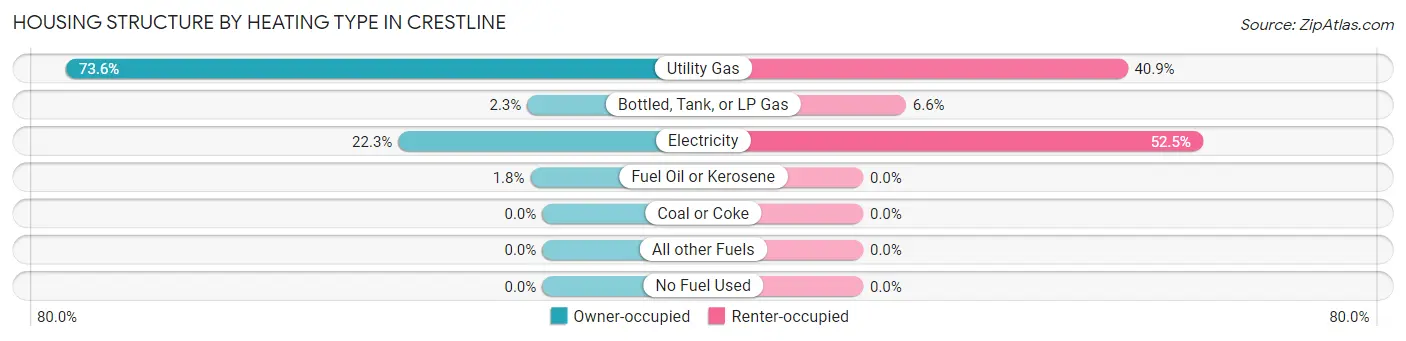
| Heating Type | Owner-occupied | Renter-occupied |
| Utility Gas | 890 (73.6%) | 253 (40.9%) |
| Bottled, Tank, or LP Gas | 28 (2.3%) | 41 (6.6%) |
| Electricity | 269 (22.3%) | 325 (52.5%) |
| Fuel Oil or Kerosene | 22 (1.8%) | 0 (0.0%) |
| Coal or Coke | 0 (0.0%) | 0 (0.0%) |
| All other Fuels | 0 (0.0%) | 0 (0.0%) |
| No Fuel Used | 0 (0.0%) | 0 (0.0%) |
| Total | 1,209 (100.0%) | 619 (100.0%) |
Household Vehicle Usage in Crestline
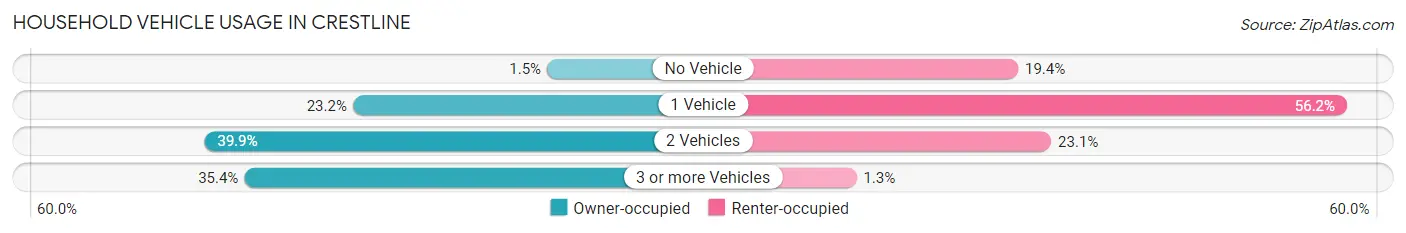
| Vehicles per Household | Owner-occupied | Renter-occupied |
| No Vehicle | 18 (1.5%) | 120 (19.4%) |
| 1 Vehicle | 281 (23.2%) | 348 (56.2%) |
| 2 Vehicles | 482 (39.9%) | 143 (23.1%) |
| 3 or more Vehicles | 428 (35.4%) | 8 (1.3%) |
| Total | 1,209 (100.0%) | 619 (100.0%) |
Real Estate & Mortgages in Crestline
Real Estate and Mortgage Overview in Crestline
| Characteristic | Without Mortgage | With Mortgage |
| Housing Units | 540 | 669 |
| Median Property Value | $89,800 | $94,200 |
| Median Household Income | $52,500 | $73 |
| Monthly Housing Costs | $437 | $0 |
| Real Estate Taxes | $1,234 | $0 |
Property Value by Mortgage Status in Crestline
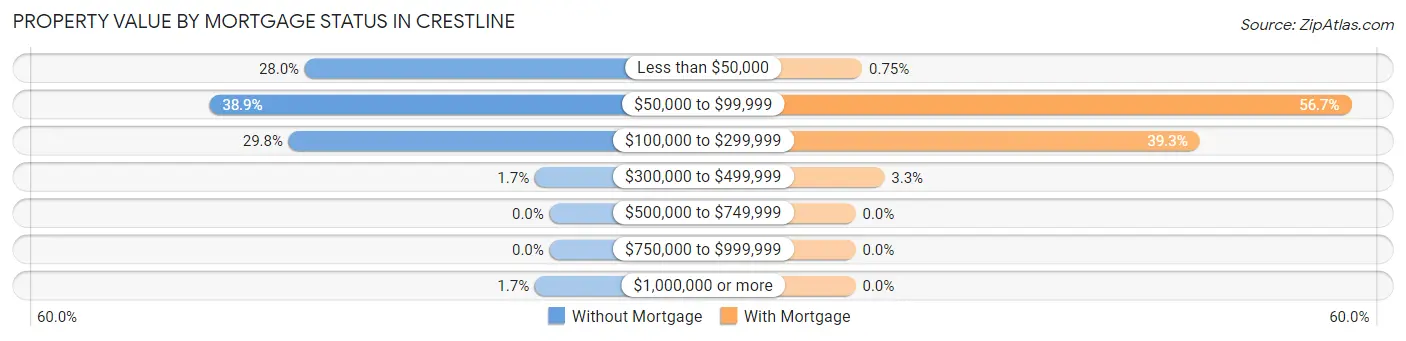
| Property Value | Without Mortgage | With Mortgage |
| Less than $50,000 | 151 (28.0%) | 5 (0.7%) |
| $50,000 to $99,999 | 210 (38.9%) | 379 (56.7%) |
| $100,000 to $299,999 | 161 (29.8%) | 263 (39.3%) |
| $300,000 to $499,999 | 9 (1.7%) | 22 (3.3%) |
| $500,000 to $749,999 | 0 (0.0%) | 0 (0.0%) |
| $750,000 to $999,999 | 0 (0.0%) | 0 (0.0%) |
| $1,000,000 or more | 9 (1.7%) | 0 (0.0%) |
| Total | 540 (100.0%) | 669 (100.0%) |
Household Income by Mortgage Status in Crestline
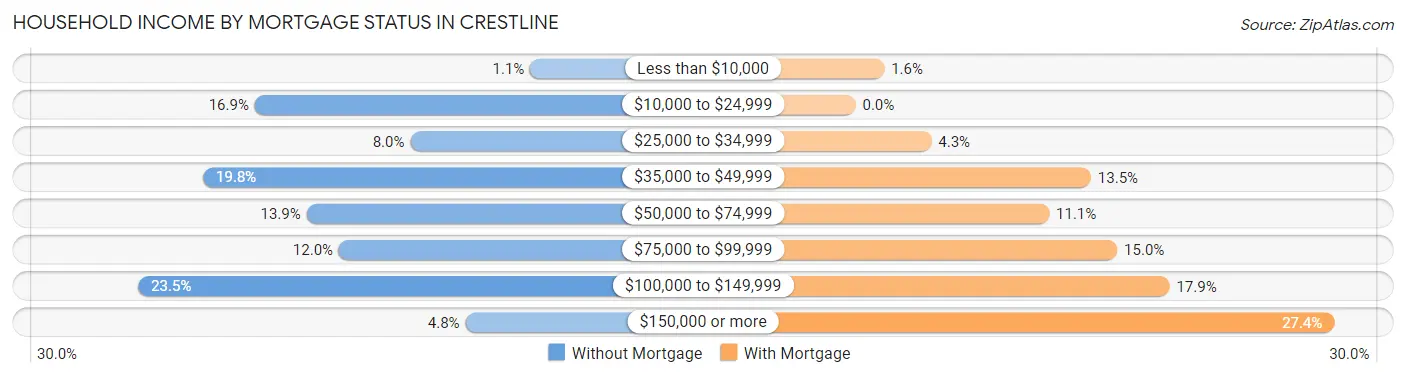
| Household Income | Without Mortgage | With Mortgage |
| Less than $10,000 | 6 (1.1%) | 11 (1.6%) |
| $10,000 to $24,999 | 91 (16.9%) | 0 (0.0%) |
| $25,000 to $34,999 | 43 (8.0%) | 29 (4.3%) |
| $35,000 to $49,999 | 107 (19.8%) | 90 (13.5%) |
| $50,000 to $74,999 | 75 (13.9%) | 74 (11.1%) |
| $75,000 to $99,999 | 65 (12.0%) | 100 (14.9%) |
| $100,000 to $149,999 | 127 (23.5%) | 120 (17.9%) |
| $150,000 or more | 26 (4.8%) | 183 (27.4%) |
| Total | 540 (100.0%) | 669 (100.0%) |
Property Value to Household Income Ratio in Crestline
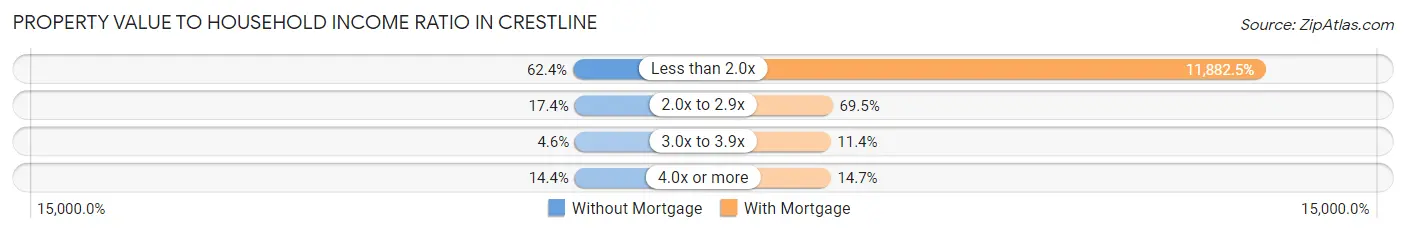
| Value-to-Income Ratio | Without Mortgage | With Mortgage |
| Less than 2.0x | 337 (62.4%) | 79,494 (11,882.5%) |
| 2.0x to 2.9x | 94 (17.4%) | 465 (69.5%) |
| 3.0x to 3.9x | 25 (4.6%) | 76 (11.4%) |
| 4.0x or more | 78 (14.4%) | 98 (14.6%) |
| Total | 540 (100.0%) | 669 (100.0%) |
Real Estate Taxes by Mortgage Status in Crestline
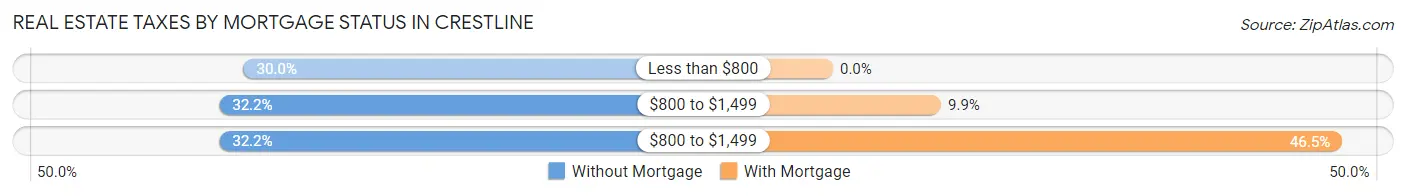
| Property Taxes | Without Mortgage | With Mortgage |
| Less than $800 | 162 (30.0%) | 0 (0.0%) |
| $800 to $1,499 | 174 (32.2%) | 66 (9.9%) |
| $800 to $1,499 | 174 (32.2%) | 311 (46.5%) |
| Total | 540 (100.0%) | 669 (100.0%) |
Health & Disability in Crestline
Health Insurance Coverage by Age in Crestline
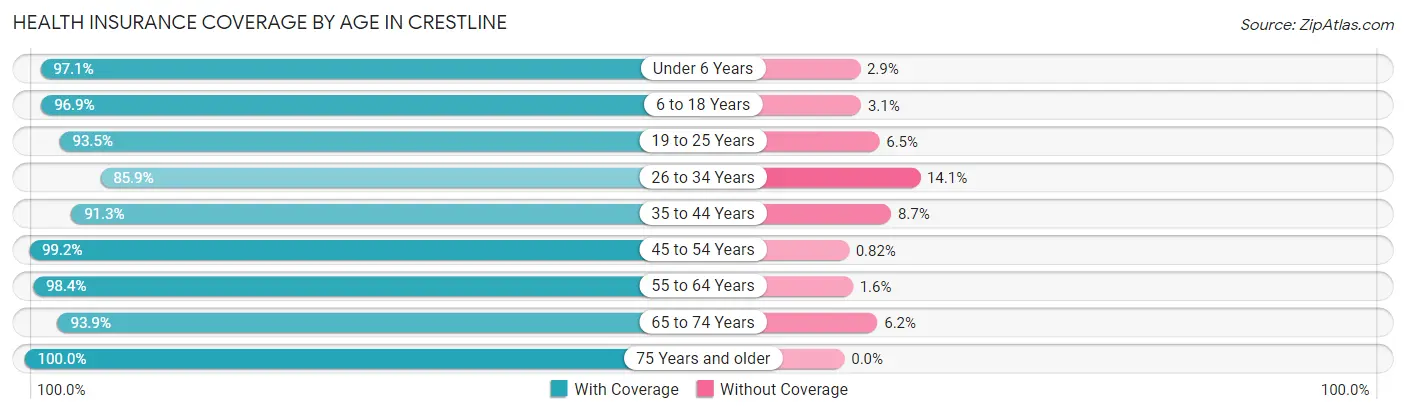
| Age Bracket | With Coverage | Without Coverage |
| Under 6 Years | 299 (97.1%) | 9 (2.9%) |
| 6 to 18 Years | 810 (96.9%) | 26 (3.1%) |
| 19 to 25 Years | 372 (93.5%) | 26 (6.5%) |
| 26 to 34 Years | 347 (85.9%) | 57 (14.1%) |
| 35 to 44 Years | 430 (91.3%) | 41 (8.7%) |
| 45 to 54 Years | 846 (99.2%) | 7 (0.8%) |
| 55 to 64 Years | 563 (98.4%) | 9 (1.6%) |
| 65 to 74 Years | 351 (93.9%) | 23 (6.1%) |
| 75 Years and older | 246 (100.0%) | 0 (0.0%) |
| Total | 4,264 (95.6%) | 198 (4.4%) |
Health Insurance Coverage by Citizenship Status in Crestline
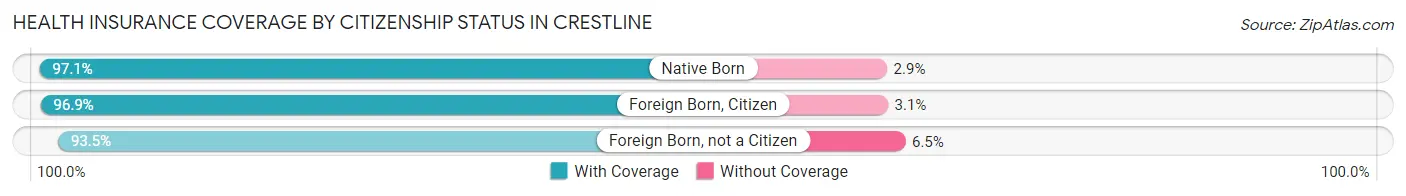
| Citizenship Status | With Coverage | Without Coverage |
| Native Born | 299 (97.1%) | 9 (2.9%) |
| Foreign Born, Citizen | 810 (96.9%) | 26 (3.1%) |
| Foreign Born, not a Citizen | 372 (93.5%) | 26 (6.5%) |
Health Insurance Coverage by Household Income in Crestline
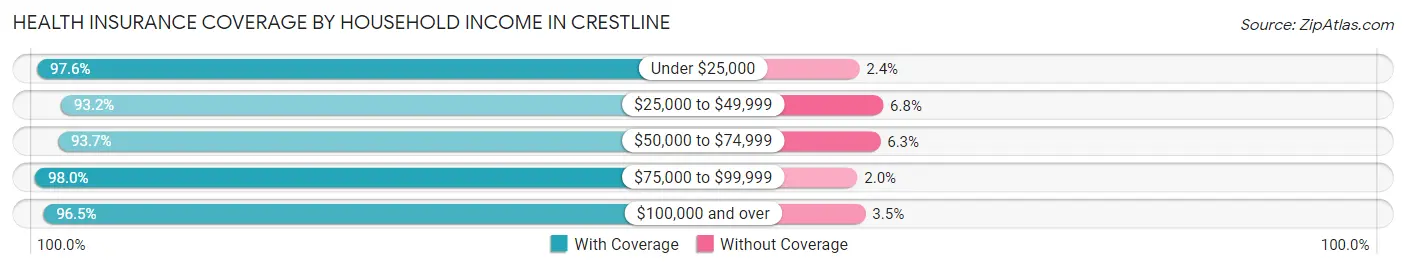
| Household Income | With Coverage | Without Coverage |
| Under $25,000 | 744 (97.6%) | 18 (2.4%) |
| $25,000 to $49,999 | 958 (93.2%) | 70 (6.8%) |
| $50,000 to $74,999 | 822 (93.7%) | 55 (6.3%) |
| $75,000 to $99,999 | 494 (98.0%) | 10 (2.0%) |
| $100,000 and over | 1,246 (96.5%) | 45 (3.5%) |
Public vs Private Health Insurance Coverage by Age in Crestline
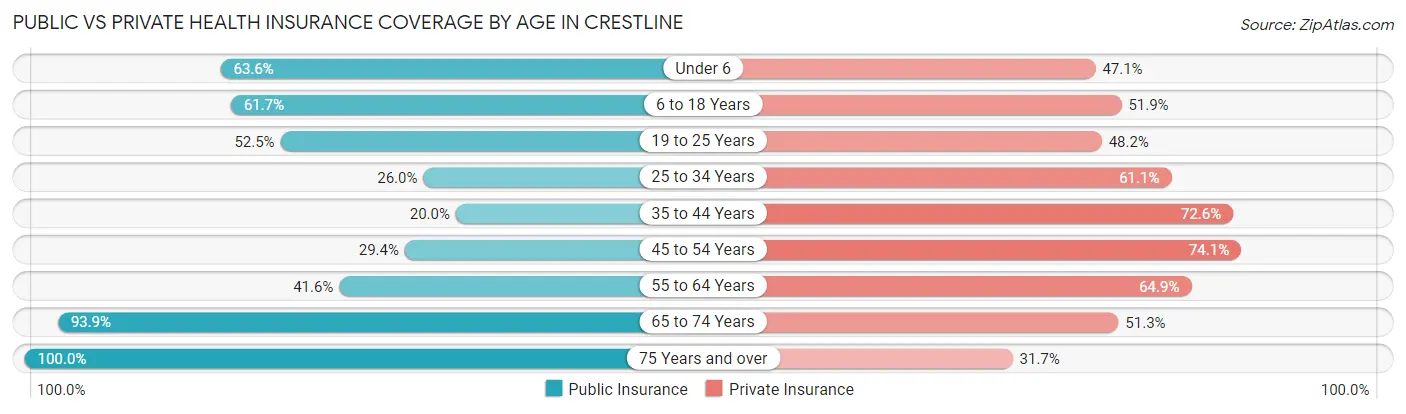
| Age Bracket | Public Insurance | Private Insurance |
| Under 6 | 196 (63.6%) | 145 (47.1%) |
| 6 to 18 Years | 516 (61.7%) | 434 (51.9%) |
| 19 to 25 Years | 209 (52.5%) | 192 (48.2%) |
| 25 to 34 Years | 105 (26.0%) | 247 (61.1%) |
| 35 to 44 Years | 94 (20.0%) | 342 (72.6%) |
| 45 to 54 Years | 251 (29.4%) | 632 (74.1%) |
| 55 to 64 Years | 238 (41.6%) | 371 (64.9%) |
| 65 to 74 Years | 351 (93.9%) | 192 (51.3%) |
| 75 Years and over | 246 (100.0%) | 78 (31.7%) |
| Total | 2,206 (49.4%) | 2,633 (59.0%) |
Disability Status by Sex by Age in Crestline
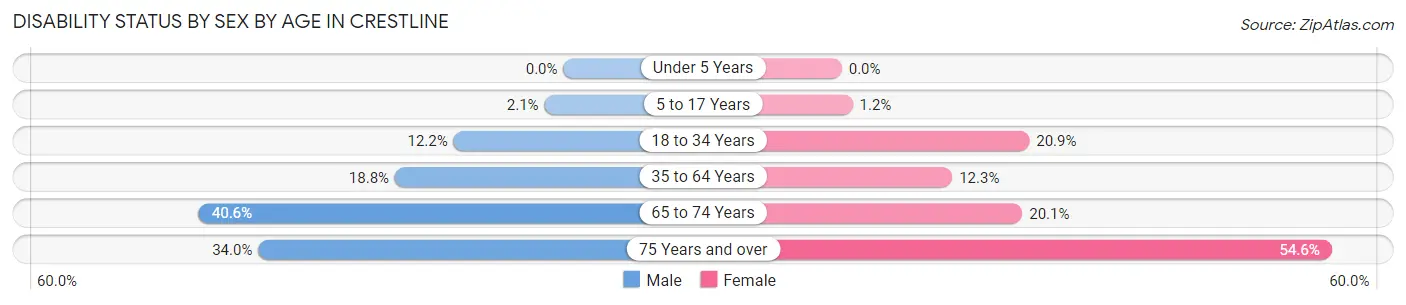
| Age Bracket | Male | Female |
| Under 5 Years | 0 (0.0%) | 0 (0.0%) |
| 5 to 17 Years | 10 (2.1%) | 5 (1.2%) |
| 18 to 34 Years | 40 (12.2%) | 104 (20.9%) |
| 35 to 64 Years | 191 (18.8%) | 108 (12.3%) |
| 65 to 74 Years | 69 (40.6%) | 41 (20.1%) |
| 75 Years and over | 35 (34.0%) | 78 (54.5%) |
Disability Class by Sex by Age in Crestline
Disability Class: Hearing Difficulty
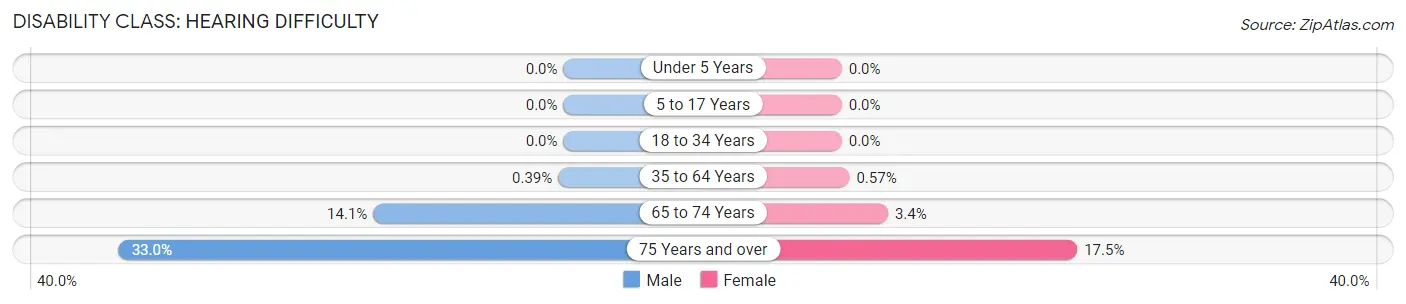
| Age Bracket | Male | Female |
| Under 5 Years | 0 (0.0%) | 0 (0.0%) |
| 5 to 17 Years | 0 (0.0%) | 0 (0.0%) |
| 18 to 34 Years | 0 (0.0%) | 0 (0.0%) |
| 35 to 64 Years | 4 (0.4%) | 5 (0.6%) |
| 65 to 74 Years | 24 (14.1%) | 7 (3.4%) |
| 75 Years and over | 34 (33.0%) | 25 (17.5%) |
Disability Class: Vision Difficulty
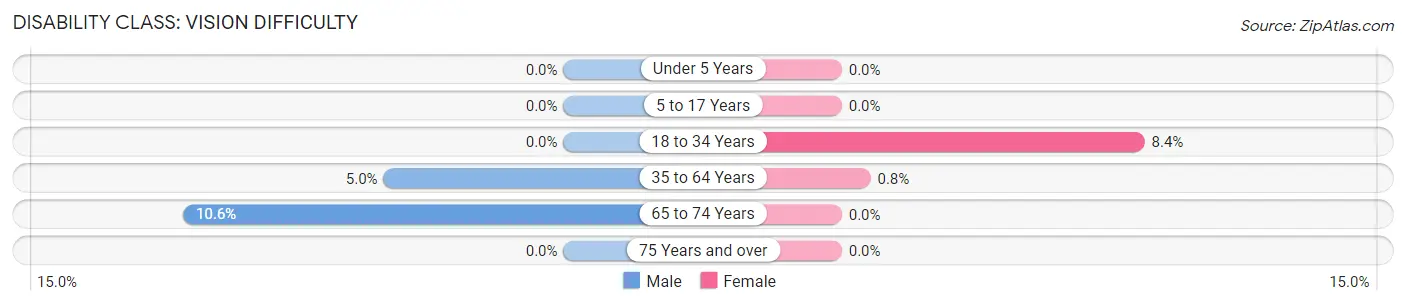
| Age Bracket | Male | Female |
| Under 5 Years | 0 (0.0%) | 0 (0.0%) |
| 5 to 17 Years | 0 (0.0%) | 0 (0.0%) |
| 18 to 34 Years | 0 (0.0%) | 42 (8.4%) |
| 35 to 64 Years | 51 (5.0%) | 7 (0.8%) |
| 65 to 74 Years | 18 (10.6%) | 0 (0.0%) |
| 75 Years and over | 0 (0.0%) | 0 (0.0%) |
Disability Class: Cognitive Difficulty
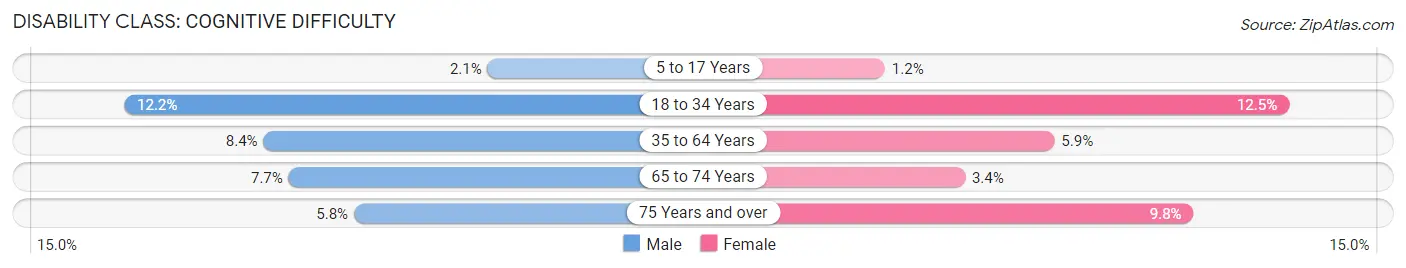
| Age Bracket | Male | Female |
| 5 to 17 Years | 10 (2.1%) | 5 (1.2%) |
| 18 to 34 Years | 40 (12.2%) | 62 (12.4%) |
| 35 to 64 Years | 85 (8.4%) | 52 (5.9%) |
| 65 to 74 Years | 13 (7.6%) | 7 (3.4%) |
| 75 Years and over | 6 (5.8%) | 14 (9.8%) |
Disability Class: Ambulatory Difficulty
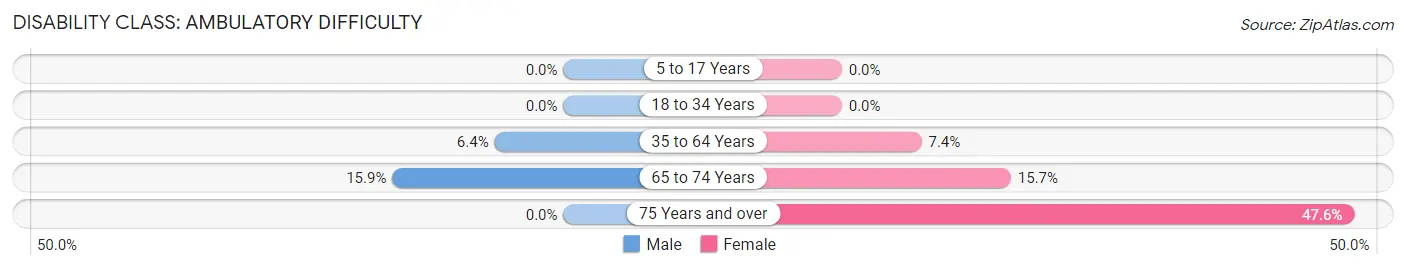
| Age Bracket | Male | Female |
| 5 to 17 Years | 0 (0.0%) | 0 (0.0%) |
| 18 to 34 Years | 0 (0.0%) | 0 (0.0%) |
| 35 to 64 Years | 65 (6.4%) | 65 (7.4%) |
| 65 to 74 Years | 27 (15.9%) | 32 (15.7%) |
| 75 Years and over | 0 (0.0%) | 68 (47.5%) |
Disability Class: Self-Care Difficulty
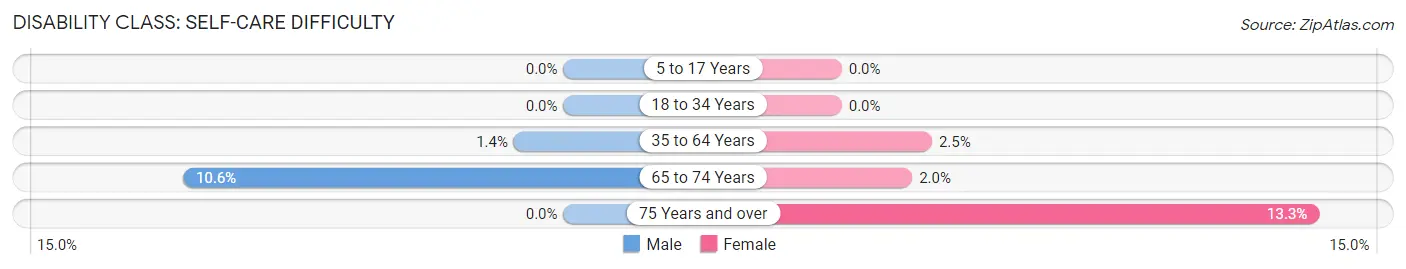
| Age Bracket | Male | Female |
| 5 to 17 Years | 0 (0.0%) | 0 (0.0%) |
| 18 to 34 Years | 0 (0.0%) | 0 (0.0%) |
| 35 to 64 Years | 14 (1.4%) | 22 (2.5%) |
| 65 to 74 Years | 18 (10.6%) | 4 (2.0%) |
| 75 Years and over | 0 (0.0%) | 19 (13.3%) |
Technology Access in Crestline
Computing Device Access in Crestline
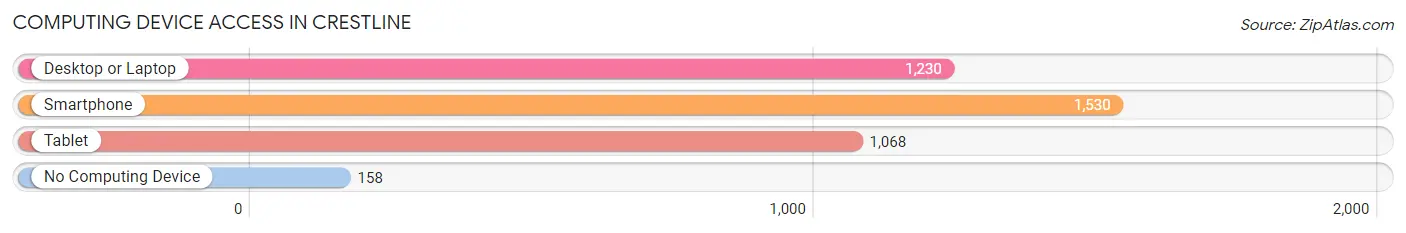
| Device Type | # Households | % Households |
| Desktop or Laptop | 1,230 | 67.3% |
| Smartphone | 1,530 | 83.7% |
| Tablet | 1,068 | 58.4% |
| No Computing Device | 158 | 8.6% |
| Total | 1,828 | 100.0% |
Internet Access in Crestline
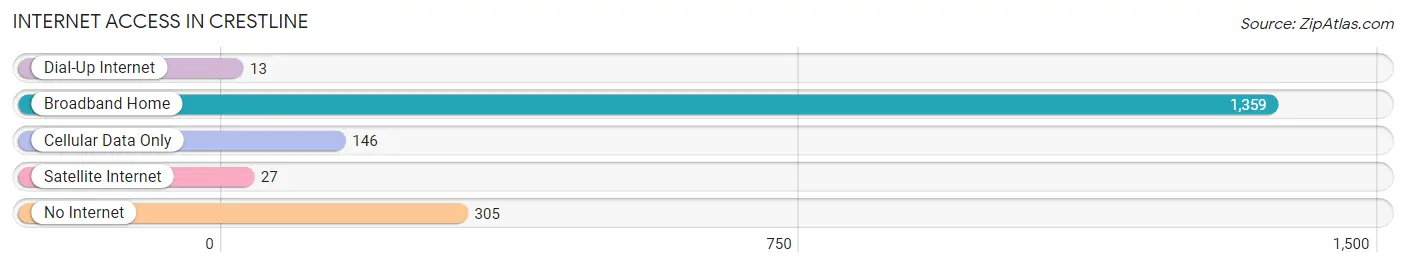
| Internet Type | # Households | % Households |
| Dial-Up Internet | 13 | 0.7% |
| Broadband Home | 1,359 | 74.3% |
| Cellular Data Only | 146 | 8.0% |
| Satellite Internet | 27 | 1.5% |
| No Internet | 305 | 16.7% |
| Total | 1,828 | 100.0% |
Crestline Summary
Crestline, Ohio is a small village located in Crawford County, Ohio. It is situated on the banks of the Sandusky River, and is part of the Bucyrus Micropolitan Statistical Area. The village has a population of approximately 2,000 people, and is known for its small-town charm and friendly atmosphere.
History
Crestline was founded in 1837 by a group of settlers from Pennsylvania. The village was originally known as “Crestline Station”, and was named after the nearby crest of the Sandusky River. The village was incorporated in 1867, and the first mayor was elected in 1868.
In the late 19th century, Crestline was a thriving industrial center, with several factories and mills located in the village. The most prominent of these was the Crestline Stove Company, which manufactured stoves and other heating appliances. The company was founded in 1876 and operated until the early 20th century.
In the early 20th century, Crestline experienced a period of decline, as many of the factories and mills closed down. The village was also affected by the Great Depression, and many of the residents were forced to leave in search of work.
Geography
Crestline is located in the northwest corner of Crawford County, Ohio. It is situated on the banks of the Sandusky River, and is part of the Bucyrus Micropolitan Statistical Area. The village is located approximately 30 miles north of Mansfield, and is approximately 60 miles south of Toledo.
The village is surrounded by rolling hills and farmland, and is home to several parks and recreational areas. The most notable of these is the Crestline Reservoir, which is a popular spot for fishing and boating.
Economy
Crestline’s economy is largely based on agriculture and manufacturing. The village is home to several small businesses, including a grocery store, a hardware store, and a few restaurants. The village also has a small industrial park, which is home to several light manufacturing companies.
The village is also home to several educational institutions, including Crestline High School and Crestline Middle School. The village is also home to a branch of the North Central State College.
Demographics
As of the 2010 census, the population of Crestline was 2,000 people. The racial makeup of the village was 97.2% White, 0.7% African American, 0.3% Native American, 0.2% Asian, 0.1% Pacific Islander, 0.3% from other races, and 1.3% from two or more races. Hispanic or Latino of any race were 1.3% of the population.
The median household income in Crestline was $37,500, and the median family income was $45,000. The per capita income for the village was $18,000. About 11.2% of families and 14.2% of the population were below the poverty line, including 18.2% of those under age 18 and 8.3% of those age 65 or over.
Crestline is a small village with a rich history and a friendly atmosphere. The village is home to several small businesses, educational institutions, and recreational areas. The village is also home to a diverse population, with a variety of racial and ethnic backgrounds.
Common Questions
What is Per Capita Income in Crestline?
Per Capita income in Crestline is $25,213.
What is the Median Family Income in Crestline?
Median Family Income in Crestline is $63,484.
What is the Median Household income in Crestline?
Median Household Income in Crestline is $49,471.
What is Income or Wage Gap in Crestline?
Income or Wage Gap in Crestline is 43.5%.
Women in Crestline earn 56.5 cents for every dollar earned by a man.
What is Family Income Deficit in Crestline?
Family Income Deficit in Crestline is $12,170.
Families that are below poverty line in Crestline earn $12,170 less on average than the poverty threshold level.
What is Inequality or Gini Index in Crestline?
Inequality or Gini Index in Crestline is 0.44.
What is the Total Population of Crestline?
Total Population of Crestline is 4,490.
What is the Total Male Population of Crestline?
Total Male Population of Crestline is 2,237.
What is the Total Female Population of Crestline?
Total Female Population of Crestline is 2,253.
What is the Ratio of Males per 100 Females in Crestline?
There are 99.29 Males per 100 Females in Crestline.
What is the Ratio of Females per 100 Males in Crestline?
There are 100.72 Females per 100 Males in Crestline.
What is the Median Population Age in Crestline?
Median Population Age in Crestline is 41.7 Years.
What is the Average Family Size in Crestline
Average Family Size in Crestline is 2.9 People.
What is the Average Household Size in Crestline
Average Household Size in Crestline is 2.4 People.
How Large is the Labor Force in Crestline?
There are 2,240 People in the Labor Forcein in Crestline.
What is the Percentage of People in the Labor Force in Crestline?
63.6% of People are in the Labor Force in Crestline.
What is the Unemployment Rate in Crestline?
Unemployment Rate in Crestline is 5.5%.