Zip Codes with the Highest Percentage of Population with a Degree in Literature and Languages in Dayton, OH

RELATED REPORTS & OPTIONS

Literature and Languages
Population
Families and Households
Female Fertility
Female Fertility (Unmarried)
Race (Community Size)
Race (Percentage)
Ancestry (Community Size)
AfricanAlbanianAlsatianAmericanApacheArabArgentineanArmenianAustralianAustrianBasqueBelgianBhutaneseBlackfeetBolivianBrazilianBritishBulgarianBurmeseCajunCanadianCape VerdeanCelticCentral AmericanCentral American IndianCherokeeChileanChippewaChoctawColombianCosta RicanCreekCroatianCubanCzechCzechoslovakianDanishDominicanDutchEastern EuropeanEcuadorianEgyptianEnglishEstonianEthiopianEuropeanFilipinoFinnishFrenchFrench CanadianGermanGhanaianGreekGuamanian / ChamorroGuatemalanHaitianHonduranHungarianIcelanderIndian (Asian)InupiatIranianIraqiIrishIroquoisItalianJamaicanJapaneseKenyanKoreanLaotianLatvianLebaneseLiberianLithuanianLuxembourgerMacedonianMalteseMexicanMexican American IndianMoroccanNative HawaiianNavajoNicaraguanNigerianNorthern EuropeanNorwegianOkinawanPakistaniPalestinianPanamanianPennsylvania GermanPeruvianPolishPortuguesePotawatomiPuerto RicanRomanianRussianSalvadoranSamoanScandinavianScotch-IrishScottishSeminoleSenegaleseSerbianSiouxSlavicSlovakSloveneSouth AfricanSouth AmericanSpaniardSpanishSri LankanSubsaharan AfricanSudaneseSwedishSwissSyrianThaiTrinidadian and TobagonianTurkishUkrainianVenezuelanWelshWest IndianYugoslavian
Ancestry (Percentage)
AfricanAlbanianAlsatianAmericanApacheArabArgentineanArmenianAustralianAustrianBasqueBelgianBhutaneseBlackfeetBolivianBrazilianBritishBulgarianBurmeseCajunCanadianCape VerdeanCelticCentral AmericanCentral American IndianCherokeeChileanChippewaChoctawColombianCosta RicanCreekCroatianCubanCzechCzechoslovakianDanishDominicanDutchEastern EuropeanEcuadorianEgyptianEnglishEstonianEthiopianEuropeanFilipinoFinnishFrenchFrench CanadianGermanGhanaianGreekGuamanian / ChamorroGuatemalanHaitianHonduranHungarianIcelanderIndian (Asian)InupiatIranianIraqiIrishIroquoisItalianJamaicanJapaneseKenyanKoreanLaotianLatvianLebaneseLiberianLithuanianLuxembourgerMacedonianMalteseMexicanMexican American IndianMoroccanNative HawaiianNavajoNicaraguanNigerianNorthern EuropeanNorwegianOkinawanPakistaniPalestinianPanamanianPennsylvania GermanPeruvianPolishPortuguesePotawatomiPuerto RicanRomanianRussianSalvadoranSamoanScandinavianScotch-IrishScottishSeminoleSenegaleseSerbianSiouxSlavicSlovakSloveneSouth AfricanSouth AmericanSpaniardSpanishSri LankanSubsaharan AfricanSudaneseSwedishSwissSyrianThaiTrinidadian and TobagonianTurkishUkrainianVenezuelanWelshWest IndianYugoslavian
Immigrant Origin (Total)
AfricaArgentinaAsiaAustraliaBelarusBosnia and HerzegovinaBrazilBulgariaCambodiaCameroonCanadaCaribbeanCentral AmericaChinaColombiaCongoCosta RicaCubaDominican RepublicEastern AfricaEastern AsiaEastern EuropeEcuadorEgyptEl SalvadorEnglandEthiopiaEuropeFranceGermanyGhanaGreeceGuatemalaGuyanaHaitiHondurasHong KongHungaryIndiaIndonesiaIranIraqIrelandIsraelItalyJamaicaJapanJordanKenyaKoreaKuwaitLatin AmericaLebanonLiberiaMalaysiaMexicoMiddle AfricaMoldovaMoroccoNetherlandsNigeriaNorthern AfricaNorthern EuropeNorwayOceaniaPakistanPanamaPeruPhilippinesPolandPortugalRomaniaRussiaSaudi ArabiaScotlandSenegalSingaporeSouth AfricaSouth AmericaSouth Central AsiaSouth Eastern AsiaSouthern EuropeSpainSudanTaiwanThailandTrinidad and TobagoTurkeyUkraineUzbekistanVenezuelaVietnamWestern AfricaWestern AsiaWestern EuropeZaire
Immigrant Origin (Percentage)
AfricaArgentinaAsiaAustraliaBelarusBosnia and HerzegovinaBrazilBulgariaCambodiaCameroonCanadaCaribbeanCentral AmericaChinaColombiaCongoCosta RicaCubaDominican RepublicEastern AfricaEastern AsiaEastern EuropeEcuadorEgyptEl SalvadorEnglandEthiopiaEuropeFranceGermanyGhanaGreeceGuatemalaGuyanaHaitiHondurasHong KongHungaryIndiaIndonesiaIranIraqIrelandIsraelItalyJamaicaJapanJordanKenyaKoreaKuwaitLatin AmericaLebanonLiberiaMalaysiaMexicoMiddle AfricaMoldovaMoroccoNetherlandsNigeriaNorthern AfricaNorthern EuropeNorwayOceaniaPakistanPanamaPeruPhilippinesPolandPortugalRomaniaRussiaSaudi ArabiaScotlandSenegalSingaporeSouth AfricaSouth AmericaSouth Central AsiaSouth Eastern AsiaSouthern EuropeSpainSudanTaiwanThailandTrinidad and TobagoTurkeyUkraineUzbekistanVenezuelaVietnamWestern AfricaWestern AsiaWestern EuropeZaire
Income
Income (Families)
Income (Households)
Poverty
Poverty (Families)
Unemployment
Employment Occupations
Employment Industries
Employer Class
Commute Time
Commute Means
School Enrollment
Education by Degree Field
Occupancy
Finances
Physical Characteristics
Dayton
Compare Zip Codes
Comparison Subject

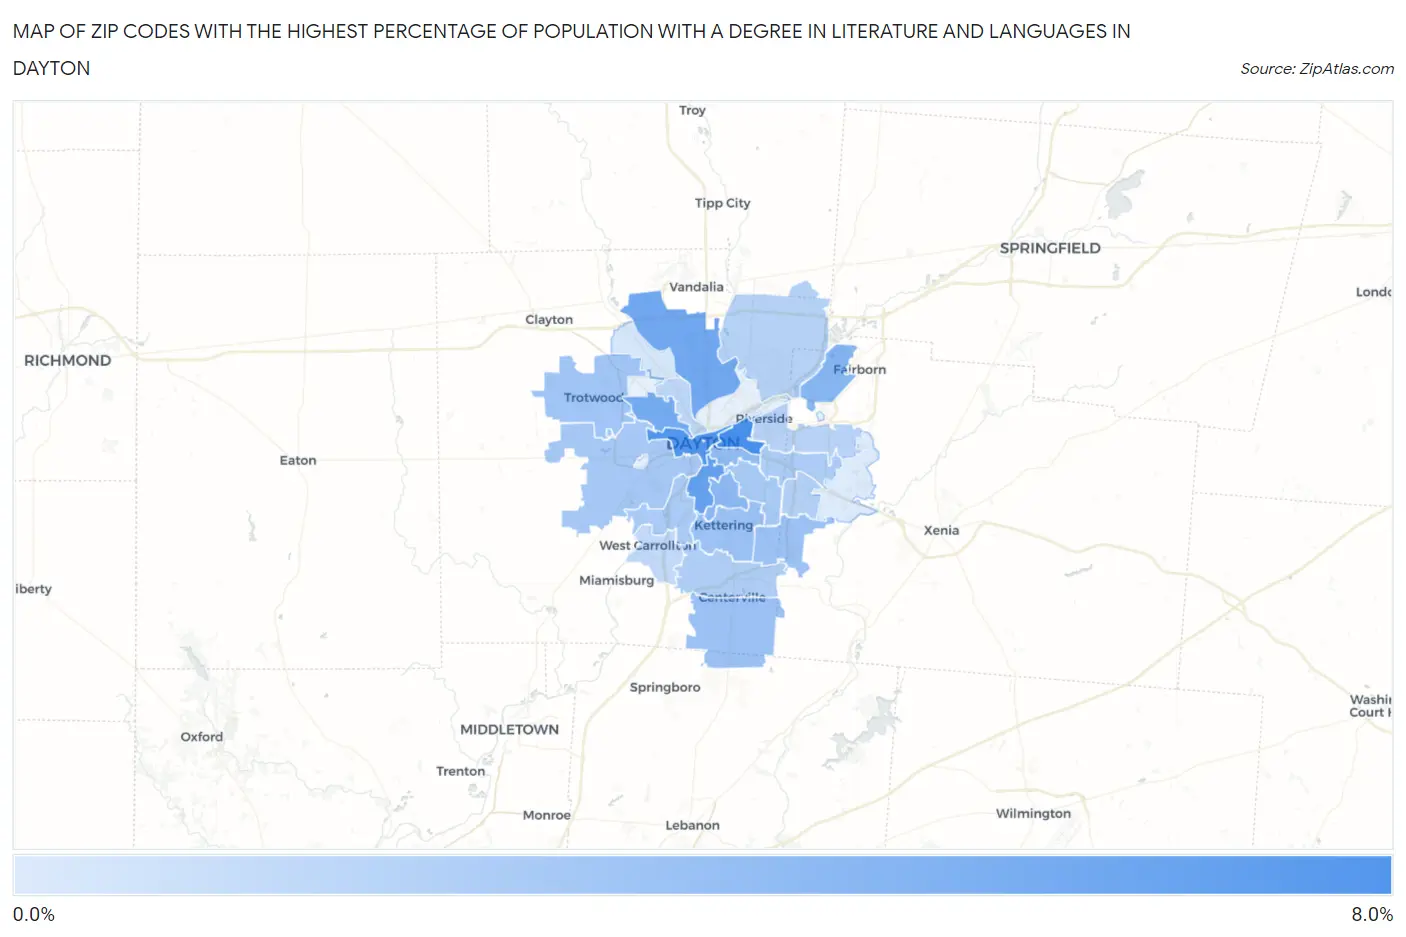
Map of Zip Codes with the Highest Percentage of Population with a Degree in Literature and Languages in Dayton

0.0%
8.0%
Zip Codes with the Highest Percentage of Population with a Degree in Literature and Languages in Dayton Map

Zip Codes with the Highest Percentage of Population with a Degree in Literature and Languages in Dayton, OH

Zip Code % Graduates vs State vs National
1.454036.9%3.7%(+3.18)#994.4%(+2.45)#4,168
2.454026.5%3.7%(+2.78)#1214.4%(+2.05)#4,706
3.454095.8%3.7%(+2.09)#1534.4%(+1.36)#5,811
4.454145.3%3.7%(+1.63)#1884.4%(+0.900)#6,706
5.454065.1%3.7%(+1.46)#2034.4%(+0.722)#7,064
6.454334.5%3.7%(+0.840)#2484.4%(+0.106)#8,679
7.454194.4%3.7%(+0.687)#2614.4%(-0.047)#9,107
8.454104.1%3.7%(+0.457)#2814.4%(-0.277)#9,814
9.454293.8%3.7%(+0.149)#3114.4%(-0.585)#10,739
10.454583.8%3.7%(+0.146)#3134.4%(-0.587)#10,745
11.454403.7%3.7%(+0.064)#3194.4%(-0.670)#11,026
12.454263.6%3.7%(-0.088)#3364.4%(-0.822)#11,545
13.454173.4%3.7%(-0.241)#3554.4%(-0.975)#12,064
14.454203.3%3.7%(-0.328)#3694.4%(-1.06)#12,353
15.454393.2%3.7%(-0.445)#3904.4%(-1.18)#12,786
16.454323.2%3.7%(-0.469)#3974.4%(-1.20)#12,887
17.454593.1%3.7%(-0.566)#4114.4%(-1.30)#13,181
18.454302.9%3.7%(-0.788)#4434.4%(-1.52)#13,936
19.454242.8%3.7%(-0.873)#4534.4%(-1.61)#14,253
20.454312.7%3.7%(-0.946)#4694.4%(-1.68)#14,528
21.454052.6%3.7%(-1.07)#4874.4%(-1.81)#14,952
22.454492.4%3.7%(-1.25)#5184.4%(-1.99)#15,581
23.454151.7%3.7%(-2.00)#6244.4%(-2.74)#18,109
24.454341.5%3.7%(-2.23)#6484.4%(-2.96)#18,835

Common Questions

What are the Top 10 Zip Codes with the Highest Percentage of Population with a Degree in Literature and Languages in Dayton, OH?
Top 10 Zip Codes with the Highest Percentage of Population with a Degree in Literature and Languages in Dayton, OH are:
#1
6.9%
#2
6.5%
#3
5.8%
#4
5.3%
#5
5.1%
#6
4.5%
#7
4.4%
#8
4.1%
#9
3.8%
#10
3.8%
What zip code has the Highest Percentage of Population with a Degree in Literature and Languages in Dayton, OH?
45403 has the Highest Percentage of Population with a Degree in Literature and Languages in Dayton, OH with 6.9%.
What is the Percentage of Population with a Degree in Literature and Languages in Dayton, OH?
Percentage of Population with a Degree in Literature and Languages in Dayton is 4.2%.
What is the Percentage of Population with a Degree in Literature and Languages in Ohio?
Percentage of Population with a Degree in Literature and Languages in Ohio is 3.7%.
What is the Percentage of Population with a Degree in Literature and Languages in the United States?
Percentage of Population with a Degree in Literature and Languages in the United States is 4.4%.