Port Washington, OH Map & Demographics
Port Washington Map
Port Washington Overview
$27,390
PER CAPITA INCOME
$76,875
AVG FAMILY INCOME
$70,714
AVG HOUSEHOLD INCOME
22.0%
WAGE / INCOME GAP [ % ]
78.0¢/ $1
WAGE / INCOME GAP [ $ ]
0.32
INEQUALITY / GINI INDEX
621
TOTAL POPULATION
338
MALE POPULATION
283
FEMALE POPULATION
119.43
MALES / 100 FEMALES
83.73
FEMALES / 100 MALES
39.6
MEDIAN AGE
3.0
AVG FAMILY SIZE
2.8
AVG HOUSEHOLD SIZE
311
LABOR FORCE [ PEOPLE ]
65.1%
PERCENT IN LABOR FORCE
10.6%
UNEMPLOYMENT RATE
Port Washington Zip Codes
Income in Port Washington
Income Overview in Port Washington
Per Capita Income in Port Washington is $27,390, while median incomes of families and households are $76,875 and $70,714 respectively.
| Characteristic | Number | Measure |
| Per Capita Income | 621 | $27,390 |
| Median Family Income | 177 | $76,875 |
| Mean Family Income | 177 | $81,311 |
| Median Household Income | 224 | $70,714 |
| Mean Household Income | 224 | $72,858 |
| Income Deficit | 177 | $0 |
| Wage / Income Gap (%) | 621 | 21.99% |
| Wage / Income Gap ($) | 621 | 78.01¢ per $1 |
| Gini / Inequality Index | 621 | 0.32 |
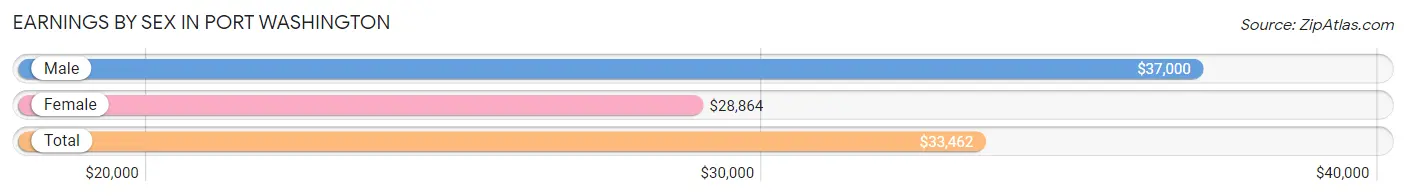
Earnings by Sex in Port Washington
Average Earnings in Port Washington are $33,462, $37,000 for men and $28,864 for women, a difference of 22.0%.
| Sex | Number | Average Earnings |
| Male | 166 (51.2%) | $37,000 |
| Female | 158 (48.8%) | $28,864 |
| Total | 324 (100.0%) | $33,462 |
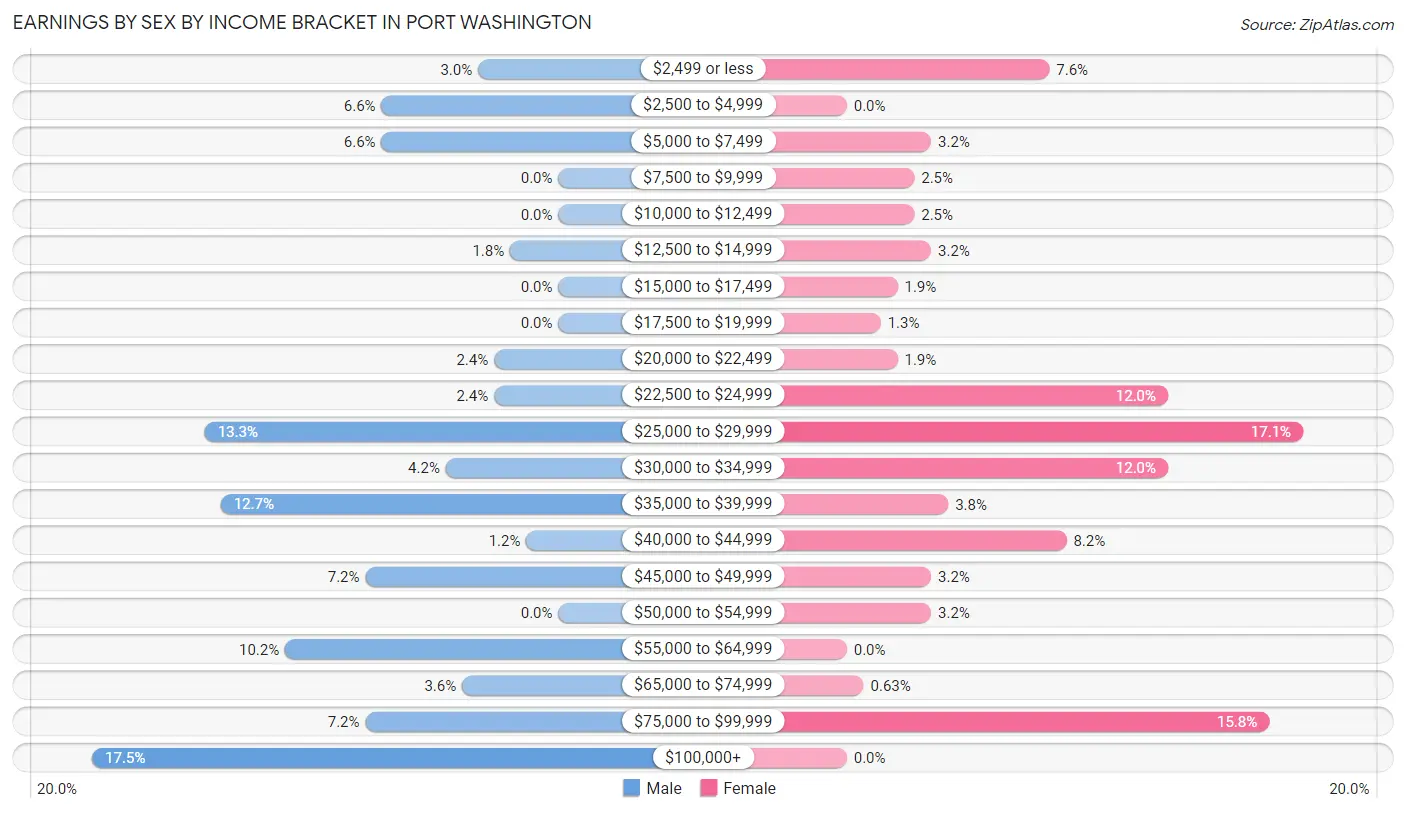
Earnings by Sex by Income Bracket in Port Washington
The most common earnings brackets in Port Washington are $100,000+ for men (29 | 17.5%) and $25,000 to $29,999 for women (27 | 17.1%).
| Income | Male | Female |
| $2,499 or less | 5 (3.0%) | 12 (7.6%) |
| $2,500 to $4,999 | 11 (6.6%) | 0 (0.0%) |
| $5,000 to $7,499 | 11 (6.6%) | 5 (3.2%) |
| $7,500 to $9,999 | 0 (0.0%) | 4 (2.5%) |
| $10,000 to $12,499 | 0 (0.0%) | 4 (2.5%) |
| $12,500 to $14,999 | 3 (1.8%) | 5 (3.2%) |
| $15,000 to $17,499 | 0 (0.0%) | 3 (1.9%) |
| $17,500 to $19,999 | 0 (0.0%) | 2 (1.3%) |
| $20,000 to $22,499 | 4 (2.4%) | 3 (1.9%) |
| $22,500 to $24,999 | 4 (2.4%) | 19 (12.0%) |
| $25,000 to $29,999 | 22 (13.3%) | 27 (17.1%) |
| $30,000 to $34,999 | 7 (4.2%) | 19 (12.0%) |
| $35,000 to $39,999 | 21 (12.7%) | 6 (3.8%) |
| $40,000 to $44,999 | 2 (1.2%) | 13 (8.2%) |
| $45,000 to $49,999 | 12 (7.2%) | 5 (3.2%) |
| $50,000 to $54,999 | 0 (0.0%) | 5 (3.2%) |
| $55,000 to $64,999 | 17 (10.2%) | 0 (0.0%) |
| $65,000 to $74,999 | 6 (3.6%) | 1 (0.6%) |
| $75,000 to $99,999 | 12 (7.2%) | 25 (15.8%) |
| $100,000+ | 29 (17.5%) | 0 (0.0%) |
| Total | 166 (100.0%) | 158 (100.0%) |
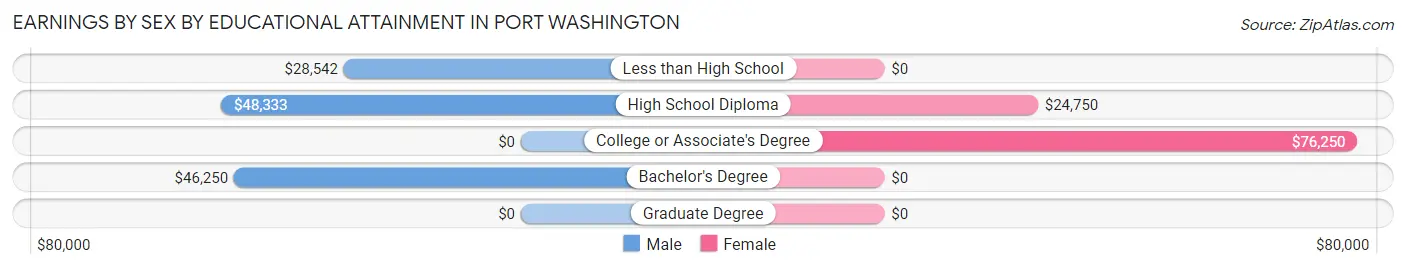
Earnings by Sex by Educational Attainment in Port Washington
Average earnings in Port Washington are $41,250 for men and $30,673 for women, a difference of 25.6%. Men with an educational attainment of high school diploma enjoy the highest average annual earnings of $48,333, while those with less than high school education earn the least with $28,542. Women with an educational attainment of college or associate's degree earn the most with the average annual earnings of $76,250, while those with high school diploma education have the smallest earnings of $24,750.
| Educational Attainment | Male Income | Female Income |
| Less than High School | $28,542 | $0 |
| High School Diploma | $48,333 | $24,750 |
| College or Associate's Degree | - | - |
| Bachelor's Degree | $46,250 | $0 |
| Graduate Degree | - | - |
| Total | $41,250 | $30,673 |
Family Income in Port Washington
Family Income Brackets in Port Washington
According to the Port Washington family income data, there are 57 families falling into the $100,000 to $149,999 income range, which is the most common income bracket and makes up 32.2% of all families.
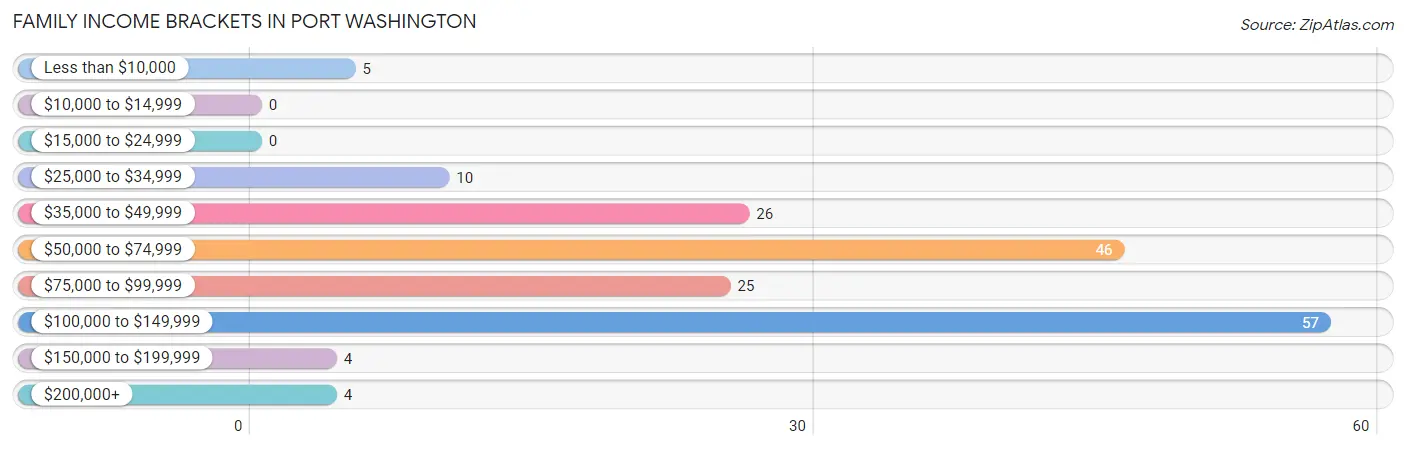
| Income Bracket | # Families | % Families |
| Less than $10,000 | 5 | 2.8% |
| $10,000 to $14,999 | 0 | 0.0% |
| $15,000 to $24,999 | 0 | 0.0% |
| $25,000 to $34,999 | 10 | 5.6% |
| $35,000 to $49,999 | 26 | 14.7% |
| $50,000 to $74,999 | 46 | 26.0% |
| $75,000 to $99,999 | 25 | 14.1% |
| $100,000 to $149,999 | 57 | 32.2% |
| $150,000 to $199,999 | 4 | 2.3% |
| $200,000+ | 4 | 2.3% |
Family Income by Famaliy Size in Port Washington
5-person families (11 | 6.2%) account for the highest median family income in Port Washington with $115,417 per family, while 2-person families (67 | 37.9%) have the highest median income of $29,453 per family member.
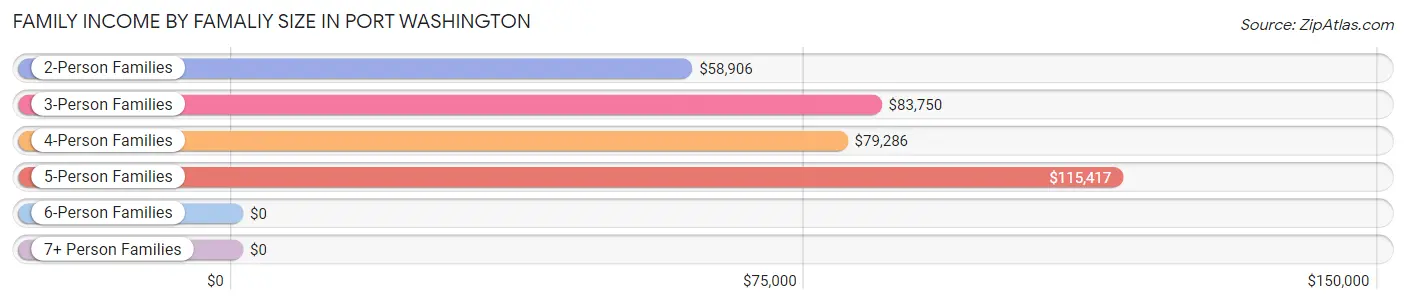
| Income Bracket | # Families | Median Income |
| 2-Person Families | 67 (37.9%) | $58,906 |
| 3-Person Families | 65 (36.7%) | $83,750 |
| 4-Person Families | 32 (18.1%) | $79,286 |
| 5-Person Families | 11 (6.2%) | $115,417 |
| 6-Person Families | 2 (1.1%) | $0 |
| 7+ Person Families | 0 (0.0%) | $0 |
| Total | 177 (100.0%) | $76,875 |
Family Income by Number of Earners in Port Washington
The median family income in Port Washington is $76,875, with families comprising 3+ earners (12) having the highest median family income of $138,750, while families with no earners (21) have the lowest median family income of $34,750, accounting for 6.8% and 11.9% of families, respectively.
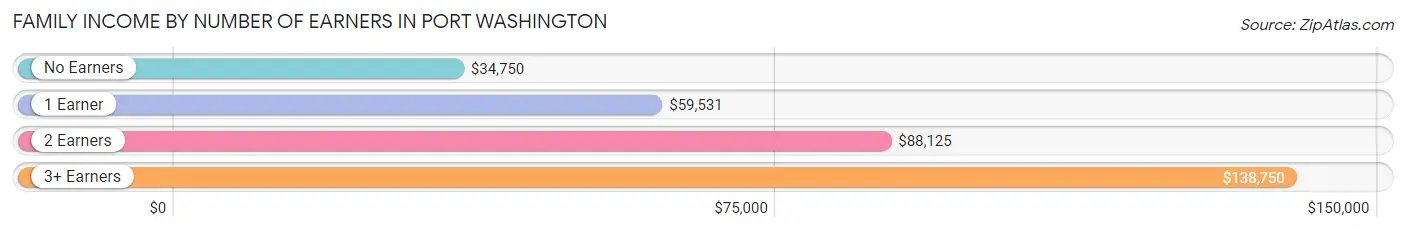
| Number of Earners | # Families | Median Income |
| No Earners | 21 (11.9%) | $34,750 |
| 1 Earner | 59 (33.3%) | $59,531 |
| 2 Earners | 85 (48.0%) | $88,125 |
| 3+ Earners | 12 (6.8%) | $138,750 |
| Total | 177 (100.0%) | $76,875 |
Household Income in Port Washington
Household Income Brackets in Port Washington
With 61 households falling in the category, the $100,000 to $149,999 income range is the most frequent in Port Washington, accounting for 27.2% of all households. In contrast, only 3 households (1.3%) fall into the $10,000 to $14,999 income bracket, making it the least populous group.
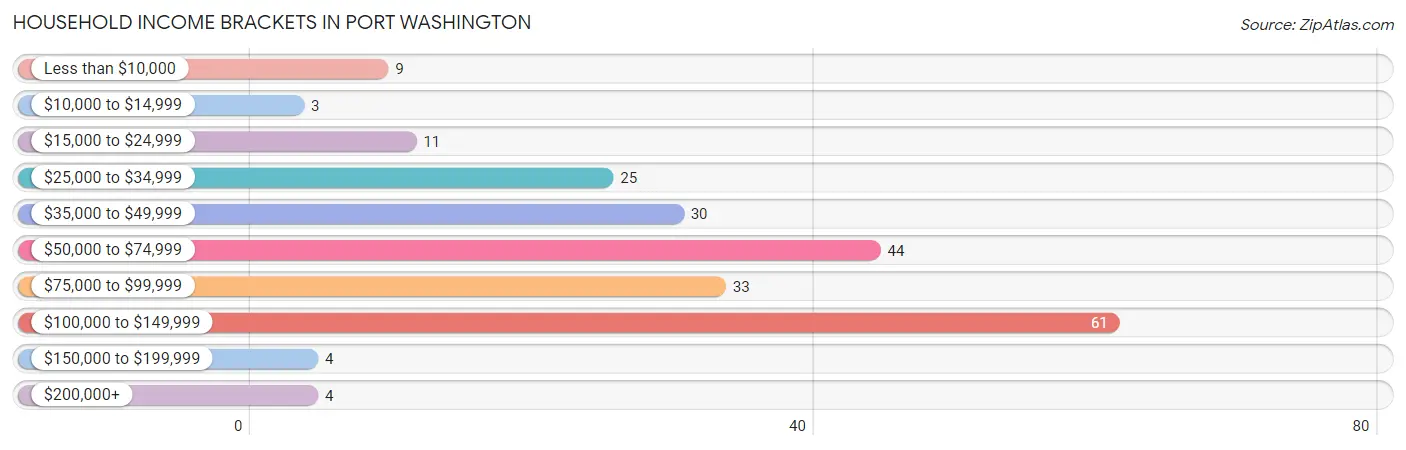
| Income Bracket | # Households | % Households |
| Less than $10,000 | 9 | 4.0% |
| $10,000 to $14,999 | 3 | 1.3% |
| $15,000 to $24,999 | 11 | 4.9% |
| $25,000 to $34,999 | 25 | 11.2% |
| $35,000 to $49,999 | 30 | 13.4% |
| $50,000 to $74,999 | 44 | 19.6% |
| $75,000 to $99,999 | 33 | 14.7% |
| $100,000 to $149,999 | 61 | 27.2% |
| $150,000 to $199,999 | 4 | 1.8% |
| $200,000+ | 4 | 1.8% |
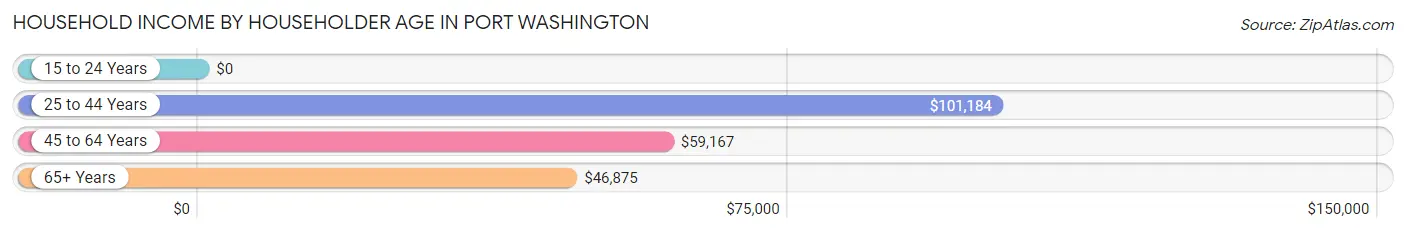
Household Income by Householder Age in Port Washington
The median household income in Port Washington is $70,714, with the highest median household income of $101,184 found in the 25 to 44 years age bracket for the primary householder. A total of 68 households (30.4%) fall into this category.
| Income Bracket | # Households | Median Income |
| 15 to 24 Years | 0 (0.0%) | $0 |
| 25 to 44 Years | 68 (30.4%) | $101,184 |
| 45 to 64 Years | 88 (39.3%) | $59,167 |
| 65+ Years | 68 (30.4%) | $46,875 |
| Total | 224 (100.0%) | $70,714 |
Poverty in Port Washington
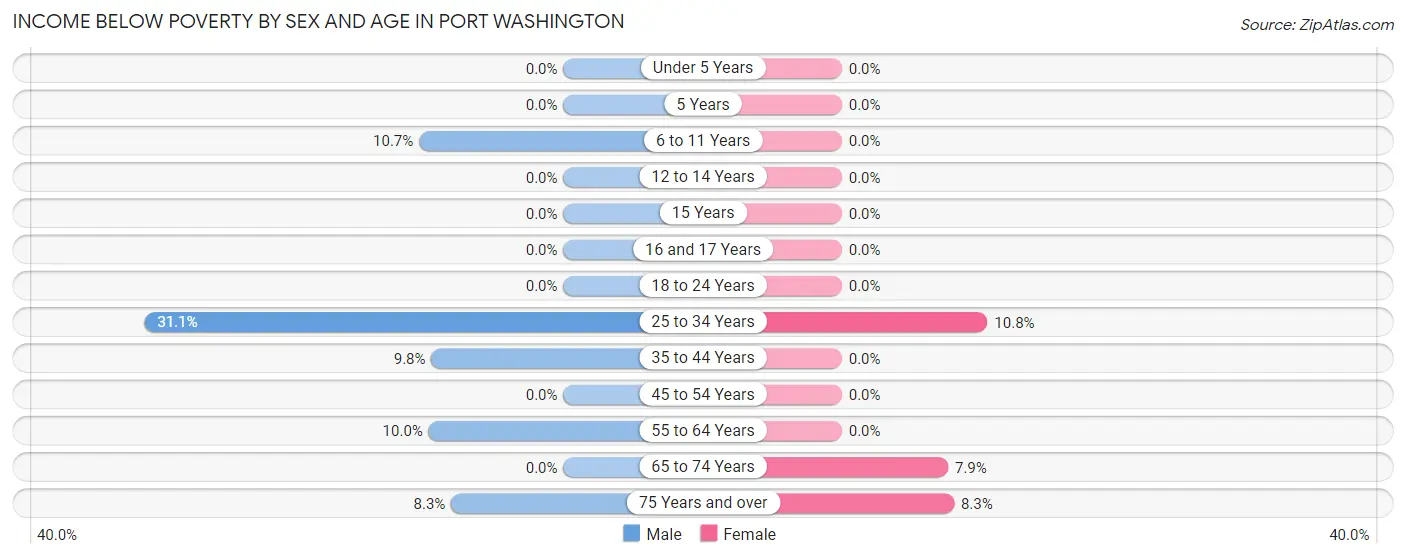
Income Below Poverty by Sex and Age in Port Washington
With 8.4% poverty level for males and 3.2% for females among the residents of Port Washington, 25 to 34 year old males and 25 to 34 year old females are the most vulnerable to poverty, with 14 males (31.1%) and 4 females (10.8%) in their respective age groups living below the poverty level.
| Age Bracket | Male | Female |
| Under 5 Years | 0 (0.0%) | 0 (0.0%) |
| 5 Years | 0 (0.0%) | 0 (0.0%) |
| 6 to 11 Years | 3 (10.7%) | 0 (0.0%) |
| 12 to 14 Years | 0 (0.0%) | 0 (0.0%) |
| 15 Years | 0 (0.0%) | 0 (0.0%) |
| 16 and 17 Years | 0 (0.0%) | 0 (0.0%) |
| 18 to 24 Years | 0 (0.0%) | 0 (0.0%) |
| 25 to 34 Years | 14 (31.1%) | 4 (10.8%) |
| 35 to 44 Years | 5 (9.8%) | 0 (0.0%) |
| 45 to 54 Years | 0 (0.0%) | 0 (0.0%) |
| 55 to 64 Years | 4 (10.0%) | 0 (0.0%) |
| 65 to 74 Years | 0 (0.0%) | 3 (7.9%) |
| 75 Years and over | 2 (8.3%) | 2 (8.3%) |
| Total | 28 (8.4%) | 9 (3.2%) |
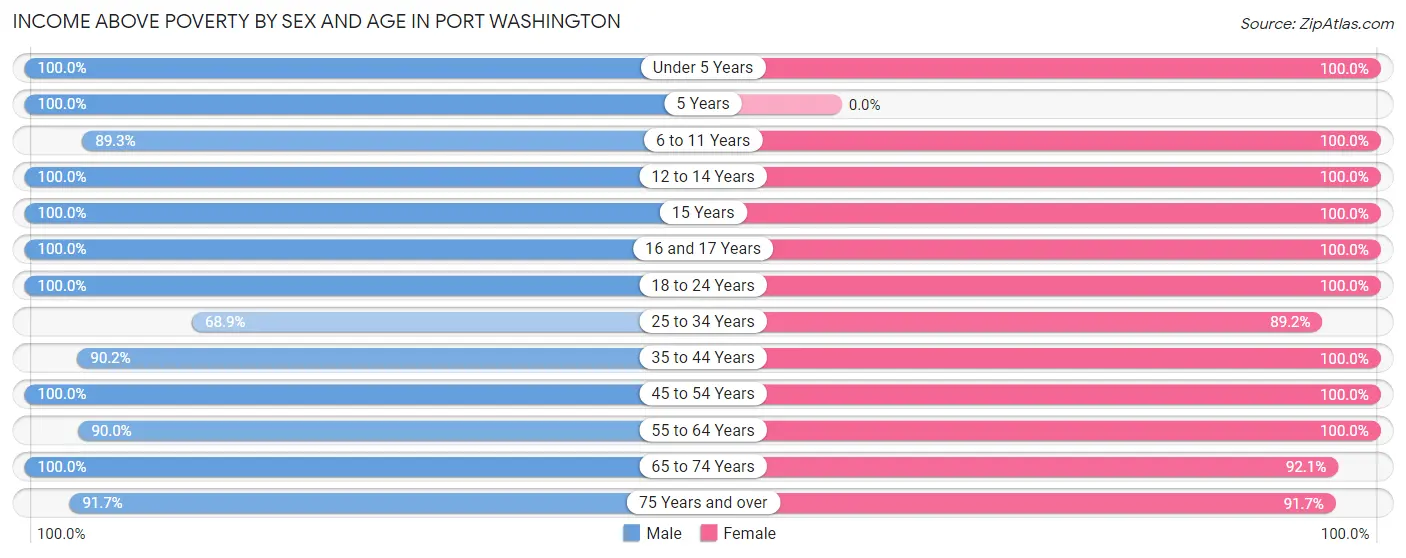
Income Above Poverty by Sex and Age in Port Washington
According to the poverty statistics in Port Washington, males aged under 5 years and females aged under 5 years are the age groups that are most secure financially, with 100.0% of males and 100.0% of females in these age groups living above the poverty line.
| Age Bracket | Male | Female |
| Under 5 Years | 42 (100.0%) | 17 (100.0%) |
| 5 Years | 2 (100.0%) | 0 (0.0%) |
| 6 to 11 Years | 25 (89.3%) | 10 (100.0%) |
| 12 to 14 Years | 27 (100.0%) | 2 (100.0%) |
| 15 Years | 1 (100.0%) | 10 (100.0%) |
| 16 and 17 Years | 8 (100.0%) | 6 (100.0%) |
| 18 to 24 Years | 12 (100.0%) | 27 (100.0%) |
| 25 to 34 Years | 31 (68.9%) | 33 (89.2%) |
| 35 to 44 Years | 46 (90.2%) | 11 (100.0%) |
| 45 to 54 Years | 32 (100.0%) | 57 (100.0%) |
| 55 to 64 Years | 36 (90.0%) | 44 (100.0%) |
| 65 to 74 Years | 22 (100.0%) | 35 (92.1%) |
| 75 Years and over | 22 (91.7%) | 22 (91.7%) |
| Total | 306 (91.6%) | 274 (96.8%) |
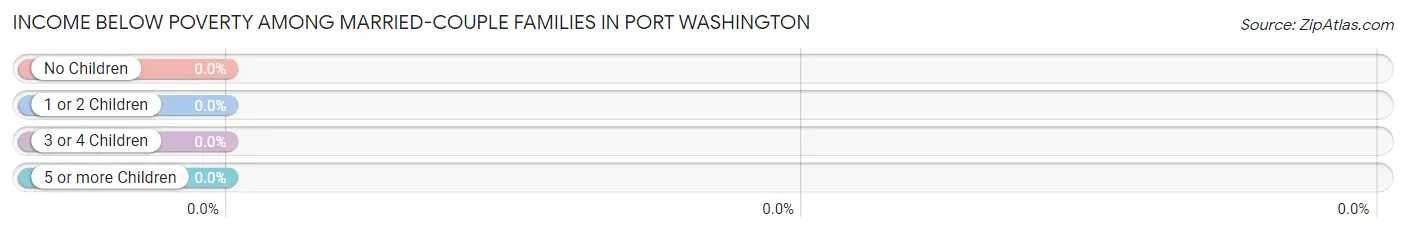
Income Below Poverty Among Married-Couple Families in Port Washington
| Children | Above Poverty | Below Poverty |
| No Children | 87 (100.0%) | 0 (0.0%) |
| 1 or 2 Children | 46 (100.0%) | 0 (0.0%) |
| 3 or 4 Children | 1 (100.0%) | 0 (0.0%) |
| 5 or more Children | 0 (0.0%) | 0 (0.0%) |
| Total | 134 (100.0%) | 0 (0.0%) |
Income Below Poverty Among Single-Parent Households in Port Washington
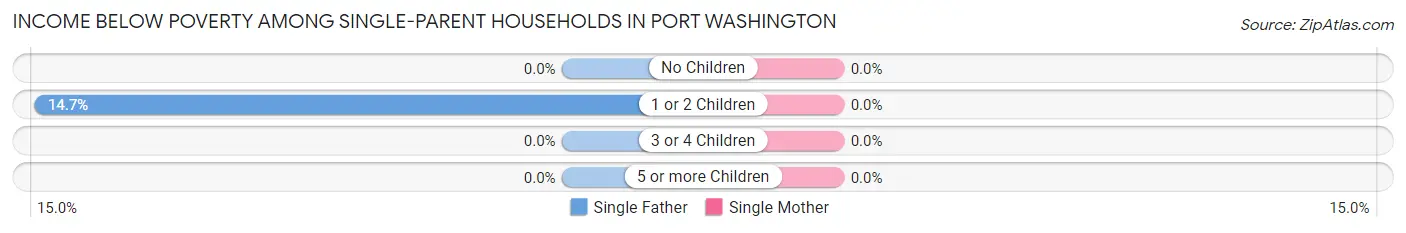
| Children | Single Father | Single Mother |
| No Children | 0 (0.0%) | 0 (0.0%) |
| 1 or 2 Children | 5 (14.7%) | 0 (0.0%) |
| 3 or 4 Children | 0 (0.0%) | 0 (0.0%) |
| 5 or more Children | 0 (0.0%) | 0 (0.0%) |
| Total | 5 (14.7%) | 0 (0.0%) |
Income Below Poverty Among Married-Couple vs Single-Parent Households in Port Washington
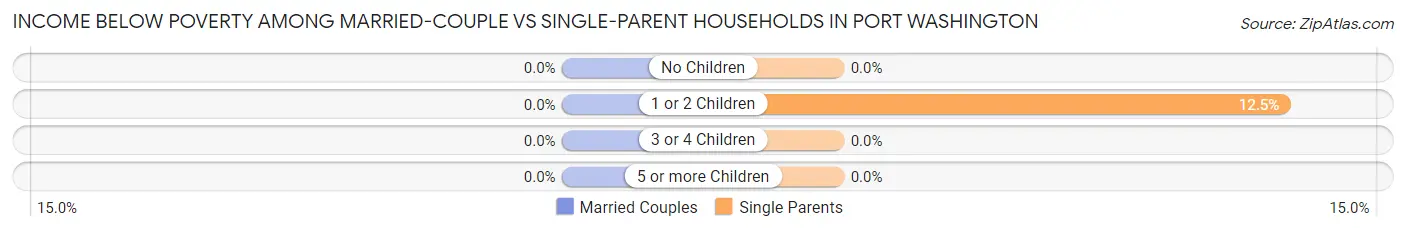
| Children | Married-Couple Families | Single-Parent Households |
| No Children | 0 (0.0%) | 0 (0.0%) |
| 1 or 2 Children | 0 (0.0%) | 5 (12.5%) |
| 3 or 4 Children | 0 (0.0%) | 0 (0.0%) |
| 5 or more Children | 0 (0.0%) | 0 (0.0%) |
| Total | 0 (0.0%) | 5 (11.6%) |
Race in Port Washington
The most populous races in Port Washington are White / Caucasian (591 | 95.2%), Black / African American (22 | 3.5%), and Hispanic or Latino (11 | 1.8%).
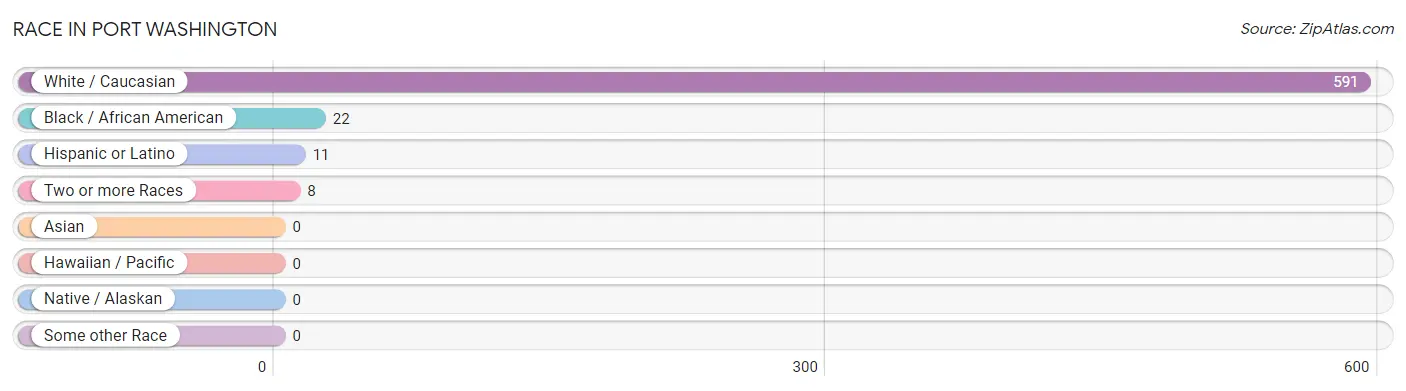
| Race | # Population | % Population |
| Asian | 0 | 0.0% |
| Black / African American | 22 | 3.5% |
| Hawaiian / Pacific | 0 | 0.0% |
| Hispanic or Latino | 11 | 1.8% |
| Native / Alaskan | 0 | 0.0% |
| White / Caucasian | 591 | 95.2% |
| Two or more Races | 8 | 1.3% |
| Some other Race | 0 | 0.0% |
| Total | 621 | 100.0% |
Ancestry in Port Washington
The most populous ancestries reported in Port Washington are German (144 | 23.2%), English (69 | 11.1%), Irish (54 | 8.7%), Dutch (47 | 7.6%), and Italian (42 | 6.8%), together accounting for 57.3% of all Port Washington residents.
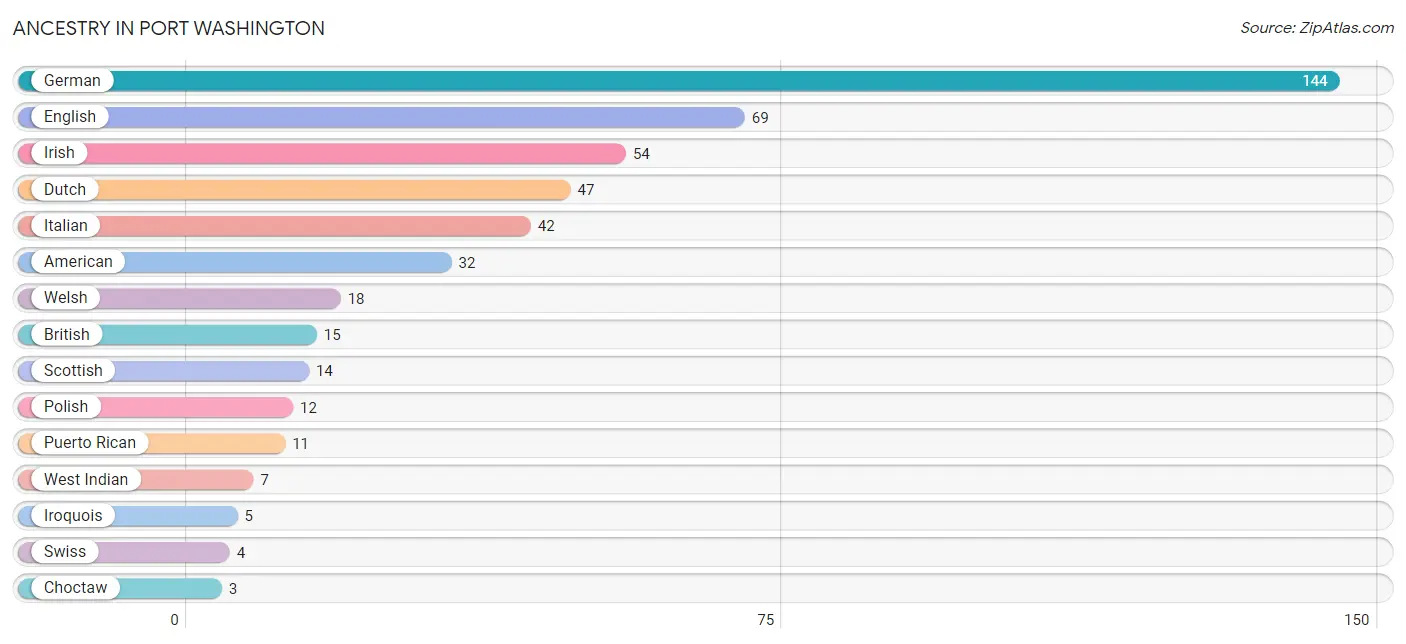
| Ancestry | # Population | % Population |
| American | 32 | 5.1% |
| British | 15 | 2.4% |
| Choctaw | 3 | 0.5% |
| Dutch | 47 | 7.6% |
| English | 69 | 11.1% |
| European | 3 | 0.5% |
| French | 1 | 0.2% |
| German | 144 | 23.2% |
| Irish | 54 | 8.7% |
| Iroquois | 5 | 0.8% |
| Italian | 42 | 6.8% |
| Polish | 12 | 1.9% |
| Puerto Rican | 11 | 1.8% |
| Scottish | 14 | 2.2% |
| Swedish | 2 | 0.3% |
| Swiss | 4 | 0.6% |
| Welsh | 18 | 2.9% |
| West Indian | 7 | 1.1% | View All 18 Rows |
Immigrants in Port Washington

| Immigration Origin | # Population | % Population | View All 0 Rows |
Sex and Age in Port Washington
Sex and Age in Port Washington
The most populous age groups in Port Washington are 10 to 14 Years (49 | 14.5%) for men and 15 to 19 Years (34 | 12.0%) for women.
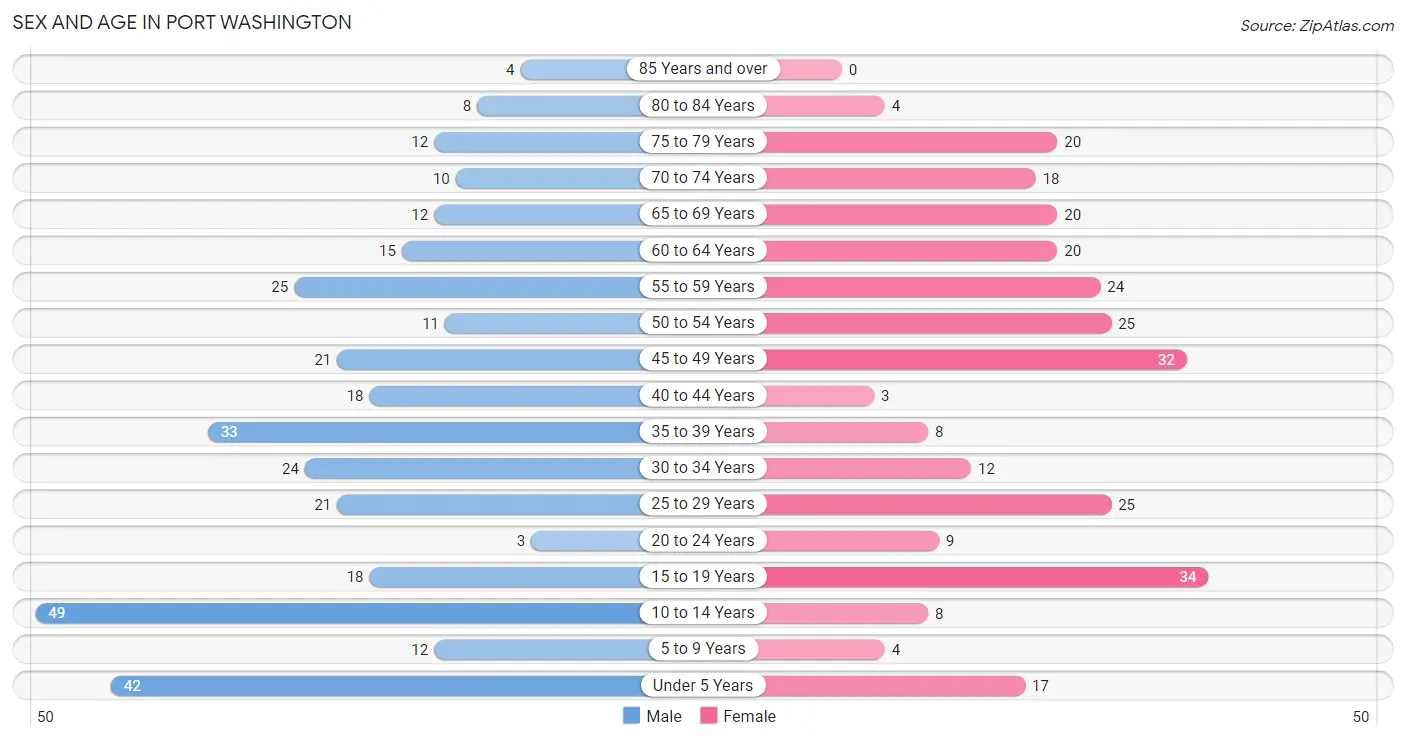
| Age Bracket | Male | Female |
| Under 5 Years | 42 (12.4%) | 17 (6.0%) |
| 5 to 9 Years | 12 (3.5%) | 4 (1.4%) |
| 10 to 14 Years | 49 (14.5%) | 8 (2.8%) |
| 15 to 19 Years | 18 (5.3%) | 34 (12.0%) |
| 20 to 24 Years | 3 (0.9%) | 9 (3.2%) |
| 25 to 29 Years | 21 (6.2%) | 25 (8.8%) |
| 30 to 34 Years | 24 (7.1%) | 12 (4.2%) |
| 35 to 39 Years | 33 (9.8%) | 8 (2.8%) |
| 40 to 44 Years | 18 (5.3%) | 3 (1.1%) |
| 45 to 49 Years | 21 (6.2%) | 32 (11.3%) |
| 50 to 54 Years | 11 (3.3%) | 25 (8.8%) |
| 55 to 59 Years | 25 (7.4%) | 24 (8.5%) |
| 60 to 64 Years | 15 (4.4%) | 20 (7.1%) |
| 65 to 69 Years | 12 (3.5%) | 20 (7.1%) |
| 70 to 74 Years | 10 (3.0%) | 18 (6.4%) |
| 75 to 79 Years | 12 (3.5%) | 20 (7.1%) |
| 80 to 84 Years | 8 (2.4%) | 4 (1.4%) |
| 85 Years and over | 4 (1.2%) | 0 (0.0%) |
| Total | 338 (100.0%) | 283 (100.0%) |
Families and Households in Port Washington
Median Family Size in Port Washington
The median family size in Port Washington is 3.04 persons per family, with married-couple families (134 | 75.7%) accounting for the largest median family size of 3.15 persons per family. On the other hand, single female/mother families (9 | 5.1%) represent the smallest median family size with 2.56 persons per family.
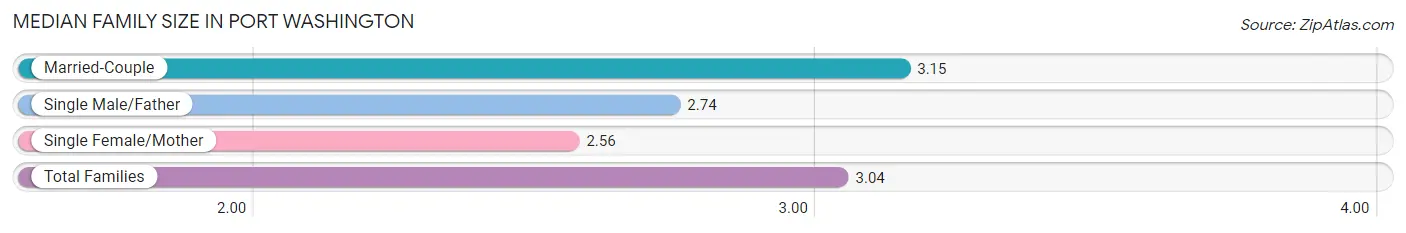
| Family Type | # Families | Family Size |
| Married-Couple | 134 (75.7%) | 3.15 |
| Single Male/Father | 34 (19.2%) | 2.74 |
| Single Female/Mother | 9 (5.1%) | 2.56 |
| Total Families | 177 (100.0%) | 3.04 |
Median Household Size in Port Washington
The median household size in Port Washington is 2.77 persons per household, with married-couple households (134 | 59.8%) accounting for the largest median household size of 3.15 persons per household. non-family households (47 | 21.0%) represent the smallest median household size with 1.43 persons per household.
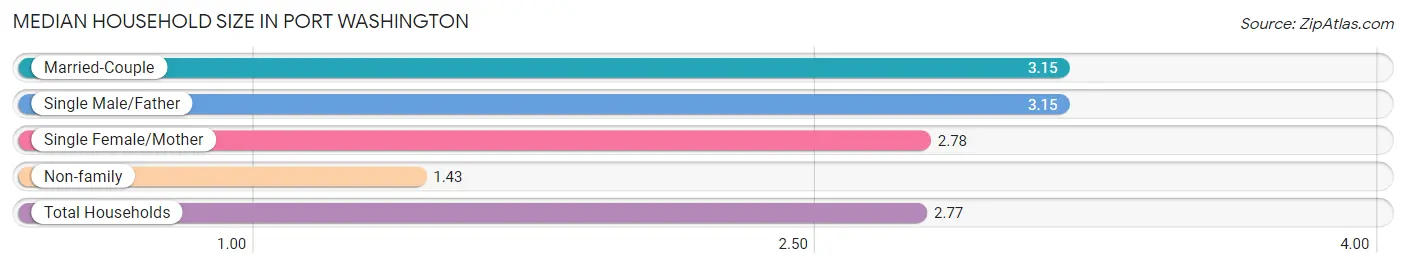
| Household Type | # Households | Household Size |
| Married-Couple | 134 (59.8%) | 3.15 |
| Single Male/Father | 34 (15.2%) | 3.15 |
| Single Female/Mother | 9 (4.0%) | 2.78 |
| Non-family | 47 (21.0%) | 1.43 |
| Total Households | 224 (100.0%) | 2.77 |
Household Size by Marriage Status in Port Washington
Out of a total of 224 households in Port Washington, 177 (79.0%) are family households, while 47 (21.0%) are nonfamily households. The most numerous type of family households are 3-person households, comprising 76, and the most common type of nonfamily households are 1-person households, comprising 35.
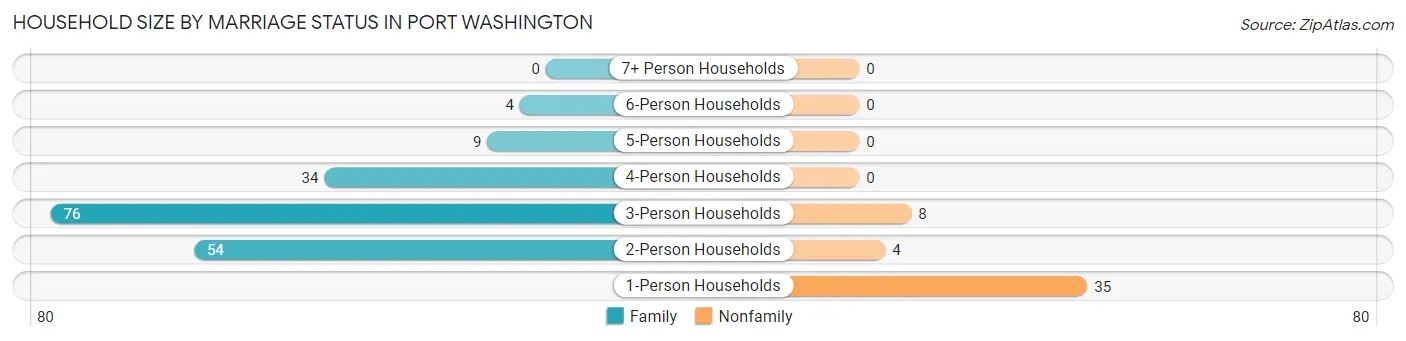
| Household Size | Family Households | Nonfamily Households |
| 1-Person Households | - | 35 (15.6%) |
| 2-Person Households | 54 (24.1%) | 4 (1.8%) |
| 3-Person Households | 76 (33.9%) | 8 (3.6%) |
| 4-Person Households | 34 (15.2%) | 0 (0.0%) |
| 5-Person Households | 9 (4.0%) | 0 (0.0%) |
| 6-Person Households | 4 (1.8%) | 0 (0.0%) |
| 7+ Person Households | 0 (0.0%) | 0 (0.0%) |
| Total | 177 (79.0%) | 47 (21.0%) |
Female Fertility in Port Washington
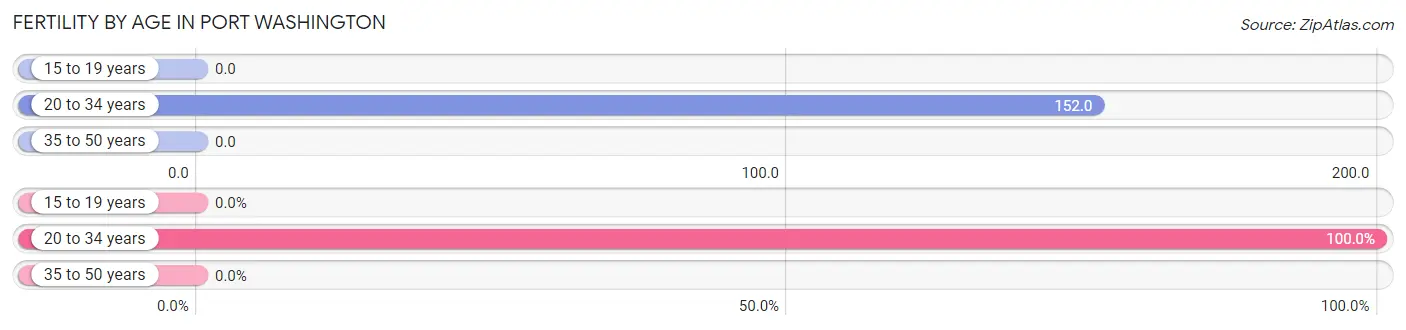
Fertility by Age in Port Washington
Average fertility rate in Port Washington is 57.0 births per 1,000 women. Women in the age bracket of 20 to 34 years have the highest fertility rate with 152.0 births per 1,000 women. Women in the age bracket of 20 to 34 years acount for 100.0% of all women with births.
| Age Bracket | Women with Births | Births / 1,000 Women |
| 15 to 19 years | 0 (0.0%) | 0.0 |
| 20 to 34 years | 7 (100.0%) | 152.0 |
| 35 to 50 years | 0 (0.0%) | 0.0 |
| Total | 7 (100.0%) | 57.0 |
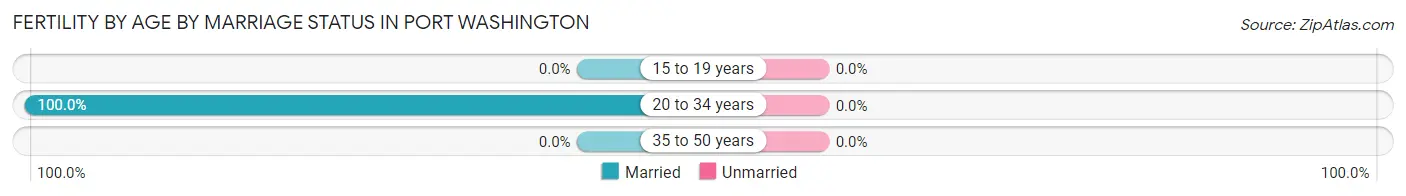
Fertility by Age by Marriage Status in Port Washington
| Age Bracket | Married | Unmarried |
| 15 to 19 years | 0 (0.0%) | 0 (0.0%) |
| 20 to 34 years | 7 (100.0%) | 0 (0.0%) |
| 35 to 50 years | 0 (0.0%) | 0 (0.0%) |
| Total | 7 (100.0%) | 0 (0.0%) |
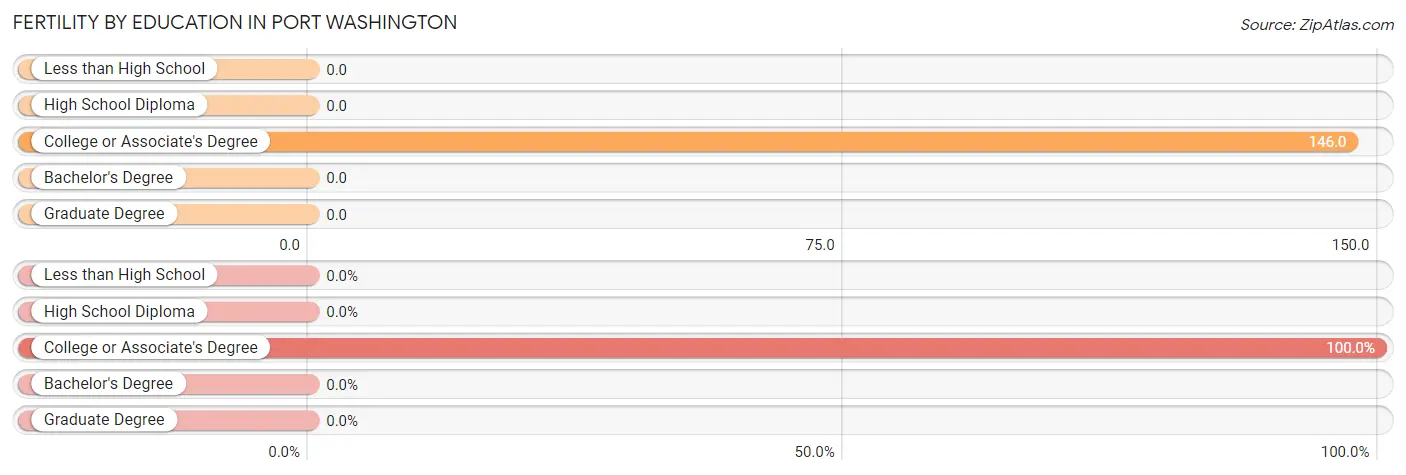
Fertility by Education in Port Washington
| Educational Attainment | Women with Births | Births / 1,000 Women |
| Less than High School | 0 (0.0%) | 0.0 |
| High School Diploma | 0 (0.0%) | 0.0 |
| College or Associate's Degree | 7 (100.0%) | 146.0 |
| Bachelor's Degree | 0 (0.0%) | 0.0 |
| Graduate Degree | 0 (0.0%) | 0.0 |
| Total | 7 (100.0%) | 57.0 |
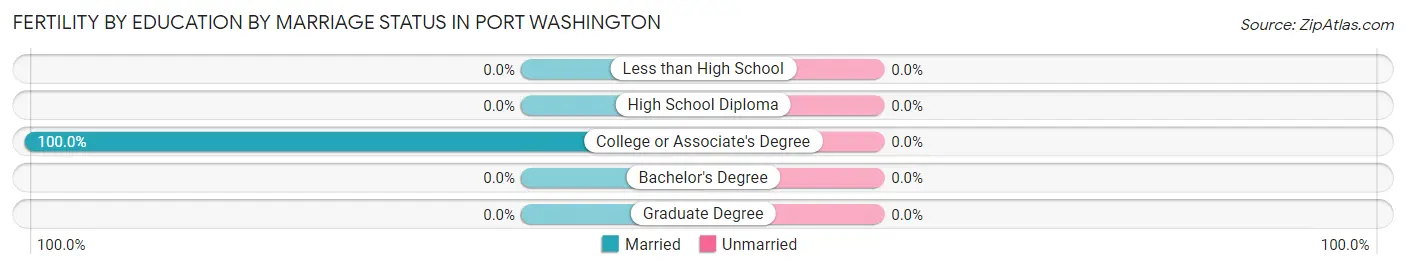
Fertility by Education by Marriage Status in Port Washington
| Educational Attainment | Married | Unmarried |
| Less than High School | 0 (0.0%) | 0 (0.0%) |
| High School Diploma | 0 (0.0%) | 0 (0.0%) |
| College or Associate's Degree | 7 (100.0%) | 0 (0.0%) |
| Bachelor's Degree | 0 (0.0%) | 0 (0.0%) |
| Graduate Degree | 0 (0.0%) | 0 (0.0%) |
| Total | 7 (100.0%) | 0 (0.0%) |
Employment Characteristics in Port Washington
Employment by Class of Employer in Port Washington
Among the 266 employed individuals in Port Washington, private company employees (218 | 82.0%), local government employees (19 | 7.1%), and self-employed (not incorporated) (14 | 5.3%) make up the most common classes of employment.
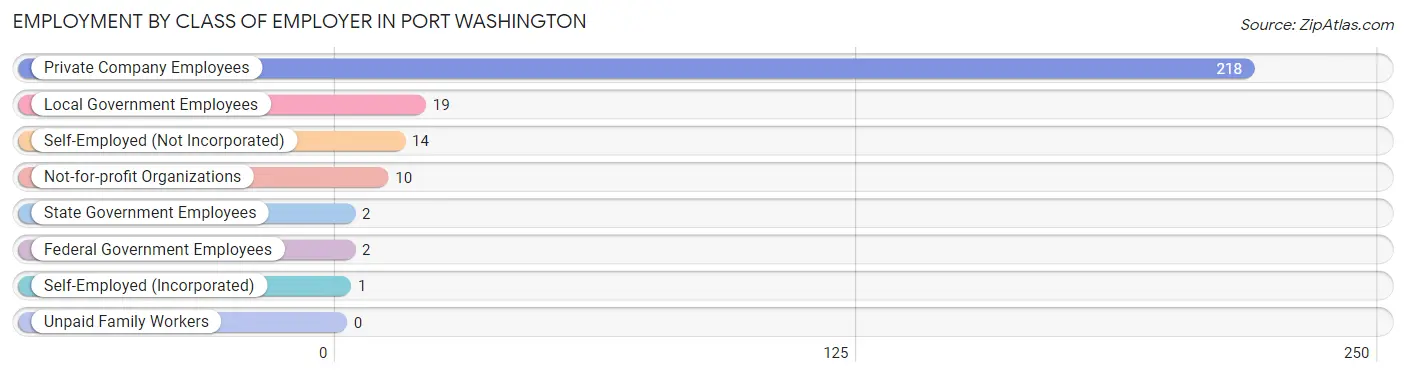
| Employer Class | # Employees | % Employees |
| Private Company Employees | 218 | 82.0% |
| Self-Employed (Incorporated) | 1 | 0.4% |
| Self-Employed (Not Incorporated) | 14 | 5.3% |
| Not-for-profit Organizations | 10 | 3.8% |
| Local Government Employees | 19 | 7.1% |
| State Government Employees | 2 | 0.7% |
| Federal Government Employees | 2 | 0.7% |
| Unpaid Family Workers | 0 | 0.0% |
| Total | 266 | 100.0% |
Employment Status by Age in Port Washington
According to the labor force statistics for Port Washington, out of the total population over 16 years of age (478), 65.1% or 311 individuals are in the labor force, with 10.6% or 33 of them unemployed. The age group with the highest labor force participation rate is 45 to 54 years, with 92.1% or 82 individuals in the labor force. Within the labor force, the 16 to 19 years age range has the highest percentage of unemployed individuals, with 51.9% or 14 of them being unemployed.
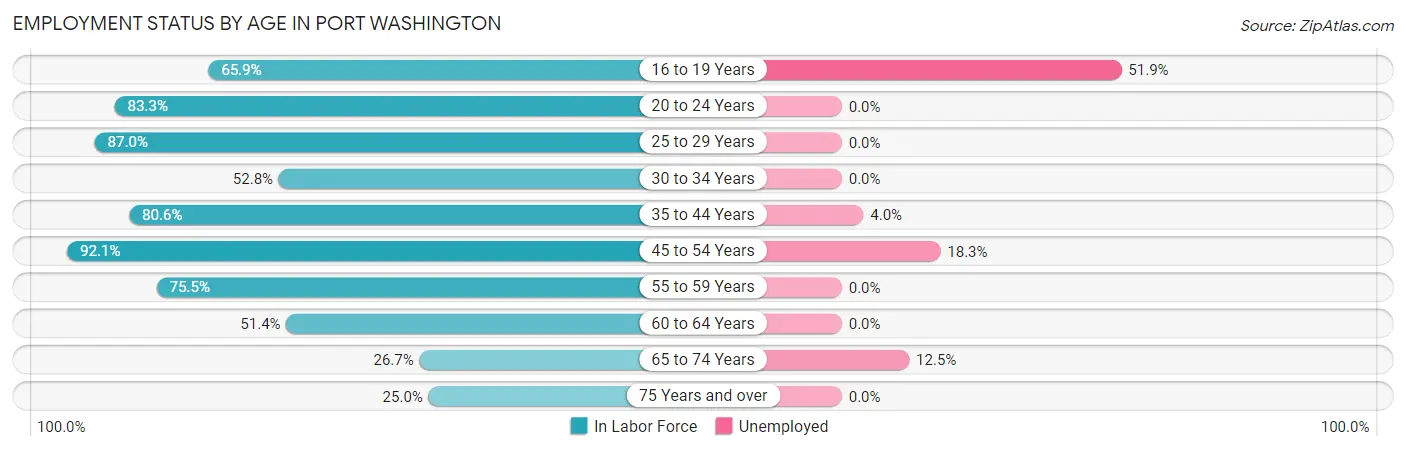
| Age Bracket | In Labor Force | Unemployed |
| 16 to 19 Years | 27 (65.9%) | 14 (51.9%) |
| 20 to 24 Years | 10 (83.3%) | 0 (0.0%) |
| 25 to 29 Years | 40 (87.0%) | 0 (0.0%) |
| 30 to 34 Years | 19 (52.8%) | 0 (0.0%) |
| 35 to 44 Years | 50 (80.6%) | 2 (4.0%) |
| 45 to 54 Years | 82 (92.1%) | 15 (18.3%) |
| 55 to 59 Years | 37 (75.5%) | 0 (0.0%) |
| 60 to 64 Years | 18 (51.4%) | 0 (0.0%) |
| 65 to 74 Years | 16 (26.7%) | 2 (12.5%) |
| 75 Years and over | 12 (25.0%) | 0 (0.0%) |
| Total | 311 (65.1%) | 33 (10.6%) |
Employment Status by Educational Attainment in Port Washington
According to labor force statistics for Port Washington, 77.6% of individuals (246) out of the total population between 25 and 64 years of age (317) are in the labor force, with 6.9% or 17 of them being unemployed. The group with the highest labor force participation rate are those with the educational attainment of bachelor's degree or higher, with 100.0% or 17 individuals in the labor force. Within the labor force, individuals with college / associate degree education have the highest percentage of unemployment, with 24.2% or 15 of them being unemployed.
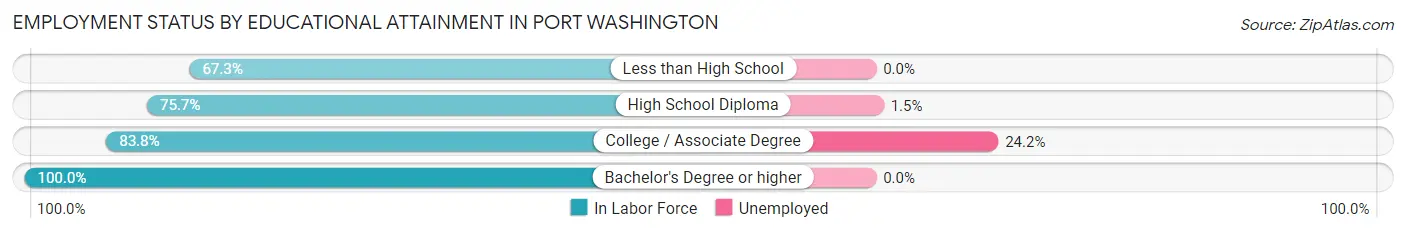
| Educational Attainment | In Labor Force | Unemployed |
| Less than High School | 33 (67.3%) | 0 (0.0%) |
| High School Diploma | 134 (75.7%) | 3 (1.5%) |
| College / Associate Degree | 62 (83.8%) | 18 (24.2%) |
| Bachelor's Degree or higher | 17 (100.0%) | 0 (0.0%) |
| Total | 246 (77.6%) | 22 (6.9%) |
Employment Occupations by Sex in Port Washington
Management, Business, Science and Arts Occupations
The most common Management, Business, Science and Arts occupations in Port Washington are Health Diagnosing & Treating (19 | 6.8%), Computers, Engineering & Science (15 | 5.4%), Community & Social Service (11 | 4.0%), Computers & Mathematics (8 | 2.9%), and Education, Arts & Media (8 | 2.9%).
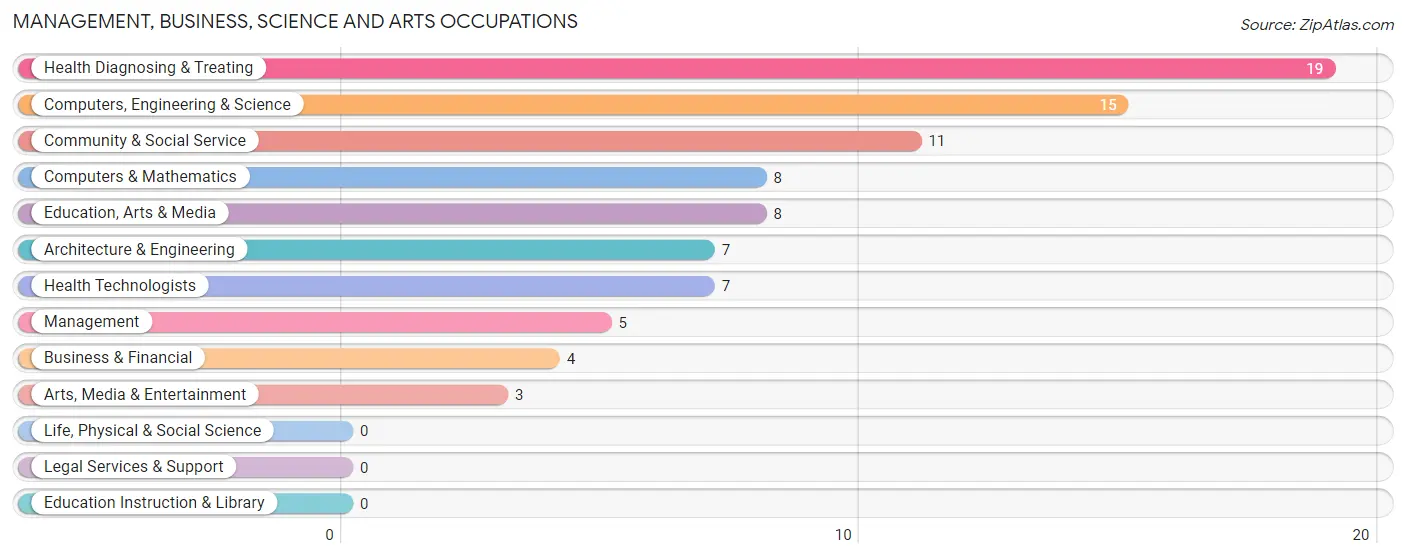
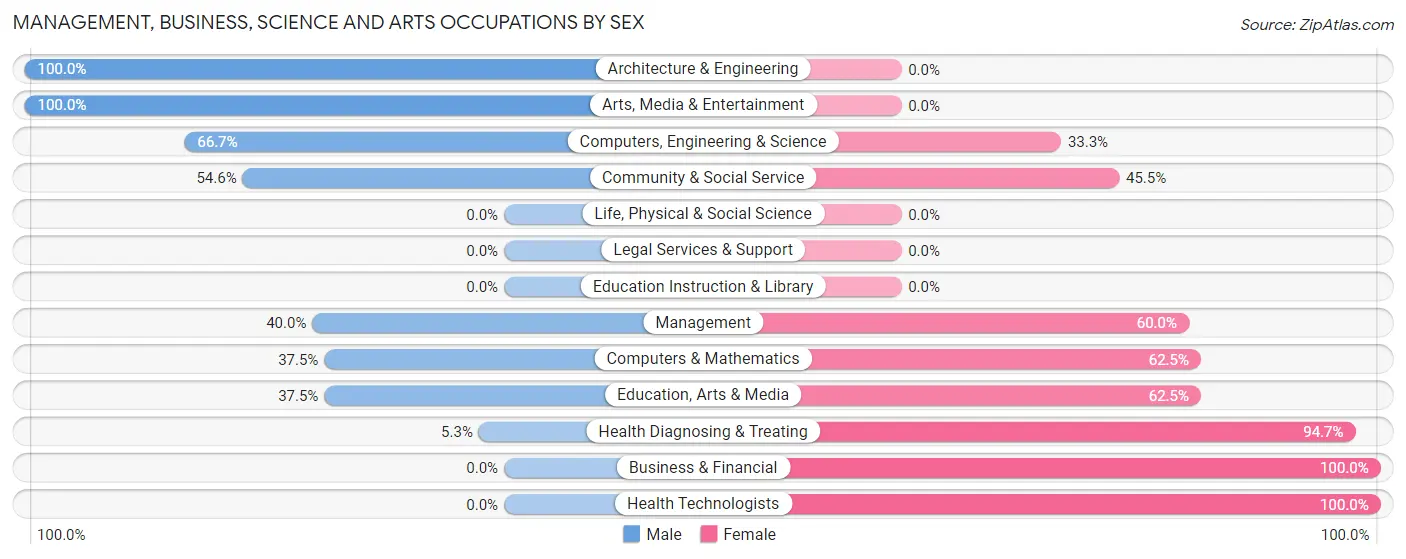
Management, Business, Science and Arts Occupations by Sex
Within the Management, Business, Science and Arts occupations in Port Washington, the most male-oriented occupations are Architecture & Engineering (100.0%), Arts, Media & Entertainment (100.0%), and Computers, Engineering & Science (66.7%), while the most female-oriented occupations are Business & Financial (100.0%), Health Technologists (100.0%), and Health Diagnosing & Treating (94.7%).
| Occupation | Male | Female |
| Management | 2 (40.0%) | 3 (60.0%) |
| Business & Financial | 0 (0.0%) | 4 (100.0%) |
| Computers, Engineering & Science | 10 (66.7%) | 5 (33.3%) |
| Computers & Mathematics | 3 (37.5%) | 5 (62.5%) |
| Architecture & Engineering | 7 (100.0%) | 0 (0.0%) |
| Life, Physical & Social Science | 0 (0.0%) | 0 (0.0%) |
| Community & Social Service | 6 (54.5%) | 5 (45.5%) |
| Education, Arts & Media | 3 (37.5%) | 5 (62.5%) |
| Legal Services & Support | 0 (0.0%) | 0 (0.0%) |
| Education Instruction & Library | 0 (0.0%) | 0 (0.0%) |
| Arts, Media & Entertainment | 3 (100.0%) | 0 (0.0%) |
| Health Diagnosing & Treating | 1 (5.3%) | 18 (94.7%) |
| Health Technologists | 0 (0.0%) | 7 (100.0%) |
| Total (Category) | 19 (35.2%) | 35 (64.8%) |
| Total (Overall) | 141 (50.7%) | 137 (49.3%) |
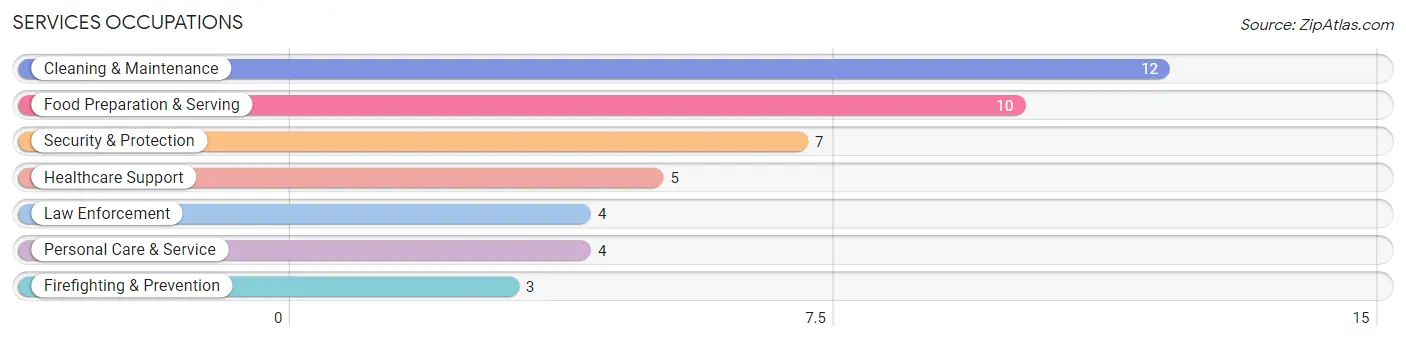
Services Occupations
The most common Services occupations in Port Washington are Cleaning & Maintenance (12 | 4.3%), Food Preparation & Serving (10 | 3.6%), Security & Protection (7 | 2.5%), Healthcare Support (5 | 1.8%), and Law Enforcement (4 | 1.4%).
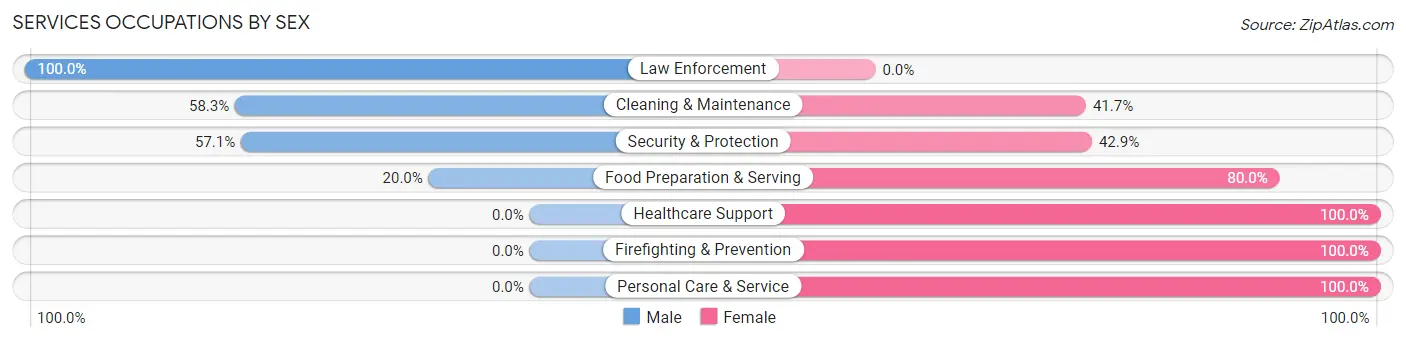
Services Occupations by Sex
Within the Services occupations in Port Washington, the most male-oriented occupations are Law Enforcement (100.0%), Cleaning & Maintenance (58.3%), and Security & Protection (57.1%), while the most female-oriented occupations are Healthcare Support (100.0%), Firefighting & Prevention (100.0%), and Personal Care & Service (100.0%).
| Occupation | Male | Female |
| Healthcare Support | 0 (0.0%) | 5 (100.0%) |
| Security & Protection | 4 (57.1%) | 3 (42.9%) |
| Firefighting & Prevention | 0 (0.0%) | 3 (100.0%) |
| Law Enforcement | 4 (100.0%) | 0 (0.0%) |
| Food Preparation & Serving | 2 (20.0%) | 8 (80.0%) |
| Cleaning & Maintenance | 7 (58.3%) | 5 (41.7%) |
| Personal Care & Service | 0 (0.0%) | 4 (100.0%) |
| Total (Category) | 13 (34.2%) | 25 (65.8%) |
| Total (Overall) | 141 (50.7%) | 137 (49.3%) |
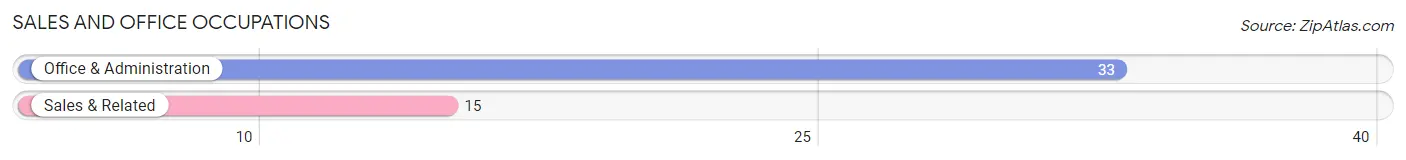
Sales and Office Occupations
The most common Sales and Office occupations in Port Washington are Office & Administration (33 | 11.9%), and Sales & Related (15 | 5.4%).
Sales and Office Occupations by Sex
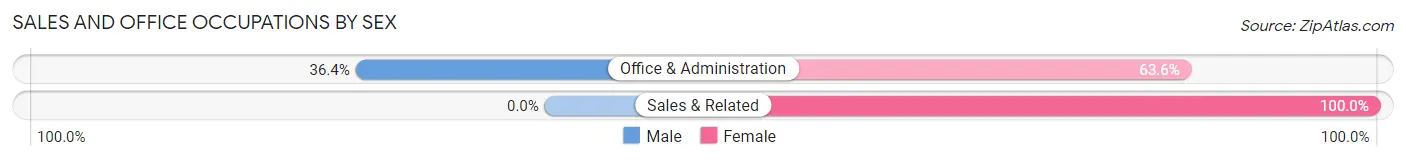
| Occupation | Male | Female |
| Sales & Related | 0 (0.0%) | 15 (100.0%) |
| Office & Administration | 12 (36.4%) | 21 (63.6%) |
| Total (Category) | 12 (25.0%) | 36 (75.0%) |
| Total (Overall) | 141 (50.7%) | 137 (49.3%) |
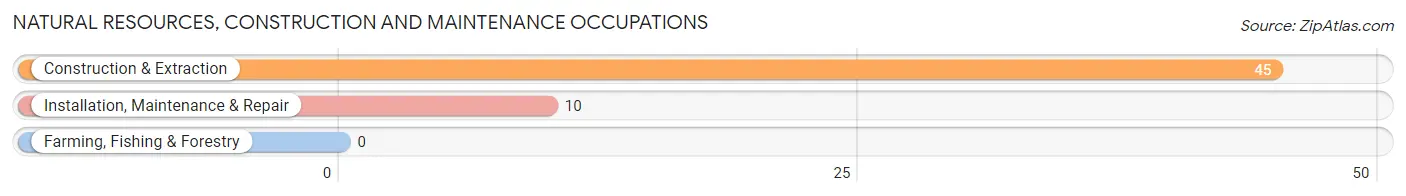
Natural Resources, Construction and Maintenance Occupations
The most common Natural Resources, Construction and Maintenance occupations in Port Washington are Construction & Extraction (45 | 16.2%), and Installation, Maintenance & Repair (10 | 3.6%).
Natural Resources, Construction and Maintenance Occupations by Sex
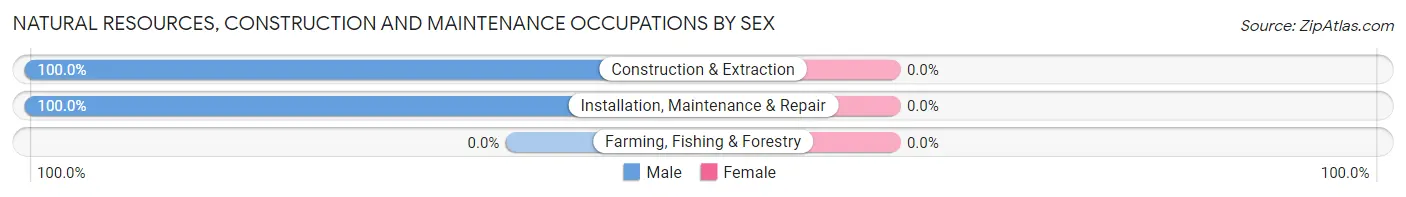
| Occupation | Male | Female |
| Farming, Fishing & Forestry | 0 (0.0%) | 0 (0.0%) |
| Construction & Extraction | 45 (100.0%) | 0 (0.0%) |
| Installation, Maintenance & Repair | 10 (100.0%) | 0 (0.0%) |
| Total (Category) | 55 (100.0%) | 0 (0.0%) |
| Total (Overall) | 141 (50.7%) | 137 (49.3%) |
Production, Transportation and Moving Occupations
The most common Production, Transportation and Moving occupations in Port Washington are Production (49 | 17.6%), Material Moving (24 | 8.6%), and Transportation (10 | 3.6%).
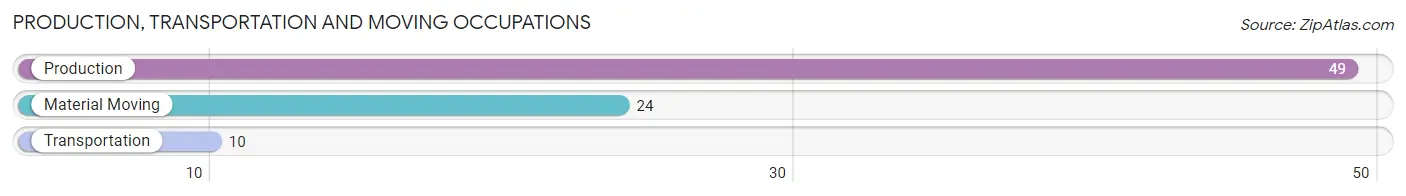
Production, Transportation and Moving Occupations by Sex
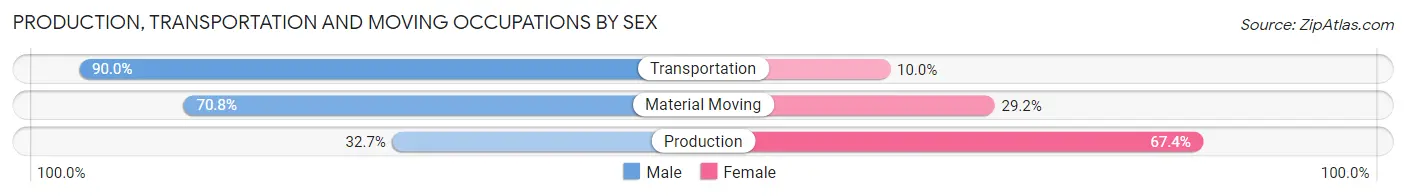
| Occupation | Male | Female |
| Production | 16 (32.7%) | 33 (67.3%) |
| Transportation | 9 (90.0%) | 1 (10.0%) |
| Material Moving | 17 (70.8%) | 7 (29.2%) |
| Total (Category) | 42 (50.6%) | 41 (49.4%) |
| Total (Overall) | 141 (50.7%) | 137 (49.3%) |
Employment Industries by Sex in Port Washington
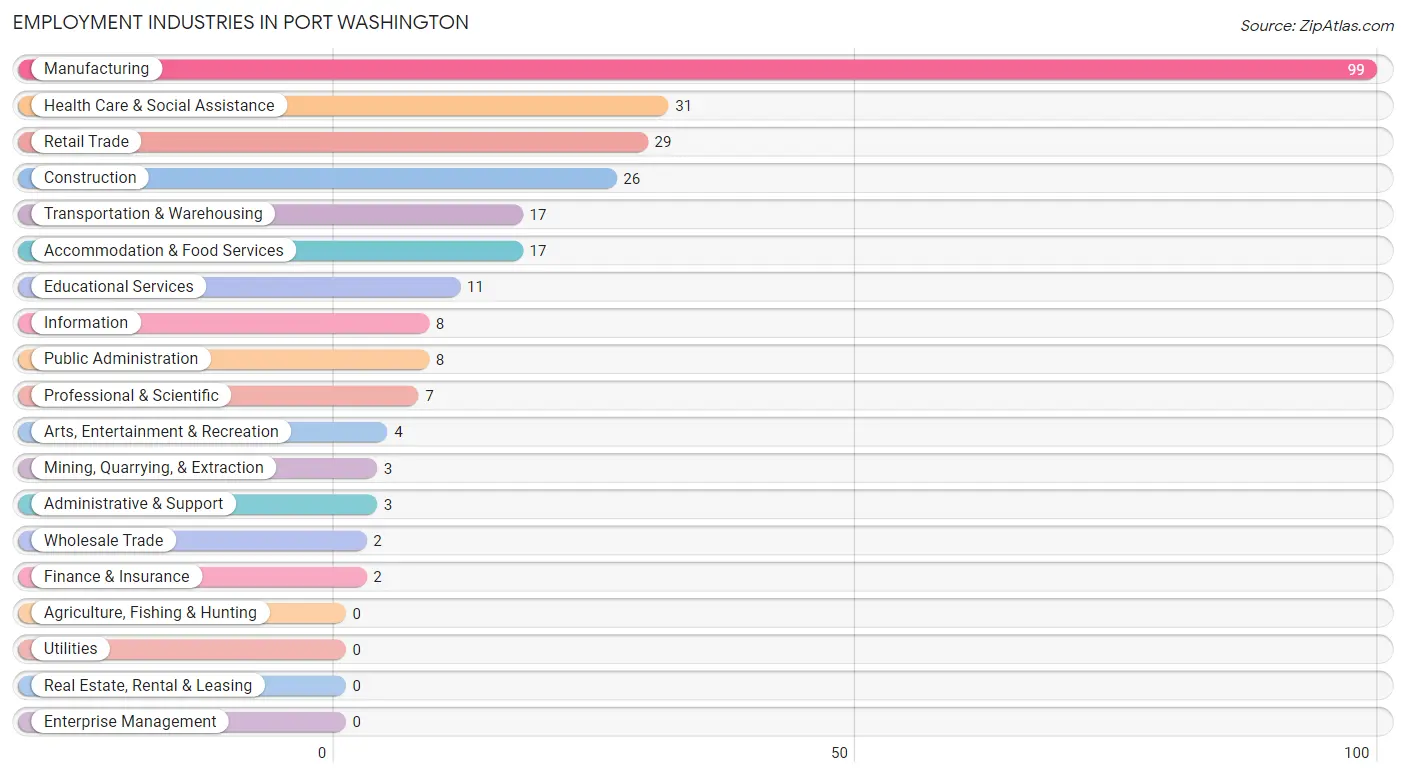
Employment Industries in Port Washington
The major employment industries in Port Washington include Manufacturing (99 | 35.6%), Health Care & Social Assistance (31 | 11.2%), Retail Trade (29 | 10.4%), Construction (26 | 9.3%), and Transportation & Warehousing (17 | 6.1%).
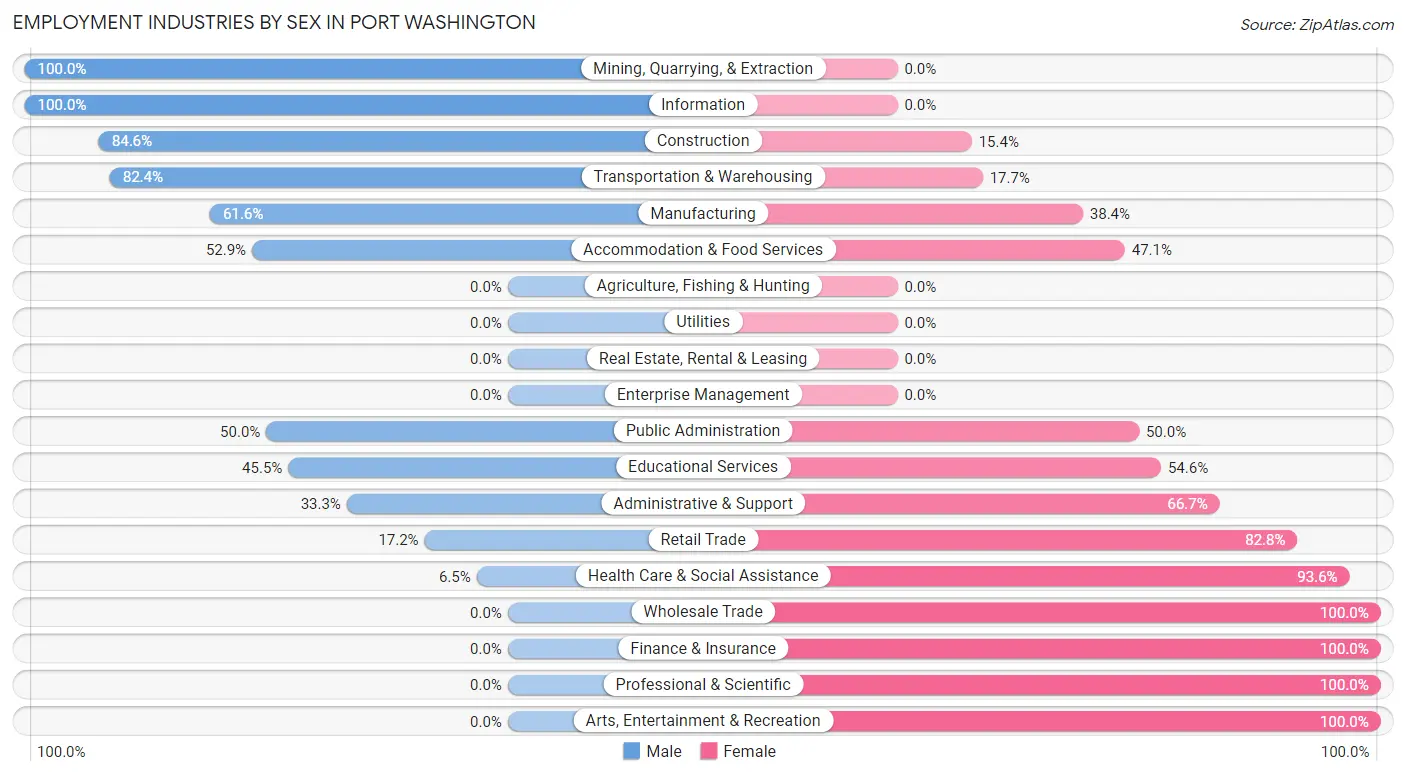
Employment Industries by Sex in Port Washington
The Port Washington industries that see more men than women are Mining, Quarrying, & Extraction (100.0%), Information (100.0%), and Construction (84.6%), whereas the industries that tend to have a higher number of women are Wholesale Trade (100.0%), Finance & Insurance (100.0%), and Professional & Scientific (100.0%).
| Industry | Male | Female |
| Agriculture, Fishing & Hunting | 0 (0.0%) | 0 (0.0%) |
| Mining, Quarrying, & Extraction | 3 (100.0%) | 0 (0.0%) |
| Construction | 22 (84.6%) | 4 (15.4%) |
| Manufacturing | 61 (61.6%) | 38 (38.4%) |
| Wholesale Trade | 0 (0.0%) | 2 (100.0%) |
| Retail Trade | 5 (17.2%) | 24 (82.8%) |
| Transportation & Warehousing | 14 (82.4%) | 3 (17.6%) |
| Utilities | 0 (0.0%) | 0 (0.0%) |
| Information | 8 (100.0%) | 0 (0.0%) |
| Finance & Insurance | 0 (0.0%) | 2 (100.0%) |
| Real Estate, Rental & Leasing | 0 (0.0%) | 0 (0.0%) |
| Professional & Scientific | 0 (0.0%) | 7 (100.0%) |
| Enterprise Management | 0 (0.0%) | 0 (0.0%) |
| Administrative & Support | 1 (33.3%) | 2 (66.7%) |
| Educational Services | 5 (45.5%) | 6 (54.5%) |
| Health Care & Social Assistance | 2 (6.5%) | 29 (93.5%) |
| Arts, Entertainment & Recreation | 0 (0.0%) | 4 (100.0%) |
| Accommodation & Food Services | 9 (52.9%) | 8 (47.1%) |
| Public Administration | 4 (50.0%) | 4 (50.0%) |
| Total | 141 (50.7%) | 137 (49.3%) |
Education in Port Washington
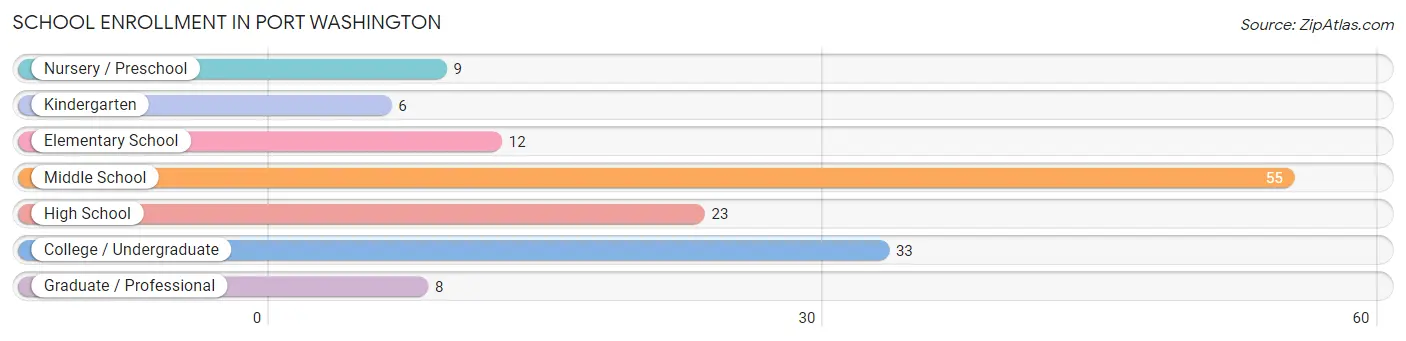
School Enrollment in Port Washington
The most common levels of schooling among the 146 students in Port Washington are middle school (55 | 37.7%), college / undergraduate (33 | 22.6%), and high school (23 | 15.8%).
| School Level | # Students | % Students |
| Nursery / Preschool | 9 | 6.2% |
| Kindergarten | 6 | 4.1% |
| Elementary School | 12 | 8.2% |
| Middle School | 55 | 37.7% |
| High School | 23 | 15.8% |
| College / Undergraduate | 33 | 22.6% |
| Graduate / Professional | 8 | 5.5% |
| Total | 146 | 100.0% |
School Enrollment by Age by Funding Source in Port Washington
Out of a total of 146 students who are enrolled in schools in Port Washington, 21 (14.4%) attend a private institution, while the remaining 125 (85.6%) are enrolled in public schools. The age group of 3 to 4 year olds has the highest likelihood of being enrolled in private schools, with 6 (66.7% in the age bracket) enrolled. Conversely, the age group of 10 to 14 year olds has the lowest likelihood of being enrolled in a private school, with 57 (100.0% in the age bracket) attending a public institution.
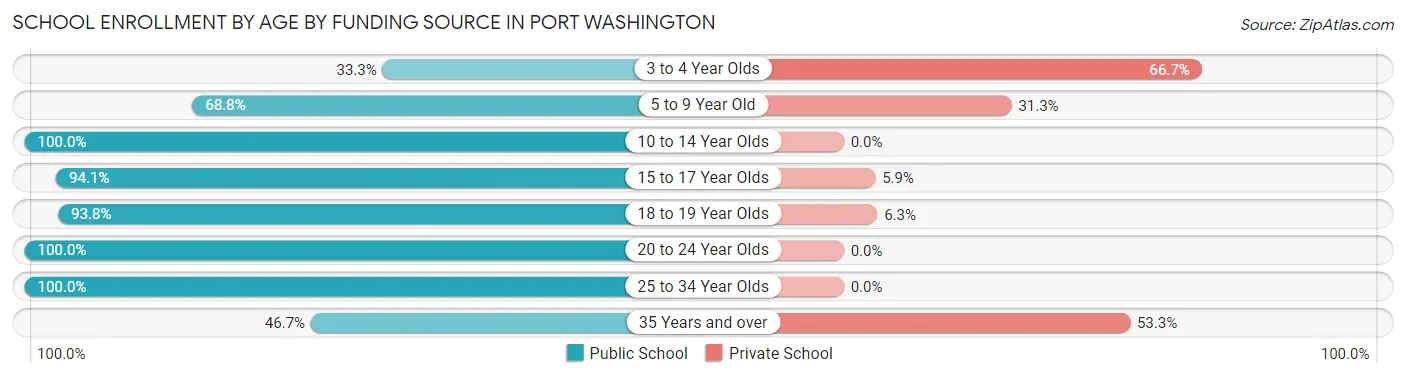
| Age Bracket | Public School | Private School |
| 3 to 4 Year Olds | 3 (33.3%) | 6 (66.7%) |
| 5 to 9 Year Old | 11 (68.8%) | 5 (31.2%) |
| 10 to 14 Year Olds | 57 (100.0%) | 0 (0.0%) |
| 15 to 17 Year Olds | 16 (94.1%) | 1 (5.9%) |
| 18 to 19 Year Olds | 15 (93.8%) | 1 (6.2%) |
| 20 to 24 Year Olds | 8 (100.0%) | 0 (0.0%) |
| 25 to 34 Year Olds | 8 (100.0%) | 0 (0.0%) |
| 35 Years and over | 7 (46.7%) | 8 (53.3%) |
| Total | 125 (85.6%) | 21 (14.4%) |
Educational Attainment by Field of Study in Port Washington
Education (9 | 36.0%), business (4 | 16.0%), arts & humanities (4 | 16.0%), bio, nature & agricultural (2 | 8.0%), and physical & health sciences (2 | 8.0%) are the most common fields of study among 25 individuals in Port Washington who have obtained a bachelor's degree or higher.
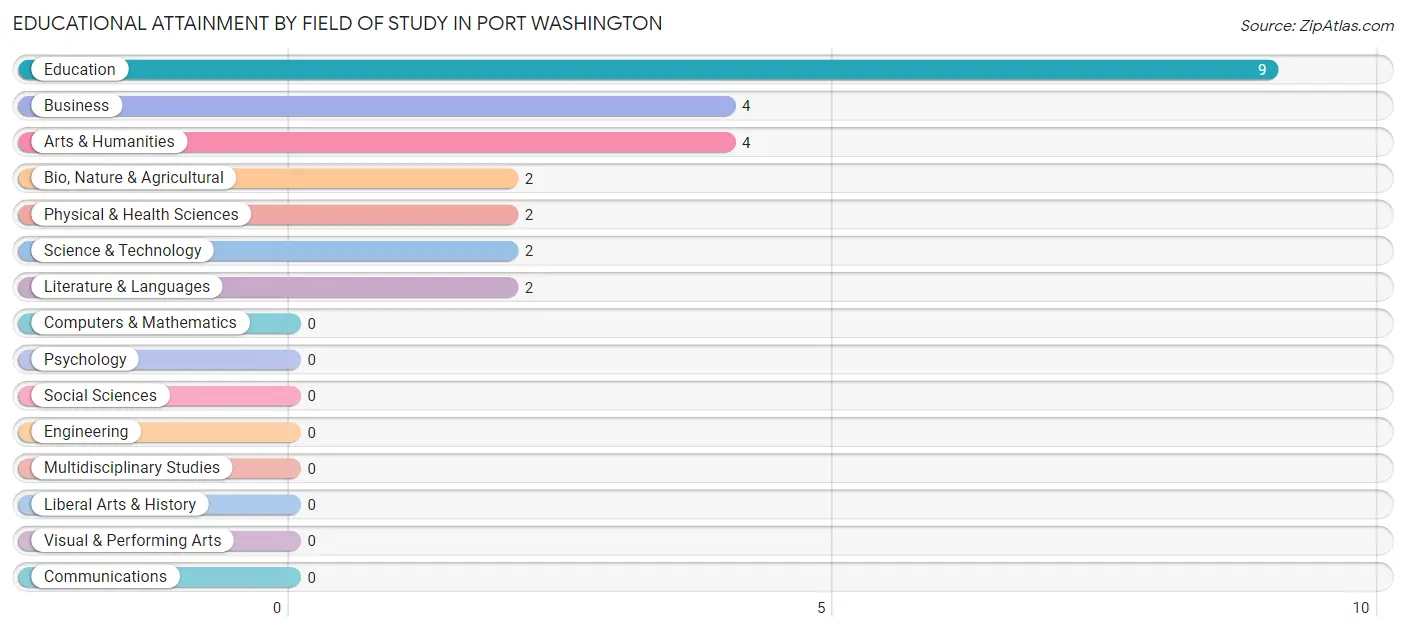
| Field of Study | # Graduates | % Graduates |
| Computers & Mathematics | 0 | 0.0% |
| Bio, Nature & Agricultural | 2 | 8.0% |
| Physical & Health Sciences | 2 | 8.0% |
| Psychology | 0 | 0.0% |
| Social Sciences | 0 | 0.0% |
| Engineering | 0 | 0.0% |
| Multidisciplinary Studies | 0 | 0.0% |
| Science & Technology | 2 | 8.0% |
| Business | 4 | 16.0% |
| Education | 9 | 36.0% |
| Literature & Languages | 2 | 8.0% |
| Liberal Arts & History | 0 | 0.0% |
| Visual & Performing Arts | 0 | 0.0% |
| Communications | 0 | 0.0% |
| Arts & Humanities | 4 | 16.0% |
| Total | 25 | 100.0% |
Transportation & Commute in Port Washington
Vehicle Availability by Sex in Port Washington
The most prevalent vehicle ownership categories in Port Washington are males with 3 vehicles (46, accounting for 32.6%) and females with 3 vehicles (54, making up 36.8%).
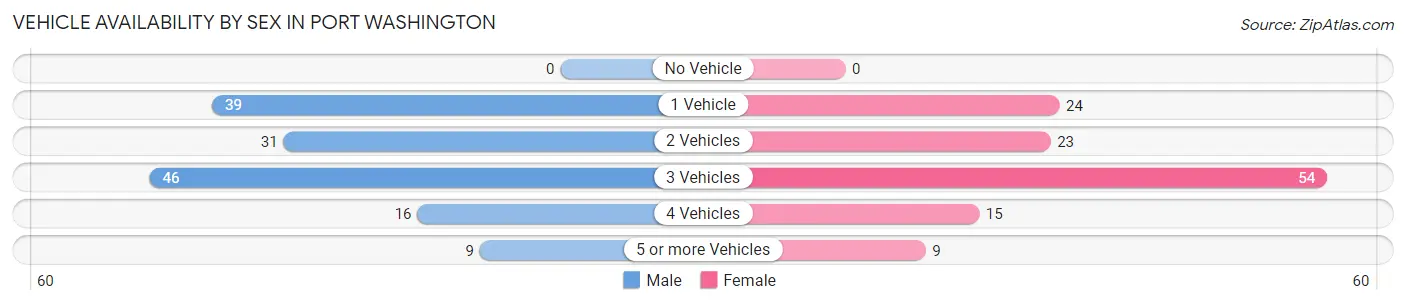
| Vehicles Available | Male | Female |
| No Vehicle | 0 (0.0%) | 0 (0.0%) |
| 1 Vehicle | 39 (27.7%) | 24 (19.2%) |
| 2 Vehicles | 31 (22.0%) | 23 (18.4%) |
| 3 Vehicles | 46 (32.6%) | 54 (43.2%) |
| 4 Vehicles | 16 (11.4%) | 15 (12.0%) |
| 5 or more Vehicles | 9 (6.4%) | 9 (7.2%) |
| Total | 141 (100.0%) | 125 (100.0%) |
Commute Time in Port Washington
The most frequently occuring commute durations in Port Washington are less than 5 minutes (57 commuters, 22.2%), 15 to 19 minutes (41 commuters, 16.0%), and 20 to 24 minutes (33 commuters, 12.8%).
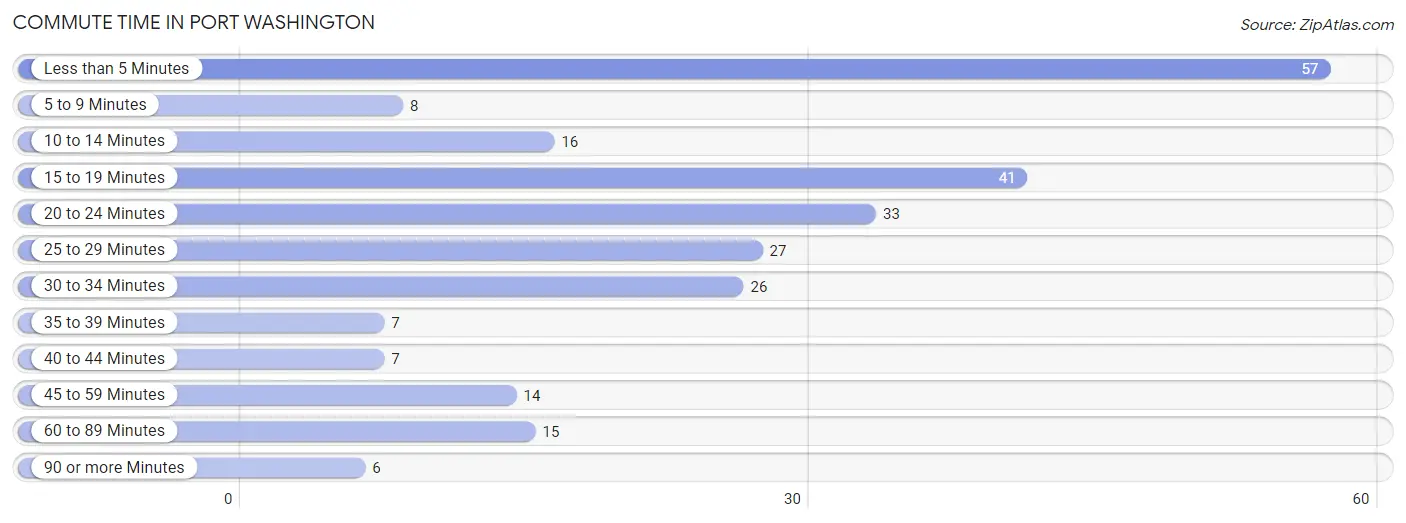
| Commute Time | # Commuters | % Commuters |
| Less than 5 Minutes | 57 | 22.2% |
| 5 to 9 Minutes | 8 | 3.1% |
| 10 to 14 Minutes | 16 | 6.2% |
| 15 to 19 Minutes | 41 | 16.0% |
| 20 to 24 Minutes | 33 | 12.8% |
| 25 to 29 Minutes | 27 | 10.5% |
| 30 to 34 Minutes | 26 | 10.1% |
| 35 to 39 Minutes | 7 | 2.7% |
| 40 to 44 Minutes | 7 | 2.7% |
| 45 to 59 Minutes | 14 | 5.4% |
| 60 to 89 Minutes | 15 | 5.8% |
| 90 or more Minutes | 6 | 2.3% |
Commute Time by Sex in Port Washington
The most common commute times in Port Washington are less than 5 minutes (33 commuters, 23.4%) for males and less than 5 minutes (24 commuters, 20.7%) for females.
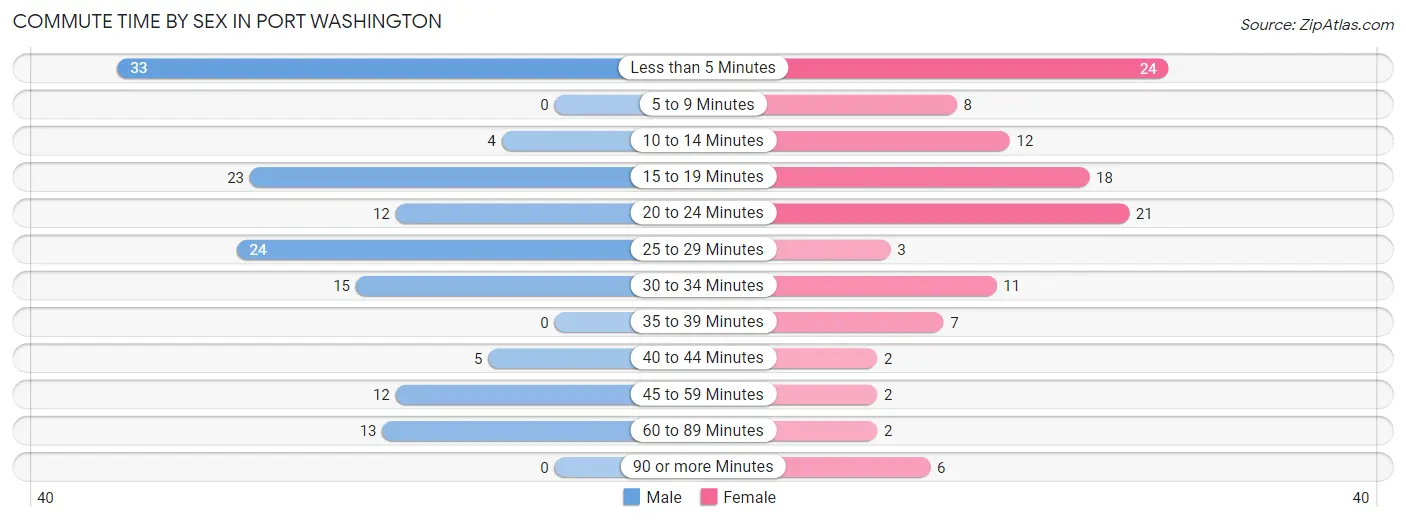
| Commute Time | Male | Female |
| Less than 5 Minutes | 33 (23.4%) | 24 (20.7%) |
| 5 to 9 Minutes | 0 (0.0%) | 8 (6.9%) |
| 10 to 14 Minutes | 4 (2.8%) | 12 (10.3%) |
| 15 to 19 Minutes | 23 (16.3%) | 18 (15.5%) |
| 20 to 24 Minutes | 12 (8.5%) | 21 (18.1%) |
| 25 to 29 Minutes | 24 (17.0%) | 3 (2.6%) |
| 30 to 34 Minutes | 15 (10.6%) | 11 (9.5%) |
| 35 to 39 Minutes | 0 (0.0%) | 7 (6.0%) |
| 40 to 44 Minutes | 5 (3.5%) | 2 (1.7%) |
| 45 to 59 Minutes | 12 (8.5%) | 2 (1.7%) |
| 60 to 89 Minutes | 13 (9.2%) | 2 (1.7%) |
| 90 or more Minutes | 0 (0.0%) | 6 (5.2%) |
Time of Departure to Work by Sex in Port Washington
The most frequent times of departure to work in Port Washington are 6:00 AM to 6:29 AM (31, 22.0%) for males and 6:30 AM to 6:59 AM (25, 21.5%) for females.
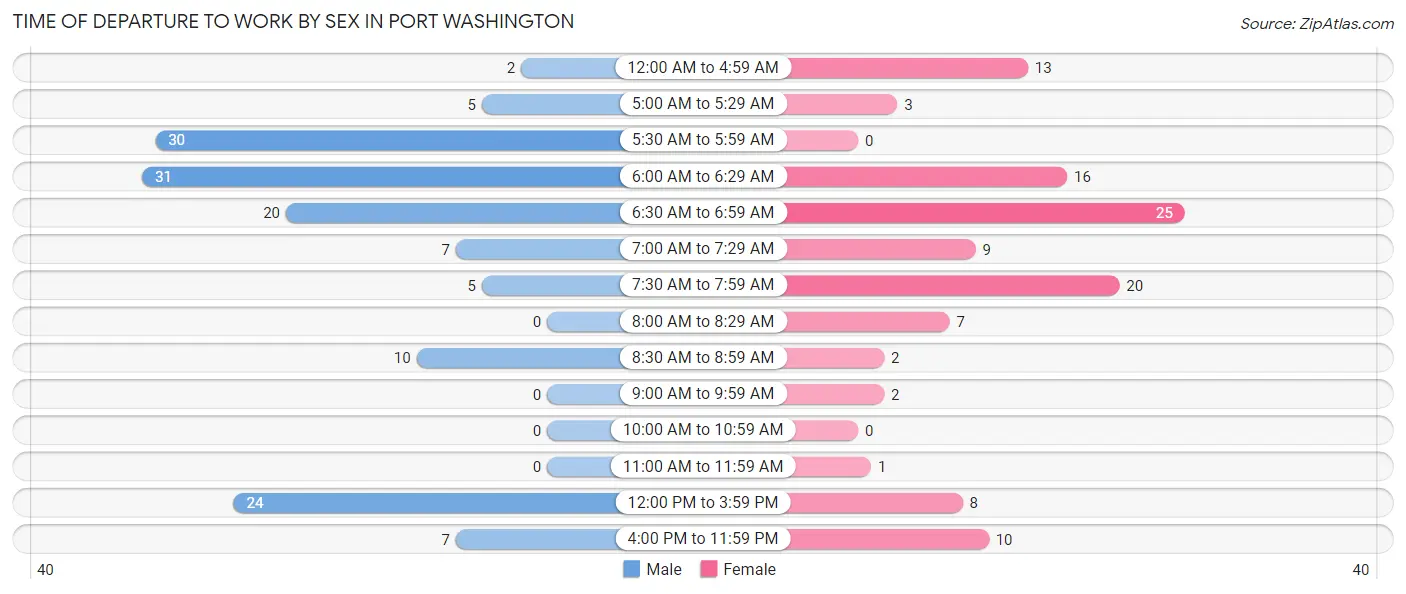
| Time of Departure | Male | Female |
| 12:00 AM to 4:59 AM | 2 (1.4%) | 13 (11.2%) |
| 5:00 AM to 5:29 AM | 5 (3.5%) | 3 (2.6%) |
| 5:30 AM to 5:59 AM | 30 (21.3%) | 0 (0.0%) |
| 6:00 AM to 6:29 AM | 31 (22.0%) | 16 (13.8%) |
| 6:30 AM to 6:59 AM | 20 (14.2%) | 25 (21.5%) |
| 7:00 AM to 7:29 AM | 7 (5.0%) | 9 (7.8%) |
| 7:30 AM to 7:59 AM | 5 (3.5%) | 20 (17.2%) |
| 8:00 AM to 8:29 AM | 0 (0.0%) | 7 (6.0%) |
| 8:30 AM to 8:59 AM | 10 (7.1%) | 2 (1.7%) |
| 9:00 AM to 9:59 AM | 0 (0.0%) | 2 (1.7%) |
| 10:00 AM to 10:59 AM | 0 (0.0%) | 0 (0.0%) |
| 11:00 AM to 11:59 AM | 0 (0.0%) | 1 (0.9%) |
| 12:00 PM to 3:59 PM | 24 (17.0%) | 8 (6.9%) |
| 4:00 PM to 11:59 PM | 7 (5.0%) | 10 (8.6%) |
| Total | 141 (100.0%) | 116 (100.0%) |
Housing Occupancy in Port Washington
Occupancy by Ownership in Port Washington
Of the total 224 dwellings in Port Washington, owner-occupied units account for 179 (79.9%), while renter-occupied units make up 45 (20.1%).
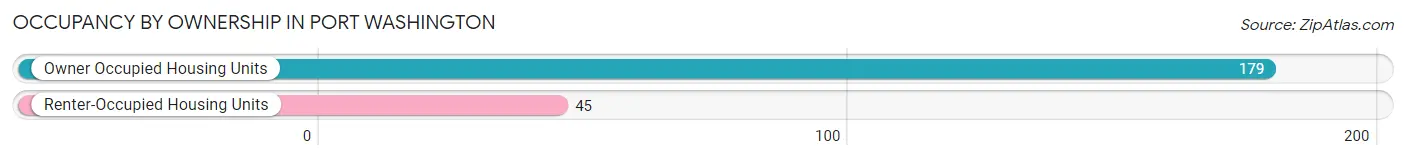
| Occupancy | # Housing Units | % Housing Units |
| Owner Occupied Housing Units | 179 | 79.9% |
| Renter-Occupied Housing Units | 45 | 20.1% |
| Total Occupied Housing Units | 224 | 100.0% |
Occupancy by Household Size in Port Washington
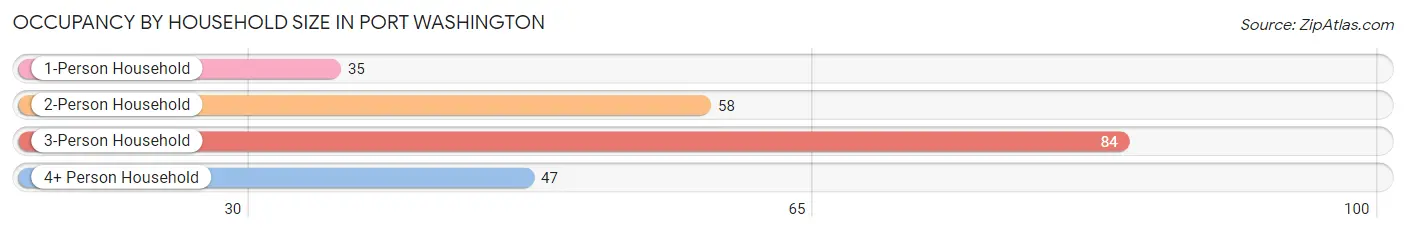
| Household Size | # Housing Units | % Housing Units |
| 1-Person Household | 35 | 15.6% |
| 2-Person Household | 58 | 25.9% |
| 3-Person Household | 84 | 37.5% |
| 4+ Person Household | 47 | 21.0% |
| Total Housing Units | 224 | 100.0% |
Occupancy by Ownership by Household Size in Port Washington
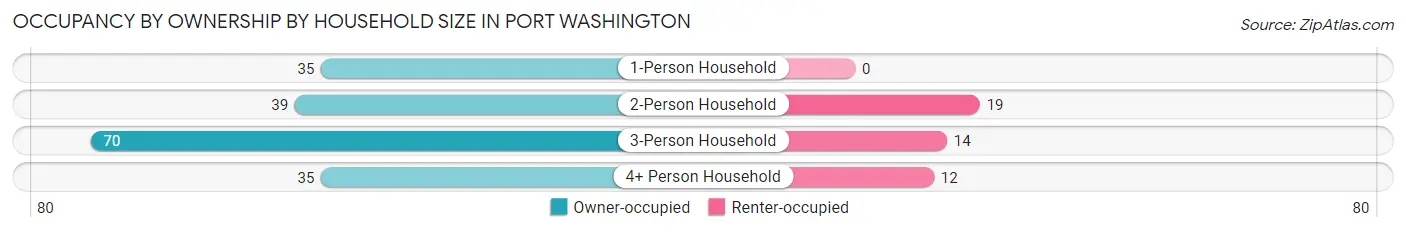
| Household Size | Owner-occupied | Renter-occupied |
| 1-Person Household | 35 (100.0%) | 0 (0.0%) |
| 2-Person Household | 39 (67.2%) | 19 (32.8%) |
| 3-Person Household | 70 (83.3%) | 14 (16.7%) |
| 4+ Person Household | 35 (74.5%) | 12 (25.5%) |
| Total Housing Units | 179 (79.9%) | 45 (20.1%) |
Occupancy by Educational Attainment in Port Washington
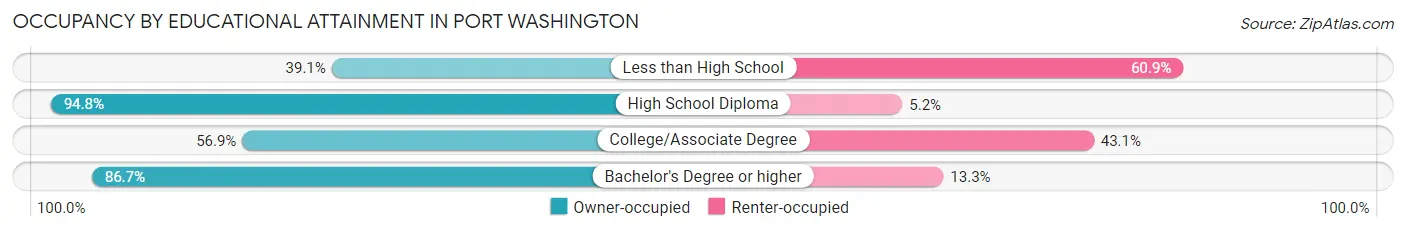
| Household Size | Owner-occupied | Renter-occupied |
| Less than High School | 9 (39.1%) | 14 (60.9%) |
| High School Diploma | 128 (94.8%) | 7 (5.2%) |
| College/Associate Degree | 29 (56.9%) | 22 (43.1%) |
| Bachelor's Degree or higher | 13 (86.7%) | 2 (13.3%) |
Occupancy by Age of Householder in Port Washington
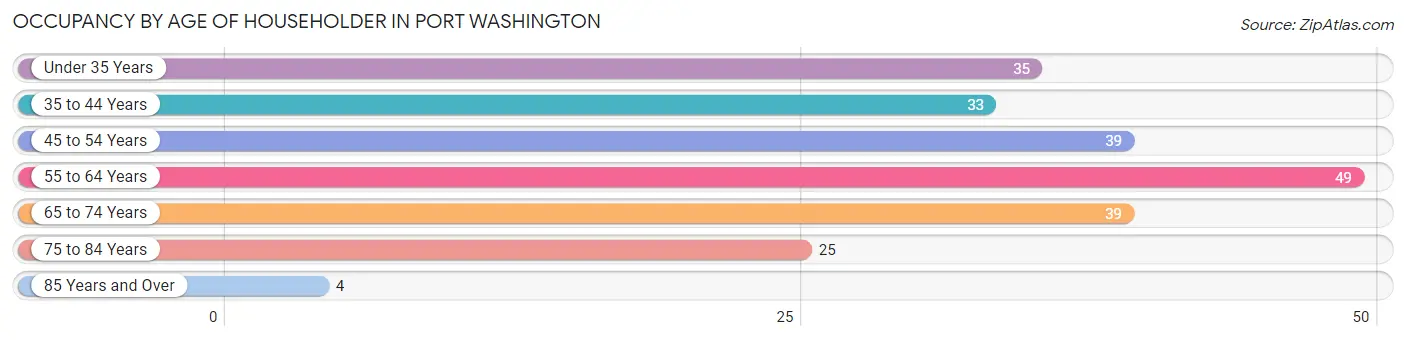
| Age Bracket | # Households | % Households |
| Under 35 Years | 35 | 15.6% |
| 35 to 44 Years | 33 | 14.7% |
| 45 to 54 Years | 39 | 17.4% |
| 55 to 64 Years | 49 | 21.9% |
| 65 to 74 Years | 39 | 17.4% |
| 75 to 84 Years | 25 | 11.2% |
| 85 Years and Over | 4 | 1.8% |
| Total | 224 | 100.0% |
Housing Finances in Port Washington
Median Income by Occupancy in Port Washington
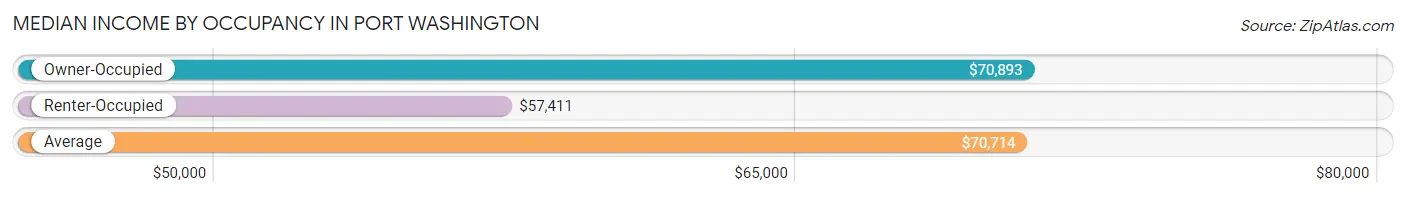
| Occupancy Type | # Households | Median Income |
| Owner-Occupied | 179 (79.9%) | $70,893 |
| Renter-Occupied | 45 (20.1%) | $57,411 |
| Average | 224 (100.0%) | $70,714 |
Occupancy by Householder Income Bracket in Port Washington
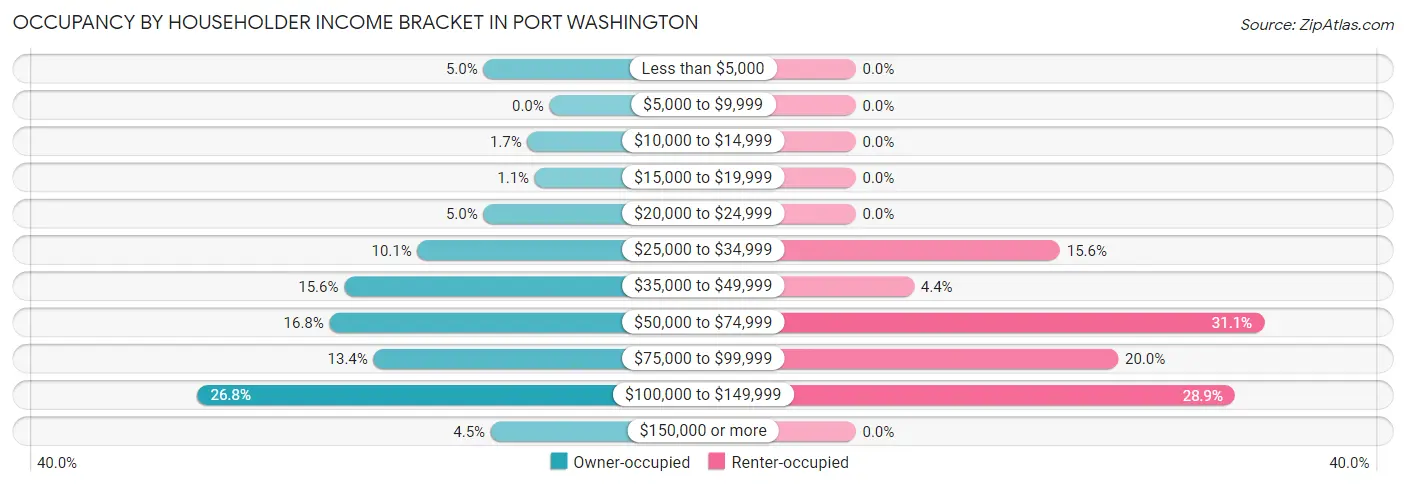
| Income Bracket | Owner-occupied | Renter-occupied |
| Less than $5,000 | 9 (5.0%) | 0 (0.0%) |
| $5,000 to $9,999 | 0 (0.0%) | 0 (0.0%) |
| $10,000 to $14,999 | 3 (1.7%) | 0 (0.0%) |
| $15,000 to $19,999 | 2 (1.1%) | 0 (0.0%) |
| $20,000 to $24,999 | 9 (5.0%) | 0 (0.0%) |
| $25,000 to $34,999 | 18 (10.1%) | 7 (15.6%) |
| $35,000 to $49,999 | 28 (15.6%) | 2 (4.4%) |
| $50,000 to $74,999 | 30 (16.8%) | 14 (31.1%) |
| $75,000 to $99,999 | 24 (13.4%) | 9 (20.0%) |
| $100,000 to $149,999 | 48 (26.8%) | 13 (28.9%) |
| $150,000 or more | 8 (4.5%) | 0 (0.0%) |
| Total | 179 (100.0%) | 45 (100.0%) |
Monthly Housing Cost Tiers in Port Washington
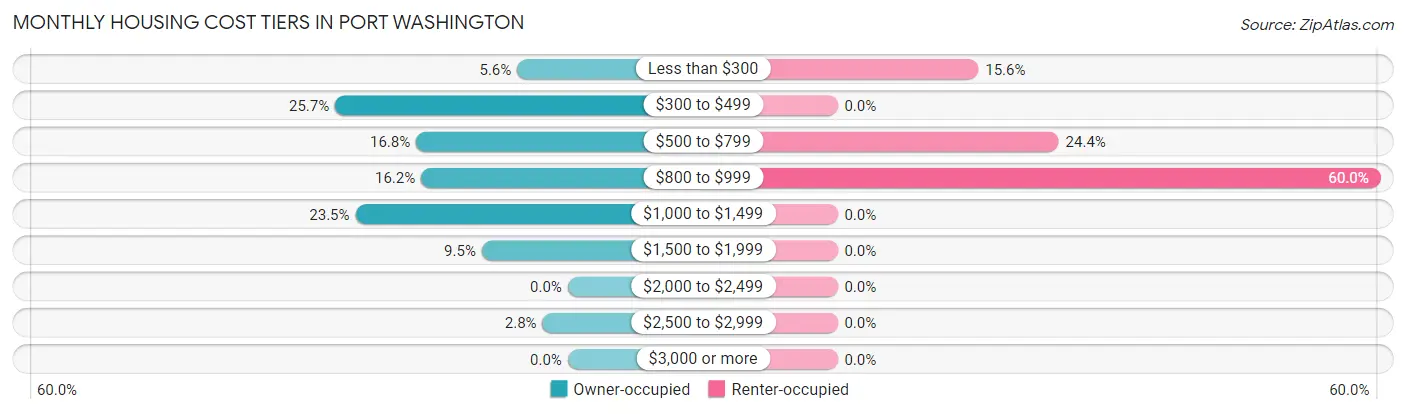
| Monthly Cost | Owner-occupied | Renter-occupied |
| Less than $300 | 10 (5.6%) | 7 (15.6%) |
| $300 to $499 | 46 (25.7%) | 0 (0.0%) |
| $500 to $799 | 30 (16.8%) | 11 (24.4%) |
| $800 to $999 | 29 (16.2%) | 27 (60.0%) |
| $1,000 to $1,499 | 42 (23.5%) | 0 (0.0%) |
| $1,500 to $1,999 | 17 (9.5%) | 0 (0.0%) |
| $2,000 to $2,499 | 0 (0.0%) | 0 (0.0%) |
| $2,500 to $2,999 | 5 (2.8%) | 0 (0.0%) |
| $3,000 or more | 0 (0.0%) | 0 (0.0%) |
| Total | 179 (100.0%) | 45 (100.0%) |
Physical Housing Characteristics in Port Washington
Housing Structures in Port Washington
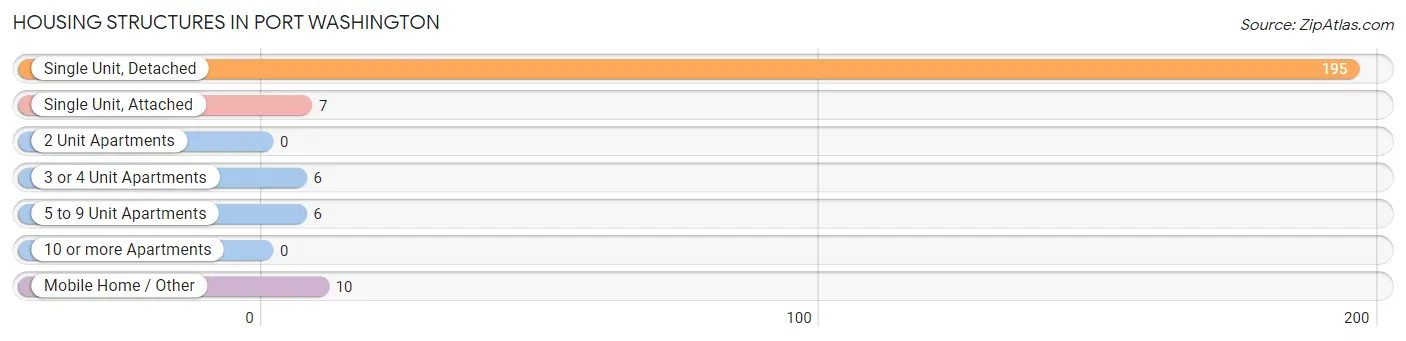
| Structure Type | # Housing Units | % Housing Units |
| Single Unit, Detached | 195 | 87.1% |
| Single Unit, Attached | 7 | 3.1% |
| 2 Unit Apartments | 0 | 0.0% |
| 3 or 4 Unit Apartments | 6 | 2.7% |
| 5 to 9 Unit Apartments | 6 | 2.7% |
| 10 or more Apartments | 0 | 0.0% |
| Mobile Home / Other | 10 | 4.5% |
| Total | 224 | 100.0% |
Housing Structures by Occupancy in Port Washington
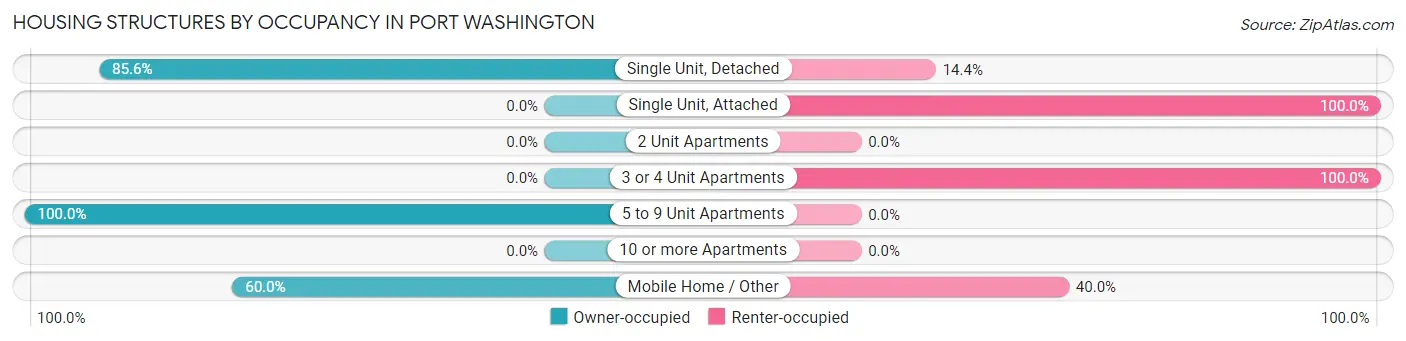
| Structure Type | Owner-occupied | Renter-occupied |
| Single Unit, Detached | 167 (85.6%) | 28 (14.4%) |
| Single Unit, Attached | 0 (0.0%) | 7 (100.0%) |
| 2 Unit Apartments | 0 (0.0%) | 0 (0.0%) |
| 3 or 4 Unit Apartments | 0 (0.0%) | 6 (100.0%) |
| 5 to 9 Unit Apartments | 6 (100.0%) | 0 (0.0%) |
| 10 or more Apartments | 0 (0.0%) | 0 (0.0%) |
| Mobile Home / Other | 6 (60.0%) | 4 (40.0%) |
| Total | 179 (79.9%) | 45 (20.1%) |
Housing Structures by Number of Rooms in Port Washington
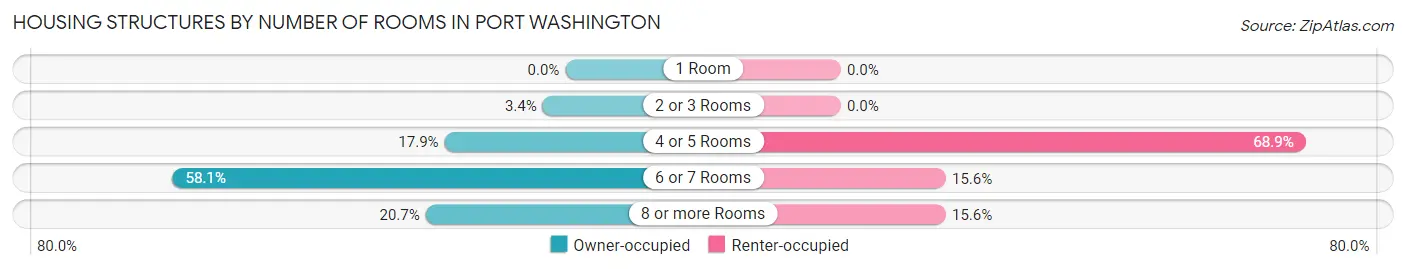
| Number of Rooms | Owner-occupied | Renter-occupied |
| 1 Room | 0 (0.0%) | 0 (0.0%) |
| 2 or 3 Rooms | 6 (3.4%) | 0 (0.0%) |
| 4 or 5 Rooms | 32 (17.9%) | 31 (68.9%) |
| 6 or 7 Rooms | 104 (58.1%) | 7 (15.6%) |
| 8 or more Rooms | 37 (20.7%) | 7 (15.6%) |
| Total | 179 (100.0%) | 45 (100.0%) |
Housing Structure by Heating Type in Port Washington
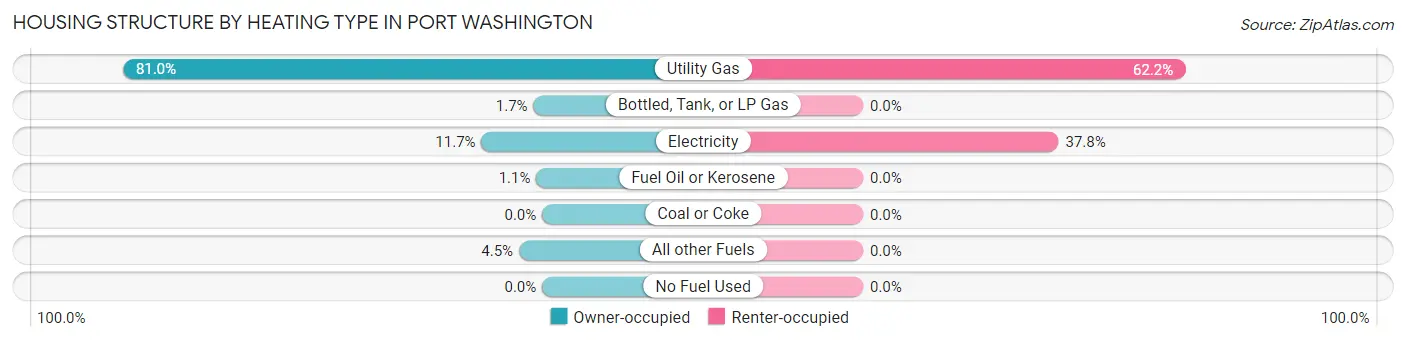
| Heating Type | Owner-occupied | Renter-occupied |
| Utility Gas | 145 (81.0%) | 28 (62.2%) |
| Bottled, Tank, or LP Gas | 3 (1.7%) | 0 (0.0%) |
| Electricity | 21 (11.7%) | 17 (37.8%) |
| Fuel Oil or Kerosene | 2 (1.1%) | 0 (0.0%) |
| Coal or Coke | 0 (0.0%) | 0 (0.0%) |
| All other Fuels | 8 (4.5%) | 0 (0.0%) |
| No Fuel Used | 0 (0.0%) | 0 (0.0%) |
| Total | 179 (100.0%) | 45 (100.0%) |
Household Vehicle Usage in Port Washington
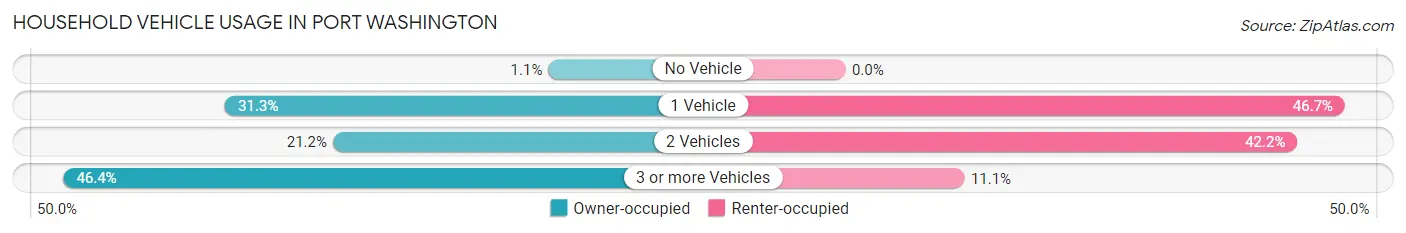
| Vehicles per Household | Owner-occupied | Renter-occupied |
| No Vehicle | 2 (1.1%) | 0 (0.0%) |
| 1 Vehicle | 56 (31.3%) | 21 (46.7%) |
| 2 Vehicles | 38 (21.2%) | 19 (42.2%) |
| 3 or more Vehicles | 83 (46.4%) | 5 (11.1%) |
| Total | 179 (100.0%) | 45 (100.0%) |
Real Estate & Mortgages in Port Washington
Real Estate and Mortgage Overview in Port Washington
| Characteristic | Without Mortgage | With Mortgage |
| Housing Units | 71 | 108 |
| Median Property Value | $102,500 | $108,600 |
| Median Household Income | $39,583 | $8 |
| Monthly Housing Costs | $408 | $0 |
| Real Estate Taxes | $925 | $0 |
Property Value by Mortgage Status in Port Washington
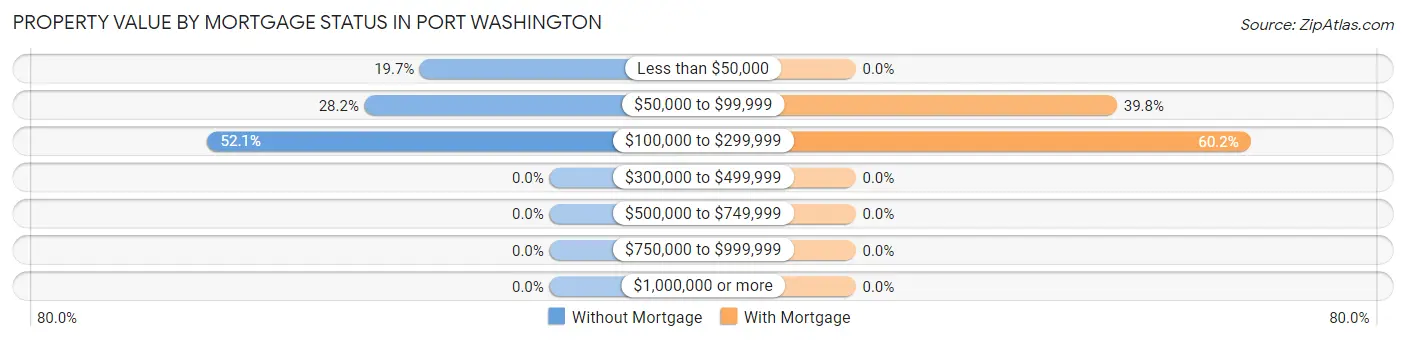
| Property Value | Without Mortgage | With Mortgage |
| Less than $50,000 | 14 (19.7%) | 0 (0.0%) |
| $50,000 to $99,999 | 20 (28.2%) | 43 (39.8%) |
| $100,000 to $299,999 | 37 (52.1%) | 65 (60.2%) |
| $300,000 to $499,999 | 0 (0.0%) | 0 (0.0%) |
| $500,000 to $749,999 | 0 (0.0%) | 0 (0.0%) |
| $750,000 to $999,999 | 0 (0.0%) | 0 (0.0%) |
| $1,000,000 or more | 0 (0.0%) | 0 (0.0%) |
| Total | 71 (100.0%) | 108 (100.0%) |
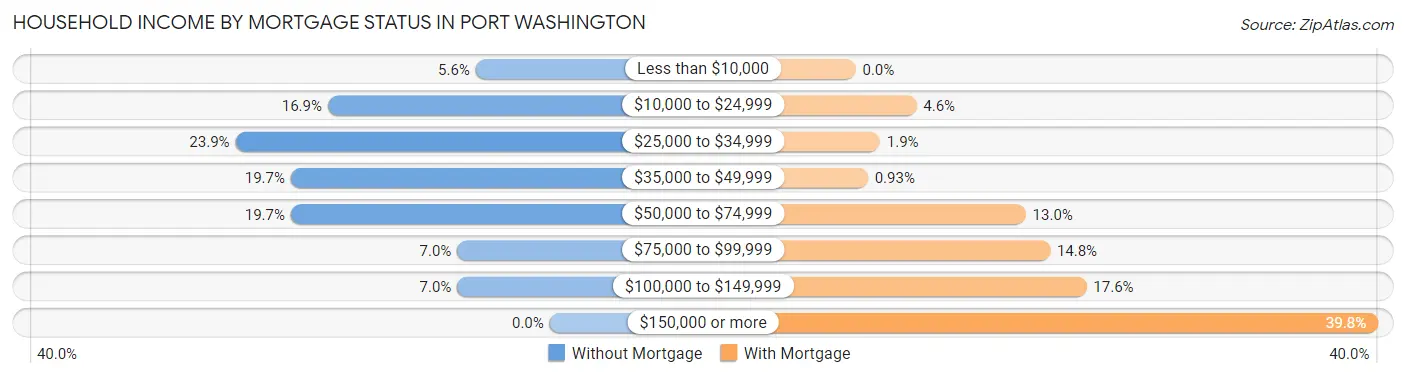
Household Income by Mortgage Status in Port Washington
| Household Income | Without Mortgage | With Mortgage |
| Less than $10,000 | 4 (5.6%) | 0 (0.0%) |
| $10,000 to $24,999 | 12 (16.9%) | 5 (4.6%) |
| $25,000 to $34,999 | 17 (23.9%) | 2 (1.8%) |
| $35,000 to $49,999 | 14 (19.7%) | 1 (0.9%) |
| $50,000 to $74,999 | 14 (19.7%) | 14 (13.0%) |
| $75,000 to $99,999 | 5 (7.0%) | 16 (14.8%) |
| $100,000 to $149,999 | 5 (7.0%) | 19 (17.6%) |
| $150,000 or more | 0 (0.0%) | 43 (39.8%) |
| Total | 71 (100.0%) | 108 (100.0%) |
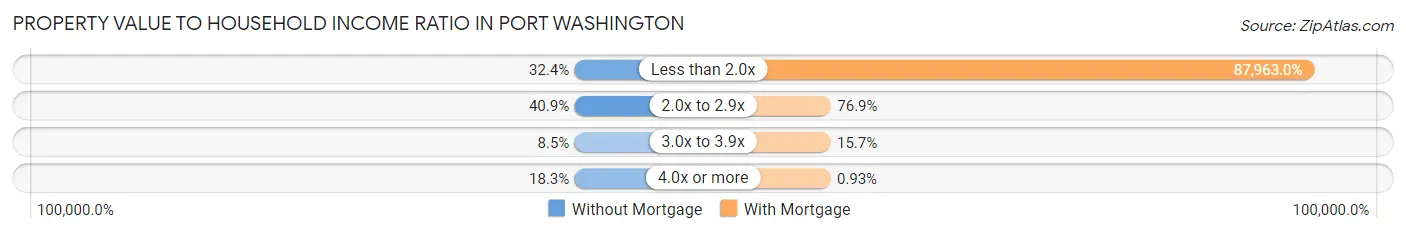
Property Value to Household Income Ratio in Port Washington
| Value-to-Income Ratio | Without Mortgage | With Mortgage |
| Less than 2.0x | 23 (32.4%) | 95,000 (87,963.0%) |
| 2.0x to 2.9x | 29 (40.8%) | 83 (76.8%) |
| 3.0x to 3.9x | 6 (8.5%) | 17 (15.7%) |
| 4.0x or more | 13 (18.3%) | 1 (0.9%) |
| Total | 71 (100.0%) | 108 (100.0%) |
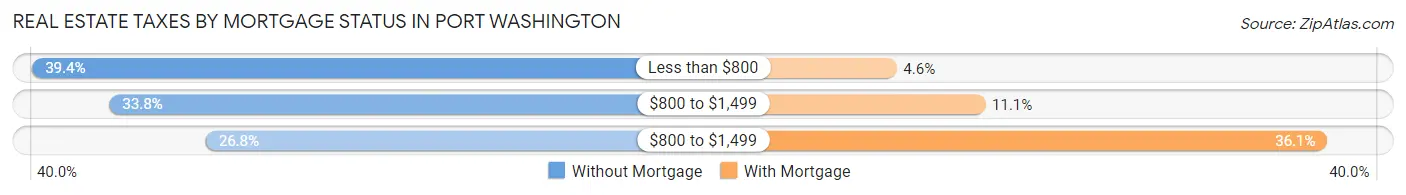
Real Estate Taxes by Mortgage Status in Port Washington
| Property Taxes | Without Mortgage | With Mortgage |
| Less than $800 | 28 (39.4%) | 5 (4.6%) |
| $800 to $1,499 | 24 (33.8%) | 12 (11.1%) |
| $800 to $1,499 | 19 (26.8%) | 39 (36.1%) |
| Total | 71 (100.0%) | 108 (100.0%) |
Health & Disability in Port Washington
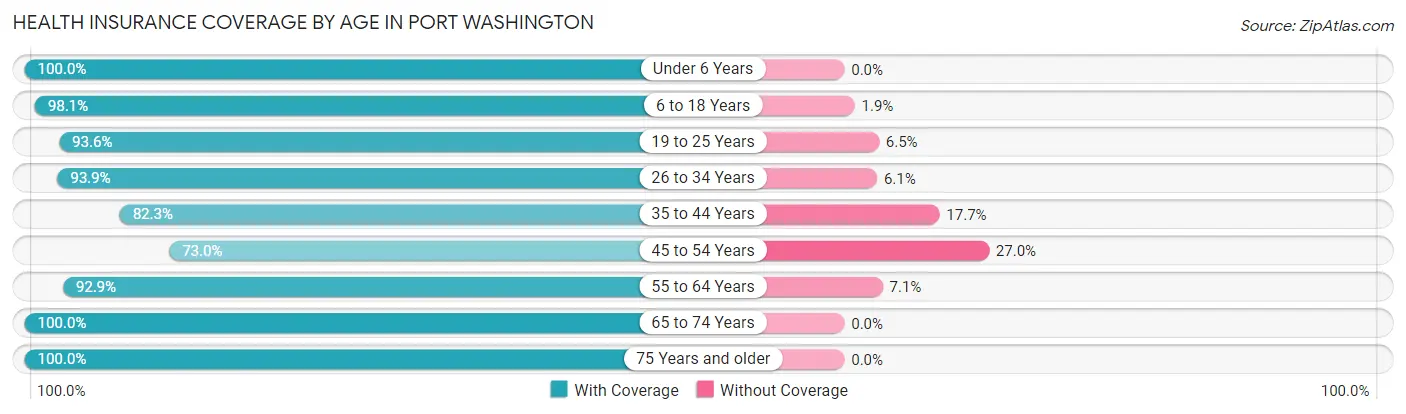
Health Insurance Coverage by Age in Port Washington
| Age Bracket | With Coverage | Without Coverage |
| Under 6 Years | 61 (100.0%) | 0 (0.0%) |
| 6 to 18 Years | 102 (98.1%) | 2 (1.9%) |
| 19 to 25 Years | 29 (93.5%) | 2 (6.5%) |
| 26 to 34 Years | 77 (93.9%) | 5 (6.1%) |
| 35 to 44 Years | 51 (82.3%) | 11 (17.7%) |
| 45 to 54 Years | 65 (73.0%) | 24 (27.0%) |
| 55 to 64 Years | 78 (92.9%) | 6 (7.1%) |
| 65 to 74 Years | 60 (100.0%) | 0 (0.0%) |
| 75 Years and older | 48 (100.0%) | 0 (0.0%) |
| Total | 571 (91.9%) | 50 (8.1%) |
Health Insurance Coverage by Citizenship Status in Port Washington
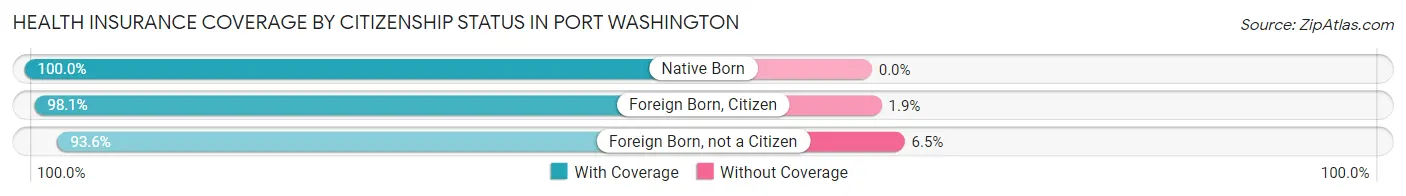
| Citizenship Status | With Coverage | Without Coverage |
| Native Born | 61 (100.0%) | 0 (0.0%) |
| Foreign Born, Citizen | 102 (98.1%) | 2 (1.9%) |
| Foreign Born, not a Citizen | 29 (93.5%) | 2 (6.5%) |
Health Insurance Coverage by Household Income in Port Washington
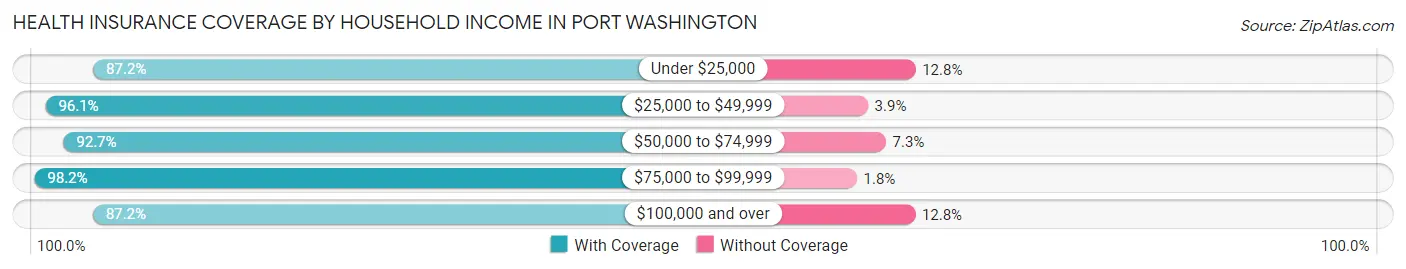
| Household Income | With Coverage | Without Coverage |
| Under $25,000 | 34 (87.2%) | 5 (12.8%) |
| $25,000 to $49,999 | 123 (96.1%) | 5 (3.9%) |
| $50,000 to $74,999 | 102 (92.7%) | 8 (7.3%) |
| $75,000 to $99,999 | 107 (98.2%) | 2 (1.8%) |
| $100,000 and over | 205 (87.2%) | 30 (12.8%) |
Public vs Private Health Insurance Coverage by Age in Port Washington
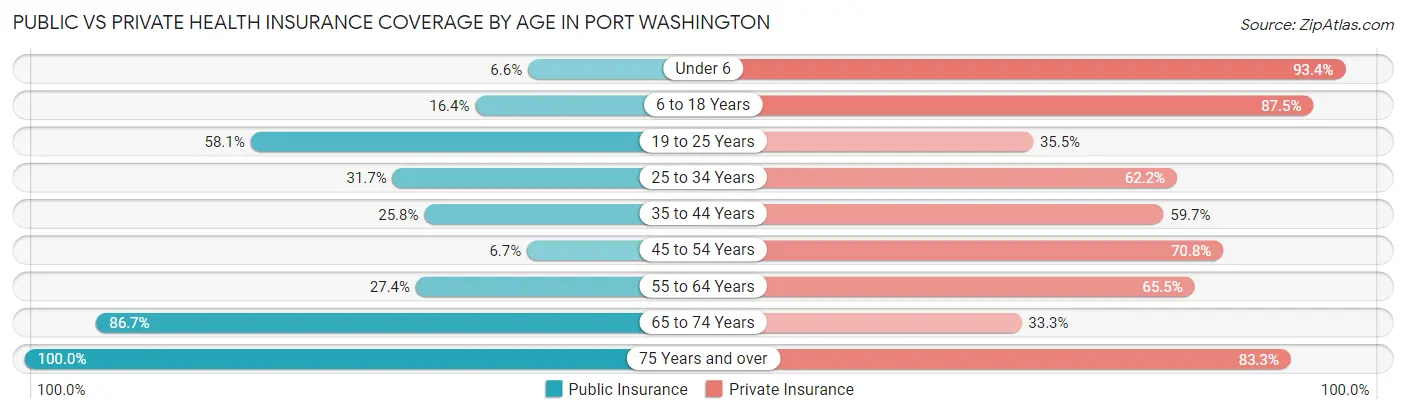
| Age Bracket | Public Insurance | Private Insurance |
| Under 6 | 4 (6.6%) | 57 (93.4%) |
| 6 to 18 Years | 17 (16.4%) | 91 (87.5%) |
| 19 to 25 Years | 18 (58.1%) | 11 (35.5%) |
| 25 to 34 Years | 26 (31.7%) | 51 (62.2%) |
| 35 to 44 Years | 16 (25.8%) | 37 (59.7%) |
| 45 to 54 Years | 6 (6.7%) | 63 (70.8%) |
| 55 to 64 Years | 23 (27.4%) | 55 (65.5%) |
| 65 to 74 Years | 52 (86.7%) | 20 (33.3%) |
| 75 Years and over | 48 (100.0%) | 40 (83.3%) |
| Total | 210 (33.8%) | 425 (68.4%) |
Disability Status by Sex by Age in Port Washington
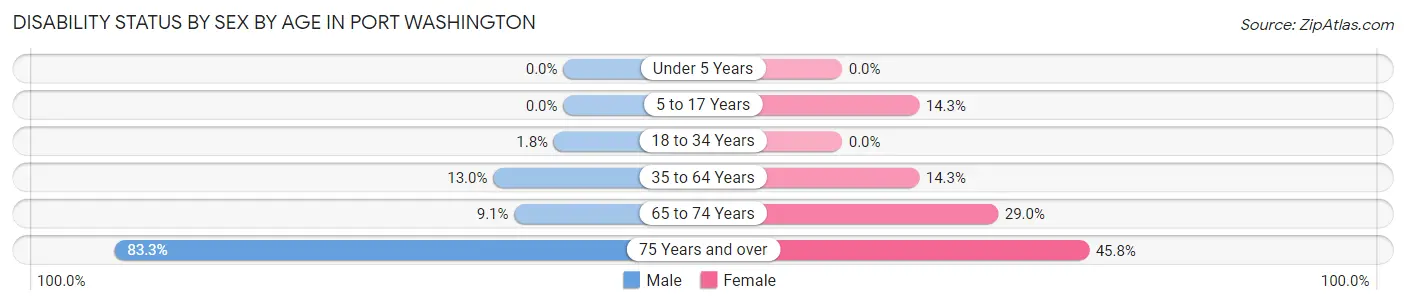
| Age Bracket | Male | Female |
| Under 5 Years | 0 (0.0%) | 0 (0.0%) |
| 5 to 17 Years | 0 (0.0%) | 4 (14.3%) |
| 18 to 34 Years | 1 (1.8%) | 0 (0.0%) |
| 35 to 64 Years | 16 (13.0%) | 16 (14.3%) |
| 65 to 74 Years | 2 (9.1%) | 11 (28.9%) |
| 75 Years and over | 20 (83.3%) | 11 (45.8%) |
Disability Class by Sex by Age in Port Washington
Disability Class: Hearing Difficulty
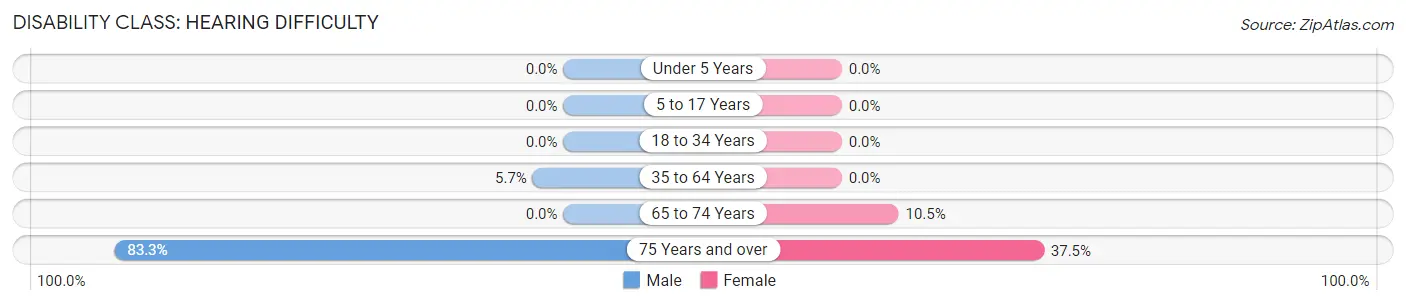
| Age Bracket | Male | Female |
| Under 5 Years | 0 (0.0%) | 0 (0.0%) |
| 5 to 17 Years | 0 (0.0%) | 0 (0.0%) |
| 18 to 34 Years | 0 (0.0%) | 0 (0.0%) |
| 35 to 64 Years | 7 (5.7%) | 0 (0.0%) |
| 65 to 74 Years | 0 (0.0%) | 4 (10.5%) |
| 75 Years and over | 20 (83.3%) | 9 (37.5%) |
Disability Class: Vision Difficulty
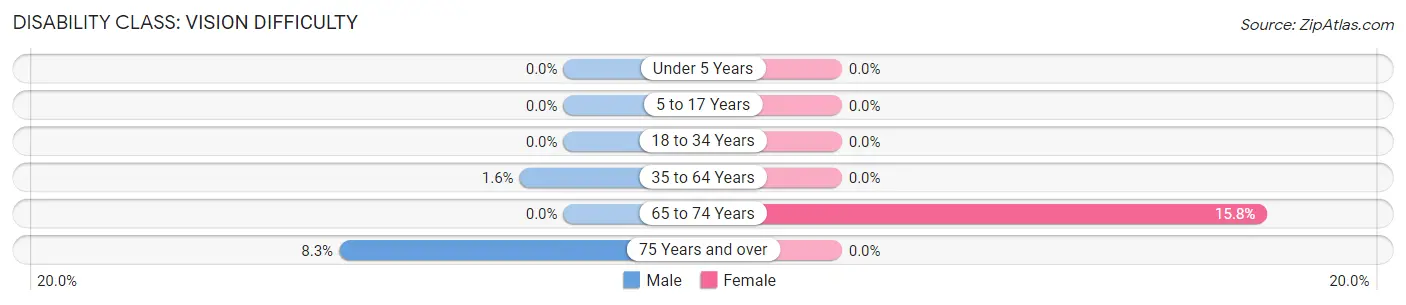
| Age Bracket | Male | Female |
| Under 5 Years | 0 (0.0%) | 0 (0.0%) |
| 5 to 17 Years | 0 (0.0%) | 0 (0.0%) |
| 18 to 34 Years | 0 (0.0%) | 0 (0.0%) |
| 35 to 64 Years | 2 (1.6%) | 0 (0.0%) |
| 65 to 74 Years | 0 (0.0%) | 6 (15.8%) |
| 75 Years and over | 2 (8.3%) | 0 (0.0%) |
Disability Class: Cognitive Difficulty
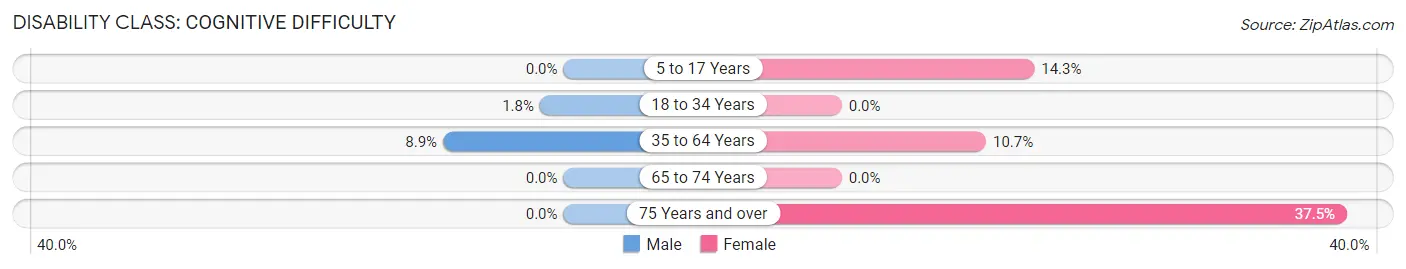
| Age Bracket | Male | Female |
| 5 to 17 Years | 0 (0.0%) | 4 (14.3%) |
| 18 to 34 Years | 1 (1.8%) | 0 (0.0%) |
| 35 to 64 Years | 11 (8.9%) | 12 (10.7%) |
| 65 to 74 Years | 0 (0.0%) | 0 (0.0%) |
| 75 Years and over | 0 (0.0%) | 9 (37.5%) |
Disability Class: Ambulatory Difficulty
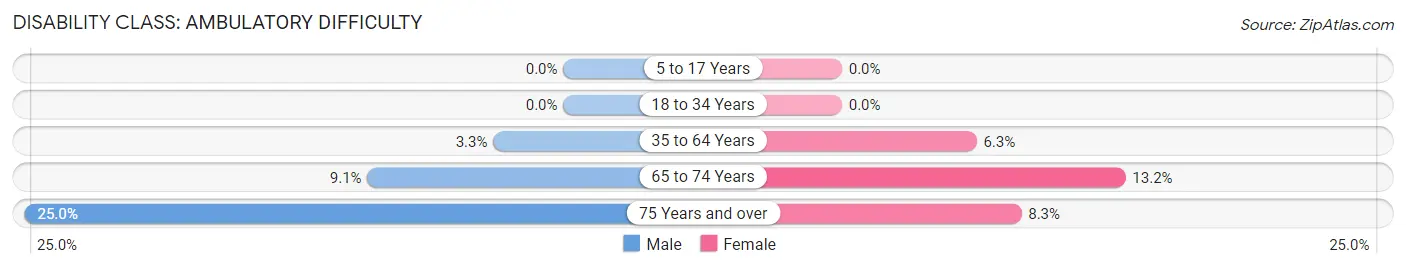
| Age Bracket | Male | Female |
| 5 to 17 Years | 0 (0.0%) | 0 (0.0%) |
| 18 to 34 Years | 0 (0.0%) | 0 (0.0%) |
| 35 to 64 Years | 4 (3.3%) | 7 (6.2%) |
| 65 to 74 Years | 2 (9.1%) | 5 (13.2%) |
| 75 Years and over | 6 (25.0%) | 2 (8.3%) |
Disability Class: Self-Care Difficulty
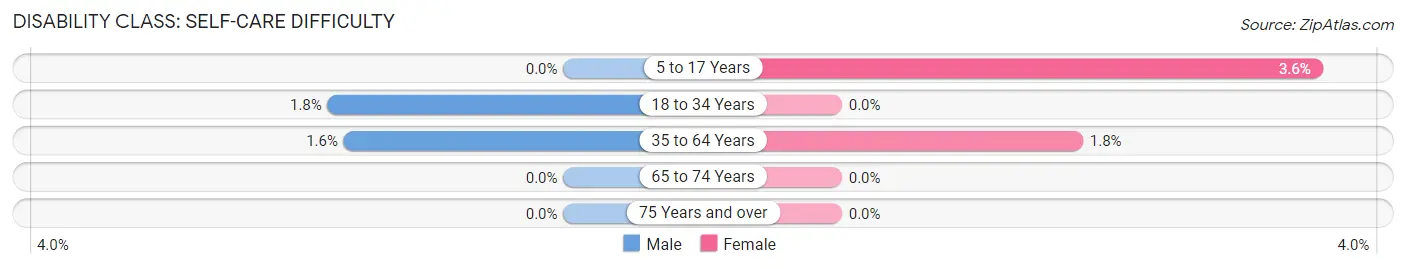
| Age Bracket | Male | Female |
| 5 to 17 Years | 0 (0.0%) | 1 (3.6%) |
| 18 to 34 Years | 1 (1.8%) | 0 (0.0%) |
| 35 to 64 Years | 2 (1.6%) | 2 (1.8%) |
| 65 to 74 Years | 0 (0.0%) | 0 (0.0%) |
| 75 Years and over | 0 (0.0%) | 0 (0.0%) |
Technology Access in Port Washington
Computing Device Access in Port Washington
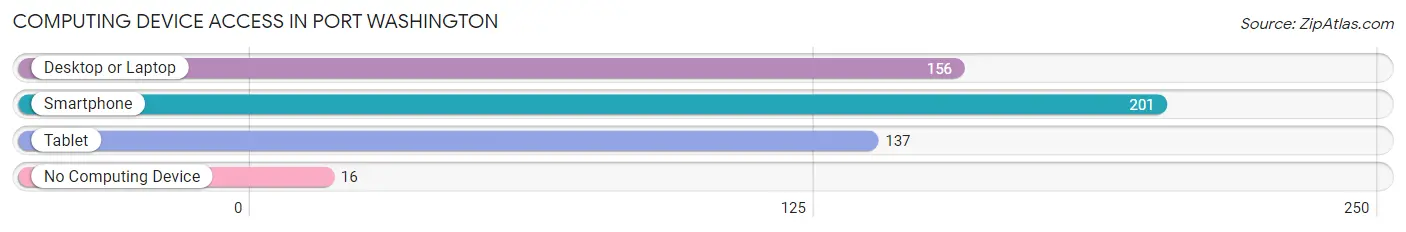
| Device Type | # Households | % Households |
| Desktop or Laptop | 156 | 69.6% |
| Smartphone | 201 | 89.7% |
| Tablet | 137 | 61.2% |
| No Computing Device | 16 | 7.1% |
| Total | 224 | 100.0% |
Internet Access in Port Washington
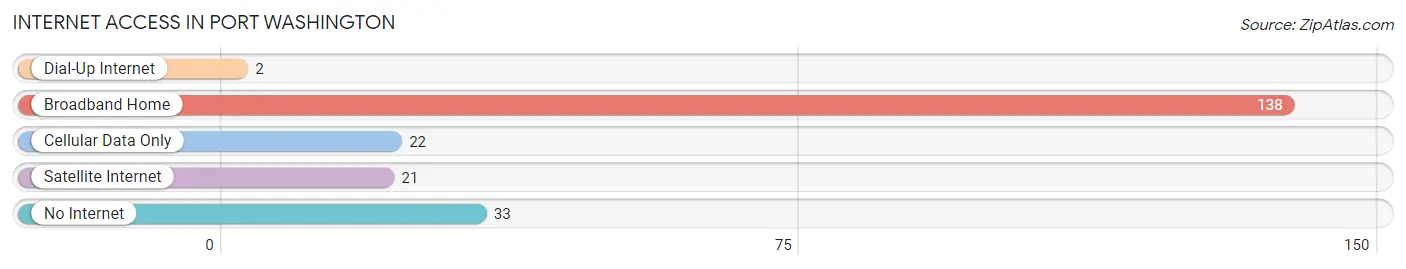
| Internet Type | # Households | % Households |
| Dial-Up Internet | 2 | 0.9% |
| Broadband Home | 138 | 61.6% |
| Cellular Data Only | 22 | 9.8% |
| Satellite Internet | 21 | 9.4% |
| No Internet | 33 | 14.7% |
| Total | 224 | 100.0% |
Port Washington Summary
Port Washington is a small village located in Tuscarawas County, Ohio. It is situated on the banks of the Tuscarawas River, approximately 25 miles east of Canton. The village has a population of approximately 1,000 people and is part of the Dover-New Philadelphia-Cambridge Metropolitan Statistical Area.
History
Port Washington was founded in 1817 by a group of settlers from Pennsylvania. The village was named after the nearby port of Washington, which was located on the Tuscarawas River. The port was used to transport goods and people between the Ohio and Muskingum Rivers.
In 1820, the village was incorporated and the first post office was established. The village grew slowly over the next few decades, with the population reaching just over 500 by the 1880s.
In the late 19th century, the village began to experience a period of growth and development. The railroad arrived in 1887, connecting the village to the larger cities of Canton and New Philadelphia. This allowed for the transportation of goods and people, and helped to spur economic growth.
In the early 20th century, the village continued to grow and develop. The population reached 1,000 by the 1920s, and the village was home to several businesses, including a flour mill, a sawmill, a brickyard, and a furniture factory.
Geography
Port Washington is located in Tuscarawas County, Ohio. It is situated on the banks of the Tuscarawas River, approximately 25 miles east of Canton. The village has a total area of 0.7 square miles, all of which is land.
The village is located in a rural area, with the nearest major city being Canton, which is approximately 25 miles away. The village is surrounded by rolling hills and farmland, and is home to several small lakes and streams.
Economy
The economy of Port Washington is largely based on agriculture and tourism. The village is home to several small businesses, including a grocery store, a hardware store, and a restaurant.
The village is also home to several tourist attractions, including the Port Washington Historical Museum, the Port Washington Lighthouse, and the Port Washington State Park. These attractions draw visitors from all over the region, and help to support the local economy.
Demographics
As of the 2010 census, the population of Port Washington was 1,000. The racial makeup of the village was 97.2% White, 0.7% African American, 0.2% Native American, 0.2% Asian, 0.2% from other races, and 1.7% from two or more races. Hispanic or Latino of any race were 0.7% of the population.
The median household income in Port Washington was $41,250, and the median family income was $50,000. The per capita income for the village was $20,845. About 11.2% of families and 14.2% of the population were below the poverty line, including 18.2% of those under age 18 and 8.3% of those age 65 or over.
Common Questions
What is Per Capita Income in Port Washington?
Per Capita income in Port Washington is $27,390.
What is the Median Family Income in Port Washington?
Median Family Income in Port Washington is $76,875.
What is the Median Household income in Port Washington?
Median Household Income in Port Washington is $70,714.
What is Income or Wage Gap in Port Washington?
Income or Wage Gap in Port Washington is 22.0%.
Women in Port Washington earn 78.0 cents for every dollar earned by a man.
What is Inequality or Gini Index in Port Washington?
Inequality or Gini Index in Port Washington is 0.32.
What is the Total Population of Port Washington?
Total Population of Port Washington is 621.
What is the Total Male Population of Port Washington?
Total Male Population of Port Washington is 338.
What is the Total Female Population of Port Washington?
Total Female Population of Port Washington is 283.
What is the Ratio of Males per 100 Females in Port Washington?
There are 119.43 Males per 100 Females in Port Washington.
What is the Ratio of Females per 100 Males in Port Washington?
There are 83.73 Females per 100 Males in Port Washington.
What is the Median Population Age in Port Washington?
Median Population Age in Port Washington is 39.6 Years.
What is the Average Family Size in Port Washington
Average Family Size in Port Washington is 3.0 People.
What is the Average Household Size in Port Washington
Average Household Size in Port Washington is 2.8 People.
How Large is the Labor Force in Port Washington?
There are 311 People in the Labor Forcein in Port Washington.
What is the Percentage of People in the Labor Force in Port Washington?
65.1% of People are in the Labor Force in Port Washington.
What is the Unemployment Rate in Port Washington?
Unemployment Rate in Port Washington is 10.6%.