Senecaville, OH Map & Demographics
Senecaville Map
Senecaville Overview
$27,244
PER CAPITA INCOME
$53,750
AVG FAMILY INCOME
$48,036
AVG HOUSEHOLD INCOME
43.0%
WAGE / INCOME GAP [ % ]
57.0¢/ $1
WAGE / INCOME GAP [ $ ]
0.39
INEQUALITY / GINI INDEX
449
TOTAL POPULATION
246
MALE POPULATION
203
FEMALE POPULATION
121.18
MALES / 100 FEMALES
82.52
FEMALES / 100 MALES
36.4
MEDIAN AGE
2.5
AVG FAMILY SIZE
2.1
AVG HOUSEHOLD SIZE
215
LABOR FORCE [ PEOPLE ]
57.2%
PERCENT IN LABOR FORCE
4.2%
UNEMPLOYMENT RATE
Senecaville Zip Codes
Senecaville Area Codes
Income in Senecaville
Income Overview in Senecaville
Per Capita Income in Senecaville is $27,244, while median incomes of families and households are $53,750 and $48,036 respectively.
| Characteristic | Number | Measure |
| Per Capita Income | 449 | $27,244 |
| Median Family Income | 131 | $53,750 |
| Mean Family Income | 131 | $63,142 |
| Median Household Income | 209 | $48,036 |
| Mean Household Income | 209 | $56,880 |
| Income Deficit | 131 | $0 |
| Wage / Income Gap (%) | 449 | 43.00% |
| Wage / Income Gap ($) | 449 | 57.00¢ per $1 |
| Gini / Inequality Index | 449 | 0.39 |
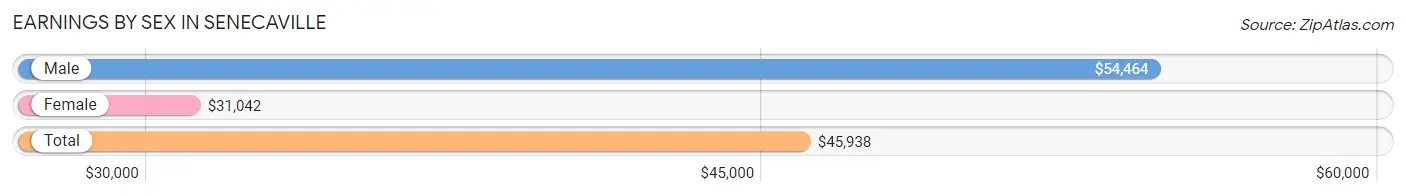
Earnings by Sex in Senecaville
Average Earnings in Senecaville are $45,938, $54,464 for men and $31,042 for women, a difference of 43.0%.
| Sex | Number | Average Earnings |
| Male | 133 (61.0%) | $54,464 |
| Female | 85 (39.0%) | $31,042 |
| Total | 218 (100.0%) | $45,938 |
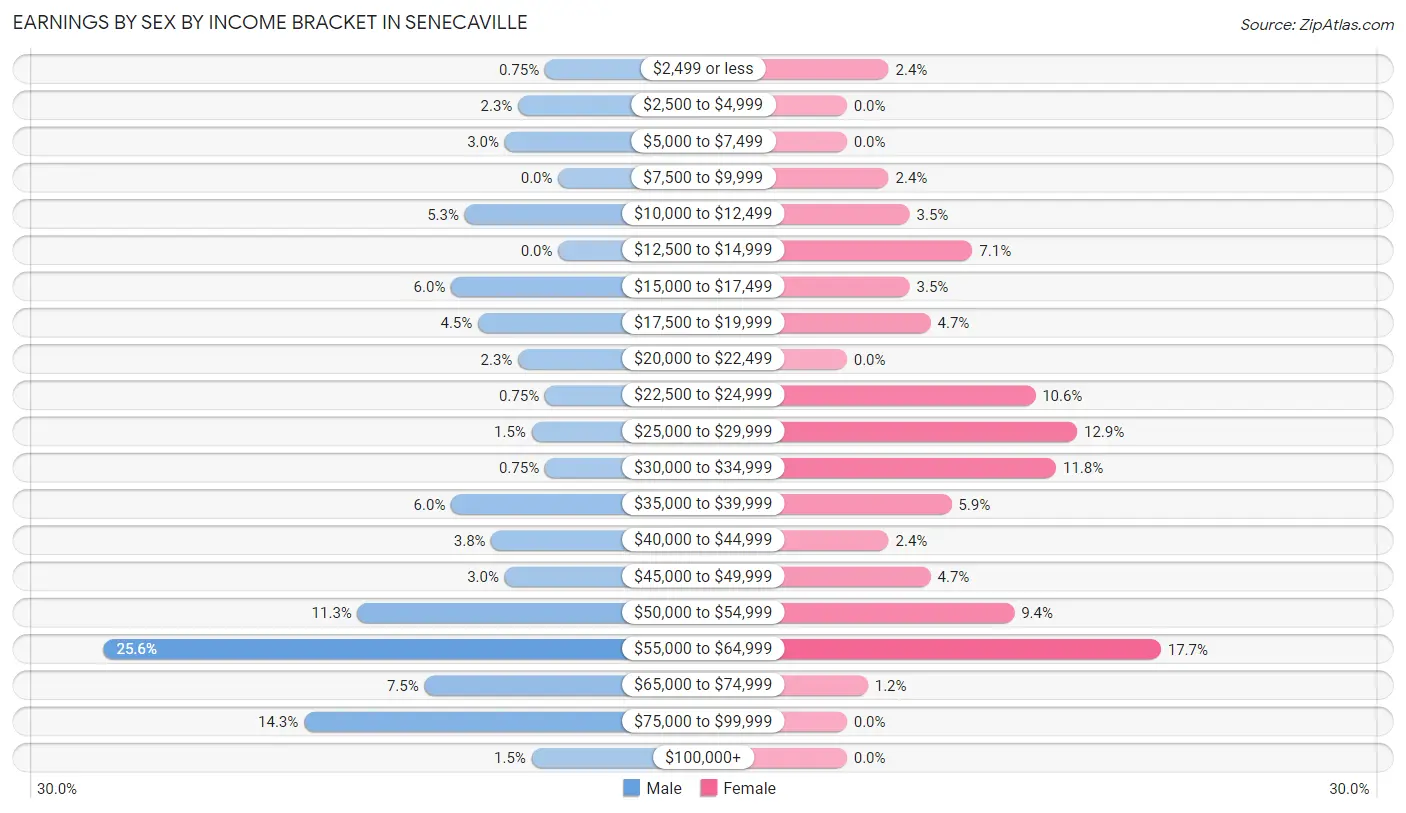
Earnings by Sex by Income Bracket in Senecaville
The most common earnings brackets in Senecaville are $55,000 to $64,999 for men (34 | 25.6%) and $55,000 to $64,999 for women (15 | 17.6%).
| Income | Male | Female |
| $2,499 or less | 1 (0.7%) | 2 (2.4%) |
| $2,500 to $4,999 | 3 (2.3%) | 0 (0.0%) |
| $5,000 to $7,499 | 4 (3.0%) | 0 (0.0%) |
| $7,500 to $9,999 | 0 (0.0%) | 2 (2.4%) |
| $10,000 to $12,499 | 7 (5.3%) | 3 (3.5%) |
| $12,500 to $14,999 | 0 (0.0%) | 6 (7.1%) |
| $15,000 to $17,499 | 8 (6.0%) | 3 (3.5%) |
| $17,500 to $19,999 | 6 (4.5%) | 4 (4.7%) |
| $20,000 to $22,499 | 3 (2.3%) | 0 (0.0%) |
| $22,500 to $24,999 | 1 (0.7%) | 9 (10.6%) |
| $25,000 to $29,999 | 2 (1.5%) | 11 (12.9%) |
| $30,000 to $34,999 | 1 (0.7%) | 10 (11.8%) |
| $35,000 to $39,999 | 8 (6.0%) | 5 (5.9%) |
| $40,000 to $44,999 | 5 (3.8%) | 2 (2.4%) |
| $45,000 to $49,999 | 4 (3.0%) | 4 (4.7%) |
| $50,000 to $54,999 | 15 (11.3%) | 8 (9.4%) |
| $55,000 to $64,999 | 34 (25.6%) | 15 (17.6%) |
| $65,000 to $74,999 | 10 (7.5%) | 1 (1.2%) |
| $75,000 to $99,999 | 19 (14.3%) | 0 (0.0%) |
| $100,000+ | 2 (1.5%) | 0 (0.0%) |
| Total | 133 (100.0%) | 85 (100.0%) |
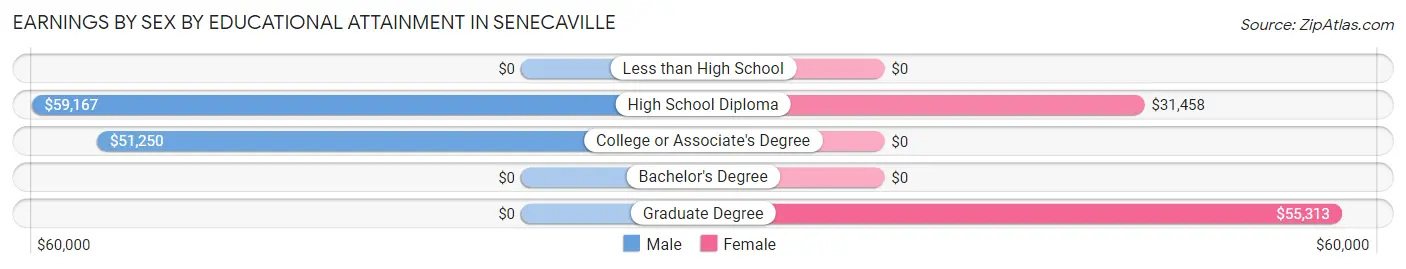
Earnings by Sex by Educational Attainment in Senecaville
Average earnings in Senecaville are $57,500 for men and $35,250 for women, a difference of 38.7%. Men with an educational attainment of high school diploma enjoy the highest average annual earnings of $59,167, while those with college or associate's degree education earn the least with $51,250. Women with an educational attainment of graduate degree earn the most with the average annual earnings of $55,313, while those with high school diploma education have the smallest earnings of $31,458.
| Educational Attainment | Male Income | Female Income |
| Less than High School | - | - |
| High School Diploma | $59,167 | $31,458 |
| College or Associate's Degree | $51,250 | $0 |
| Bachelor's Degree | - | - |
| Graduate Degree | - | - |
| Total | $57,500 | $35,250 |
Family Income in Senecaville
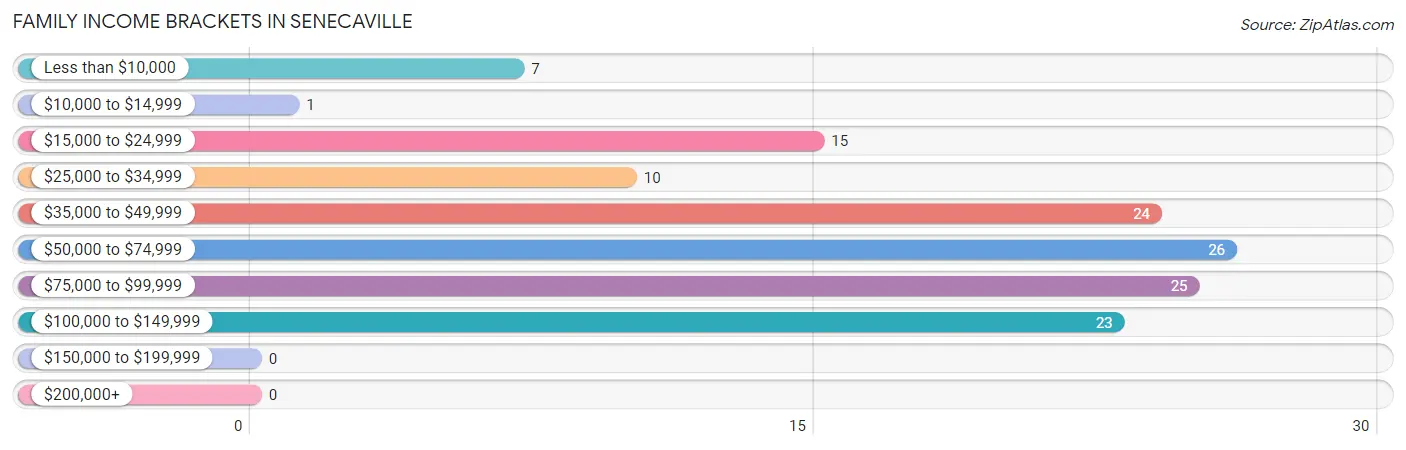
Family Income Brackets in Senecaville
According to the Senecaville family income data, there are 26 families falling into the $50,000 to $74,999 income range, which is the most common income bracket and makes up 19.9% of all families.
| Income Bracket | # Families | % Families |
| Less than $10,000 | 7 | 5.3% |
| $10,000 to $14,999 | 1 | 0.8% |
| $15,000 to $24,999 | 15 | 11.5% |
| $25,000 to $34,999 | 10 | 7.6% |
| $35,000 to $49,999 | 24 | 18.3% |
| $50,000 to $74,999 | 26 | 19.8% |
| $75,000 to $99,999 | 25 | 19.1% |
| $100,000 to $149,999 | 23 | 17.6% |
| $150,000 to $199,999 | 0 | 0.0% |
| $200,000+ | 0 | 0.0% |
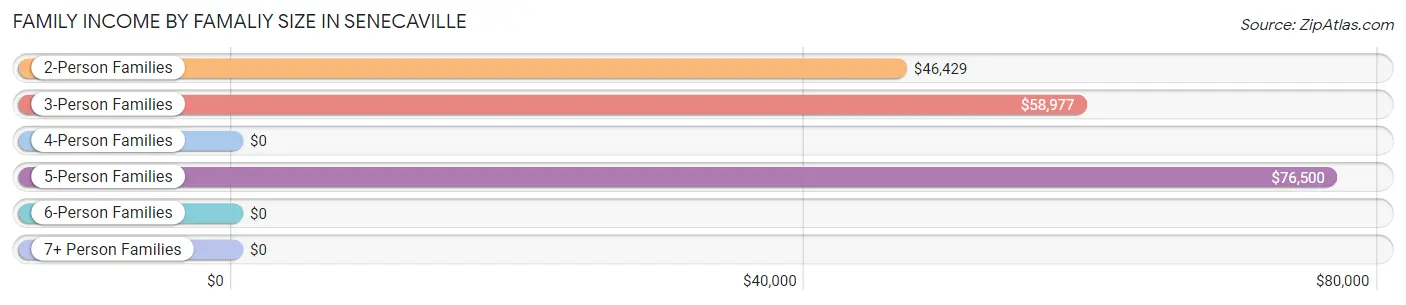
Family Income by Famaliy Size in Senecaville
5-person families (12 | 9.2%) account for the highest median family income in Senecaville with $76,500 per family, while 2-person families (76 | 58.0%) have the highest median income of $23,214 per family member.
| Income Bracket | # Families | Median Income |
| 2-Person Families | 76 (58.0%) | $46,429 |
| 3-Person Families | 37 (28.2%) | $58,977 |
| 4-Person Families | 6 (4.6%) | $0 |
| 5-Person Families | 12 (9.2%) | $76,500 |
| 6-Person Families | 0 (0.0%) | $0 |
| 7+ Person Families | 0 (0.0%) | $0 |
| Total | 131 (100.0%) | $53,750 |
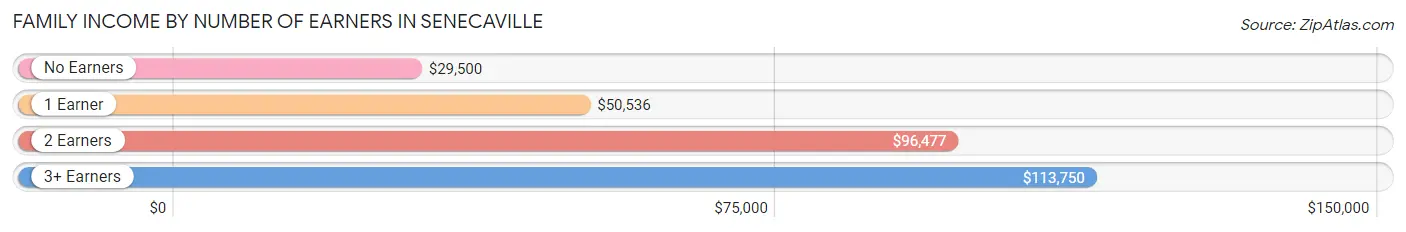
Family Income by Number of Earners in Senecaville
The median family income in Senecaville is $53,750, with families comprising 3+ earners (9) having the highest median family income of $113,750, while families with no earners (30) have the lowest median family income of $29,500, accounting for 6.9% and 22.9% of families, respectively.
| Number of Earners | # Families | Median Income |
| No Earners | 30 (22.9%) | $29,500 |
| 1 Earner | 61 (46.6%) | $50,536 |
| 2 Earners | 31 (23.7%) | $96,477 |
| 3+ Earners | 9 (6.9%) | $113,750 |
| Total | 131 (100.0%) | $53,750 |
Household Income in Senecaville
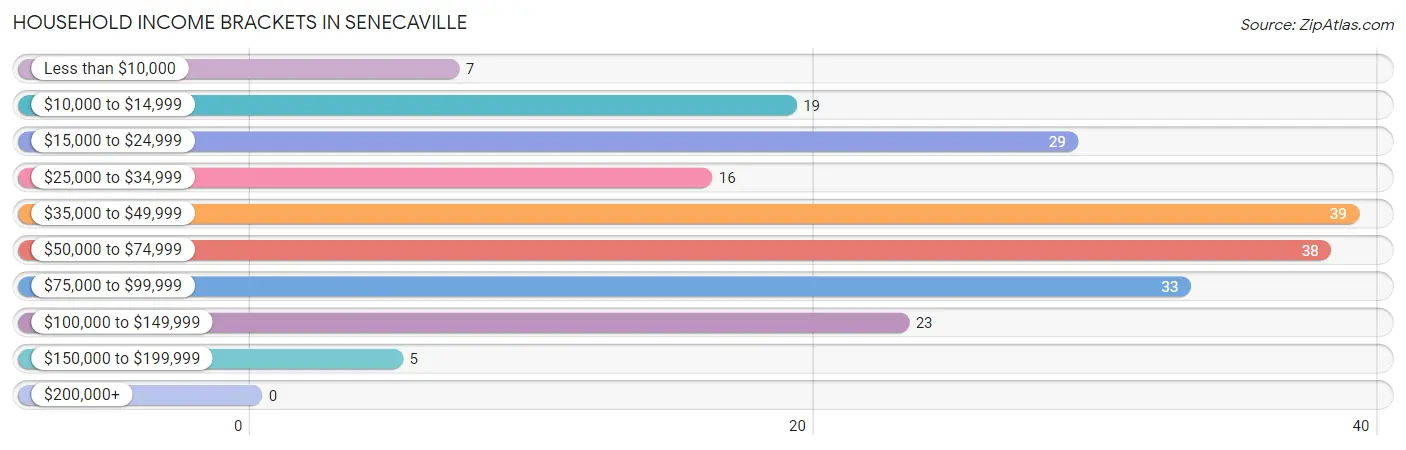
Household Income Brackets in Senecaville
With 39 households falling in the category, the $35,000 to $49,999 income range is the most frequent in Senecaville, accounting for 18.7% of all households.
| Income Bracket | # Households | % Households |
| Less than $10,000 | 7 | 3.3% |
| $10,000 to $14,999 | 19 | 9.1% |
| $15,000 to $24,999 | 29 | 13.9% |
| $25,000 to $34,999 | 16 | 7.7% |
| $35,000 to $49,999 | 39 | 18.7% |
| $50,000 to $74,999 | 38 | 18.2% |
| $75,000 to $99,999 | 33 | 15.8% |
| $100,000 to $149,999 | 23 | 11.0% |
| $150,000 to $199,999 | 5 | 2.4% |
| $200,000+ | 0 | 0.0% |
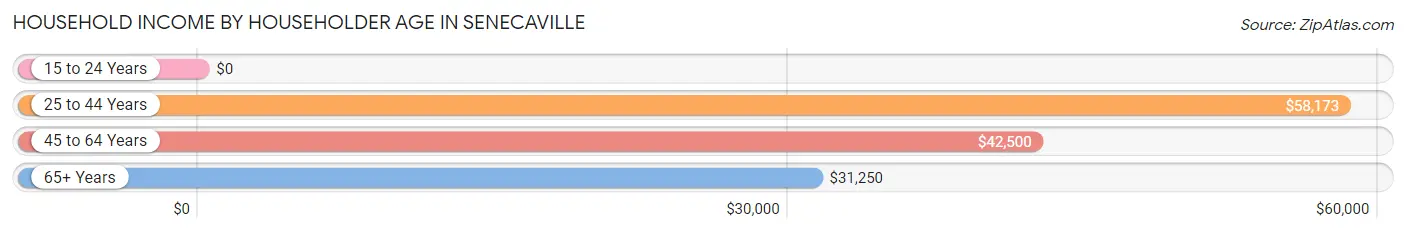
Household Income by Householder Age in Senecaville
The median household income in Senecaville is $48,036, with the highest median household income of $58,173 found in the 25 to 44 years age bracket for the primary householder. A total of 81 households (38.8%) fall into this category. Meanwhile, the 15 to 24 years age bracket for the primary householder has the lowest median household income of $0, with 2 households (1.0%) in this group.
| Income Bracket | # Households | Median Income |
| 15 to 24 Years | 2 (1.0%) | $0 |
| 25 to 44 Years | 81 (38.8%) | $58,173 |
| 45 to 64 Years | 78 (37.3%) | $42,500 |
| 65+ Years | 48 (23.0%) | $31,250 |
| Total | 209 (100.0%) | $48,036 |
Poverty in Senecaville
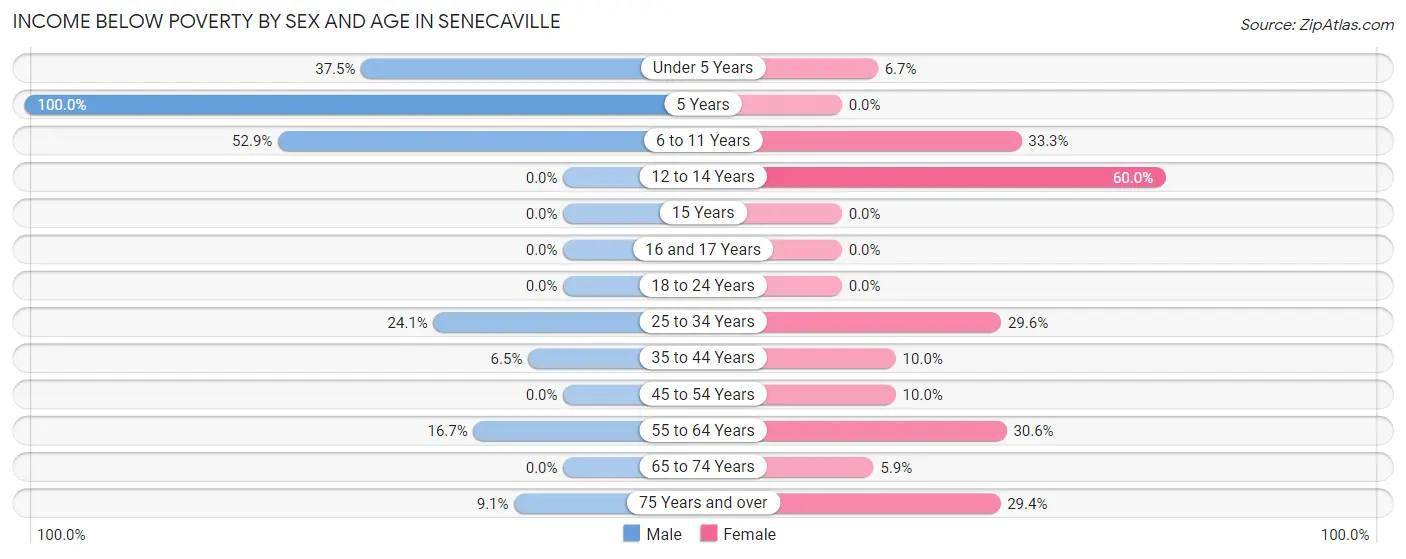
Income Below Poverty by Sex and Age in Senecaville
With 16.3% poverty level for males and 19.2% for females among the residents of Senecaville, 5 year old males and 12 to 14 year old females are the most vulnerable to poverty, with 6 males (100.0%) and 3 females (60.0%) in their respective age groups living below the poverty level.
| Age Bracket | Male | Female |
| Under 5 Years | 3 (37.5%) | 1 (6.7%) |
| 5 Years | 6 (100.0%) | 0 (0.0%) |
| 6 to 11 Years | 9 (52.9%) | 2 (33.3%) |
| 12 to 14 Years | 0 (0.0%) | 3 (60.0%) |
| 15 Years | 0 (0.0%) | 0 (0.0%) |
| 16 and 17 Years | 0 (0.0%) | 0 (0.0%) |
| 18 to 24 Years | 0 (0.0%) | 0 (0.0%) |
| 25 to 34 Years | 13 (24.1%) | 13 (29.5%) |
| 35 to 44 Years | 3 (6.5%) | 1 (10.0%) |
| 45 to 54 Years | 0 (0.0%) | 2 (10.0%) |
| 55 to 64 Years | 5 (16.7%) | 11 (30.6%) |
| 65 to 74 Years | 0 (0.0%) | 1 (5.9%) |
| 75 Years and over | 1 (9.1%) | 5 (29.4%) |
| Total | 40 (16.3%) | 39 (19.2%) |
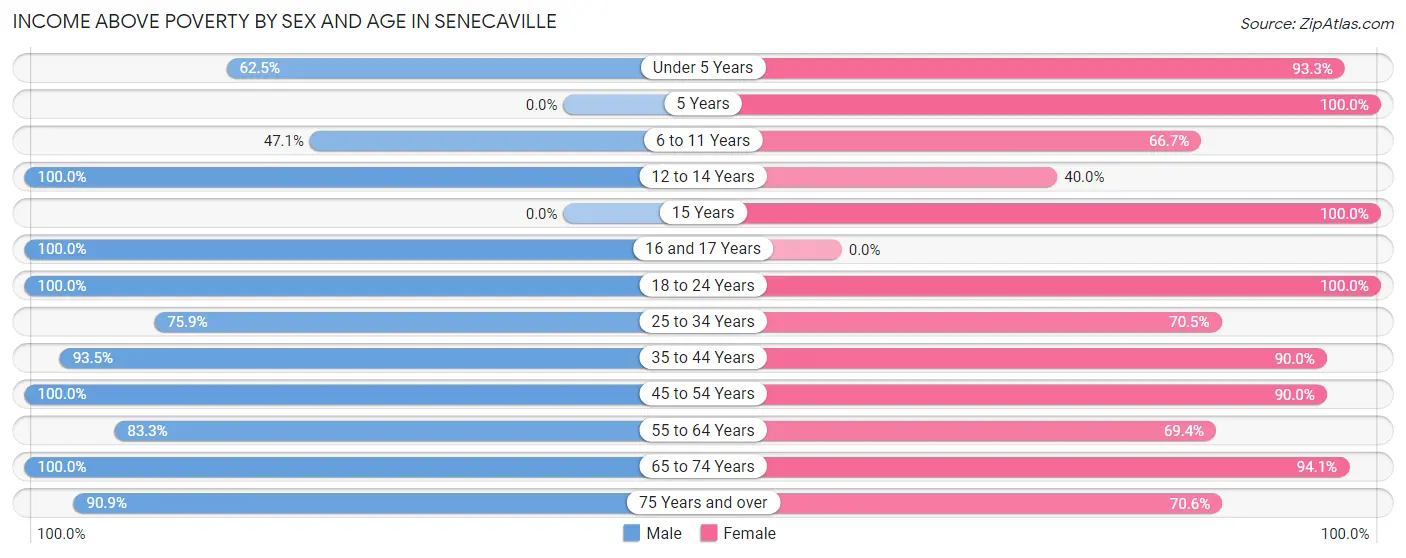
Income Above Poverty by Sex and Age in Senecaville
According to the poverty statistics in Senecaville, males aged 12 to 14 years and females aged 5 years are the age groups that are most secure financially, with 100.0% of males and 100.0% of females in these age groups living above the poverty line.
| Age Bracket | Male | Female |
| Under 5 Years | 5 (62.5%) | 14 (93.3%) |
| 5 Years | 0 (0.0%) | 1 (100.0%) |
| 6 to 11 Years | 8 (47.1%) | 4 (66.7%) |
| 12 to 14 Years | 10 (100.0%) | 2 (40.0%) |
| 15 Years | 0 (0.0%) | 5 (100.0%) |
| 16 and 17 Years | 6 (100.0%) | 0 (0.0%) |
| 18 to 24 Years | 7 (100.0%) | 27 (100.0%) |
| 25 to 34 Years | 41 (75.9%) | 31 (70.5%) |
| 35 to 44 Years | 43 (93.5%) | 9 (90.0%) |
| 45 to 54 Years | 18 (100.0%) | 18 (90.0%) |
| 55 to 64 Years | 25 (83.3%) | 25 (69.4%) |
| 65 to 74 Years | 33 (100.0%) | 16 (94.1%) |
| 75 Years and over | 10 (90.9%) | 12 (70.6%) |
| Total | 206 (83.7%) | 164 (80.8%) |
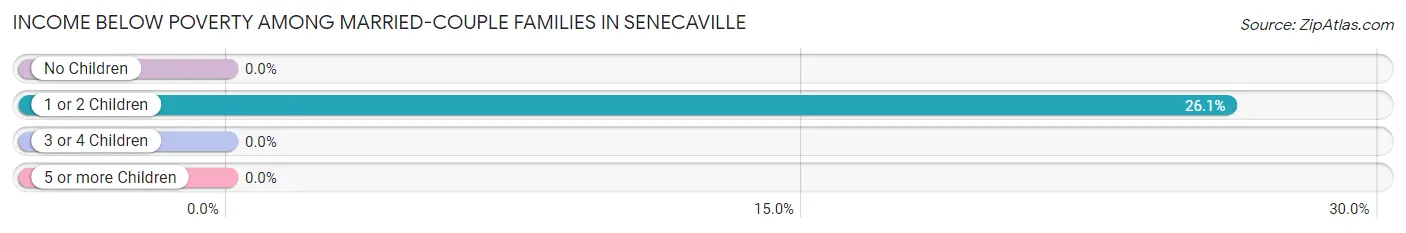
Income Below Poverty Among Married-Couple Families in Senecaville
The poverty statistics for married-couple families in Senecaville show that 6.8% or 6 of the total 88 families live below the poverty line. Families with 1 or 2 children have the highest poverty rate of 26.1%, comprising of 6 families. On the other hand, families with no children have the lowest poverty rate of 0.0%, which includes 0 families.
| Children | Above Poverty | Below Poverty |
| No Children | 61 (100.0%) | 0 (0.0%) |
| 1 or 2 Children | 17 (73.9%) | 6 (26.1%) |
| 3 or 4 Children | 4 (100.0%) | 0 (0.0%) |
| 5 or more Children | 0 (0.0%) | 0 (0.0%) |
| Total | 82 (93.2%) | 6 (6.8%) |
Income Below Poverty Among Single-Parent Households in Senecaville
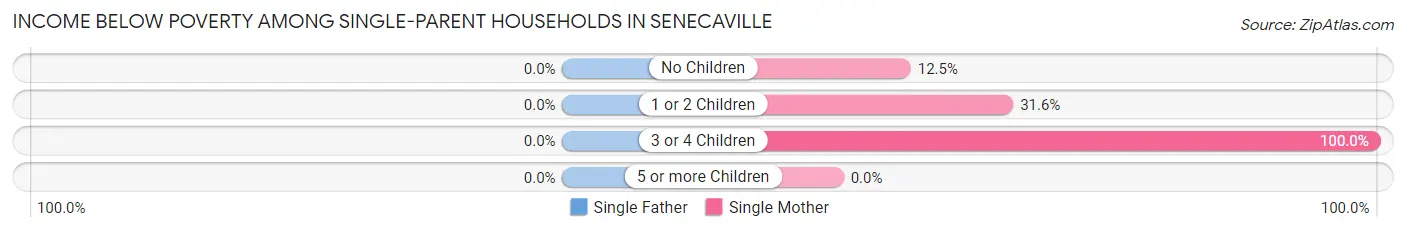
| Children | Single Father | Single Mother |
| No Children | 0 (0.0%) | 1 (12.5%) |
| 1 or 2 Children | 0 (0.0%) | 6 (31.6%) |
| 3 or 4 Children | 0 (0.0%) | 1 (100.0%) |
| 5 or more Children | 0 (0.0%) | 0 (0.0%) |
| Total | 0 (0.0%) | 8 (28.6%) |
Income Below Poverty Among Married-Couple vs Single-Parent Households in Senecaville
The poverty data for Senecaville shows that 6 of the married-couple family households (6.8%) and 8 of the single-parent households (18.6%) are living below the poverty level. Within the married-couple family households, those with 1 or 2 children have the highest poverty rate, with 6 households (26.1%) falling below the poverty line. Among the single-parent households, those with 3 or 4 children have the highest poverty rate, with 1 household (100.0%) living below poverty.
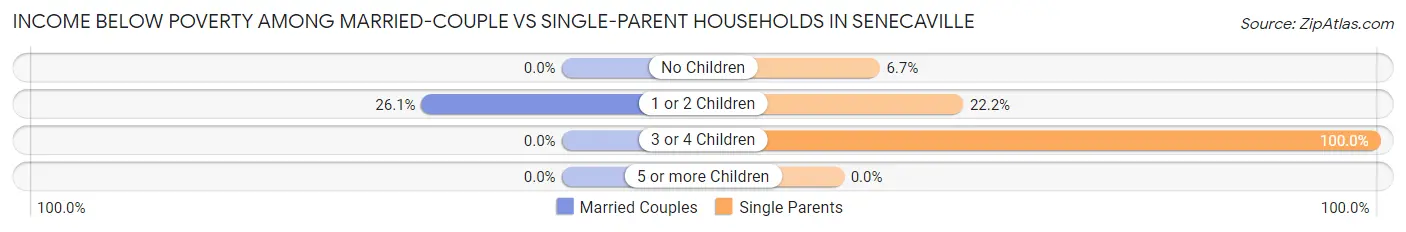
| Children | Married-Couple Families | Single-Parent Households |
| No Children | 0 (0.0%) | 1 (6.7%) |
| 1 or 2 Children | 6 (26.1%) | 6 (22.2%) |
| 3 or 4 Children | 0 (0.0%) | 1 (100.0%) |
| 5 or more Children | 0 (0.0%) | 0 (0.0%) |
| Total | 6 (6.8%) | 8 (18.6%) |
Race in Senecaville
The most populous races in Senecaville are White / Caucasian (409 | 91.1%), Two or more Races (27 | 6.0%), and Black / African American (13 | 2.9%).
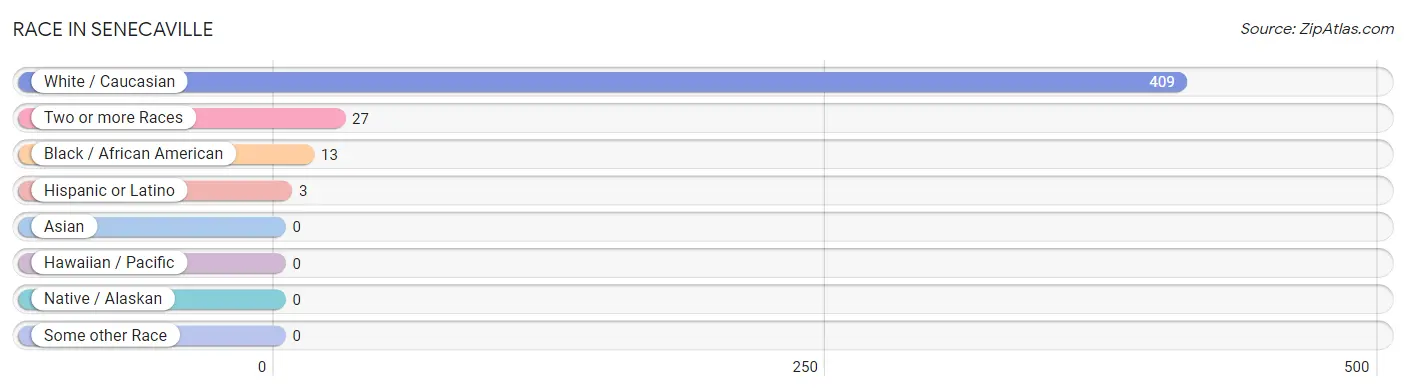
| Race | # Population | % Population |
| Asian | 0 | 0.0% |
| Black / African American | 13 | 2.9% |
| Hawaiian / Pacific | 0 | 0.0% |
| Hispanic or Latino | 3 | 0.7% |
| Native / Alaskan | 0 | 0.0% |
| White / Caucasian | 409 | 91.1% |
| Two or more Races | 27 | 6.0% |
| Some other Race | 0 | 0.0% |
| Total | 449 | 100.0% |
Ancestry in Senecaville
The most populous ancestries reported in Senecaville are Irish (137 | 30.5%), German (55 | 12.2%), English (38 | 8.5%), American (32 | 7.1%), and Dutch (24 | 5.3%), together accounting for 63.7% of all Senecaville residents.
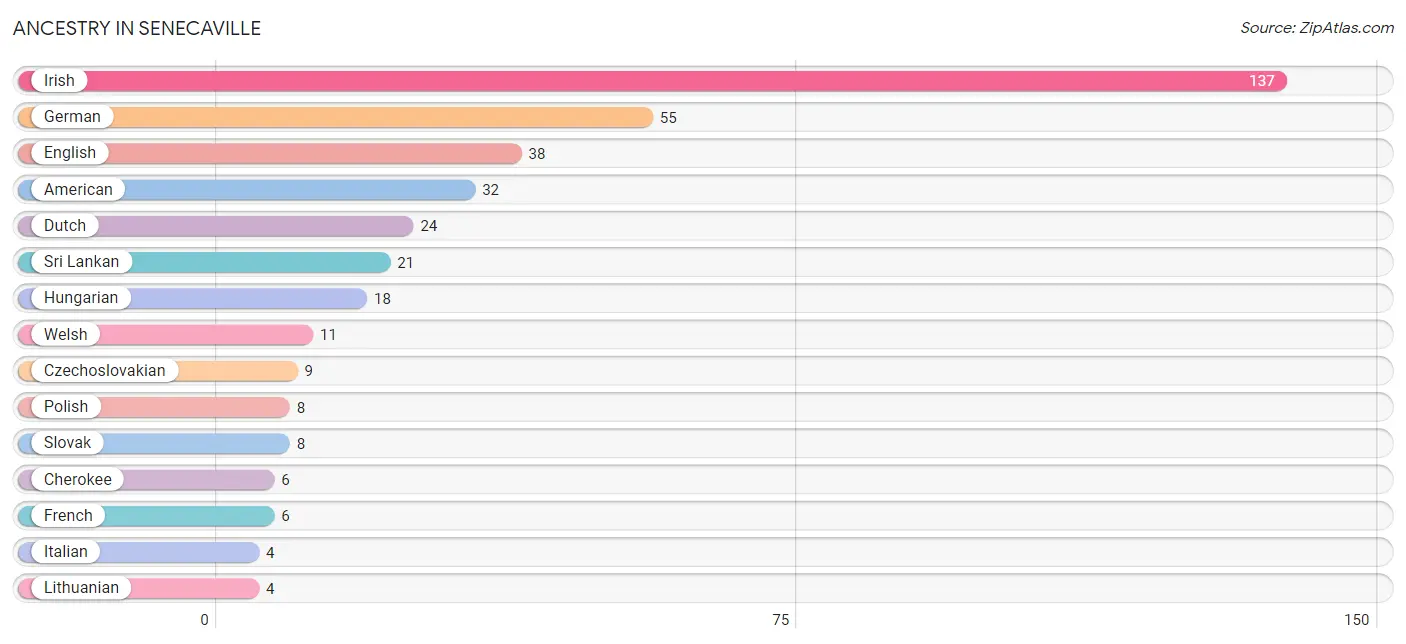
| Ancestry | # Population | % Population |
| American | 32 | 7.1% |
| Austrian | 3 | 0.7% |
| British | 1 | 0.2% |
| Cherokee | 6 | 1.3% |
| Czechoslovakian | 9 | 2.0% |
| Dutch | 24 | 5.3% |
| English | 38 | 8.5% |
| European | 3 | 0.7% |
| French | 6 | 1.3% |
| German | 55 | 12.2% |
| Hungarian | 18 | 4.0% |
| Irish | 137 | 30.5% |
| Italian | 4 | 0.9% |
| Lithuanian | 4 | 0.9% |
| Polish | 8 | 1.8% |
| Puerto Rican | 3 | 0.7% |
| Scotch-Irish | 4 | 0.9% |
| Scottish | 2 | 0.4% |
| Slovak | 8 | 1.8% |
| Sri Lankan | 21 | 4.7% |
| Welsh | 11 | 2.5% | View All 21 Rows |
Immigrants in Senecaville

| Immigration Origin | # Population | % Population | View All 0 Rows |
Sex and Age in Senecaville
Sex and Age in Senecaville
The most populous age groups in Senecaville are 30 to 34 Years (30 | 12.2%) for men and 30 to 34 Years (25 | 12.3%) for women.
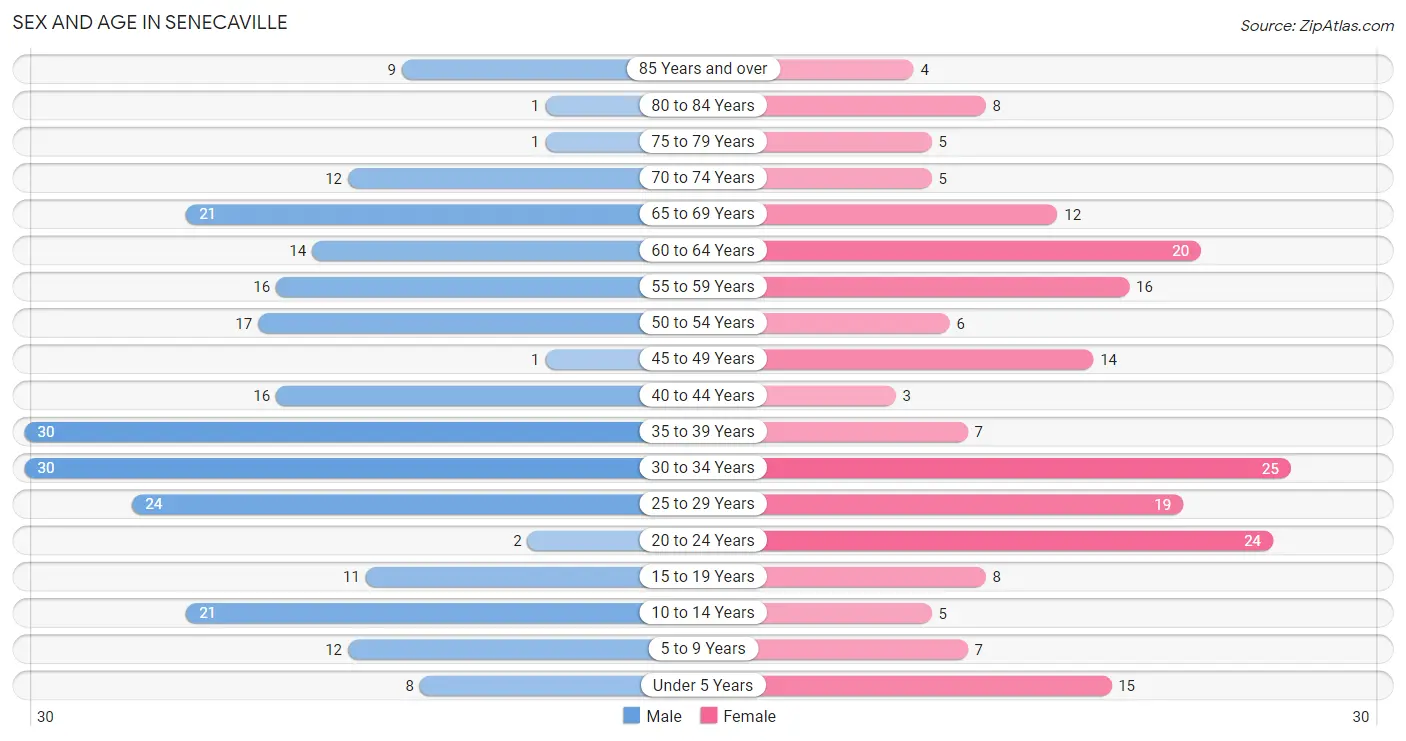
| Age Bracket | Male | Female |
| Under 5 Years | 8 (3.3%) | 15 (7.4%) |
| 5 to 9 Years | 12 (4.9%) | 7 (3.5%) |
| 10 to 14 Years | 21 (8.5%) | 5 (2.5%) |
| 15 to 19 Years | 11 (4.5%) | 8 (3.9%) |
| 20 to 24 Years | 2 (0.8%) | 24 (11.8%) |
| 25 to 29 Years | 24 (9.8%) | 19 (9.4%) |
| 30 to 34 Years | 30 (12.2%) | 25 (12.3%) |
| 35 to 39 Years | 30 (12.2%) | 7 (3.5%) |
| 40 to 44 Years | 16 (6.5%) | 3 (1.5%) |
| 45 to 49 Years | 1 (0.4%) | 14 (6.9%) |
| 50 to 54 Years | 17 (6.9%) | 6 (3.0%) |
| 55 to 59 Years | 16 (6.5%) | 16 (7.9%) |
| 60 to 64 Years | 14 (5.7%) | 20 (9.9%) |
| 65 to 69 Years | 21 (8.5%) | 12 (5.9%) |
| 70 to 74 Years | 12 (4.9%) | 5 (2.5%) |
| 75 to 79 Years | 1 (0.4%) | 5 (2.5%) |
| 80 to 84 Years | 1 (0.4%) | 8 (3.9%) |
| 85 Years and over | 9 (3.7%) | 4 (2.0%) |
| Total | 246 (100.0%) | 203 (100.0%) |
Families and Households in Senecaville
Median Family Size in Senecaville
The median family size in Senecaville is 2.54 persons per family, with single female/mother families (28 | 21.4%) accounting for the largest median family size of 2.89 persons per family. On the other hand, single male/father families (15 | 11.5%) represent the smallest median family size with 2.07 persons per family.
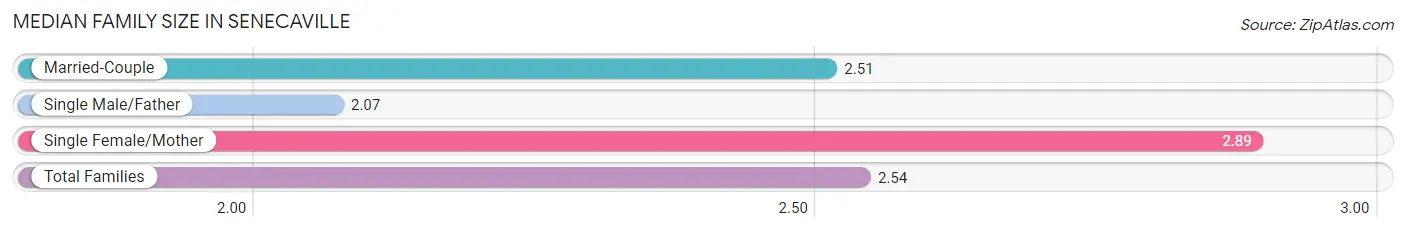
| Family Type | # Families | Family Size |
| Married-Couple | 88 (67.2%) | 2.51 |
| Single Male/Father | 15 (11.5%) | 2.07 |
| Single Female/Mother | 28 (21.4%) | 2.89 |
| Total Families | 131 (100.0%) | 2.54 |
Median Household Size in Senecaville
The median household size in Senecaville is 2.15 persons per household, with single female/mother households (28 | 13.4%) accounting for the largest median household size of 3.54 persons per household. non-family households (78 | 37.3%) represent the smallest median household size with 1.14 persons per household.
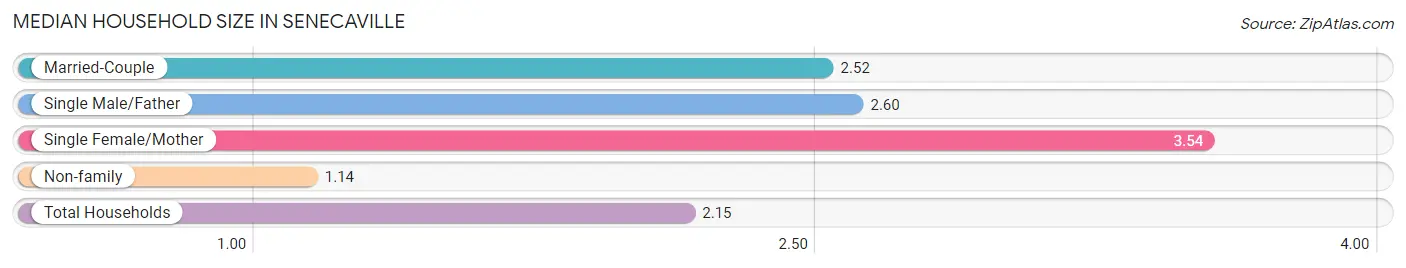
| Household Type | # Households | Household Size |
| Married-Couple | 88 (42.1%) | 2.52 |
| Single Male/Father | 15 (7.2%) | 2.60 |
| Single Female/Mother | 28 (13.4%) | 3.54 |
| Non-family | 78 (37.3%) | 1.14 |
| Total Households | 209 (100.0%) | 2.15 |
Household Size by Marriage Status in Senecaville
Out of a total of 209 households in Senecaville, 131 (62.7%) are family households, while 78 (37.3%) are nonfamily households. The most numerous type of family households are 2-person households, comprising 64, and the most common type of nonfamily households are 1-person households, comprising 66.
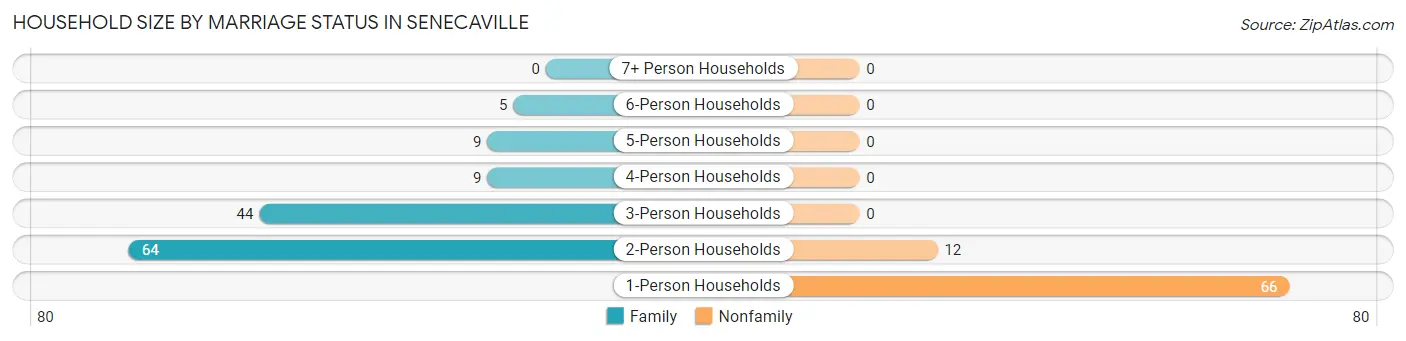
| Household Size | Family Households | Nonfamily Households |
| 1-Person Households | - | 66 (31.6%) |
| 2-Person Households | 64 (30.6%) | 12 (5.7%) |
| 3-Person Households | 44 (21.0%) | 0 (0.0%) |
| 4-Person Households | 9 (4.3%) | 0 (0.0%) |
| 5-Person Households | 9 (4.3%) | 0 (0.0%) |
| 6-Person Households | 5 (2.4%) | 0 (0.0%) |
| 7+ Person Households | 0 (0.0%) | 0 (0.0%) |
| Total | 131 (62.7%) | 78 (37.3%) |
Female Fertility in Senecaville
Fertility by Age in Senecaville
Average fertility rate in Senecaville is 20.0 births per 1,000 women. Women in the age bracket of 20 to 34 years have the highest fertility rate with 29.0 births per 1,000 women. Women in the age bracket of 20 to 34 years acount for 100.0% of all women with births.
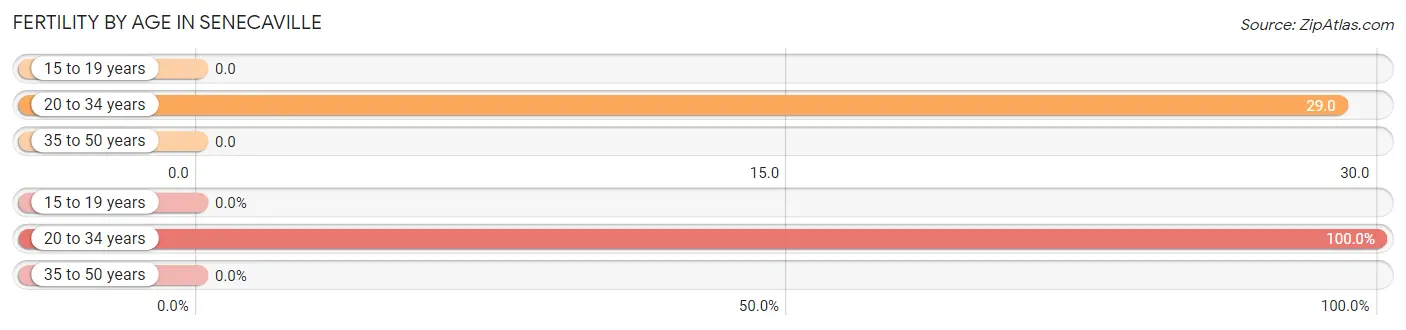
| Age Bracket | Women with Births | Births / 1,000 Women |
| 15 to 19 years | 0 (0.0%) | 0.0 |
| 20 to 34 years | 2 (100.0%) | 29.0 |
| 35 to 50 years | 0 (0.0%) | 0.0 |
| Total | 2 (100.0%) | 20.0 |
Fertility by Age by Marriage Status in Senecaville
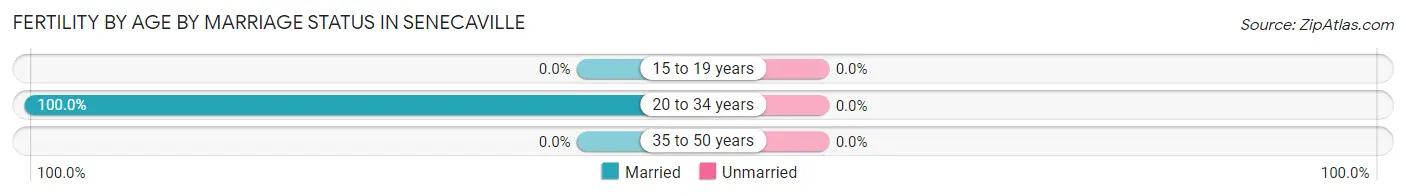
| Age Bracket | Married | Unmarried |
| 15 to 19 years | 0 (0.0%) | 0 (0.0%) |
| 20 to 34 years | 2 (100.0%) | 0 (0.0%) |
| 35 to 50 years | 0 (0.0%) | 0 (0.0%) |
| Total | 2 (100.0%) | 0 (0.0%) |
Fertility by Education in Senecaville
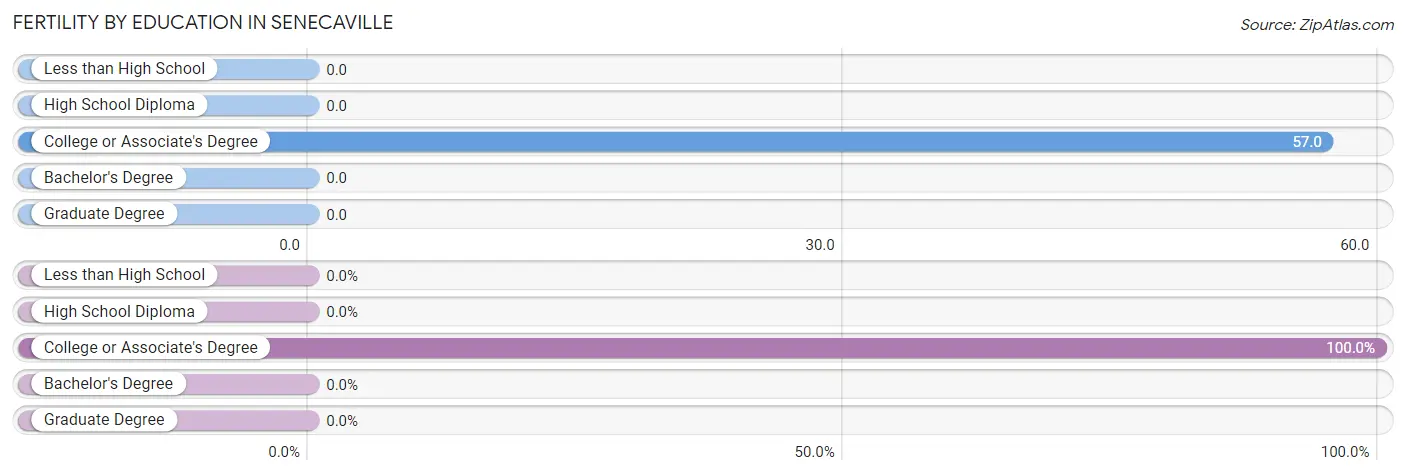
| Educational Attainment | Women with Births | Births / 1,000 Women |
| Less than High School | 0 (0.0%) | 0.0 |
| High School Diploma | 0 (0.0%) | 0.0 |
| College or Associate's Degree | 2 (100.0%) | 57.0 |
| Bachelor's Degree | 0 (0.0%) | 0.0 |
| Graduate Degree | 0 (0.0%) | 0.0 |
| Total | 2 (100.0%) | 20.0 |
Fertility by Education by Marriage Status in Senecaville
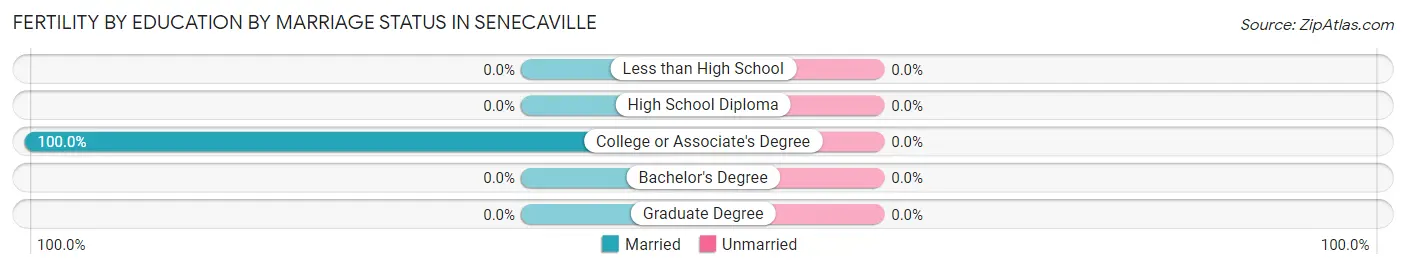
| Educational Attainment | Married | Unmarried |
| Less than High School | 0 (0.0%) | 0 (0.0%) |
| High School Diploma | 0 (0.0%) | 0 (0.0%) |
| College or Associate's Degree | 2 (100.0%) | 0 (0.0%) |
| Bachelor's Degree | 0 (0.0%) | 0 (0.0%) |
| Graduate Degree | 0 (0.0%) | 0 (0.0%) |
| Total | 2 (100.0%) | 0 (0.0%) |
Employment Characteristics in Senecaville
Employment by Class of Employer in Senecaville
Among the 204 employed individuals in Senecaville, private company employees (152 | 74.5%), local government employees (20 | 9.8%), and not-for-profit organizations (16 | 7.8%) make up the most common classes of employment.
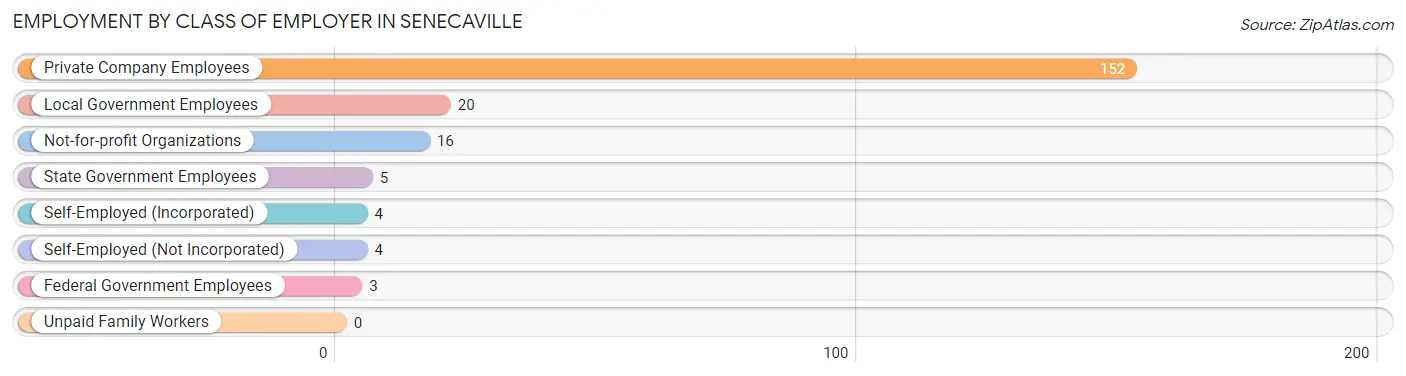
| Employer Class | # Employees | % Employees |
| Private Company Employees | 152 | 74.5% |
| Self-Employed (Incorporated) | 4 | 2.0% |
| Self-Employed (Not Incorporated) | 4 | 2.0% |
| Not-for-profit Organizations | 16 | 7.8% |
| Local Government Employees | 20 | 9.8% |
| State Government Employees | 5 | 2.5% |
| Federal Government Employees | 3 | 1.5% |
| Unpaid Family Workers | 0 | 0.0% |
| Total | 204 | 100.0% |
Employment Status by Age in Senecaville
According to the labor force statistics for Senecaville, out of the total population over 16 years of age (376), 57.2% or 215 individuals are in the labor force, with 4.2% or 9 of them unemployed. The age group with the highest labor force participation rate is 45 to 54 years, with 97.4% or 37 individuals in the labor force. Within the labor force, the 16 to 19 years age range has the highest percentage of unemployed individuals, with 100.0% or 3 of them being unemployed.
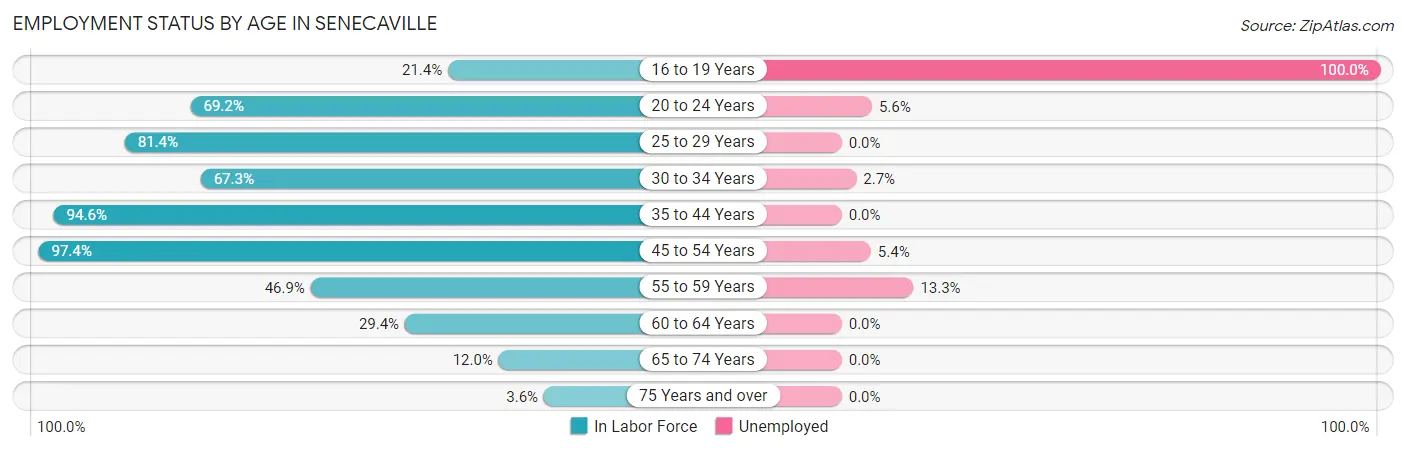
| Age Bracket | In Labor Force | Unemployed |
| 16 to 19 Years | 3 (21.4%) | 3 (100.0%) |
| 20 to 24 Years | 18 (69.2%) | 1 (5.6%) |
| 25 to 29 Years | 35 (81.4%) | 0 (0.0%) |
| 30 to 34 Years | 37 (67.3%) | 1 (2.7%) |
| 35 to 44 Years | 53 (94.6%) | 0 (0.0%) |
| 45 to 54 Years | 37 (97.4%) | 2 (5.4%) |
| 55 to 59 Years | 15 (46.9%) | 2 (13.3%) |
| 60 to 64 Years | 10 (29.4%) | 0 (0.0%) |
| 65 to 74 Years | 6 (12.0%) | 0 (0.0%) |
| 75 Years and over | 1 (3.6%) | 0 (0.0%) |
| Total | 215 (57.2%) | 9 (4.2%) |
Employment Status by Educational Attainment in Senecaville
According to labor force statistics for Senecaville, 72.5% of individuals (187) out of the total population between 25 and 64 years of age (258) are in the labor force, with 2.7% or 5 of them being unemployed. The group with the highest labor force participation rate are those with the educational attainment of bachelor's degree or higher, with 100.0% or 19 individuals in the labor force. Within the labor force, individuals with bachelor's degree or higher education have the highest percentage of unemployment, with 10.5% or 2 of them being unemployed.
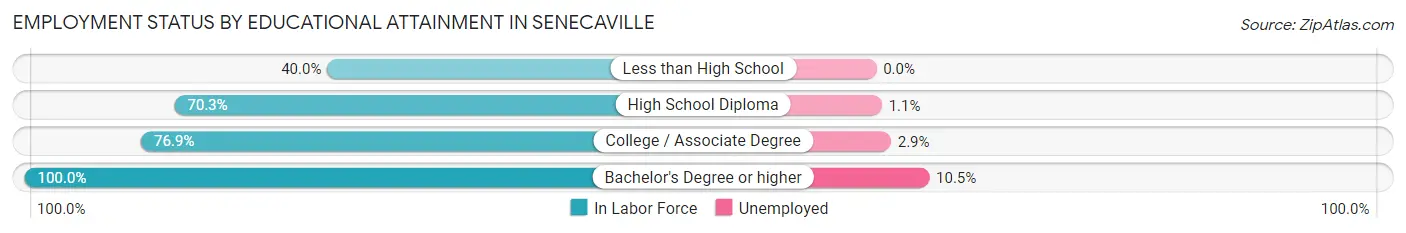
| Educational Attainment | In Labor Force | Unemployed |
| Less than High School | 8 (40.0%) | 0 (0.0%) |
| High School Diploma | 90 (70.3%) | 1 (1.1%) |
| College / Associate Degree | 70 (76.9%) | 3 (2.9%) |
| Bachelor's Degree or higher | 19 (100.0%) | 2 (10.5%) |
| Total | 187 (72.5%) | 7 (2.7%) |
Employment Occupations by Sex in Senecaville
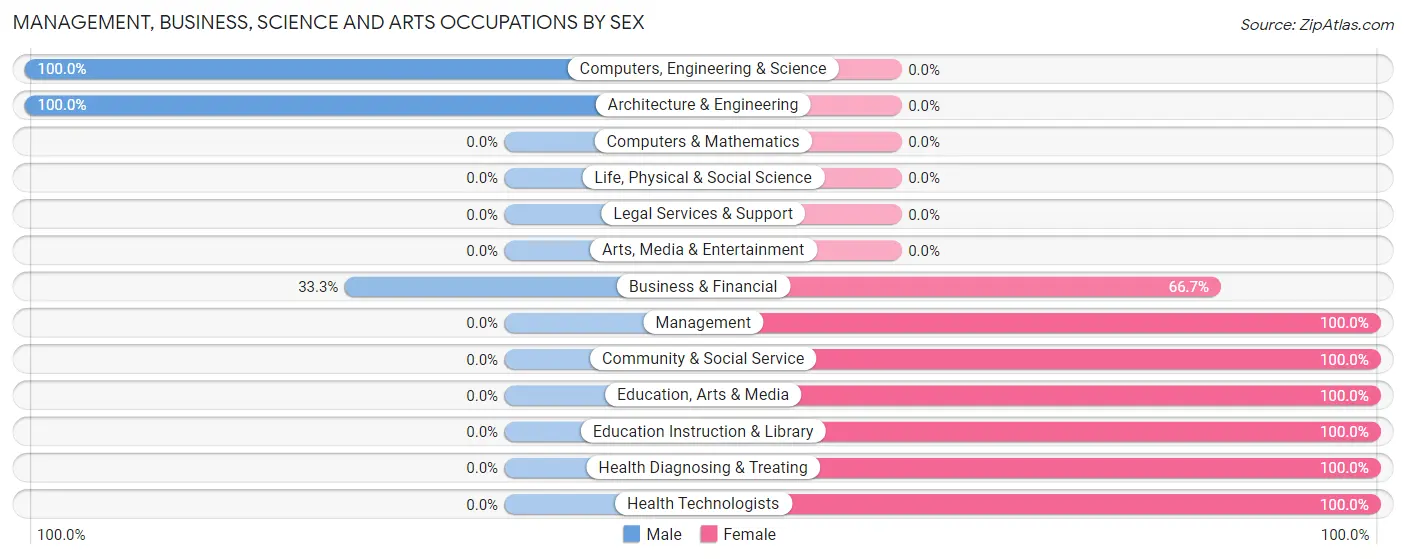
Management, Business, Science and Arts Occupations
The most common Management, Business, Science and Arts occupations in Senecaville are Community & Social Service (17 | 8.3%), Education Instruction & Library (12 | 5.8%), Management (7 | 3.4%), Computers, Engineering & Science (5 | 2.4%), and Architecture & Engineering (5 | 2.4%).
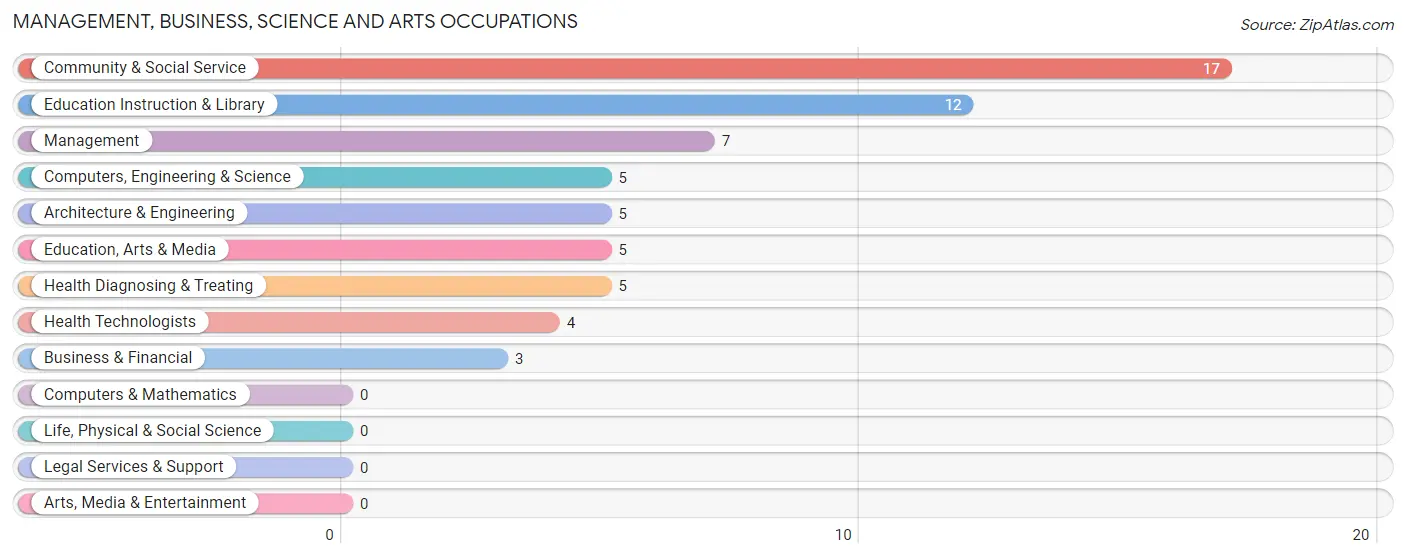
Management, Business, Science and Arts Occupations by Sex
Within the Management, Business, Science and Arts occupations in Senecaville, the most male-oriented occupations are Computers, Engineering & Science (100.0%), Architecture & Engineering (100.0%), and Business & Financial (33.3%), while the most female-oriented occupations are Management (100.0%), Community & Social Service (100.0%), and Education, Arts & Media (100.0%).
| Occupation | Male | Female |
| Management | 0 (0.0%) | 7 (100.0%) |
| Business & Financial | 1 (33.3%) | 2 (66.7%) |
| Computers, Engineering & Science | 5 (100.0%) | 0 (0.0%) |
| Computers & Mathematics | 0 (0.0%) | 0 (0.0%) |
| Architecture & Engineering | 5 (100.0%) | 0 (0.0%) |
| Life, Physical & Social Science | 0 (0.0%) | 0 (0.0%) |
| Community & Social Service | 0 (0.0%) | 17 (100.0%) |
| Education, Arts & Media | 0 (0.0%) | 5 (100.0%) |
| Legal Services & Support | 0 (0.0%) | 0 (0.0%) |
| Education Instruction & Library | 0 (0.0%) | 12 (100.0%) |
| Arts, Media & Entertainment | 0 (0.0%) | 0 (0.0%) |
| Health Diagnosing & Treating | 0 (0.0%) | 5 (100.0%) |
| Health Technologists | 0 (0.0%) | 4 (100.0%) |
| Total (Category) | 6 (16.2%) | 31 (83.8%) |
| Total (Overall) | 125 (60.7%) | 81 (39.3%) |
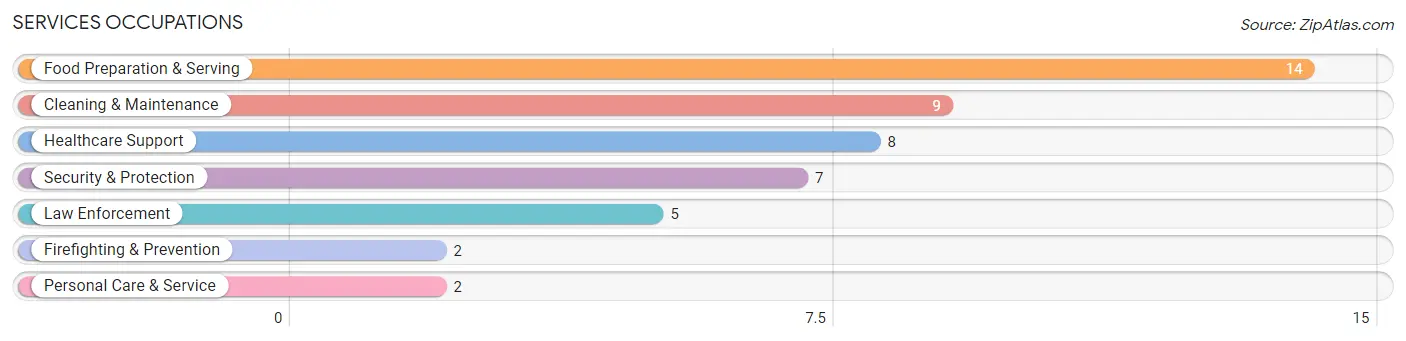
Services Occupations
The most common Services occupations in Senecaville are Food Preparation & Serving (14 | 6.8%), Cleaning & Maintenance (9 | 4.4%), Healthcare Support (8 | 3.9%), Security & Protection (7 | 3.4%), and Law Enforcement (5 | 2.4%).
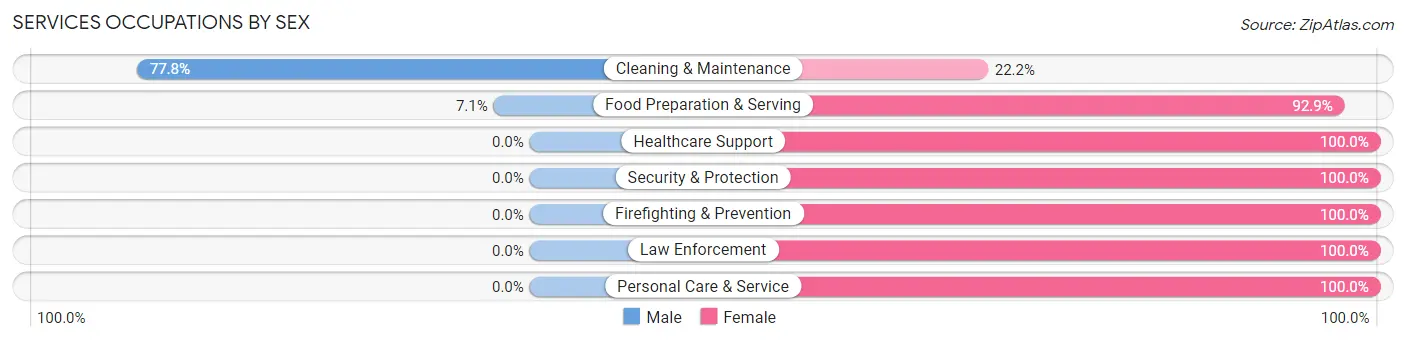
Services Occupations by Sex
Within the Services occupations in Senecaville, the most male-oriented occupations are Cleaning & Maintenance (77.8%), and Food Preparation & Serving (7.1%), while the most female-oriented occupations are Healthcare Support (100.0%), Security & Protection (100.0%), and Firefighting & Prevention (100.0%).
| Occupation | Male | Female |
| Healthcare Support | 0 (0.0%) | 8 (100.0%) |
| Security & Protection | 0 (0.0%) | 7 (100.0%) |
| Firefighting & Prevention | 0 (0.0%) | 2 (100.0%) |
| Law Enforcement | 0 (0.0%) | 5 (100.0%) |
| Food Preparation & Serving | 1 (7.1%) | 13 (92.9%) |
| Cleaning & Maintenance | 7 (77.8%) | 2 (22.2%) |
| Personal Care & Service | 0 (0.0%) | 2 (100.0%) |
| Total (Category) | 8 (20.0%) | 32 (80.0%) |
| Total (Overall) | 125 (60.7%) | 81 (39.3%) |
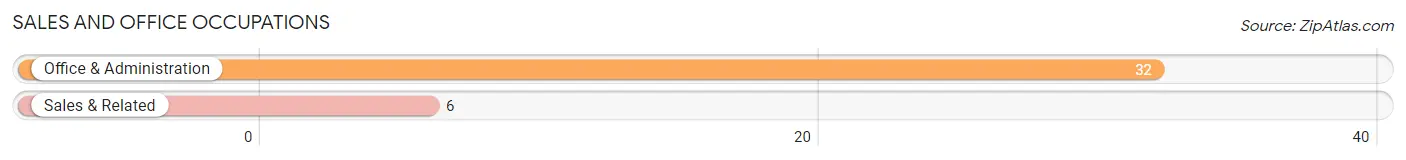
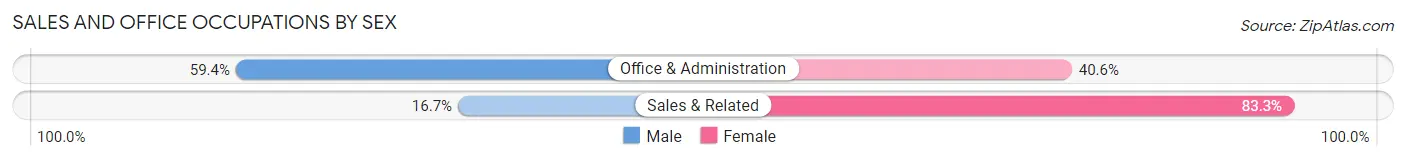
Sales and Office Occupations
The most common Sales and Office occupations in Senecaville are Office & Administration (32 | 15.5%), and Sales & Related (6 | 2.9%).
Sales and Office Occupations by Sex
| Occupation | Male | Female |
| Sales & Related | 1 (16.7%) | 5 (83.3%) |
| Office & Administration | 19 (59.4%) | 13 (40.6%) |
| Total (Category) | 20 (52.6%) | 18 (47.4%) |
| Total (Overall) | 125 (60.7%) | 81 (39.3%) |
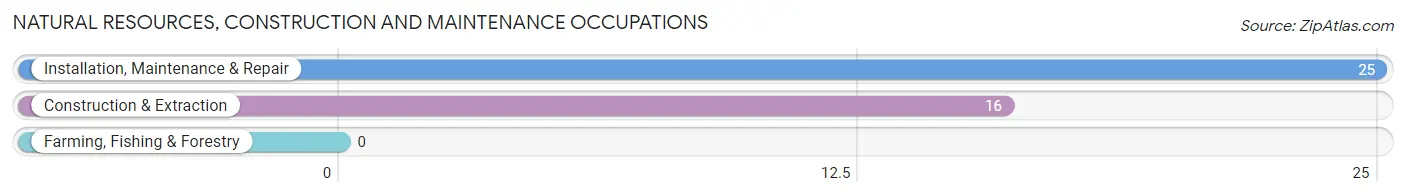
Natural Resources, Construction and Maintenance Occupations
The most common Natural Resources, Construction and Maintenance occupations in Senecaville are Installation, Maintenance & Repair (25 | 12.1%), and Construction & Extraction (16 | 7.8%).
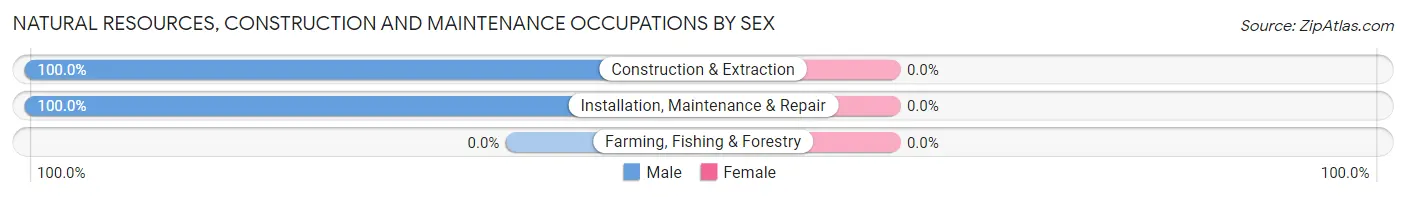
Natural Resources, Construction and Maintenance Occupations by Sex
| Occupation | Male | Female |
| Farming, Fishing & Forestry | 0 (0.0%) | 0 (0.0%) |
| Construction & Extraction | 16 (100.0%) | 0 (0.0%) |
| Installation, Maintenance & Repair | 25 (100.0%) | 0 (0.0%) |
| Total (Category) | 41 (100.0%) | 0 (0.0%) |
| Total (Overall) | 125 (60.7%) | 81 (39.3%) |
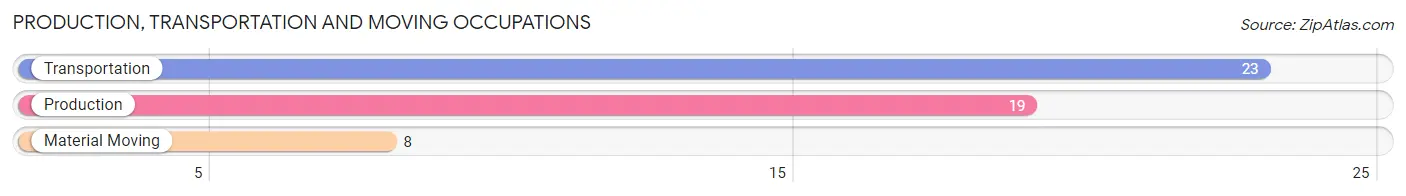
Production, Transportation and Moving Occupations
The most common Production, Transportation and Moving occupations in Senecaville are Transportation (23 | 11.2%), Production (19 | 9.2%), and Material Moving (8 | 3.9%).
Production, Transportation and Moving Occupations by Sex
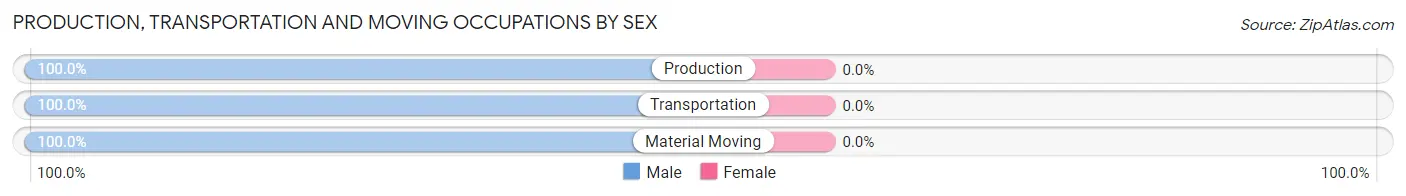
| Occupation | Male | Female |
| Production | 19 (100.0%) | 0 (0.0%) |
| Transportation | 23 (100.0%) | 0 (0.0%) |
| Material Moving | 8 (100.0%) | 0 (0.0%) |
| Total (Category) | 50 (100.0%) | 0 (0.0%) |
| Total (Overall) | 125 (60.7%) | 81 (39.3%) |
Employment Industries by Sex in Senecaville
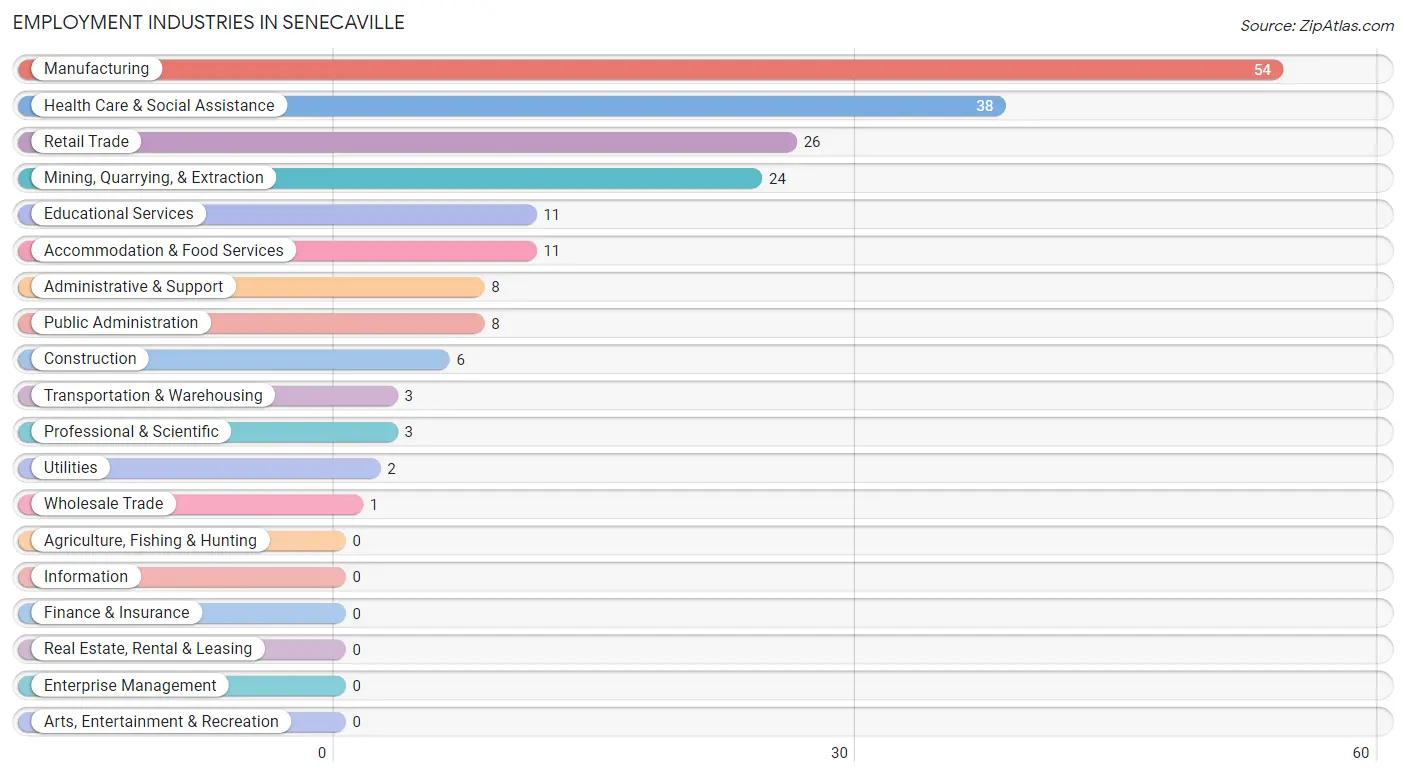
Employment Industries in Senecaville
The major employment industries in Senecaville include Manufacturing (54 | 26.2%), Health Care & Social Assistance (38 | 18.4%), Retail Trade (26 | 12.6%), Mining, Quarrying, & Extraction (24 | 11.7%), and Educational Services (11 | 5.3%).
Employment Industries by Sex in Senecaville
The Senecaville industries that see more men than women are Mining, Quarrying, & Extraction (100.0%), Wholesale Trade (100.0%), and Utilities (100.0%), whereas the industries that tend to have a higher number of women are Transportation & Warehousing (100.0%), Educational Services (100.0%), and Accommodation & Food Services (100.0%).
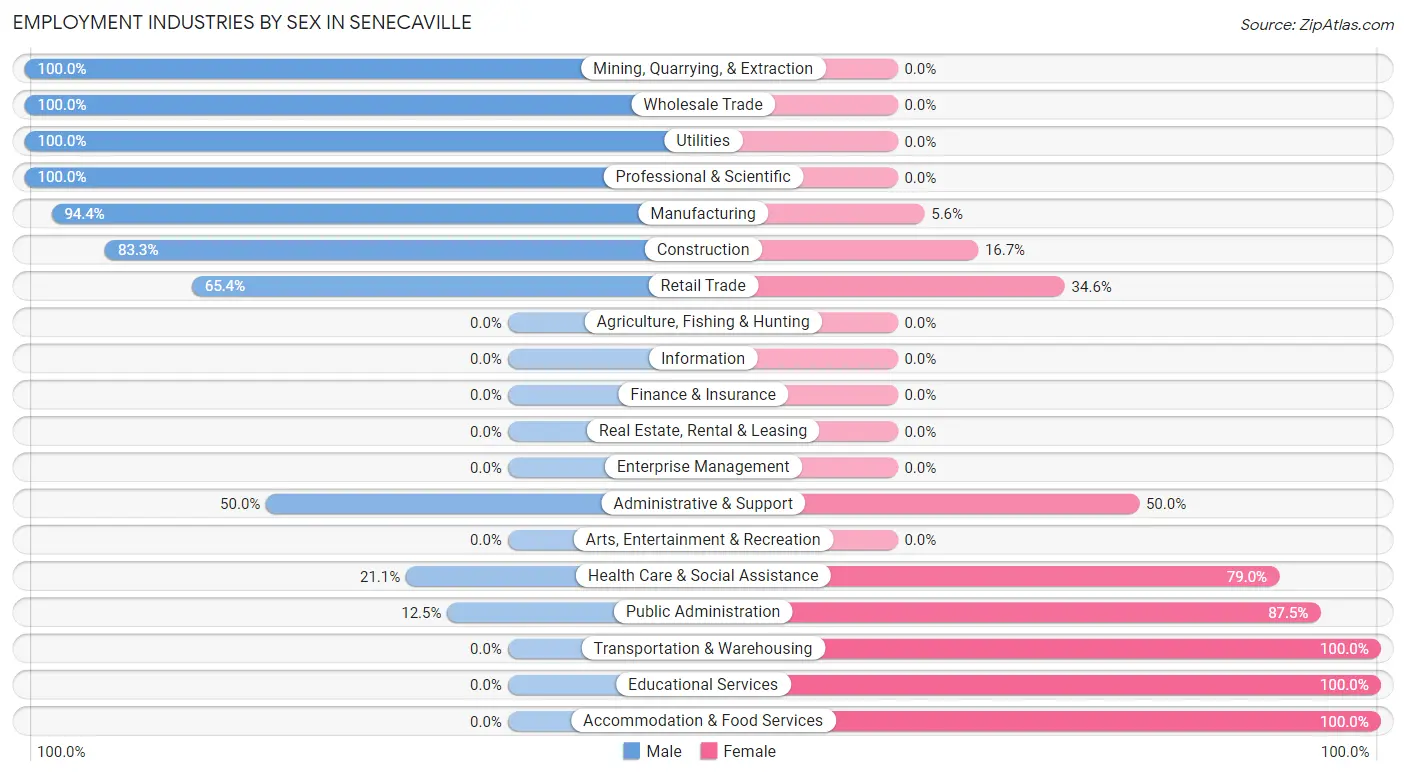
| Industry | Male | Female |
| Agriculture, Fishing & Hunting | 0 (0.0%) | 0 (0.0%) |
| Mining, Quarrying, & Extraction | 24 (100.0%) | 0 (0.0%) |
| Construction | 5 (83.3%) | 1 (16.7%) |
| Manufacturing | 51 (94.4%) | 3 (5.6%) |
| Wholesale Trade | 1 (100.0%) | 0 (0.0%) |
| Retail Trade | 17 (65.4%) | 9 (34.6%) |
| Transportation & Warehousing | 0 (0.0%) | 3 (100.0%) |
| Utilities | 2 (100.0%) | 0 (0.0%) |
| Information | 0 (0.0%) | 0 (0.0%) |
| Finance & Insurance | 0 (0.0%) | 0 (0.0%) |
| Real Estate, Rental & Leasing | 0 (0.0%) | 0 (0.0%) |
| Professional & Scientific | 3 (100.0%) | 0 (0.0%) |
| Enterprise Management | 0 (0.0%) | 0 (0.0%) |
| Administrative & Support | 4 (50.0%) | 4 (50.0%) |
| Educational Services | 0 (0.0%) | 11 (100.0%) |
| Health Care & Social Assistance | 8 (21.0%) | 30 (78.9%) |
| Arts, Entertainment & Recreation | 0 (0.0%) | 0 (0.0%) |
| Accommodation & Food Services | 0 (0.0%) | 11 (100.0%) |
| Public Administration | 1 (12.5%) | 7 (87.5%) |
| Total | 125 (60.7%) | 81 (39.3%) |
Education in Senecaville
School Enrollment in Senecaville
The most common levels of schooling among the 79 students in Senecaville are middle school (26 | 32.9%), high school (19 | 24.0%), and kindergarten (11 | 13.9%).
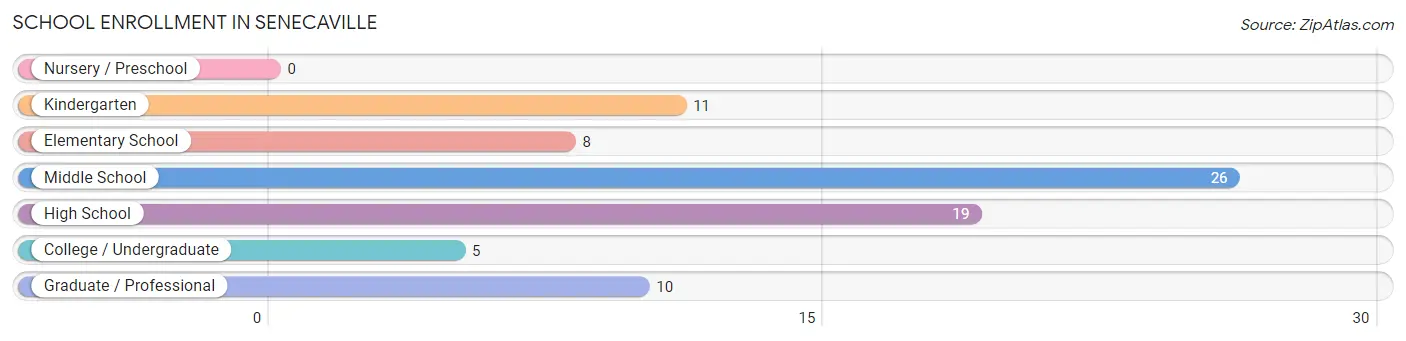
| School Level | # Students | % Students |
| Nursery / Preschool | 0 | 0.0% |
| Kindergarten | 11 | 13.9% |
| Elementary School | 8 | 10.1% |
| Middle School | 26 | 32.9% |
| High School | 19 | 24.0% |
| College / Undergraduate | 5 | 6.3% |
| Graduate / Professional | 10 | 12.7% |
| Total | 79 | 100.0% |
School Enrollment by Age by Funding Source in Senecaville
Out of a total of 79 students who are enrolled in schools in Senecaville, 11 (13.9%) attend a private institution, while the remaining 68 (86.1%) are enrolled in public schools. The age group of 20 to 24 year olds has the highest likelihood of being enrolled in private schools, with 9 (100.0% in the age bracket) enrolled. Conversely, the age group of 10 to 14 year olds has the lowest likelihood of being enrolled in a private school, with 26 (100.0% in the age bracket) attending a public institution.
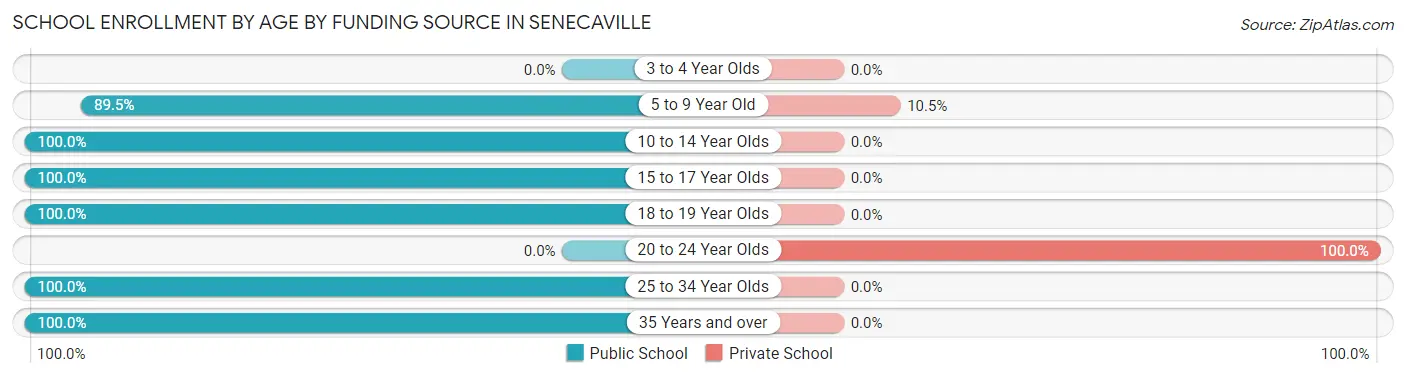
| Age Bracket | Public School | Private School |
| 3 to 4 Year Olds | 0 (0.0%) | 0 (0.0%) |
| 5 to 9 Year Old | 17 (89.5%) | 2 (10.5%) |
| 10 to 14 Year Olds | 26 (100.0%) | 0 (0.0%) |
| 15 to 17 Year Olds | 11 (100.0%) | 0 (0.0%) |
| 18 to 19 Year Olds | 5 (100.0%) | 0 (0.0%) |
| 20 to 24 Year Olds | 0 (0.0%) | 9 (100.0%) |
| 25 to 34 Year Olds | 1 (100.0%) | 0 (0.0%) |
| 35 Years and over | 8 (100.0%) | 0 (0.0%) |
| Total | 68 (86.1%) | 11 (13.9%) |
Educational Attainment by Field of Study in Senecaville
Business (9 | 40.9%), computers & mathematics (3 | 13.6%), science & technology (3 | 13.6%), psychology (2 | 9.1%), and engineering (2 | 9.1%) are the most common fields of study among 22 individuals in Senecaville who have obtained a bachelor's degree or higher.
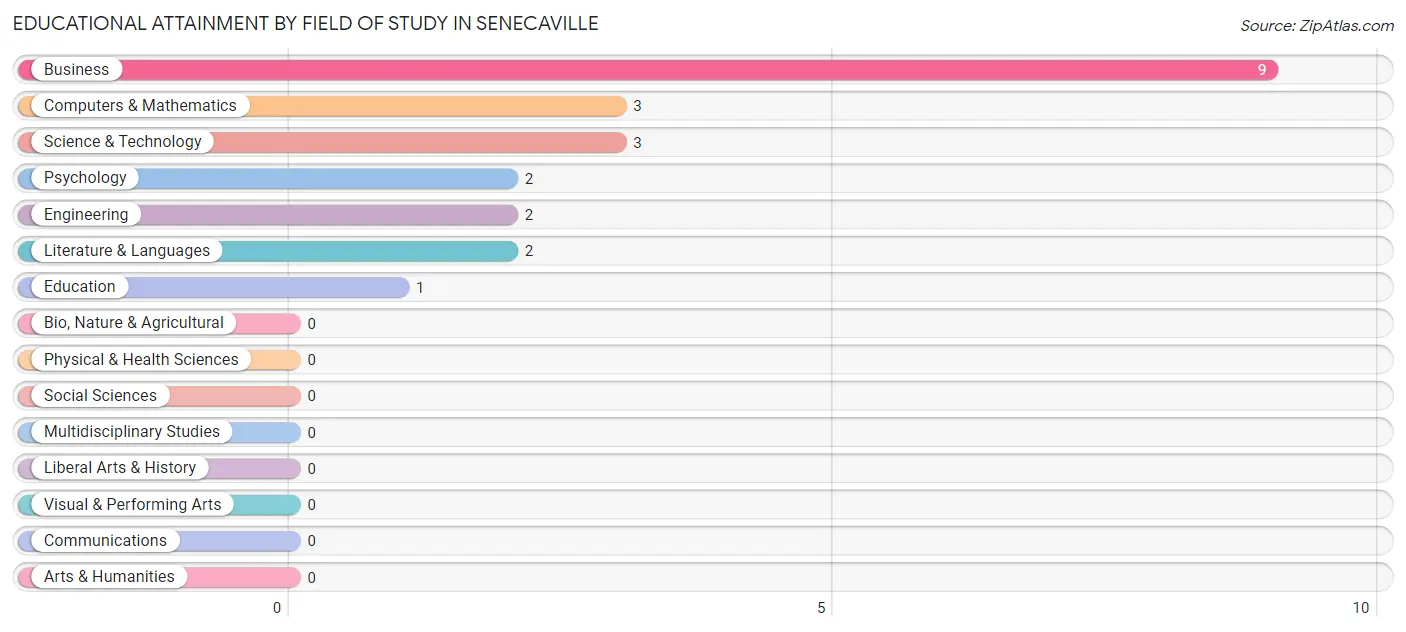
| Field of Study | # Graduates | % Graduates |
| Computers & Mathematics | 3 | 13.6% |
| Bio, Nature & Agricultural | 0 | 0.0% |
| Physical & Health Sciences | 0 | 0.0% |
| Psychology | 2 | 9.1% |
| Social Sciences | 0 | 0.0% |
| Engineering | 2 | 9.1% |
| Multidisciplinary Studies | 0 | 0.0% |
| Science & Technology | 3 | 13.6% |
| Business | 9 | 40.9% |
| Education | 1 | 4.5% |
| Literature & Languages | 2 | 9.1% |
| Liberal Arts & History | 0 | 0.0% |
| Visual & Performing Arts | 0 | 0.0% |
| Communications | 0 | 0.0% |
| Arts & Humanities | 0 | 0.0% |
| Total | 22 | 100.0% |
Transportation & Commute in Senecaville
Vehicle Availability by Sex in Senecaville
The most prevalent vehicle ownership categories in Senecaville are males with 2 vehicles (71, accounting for 57.7%) and females with 2 vehicles (30, making up 87.6%).
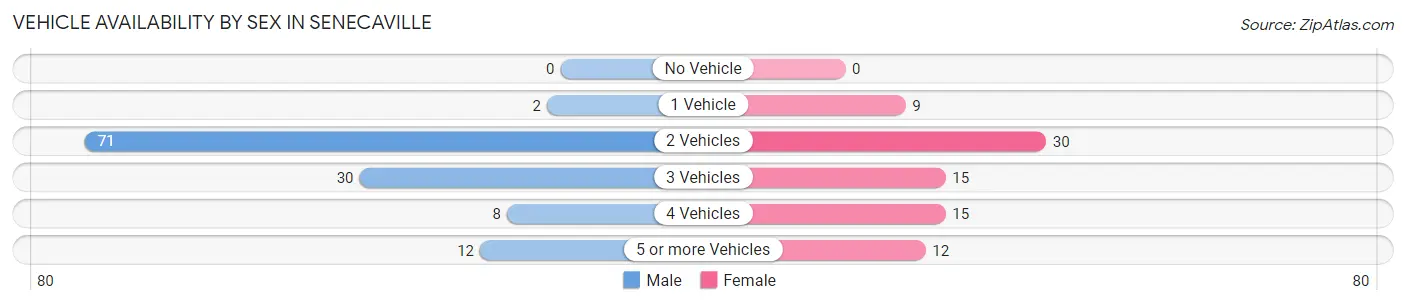
| Vehicles Available | Male | Female |
| No Vehicle | 0 (0.0%) | 0 (0.0%) |
| 1 Vehicle | 2 (1.6%) | 9 (11.1%) |
| 2 Vehicles | 71 (57.7%) | 30 (37.0%) |
| 3 Vehicles | 30 (24.4%) | 15 (18.5%) |
| 4 Vehicles | 8 (6.5%) | 15 (18.5%) |
| 5 or more Vehicles | 12 (9.8%) | 12 (14.8%) |
| Total | 123 (100.0%) | 81 (100.0%) |
Commute Time in Senecaville
The most frequently occuring commute durations in Senecaville are 15 to 19 minutes (59 commuters, 28.9%), 30 to 34 minutes (39 commuters, 19.1%), and 20 to 24 minutes (37 commuters, 18.1%).
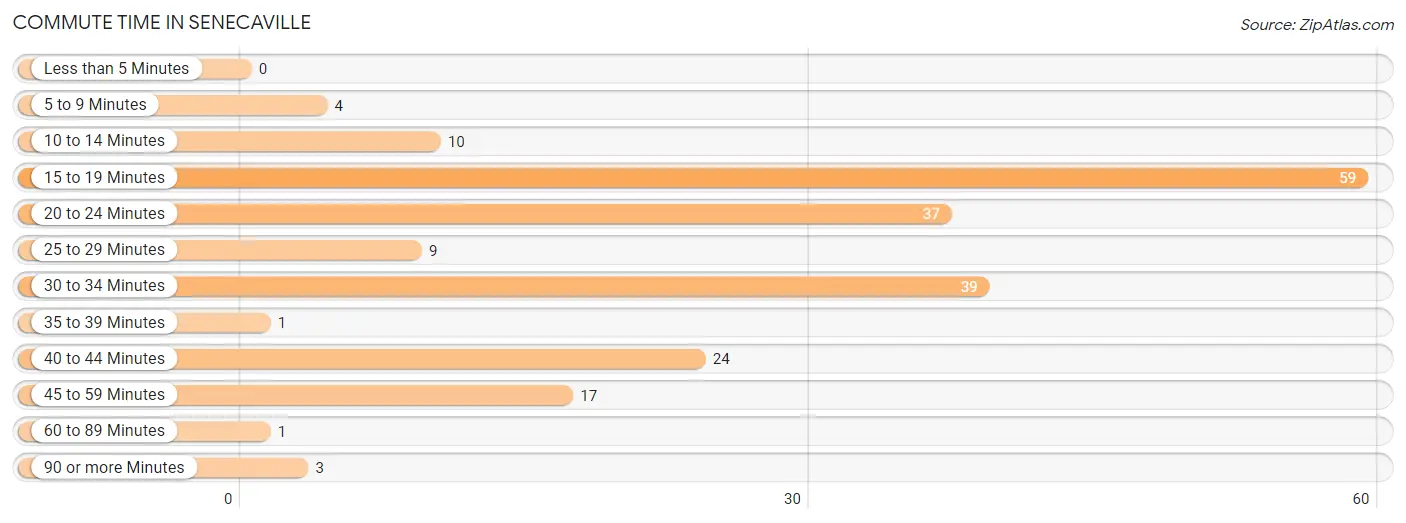
| Commute Time | # Commuters | % Commuters |
| Less than 5 Minutes | 0 | 0.0% |
| 5 to 9 Minutes | 4 | 2.0% |
| 10 to 14 Minutes | 10 | 4.9% |
| 15 to 19 Minutes | 59 | 28.9% |
| 20 to 24 Minutes | 37 | 18.1% |
| 25 to 29 Minutes | 9 | 4.4% |
| 30 to 34 Minutes | 39 | 19.1% |
| 35 to 39 Minutes | 1 | 0.5% |
| 40 to 44 Minutes | 24 | 11.8% |
| 45 to 59 Minutes | 17 | 8.3% |
| 60 to 89 Minutes | 1 | 0.5% |
| 90 or more Minutes | 3 | 1.5% |
Commute Time by Sex in Senecaville
The most common commute times in Senecaville are 15 to 19 minutes (36 commuters, 29.3%) for males and 15 to 19 minutes (23 commuters, 28.4%) for females.
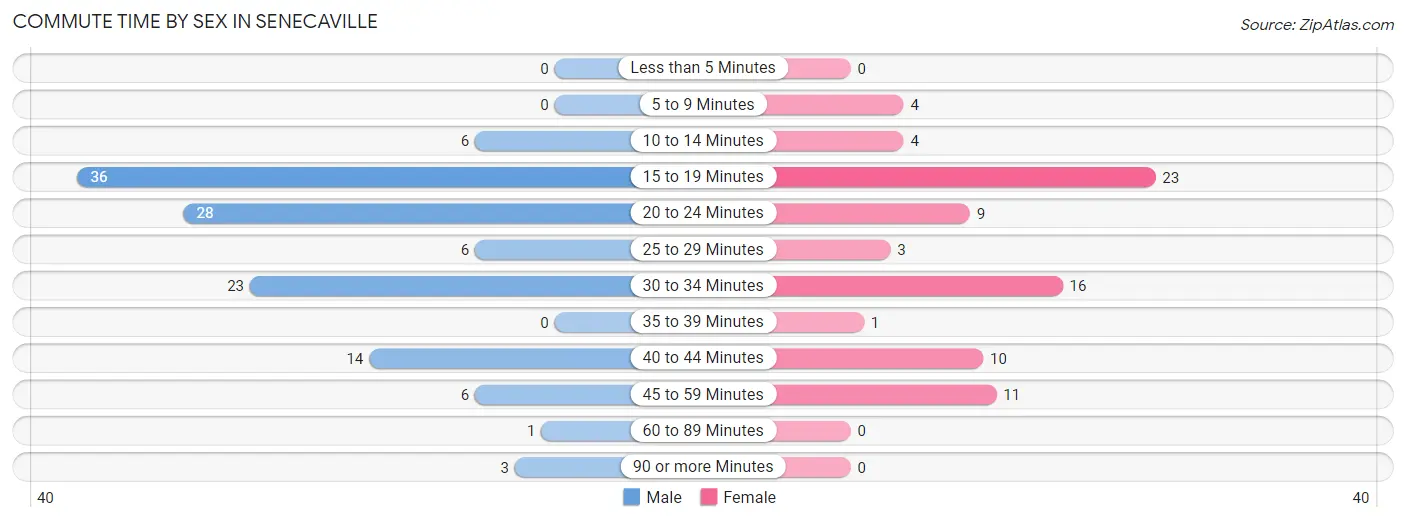
| Commute Time | Male | Female |
| Less than 5 Minutes | 0 (0.0%) | 0 (0.0%) |
| 5 to 9 Minutes | 0 (0.0%) | 4 (4.9%) |
| 10 to 14 Minutes | 6 (4.9%) | 4 (4.9%) |
| 15 to 19 Minutes | 36 (29.3%) | 23 (28.4%) |
| 20 to 24 Minutes | 28 (22.8%) | 9 (11.1%) |
| 25 to 29 Minutes | 6 (4.9%) | 3 (3.7%) |
| 30 to 34 Minutes | 23 (18.7%) | 16 (19.8%) |
| 35 to 39 Minutes | 0 (0.0%) | 1 (1.2%) |
| 40 to 44 Minutes | 14 (11.4%) | 10 (12.3%) |
| 45 to 59 Minutes | 6 (4.9%) | 11 (13.6%) |
| 60 to 89 Minutes | 1 (0.8%) | 0 (0.0%) |
| 90 or more Minutes | 3 (2.4%) | 0 (0.0%) |
Time of Departure to Work by Sex in Senecaville
The most frequent times of departure to work in Senecaville are 5:00 AM to 5:29 AM (27, 22.0%) for males and 7:30 AM to 7:59 AM (16, 19.8%) for females.
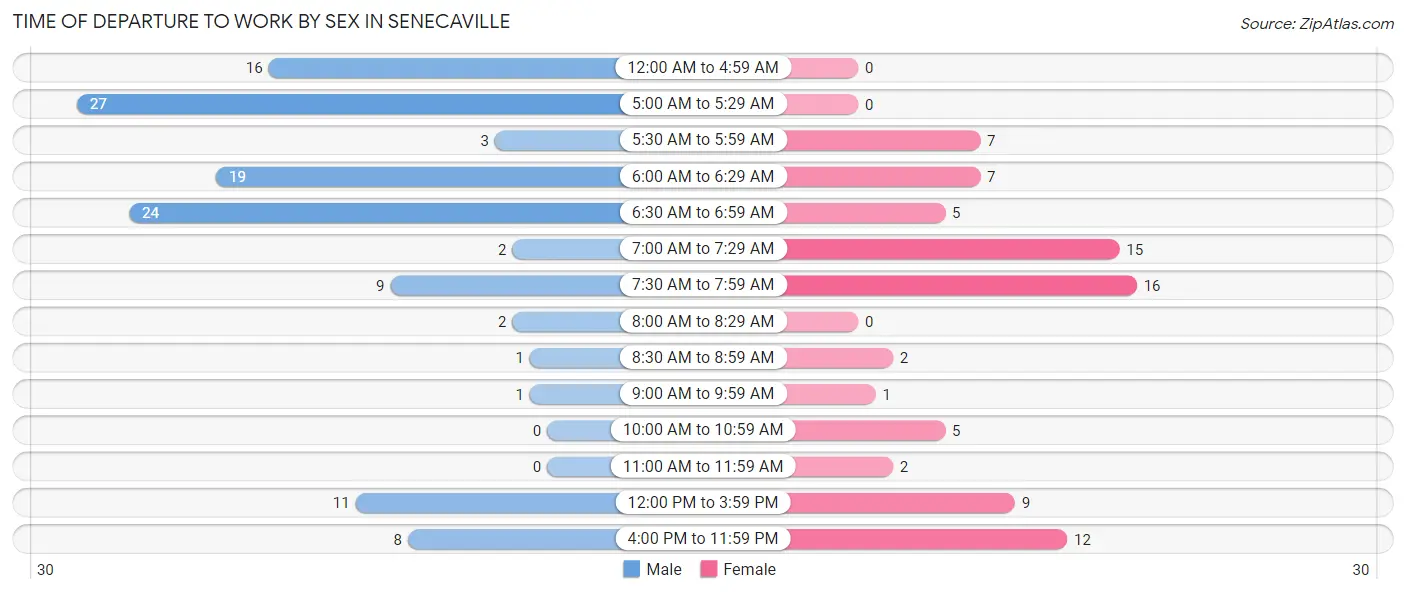
| Time of Departure | Male | Female |
| 12:00 AM to 4:59 AM | 16 (13.0%) | 0 (0.0%) |
| 5:00 AM to 5:29 AM | 27 (22.0%) | 0 (0.0%) |
| 5:30 AM to 5:59 AM | 3 (2.4%) | 7 (8.6%) |
| 6:00 AM to 6:29 AM | 19 (15.4%) | 7 (8.6%) |
| 6:30 AM to 6:59 AM | 24 (19.5%) | 5 (6.2%) |
| 7:00 AM to 7:29 AM | 2 (1.6%) | 15 (18.5%) |
| 7:30 AM to 7:59 AM | 9 (7.3%) | 16 (19.8%) |
| 8:00 AM to 8:29 AM | 2 (1.6%) | 0 (0.0%) |
| 8:30 AM to 8:59 AM | 1 (0.8%) | 2 (2.5%) |
| 9:00 AM to 9:59 AM | 1 (0.8%) | 1 (1.2%) |
| 10:00 AM to 10:59 AM | 0 (0.0%) | 5 (6.2%) |
| 11:00 AM to 11:59 AM | 0 (0.0%) | 2 (2.5%) |
| 12:00 PM to 3:59 PM | 11 (8.9%) | 9 (11.1%) |
| 4:00 PM to 11:59 PM | 8 (6.5%) | 12 (14.8%) |
| Total | 123 (100.0%) | 81 (100.0%) |
Housing Occupancy in Senecaville
Occupancy by Ownership in Senecaville
Of the total 209 dwellings in Senecaville, owner-occupied units account for 158 (75.6%), while renter-occupied units make up 51 (24.4%).
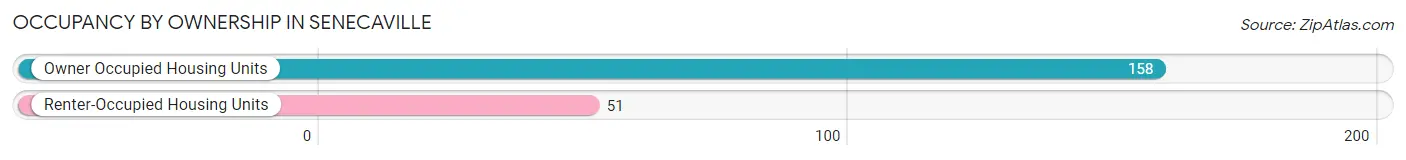
| Occupancy | # Housing Units | % Housing Units |
| Owner Occupied Housing Units | 158 | 75.6% |
| Renter-Occupied Housing Units | 51 | 24.4% |
| Total Occupied Housing Units | 209 | 100.0% |
Occupancy by Household Size in Senecaville
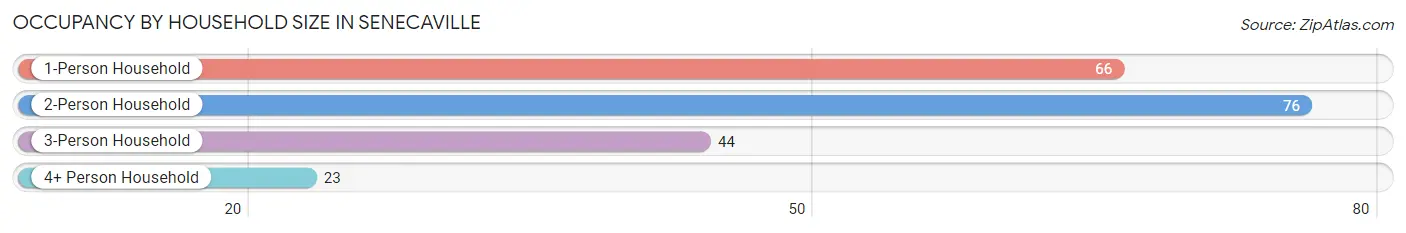
| Household Size | # Housing Units | % Housing Units |
| 1-Person Household | 66 | 31.6% |
| 2-Person Household | 76 | 36.4% |
| 3-Person Household | 44 | 21.0% |
| 4+ Person Household | 23 | 11.0% |
| Total Housing Units | 209 | 100.0% |
Occupancy by Ownership by Household Size in Senecaville
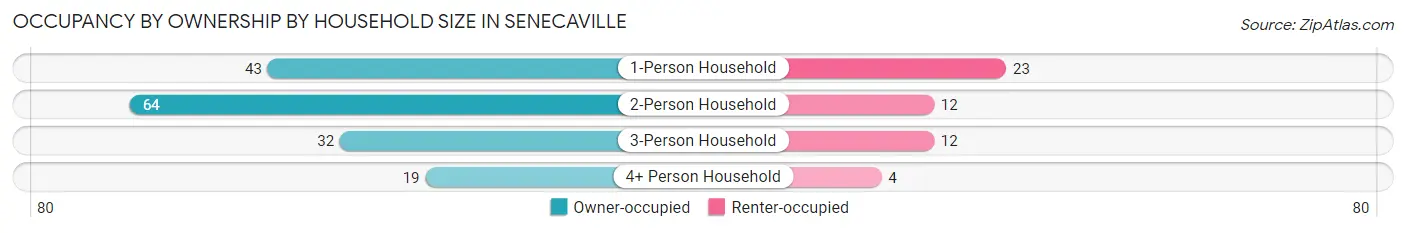
| Household Size | Owner-occupied | Renter-occupied |
| 1-Person Household | 43 (65.1%) | 23 (34.8%) |
| 2-Person Household | 64 (84.2%) | 12 (15.8%) |
| 3-Person Household | 32 (72.7%) | 12 (27.3%) |
| 4+ Person Household | 19 (82.6%) | 4 (17.4%) |
| Total Housing Units | 158 (75.6%) | 51 (24.4%) |
Occupancy by Educational Attainment in Senecaville
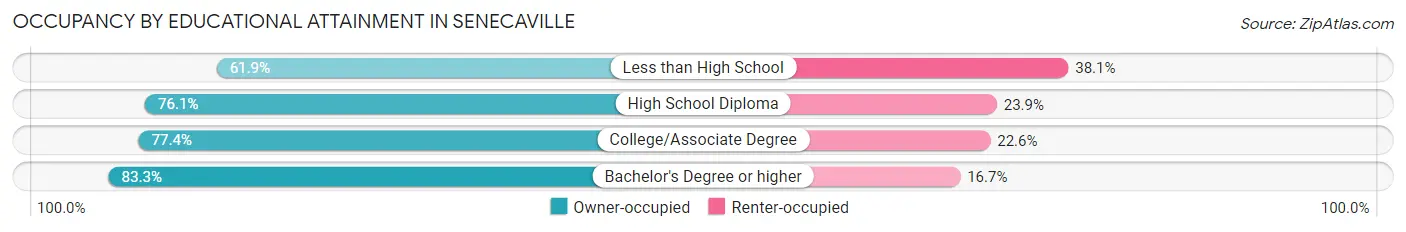
| Household Size | Owner-occupied | Renter-occupied |
| Less than High School | 13 (61.9%) | 8 (38.1%) |
| High School Diploma | 70 (76.1%) | 22 (23.9%) |
| College/Associate Degree | 65 (77.4%) | 19 (22.6%) |
| Bachelor's Degree or higher | 10 (83.3%) | 2 (16.7%) |
Occupancy by Age of Householder in Senecaville
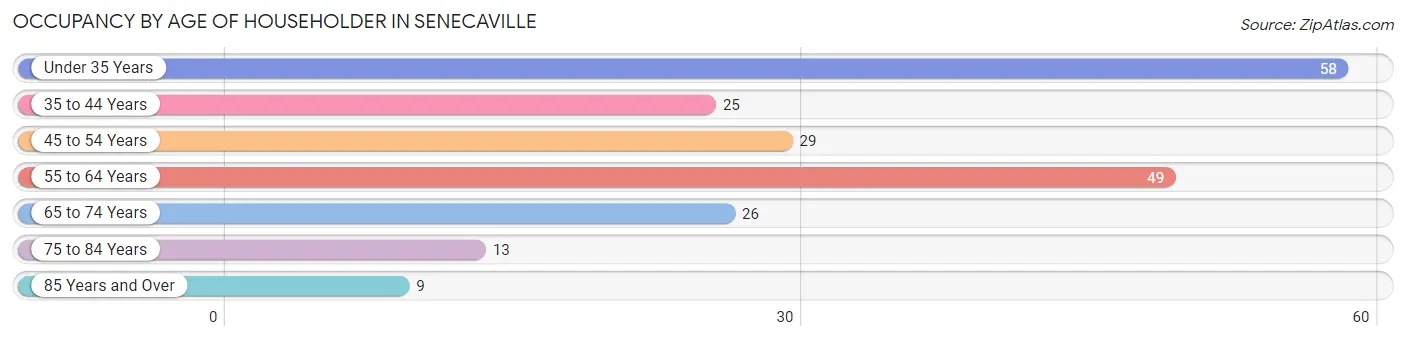
| Age Bracket | # Households | % Households |
| Under 35 Years | 58 | 27.8% |
| 35 to 44 Years | 25 | 12.0% |
| 45 to 54 Years | 29 | 13.9% |
| 55 to 64 Years | 49 | 23.4% |
| 65 to 74 Years | 26 | 12.4% |
| 75 to 84 Years | 13 | 6.2% |
| 85 Years and Over | 9 | 4.3% |
| Total | 209 | 100.0% |
Housing Finances in Senecaville
Median Income by Occupancy in Senecaville
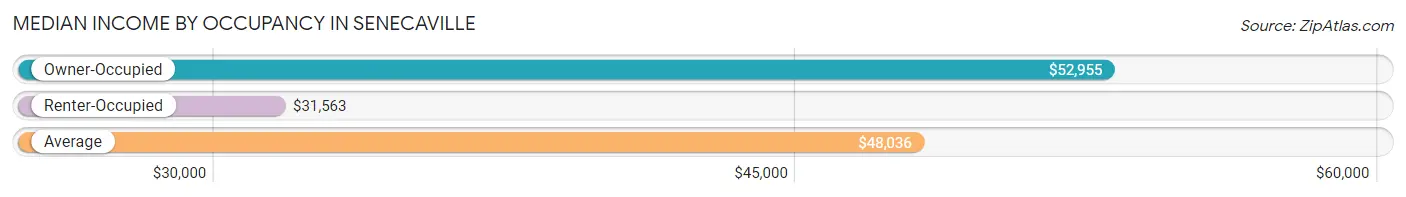
| Occupancy Type | # Households | Median Income |
| Owner-Occupied | 158 (75.6%) | $52,955 |
| Renter-Occupied | 51 (24.4%) | $31,563 |
| Average | 209 (100.0%) | $48,036 |
Occupancy by Householder Income Bracket in Senecaville
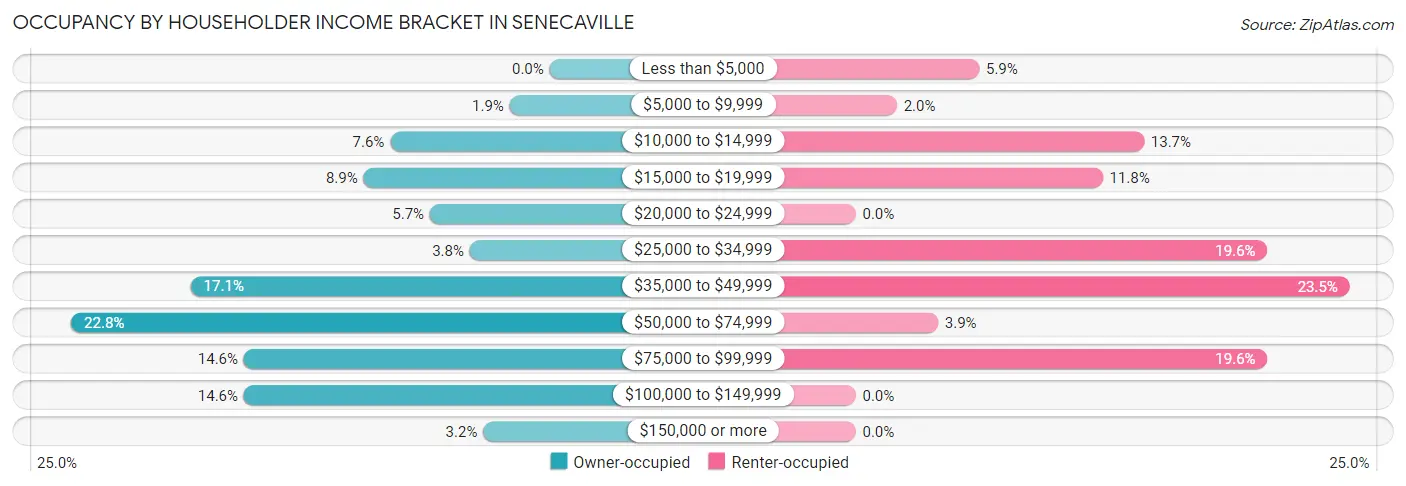
| Income Bracket | Owner-occupied | Renter-occupied |
| Less than $5,000 | 0 (0.0%) | 3 (5.9%) |
| $5,000 to $9,999 | 3 (1.9%) | 1 (2.0%) |
| $10,000 to $14,999 | 12 (7.6%) | 7 (13.7%) |
| $15,000 to $19,999 | 14 (8.9%) | 6 (11.8%) |
| $20,000 to $24,999 | 9 (5.7%) | 0 (0.0%) |
| $25,000 to $34,999 | 6 (3.8%) | 10 (19.6%) |
| $35,000 to $49,999 | 27 (17.1%) | 12 (23.5%) |
| $50,000 to $74,999 | 36 (22.8%) | 2 (3.9%) |
| $75,000 to $99,999 | 23 (14.6%) | 10 (19.6%) |
| $100,000 to $149,999 | 23 (14.6%) | 0 (0.0%) |
| $150,000 or more | 5 (3.2%) | 0 (0.0%) |
| Total | 158 (100.0%) | 51 (100.0%) |
Monthly Housing Cost Tiers in Senecaville
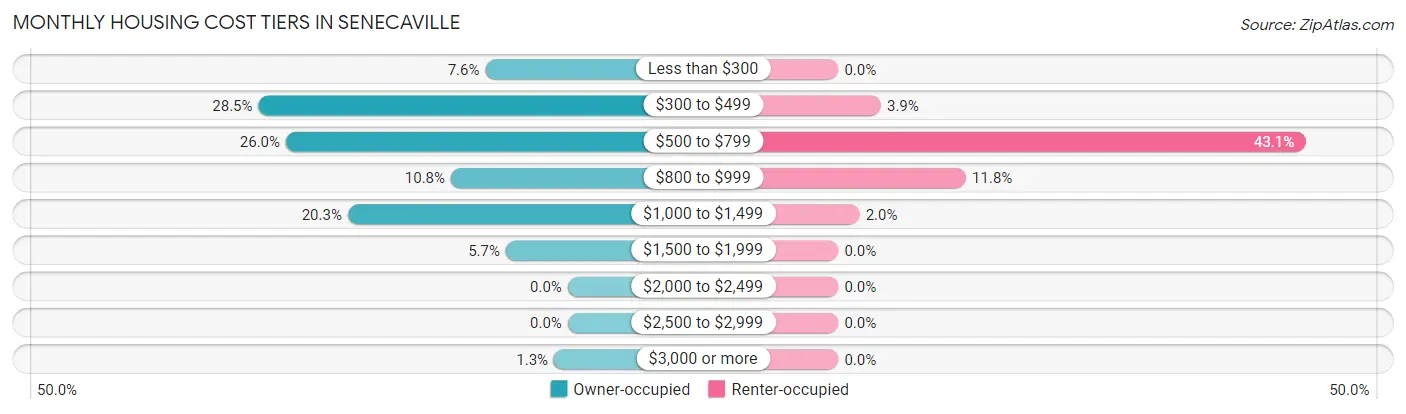
| Monthly Cost | Owner-occupied | Renter-occupied |
| Less than $300 | 12 (7.6%) | 0 (0.0%) |
| $300 to $499 | 45 (28.5%) | 2 (3.9%) |
| $500 to $799 | 41 (26.0%) | 22 (43.1%) |
| $800 to $999 | 17 (10.8%) | 6 (11.8%) |
| $1,000 to $1,499 | 32 (20.3%) | 1 (2.0%) |
| $1,500 to $1,999 | 9 (5.7%) | 0 (0.0%) |
| $2,000 to $2,499 | 0 (0.0%) | 0 (0.0%) |
| $2,500 to $2,999 | 0 (0.0%) | 0 (0.0%) |
| $3,000 or more | 2 (1.3%) | 0 (0.0%) |
| Total | 158 (100.0%) | 51 (100.0%) |
Physical Housing Characteristics in Senecaville
Housing Structures in Senecaville
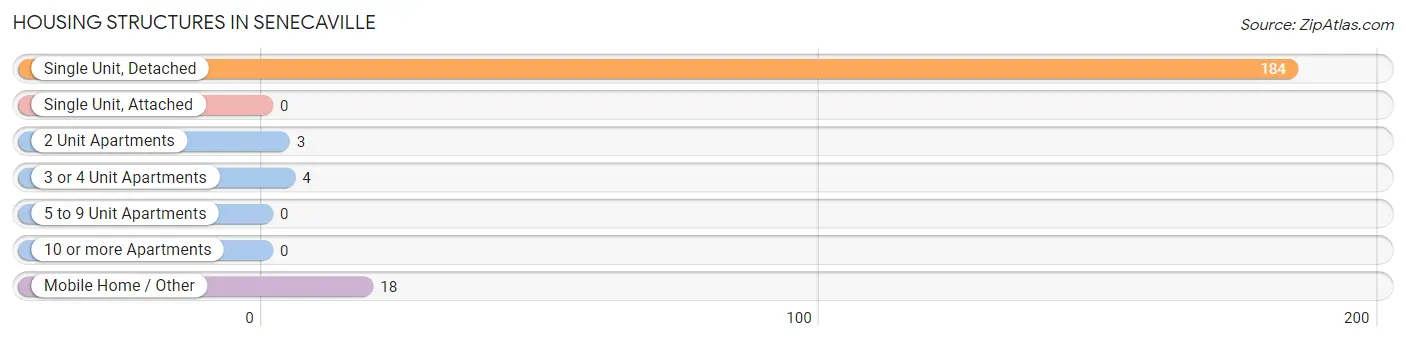
| Structure Type | # Housing Units | % Housing Units |
| Single Unit, Detached | 184 | 88.0% |
| Single Unit, Attached | 0 | 0.0% |
| 2 Unit Apartments | 3 | 1.4% |
| 3 or 4 Unit Apartments | 4 | 1.9% |
| 5 to 9 Unit Apartments | 0 | 0.0% |
| 10 or more Apartments | 0 | 0.0% |
| Mobile Home / Other | 18 | 8.6% |
| Total | 209 | 100.0% |
Housing Structures by Occupancy in Senecaville
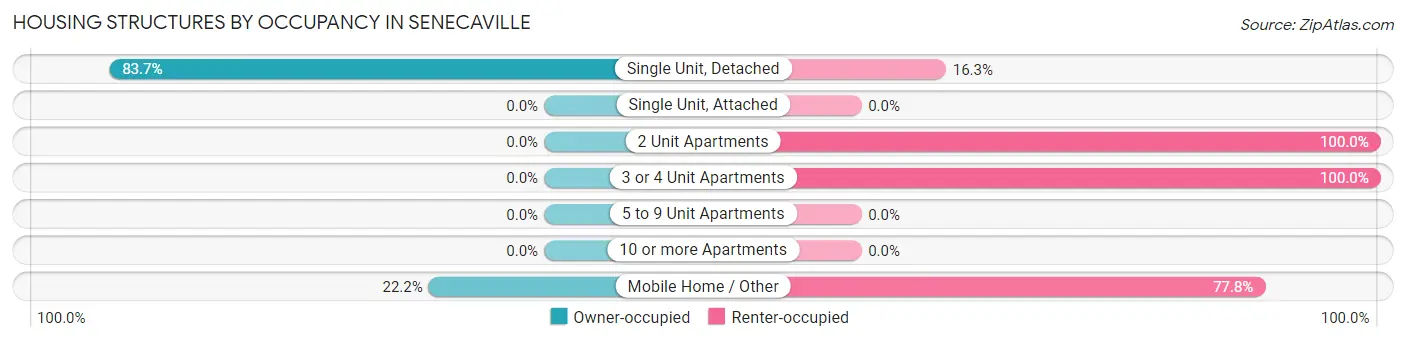
| Structure Type | Owner-occupied | Renter-occupied |
| Single Unit, Detached | 154 (83.7%) | 30 (16.3%) |
| Single Unit, Attached | 0 (0.0%) | 0 (0.0%) |
| 2 Unit Apartments | 0 (0.0%) | 3 (100.0%) |
| 3 or 4 Unit Apartments | 0 (0.0%) | 4 (100.0%) |
| 5 to 9 Unit Apartments | 0 (0.0%) | 0 (0.0%) |
| 10 or more Apartments | 0 (0.0%) | 0 (0.0%) |
| Mobile Home / Other | 4 (22.2%) | 14 (77.8%) |
| Total | 158 (75.6%) | 51 (24.4%) |
Housing Structures by Number of Rooms in Senecaville
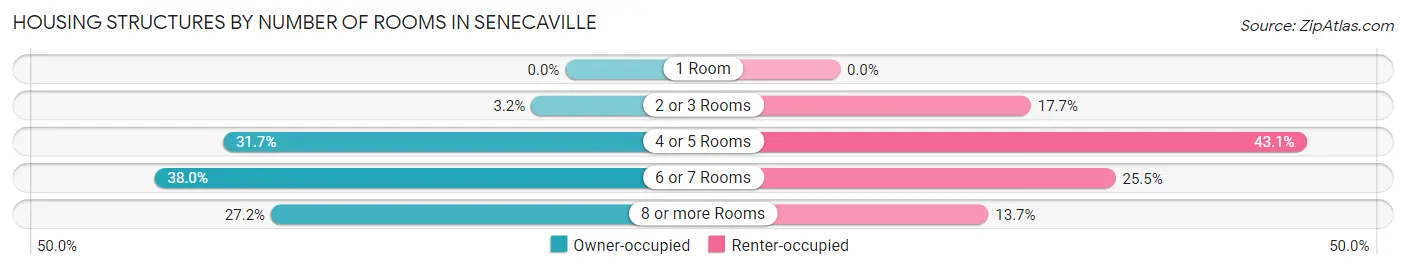
| Number of Rooms | Owner-occupied | Renter-occupied |
| 1 Room | 0 (0.0%) | 0 (0.0%) |
| 2 or 3 Rooms | 5 (3.2%) | 9 (17.6%) |
| 4 or 5 Rooms | 50 (31.7%) | 22 (43.1%) |
| 6 or 7 Rooms | 60 (38.0%) | 13 (25.5%) |
| 8 or more Rooms | 43 (27.2%) | 7 (13.7%) |
| Total | 158 (100.0%) | 51 (100.0%) |
Housing Structure by Heating Type in Senecaville
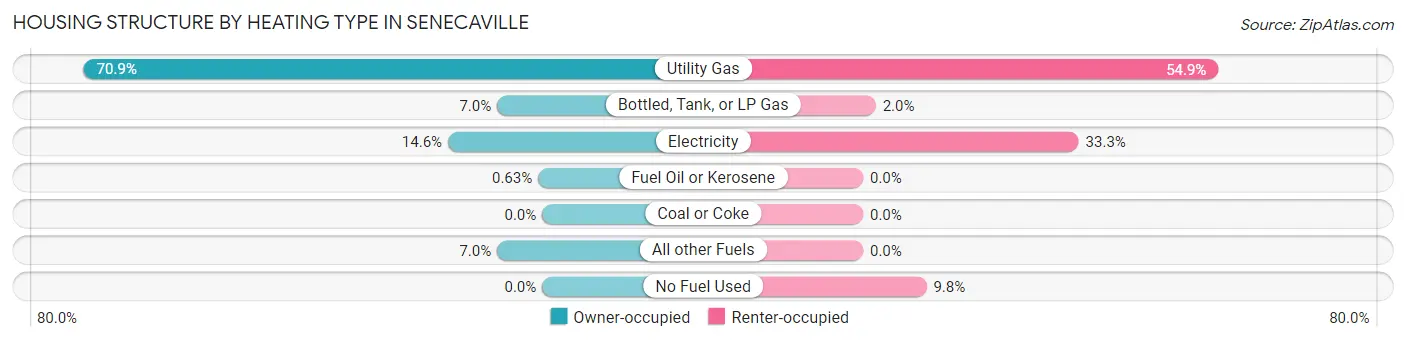
| Heating Type | Owner-occupied | Renter-occupied |
| Utility Gas | 112 (70.9%) | 28 (54.9%) |
| Bottled, Tank, or LP Gas | 11 (7.0%) | 1 (2.0%) |
| Electricity | 23 (14.6%) | 17 (33.3%) |
| Fuel Oil or Kerosene | 1 (0.6%) | 0 (0.0%) |
| Coal or Coke | 0 (0.0%) | 0 (0.0%) |
| All other Fuels | 11 (7.0%) | 0 (0.0%) |
| No Fuel Used | 0 (0.0%) | 5 (9.8%) |
| Total | 158 (100.0%) | 51 (100.0%) |
Household Vehicle Usage in Senecaville
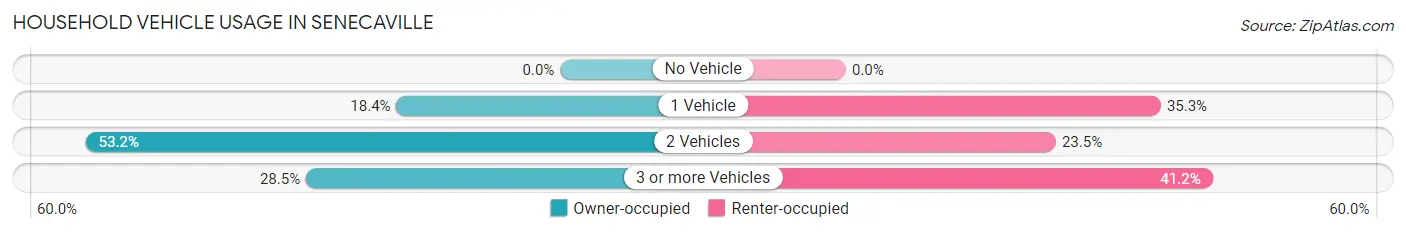
| Vehicles per Household | Owner-occupied | Renter-occupied |
| No Vehicle | 0 (0.0%) | 0 (0.0%) |
| 1 Vehicle | 29 (18.3%) | 18 (35.3%) |
| 2 Vehicles | 84 (53.2%) | 12 (23.5%) |
| 3 or more Vehicles | 45 (28.5%) | 21 (41.2%) |
| Total | 158 (100.0%) | 51 (100.0%) |
Real Estate & Mortgages in Senecaville
Real Estate and Mortgage Overview in Senecaville
| Characteristic | Without Mortgage | With Mortgage |
| Housing Units | 76 | 82 |
| Median Property Value | $92,000 | $98,200 |
| Median Household Income | $39,375 | $5 |
| Monthly Housing Costs | $382 | $2 |
| Real Estate Taxes | $933 | $2 |
Property Value by Mortgage Status in Senecaville
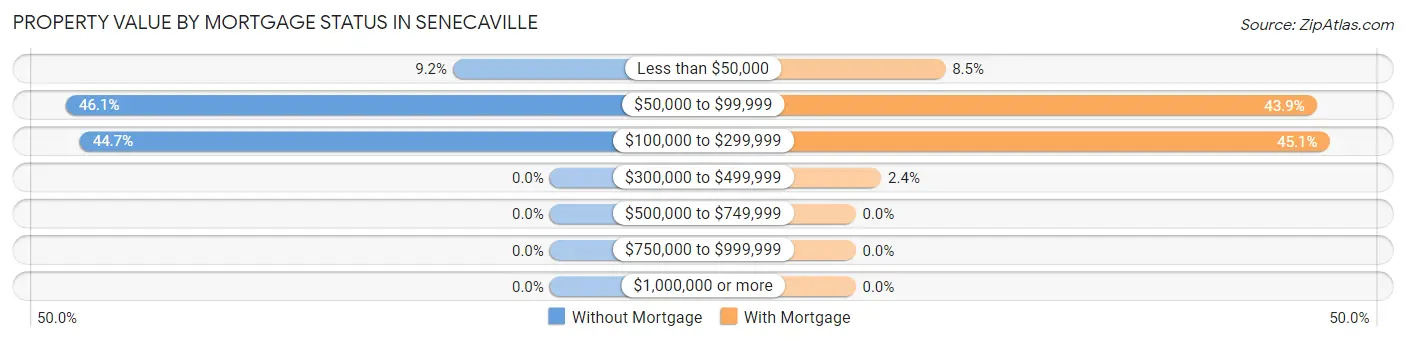
| Property Value | Without Mortgage | With Mortgage |
| Less than $50,000 | 7 (9.2%) | 7 (8.5%) |
| $50,000 to $99,999 | 35 (46.1%) | 36 (43.9%) |
| $100,000 to $299,999 | 34 (44.7%) | 37 (45.1%) |
| $300,000 to $499,999 | 0 (0.0%) | 2 (2.4%) |
| $500,000 to $749,999 | 0 (0.0%) | 0 (0.0%) |
| $750,000 to $999,999 | 0 (0.0%) | 0 (0.0%) |
| $1,000,000 or more | 0 (0.0%) | 0 (0.0%) |
| Total | 76 (100.0%) | 82 (100.0%) |
Household Income by Mortgage Status in Senecaville
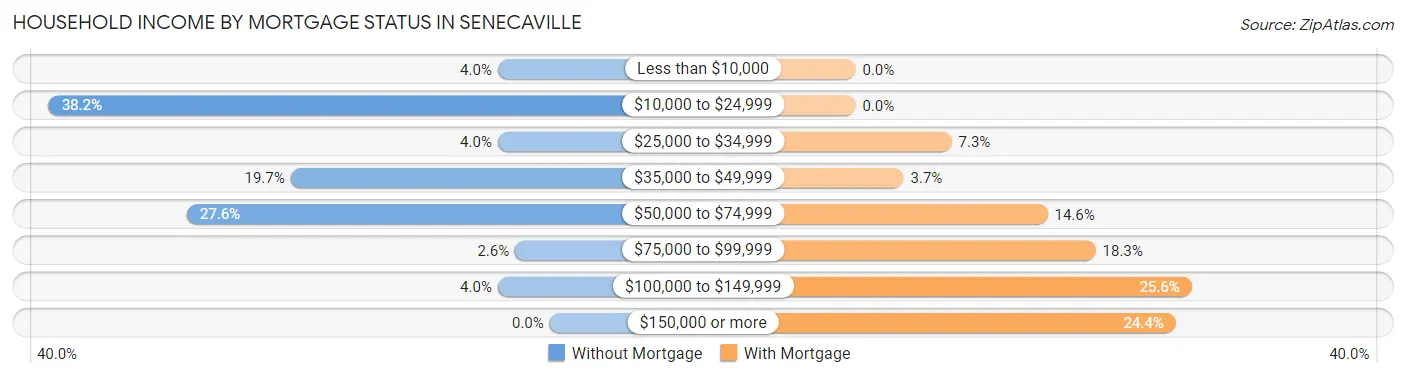
| Household Income | Without Mortgage | With Mortgage |
| Less than $10,000 | 3 (4.0%) | 0 (0.0%) |
| $10,000 to $24,999 | 29 (38.2%) | 0 (0.0%) |
| $25,000 to $34,999 | 3 (4.0%) | 6 (7.3%) |
| $35,000 to $49,999 | 15 (19.7%) | 3 (3.7%) |
| $50,000 to $74,999 | 21 (27.6%) | 12 (14.6%) |
| $75,000 to $99,999 | 2 (2.6%) | 15 (18.3%) |
| $100,000 to $149,999 | 3 (4.0%) | 21 (25.6%) |
| $150,000 or more | 0 (0.0%) | 20 (24.4%) |
| Total | 76 (100.0%) | 82 (100.0%) |
Property Value to Household Income Ratio in Senecaville
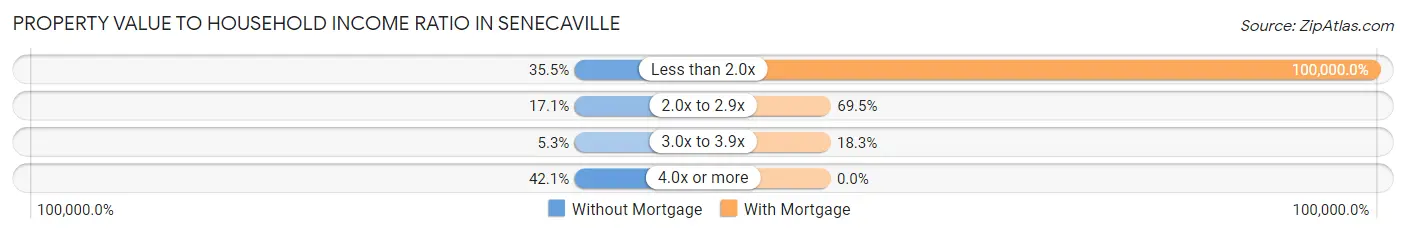
| Value-to-Income Ratio | Without Mortgage | With Mortgage |
| Less than 2.0x | 27 (35.5%) | 82,000 (100,000.0%) |
| 2.0x to 2.9x | 13 (17.1%) | 57 (69.5%) |
| 3.0x to 3.9x | 4 (5.3%) | 15 (18.3%) |
| 4.0x or more | 32 (42.1%) | 0 (0.0%) |
| Total | 76 (100.0%) | 82 (100.0%) |
Real Estate Taxes by Mortgage Status in Senecaville
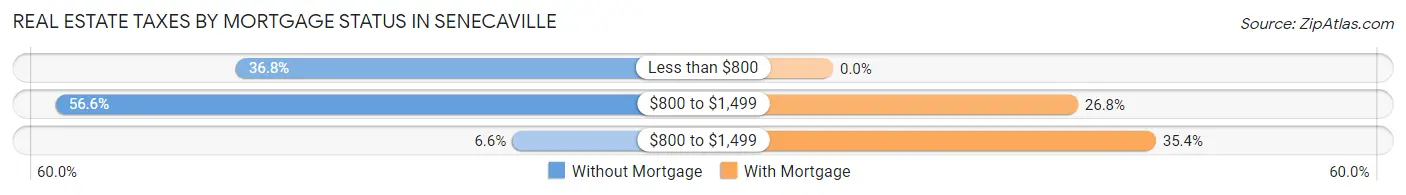
| Property Taxes | Without Mortgage | With Mortgage |
| Less than $800 | 28 (36.8%) | 0 (0.0%) |
| $800 to $1,499 | 43 (56.6%) | 22 (26.8%) |
| $800 to $1,499 | 5 (6.6%) | 29 (35.4%) |
| Total | 76 (100.0%) | 82 (100.0%) |
Health & Disability in Senecaville
Health Insurance Coverage by Age in Senecaville
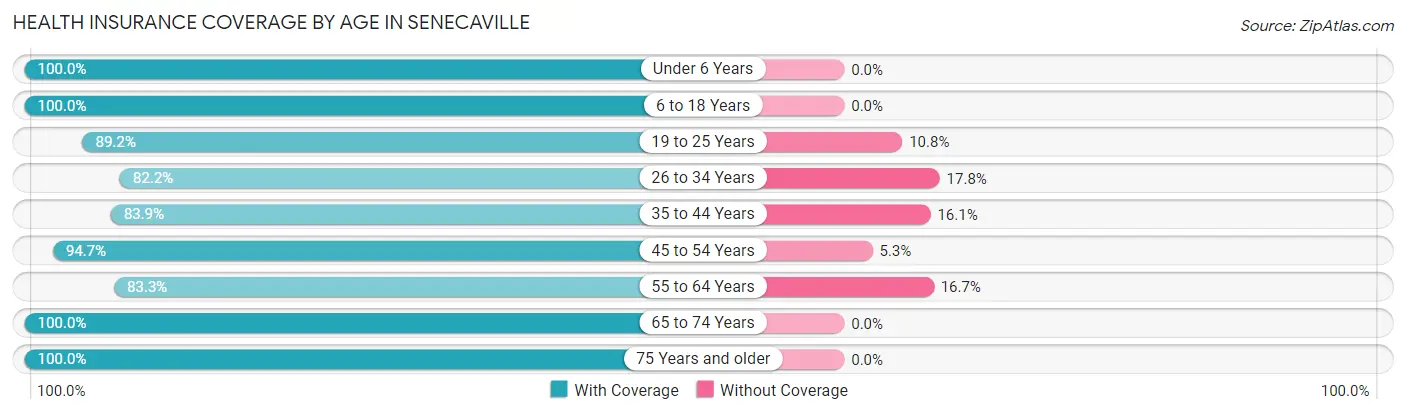
| Age Bracket | With Coverage | Without Coverage |
| Under 6 Years | 30 (100.0%) | 0 (0.0%) |
| 6 to 18 Years | 54 (100.0%) | 0 (0.0%) |
| 19 to 25 Years | 33 (89.2%) | 4 (10.8%) |
| 26 to 34 Years | 74 (82.2%) | 16 (17.8%) |
| 35 to 44 Years | 47 (83.9%) | 9 (16.1%) |
| 45 to 54 Years | 36 (94.7%) | 2 (5.3%) |
| 55 to 64 Years | 55 (83.3%) | 11 (16.7%) |
| 65 to 74 Years | 50 (100.0%) | 0 (0.0%) |
| 75 Years and older | 28 (100.0%) | 0 (0.0%) |
| Total | 407 (90.6%) | 42 (9.3%) |
Health Insurance Coverage by Citizenship Status in Senecaville
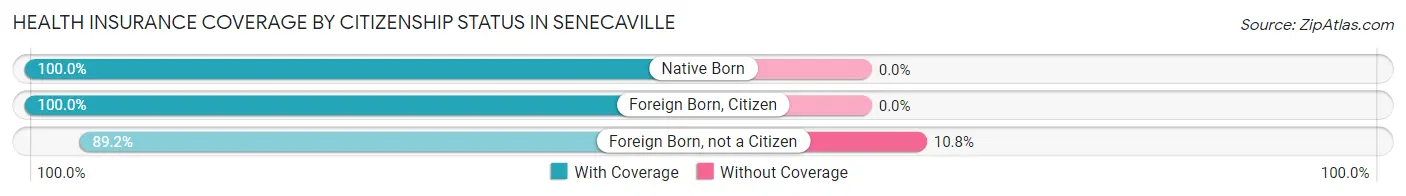
| Citizenship Status | With Coverage | Without Coverage |
| Native Born | 30 (100.0%) | 0 (0.0%) |
| Foreign Born, Citizen | 54 (100.0%) | 0 (0.0%) |
| Foreign Born, not a Citizen | 33 (89.2%) | 4 (10.8%) |
Health Insurance Coverage by Household Income in Senecaville
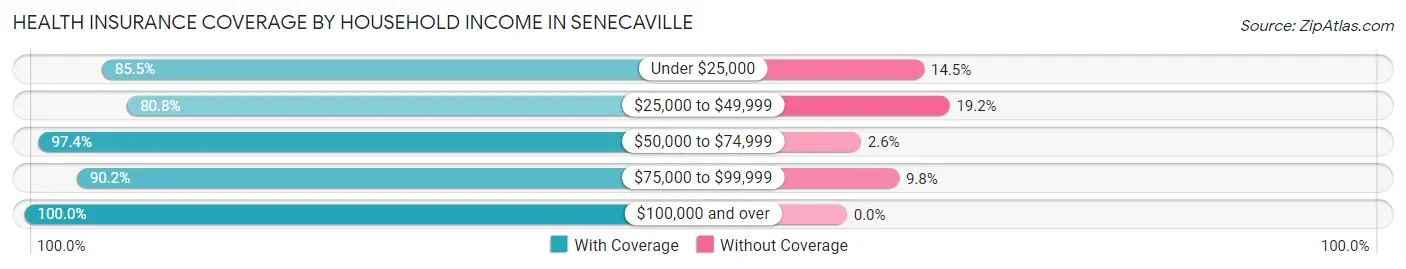
| Household Income | With Coverage | Without Coverage |
| Under $25,000 | 65 (85.5%) | 11 (14.5%) |
| $25,000 to $49,999 | 84 (80.8%) | 20 (19.2%) |
| $50,000 to $74,999 | 74 (97.4%) | 2 (2.6%) |
| $75,000 to $99,999 | 83 (90.2%) | 9 (9.8%) |
| $100,000 and over | 101 (100.0%) | 0 (0.0%) |
Public vs Private Health Insurance Coverage by Age in Senecaville
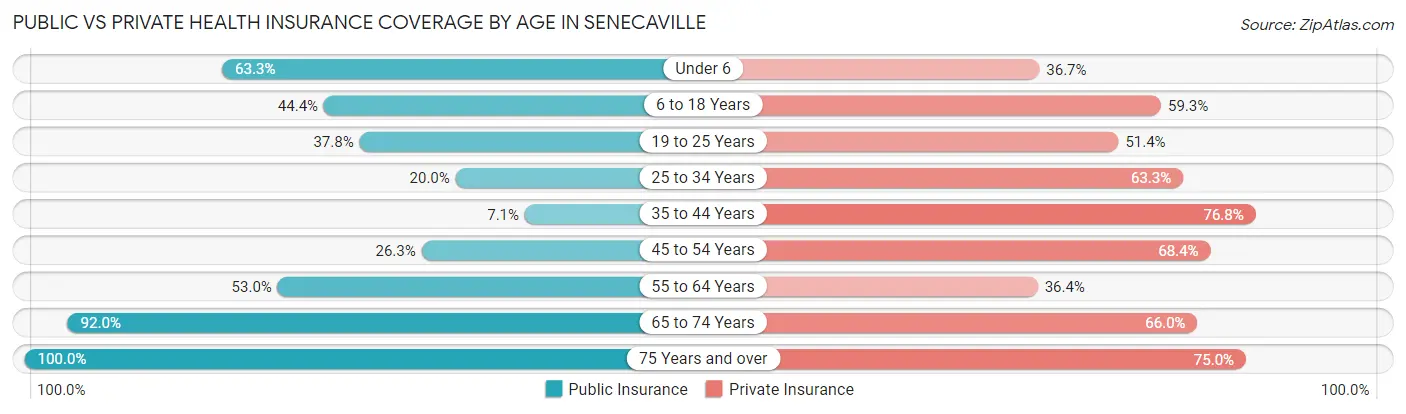
| Age Bracket | Public Insurance | Private Insurance |
| Under 6 | 19 (63.3%) | 11 (36.7%) |
| 6 to 18 Years | 24 (44.4%) | 32 (59.3%) |
| 19 to 25 Years | 14 (37.8%) | 19 (51.3%) |
| 25 to 34 Years | 18 (20.0%) | 57 (63.3%) |
| 35 to 44 Years | 4 (7.1%) | 43 (76.8%) |
| 45 to 54 Years | 10 (26.3%) | 26 (68.4%) |
| 55 to 64 Years | 35 (53.0%) | 24 (36.4%) |
| 65 to 74 Years | 46 (92.0%) | 33 (66.0%) |
| 75 Years and over | 28 (100.0%) | 21 (75.0%) |
| Total | 198 (44.1%) | 266 (59.2%) |
Disability Status by Sex by Age in Senecaville
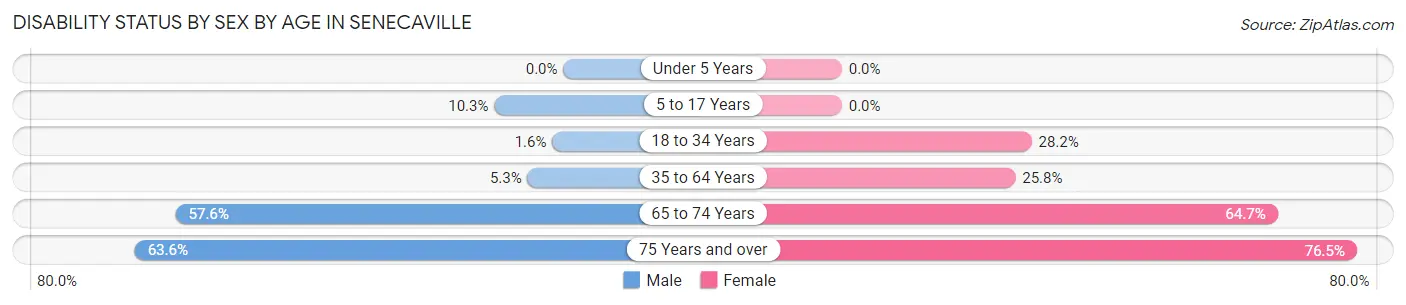
| Age Bracket | Male | Female |
| Under 5 Years | 0 (0.0%) | 0 (0.0%) |
| 5 to 17 Years | 4 (10.3%) | 0 (0.0%) |
| 18 to 34 Years | 1 (1.6%) | 20 (28.2%) |
| 35 to 64 Years | 5 (5.3%) | 17 (25.8%) |
| 65 to 74 Years | 19 (57.6%) | 11 (64.7%) |
| 75 Years and over | 7 (63.6%) | 13 (76.5%) |
Disability Class by Sex by Age in Senecaville
Disability Class: Hearing Difficulty
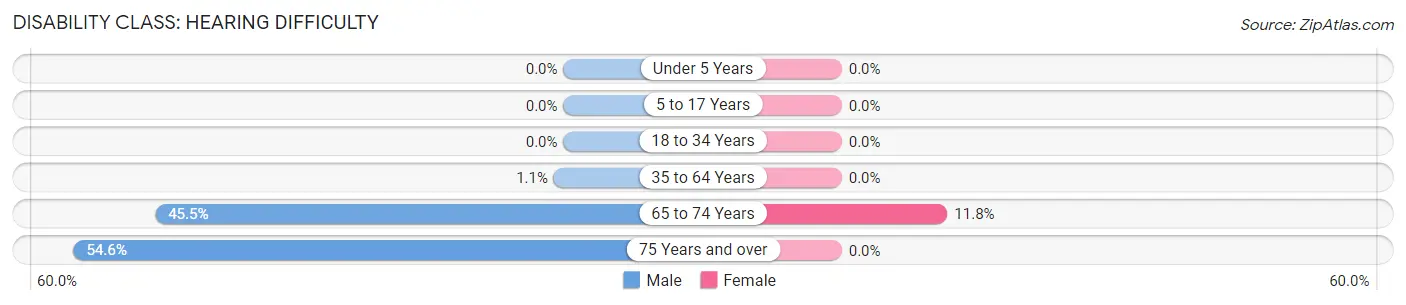
| Age Bracket | Male | Female |
| Under 5 Years | 0 (0.0%) | 0 (0.0%) |
| 5 to 17 Years | 0 (0.0%) | 0 (0.0%) |
| 18 to 34 Years | 0 (0.0%) | 0 (0.0%) |
| 35 to 64 Years | 1 (1.1%) | 0 (0.0%) |
| 65 to 74 Years | 15 (45.5%) | 2 (11.8%) |
| 75 Years and over | 6 (54.5%) | 0 (0.0%) |
Disability Class: Vision Difficulty
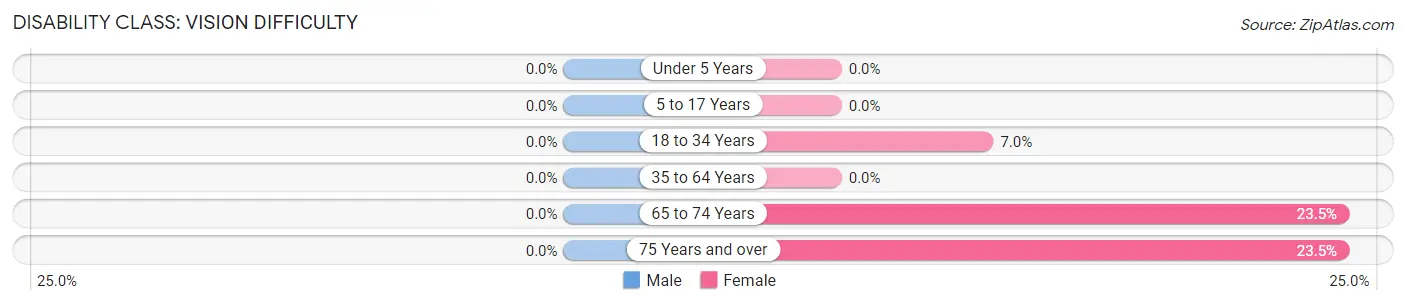
| Age Bracket | Male | Female |
| Under 5 Years | 0 (0.0%) | 0 (0.0%) |
| 5 to 17 Years | 0 (0.0%) | 0 (0.0%) |
| 18 to 34 Years | 0 (0.0%) | 5 (7.0%) |
| 35 to 64 Years | 0 (0.0%) | 0 (0.0%) |
| 65 to 74 Years | 0 (0.0%) | 4 (23.5%) |
| 75 Years and over | 0 (0.0%) | 4 (23.5%) |
Disability Class: Cognitive Difficulty
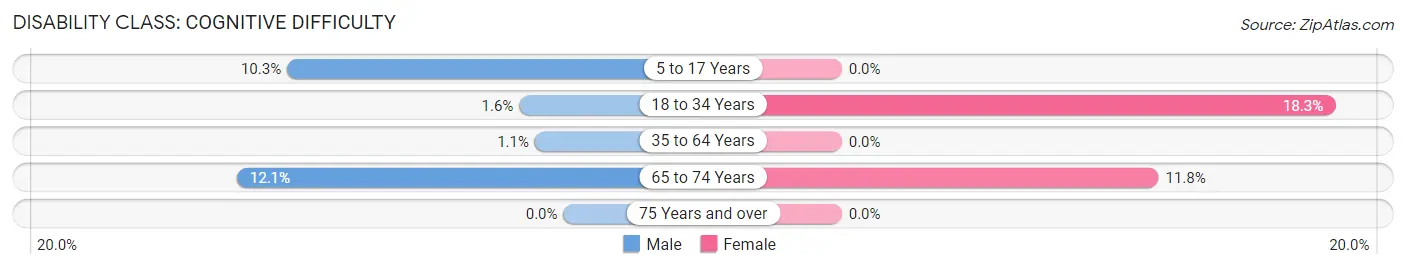
| Age Bracket | Male | Female |
| 5 to 17 Years | 4 (10.3%) | 0 (0.0%) |
| 18 to 34 Years | 1 (1.6%) | 13 (18.3%) |
| 35 to 64 Years | 1 (1.1%) | 0 (0.0%) |
| 65 to 74 Years | 4 (12.1%) | 2 (11.8%) |
| 75 Years and over | 0 (0.0%) | 0 (0.0%) |
Disability Class: Ambulatory Difficulty
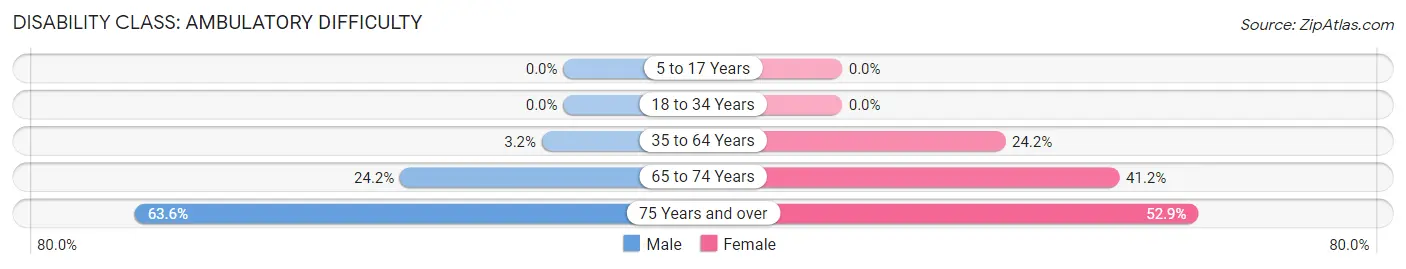
| Age Bracket | Male | Female |
| 5 to 17 Years | 0 (0.0%) | 0 (0.0%) |
| 18 to 34 Years | 0 (0.0%) | 0 (0.0%) |
| 35 to 64 Years | 3 (3.2%) | 16 (24.2%) |
| 65 to 74 Years | 8 (24.2%) | 7 (41.2%) |
| 75 Years and over | 7 (63.6%) | 9 (52.9%) |
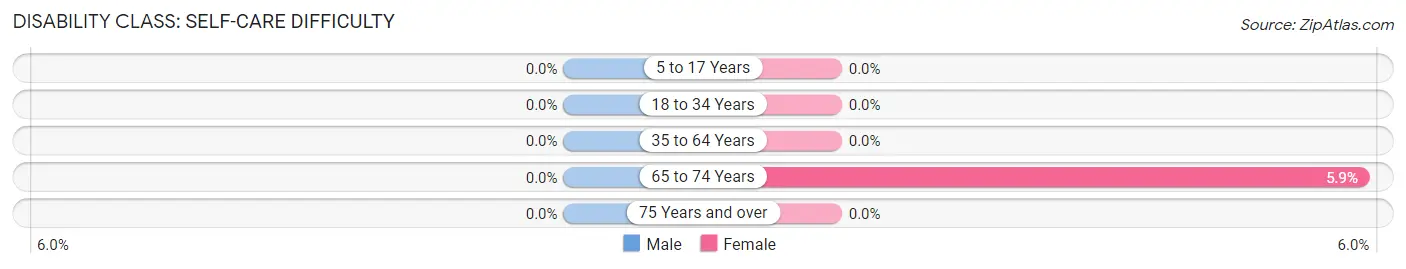
Disability Class: Self-Care Difficulty
| Age Bracket | Male | Female |
| 5 to 17 Years | 0 (0.0%) | 0 (0.0%) |
| 18 to 34 Years | 0 (0.0%) | 0 (0.0%) |
| 35 to 64 Years | 0 (0.0%) | 0 (0.0%) |
| 65 to 74 Years | 0 (0.0%) | 1 (5.9%) |
| 75 Years and over | 0 (0.0%) | 0 (0.0%) |
Technology Access in Senecaville
Computing Device Access in Senecaville
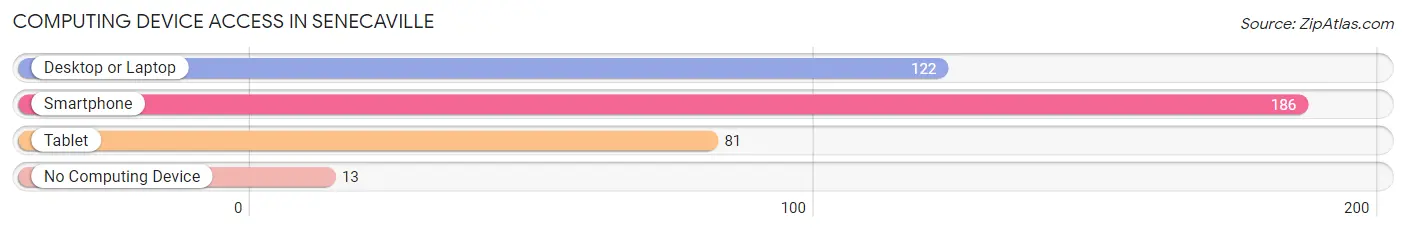
| Device Type | # Households | % Households |
| Desktop or Laptop | 122 | 58.4% |
| Smartphone | 186 | 89.0% |
| Tablet | 81 | 38.8% |
| No Computing Device | 13 | 6.2% |
| Total | 209 | 100.0% |
Internet Access in Senecaville
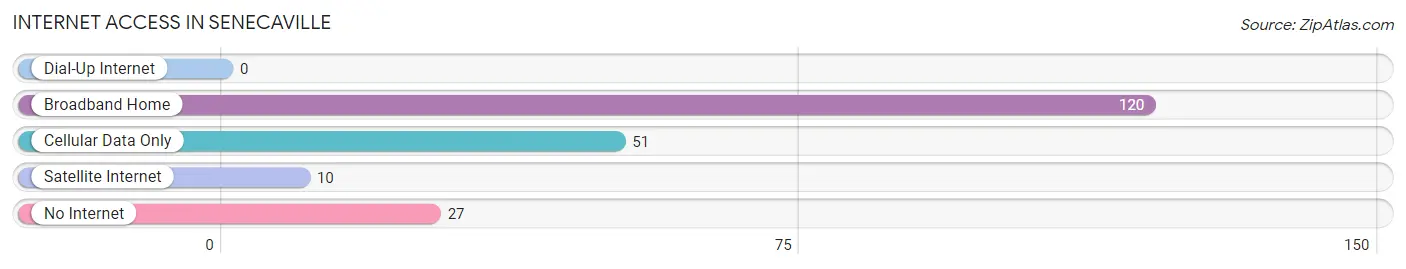
| Internet Type | # Households | % Households |
| Dial-Up Internet | 0 | 0.0% |
| Broadband Home | 120 | 57.4% |
| Cellular Data Only | 51 | 24.4% |
| Satellite Internet | 10 | 4.8% |
| No Internet | 27 | 12.9% |
| Total | 209 | 100.0% |
Senecaville Summary
Senecaville is a small village located in Guernsey County, Ohio. It is situated on the western edge of the county, near the border of Noble County. The village has a population of approximately 500 people and is part of the Cambridge Micropolitan Statistical Area.
History
Senecaville was founded in 1817 by a group of settlers from Pennsylvania. The village was named after the Seneca Indians, who had previously inhabited the area. The first settlers were primarily farmers, and the village quickly grew to become a thriving agricultural community.
In 1820, the first post office was established in Senecaville. The village was incorporated in 1837, and the first mayor was elected in 1838.
In the late 19th century, Senecaville became a popular tourist destination. The village was home to several resorts, including the Senecaville Hotel, which was built in 1891. The hotel was a popular destination for wealthy visitors from Cleveland and Pittsburgh.
In the early 20th century, Senecaville experienced a period of economic decline. The village was hit hard by the Great Depression, and many of the resorts and businesses closed.
Geography
Senecaville is located in the Appalachian Plateau region of Ohio. The village is situated on the western edge of Guernsey County, near the border of Noble County. The village is located on the banks of Senecaville Lake, which is a popular recreational destination.
The village is surrounded by rolling hills and forests. The nearby Tappan Lake State Park offers a variety of outdoor activities, including camping, fishing, and hiking.
Economy
The economy of Senecaville is largely based on agriculture. The village is home to several farms, which produce a variety of crops, including corn, soybeans, and wheat.
The village is also home to several small businesses, including a grocery store, a hardware store, and a few restaurants. The village is also home to a few manufacturing companies, which produce a variety of products, including furniture and automotive parts.
Demographics
As of the 2010 census, the population of Senecaville was 498. The racial makeup of the village was 97.2% White, 0.6% African American, 0.2% Native American, 0.2% Asian, 0.2% from other races, and 1.8% from two or more races. Hispanic or Latino of any race were 0.8% of the population.
The median household income in Senecaville was $37,500, and the median family income was $45,000. The per capita income was $18,000. About 11.2% of families and 14.2% of the population were below the poverty line, including 18.2% of those under age 18 and 8.2% of those age 65 or over.
Common Questions
What is Per Capita Income in Senecaville?
Per Capita income in Senecaville is $27,244.
What is the Median Family Income in Senecaville?
Median Family Income in Senecaville is $53,750.
What is the Median Household income in Senecaville?
Median Household Income in Senecaville is $48,036.
What is Income or Wage Gap in Senecaville?
Income or Wage Gap in Senecaville is 43.0%.
Women in Senecaville earn 57.0 cents for every dollar earned by a man.
What is Inequality or Gini Index in Senecaville?
Inequality or Gini Index in Senecaville is 0.39.
What is the Total Population of Senecaville?
Total Population of Senecaville is 449.
What is the Total Male Population of Senecaville?
Total Male Population of Senecaville is 246.
What is the Total Female Population of Senecaville?
Total Female Population of Senecaville is 203.
What is the Ratio of Males per 100 Females in Senecaville?
There are 121.18 Males per 100 Females in Senecaville.
What is the Ratio of Females per 100 Males in Senecaville?
There are 82.52 Females per 100 Males in Senecaville.
What is the Median Population Age in Senecaville?
Median Population Age in Senecaville is 36.4 Years.
What is the Average Family Size in Senecaville
Average Family Size in Senecaville is 2.5 People.
What is the Average Household Size in Senecaville
Average Household Size in Senecaville is 2.1 People.
How Large is the Labor Force in Senecaville?
There are 215 People in the Labor Forcein in Senecaville.
What is the Percentage of People in the Labor Force in Senecaville?
57.2% of People are in the Labor Force in Senecaville.
What is the Unemployment Rate in Senecaville?
Unemployment Rate in Senecaville is 4.2%.