Butler, OH Map & Demographics
Butler Map
Butler Overview
$25,213
PER CAPITA INCOME
$77,045
AVG FAMILY INCOME
$67,292
AVG HOUSEHOLD INCOME
46.8%
WAGE / INCOME GAP [ % ]
53.2¢/ $1
WAGE / INCOME GAP [ $ ]
0.34
INEQUALITY / GINI INDEX
1,212
TOTAL POPULATION
636
MALE POPULATION
576
FEMALE POPULATION
110.42
MALES / 100 FEMALES
90.57
FEMALES / 100 MALES
28.8
MEDIAN AGE
3.5
AVG FAMILY SIZE
3.0
AVG HOUSEHOLD SIZE
584
LABOR FORCE [ PEOPLE ]
60.3%
PERCENT IN LABOR FORCE
1.2%
UNEMPLOYMENT RATE
Butler Zip Codes
Butler Area Codes
Income in Butler
Income Overview in Butler
Per Capita Income in Butler is $25,213, while median incomes of families and households are $77,045 and $67,292 respectively.
| Characteristic | Number | Measure |
| Per Capita Income | 1,212 | $25,213 |
| Median Family Income | 304 | $77,045 |
| Mean Family Income | 304 | $85,066 |
| Median Household Income | 406 | $67,292 |
| Mean Household Income | 406 | $74,670 |
| Income Deficit | 304 | $0 |
| Wage / Income Gap (%) | 1,212 | 46.84% |
| Wage / Income Gap ($) | 1,212 | 53.16¢ per $1 |
| Gini / Inequality Index | 1,212 | 0.34 |
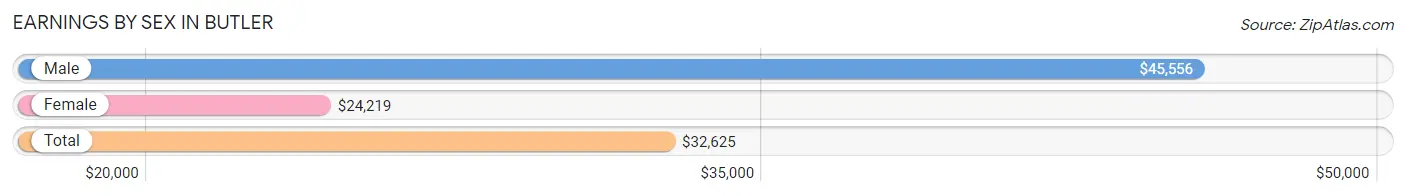
Earnings by Sex in Butler
Average Earnings in Butler are $32,625, $45,556 for men and $24,219 for women, a difference of 46.8%.
| Sex | Number | Average Earnings |
| Male | 338 (49.9%) | $45,556 |
| Female | 339 (50.1%) | $24,219 |
| Total | 677 (100.0%) | $32,625 |
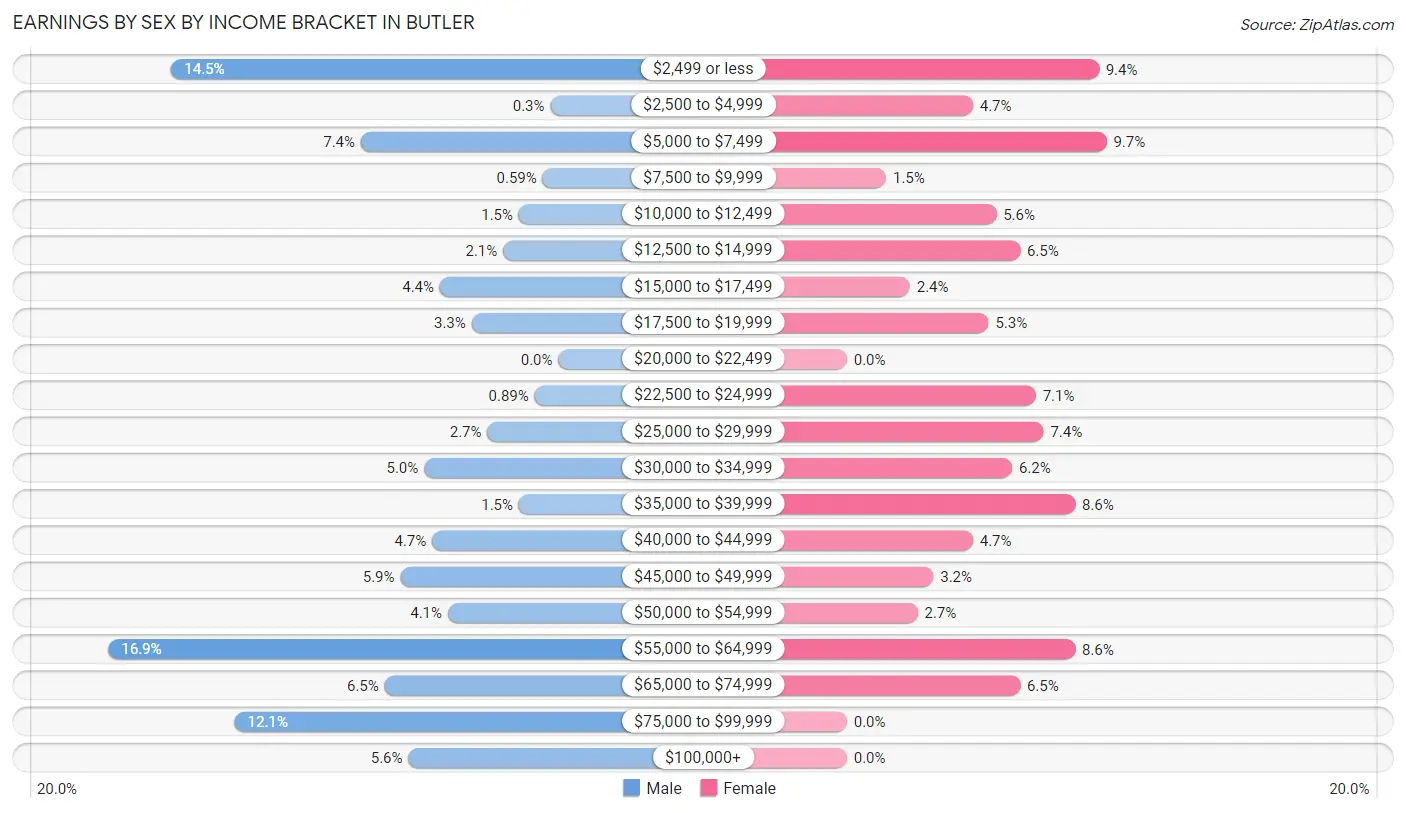
Earnings by Sex by Income Bracket in Butler
The most common earnings brackets in Butler are $55,000 to $64,999 for men (57 | 16.9%) and $5,000 to $7,499 for women (33 | 9.7%).
| Income | Male | Female |
| $2,499 or less | 49 (14.5%) | 32 (9.4%) |
| $2,500 to $4,999 | 1 (0.3%) | 16 (4.7%) |
| $5,000 to $7,499 | 25 (7.4%) | 33 (9.7%) |
| $7,500 to $9,999 | 2 (0.6%) | 5 (1.5%) |
| $10,000 to $12,499 | 5 (1.5%) | 19 (5.6%) |
| $12,500 to $14,999 | 7 (2.1%) | 22 (6.5%) |
| $15,000 to $17,499 | 15 (4.4%) | 8 (2.4%) |
| $17,500 to $19,999 | 11 (3.3%) | 18 (5.3%) |
| $20,000 to $22,499 | 0 (0.0%) | 0 (0.0%) |
| $22,500 to $24,999 | 3 (0.9%) | 24 (7.1%) |
| $25,000 to $29,999 | 9 (2.7%) | 25 (7.4%) |
| $30,000 to $34,999 | 17 (5.0%) | 21 (6.2%) |
| $35,000 to $39,999 | 5 (1.5%) | 29 (8.6%) |
| $40,000 to $44,999 | 16 (4.7%) | 16 (4.7%) |
| $45,000 to $49,999 | 20 (5.9%) | 11 (3.2%) |
| $50,000 to $54,999 | 14 (4.1%) | 9 (2.6%) |
| $55,000 to $64,999 | 57 (16.9%) | 29 (8.6%) |
| $65,000 to $74,999 | 22 (6.5%) | 22 (6.5%) |
| $75,000 to $99,999 | 41 (12.1%) | 0 (0.0%) |
| $100,000+ | 19 (5.6%) | 0 (0.0%) |
| Total | 338 (100.0%) | 339 (100.0%) |
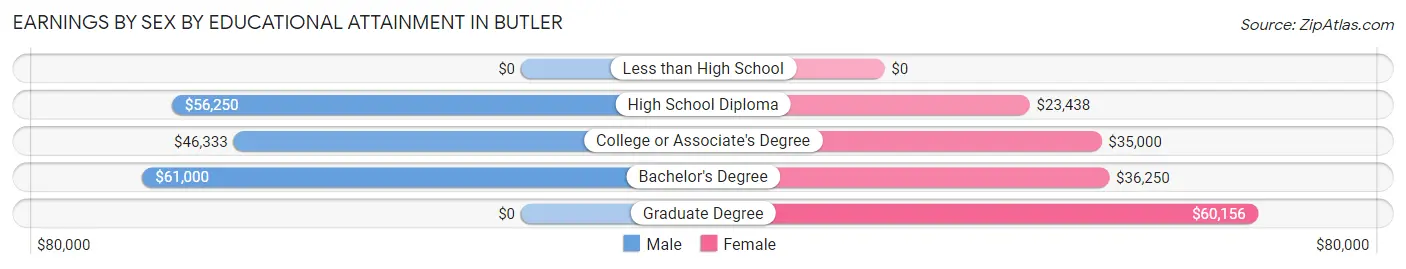
Earnings by Sex by Educational Attainment in Butler
Average earnings in Butler are $56,786 for men and $32,868 for women, a difference of 42.1%. Men with an educational attainment of bachelor's degree enjoy the highest average annual earnings of $61,000, while those with college or associate's degree education earn the least with $46,333. Women with an educational attainment of graduate degree earn the most with the average annual earnings of $60,156, while those with high school diploma education have the smallest earnings of $23,438.
| Educational Attainment | Male Income | Female Income |
| Less than High School | - | - |
| High School Diploma | $56,250 | $23,438 |
| College or Associate's Degree | $46,333 | $35,000 |
| Bachelor's Degree | $61,000 | $36,250 |
| Graduate Degree | - | - |
| Total | $56,786 | $32,868 |
Family Income in Butler
Family Income Brackets in Butler
According to the Butler family income data, there are 81 families falling into the $50,000 to $74,999 income range, which is the most common income bracket and makes up 26.6% of all families.
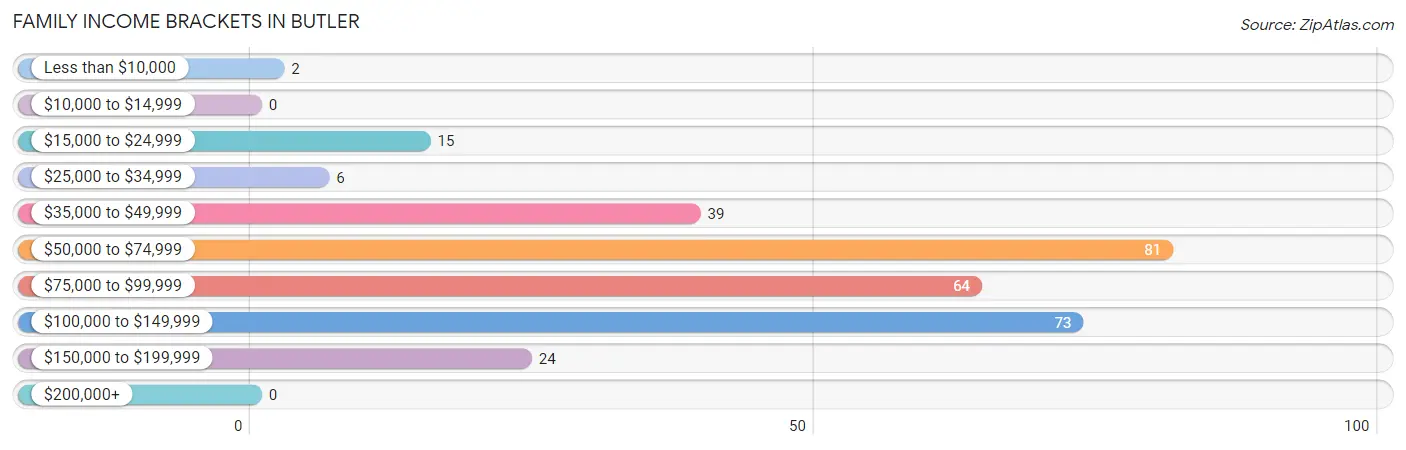
| Income Bracket | # Families | % Families |
| Less than $10,000 | 2 | 0.7% |
| $10,000 to $14,999 | 0 | 0.0% |
| $15,000 to $24,999 | 15 | 4.9% |
| $25,000 to $34,999 | 6 | 2.0% |
| $35,000 to $49,999 | 39 | 12.8% |
| $50,000 to $74,999 | 81 | 26.6% |
| $75,000 to $99,999 | 64 | 21.1% |
| $100,000 to $149,999 | 73 | 24.0% |
| $150,000 to $199,999 | 24 | 7.9% |
| $200,000+ | 0 | 0.0% |
Family Income by Famaliy Size in Butler
3-person families (57 | 18.8%) account for the highest median family income in Butler with $92,625 per family, while 2-person families (115 | 37.8%) have the highest median income of $38,875 per family member.
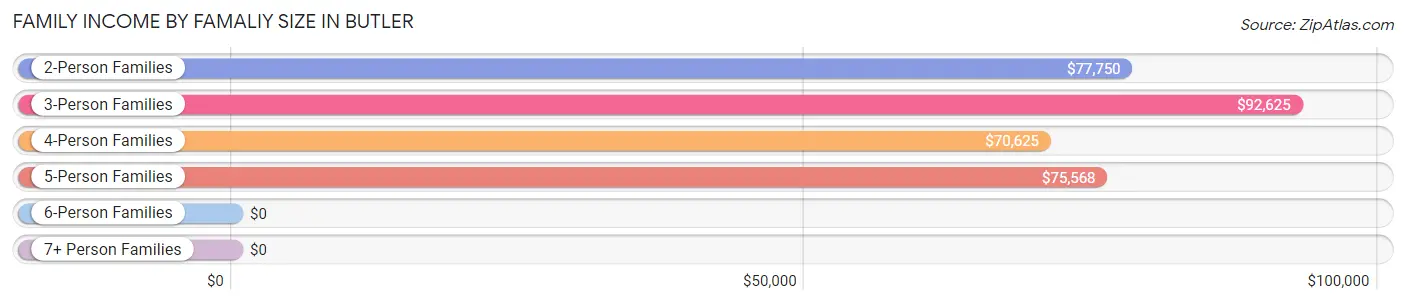
| Income Bracket | # Families | Median Income |
| 2-Person Families | 115 (37.8%) | $77,750 |
| 3-Person Families | 57 (18.8%) | $92,625 |
| 4-Person Families | 83 (27.3%) | $70,625 |
| 5-Person Families | 47 (15.5%) | $75,568 |
| 6-Person Families | 2 (0.7%) | $0 |
| 7+ Person Families | 0 (0.0%) | $0 |
| Total | 304 (100.0%) | $77,045 |
Family Income by Number of Earners in Butler
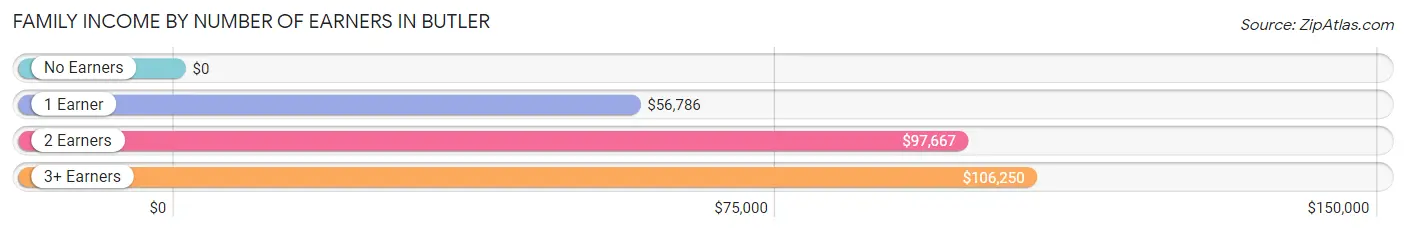
| Number of Earners | # Families | Median Income |
| No Earners | 33 (10.9%) | $0 |
| 1 Earner | 90 (29.6%) | $56,786 |
| 2 Earners | 110 (36.2%) | $97,667 |
| 3+ Earners | 71 (23.4%) | $106,250 |
| Total | 304 (100.0%) | $77,045 |
Household Income in Butler
Household Income Brackets in Butler
With 91 households falling in the category, the $50,000 to $74,999 income range is the most frequent in Butler, accounting for 22.4% of all households.
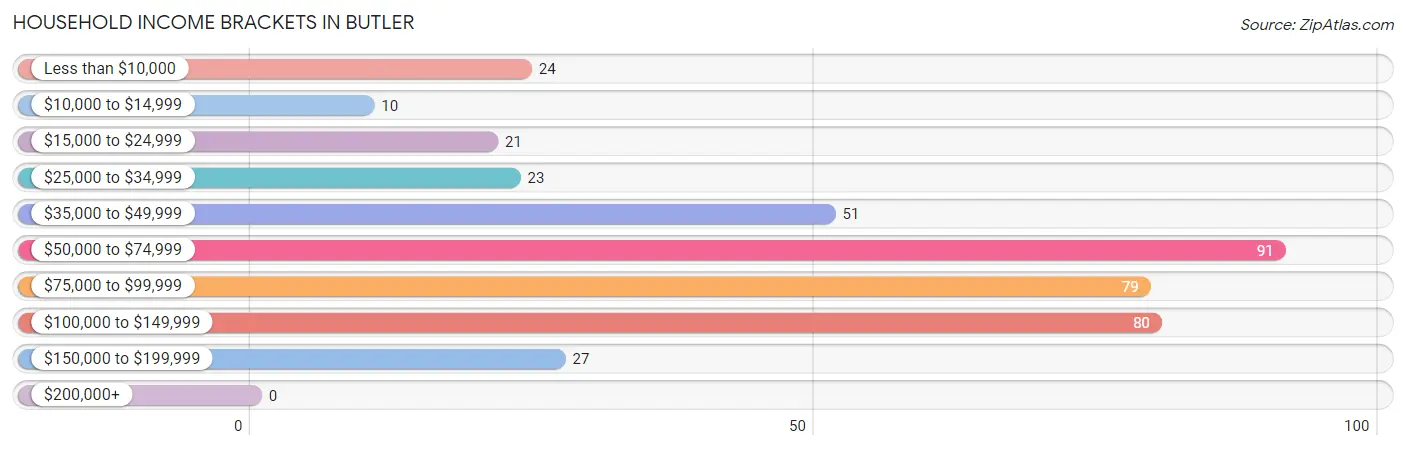
| Income Bracket | # Households | % Households |
| Less than $10,000 | 24 | 5.9% |
| $10,000 to $14,999 | 10 | 2.5% |
| $15,000 to $24,999 | 21 | 5.2% |
| $25,000 to $34,999 | 23 | 5.7% |
| $35,000 to $49,999 | 51 | 12.6% |
| $50,000 to $74,999 | 91 | 22.4% |
| $75,000 to $99,999 | 79 | 19.5% |
| $100,000 to $149,999 | 80 | 19.7% |
| $150,000 to $199,999 | 27 | 6.7% |
| $200,000+ | 0 | 0.0% |
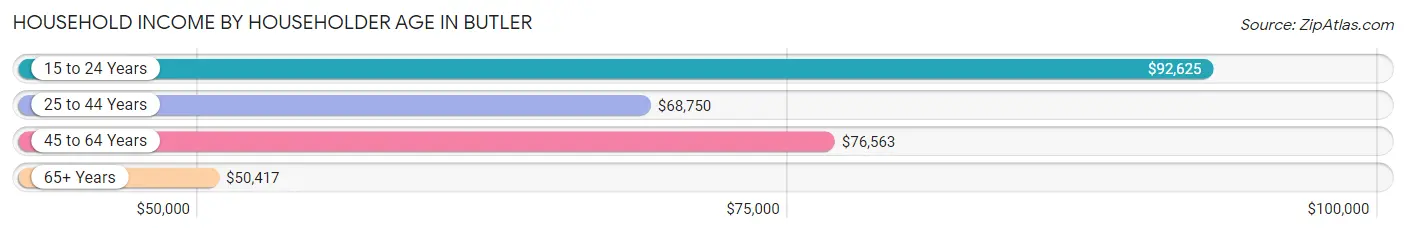
Household Income by Householder Age in Butler
The median household income in Butler is $67,292, with the highest median household income of $92,625 found in the 15 to 24 years age bracket for the primary householder. A total of 31 households (7.6%) fall into this category. Meanwhile, the 65+ years age bracket for the primary householder has the lowest median household income of $50,417, with 96 households (23.6%) in this group.
| Income Bracket | # Households | Median Income |
| 15 to 24 Years | 31 (7.6%) | $92,625 |
| 25 to 44 Years | 150 (36.9%) | $68,750 |
| 45 to 64 Years | 129 (31.8%) | $76,563 |
| 65+ Years | 96 (23.6%) | $50,417 |
| Total | 406 (100.0%) | $67,292 |
Poverty in Butler
Income Below Poverty by Sex and Age in Butler
With 1.7% poverty level for males and 6.3% for females among the residents of Butler, 15 year old males and 75 year old and over females are the most vulnerable to poverty, with 4 males (50.0%) and 7 females (20.6%) in their respective age groups living below the poverty level.
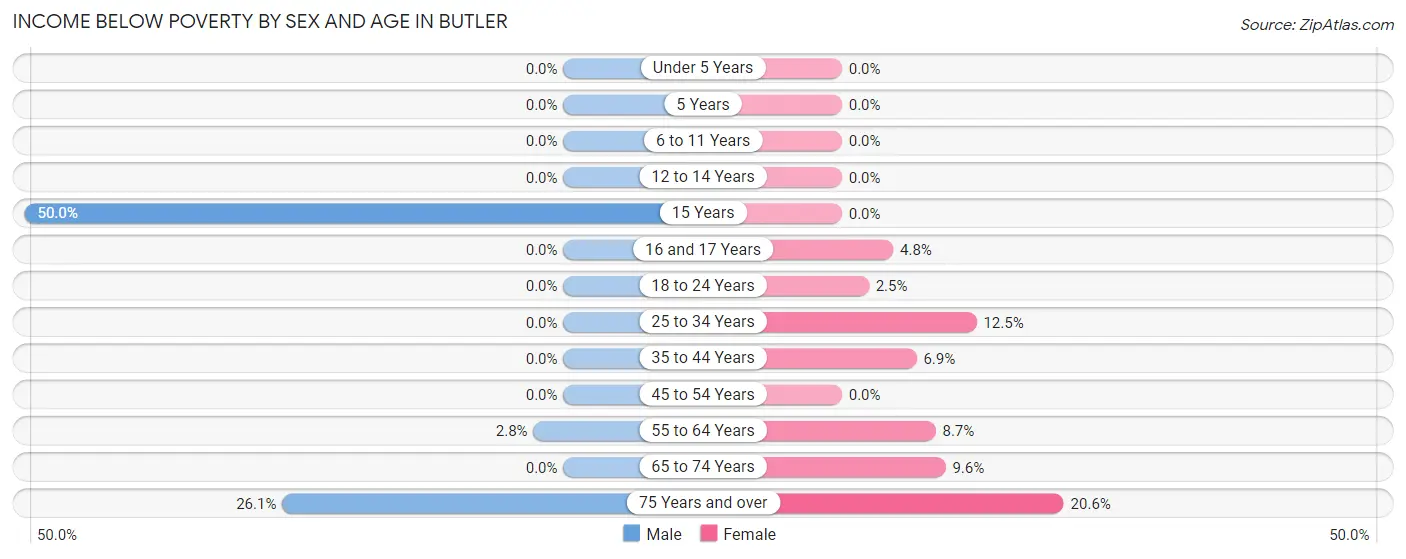
| Age Bracket | Male | Female |
| Under 5 Years | 0 (0.0%) | 0 (0.0%) |
| 5 Years | 0 (0.0%) | 0 (0.0%) |
| 6 to 11 Years | 0 (0.0%) | 0 (0.0%) |
| 12 to 14 Years | 0 (0.0%) | 0 (0.0%) |
| 15 Years | 4 (50.0%) | 0 (0.0%) |
| 16 and 17 Years | 0 (0.0%) | 1 (4.8%) |
| 18 to 24 Years | 0 (0.0%) | 2 (2.5%) |
| 25 to 34 Years | 0 (0.0%) | 10 (12.5%) |
| 35 to 44 Years | 0 (0.0%) | 7 (6.9%) |
| 45 to 54 Years | 0 (0.0%) | 0 (0.0%) |
| 55 to 64 Years | 1 (2.8%) | 4 (8.7%) |
| 65 to 74 Years | 0 (0.0%) | 5 (9.6%) |
| 75 Years and over | 6 (26.1%) | 7 (20.6%) |
| Total | 11 (1.7%) | 36 (6.3%) |
Income Above Poverty by Sex and Age in Butler
According to the poverty statistics in Butler, males aged under 5 years and females aged under 5 years are the age groups that are most secure financially, with 100.0% of males and 100.0% of females in these age groups living above the poverty line.
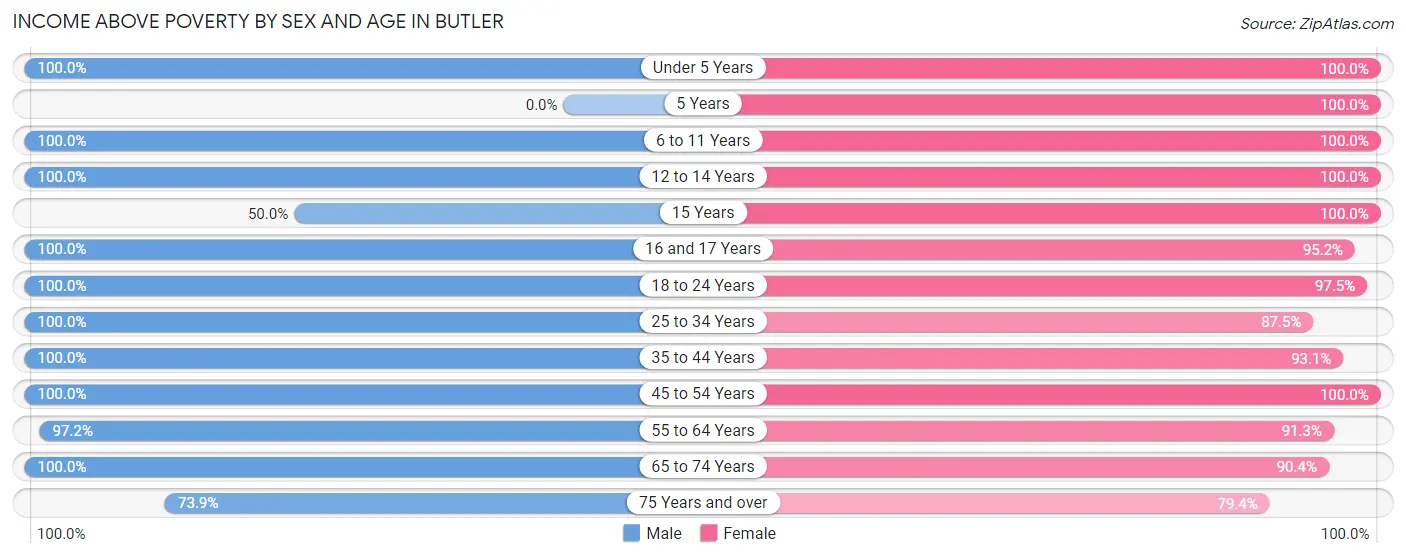
| Age Bracket | Male | Female |
| Under 5 Years | 58 (100.0%) | 31 (100.0%) |
| 5 Years | 0 (0.0%) | 20 (100.0%) |
| 6 to 11 Years | 27 (100.0%) | 10 (100.0%) |
| 12 to 14 Years | 58 (100.0%) | 27 (100.0%) |
| 15 Years | 4 (50.0%) | 2 (100.0%) |
| 16 and 17 Years | 33 (100.0%) | 20 (95.2%) |
| 18 to 24 Years | 159 (100.0%) | 78 (97.5%) |
| 25 to 34 Years | 48 (100.0%) | 70 (87.5%) |
| 35 to 44 Years | 61 (100.0%) | 94 (93.1%) |
| 45 to 54 Years | 74 (100.0%) | 71 (100.0%) |
| 55 to 64 Years | 35 (97.2%) | 42 (91.3%) |
| 65 to 74 Years | 50 (100.0%) | 47 (90.4%) |
| 75 Years and over | 17 (73.9%) | 27 (79.4%) |
| Total | 624 (98.3%) | 539 (93.7%) |
Income Below Poverty Among Married-Couple Families in Butler
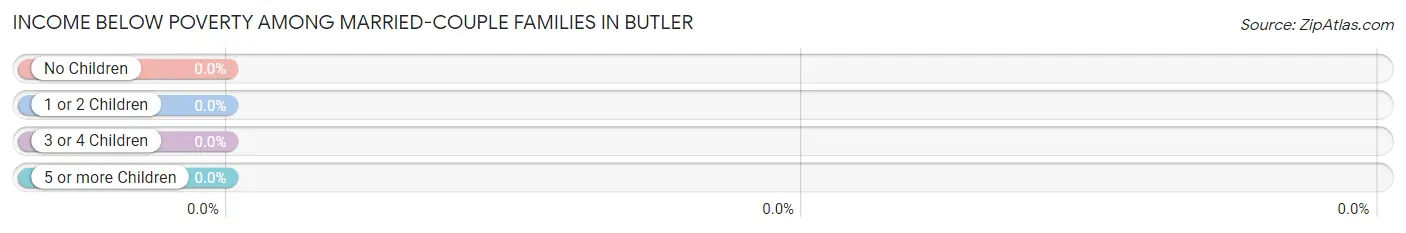
| Children | Above Poverty | Below Poverty |
| No Children | 104 (100.0%) | 0 (0.0%) |
| 1 or 2 Children | 106 (100.0%) | 0 (0.0%) |
| 3 or 4 Children | 26 (100.0%) | 0 (0.0%) |
| 5 or more Children | 0 (0.0%) | 0 (0.0%) |
| Total | 236 (100.0%) | 0 (0.0%) |
Income Below Poverty Among Single-Parent Households in Butler
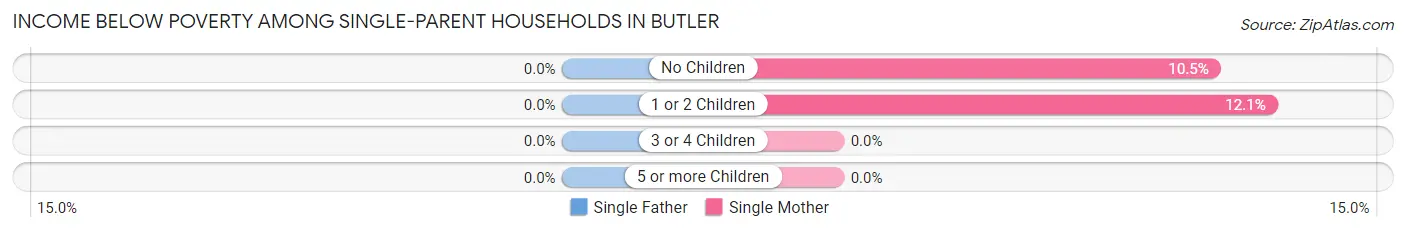
| Children | Single Father | Single Mother |
| No Children | 0 (0.0%) | 2 (10.5%) |
| 1 or 2 Children | 0 (0.0%) | 4 (12.1%) |
| 3 or 4 Children | 0 (0.0%) | 0 (0.0%) |
| 5 or more Children | 0 (0.0%) | 0 (0.0%) |
| Total | 0 (0.0%) | 6 (11.5%) |
Income Below Poverty Among Married-Couple vs Single-Parent Households in Butler
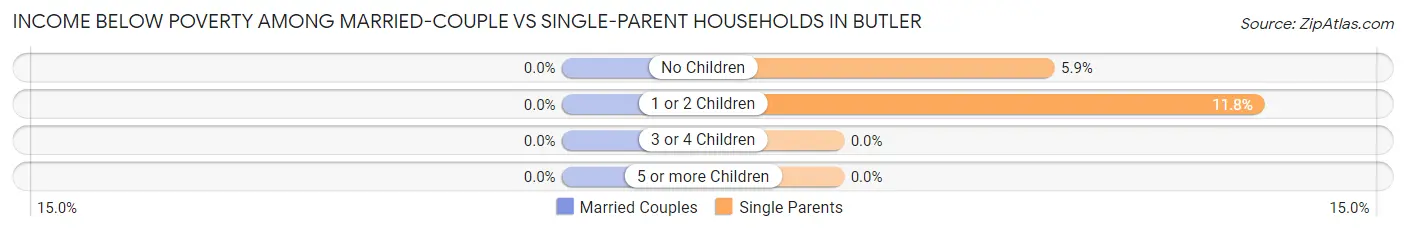
| Children | Married-Couple Families | Single-Parent Households |
| No Children | 0 (0.0%) | 2 (5.9%) |
| 1 or 2 Children | 0 (0.0%) | 4 (11.8%) |
| 3 or 4 Children | 0 (0.0%) | 0 (0.0%) |
| 5 or more Children | 0 (0.0%) | 0 (0.0%) |
| Total | 0 (0.0%) | 6 (8.8%) |
Race in Butler
The most populous races in Butler are White / Caucasian (1,155 | 95.3%), Two or more Races (57 | 4.7%), and Hispanic or Latino (34 | 2.8%).
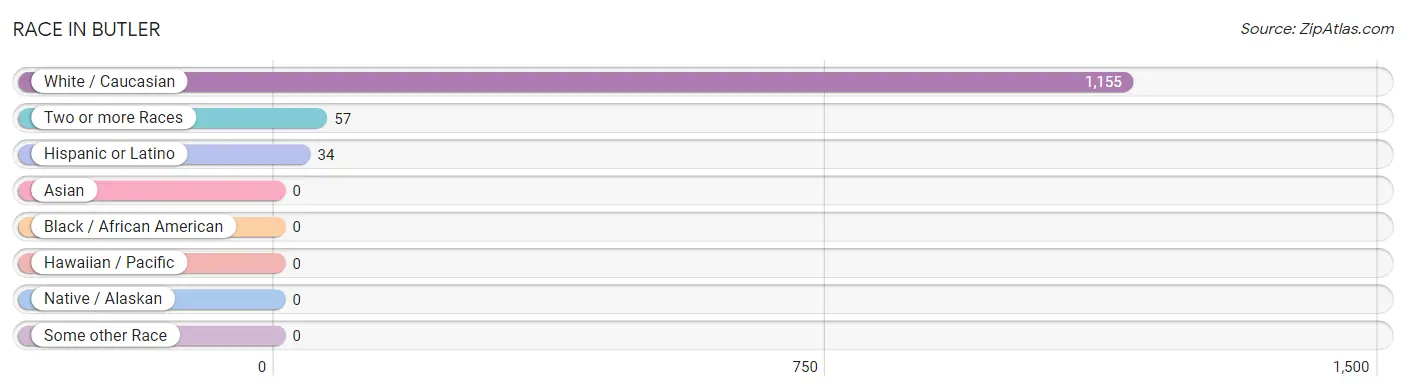
| Race | # Population | % Population |
| Asian | 0 | 0.0% |
| Black / African American | 0 | 0.0% |
| Hawaiian / Pacific | 0 | 0.0% |
| Hispanic or Latino | 34 | 2.8% |
| Native / Alaskan | 0 | 0.0% |
| White / Caucasian | 1,155 | 95.3% |
| Two or more Races | 57 | 4.7% |
| Some other Race | 0 | 0.0% |
| Total | 1,212 | 100.0% |
Ancestry in Butler
The most populous ancestries reported in Butler are German (276 | 22.8%), English (130 | 10.7%), Irish (115 | 9.5%), American (75 | 6.2%), and European (58 | 4.8%), together accounting for 54.0% of all Butler residents.
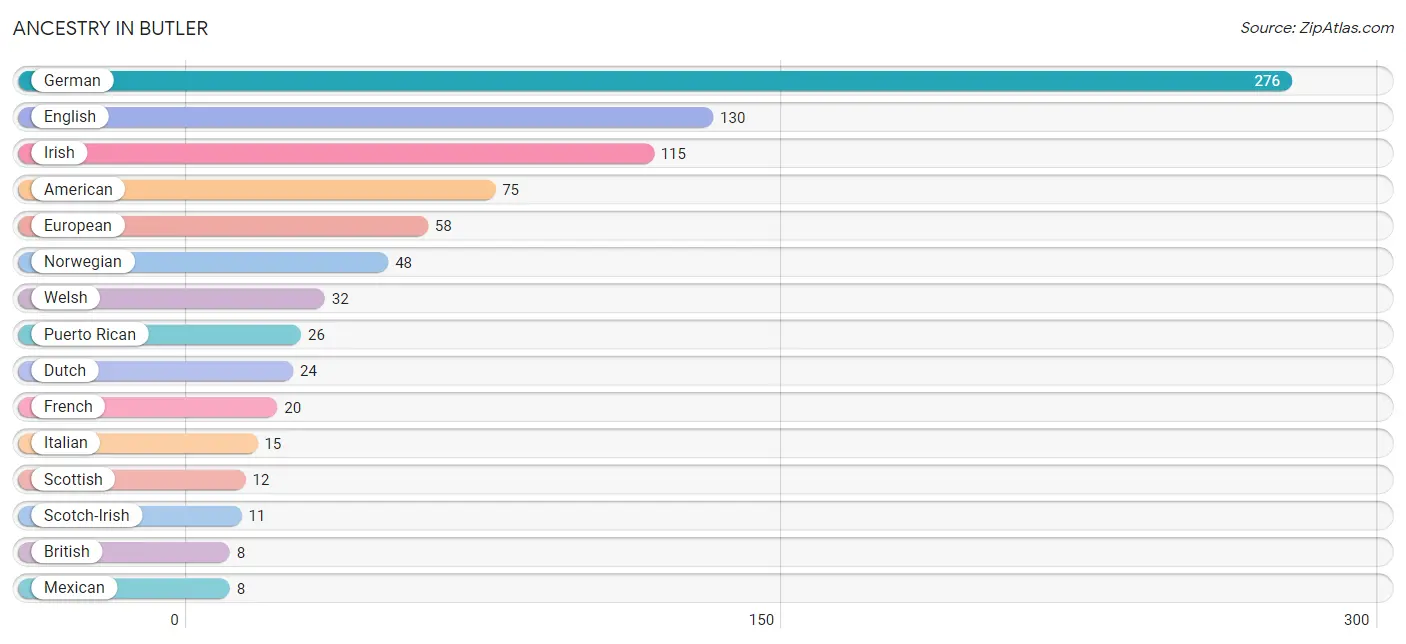
| Ancestry | # Population | % Population |
| American | 75 | 6.2% |
| Austrian | 3 | 0.3% |
| British | 8 | 0.7% |
| Cherokee | 1 | 0.1% |
| Dutch | 24 | 2.0% |
| English | 130 | 10.7% |
| European | 58 | 4.8% |
| French | 20 | 1.7% |
| German | 276 | 22.8% |
| Irish | 115 | 9.5% |
| Italian | 15 | 1.2% |
| Mexican | 8 | 0.7% |
| Norwegian | 48 | 4.0% |
| Puerto Rican | 26 | 2.1% |
| Romanian | 6 | 0.5% |
| Scotch-Irish | 11 | 0.9% |
| Scottish | 12 | 1.0% |
| Serbian | 3 | 0.3% |
| Swedish | 1 | 0.1% |
| Swiss | 2 | 0.2% |
| Welsh | 32 | 2.6% | View All 21 Rows |
Immigrants in Butler

| Immigration Origin | # Population | % Population | View All 0 Rows |
Sex and Age in Butler
Sex and Age in Butler
The most populous age groups in Butler are 20 to 24 Years (106 | 16.7%) for men and 35 to 39 Years (68 | 11.8%) for women.
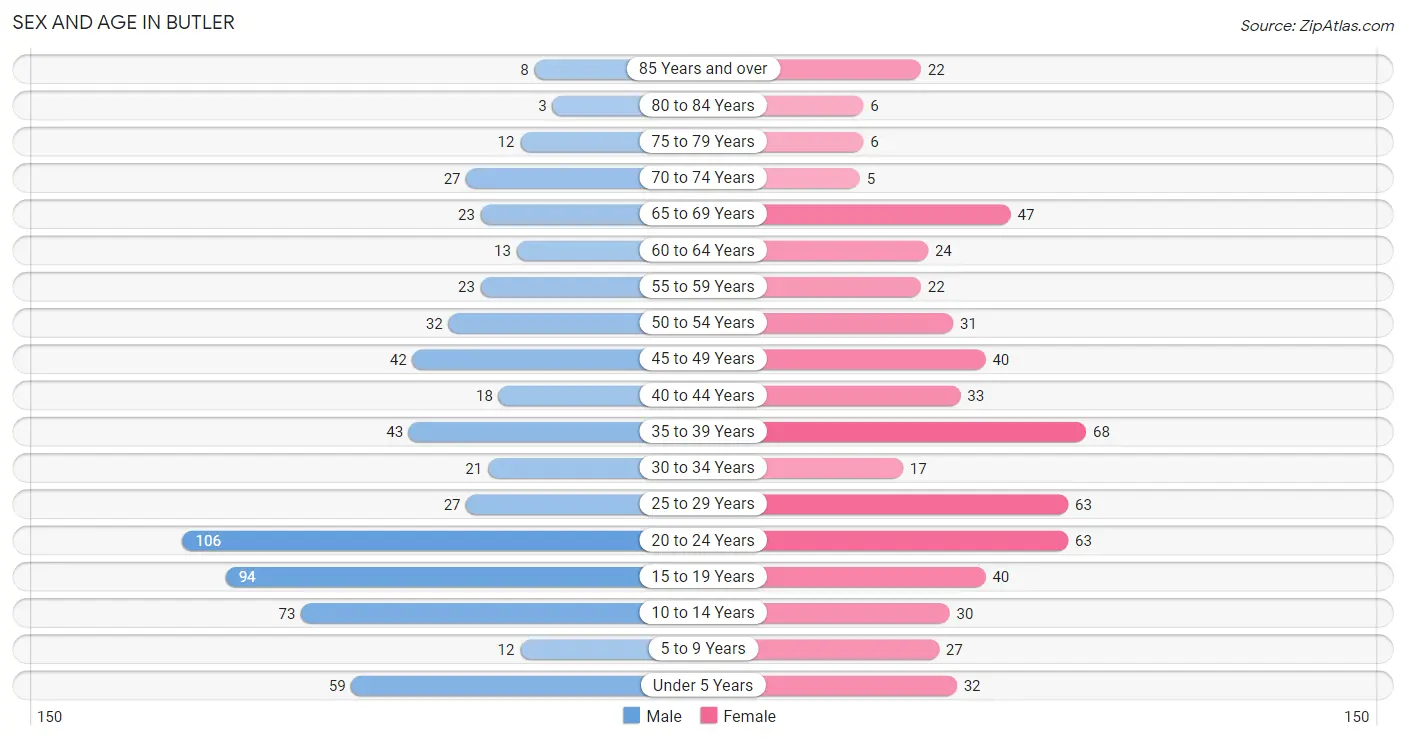
| Age Bracket | Male | Female |
| Under 5 Years | 59 (9.3%) | 32 (5.6%) |
| 5 to 9 Years | 12 (1.9%) | 27 (4.7%) |
| 10 to 14 Years | 73 (11.5%) | 30 (5.2%) |
| 15 to 19 Years | 94 (14.8%) | 40 (6.9%) |
| 20 to 24 Years | 106 (16.7%) | 63 (10.9%) |
| 25 to 29 Years | 27 (4.3%) | 63 (10.9%) |
| 30 to 34 Years | 21 (3.3%) | 17 (2.9%) |
| 35 to 39 Years | 43 (6.8%) | 68 (11.8%) |
| 40 to 44 Years | 18 (2.8%) | 33 (5.7%) |
| 45 to 49 Years | 42 (6.6%) | 40 (6.9%) |
| 50 to 54 Years | 32 (5.0%) | 31 (5.4%) |
| 55 to 59 Years | 23 (3.6%) | 22 (3.8%) |
| 60 to 64 Years | 13 (2.0%) | 24 (4.2%) |
| 65 to 69 Years | 23 (3.6%) | 47 (8.2%) |
| 70 to 74 Years | 27 (4.3%) | 5 (0.9%) |
| 75 to 79 Years | 12 (1.9%) | 6 (1.0%) |
| 80 to 84 Years | 3 (0.5%) | 6 (1.0%) |
| 85 Years and over | 8 (1.3%) | 22 (3.8%) |
| Total | 636 (100.0%) | 576 (100.0%) |
Families and Households in Butler
Median Family Size in Butler
The median family size in Butler is 3.48 persons per family, with single male/father families (16 | 5.3%) accounting for the largest median family size of 5.63 persons per family. On the other hand, single female/mother families (52 | 17.1%) represent the smallest median family size with 2.42 persons per family.
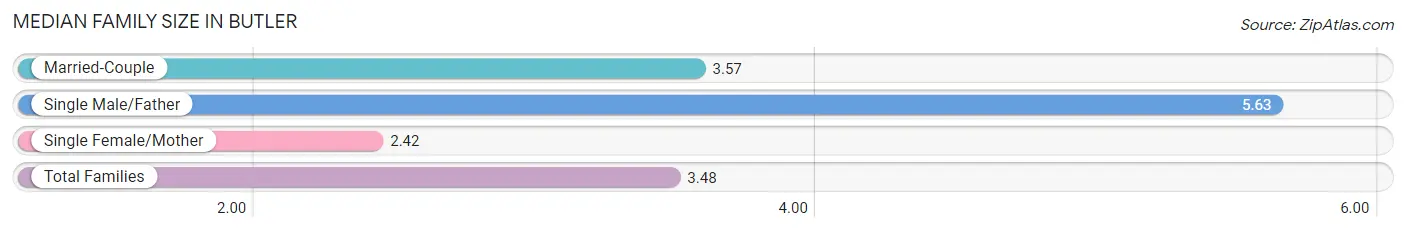
| Family Type | # Families | Family Size |
| Married-Couple | 236 (77.6%) | 3.57 |
| Single Male/Father | 16 (5.3%) | 5.63 |
| Single Female/Mother | 52 (17.1%) | 2.42 |
| Total Families | 304 (100.0%) | 3.48 |
Median Household Size in Butler
The median household size in Butler is 2.99 persons per household, with single male/father households (16 | 3.9%) accounting for the largest median household size of 5.75 persons per household. non-family households (102 | 25.1%) represent the smallest median household size with 1.34 persons per household.
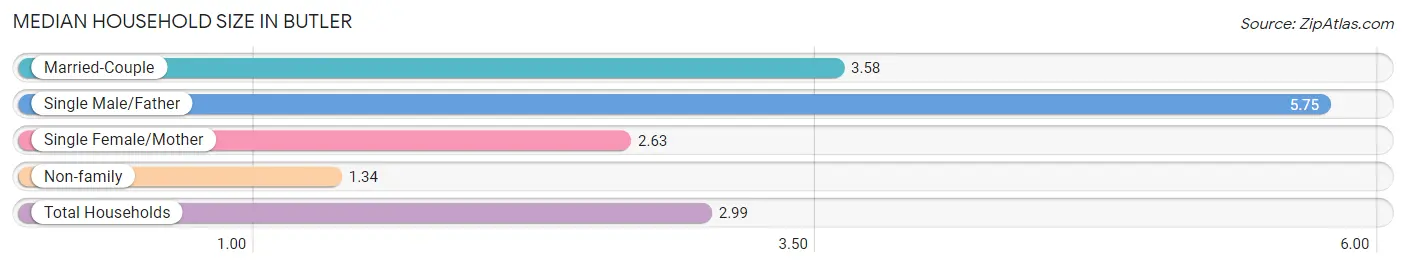
| Household Type | # Households | Household Size |
| Married-Couple | 236 (58.1%) | 3.58 |
| Single Male/Father | 16 (3.9%) | 5.75 |
| Single Female/Mother | 52 (12.8%) | 2.63 |
| Non-family | 102 (25.1%) | 1.34 |
| Total Households | 406 (100.0%) | 2.99 |
Household Size by Marriage Status in Butler
Out of a total of 406 households in Butler, 304 (74.9%) are family households, while 102 (25.1%) are nonfamily households. The most numerous type of family households are 2-person households, comprising 105, and the most common type of nonfamily households are 1-person households, comprising 78.
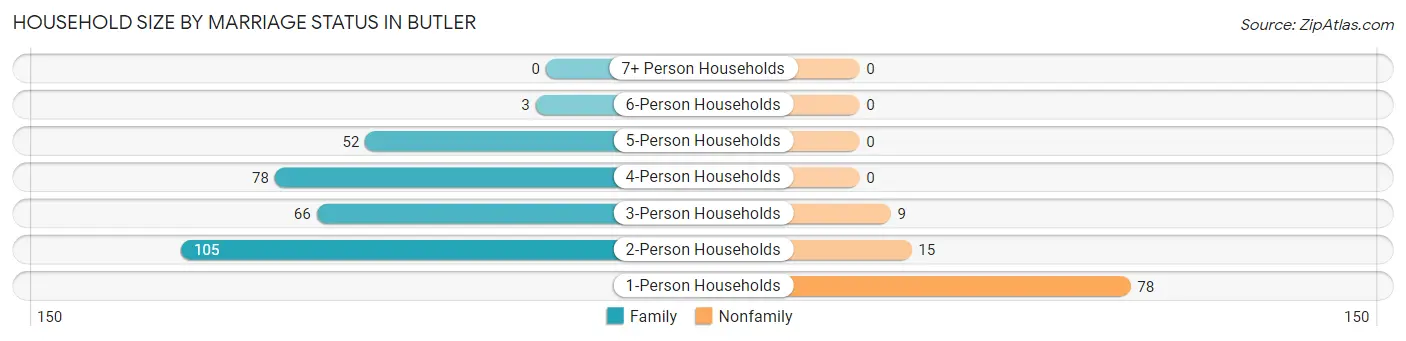
| Household Size | Family Households | Nonfamily Households |
| 1-Person Households | - | 78 (19.2%) |
| 2-Person Households | 105 (25.9%) | 15 (3.7%) |
| 3-Person Households | 66 (16.3%) | 9 (2.2%) |
| 4-Person Households | 78 (19.2%) | 0 (0.0%) |
| 5-Person Households | 52 (12.8%) | 0 (0.0%) |
| 6-Person Households | 3 (0.7%) | 0 (0.0%) |
| 7+ Person Households | 0 (0.0%) | 0 (0.0%) |
| Total | 304 (74.9%) | 102 (25.1%) |
Female Fertility in Butler
Fertility by Age in Butler
Average fertility rate in Butler is 83.0 births per 1,000 women. Women in the age bracket of 20 to 34 years have the highest fertility rate with 189.0 births per 1,000 women. Women in the age bracket of 20 to 34 years acount for 100.0% of all women with births.
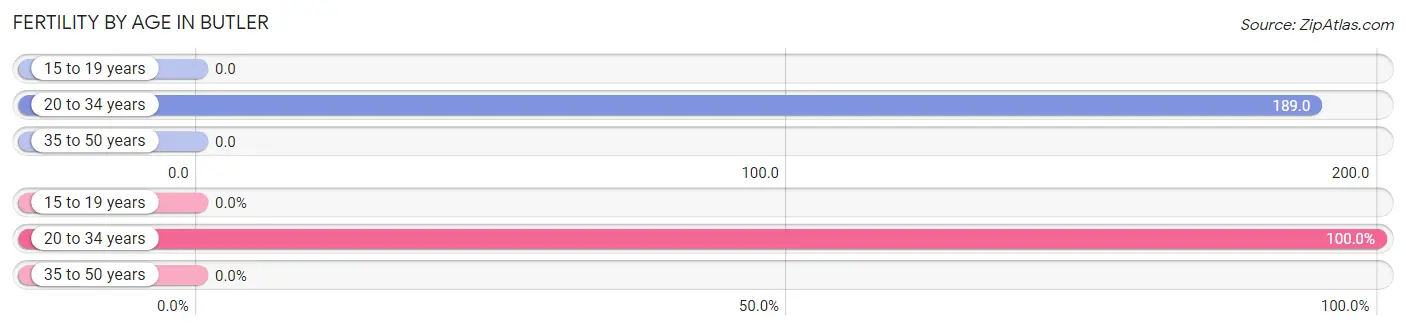
| Age Bracket | Women with Births | Births / 1,000 Women |
| 15 to 19 years | 0 (0.0%) | 0.0 |
| 20 to 34 years | 27 (100.0%) | 189.0 |
| 35 to 50 years | 0 (0.0%) | 0.0 |
| Total | 27 (100.0%) | 83.0 |
Fertility by Age by Marriage Status in Butler
88.9% of women with births (27) in Butler are married. The highest percentage of unmarried women with births falls into 20 to 34 years age bracket with 11.1% of them unmarried at the time of birth, while the lowest percentage of unmarried women with births belong to 20 to 34 years age bracket with 11.1% of them unmarried.
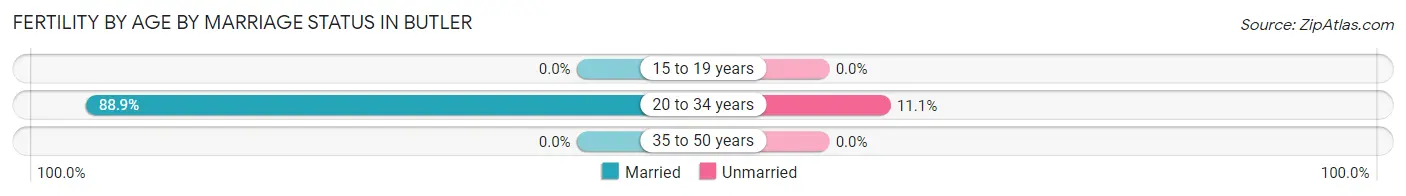
| Age Bracket | Married | Unmarried |
| 15 to 19 years | 0 (0.0%) | 0 (0.0%) |
| 20 to 34 years | 24 (88.9%) | 3 (11.1%) |
| 35 to 50 years | 0 (0.0%) | 0 (0.0%) |
| Total | 24 (88.9%) | 3 (11.1%) |
Fertility by Education in Butler
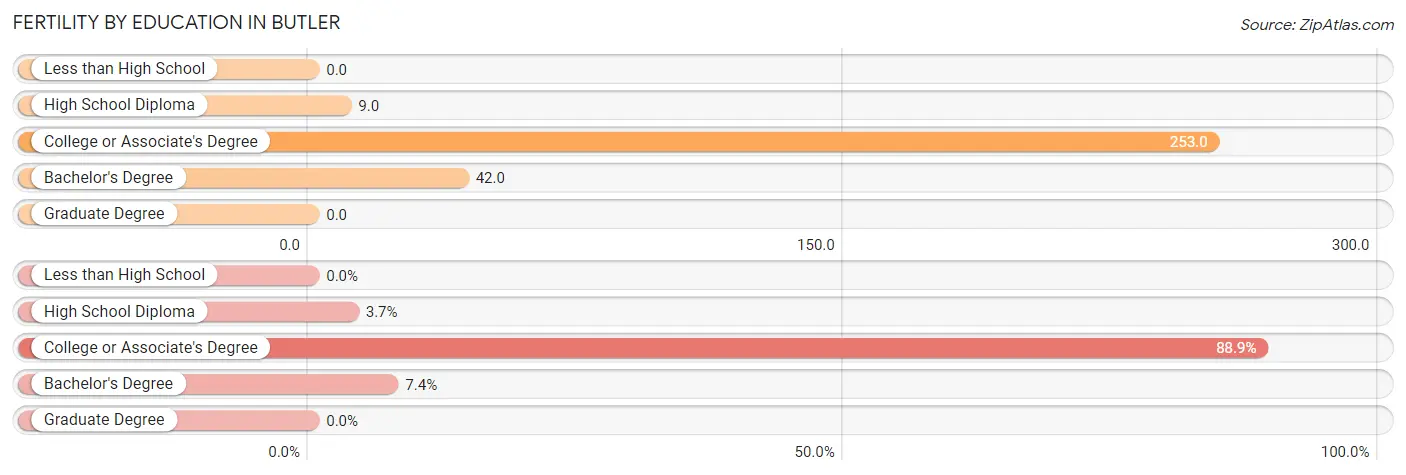
| Educational Attainment | Women with Births | Births / 1,000 Women |
| Less than High School | 0 (0.0%) | 0.0 |
| High School Diploma | 1 (3.7%) | 9.0 |
| College or Associate's Degree | 24 (88.9%) | 253.0 |
| Bachelor's Degree | 2 (7.4%) | 42.0 |
| Graduate Degree | 0 (0.0%) | 0.0 |
| Total | 27 (100.0%) | 83.0 |
Fertility by Education by Marriage Status in Butler
11.1% of women with births in Butler are unmarried. Women with the educational attainment of high school diploma are most likely to be married with 100.0% of them married at childbirth, while women with the educational attainment of college or associate's degree are least likely to be married with 12.5% of them unmarried at childbirth.
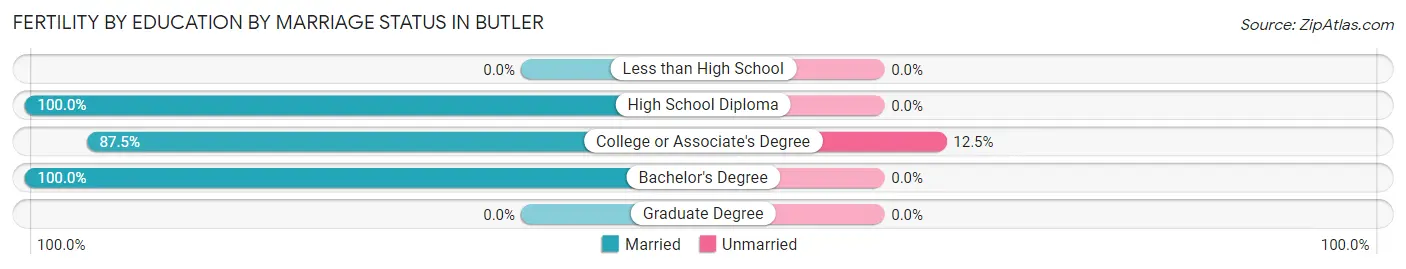
| Educational Attainment | Married | Unmarried |
| Less than High School | 0 (0.0%) | 0 (0.0%) |
| High School Diploma | 1 (100.0%) | 0 (0.0%) |
| College or Associate's Degree | 21 (87.5%) | 3 (12.5%) |
| Bachelor's Degree | 2 (100.0%) | 0 (0.0%) |
| Graduate Degree | 0 (0.0%) | 0 (0.0%) |
| Total | 24 (88.9%) | 3 (11.1%) |
Employment Characteristics in Butler
Employment by Class of Employer in Butler
Among the 552 employed individuals in Butler, private company employees (407 | 73.7%), not-for-profit organizations (50 | 9.1%), and local government employees (44 | 8.0%) make up the most common classes of employment.
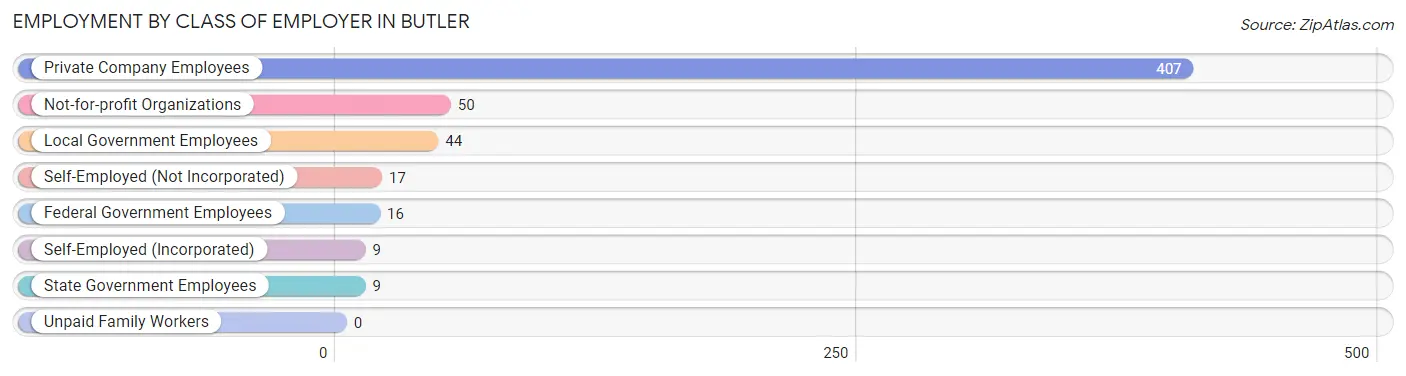
| Employer Class | # Employees | % Employees |
| Private Company Employees | 407 | 73.7% |
| Self-Employed (Incorporated) | 9 | 1.6% |
| Self-Employed (Not Incorporated) | 17 | 3.1% |
| Not-for-profit Organizations | 50 | 9.1% |
| Local Government Employees | 44 | 8.0% |
| State Government Employees | 9 | 1.6% |
| Federal Government Employees | 16 | 2.9% |
| Unpaid Family Workers | 0 | 0.0% |
| Total | 552 | 100.0% |
Employment Status by Age in Butler
According to the labor force statistics for Butler, out of the total population over 16 years of age (969), 60.3% or 584 individuals are in the labor force, with 1.2% or 7 of them unemployed. The age group with the highest labor force participation rate is 45 to 54 years, with 95.2% or 138 individuals in the labor force. Within the labor force, the 20 to 24 years age range has the highest percentage of unemployed individuals, with 4.2% or 4 of them being unemployed.
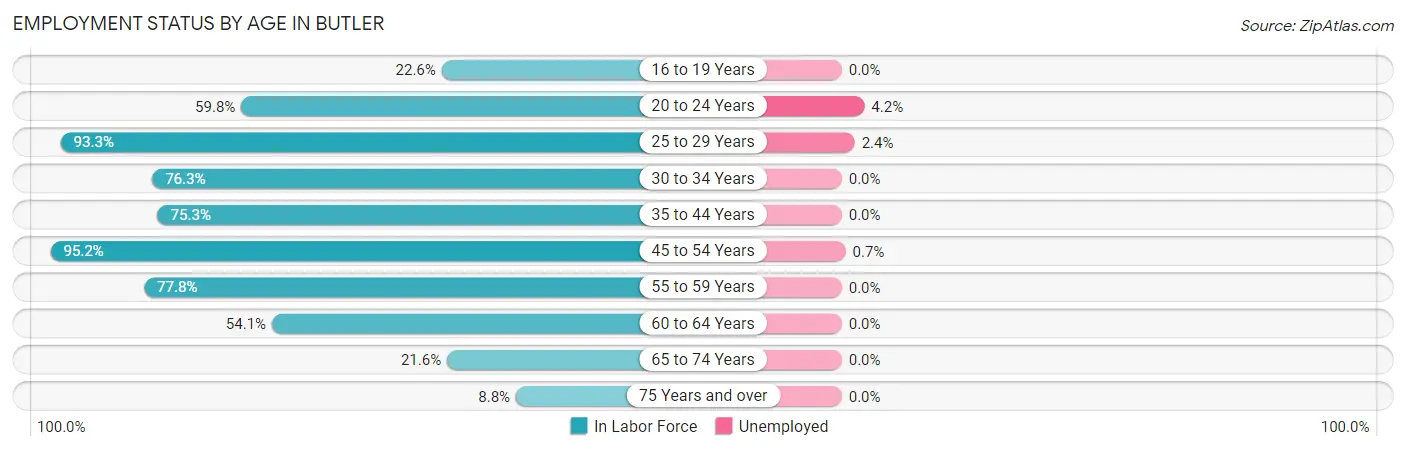
| Age Bracket | In Labor Force | Unemployed |
| 16 to 19 Years | 28 (22.6%) | 0 (0.0%) |
| 20 to 24 Years | 101 (59.8%) | 4 (4.2%) |
| 25 to 29 Years | 84 (93.3%) | 2 (2.4%) |
| 30 to 34 Years | 29 (76.3%) | 0 (0.0%) |
| 35 to 44 Years | 122 (75.3%) | 0 (0.0%) |
| 45 to 54 Years | 138 (95.2%) | 1 (0.7%) |
| 55 to 59 Years | 35 (77.8%) | 0 (0.0%) |
| 60 to 64 Years | 20 (54.1%) | 0 (0.0%) |
| 65 to 74 Years | 22 (21.6%) | 0 (0.0%) |
| 75 Years and over | 5 (8.8%) | 0 (0.0%) |
| Total | 584 (60.3%) | 7 (1.2%) |
Employment Status by Educational Attainment in Butler
According to labor force statistics for Butler, 82.8% of individuals (428) out of the total population between 25 and 64 years of age (517) are in the labor force, with 0.7% or 3 of them being unemployed. The group with the highest labor force participation rate are those with the educational attainment of bachelor's degree or higher, with 89.9% or 89 individuals in the labor force. Within the labor force, individuals with college / associate degree education have the highest percentage of unemployment, with 1.5% or 2 of them being unemployed.
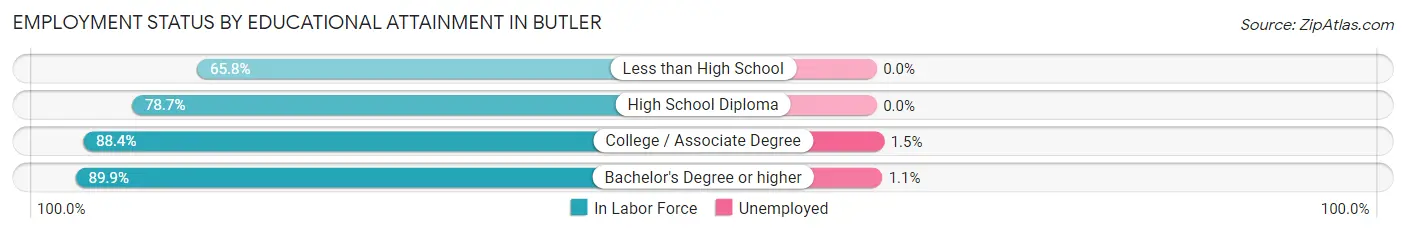
| Educational Attainment | In Labor Force | Unemployed |
| Less than High School | 25 (65.8%) | 0 (0.0%) |
| High School Diploma | 177 (78.7%) | 0 (0.0%) |
| College / Associate Degree | 137 (88.4%) | 2 (1.5%) |
| Bachelor's Degree or higher | 89 (89.9%) | 1 (1.1%) |
| Total | 428 (82.8%) | 4 (0.7%) |
Employment Occupations by Sex in Butler
Management, Business, Science and Arts Occupations
The most common Management, Business, Science and Arts occupations in Butler are Health Diagnosing & Treating (47 | 8.2%), Management (42 | 7.4%), Community & Social Service (33 | 5.8%), Health Technologists (29 | 5.1%), and Education Instruction & Library (24 | 4.2%).
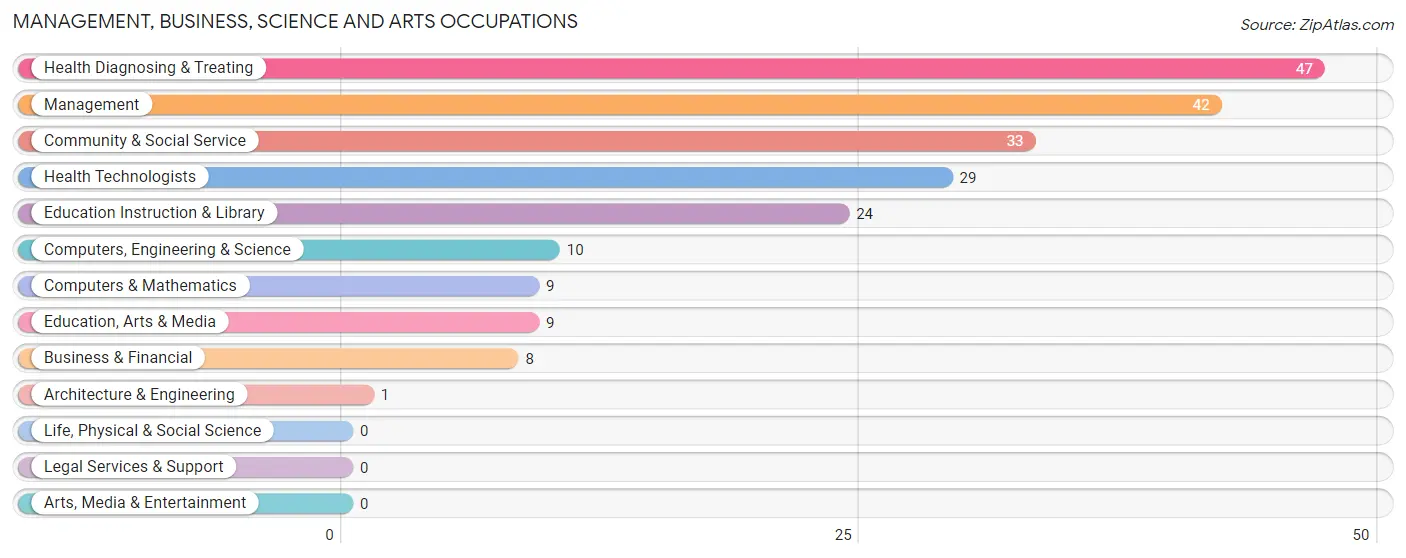
Management, Business, Science and Arts Occupations by Sex
Within the Management, Business, Science and Arts occupations in Butler, the most male-oriented occupations are Computers, Engineering & Science (100.0%), Computers & Mathematics (100.0%), and Architecture & Engineering (100.0%), while the most female-oriented occupations are Business & Financial (100.0%), Health Diagnosing & Treating (100.0%), and Health Technologists (100.0%).
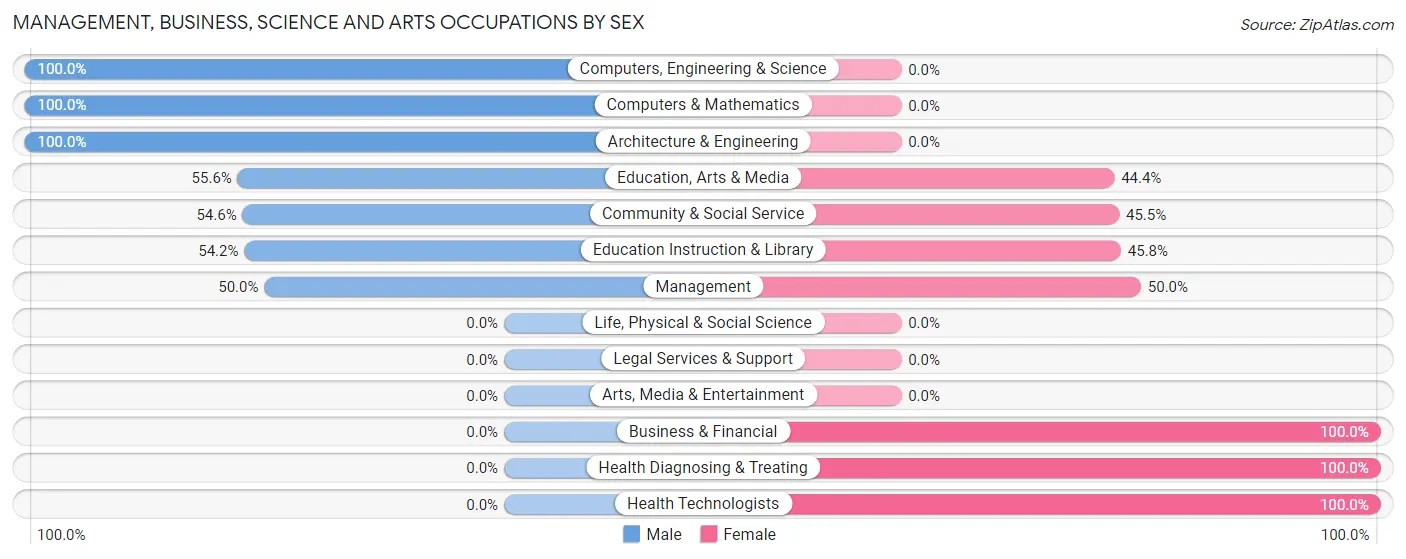
| Occupation | Male | Female |
| Management | 21 (50.0%) | 21 (50.0%) |
| Business & Financial | 0 (0.0%) | 8 (100.0%) |
| Computers, Engineering & Science | 10 (100.0%) | 0 (0.0%) |
| Computers & Mathematics | 9 (100.0%) | 0 (0.0%) |
| Architecture & Engineering | 1 (100.0%) | 0 (0.0%) |
| Life, Physical & Social Science | 0 (0.0%) | 0 (0.0%) |
| Community & Social Service | 18 (54.5%) | 15 (45.5%) |
| Education, Arts & Media | 5 (55.6%) | 4 (44.4%) |
| Legal Services & Support | 0 (0.0%) | 0 (0.0%) |
| Education Instruction & Library | 13 (54.2%) | 11 (45.8%) |
| Arts, Media & Entertainment | 0 (0.0%) | 0 (0.0%) |
| Health Diagnosing & Treating | 0 (0.0%) | 47 (100.0%) |
| Health Technologists | 0 (0.0%) | 29 (100.0%) |
| Total (Category) | 49 (35.0%) | 91 (65.0%) |
| Total (Overall) | 255 (44.7%) | 316 (55.3%) |
Services Occupations
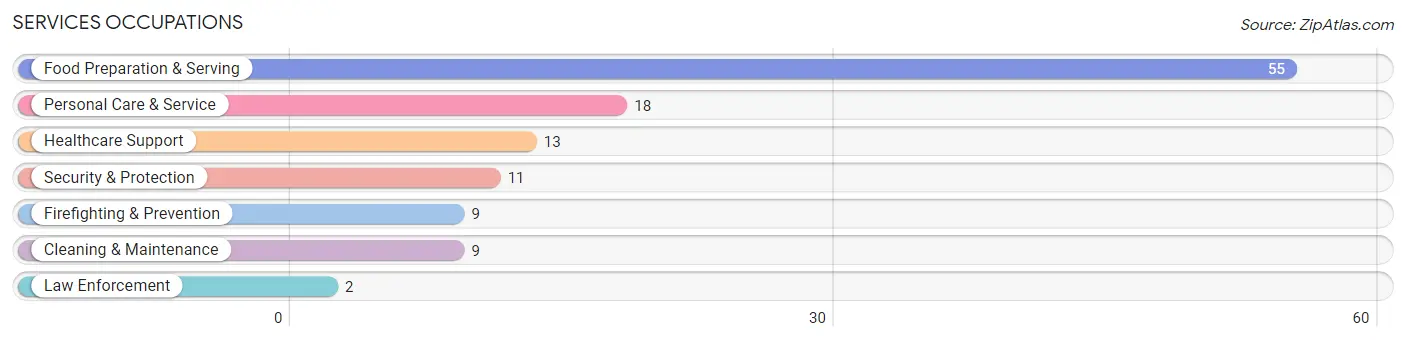
The most common Services occupations in Butler are Food Preparation & Serving (55 | 9.6%), Personal Care & Service (18 | 3.2%), Healthcare Support (13 | 2.3%), Security & Protection (11 | 1.9%), and Firefighting & Prevention (9 | 1.6%).
Services Occupations by Sex
Within the Services occupations in Butler, the most male-oriented occupations are Law Enforcement (100.0%), Cleaning & Maintenance (44.4%), and Security & Protection (18.2%), while the most female-oriented occupations are Healthcare Support (100.0%), Firefighting & Prevention (100.0%), and Food Preparation & Serving (90.9%).
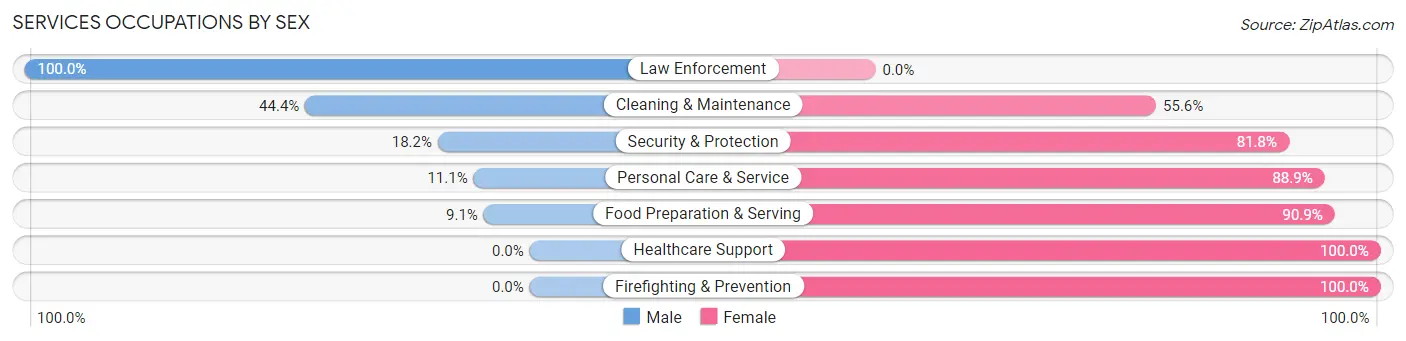
| Occupation | Male | Female |
| Healthcare Support | 0 (0.0%) | 13 (100.0%) |
| Security & Protection | 2 (18.2%) | 9 (81.8%) |
| Firefighting & Prevention | 0 (0.0%) | 9 (100.0%) |
| Law Enforcement | 2 (100.0%) | 0 (0.0%) |
| Food Preparation & Serving | 5 (9.1%) | 50 (90.9%) |
| Cleaning & Maintenance | 4 (44.4%) | 5 (55.6%) |
| Personal Care & Service | 2 (11.1%) | 16 (88.9%) |
| Total (Category) | 13 (12.3%) | 93 (87.7%) |
| Total (Overall) | 255 (44.7%) | 316 (55.3%) |
Sales and Office Occupations
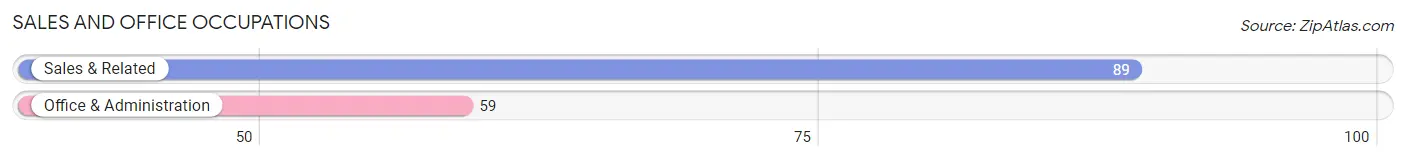
The most common Sales and Office occupations in Butler are Sales & Related (89 | 15.6%), and Office & Administration (59 | 10.3%).
Sales and Office Occupations by Sex

| Occupation | Male | Female |
| Sales & Related | 28 (31.5%) | 61 (68.5%) |
| Office & Administration | 19 (32.2%) | 40 (67.8%) |
| Total (Category) | 47 (31.8%) | 101 (68.2%) |
| Total (Overall) | 255 (44.7%) | 316 (55.3%) |
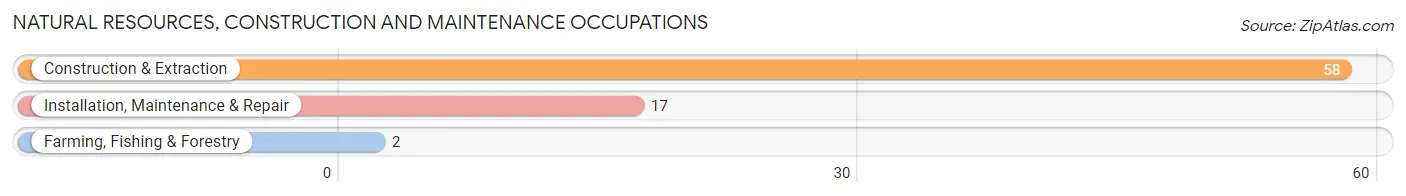
Natural Resources, Construction and Maintenance Occupations
The most common Natural Resources, Construction and Maintenance occupations in Butler are Construction & Extraction (58 | 10.2%), Installation, Maintenance & Repair (17 | 3.0%), and Farming, Fishing & Forestry (2 | 0.4%).
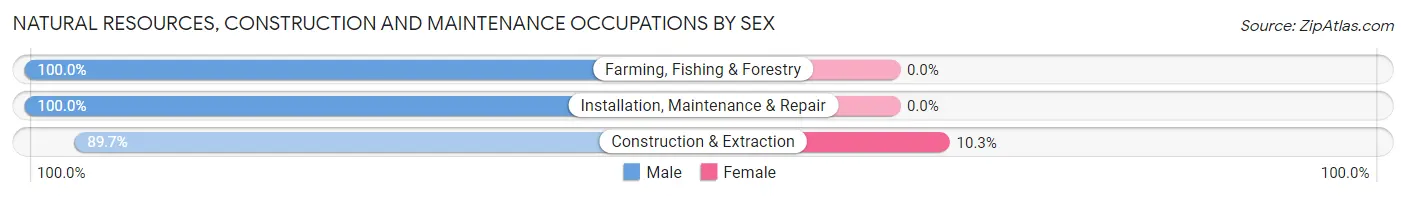
Natural Resources, Construction and Maintenance Occupations by Sex
| Occupation | Male | Female |
| Farming, Fishing & Forestry | 2 (100.0%) | 0 (0.0%) |
| Construction & Extraction | 52 (89.7%) | 6 (10.3%) |
| Installation, Maintenance & Repair | 17 (100.0%) | 0 (0.0%) |
| Total (Category) | 71 (92.2%) | 6 (7.8%) |
| Total (Overall) | 255 (44.7%) | 316 (55.3%) |
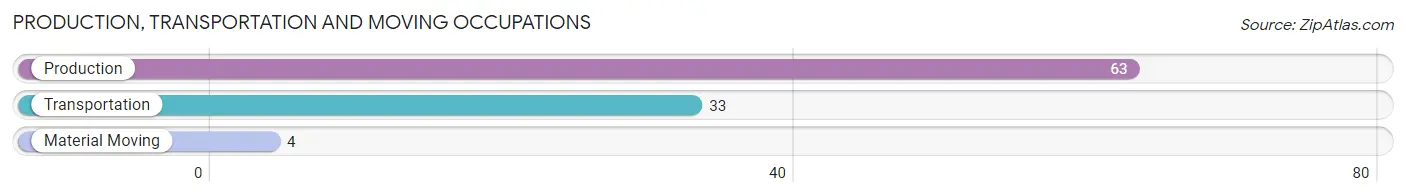
Production, Transportation and Moving Occupations
The most common Production, Transportation and Moving occupations in Butler are Production (63 | 11.0%), Transportation (33 | 5.8%), and Material Moving (4 | 0.7%).
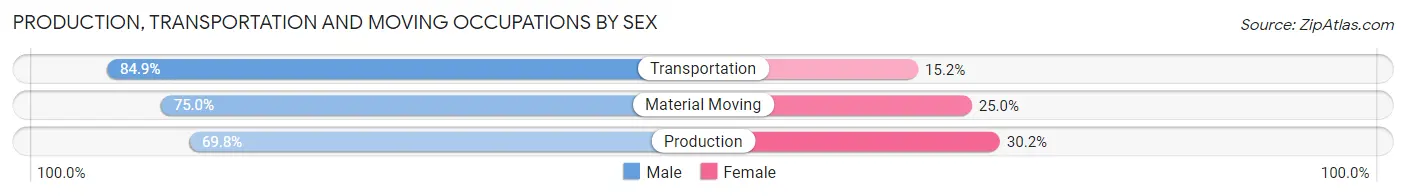
Production, Transportation and Moving Occupations by Sex
| Occupation | Male | Female |
| Production | 44 (69.8%) | 19 (30.2%) |
| Transportation | 28 (84.9%) | 5 (15.1%) |
| Material Moving | 3 (75.0%) | 1 (25.0%) |
| Total (Category) | 75 (75.0%) | 25 (25.0%) |
| Total (Overall) | 255 (44.7%) | 316 (55.3%) |
Employment Industries by Sex in Butler
Employment Industries in Butler
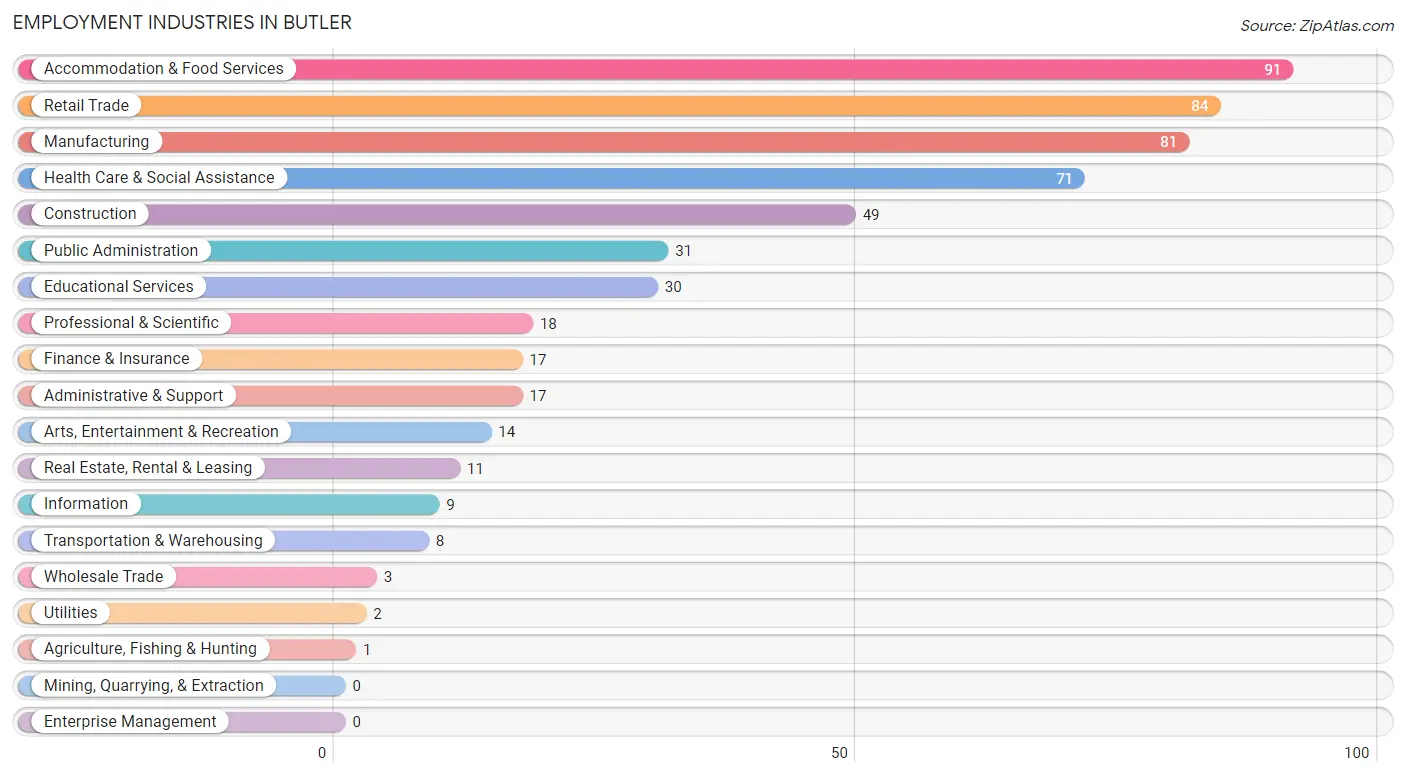
The major employment industries in Butler include Accommodation & Food Services (91 | 15.9%), Retail Trade (84 | 14.7%), Manufacturing (81 | 14.2%), Health Care & Social Assistance (71 | 12.4%), and Construction (49 | 8.6%).
Employment Industries by Sex in Butler
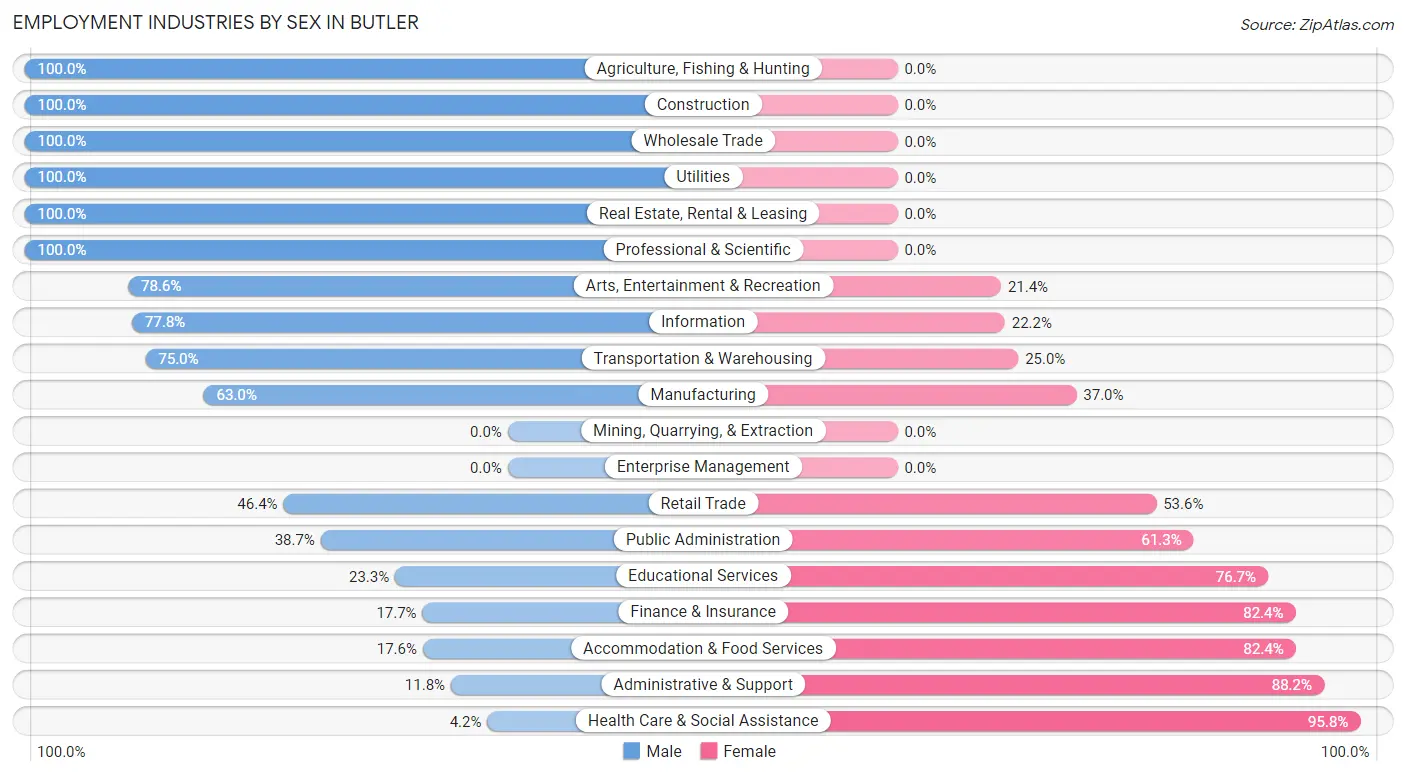
The Butler industries that see more men than women are Agriculture, Fishing & Hunting (100.0%), Construction (100.0%), and Wholesale Trade (100.0%), whereas the industries that tend to have a higher number of women are Health Care & Social Assistance (95.8%), Administrative & Support (88.2%), and Accommodation & Food Services (82.4%).
| Industry | Male | Female |
| Agriculture, Fishing & Hunting | 1 (100.0%) | 0 (0.0%) |
| Mining, Quarrying, & Extraction | 0 (0.0%) | 0 (0.0%) |
| Construction | 49 (100.0%) | 0 (0.0%) |
| Manufacturing | 51 (63.0%) | 30 (37.0%) |
| Wholesale Trade | 3 (100.0%) | 0 (0.0%) |
| Retail Trade | 39 (46.4%) | 45 (53.6%) |
| Transportation & Warehousing | 6 (75.0%) | 2 (25.0%) |
| Utilities | 2 (100.0%) | 0 (0.0%) |
| Information | 7 (77.8%) | 2 (22.2%) |
| Finance & Insurance | 3 (17.6%) | 14 (82.4%) |
| Real Estate, Rental & Leasing | 11 (100.0%) | 0 (0.0%) |
| Professional & Scientific | 18 (100.0%) | 0 (0.0%) |
| Enterprise Management | 0 (0.0%) | 0 (0.0%) |
| Administrative & Support | 2 (11.8%) | 15 (88.2%) |
| Educational Services | 7 (23.3%) | 23 (76.7%) |
| Health Care & Social Assistance | 3 (4.2%) | 68 (95.8%) |
| Arts, Entertainment & Recreation | 11 (78.6%) | 3 (21.4%) |
| Accommodation & Food Services | 16 (17.6%) | 75 (82.4%) |
| Public Administration | 12 (38.7%) | 19 (61.3%) |
| Total | 255 (44.7%) | 316 (55.3%) |
Education in Butler
School Enrollment in Butler
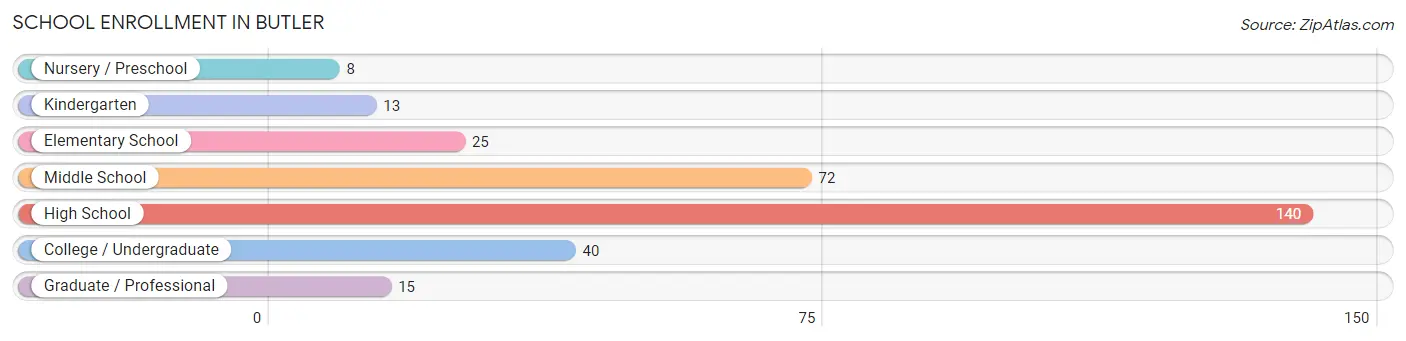
The most common levels of schooling among the 313 students in Butler are high school (140 | 44.7%), middle school (72 | 23.0%), and college / undergraduate (40 | 12.8%).
| School Level | # Students | % Students |
| Nursery / Preschool | 8 | 2.6% |
| Kindergarten | 13 | 4.2% |
| Elementary School | 25 | 8.0% |
| Middle School | 72 | 23.0% |
| High School | 140 | 44.7% |
| College / Undergraduate | 40 | 12.8% |
| Graduate / Professional | 15 | 4.8% |
| Total | 313 | 100.0% |
School Enrollment by Age by Funding Source in Butler
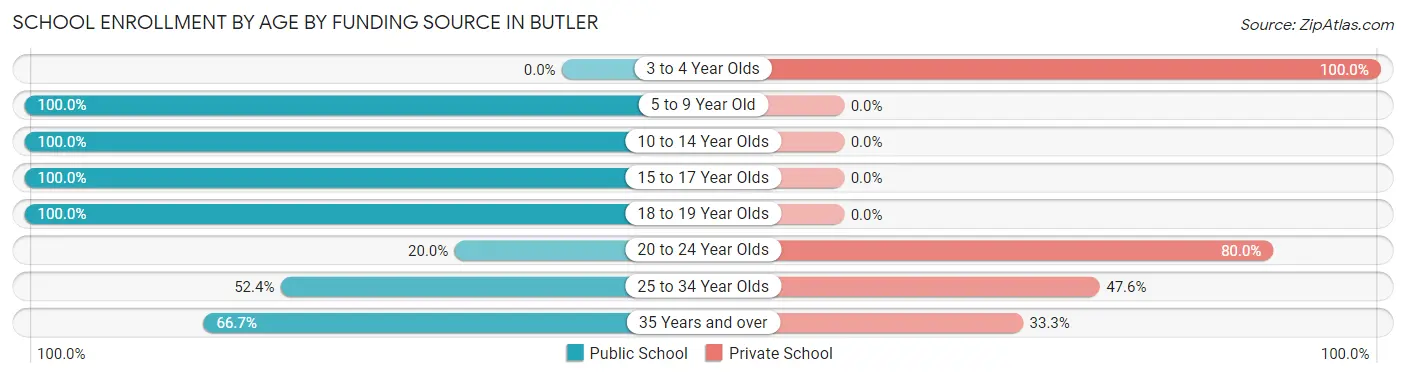
Out of a total of 313 students who are enrolled in schools in Butler, 36 (11.5%) attend a private institution, while the remaining 277 (88.5%) are enrolled in public schools. The age group of 3 to 4 year olds has the highest likelihood of being enrolled in private schools, with 8 (100.0% in the age bracket) enrolled. Conversely, the age group of 5 to 9 year old has the lowest likelihood of being enrolled in a private school, with 28 (100.0% in the age bracket) attending a public institution.
| Age Bracket | Public School | Private School |
| 3 to 4 Year Olds | 0 (0.0%) | 8 (100.0%) |
| 5 to 9 Year Old | 28 (100.0%) | 0 (0.0%) |
| 10 to 14 Year Olds | 103 (100.0%) | 0 (0.0%) |
| 15 to 17 Year Olds | 63 (100.0%) | 0 (0.0%) |
| 18 to 19 Year Olds | 64 (100.0%) | 0 (0.0%) |
| 20 to 24 Year Olds | 4 (20.0%) | 16 (80.0%) |
| 25 to 34 Year Olds | 11 (52.4%) | 10 (47.6%) |
| 35 Years and over | 4 (66.7%) | 2 (33.3%) |
| Total | 277 (88.5%) | 36 (11.5%) |
Educational Attainment by Field of Study in Butler
Science & technology (21 | 15.7%), education (18 | 13.4%), literature & languages (18 | 13.4%), business (16 | 11.9%), and visual & performing arts (16 | 11.9%) are the most common fields of study among 134 individuals in Butler who have obtained a bachelor's degree or higher.
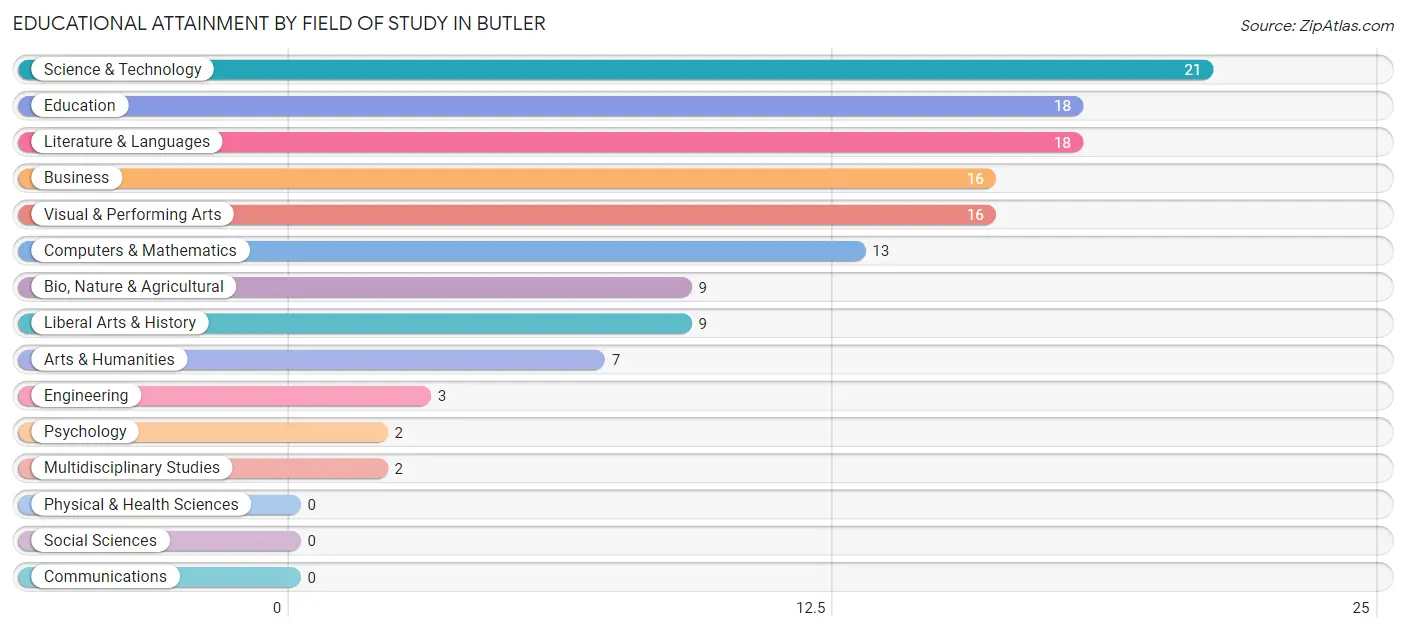
| Field of Study | # Graduates | % Graduates |
| Computers & Mathematics | 13 | 9.7% |
| Bio, Nature & Agricultural | 9 | 6.7% |
| Physical & Health Sciences | 0 | 0.0% |
| Psychology | 2 | 1.5% |
| Social Sciences | 0 | 0.0% |
| Engineering | 3 | 2.2% |
| Multidisciplinary Studies | 2 | 1.5% |
| Science & Technology | 21 | 15.7% |
| Business | 16 | 11.9% |
| Education | 18 | 13.4% |
| Literature & Languages | 18 | 13.4% |
| Liberal Arts & History | 9 | 6.7% |
| Visual & Performing Arts | 16 | 11.9% |
| Communications | 0 | 0.0% |
| Arts & Humanities | 7 | 5.2% |
| Total | 134 | 100.0% |
Transportation & Commute in Butler
Vehicle Availability by Sex in Butler
The most prevalent vehicle ownership categories in Butler are males with 2 vehicles (134, accounting for 52.5%) and females with 2 vehicles (147, making up 45.1%).
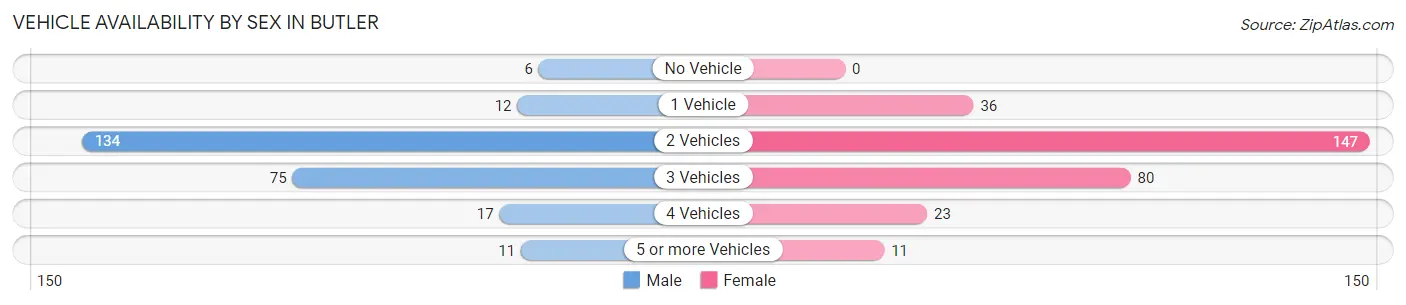
| Vehicles Available | Male | Female |
| No Vehicle | 6 (2.4%) | 0 (0.0%) |
| 1 Vehicle | 12 (4.7%) | 36 (12.1%) |
| 2 Vehicles | 134 (52.5%) | 147 (49.5%) |
| 3 Vehicles | 75 (29.4%) | 80 (26.9%) |
| 4 Vehicles | 17 (6.7%) | 23 (7.7%) |
| 5 or more Vehicles | 11 (4.3%) | 11 (3.7%) |
| Total | 255 (100.0%) | 297 (100.0%) |
Commute Time in Butler
The most frequently occuring commute durations in Butler are 30 to 34 minutes (99 commuters, 19.0%), 20 to 24 minutes (72 commuters, 13.8%), and 15 to 19 minutes (70 commuters, 13.4%).
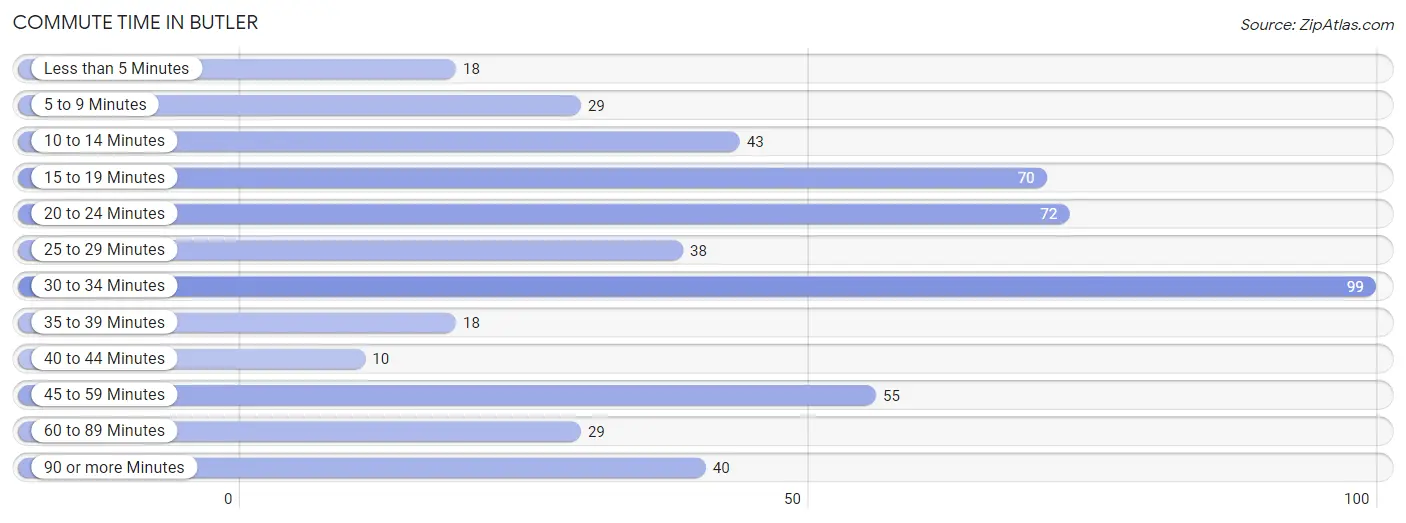
| Commute Time | # Commuters | % Commuters |
| Less than 5 Minutes | 18 | 3.5% |
| 5 to 9 Minutes | 29 | 5.6% |
| 10 to 14 Minutes | 43 | 8.3% |
| 15 to 19 Minutes | 70 | 13.4% |
| 20 to 24 Minutes | 72 | 13.8% |
| 25 to 29 Minutes | 38 | 7.3% |
| 30 to 34 Minutes | 99 | 19.0% |
| 35 to 39 Minutes | 18 | 3.5% |
| 40 to 44 Minutes | 10 | 1.9% |
| 45 to 59 Minutes | 55 | 10.6% |
| 60 to 89 Minutes | 29 | 5.6% |
| 90 or more Minutes | 40 | 7.7% |
Commute Time by Sex in Butler
The most common commute times in Butler are 30 to 34 minutes (65 commuters, 27.9%) for males and 45 to 59 minutes (44 commuters, 15.3%) for females.
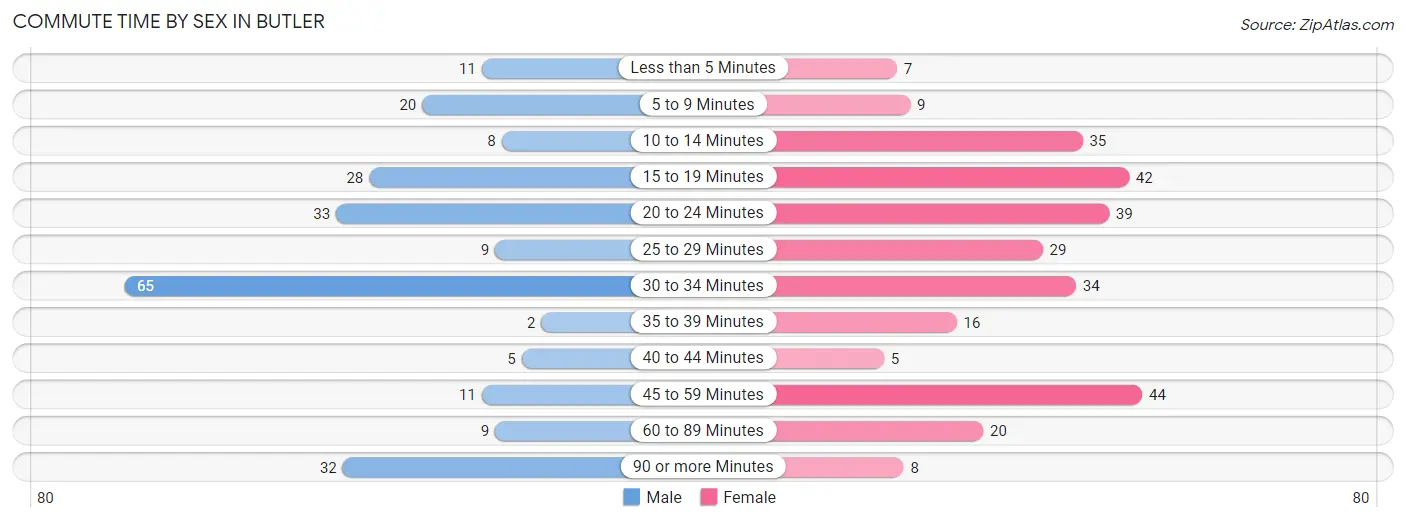
| Commute Time | Male | Female |
| Less than 5 Minutes | 11 (4.7%) | 7 (2.4%) |
| 5 to 9 Minutes | 20 (8.6%) | 9 (3.1%) |
| 10 to 14 Minutes | 8 (3.4%) | 35 (12.1%) |
| 15 to 19 Minutes | 28 (12.0%) | 42 (14.6%) |
| 20 to 24 Minutes | 33 (14.2%) | 39 (13.5%) |
| 25 to 29 Minutes | 9 (3.9%) | 29 (10.1%) |
| 30 to 34 Minutes | 65 (27.9%) | 34 (11.8%) |
| 35 to 39 Minutes | 2 (0.9%) | 16 (5.6%) |
| 40 to 44 Minutes | 5 (2.1%) | 5 (1.7%) |
| 45 to 59 Minutes | 11 (4.7%) | 44 (15.3%) |
| 60 to 89 Minutes | 9 (3.9%) | 20 (6.9%) |
| 90 or more Minutes | 32 (13.7%) | 8 (2.8%) |
Time of Departure to Work by Sex in Butler
The most frequent times of departure to work in Butler are 6:30 AM to 6:59 AM (47, 20.2%) for males and 12:00 PM to 3:59 PM (65, 22.6%) for females.
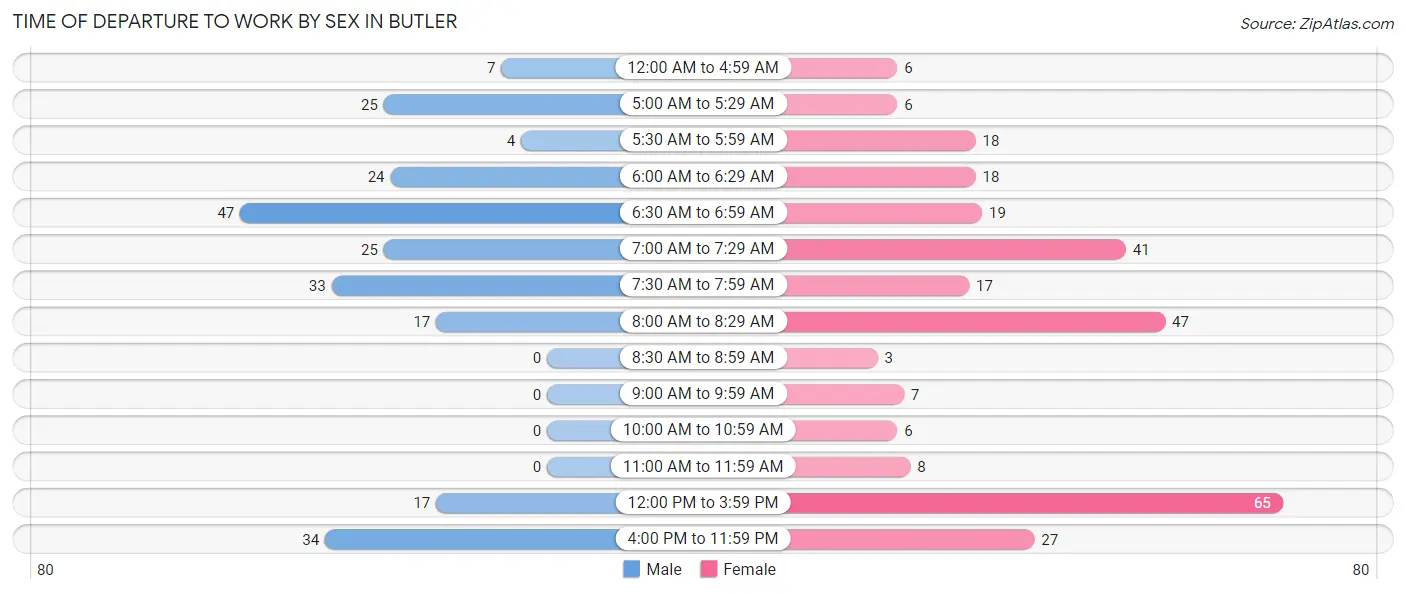
| Time of Departure | Male | Female |
| 12:00 AM to 4:59 AM | 7 (3.0%) | 6 (2.1%) |
| 5:00 AM to 5:29 AM | 25 (10.7%) | 6 (2.1%) |
| 5:30 AM to 5:59 AM | 4 (1.7%) | 18 (6.2%) |
| 6:00 AM to 6:29 AM | 24 (10.3%) | 18 (6.2%) |
| 6:30 AM to 6:59 AM | 47 (20.2%) | 19 (6.6%) |
| 7:00 AM to 7:29 AM | 25 (10.7%) | 41 (14.2%) |
| 7:30 AM to 7:59 AM | 33 (14.2%) | 17 (5.9%) |
| 8:00 AM to 8:29 AM | 17 (7.3%) | 47 (16.3%) |
| 8:30 AM to 8:59 AM | 0 (0.0%) | 3 (1.0%) |
| 9:00 AM to 9:59 AM | 0 (0.0%) | 7 (2.4%) |
| 10:00 AM to 10:59 AM | 0 (0.0%) | 6 (2.1%) |
| 11:00 AM to 11:59 AM | 0 (0.0%) | 8 (2.8%) |
| 12:00 PM to 3:59 PM | 17 (7.3%) | 65 (22.6%) |
| 4:00 PM to 11:59 PM | 34 (14.6%) | 27 (9.4%) |
| Total | 233 (100.0%) | 288 (100.0%) |
Housing Occupancy in Butler
Occupancy by Ownership in Butler
Of the total 406 dwellings in Butler, owner-occupied units account for 287 (70.7%), while renter-occupied units make up 119 (29.3%).
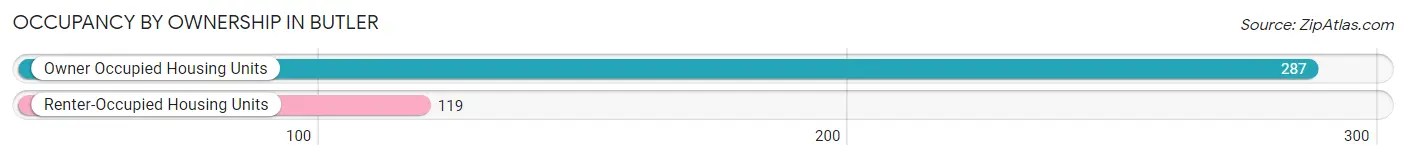
| Occupancy | # Housing Units | % Housing Units |
| Owner Occupied Housing Units | 287 | 70.7% |
| Renter-Occupied Housing Units | 119 | 29.3% |
| Total Occupied Housing Units | 406 | 100.0% |
Occupancy by Household Size in Butler
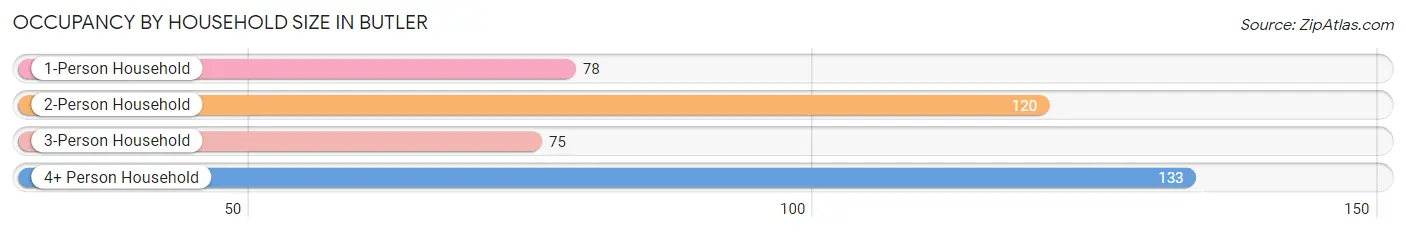
| Household Size | # Housing Units | % Housing Units |
| 1-Person Household | 78 | 19.2% |
| 2-Person Household | 120 | 29.6% |
| 3-Person Household | 75 | 18.5% |
| 4+ Person Household | 133 | 32.8% |
| Total Housing Units | 406 | 100.0% |
Occupancy by Ownership by Household Size in Butler
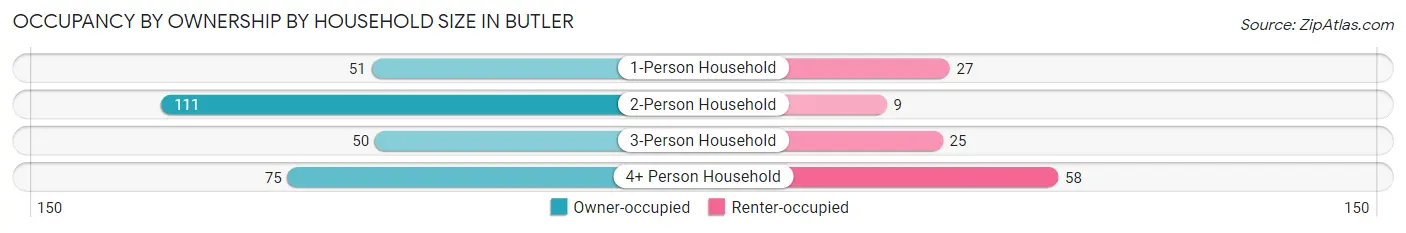
| Household Size | Owner-occupied | Renter-occupied |
| 1-Person Household | 51 (65.4%) | 27 (34.6%) |
| 2-Person Household | 111 (92.5%) | 9 (7.5%) |
| 3-Person Household | 50 (66.7%) | 25 (33.3%) |
| 4+ Person Household | 75 (56.4%) | 58 (43.6%) |
| Total Housing Units | 287 (70.7%) | 119 (29.3%) |
Occupancy by Educational Attainment in Butler
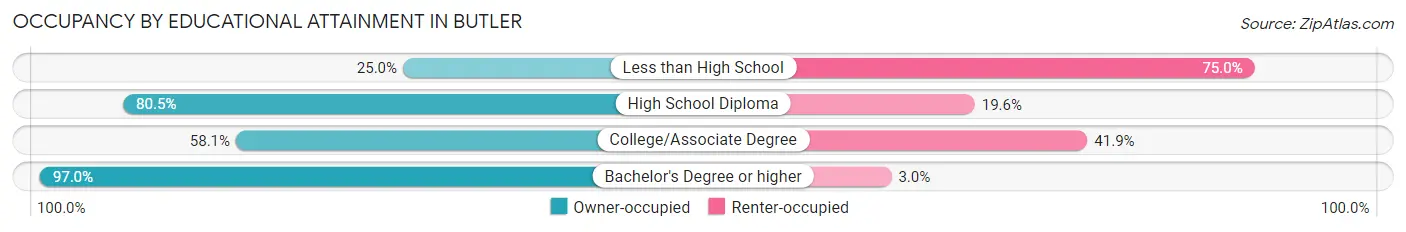
| Household Size | Owner-occupied | Renter-occupied |
| Less than High School | 11 (25.0%) | 33 (75.0%) |
| High School Diploma | 144 (80.4%) | 35 (19.6%) |
| College/Associate Degree | 68 (58.1%) | 49 (41.9%) |
| Bachelor's Degree or higher | 64 (97.0%) | 2 (3.0%) |
Occupancy by Age of Householder in Butler
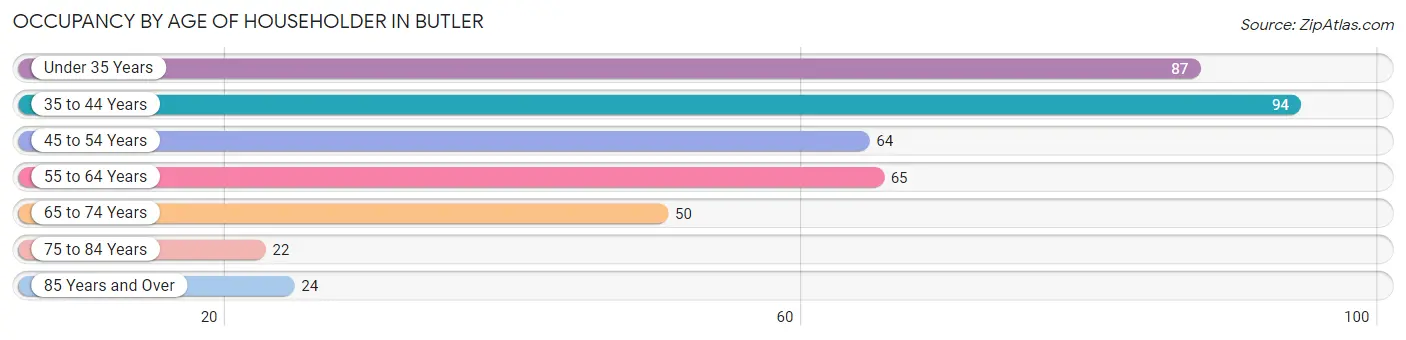
| Age Bracket | # Households | % Households |
| Under 35 Years | 87 | 21.4% |
| 35 to 44 Years | 94 | 23.2% |
| 45 to 54 Years | 64 | 15.8% |
| 55 to 64 Years | 65 | 16.0% |
| 65 to 74 Years | 50 | 12.3% |
| 75 to 84 Years | 22 | 5.4% |
| 85 Years and Over | 24 | 5.9% |
| Total | 406 | 100.0% |
Housing Finances in Butler
Median Income by Occupancy in Butler
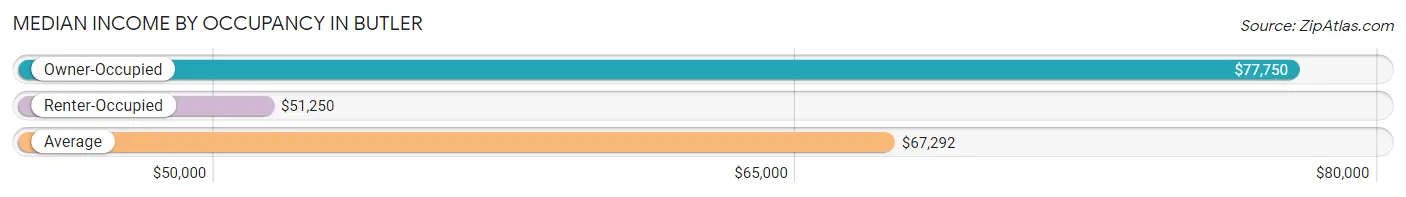
| Occupancy Type | # Households | Median Income |
| Owner-Occupied | 287 (70.7%) | $77,750 |
| Renter-Occupied | 119 (29.3%) | $51,250 |
| Average | 406 (100.0%) | $67,292 |
Occupancy by Householder Income Bracket in Butler
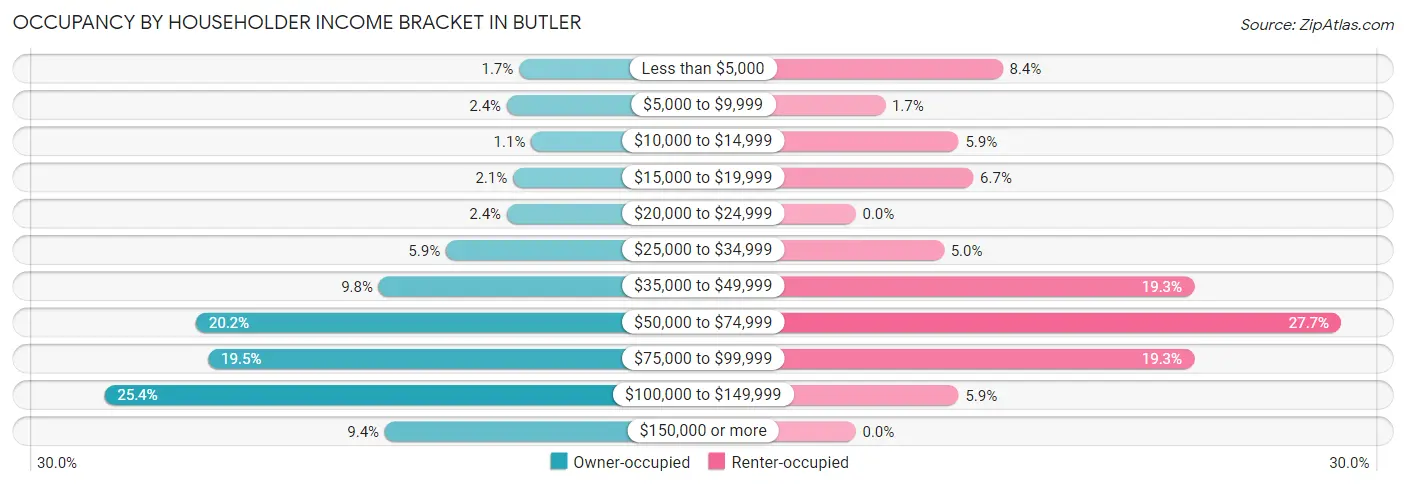
| Income Bracket | Owner-occupied | Renter-occupied |
| Less than $5,000 | 5 (1.7%) | 10 (8.4%) |
| $5,000 to $9,999 | 7 (2.4%) | 2 (1.7%) |
| $10,000 to $14,999 | 3 (1.1%) | 7 (5.9%) |
| $15,000 to $19,999 | 6 (2.1%) | 8 (6.7%) |
| $20,000 to $24,999 | 7 (2.4%) | 0 (0.0%) |
| $25,000 to $34,999 | 17 (5.9%) | 6 (5.0%) |
| $35,000 to $49,999 | 28 (9.8%) | 23 (19.3%) |
| $50,000 to $74,999 | 58 (20.2%) | 33 (27.7%) |
| $75,000 to $99,999 | 56 (19.5%) | 23 (19.3%) |
| $100,000 to $149,999 | 73 (25.4%) | 7 (5.9%) |
| $150,000 or more | 27 (9.4%) | 0 (0.0%) |
| Total | 287 (100.0%) | 119 (100.0%) |
Monthly Housing Cost Tiers in Butler
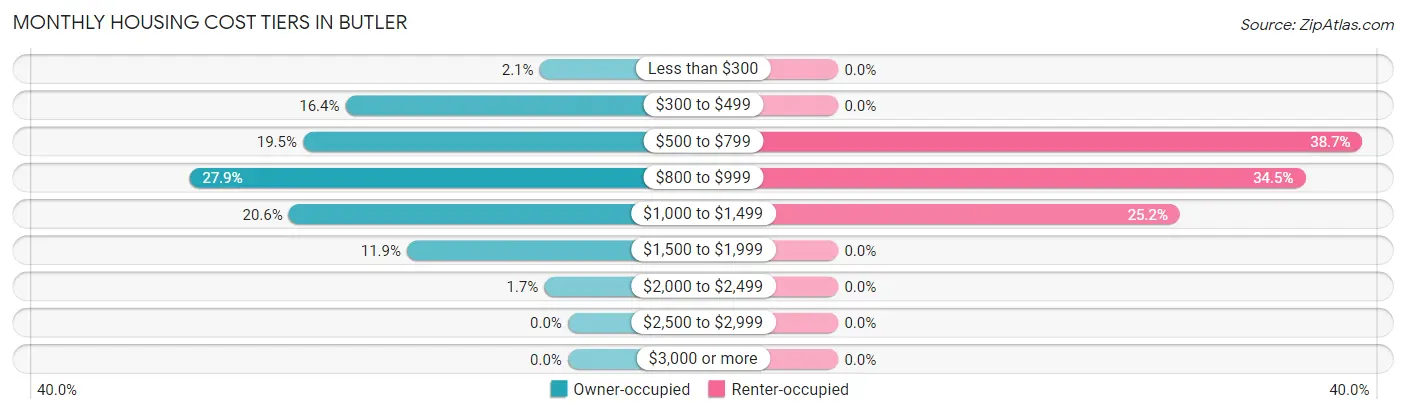
| Monthly Cost | Owner-occupied | Renter-occupied |
| Less than $300 | 6 (2.1%) | 0 (0.0%) |
| $300 to $499 | 47 (16.4%) | 0 (0.0%) |
| $500 to $799 | 56 (19.5%) | 46 (38.7%) |
| $800 to $999 | 80 (27.9%) | 41 (34.4%) |
| $1,000 to $1,499 | 59 (20.6%) | 30 (25.2%) |
| $1,500 to $1,999 | 34 (11.8%) | 0 (0.0%) |
| $2,000 to $2,499 | 5 (1.7%) | 0 (0.0%) |
| $2,500 to $2,999 | 0 (0.0%) | 0 (0.0%) |
| $3,000 or more | 0 (0.0%) | 0 (0.0%) |
| Total | 287 (100.0%) | 119 (100.0%) |
Physical Housing Characteristics in Butler
Housing Structures in Butler
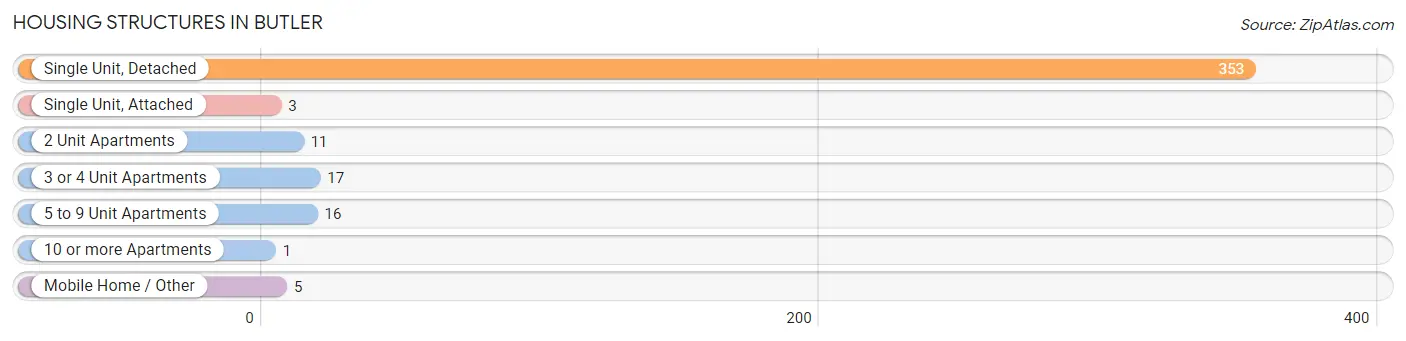
| Structure Type | # Housing Units | % Housing Units |
| Single Unit, Detached | 353 | 87.0% |
| Single Unit, Attached | 3 | 0.7% |
| 2 Unit Apartments | 11 | 2.7% |
| 3 or 4 Unit Apartments | 17 | 4.2% |
| 5 to 9 Unit Apartments | 16 | 3.9% |
| 10 or more Apartments | 1 | 0.3% |
| Mobile Home / Other | 5 | 1.2% |
| Total | 406 | 100.0% |
Housing Structures by Occupancy in Butler
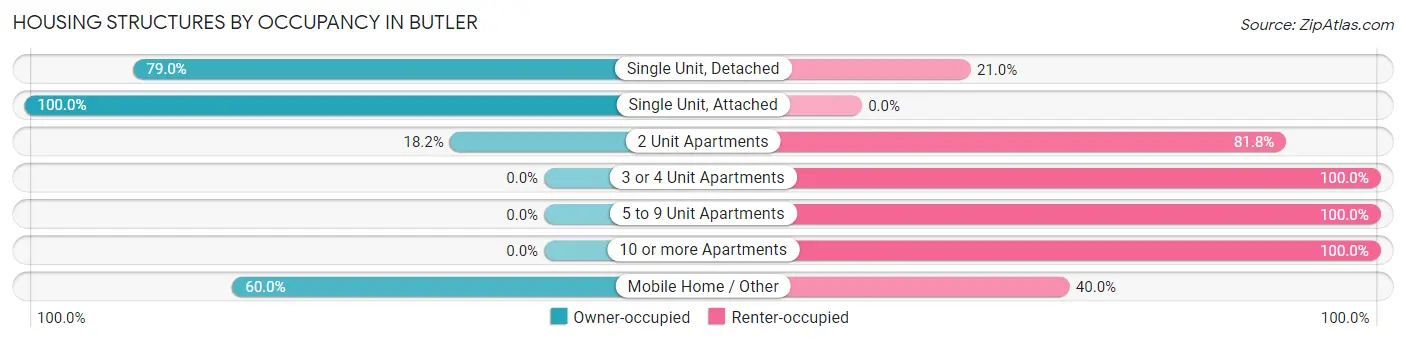
| Structure Type | Owner-occupied | Renter-occupied |
| Single Unit, Detached | 279 (79.0%) | 74 (21.0%) |
| Single Unit, Attached | 3 (100.0%) | 0 (0.0%) |
| 2 Unit Apartments | 2 (18.2%) | 9 (81.8%) |
| 3 or 4 Unit Apartments | 0 (0.0%) | 17 (100.0%) |
| 5 to 9 Unit Apartments | 0 (0.0%) | 16 (100.0%) |
| 10 or more Apartments | 0 (0.0%) | 1 (100.0%) |
| Mobile Home / Other | 3 (60.0%) | 2 (40.0%) |
| Total | 287 (70.7%) | 119 (29.3%) |
Housing Structures by Number of Rooms in Butler
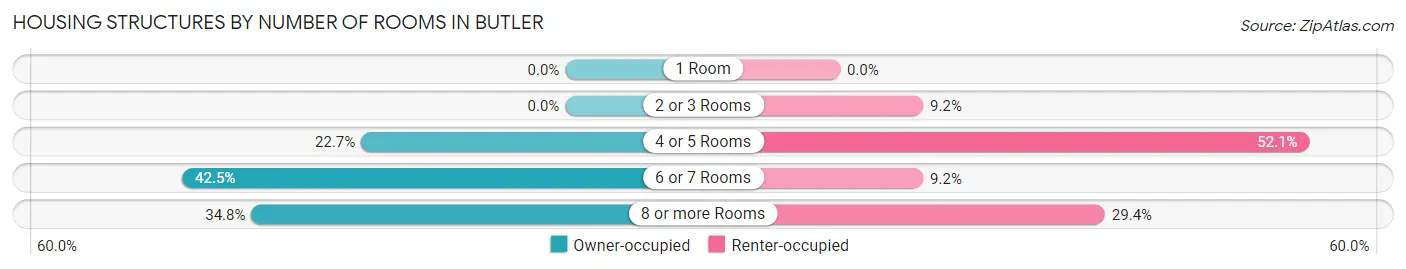
| Number of Rooms | Owner-occupied | Renter-occupied |
| 1 Room | 0 (0.0%) | 0 (0.0%) |
| 2 or 3 Rooms | 0 (0.0%) | 11 (9.2%) |
| 4 or 5 Rooms | 65 (22.7%) | 62 (52.1%) |
| 6 or 7 Rooms | 122 (42.5%) | 11 (9.2%) |
| 8 or more Rooms | 100 (34.8%) | 35 (29.4%) |
| Total | 287 (100.0%) | 119 (100.0%) |
Housing Structure by Heating Type in Butler
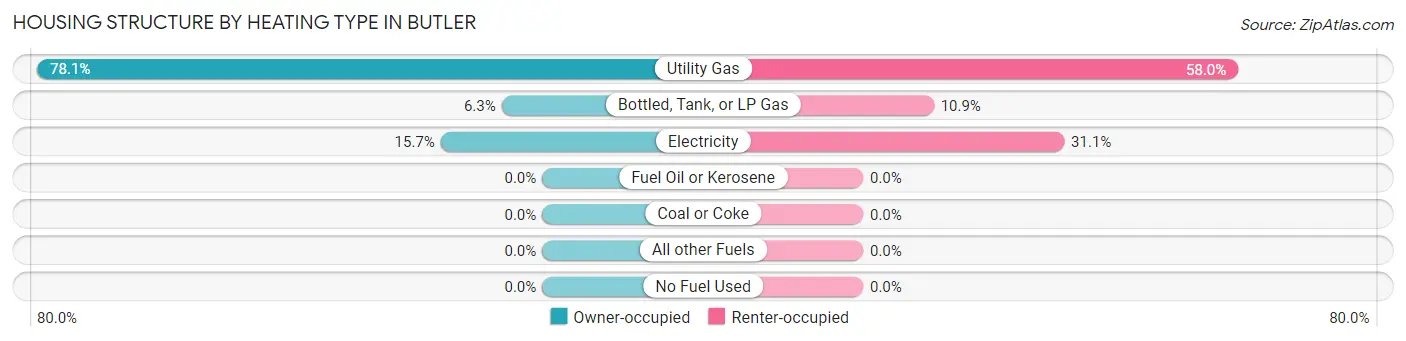
| Heating Type | Owner-occupied | Renter-occupied |
| Utility Gas | 224 (78.0%) | 69 (58.0%) |
| Bottled, Tank, or LP Gas | 18 (6.3%) | 13 (10.9%) |
| Electricity | 45 (15.7%) | 37 (31.1%) |
| Fuel Oil or Kerosene | 0 (0.0%) | 0 (0.0%) |
| Coal or Coke | 0 (0.0%) | 0 (0.0%) |
| All other Fuels | 0 (0.0%) | 0 (0.0%) |
| No Fuel Used | 0 (0.0%) | 0 (0.0%) |
| Total | 287 (100.0%) | 119 (100.0%) |
Household Vehicle Usage in Butler
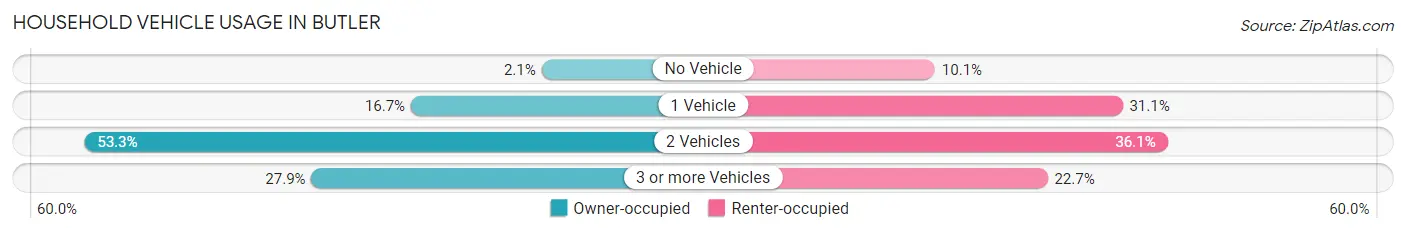
| Vehicles per Household | Owner-occupied | Renter-occupied |
| No Vehicle | 6 (2.1%) | 12 (10.1%) |
| 1 Vehicle | 48 (16.7%) | 37 (31.1%) |
| 2 Vehicles | 153 (53.3%) | 43 (36.1%) |
| 3 or more Vehicles | 80 (27.9%) | 27 (22.7%) |
| Total | 287 (100.0%) | 119 (100.0%) |
Real Estate & Mortgages in Butler
Real Estate and Mortgage Overview in Butler
| Characteristic | Without Mortgage | With Mortgage |
| Housing Units | 85 | 202 |
| Median Property Value | $121,500 | $128,200 |
| Median Household Income | $44,688 | $27 |
| Monthly Housing Costs | $458 | $0 |
| Real Estate Taxes | $1,513 | $0 |
Property Value by Mortgage Status in Butler
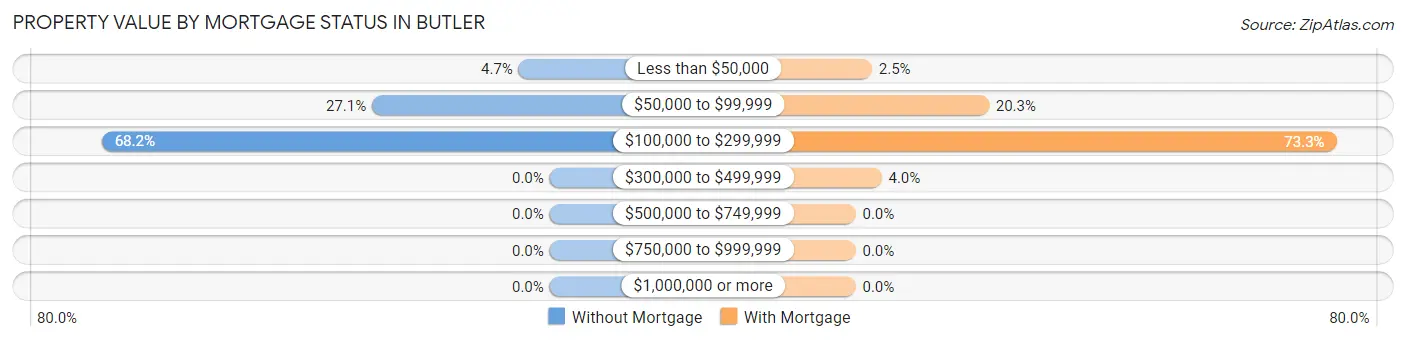
| Property Value | Without Mortgage | With Mortgage |
| Less than $50,000 | 4 (4.7%) | 5 (2.5%) |
| $50,000 to $99,999 | 23 (27.1%) | 41 (20.3%) |
| $100,000 to $299,999 | 58 (68.2%) | 148 (73.3%) |
| $300,000 to $499,999 | 0 (0.0%) | 8 (4.0%) |
| $500,000 to $749,999 | 0 (0.0%) | 0 (0.0%) |
| $750,000 to $999,999 | 0 (0.0%) | 0 (0.0%) |
| $1,000,000 or more | 0 (0.0%) | 0 (0.0%) |
| Total | 85 (100.0%) | 202 (100.0%) |
Household Income by Mortgage Status in Butler
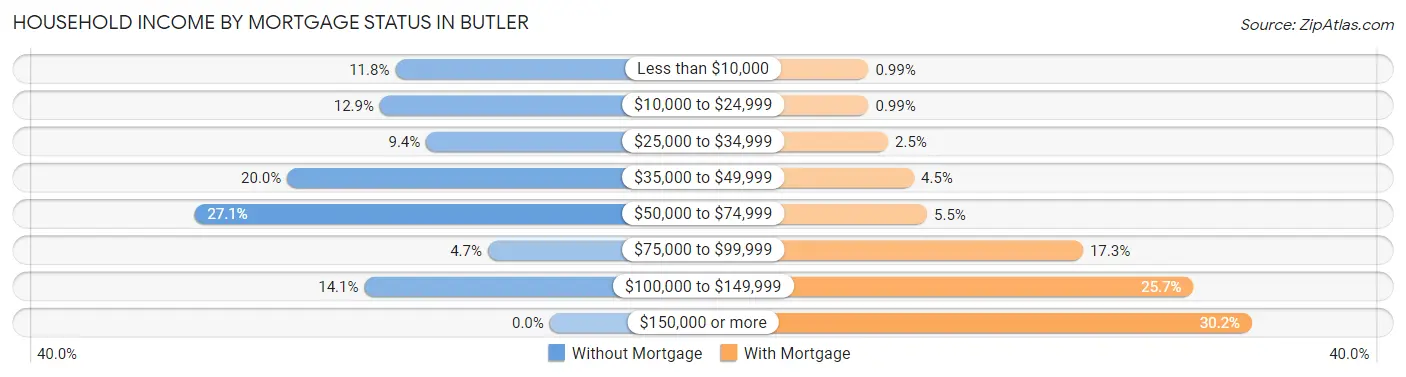
| Household Income | Without Mortgage | With Mortgage |
| Less than $10,000 | 10 (11.8%) | 2 (1.0%) |
| $10,000 to $24,999 | 11 (12.9%) | 2 (1.0%) |
| $25,000 to $34,999 | 8 (9.4%) | 5 (2.5%) |
| $35,000 to $49,999 | 17 (20.0%) | 9 (4.5%) |
| $50,000 to $74,999 | 23 (27.1%) | 11 (5.4%) |
| $75,000 to $99,999 | 4 (4.7%) | 35 (17.3%) |
| $100,000 to $149,999 | 12 (14.1%) | 52 (25.7%) |
| $150,000 or more | 0 (0.0%) | 61 (30.2%) |
| Total | 85 (100.0%) | 202 (100.0%) |
Property Value to Household Income Ratio in Butler
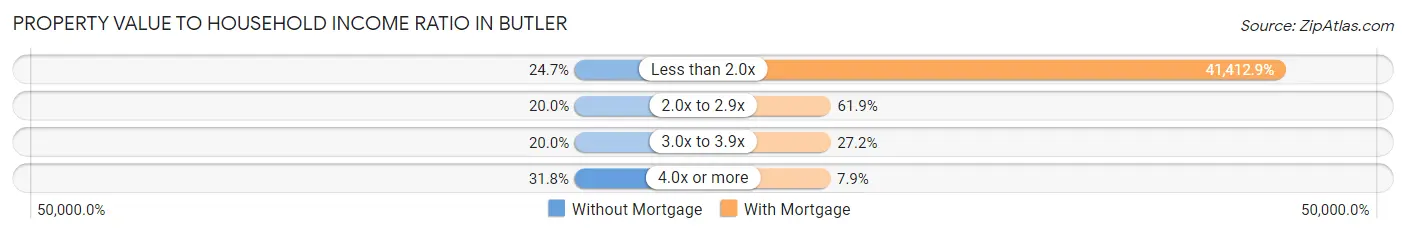
| Value-to-Income Ratio | Without Mortgage | With Mortgage |
| Less than 2.0x | 21 (24.7%) | 83,654 (41,412.9%) |
| 2.0x to 2.9x | 17 (20.0%) | 125 (61.9%) |
| 3.0x to 3.9x | 17 (20.0%) | 55 (27.2%) |
| 4.0x or more | 27 (31.8%) | 16 (7.9%) |
| Total | 85 (100.0%) | 202 (100.0%) |
Real Estate Taxes by Mortgage Status in Butler
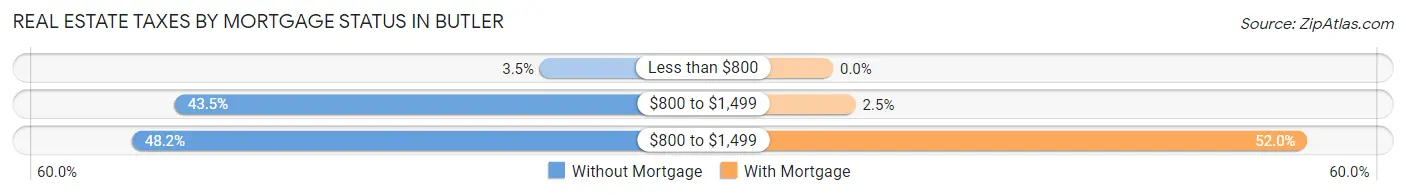
| Property Taxes | Without Mortgage | With Mortgage |
| Less than $800 | 3 (3.5%) | 0 (0.0%) |
| $800 to $1,499 | 37 (43.5%) | 5 (2.5%) |
| $800 to $1,499 | 41 (48.2%) | 105 (52.0%) |
| Total | 85 (100.0%) | 202 (100.0%) |
Health & Disability in Butler
Health Insurance Coverage by Age in Butler
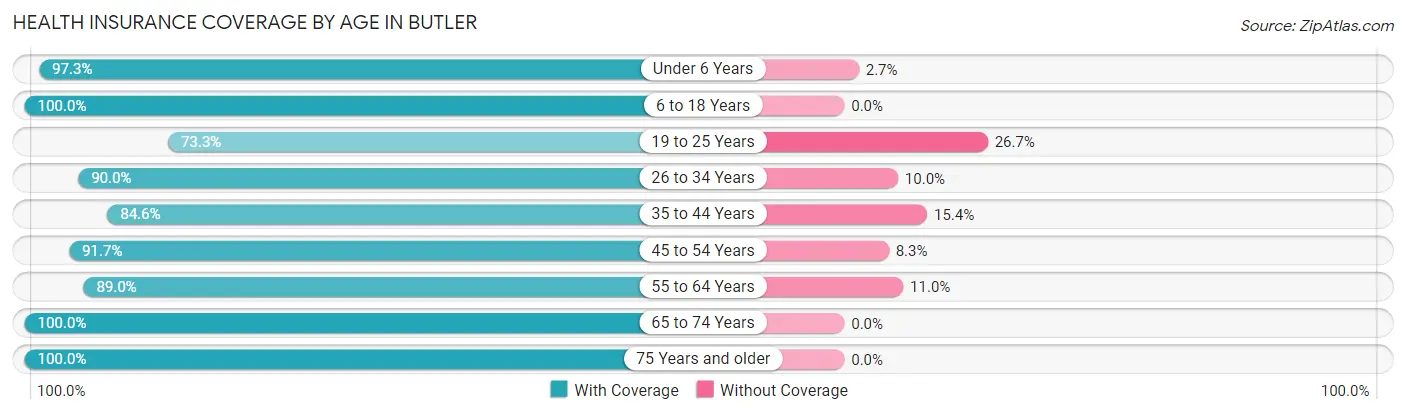
| Age Bracket | With Coverage | Without Coverage |
| Under 6 Years | 108 (97.3%) | 3 (2.7%) |
| 6 to 18 Years | 250 (100.0%) | 0 (0.0%) |
| 19 to 25 Years | 137 (73.3%) | 50 (26.7%) |
| 26 to 34 Years | 99 (90.0%) | 11 (10.0%) |
| 35 to 44 Years | 137 (84.6%) | 25 (15.4%) |
| 45 to 54 Years | 133 (91.7%) | 12 (8.3%) |
| 55 to 64 Years | 73 (89.0%) | 9 (11.0%) |
| 65 to 74 Years | 102 (100.0%) | 0 (0.0%) |
| 75 Years and older | 57 (100.0%) | 0 (0.0%) |
| Total | 1,096 (90.9%) | 110 (9.1%) |
Health Insurance Coverage by Citizenship Status in Butler
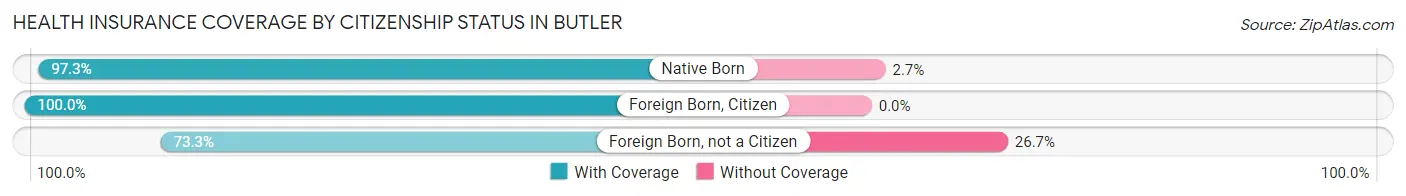
| Citizenship Status | With Coverage | Without Coverage |
| Native Born | 108 (97.3%) | 3 (2.7%) |
| Foreign Born, Citizen | 250 (100.0%) | 0 (0.0%) |
| Foreign Born, not a Citizen | 137 (73.3%) | 50 (26.7%) |
Health Insurance Coverage by Household Income in Butler
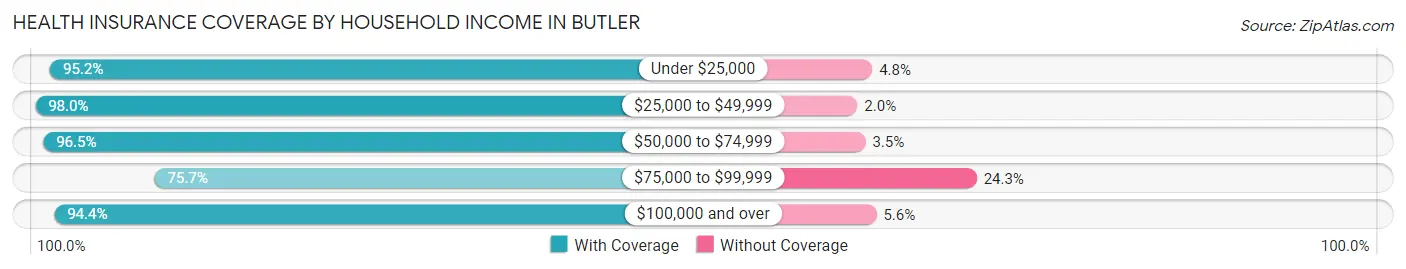
| Household Income | With Coverage | Without Coverage |
| Under $25,000 | 60 (95.2%) | 3 (4.8%) |
| $25,000 to $49,999 | 197 (98.0%) | 4 (2.0%) |
| $50,000 to $74,999 | 303 (96.5%) | 11 (3.5%) |
| $75,000 to $99,999 | 230 (75.7%) | 74 (24.3%) |
| $100,000 and over | 306 (94.4%) | 18 (5.6%) |
Public vs Private Health Insurance Coverage by Age in Butler
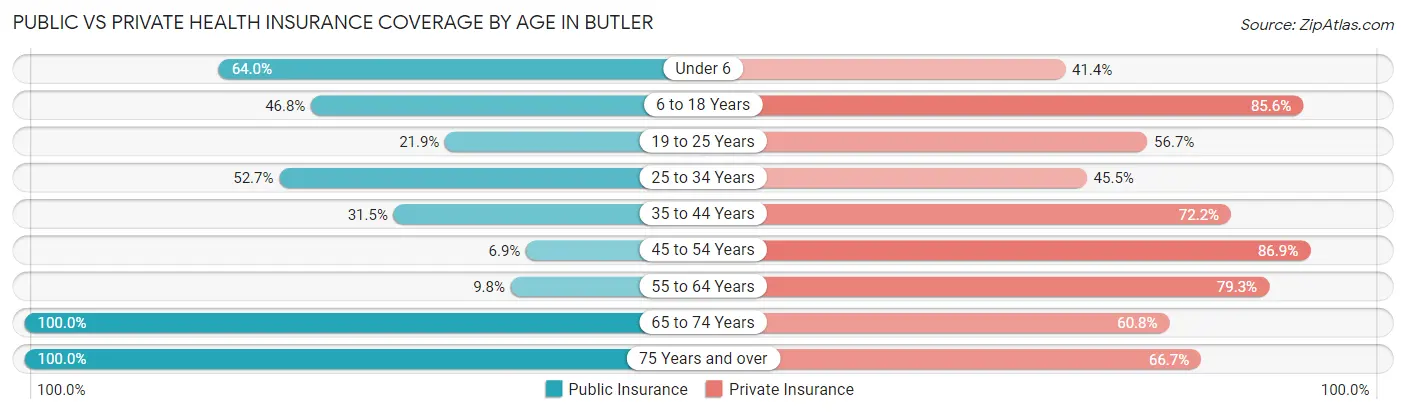
| Age Bracket | Public Insurance | Private Insurance |
| Under 6 | 71 (64.0%) | 46 (41.4%) |
| 6 to 18 Years | 117 (46.8%) | 214 (85.6%) |
| 19 to 25 Years | 41 (21.9%) | 106 (56.7%) |
| 25 to 34 Years | 58 (52.7%) | 50 (45.5%) |
| 35 to 44 Years | 51 (31.5%) | 117 (72.2%) |
| 45 to 54 Years | 10 (6.9%) | 126 (86.9%) |
| 55 to 64 Years | 8 (9.8%) | 65 (79.3%) |
| 65 to 74 Years | 102 (100.0%) | 62 (60.8%) |
| 75 Years and over | 57 (100.0%) | 38 (66.7%) |
| Total | 515 (42.7%) | 824 (68.3%) |
Disability Status by Sex by Age in Butler
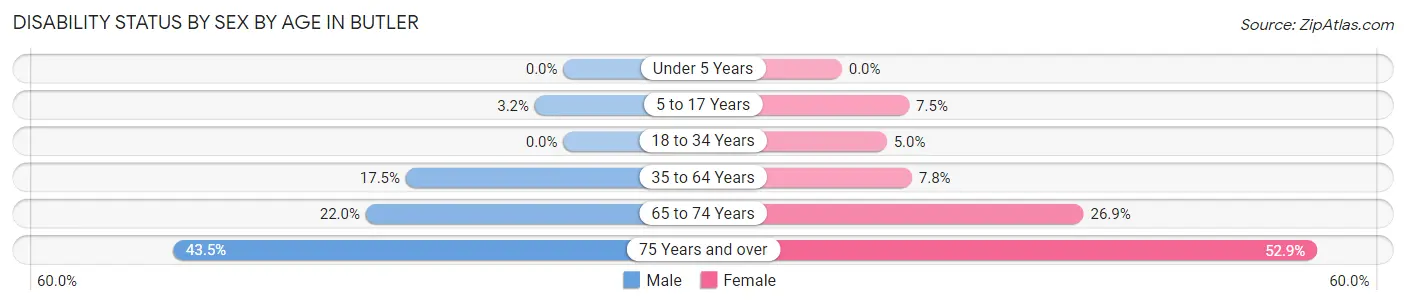
| Age Bracket | Male | Female |
| Under 5 Years | 0 (0.0%) | 0 (0.0%) |
| 5 to 17 Years | 4 (3.2%) | 6 (7.5%) |
| 18 to 34 Years | 0 (0.0%) | 8 (5.0%) |
| 35 to 64 Years | 30 (17.5%) | 17 (7.8%) |
| 65 to 74 Years | 11 (22.0%) | 14 (26.9%) |
| 75 Years and over | 10 (43.5%) | 18 (52.9%) |
Disability Class by Sex by Age in Butler
Disability Class: Hearing Difficulty
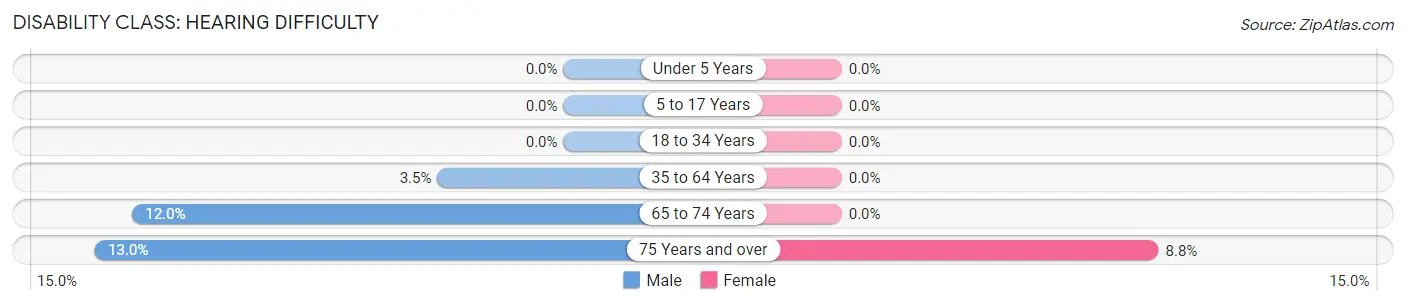
| Age Bracket | Male | Female |
| Under 5 Years | 0 (0.0%) | 0 (0.0%) |
| 5 to 17 Years | 0 (0.0%) | 0 (0.0%) |
| 18 to 34 Years | 0 (0.0%) | 0 (0.0%) |
| 35 to 64 Years | 6 (3.5%) | 0 (0.0%) |
| 65 to 74 Years | 6 (12.0%) | 0 (0.0%) |
| 75 Years and over | 3 (13.0%) | 3 (8.8%) |
Disability Class: Vision Difficulty
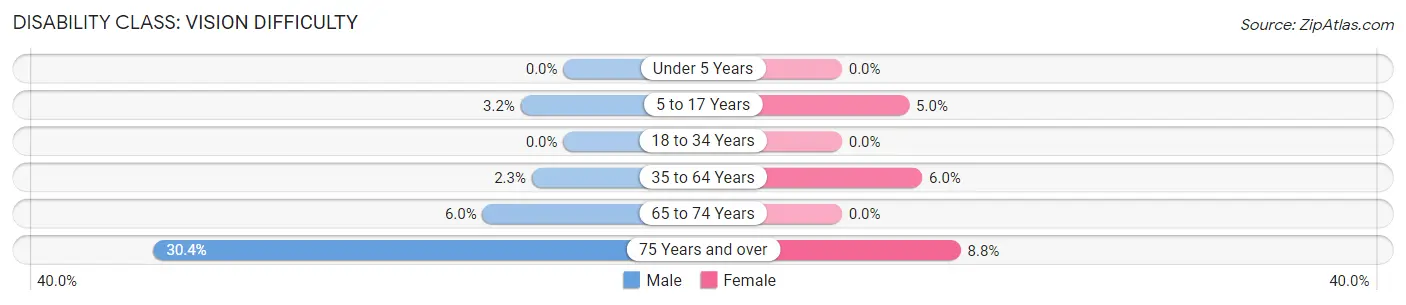
| Age Bracket | Male | Female |
| Under 5 Years | 0 (0.0%) | 0 (0.0%) |
| 5 to 17 Years | 4 (3.2%) | 4 (5.0%) |
| 18 to 34 Years | 0 (0.0%) | 0 (0.0%) |
| 35 to 64 Years | 4 (2.3%) | 13 (6.0%) |
| 65 to 74 Years | 3 (6.0%) | 0 (0.0%) |
| 75 Years and over | 7 (30.4%) | 3 (8.8%) |
Disability Class: Cognitive Difficulty
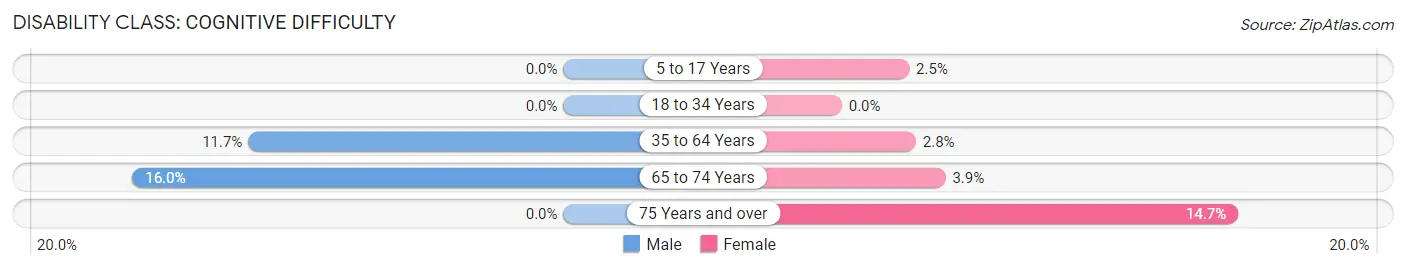
| Age Bracket | Male | Female |
| 5 to 17 Years | 0 (0.0%) | 2 (2.5%) |
| 18 to 34 Years | 0 (0.0%) | 0 (0.0%) |
| 35 to 64 Years | 20 (11.7%) | 6 (2.8%) |
| 65 to 74 Years | 8 (16.0%) | 2 (3.8%) |
| 75 Years and over | 0 (0.0%) | 5 (14.7%) |
Disability Class: Ambulatory Difficulty
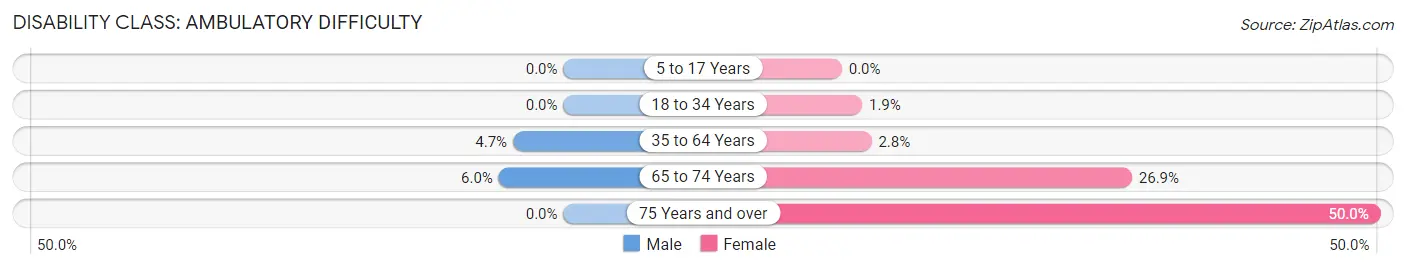
| Age Bracket | Male | Female |
| 5 to 17 Years | 0 (0.0%) | 0 (0.0%) |
| 18 to 34 Years | 0 (0.0%) | 3 (1.9%) |
| 35 to 64 Years | 8 (4.7%) | 6 (2.8%) |
| 65 to 74 Years | 3 (6.0%) | 14 (26.9%) |
| 75 Years and over | 0 (0.0%) | 17 (50.0%) |
Disability Class: Self-Care Difficulty
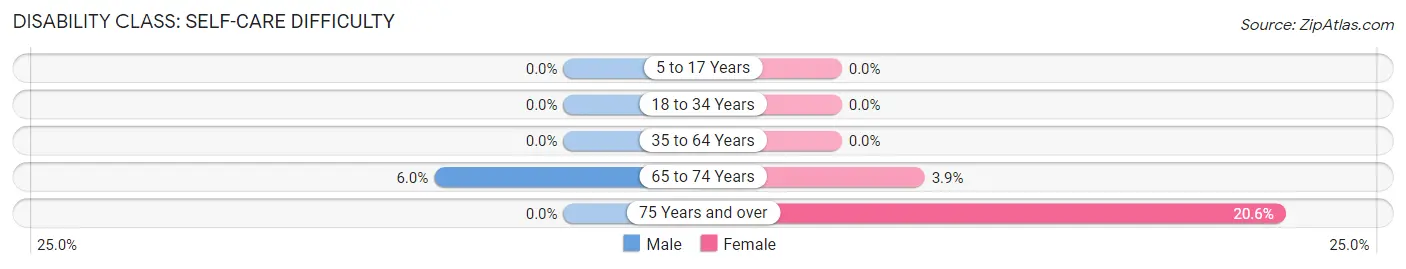
| Age Bracket | Male | Female |
| 5 to 17 Years | 0 (0.0%) | 0 (0.0%) |
| 18 to 34 Years | 0 (0.0%) | 0 (0.0%) |
| 35 to 64 Years | 0 (0.0%) | 0 (0.0%) |
| 65 to 74 Years | 3 (6.0%) | 2 (3.8%) |
| 75 Years and over | 0 (0.0%) | 7 (20.6%) |
Technology Access in Butler
Computing Device Access in Butler
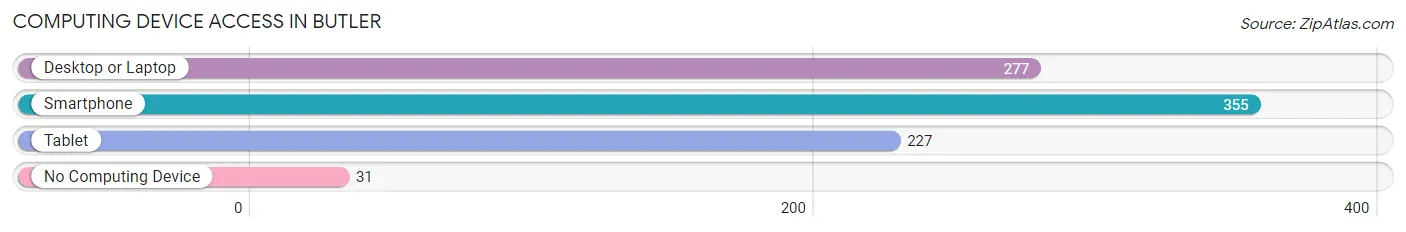
| Device Type | # Households | % Households |
| Desktop or Laptop | 277 | 68.2% |
| Smartphone | 355 | 87.4% |
| Tablet | 227 | 55.9% |
| No Computing Device | 31 | 7.6% |
| Total | 406 | 100.0% |
Internet Access in Butler
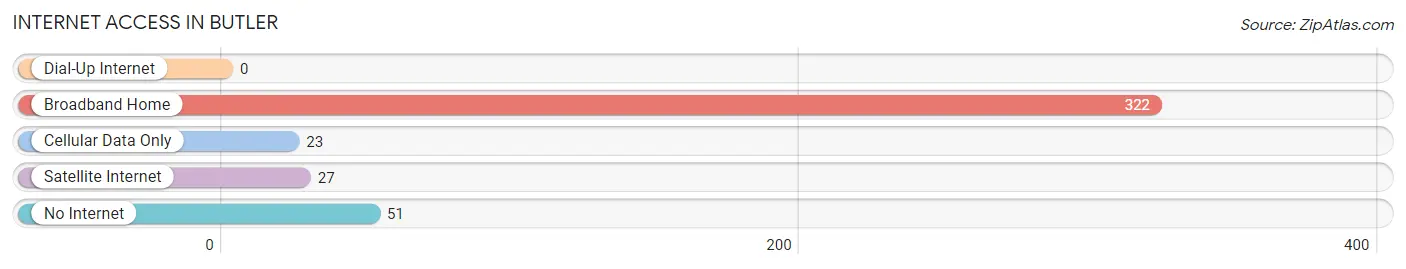
| Internet Type | # Households | % Households |
| Dial-Up Internet | 0 | 0.0% |
| Broadband Home | 322 | 79.3% |
| Cellular Data Only | 23 | 5.7% |
| Satellite Internet | 27 | 6.7% |
| No Internet | 51 | 12.6% |
| Total | 406 | 100.0% |
Butler Summary
Butler, Ohio is a small city located in the southwestern corner of the state, in Butler County. It is situated on the banks of the Great Miami River, and is part of the Dayton metropolitan area. The city has a population of approximately 8,000 people, and is the county seat of Butler County.
History
The area that is now Butler was first settled in 1796 by a group of settlers from Pennsylvania. The settlement was originally known as “Butler’s Station”, and was named after General Richard Butler, a Revolutionary War hero. The settlement was incorporated as a village in 1817, and was later incorporated as a city in 1845.
In the late 19th century, Butler was a major center for the production of agricultural products, such as wheat, corn, and oats. The city was also home to several manufacturing companies, including a paper mill, a flour mill, and a furniture factory.
Geography
Butler is located in the southwestern corner of Ohio, in Butler County. It is situated on the banks of the Great Miami River, and is part of the Dayton metropolitan area. The city has a total area of 4.2 square miles, all of which is land.
The city is located in a humid continental climate zone, with hot summers and cold winters. The average annual temperature is around 50 degrees Fahrenheit, and the average annual precipitation is around 40 inches.
Economy
The economy of Butler is largely based on manufacturing and agriculture. The city is home to several manufacturing companies, including a paper mill, a flour mill, and a furniture factory. The city is also home to several agricultural businesses, including a dairy farm, a poultry farm, and a vegetable farm.
The city is also home to several retail stores, restaurants, and other businesses. The city is served by several major highways, including Interstate 75 and U.S. Route 35.
Demographics
As of the 2010 census, the population of Butler was 8,000 people. The racial makeup of the city was 95.3% White, 1.2% African American, 0.3% Native American, 0.7% Asian, 0.1% Pacific Islander, 0.7% from other races, and 1.9% from two or more races. Hispanic or Latino of any race were 2.2% of the population.
The median income for a household in the city was $37,917, and the median income for a family was $45,938. The per capita income for the city was $19,945. About 11.2% of families and 14.2% of the population were below the poverty line, including 19.2% of those under age 18 and 8.2% of those age 65 or over.
Butler is served by several public schools, including Butler High School, Butler Middle School, and Butler Elementary School. The city is also home to several private schools, including St. Joseph Catholic School and Butler Christian School.
Common Questions
What is Per Capita Income in Butler?
Per Capita income in Butler is $25,213.
What is the Median Family Income in Butler?
Median Family Income in Butler is $77,045.
What is the Median Household income in Butler?
Median Household Income in Butler is $67,292.
What is Income or Wage Gap in Butler?
Income or Wage Gap in Butler is 46.8%.
Women in Butler earn 53.2 cents for every dollar earned by a man.
What is Inequality or Gini Index in Butler?
Inequality or Gini Index in Butler is 0.34.
What is the Total Population of Butler?
Total Population of Butler is 1,212.
What is the Total Male Population of Butler?
Total Male Population of Butler is 636.
What is the Total Female Population of Butler?
Total Female Population of Butler is 576.
What is the Ratio of Males per 100 Females in Butler?
There are 110.42 Males per 100 Females in Butler.
What is the Ratio of Females per 100 Males in Butler?
There are 90.57 Females per 100 Males in Butler.
What is the Median Population Age in Butler?
Median Population Age in Butler is 28.8 Years.
What is the Average Family Size in Butler
Average Family Size in Butler is 3.5 People.
What is the Average Household Size in Butler
Average Household Size in Butler is 3.0 People.
How Large is the Labor Force in Butler?
There are 584 People in the Labor Forcein in Butler.
What is the Percentage of People in the Labor Force in Butler?
60.3% of People are in the Labor Force in Butler.
What is the Unemployment Rate in Butler?
Unemployment Rate in Butler is 1.2%.