Oberlin, OH Map & Demographics
Oberlin Map
Oberlin Overview
$28,443
PER CAPITA INCOME
$93,807
AVG FAMILY INCOME
$67,660
AVG HOUSEHOLD INCOME
23.1%
WAGE / INCOME GAP [ % ]
76.9¢/ $1
WAGE / INCOME GAP [ $ ]
0.45
INEQUALITY / GINI INDEX
8,194
TOTAL POPULATION
3,622
MALE POPULATION
4,572
FEMALE POPULATION
79.22
MALES / 100 FEMALES
126.23
FEMALES / 100 MALES
25.8
MEDIAN AGE
2.8
AVG FAMILY SIZE
2.3
AVG HOUSEHOLD SIZE
4,111
LABOR FORCE [ PEOPLE ]
54.8%
PERCENT IN LABOR FORCE
4.6%
UNEMPLOYMENT RATE
Oberlin Zip Codes
Oberlin Area Codes
Income in Oberlin
Income Overview in Oberlin
Per Capita Income in Oberlin is $28,443, while median incomes of families and households are $93,807 and $67,660 respectively.
| Characteristic | Number | Measure |
| Per Capita Income | 8,194 | $28,443 |
| Median Family Income | 1,286 | $93,807 |
| Mean Family Income | 1,286 | $109,339 |
| Median Household Income | 2,464 | $67,660 |
| Mean Household Income | 2,464 | $82,142 |
| Income Deficit | 1,286 | $0 |
| Wage / Income Gap (%) | 8,194 | 23.06% |
| Wage / Income Gap ($) | 8,194 | 76.94¢ per $1 |
| Gini / Inequality Index | 8,194 | 0.45 |
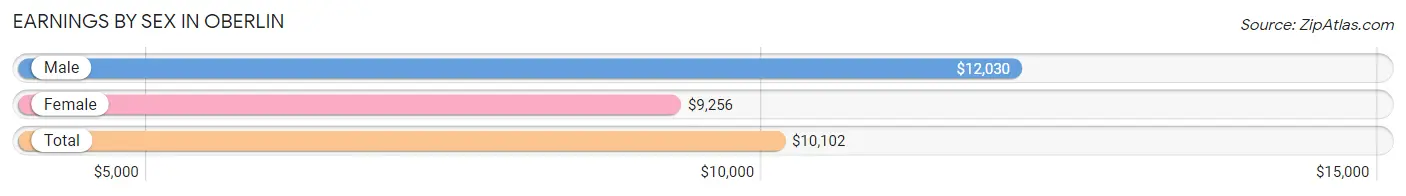
Earnings by Sex in Oberlin
Average Earnings in Oberlin are $10,102, $12,030 for men and $9,256 for women, a difference of 23.1%.
| Sex | Number | Average Earnings |
| Male | 2,195 (44.5%) | $12,030 |
| Female | 2,743 (55.5%) | $9,256 |
| Total | 4,938 (100.0%) | $10,102 |
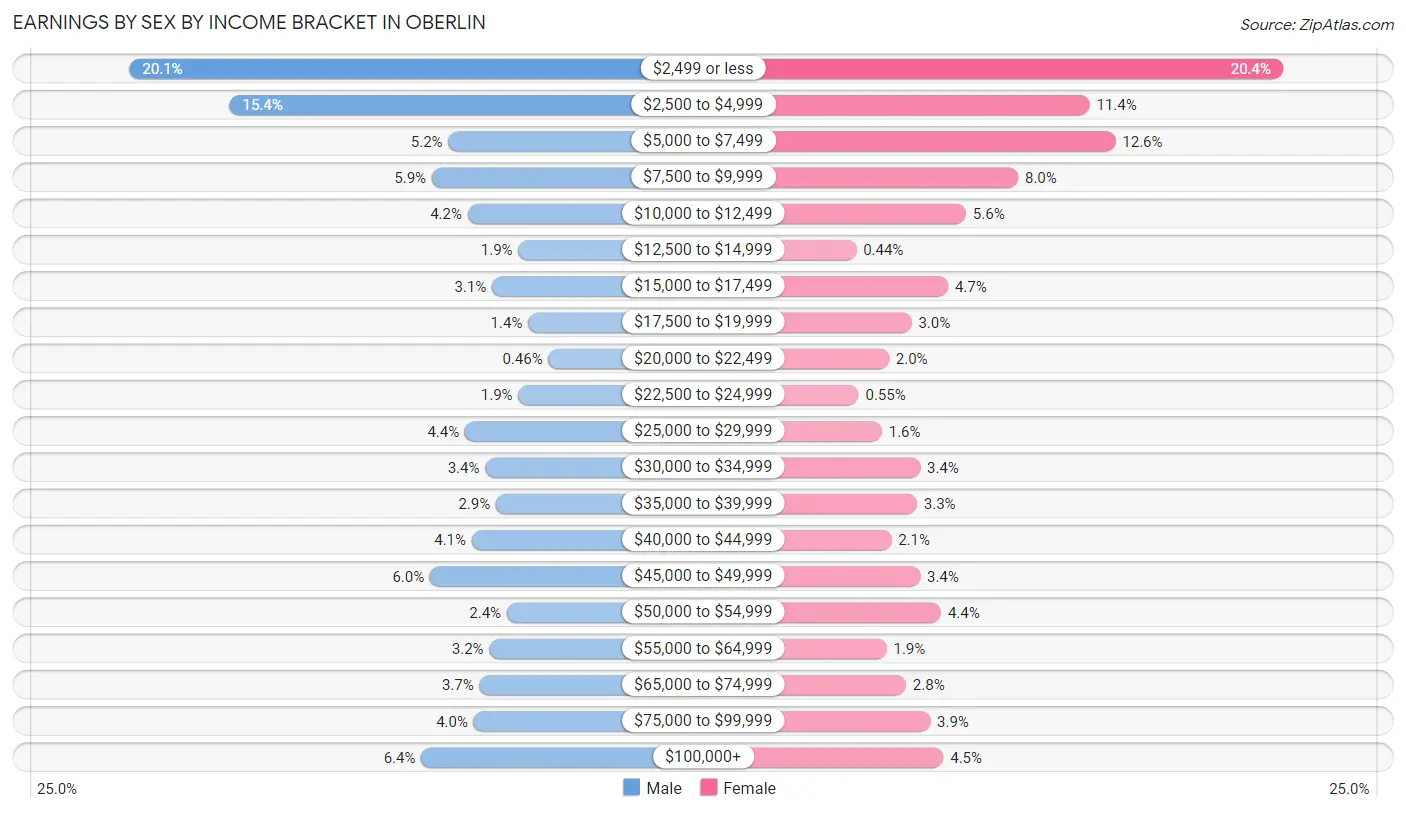
Earnings by Sex by Income Bracket in Oberlin
The most common earnings brackets in Oberlin are $2,499 or less for men (441 | 20.1%) and $2,499 or less for women (560 | 20.4%).
| Income | Male | Female |
| $2,499 or less | 441 (20.1%) | 560 (20.4%) |
| $2,500 to $4,999 | 338 (15.4%) | 312 (11.4%) |
| $5,000 to $7,499 | 113 (5.1%) | 345 (12.6%) |
| $7,500 to $9,999 | 130 (5.9%) | 220 (8.0%) |
| $10,000 to $12,499 | 93 (4.2%) | 153 (5.6%) |
| $12,500 to $14,999 | 41 (1.9%) | 12 (0.4%) |
| $15,000 to $17,499 | 68 (3.1%) | 130 (4.7%) |
| $17,500 to $19,999 | 31 (1.4%) | 83 (3.0%) |
| $20,000 to $22,499 | 10 (0.5%) | 54 (2.0%) |
| $22,500 to $24,999 | 41 (1.9%) | 15 (0.5%) |
| $25,000 to $29,999 | 96 (4.4%) | 45 (1.6%) |
| $30,000 to $34,999 | 75 (3.4%) | 94 (3.4%) |
| $35,000 to $39,999 | 64 (2.9%) | 90 (3.3%) |
| $40,000 to $44,999 | 89 (4.1%) | 57 (2.1%) |
| $45,000 to $49,999 | 132 (6.0%) | 94 (3.4%) |
| $50,000 to $54,999 | 53 (2.4%) | 121 (4.4%) |
| $55,000 to $64,999 | 71 (3.2%) | 51 (1.9%) |
| $65,000 to $74,999 | 81 (3.7%) | 76 (2.8%) |
| $75,000 to $99,999 | 87 (4.0%) | 107 (3.9%) |
| $100,000+ | 141 (6.4%) | 124 (4.5%) |
| Total | 2,195 (100.0%) | 2,743 (100.0%) |
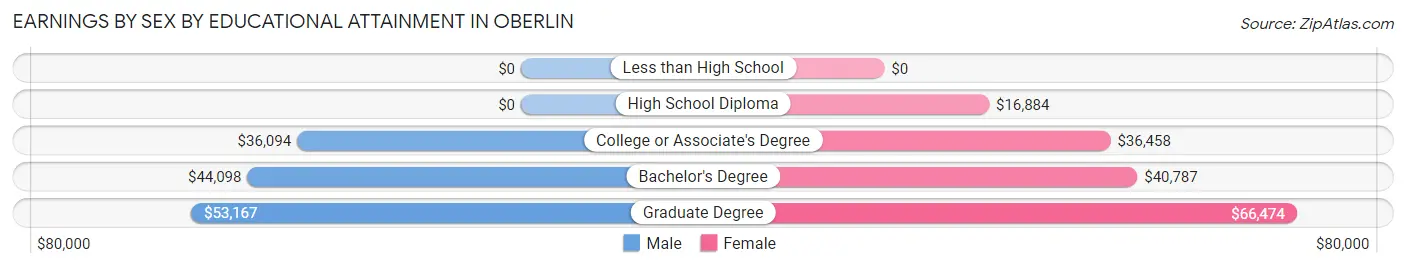
Earnings by Sex by Educational Attainment in Oberlin
Average earnings in Oberlin are $46,228 for men and $38,284 for women, a difference of 17.2%. Men with an educational attainment of graduate degree enjoy the highest average annual earnings of $53,167, while those with college or associate's degree education earn the least with $36,094. Women with an educational attainment of graduate degree earn the most with the average annual earnings of $66,474, while those with high school diploma education have the smallest earnings of $16,884.
| Educational Attainment | Male Income | Female Income |
| Less than High School | - | - |
| High School Diploma | - | - |
| College or Associate's Degree | $36,094 | $36,458 |
| Bachelor's Degree | $44,098 | $40,787 |
| Graduate Degree | $53,167 | $66,474 |
| Total | $46,228 | $38,284 |
Family Income in Oberlin
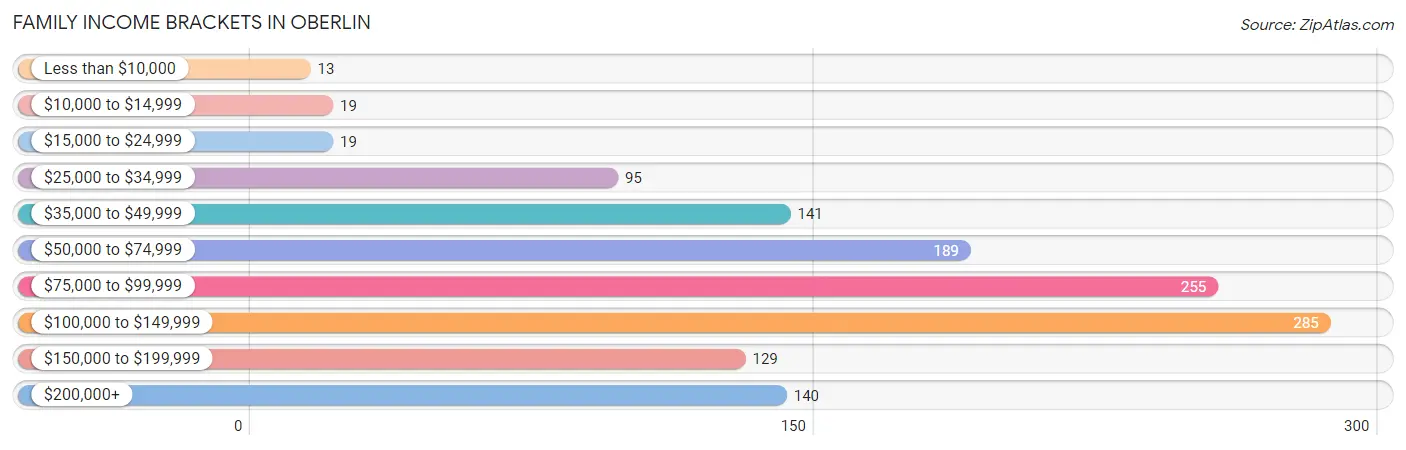
Family Income Brackets in Oberlin
According to the Oberlin family income data, there are 285 families falling into the $100,000 to $149,999 income range, which is the most common income bracket and makes up 22.2% of all families. Conversely, the less than $10,000 income bracket is the least frequent group with only 13 families (1.0%) belonging to this category.
| Income Bracket | # Families | % Families |
| Less than $10,000 | 13 | 1.0% |
| $10,000 to $14,999 | 19 | 1.5% |
| $15,000 to $24,999 | 19 | 1.5% |
| $25,000 to $34,999 | 95 | 7.4% |
| $35,000 to $49,999 | 141 | 11.0% |
| $50,000 to $74,999 | 189 | 14.7% |
| $75,000 to $99,999 | 255 | 19.8% |
| $100,000 to $149,999 | 285 | 22.2% |
| $150,000 to $199,999 | 129 | 10.0% |
| $200,000+ | 140 | 10.9% |
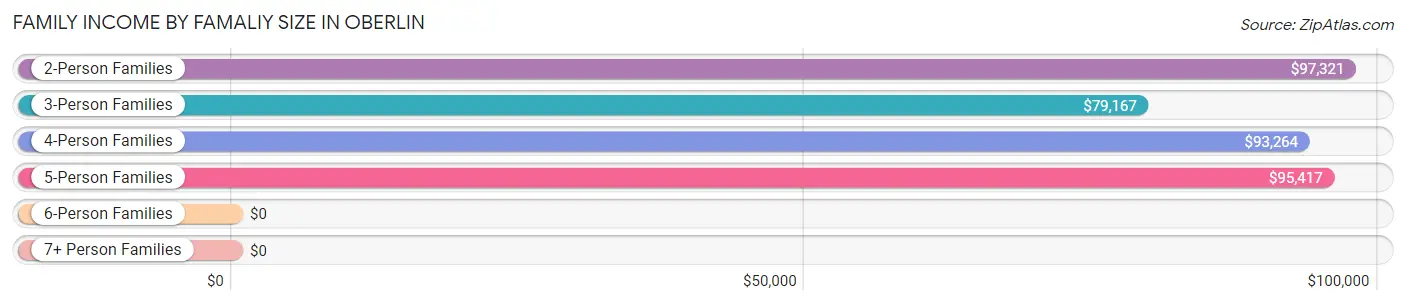
Family Income by Famaliy Size in Oberlin
2-person families (857 | 66.6%) account for the highest median family income in Oberlin with $97,321 per family, while 2-person families (857 | 66.6%) have the highest median income of $48,660 per family member.
| Income Bracket | # Families | Median Income |
| 2-Person Families | 857 (66.6%) | $97,321 |
| 3-Person Families | 226 (17.6%) | $79,167 |
| 4-Person Families | 139 (10.8%) | $93,264 |
| 5-Person Families | 40 (3.1%) | $95,417 |
| 6-Person Families | 23 (1.8%) | $0 |
| 7+ Person Families | 1 (0.1%) | $0 |
| Total | 1,286 (100.0%) | $93,807 |
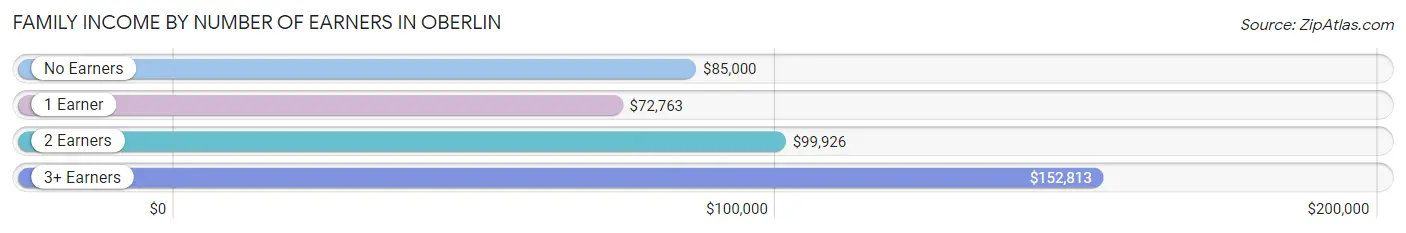
Family Income by Number of Earners in Oberlin
The median family income in Oberlin is $93,807, with families comprising 3+ earners (75) having the highest median family income of $152,813, while families with 1 earner (328) have the lowest median family income of $72,763, accounting for 5.8% and 25.5% of families, respectively.
| Number of Earners | # Families | Median Income |
| No Earners | 292 (22.7%) | $85,000 |
| 1 Earner | 328 (25.5%) | $72,763 |
| 2 Earners | 591 (46.0%) | $99,926 |
| 3+ Earners | 75 (5.8%) | $152,813 |
| Total | 1,286 (100.0%) | $93,807 |
Household Income in Oberlin
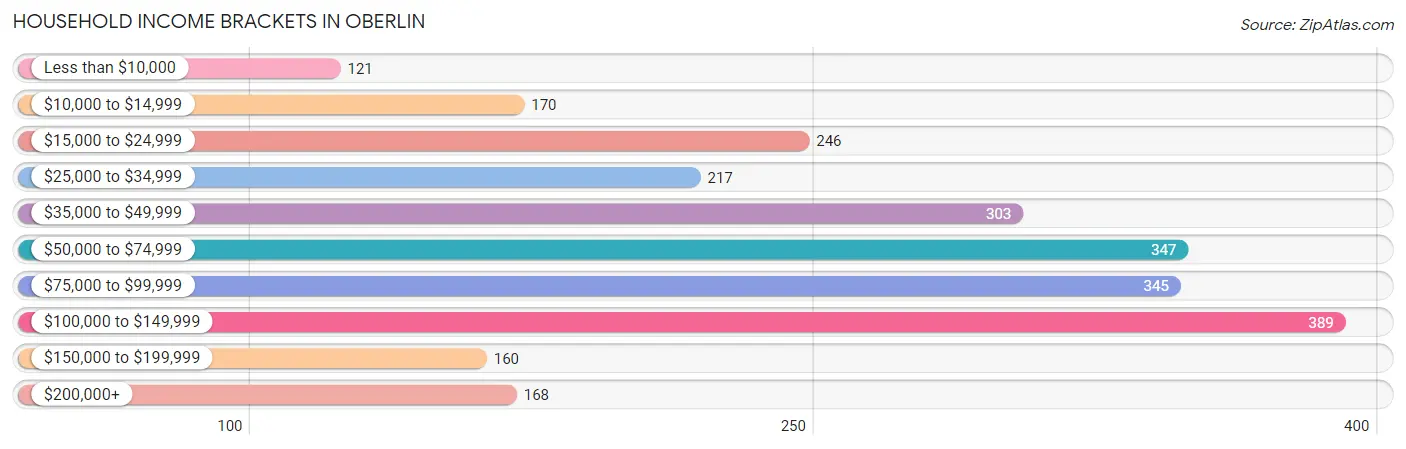
Household Income Brackets in Oberlin
With 389 households falling in the category, the $100,000 to $149,999 income range is the most frequent in Oberlin, accounting for 15.8% of all households. In contrast, only 121 households (4.9%) fall into the less than $10,000 income bracket, making it the least populous group.
| Income Bracket | # Households | % Households |
| Less than $10,000 | 121 | 4.9% |
| $10,000 to $14,999 | 170 | 6.9% |
| $15,000 to $24,999 | 246 | 10.0% |
| $25,000 to $34,999 | 217 | 8.8% |
| $35,000 to $49,999 | 303 | 12.3% |
| $50,000 to $74,999 | 347 | 14.1% |
| $75,000 to $99,999 | 345 | 14.0% |
| $100,000 to $149,999 | 389 | 15.8% |
| $150,000 to $199,999 | 160 | 6.5% |
| $200,000+ | 168 | 6.8% |
Household Income by Householder Age in Oberlin
The median household income in Oberlin is $67,660, with the highest median household income of $72,895 found in the 25 to 44 years age bracket for the primary householder. A total of 448 households (18.2%) fall into this category. Meanwhile, the 15 to 24 years age bracket for the primary householder has the lowest median household income of $22,798, with 225 households (9.1%) in this group.
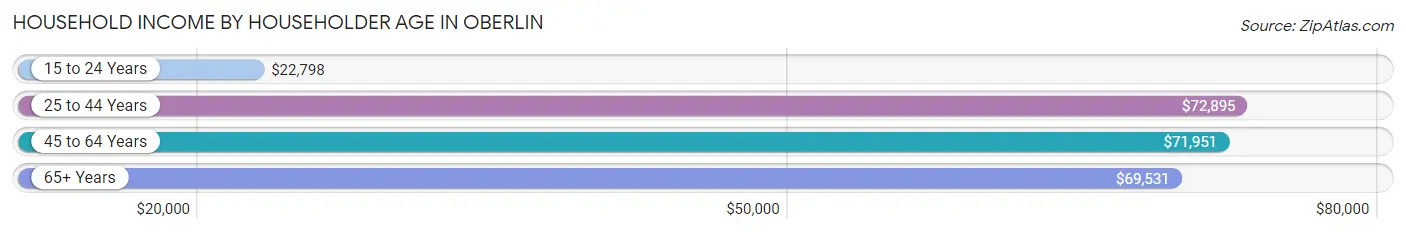
| Income Bracket | # Households | Median Income |
| 15 to 24 Years | 225 (9.1%) | $22,798 |
| 25 to 44 Years | 448 (18.2%) | $72,895 |
| 45 to 64 Years | 766 (31.1%) | $71,951 |
| 65+ Years | 1,025 (41.6%) | $69,531 |
| Total | 2,464 (100.0%) | $67,660 |
Poverty in Oberlin
Income Below Poverty by Sex and Age in Oberlin
With 19.6% poverty level for males and 23.3% for females among the residents of Oberlin, 16 and 17 year old males and 18 to 24 year old females are the most vulnerable to poverty, with 16 males (66.7%) and 387 females (77.7%) in their respective age groups living below the poverty level.
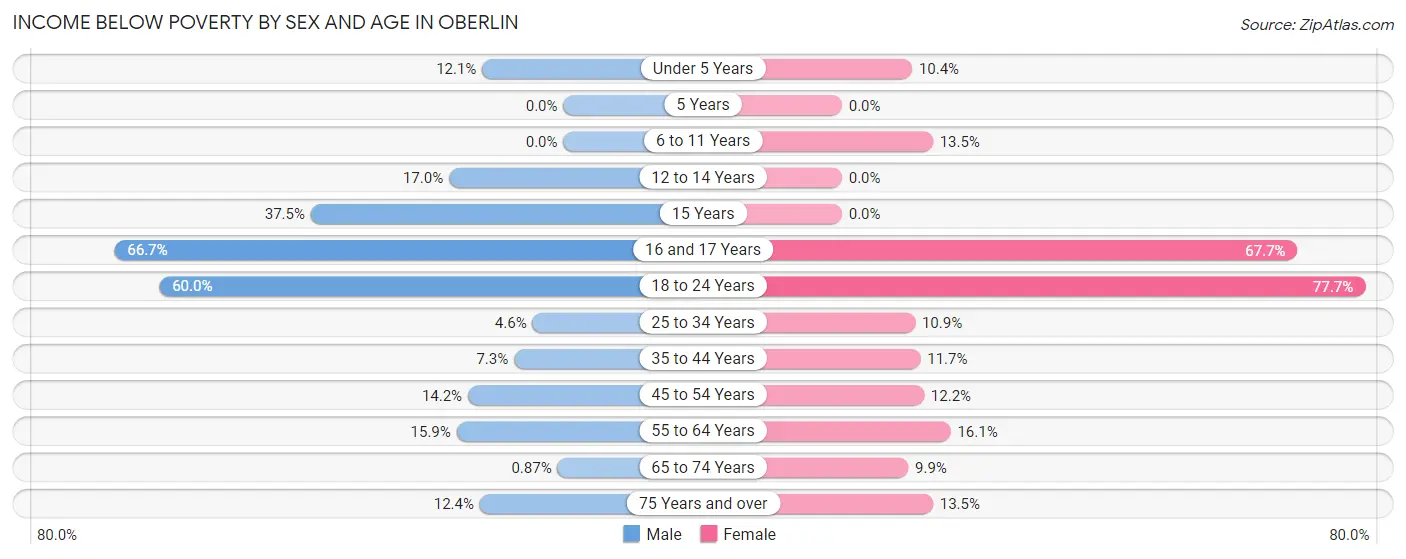
| Age Bracket | Male | Female |
| Under 5 Years | 10 (12.0%) | 5 (10.4%) |
| 5 Years | 0 (0.0%) | 0 (0.0%) |
| 6 to 11 Years | 0 (0.0%) | 22 (13.5%) |
| 12 to 14 Years | 9 (17.0%) | 0 (0.0%) |
| 15 Years | 15 (37.5%) | 0 (0.0%) |
| 16 and 17 Years | 16 (66.7%) | 23 (67.6%) |
| 18 to 24 Years | 288 (60.0%) | 387 (77.7%) |
| 25 to 34 Years | 14 (4.6%) | 20 (10.9%) |
| 35 to 44 Years | 24 (7.3%) | 33 (11.7%) |
| 45 to 54 Years | 35 (14.2%) | 39 (12.2%) |
| 55 to 64 Years | 52 (15.9%) | 71 (16.1%) |
| 65 to 74 Years | 2 (0.9%) | 40 (9.9%) |
| 75 Years and over | 36 (12.4%) | 70 (13.5%) |
| Total | 501 (19.6%) | 710 (23.3%) |
Income Above Poverty by Sex and Age in Oberlin
According to the poverty statistics in Oberlin, males aged 6 to 11 years and females aged 5 years are the age groups that are most secure financially, with 100.0% of males and 100.0% of females in these age groups living above the poverty line.
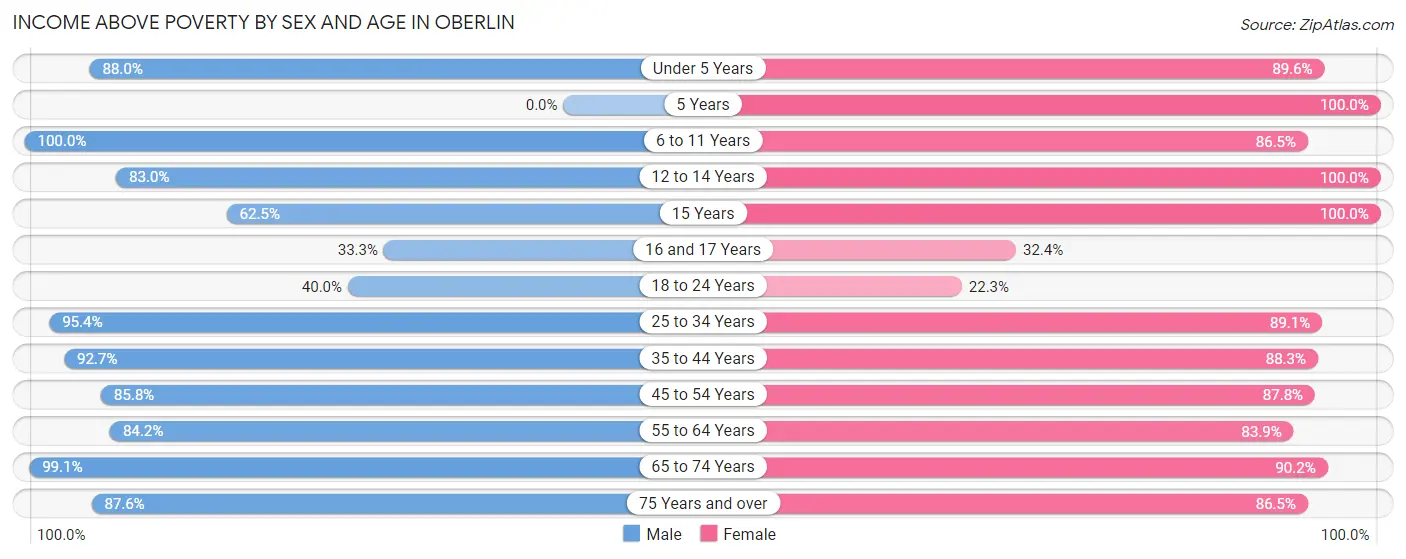
| Age Bracket | Male | Female |
| Under 5 Years | 73 (87.9%) | 43 (89.6%) |
| 5 Years | 0 (0.0%) | 58 (100.0%) |
| 6 to 11 Years | 150 (100.0%) | 141 (86.5%) |
| 12 to 14 Years | 44 (83.0%) | 83 (100.0%) |
| 15 Years | 25 (62.5%) | 14 (100.0%) |
| 16 and 17 Years | 8 (33.3%) | 11 (32.4%) |
| 18 to 24 Years | 192 (40.0%) | 111 (22.3%) |
| 25 to 34 Years | 292 (95.4%) | 164 (89.1%) |
| 35 to 44 Years | 304 (92.7%) | 250 (88.3%) |
| 45 to 54 Years | 212 (85.8%) | 281 (87.8%) |
| 55 to 64 Years | 276 (84.2%) | 369 (83.9%) |
| 65 to 74 Years | 228 (99.1%) | 366 (90.1%) |
| 75 Years and over | 254 (87.6%) | 448 (86.5%) |
| Total | 2,058 (80.4%) | 2,339 (76.7%) |
Income Below Poverty Among Married-Couple Families in Oberlin
The poverty statistics for married-couple families in Oberlin show that 1.2% or 12 of the total 1,004 families live below the poverty line. Families with no children have the highest poverty rate of 1.6%, comprising of 12 families. On the other hand, families with 1 or 2 children have the lowest poverty rate of 0.0%, which includes 0 families.
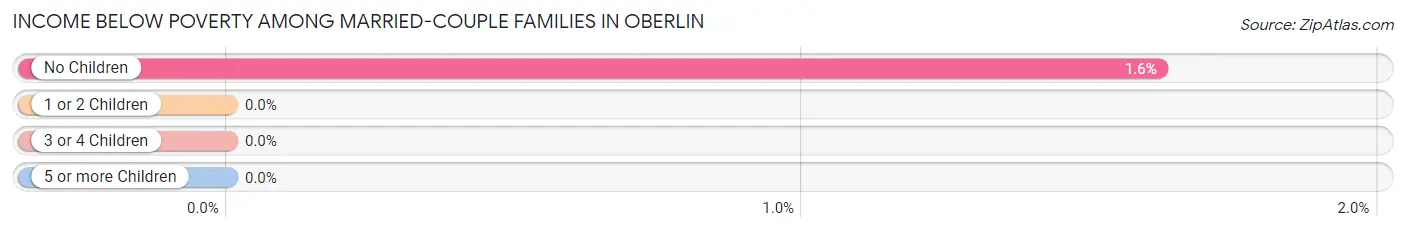
| Children | Above Poverty | Below Poverty |
| No Children | 727 (98.4%) | 12 (1.6%) |
| 1 or 2 Children | 249 (100.0%) | 0 (0.0%) |
| 3 or 4 Children | 15 (100.0%) | 0 (0.0%) |
| 5 or more Children | 1 (100.0%) | 0 (0.0%) |
| Total | 992 (98.8%) | 12 (1.2%) |
Income Below Poverty Among Single-Parent Households in Oberlin
According to the poverty data in Oberlin, 13.7% or 14 single-father households and 11.1% or 20 single-mother households are living below the poverty line. Among single-father households, those with 3 or 4 children have the highest poverty rate, with 6 households (100.0%) experiencing poverty. Likewise, among single-mother households, those with 3 or 4 children have the highest poverty rate, with 12 households (44.4%) falling below the poverty line.
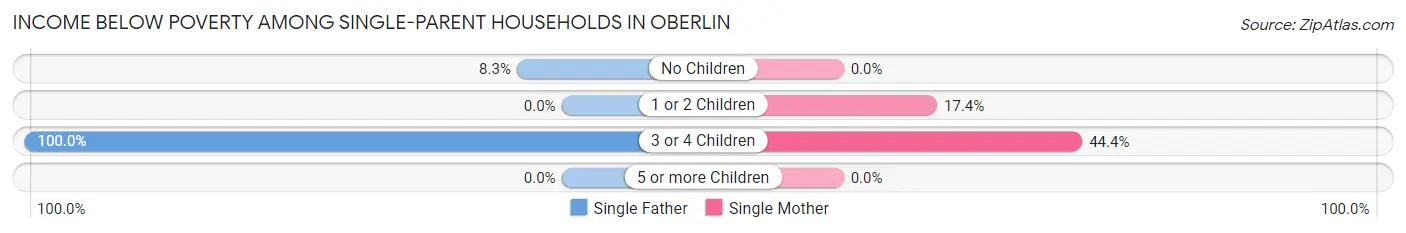
| Children | Single Father | Single Mother |
| No Children | 8 (8.3%) | 0 (0.0%) |
| 1 or 2 Children | 0 (0.0%) | 8 (17.4%) |
| 3 or 4 Children | 6 (100.0%) | 12 (44.4%) |
| 5 or more Children | 0 (0.0%) | 0 (0.0%) |
| Total | 14 (13.7%) | 20 (11.1%) |
Income Below Poverty Among Married-Couple vs Single-Parent Households in Oberlin
The poverty data for Oberlin shows that 12 of the married-couple family households (1.2%) and 34 of the single-parent households (12.1%) are living below the poverty level. Within the married-couple family households, those with no children have the highest poverty rate, with 12 households (1.6%) falling below the poverty line. Among the single-parent households, those with 3 or 4 children have the highest poverty rate, with 18 household (54.5%) living below poverty.
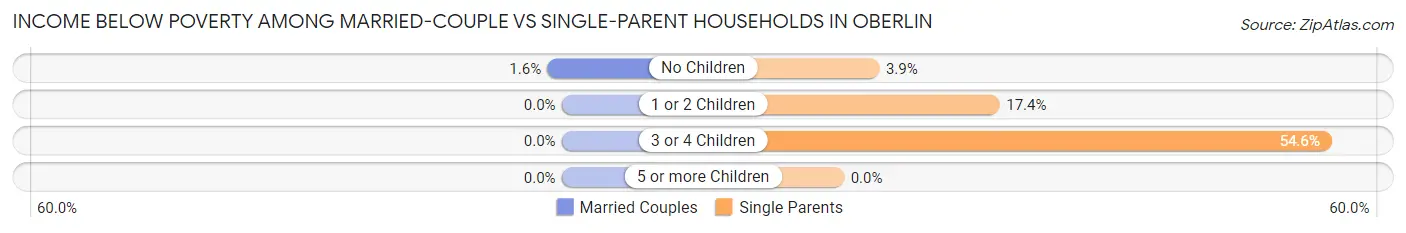
| Children | Married-Couple Families | Single-Parent Households |
| No Children | 12 (1.6%) | 8 (3.9%) |
| 1 or 2 Children | 0 (0.0%) | 8 (17.4%) |
| 3 or 4 Children | 0 (0.0%) | 18 (54.5%) |
| 5 or more Children | 0 (0.0%) | 0 (0.0%) |
| Total | 12 (1.2%) | 34 (12.1%) |
Race in Oberlin
The most populous races in Oberlin are White / Caucasian (5,947 | 72.6%), Black / African American (1,055 | 12.9%), and Two or more Races (843 | 10.3%).
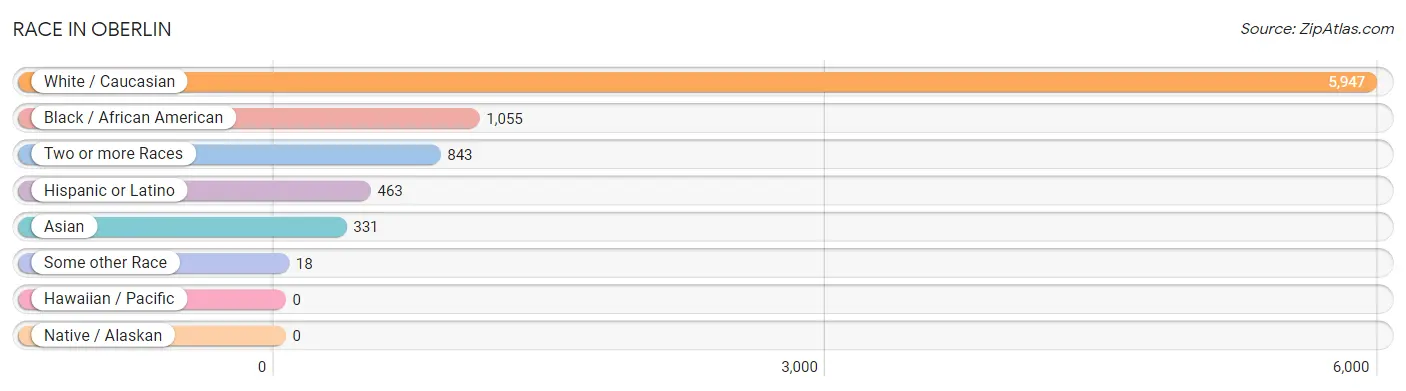
| Race | # Population | % Population |
| Asian | 331 | 4.0% |
| Black / African American | 1,055 | 12.9% |
| Hawaiian / Pacific | 0 | 0.0% |
| Hispanic or Latino | 463 | 5.7% |
| Native / Alaskan | 0 | 0.0% |
| White / Caucasian | 5,947 | 72.6% |
| Two or more Races | 843 | 10.3% |
| Some other Race | 18 | 0.2% |
| Total | 8,194 | 100.0% |
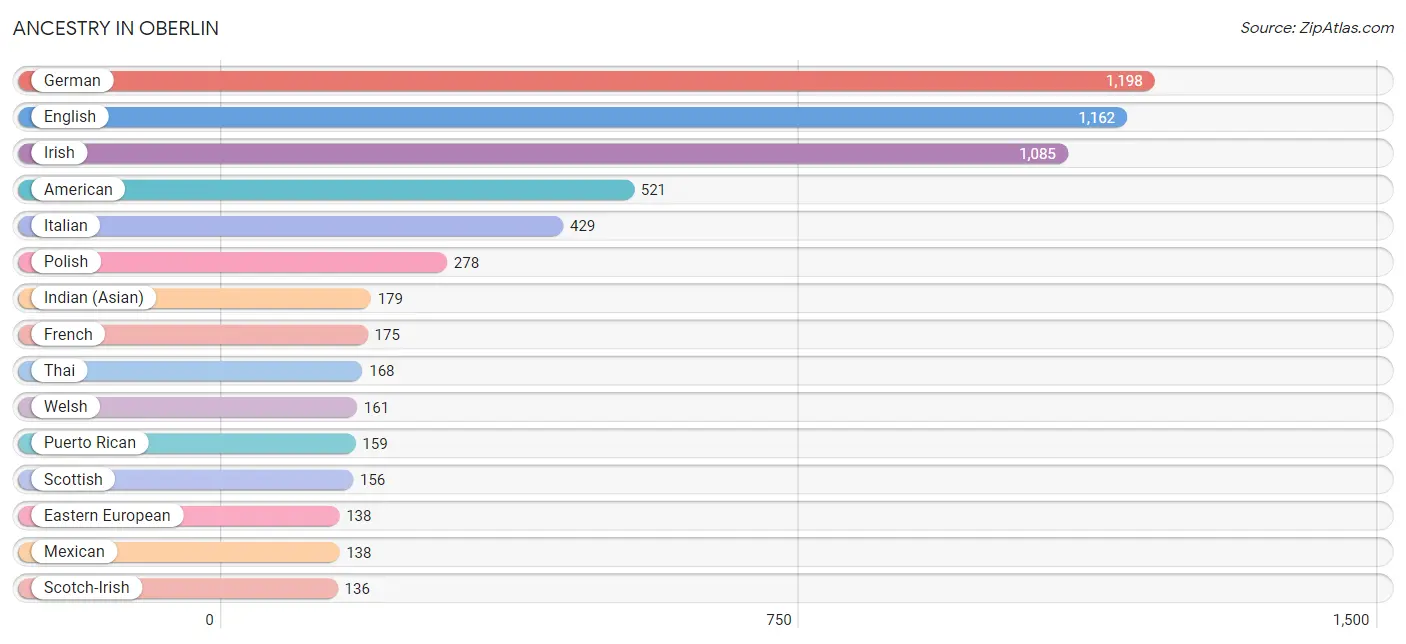
Ancestry in Oberlin
The most populous ancestries reported in Oberlin are German (1,198 | 14.6%), English (1,162 | 14.2%), Irish (1,085 | 13.2%), American (521 | 6.4%), and Italian (429 | 5.2%), together accounting for 53.6% of all Oberlin residents.
| Ancestry | # Population | % Population |
| Afghan | 6 | 0.1% |
| African | 66 | 0.8% |
| American | 521 | 6.4% |
| Arab | 20 | 0.2% |
| Australian | 39 | 0.5% |
| Austrian | 6 | 0.1% |
| Bhutanese | 54 | 0.7% |
| Brazilian | 12 | 0.2% |
| British | 66 | 0.8% |
| Bulgarian | 7 | 0.1% |
| Burmese | 17 | 0.2% |
| Central American | 58 | 0.7% |
| Cherokee | 6 | 0.1% |
| Chilean | 9 | 0.1% |
| Choctaw | 14 | 0.2% |
| Colombian | 25 | 0.3% |
| Croatian | 22 | 0.3% |
| Cuban | 7 | 0.1% |
| Czech | 81 | 1.0% |
| Czechoslovakian | 4 | 0.1% |
| Danish | 53 | 0.6% |
| Dutch | 22 | 0.3% |
| Eastern European | 138 | 1.7% |
| English | 1,162 | 14.2% |
| European | 118 | 1.4% |
| Filipino | 7 | 0.1% |
| French | 175 | 2.1% |
| French Canadian | 6 | 0.1% |
| German | 1,198 | 14.6% |
| Greek | 5 | 0.1% |
| Guyanese | 36 | 0.4% |
| Honduran | 52 | 0.6% |
| Hungarian | 28 | 0.3% |
| Indian (Asian) | 179 | 2.2% |
| Irish | 1,085 | 13.2% |
| Iroquois | 3 | 0.0% |
| Italian | 429 | 5.2% |
| Jordanian | 5 | 0.1% |
| Kenyan | 16 | 0.2% |
| Korean | 135 | 1.7% |
| Latvian | 6 | 0.1% |
| Lithuanian | 7 | 0.1% |
| Mexican | 138 | 1.7% |
| Mexican American Indian | 36 | 0.4% |
| Native Hawaiian | 6 | 0.1% |
| Nigerian | 25 | 0.3% |
| Northern European | 22 | 0.3% |
| Norwegian | 83 | 1.0% |
| Pennsylvania German | 13 | 0.2% |
| Peruvian | 5 | 0.1% |
| Polish | 278 | 3.4% |
| Portuguese | 10 | 0.1% |
| Pueblo | 6 | 0.1% |
| Puerto Rican | 159 | 1.9% |
| Romanian | 49 | 0.6% |
| Russian | 88 | 1.1% |
| Salvadoran | 6 | 0.1% |
| Scandinavian | 31 | 0.4% |
| Scotch-Irish | 136 | 1.7% |
| Scottish | 156 | 1.9% |
| Serbian | 13 | 0.2% |
| Slavic | 5 | 0.1% |
| Slovak | 14 | 0.2% |
| Slovene | 7 | 0.1% |
| South African | 7 | 0.1% |
| South American | 60 | 0.7% |
| Spaniard | 16 | 0.2% |
| Sri Lankan | 7 | 0.1% |
| Subsaharan African | 114 | 1.4% |
| Swedish | 112 | 1.4% |
| Swiss | 20 | 0.2% |
| Syrian | 7 | 0.1% |
| Thai | 168 | 2.1% |
| Turkish | 5 | 0.1% |
| Ukrainian | 84 | 1.0% |
| Uruguayan | 6 | 0.1% |
| Venezuelan | 15 | 0.2% |
| Welsh | 161 | 2.0% |
| Yugoslavian | 8 | 0.1% | View All 79 Rows |
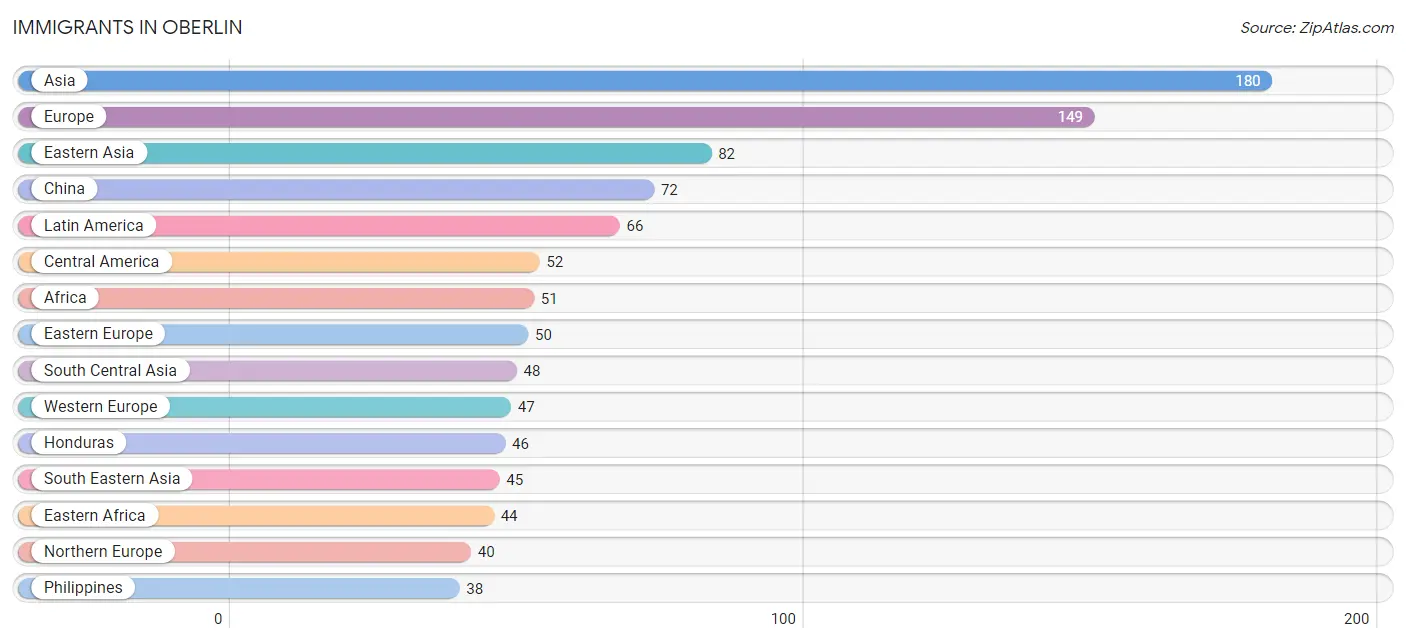
Immigrants in Oberlin
The most numerous immigrant groups reported in Oberlin came from Asia (180 | 2.2%), Europe (149 | 1.8%), Eastern Asia (82 | 1.0%), China (72 | 0.9%), and Latin America (66 | 0.8%), together accounting for 6.7% of all Oberlin residents.
| Immigration Origin | # Population | % Population |
| Afghanistan | 6 | 0.1% |
| Africa | 51 | 0.6% |
| Asia | 180 | 2.2% |
| Australia | 10 | 0.1% |
| Belgium | 5 | 0.1% |
| Canada | 21 | 0.3% |
| Caribbean | 14 | 0.2% |
| Central America | 52 | 0.6% |
| China | 72 | 0.9% |
| Eastern Africa | 44 | 0.5% |
| Eastern Asia | 82 | 1.0% |
| Eastern Europe | 50 | 0.6% |
| England | 15 | 0.2% |
| Europe | 149 | 1.8% |
| France | 7 | 0.1% |
| Germany | 35 | 0.4% |
| Honduras | 46 | 0.6% |
| India | 36 | 0.4% |
| Italy | 12 | 0.2% |
| Kenya | 16 | 0.2% |
| Korea | 10 | 0.1% |
| Latin America | 66 | 0.8% |
| Mexico | 6 | 0.1% |
| Nepal | 6 | 0.1% |
| Northern Europe | 40 | 0.5% |
| Oceania | 10 | 0.1% |
| Philippines | 38 | 0.5% |
| Romania | 16 | 0.2% |
| Russia | 16 | 0.2% |
| Scotland | 8 | 0.1% |
| South Africa | 7 | 0.1% |
| South Central Asia | 48 | 0.6% |
| South Eastern Asia | 45 | 0.5% |
| Southern Europe | 12 | 0.2% |
| Turkey | 5 | 0.1% |
| Vietnam | 7 | 0.1% |
| Western Asia | 5 | 0.1% |
| Western Europe | 47 | 0.6% | View All 38 Rows |
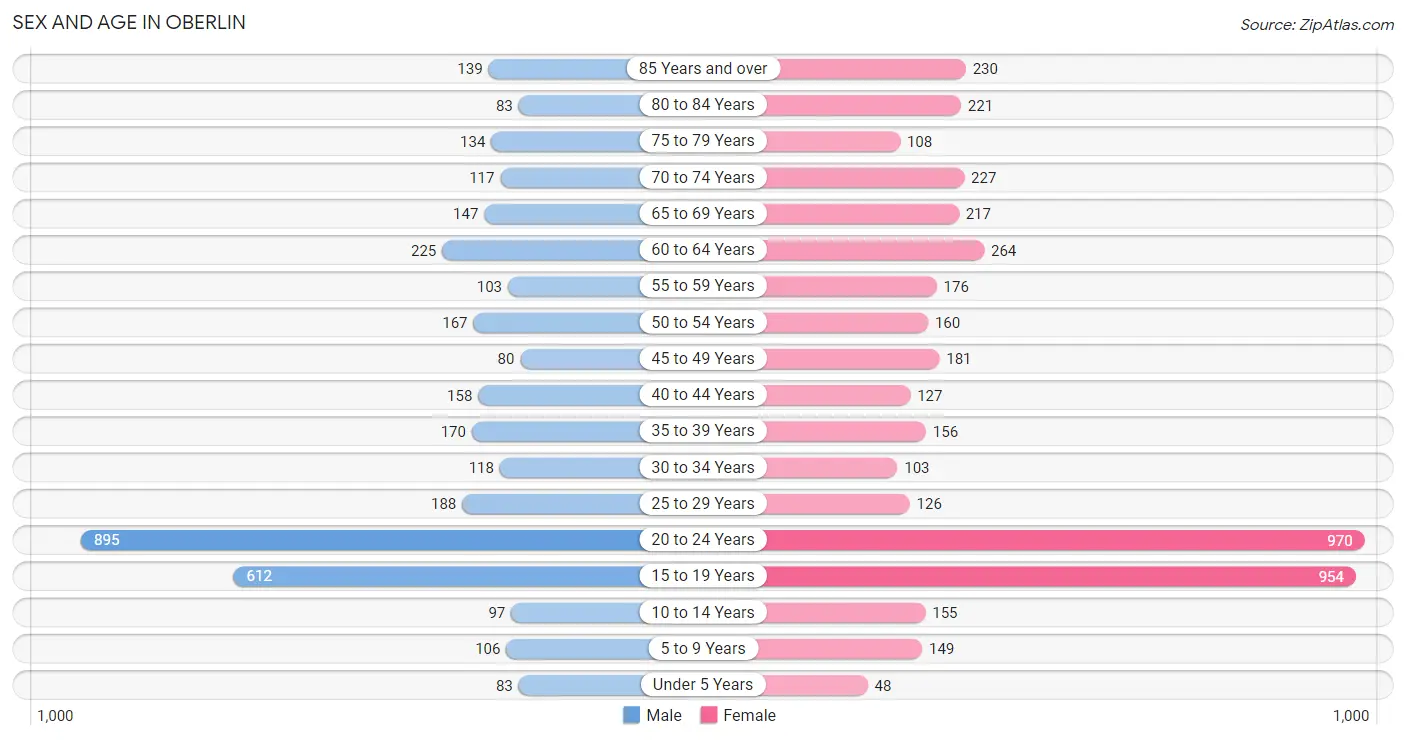
Sex and Age in Oberlin
Sex and Age in Oberlin
The most populous age groups in Oberlin are 20 to 24 Years (895 | 24.7%) for men and 20 to 24 Years (970 | 21.2%) for women.
| Age Bracket | Male | Female |
| Under 5 Years | 83 (2.3%) | 48 (1.1%) |
| 5 to 9 Years | 106 (2.9%) | 149 (3.3%) |
| 10 to 14 Years | 97 (2.7%) | 155 (3.4%) |
| 15 to 19 Years | 612 (16.9%) | 954 (20.9%) |
| 20 to 24 Years | 895 (24.7%) | 970 (21.2%) |
| 25 to 29 Years | 188 (5.2%) | 126 (2.8%) |
| 30 to 34 Years | 118 (3.3%) | 103 (2.2%) |
| 35 to 39 Years | 170 (4.7%) | 156 (3.4%) |
| 40 to 44 Years | 158 (4.4%) | 127 (2.8%) |
| 45 to 49 Years | 80 (2.2%) | 181 (4.0%) |
| 50 to 54 Years | 167 (4.6%) | 160 (3.5%) |
| 55 to 59 Years | 103 (2.8%) | 176 (3.8%) |
| 60 to 64 Years | 225 (6.2%) | 264 (5.8%) |
| 65 to 69 Years | 147 (4.1%) | 217 (4.8%) |
| 70 to 74 Years | 117 (3.2%) | 227 (5.0%) |
| 75 to 79 Years | 134 (3.7%) | 108 (2.4%) |
| 80 to 84 Years | 83 (2.3%) | 221 (4.8%) |
| 85 Years and over | 139 (3.8%) | 230 (5.0%) |
| Total | 3,622 (100.0%) | 4,572 (100.0%) |
Families and Households in Oberlin
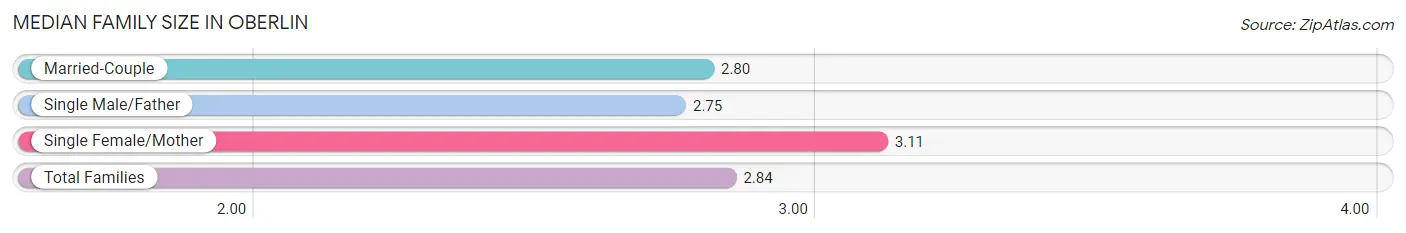
Median Family Size in Oberlin
The median family size in Oberlin is 2.84 persons per family, with single female/mother families (180 | 14.0%) accounting for the largest median family size of 3.11 persons per family. On the other hand, single male/father families (102 | 7.9%) represent the smallest median family size with 2.75 persons per family.
| Family Type | # Families | Family Size |
| Married-Couple | 1,004 (78.1%) | 2.80 |
| Single Male/Father | 102 (7.9%) | 2.75 |
| Single Female/Mother | 180 (14.0%) | 3.11 |
| Total Families | 1,286 (100.0%) | 2.84 |
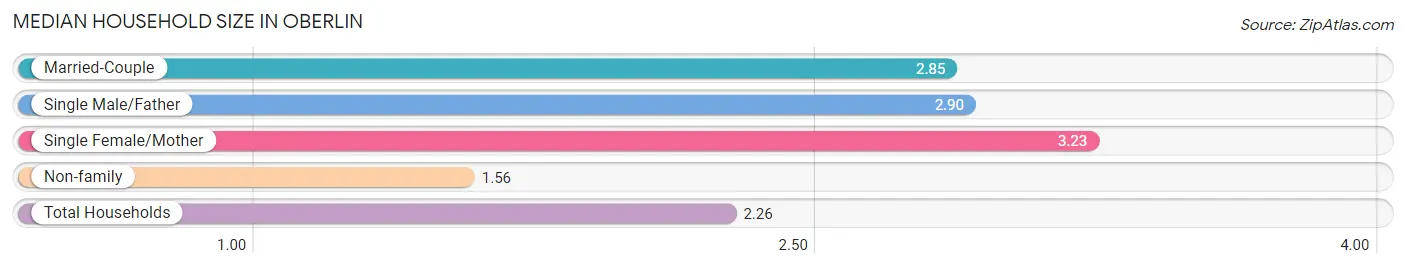
Median Household Size in Oberlin
The median household size in Oberlin is 2.26 persons per household, with single female/mother households (180 | 7.3%) accounting for the largest median household size of 3.23 persons per household. non-family households (1,178 | 47.8%) represent the smallest median household size with 1.56 persons per household.
| Household Type | # Households | Household Size |
| Married-Couple | 1,004 (40.7%) | 2.85 |
| Single Male/Father | 102 (4.1%) | 2.90 |
| Single Female/Mother | 180 (7.3%) | 3.23 |
| Non-family | 1,178 (47.8%) | 1.56 |
| Total Households | 2,464 (100.0%) | 2.26 |
Household Size by Marriage Status in Oberlin
Out of a total of 2,464 households in Oberlin, 1,286 (52.2%) are family households, while 1,178 (47.8%) are nonfamily households. The most numerous type of family households are 2-person households, comprising 836, and the most common type of nonfamily households are 1-person households, comprising 911.
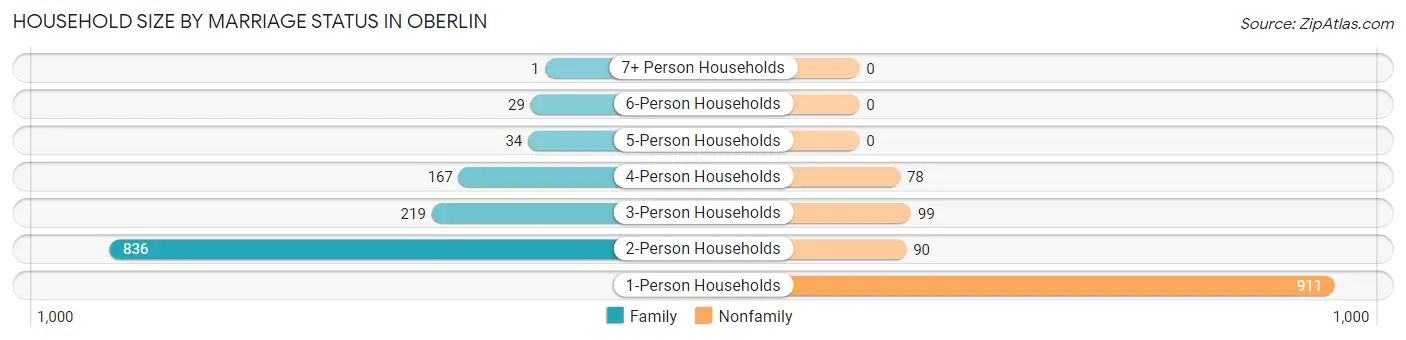
| Household Size | Family Households | Nonfamily Households |
| 1-Person Households | - | 911 (37.0%) |
| 2-Person Households | 836 (33.9%) | 90 (3.6%) |
| 3-Person Households | 219 (8.9%) | 99 (4.0%) |
| 4-Person Households | 167 (6.8%) | 78 (3.2%) |
| 5-Person Households | 34 (1.4%) | 0 (0.0%) |
| 6-Person Households | 29 (1.2%) | 0 (0.0%) |
| 7+ Person Households | 1 (0.0%) | 0 (0.0%) |
| Total | 1,286 (52.2%) | 1,178 (47.8%) |
Female Fertility in Oberlin
Fertility by Age in Oberlin
Average fertility rate in Oberlin is 24.0 births per 1,000 women. Women in the age bracket of 35 to 50 years have the highest fertility rate with 44.0 births per 1,000 women. Women in the age bracket of 20 to 34 years acount for 65.1% of all women with births.
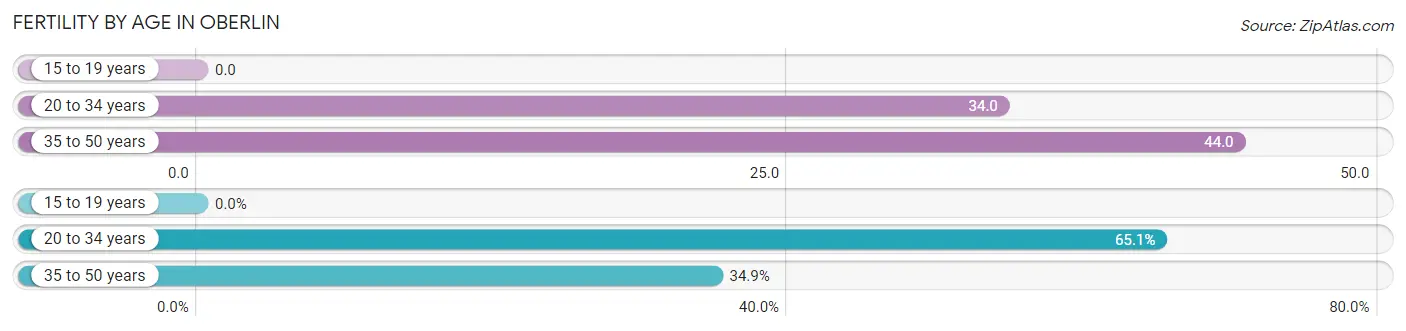
| Age Bracket | Women with Births | Births / 1,000 Women |
| 15 to 19 years | 0 (0.0%) | 0.0 |
| 20 to 34 years | 41 (65.1%) | 34.0 |
| 35 to 50 years | 22 (34.9%) | 44.0 |
| Total | 63 (100.0%) | 24.0 |
Fertility by Age by Marriage Status in Oberlin
19.0% of women with births (63) in Oberlin are married. The highest percentage of unmarried women with births falls into 20 to 34 years age bracket with 100.0% of them unmarried at the time of birth, while the lowest percentage of unmarried women with births belong to 35 to 50 years age bracket with 45.5% of them unmarried.
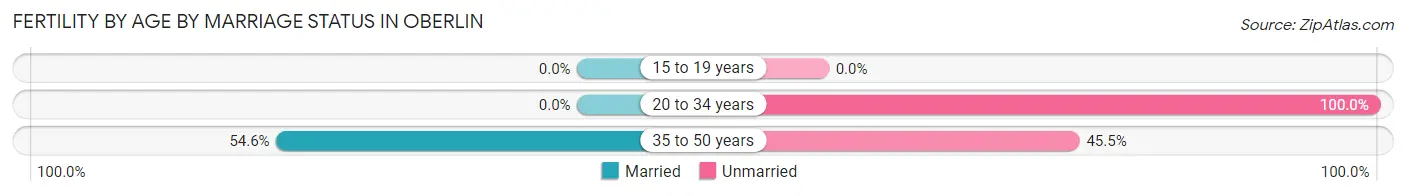
| Age Bracket | Married | Unmarried |
| 15 to 19 years | 0 (0.0%) | 0 (0.0%) |
| 20 to 34 years | 0 (0.0%) | 41 (100.0%) |
| 35 to 50 years | 12 (54.5%) | 10 (45.5%) |
| Total | 12 (19.1%) | 51 (80.9%) |
Fertility by Education in Oberlin
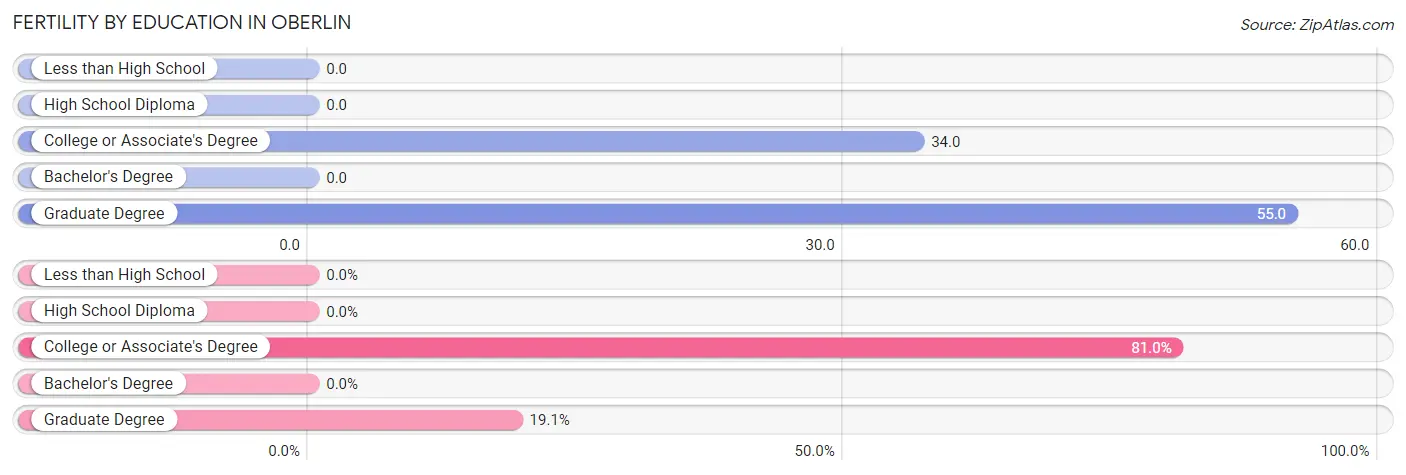
| Educational Attainment | Women with Births | Births / 1,000 Women |
| Less than High School | 0 (0.0%) | 0.0 |
| High School Diploma | 0 (0.0%) | 0.0 |
| College or Associate's Degree | 51 (80.9%) | 34.0 |
| Bachelor's Degree | 0 (0.0%) | 0.0 |
| Graduate Degree | 12 (19.1%) | 55.0 |
| Total | 63 (100.0%) | 24.0 |
Fertility by Education by Marriage Status in Oberlin
80.9% of women with births in Oberlin are unmarried. Women with the educational attainment of graduate degree are most likely to be married with 100.0% of them married at childbirth, while women with the educational attainment of college or associate's degree are least likely to be married with 100.0% of them unmarried at childbirth.
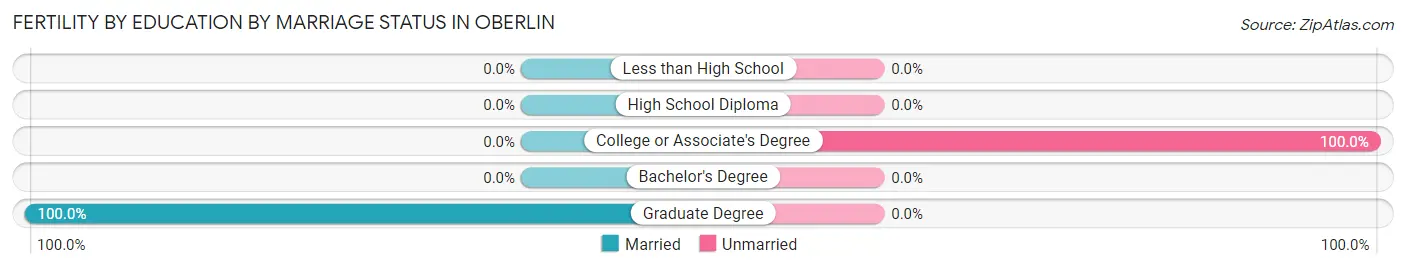
| Educational Attainment | Married | Unmarried |
| Less than High School | 0 (0.0%) | 0 (0.0%) |
| High School Diploma | 0 (0.0%) | 0 (0.0%) |
| College or Associate's Degree | 0 (0.0%) | 51 (100.0%) |
| Bachelor's Degree | 0 (0.0%) | 0 (0.0%) |
| Graduate Degree | 12 (100.0%) | 0 (0.0%) |
| Total | 12 (19.1%) | 51 (80.9%) |
Employment Characteristics in Oberlin
Employment by Class of Employer in Oberlin
Among the 3,719 employed individuals in Oberlin, private company employees (2,237 | 60.2%), not-for-profit organizations (749 | 20.1%), and state government employees (279 | 7.5%) make up the most common classes of employment.
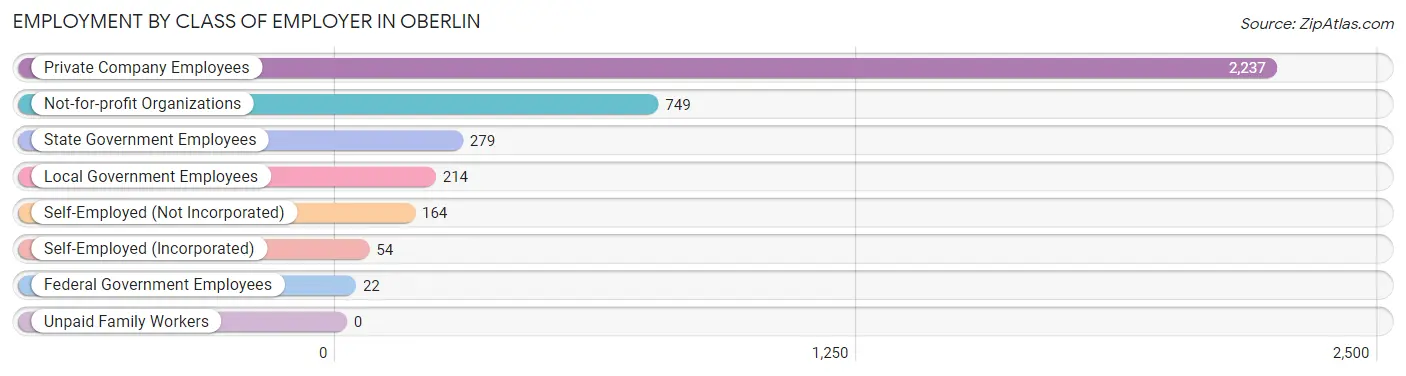
| Employer Class | # Employees | % Employees |
| Private Company Employees | 2,237 | 60.2% |
| Self-Employed (Incorporated) | 54 | 1.5% |
| Self-Employed (Not Incorporated) | 164 | 4.4% |
| Not-for-profit Organizations | 749 | 20.1% |
| Local Government Employees | 214 | 5.8% |
| State Government Employees | 279 | 7.5% |
| Federal Government Employees | 22 | 0.6% |
| Unpaid Family Workers | 0 | 0.0% |
| Total | 3,719 | 100.0% |
Employment Status by Age in Oberlin
According to the labor force statistics for Oberlin, out of the total population over 16 years of age (7,502), 54.8% or 4,111 individuals are in the labor force, with 4.6% or 189 of them unemployed. The age group with the highest labor force participation rate is 30 to 34 years, with 95.0% or 210 individuals in the labor force. Within the labor force, the 16 to 19 years age range has the highest percentage of unemployed individuals, with 14.9% or 78 of them being unemployed.
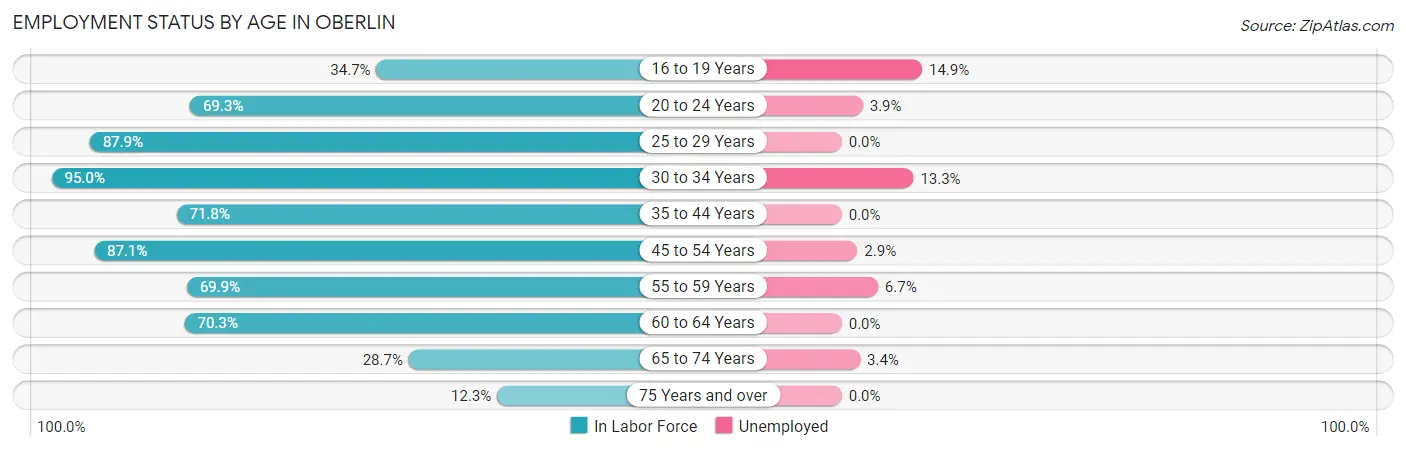
| Age Bracket | In Labor Force | Unemployed |
| 16 to 19 Years | 525 (34.7%) | 78 (14.9%) |
| 20 to 24 Years | 1,292 (69.3%) | 50 (3.9%) |
| 25 to 29 Years | 276 (87.9%) | 0 (0.0%) |
| 30 to 34 Years | 210 (95.0%) | 28 (13.3%) |
| 35 to 44 Years | 439 (71.8%) | 0 (0.0%) |
| 45 to 54 Years | 512 (87.1%) | 15 (2.9%) |
| 55 to 59 Years | 195 (69.9%) | 13 (6.7%) |
| 60 to 64 Years | 344 (70.3%) | 0 (0.0%) |
| 65 to 74 Years | 203 (28.7%) | 7 (3.4%) |
| 75 Years and over | 113 (12.3%) | 0 (0.0%) |
| Total | 4,111 (54.8%) | 189 (4.6%) |
Employment Status by Educational Attainment in Oberlin
According to labor force statistics for Oberlin, 79.0% of individuals (1,977) out of the total population between 25 and 64 years of age (2,502) are in the labor force, with 2.8% or 55 of them being unemployed. The group with the highest labor force participation rate are those with the educational attainment of bachelor's degree or higher, with 90.7% or 1,075 individuals in the labor force. Within the labor force, individuals with college / associate degree education have the highest percentage of unemployment, with 6.3% or 31 of them being unemployed.
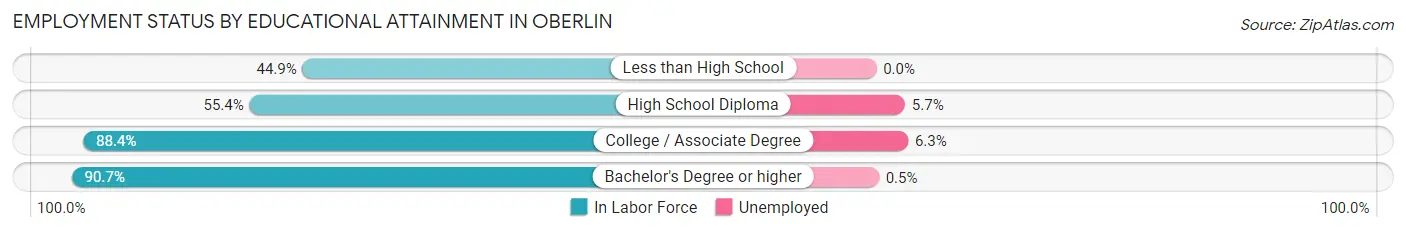
| Educational Attainment | In Labor Force | Unemployed |
| Less than High School | 57 (44.9%) | 0 (0.0%) |
| High School Diploma | 349 (55.4%) | 36 (5.7%) |
| College / Associate Degree | 495 (88.4%) | 35 (6.3%) |
| Bachelor's Degree or higher | 1,075 (90.7%) | 6 (0.5%) |
| Total | 1,977 (79.0%) | 70 (2.8%) |
Employment Occupations by Sex in Oberlin
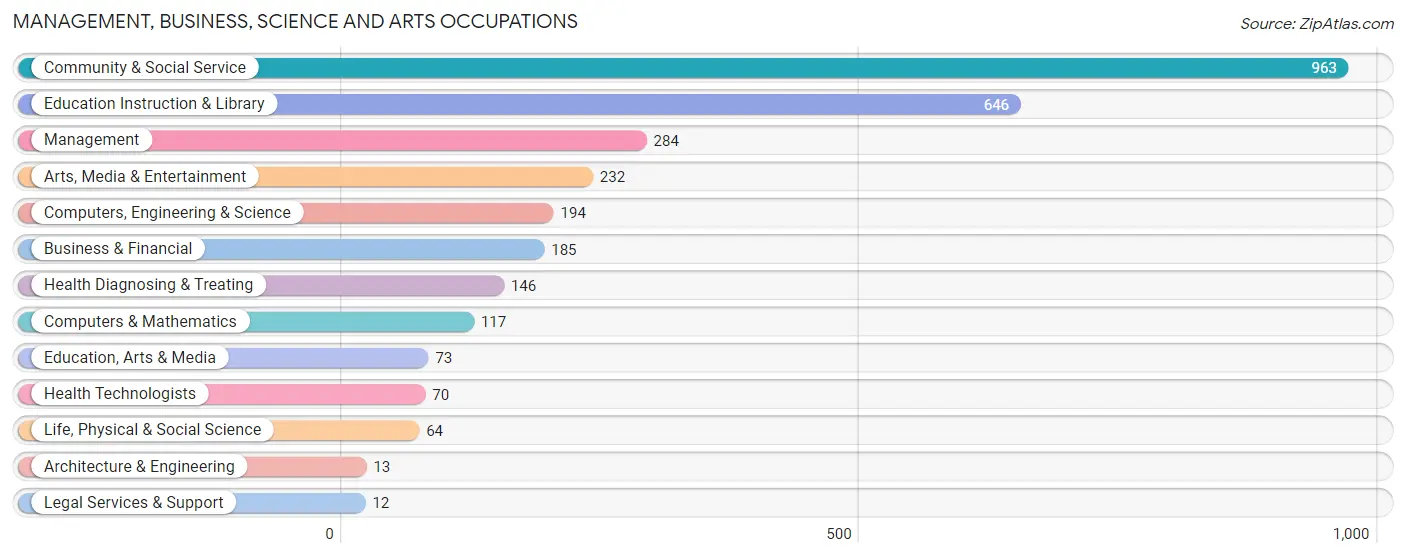
Management, Business, Science and Arts Occupations
The most common Management, Business, Science and Arts occupations in Oberlin are Community & Social Service (963 | 24.6%), Education Instruction & Library (646 | 16.5%), Management (284 | 7.2%), Arts, Media & Entertainment (232 | 5.9%), and Computers, Engineering & Science (194 | 5.0%).
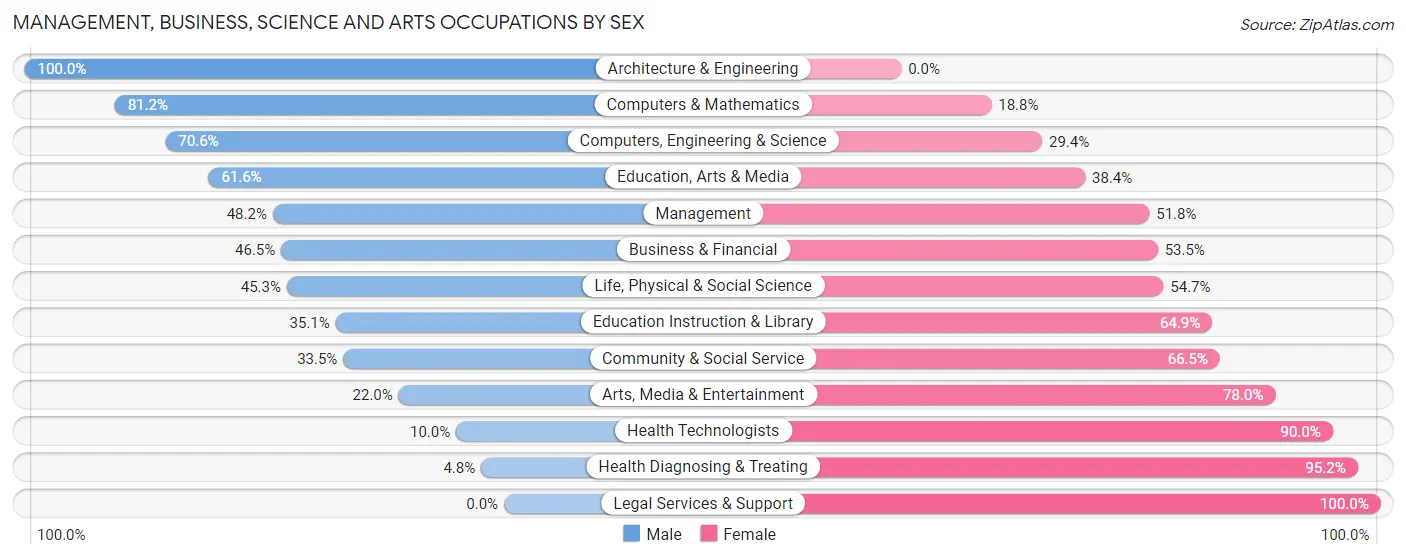
Management, Business, Science and Arts Occupations by Sex
Within the Management, Business, Science and Arts occupations in Oberlin, the most male-oriented occupations are Architecture & Engineering (100.0%), Computers & Mathematics (81.2%), and Computers, Engineering & Science (70.6%), while the most female-oriented occupations are Legal Services & Support (100.0%), Health Diagnosing & Treating (95.2%), and Health Technologists (90.0%).
| Occupation | Male | Female |
| Management | 137 (48.2%) | 147 (51.8%) |
| Business & Financial | 86 (46.5%) | 99 (53.5%) |
| Computers, Engineering & Science | 137 (70.6%) | 57 (29.4%) |
| Computers & Mathematics | 95 (81.2%) | 22 (18.8%) |
| Architecture & Engineering | 13 (100.0%) | 0 (0.0%) |
| Life, Physical & Social Science | 29 (45.3%) | 35 (54.7%) |
| Community & Social Service | 323 (33.5%) | 640 (66.5%) |
| Education, Arts & Media | 45 (61.6%) | 28 (38.4%) |
| Legal Services & Support | 0 (0.0%) | 12 (100.0%) |
| Education Instruction & Library | 227 (35.1%) | 419 (64.9%) |
| Arts, Media & Entertainment | 51 (22.0%) | 181 (78.0%) |
| Health Diagnosing & Treating | 7 (4.8%) | 139 (95.2%) |
| Health Technologists | 7 (10.0%) | 63 (90.0%) |
| Total (Category) | 690 (38.9%) | 1,082 (61.1%) |
| Total (Overall) | 1,735 (44.3%) | 2,183 (55.7%) |
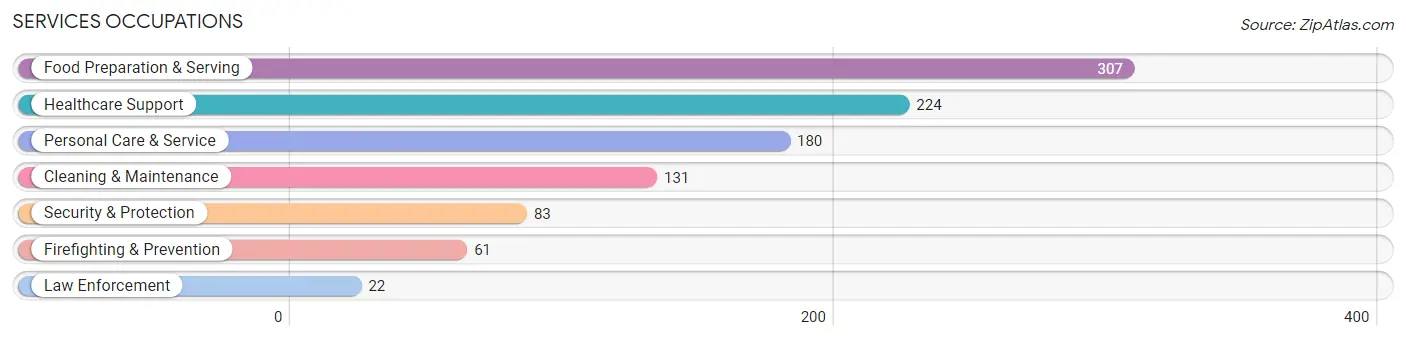
Services Occupations
The most common Services occupations in Oberlin are Food Preparation & Serving (307 | 7.8%), Healthcare Support (224 | 5.7%), Personal Care & Service (180 | 4.6%), Cleaning & Maintenance (131 | 3.3%), and Security & Protection (83 | 2.1%).
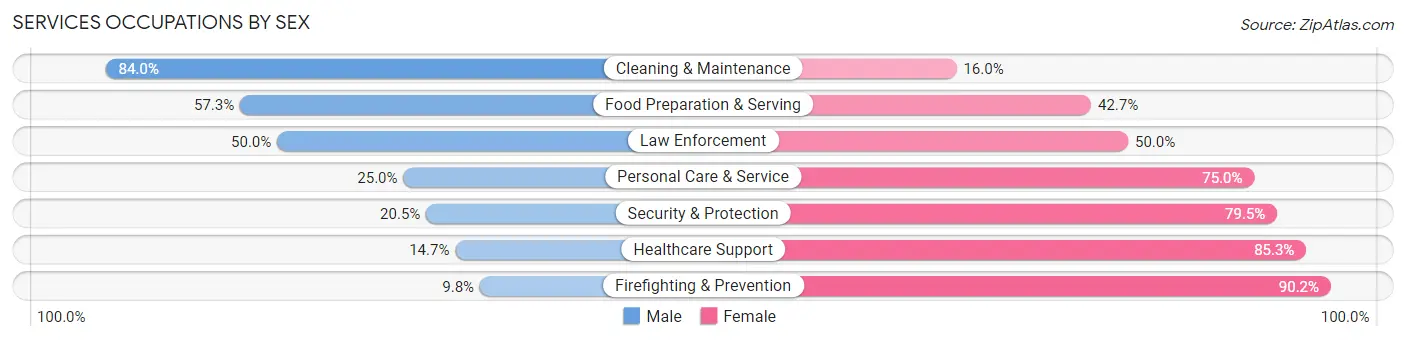
Services Occupations by Sex
Within the Services occupations in Oberlin, the most male-oriented occupations are Cleaning & Maintenance (84.0%), Food Preparation & Serving (57.3%), and Law Enforcement (50.0%), while the most female-oriented occupations are Firefighting & Prevention (90.2%), Healthcare Support (85.3%), and Security & Protection (79.5%).
| Occupation | Male | Female |
| Healthcare Support | 33 (14.7%) | 191 (85.3%) |
| Security & Protection | 17 (20.5%) | 66 (79.5%) |
| Firefighting & Prevention | 6 (9.8%) | 55 (90.2%) |
| Law Enforcement | 11 (50.0%) | 11 (50.0%) |
| Food Preparation & Serving | 176 (57.3%) | 131 (42.7%) |
| Cleaning & Maintenance | 110 (84.0%) | 21 (16.0%) |
| Personal Care & Service | 45 (25.0%) | 135 (75.0%) |
| Total (Category) | 381 (41.2%) | 544 (58.8%) |
| Total (Overall) | 1,735 (44.3%) | 2,183 (55.7%) |
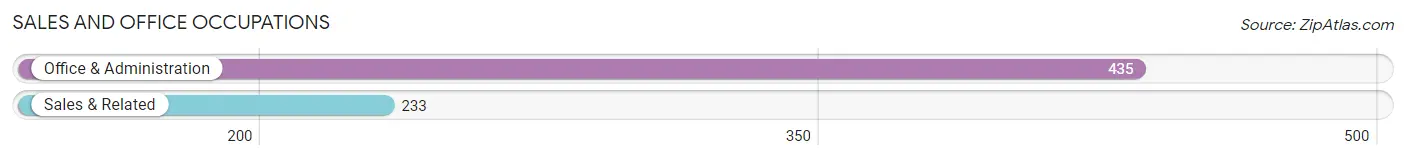
Sales and Office Occupations
The most common Sales and Office occupations in Oberlin are Office & Administration (435 | 11.1%), and Sales & Related (233 | 5.9%).
Sales and Office Occupations by Sex
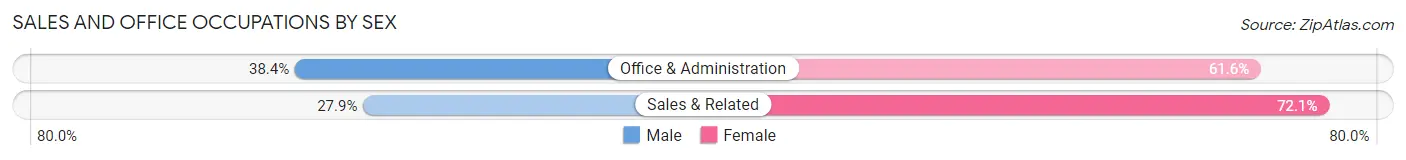
| Occupation | Male | Female |
| Sales & Related | 65 (27.9%) | 168 (72.1%) |
| Office & Administration | 167 (38.4%) | 268 (61.6%) |
| Total (Category) | 232 (34.7%) | 436 (65.3%) |
| Total (Overall) | 1,735 (44.3%) | 2,183 (55.7%) |
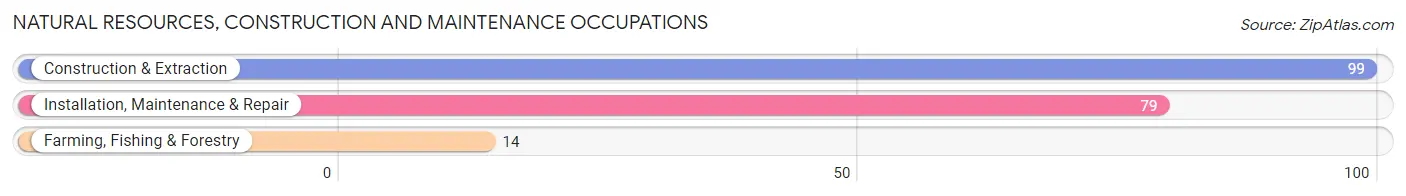
Natural Resources, Construction and Maintenance Occupations
The most common Natural Resources, Construction and Maintenance occupations in Oberlin are Construction & Extraction (99 | 2.5%), Installation, Maintenance & Repair (79 | 2.0%), and Farming, Fishing & Forestry (14 | 0.4%).
Natural Resources, Construction and Maintenance Occupations by Sex
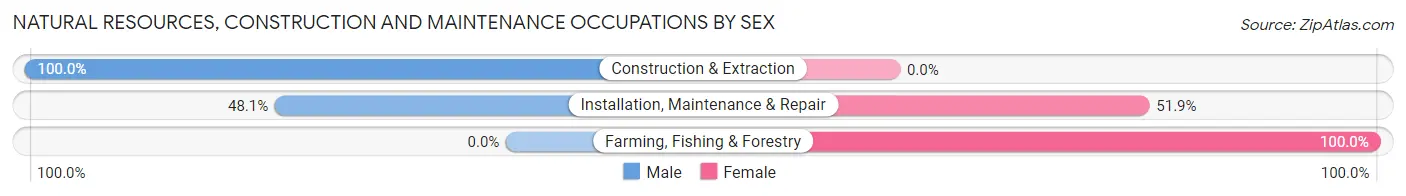
| Occupation | Male | Female |
| Farming, Fishing & Forestry | 0 (0.0%) | 14 (100.0%) |
| Construction & Extraction | 99 (100.0%) | 0 (0.0%) |
| Installation, Maintenance & Repair | 38 (48.1%) | 41 (51.9%) |
| Total (Category) | 137 (71.4%) | 55 (28.6%) |
| Total (Overall) | 1,735 (44.3%) | 2,183 (55.7%) |
Production, Transportation and Moving Occupations
The most common Production, Transportation and Moving occupations in Oberlin are Material Moving (168 | 4.3%), Production (117 | 3.0%), and Transportation (76 | 1.9%).
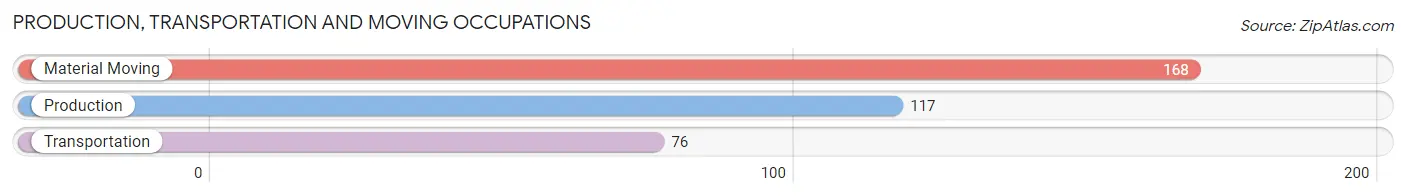
Production, Transportation and Moving Occupations by Sex
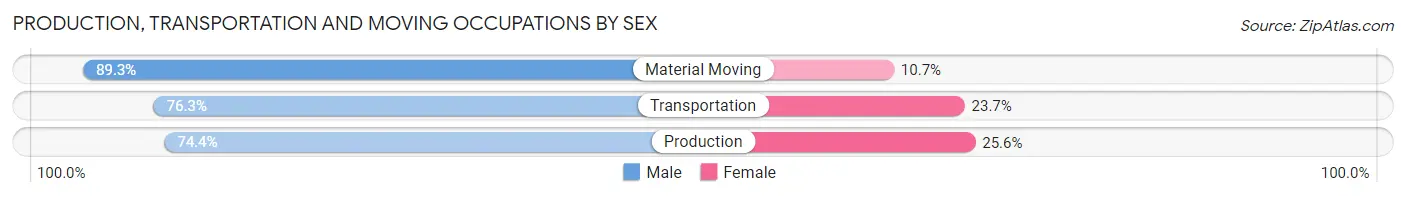
| Occupation | Male | Female |
| Production | 87 (74.4%) | 30 (25.6%) |
| Transportation | 58 (76.3%) | 18 (23.7%) |
| Material Moving | 150 (89.3%) | 18 (10.7%) |
| Total (Category) | 295 (81.7%) | 66 (18.3%) |
| Total (Overall) | 1,735 (44.3%) | 2,183 (55.7%) |
Employment Industries by Sex in Oberlin
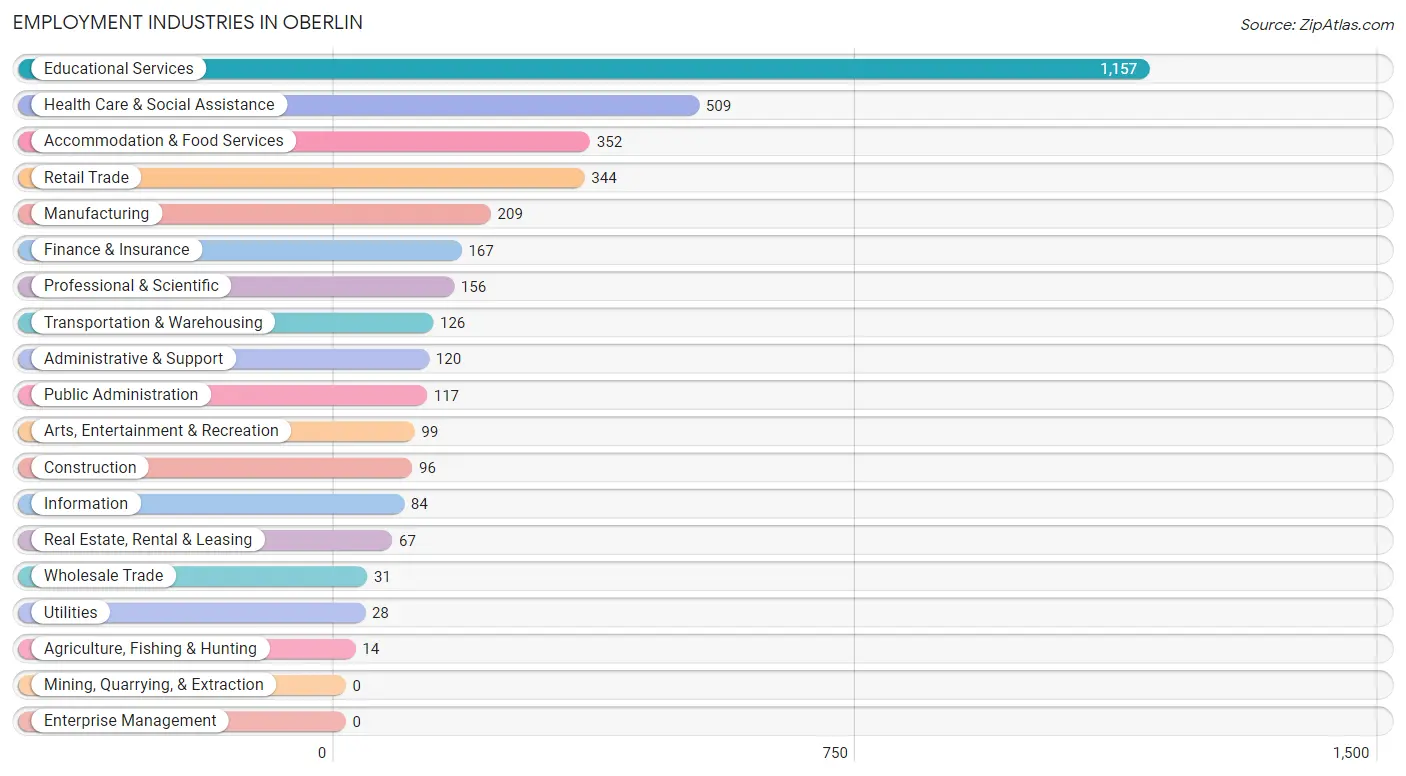
Employment Industries in Oberlin
The major employment industries in Oberlin include Educational Services (1,157 | 29.5%), Health Care & Social Assistance (509 | 13.0%), Accommodation & Food Services (352 | 9.0%), Retail Trade (344 | 8.8%), and Manufacturing (209 | 5.3%).
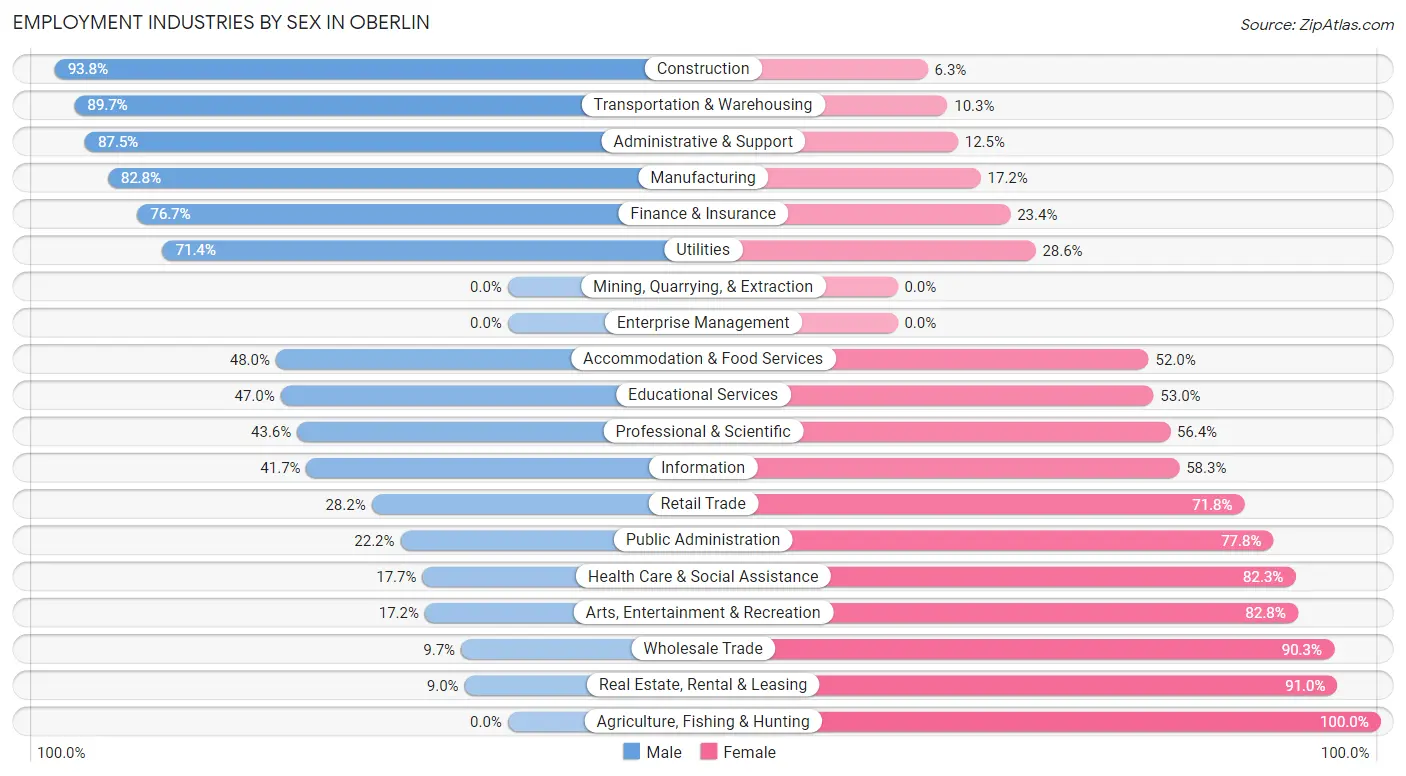
Employment Industries by Sex in Oberlin
The Oberlin industries that see more men than women are Construction (93.8%), Transportation & Warehousing (89.7%), and Administrative & Support (87.5%), whereas the industries that tend to have a higher number of women are Agriculture, Fishing & Hunting (100.0%), Real Estate, Rental & Leasing (91.0%), and Wholesale Trade (90.3%).
| Industry | Male | Female |
| Agriculture, Fishing & Hunting | 0 (0.0%) | 14 (100.0%) |
| Mining, Quarrying, & Extraction | 0 (0.0%) | 0 (0.0%) |
| Construction | 90 (93.8%) | 6 (6.2%) |
| Manufacturing | 173 (82.8%) | 36 (17.2%) |
| Wholesale Trade | 3 (9.7%) | 28 (90.3%) |
| Retail Trade | 97 (28.2%) | 247 (71.8%) |
| Transportation & Warehousing | 113 (89.7%) | 13 (10.3%) |
| Utilities | 20 (71.4%) | 8 (28.6%) |
| Information | 35 (41.7%) | 49 (58.3%) |
| Finance & Insurance | 128 (76.6%) | 39 (23.4%) |
| Real Estate, Rental & Leasing | 6 (9.0%) | 61 (91.0%) |
| Professional & Scientific | 68 (43.6%) | 88 (56.4%) |
| Enterprise Management | 0 (0.0%) | 0 (0.0%) |
| Administrative & Support | 105 (87.5%) | 15 (12.5%) |
| Educational Services | 544 (47.0%) | 613 (53.0%) |
| Health Care & Social Assistance | 90 (17.7%) | 419 (82.3%) |
| Arts, Entertainment & Recreation | 17 (17.2%) | 82 (82.8%) |
| Accommodation & Food Services | 169 (48.0%) | 183 (52.0%) |
| Public Administration | 26 (22.2%) | 91 (77.8%) |
| Total | 1,735 (44.3%) | 2,183 (55.7%) |
Education in Oberlin
School Enrollment in Oberlin
The most common levels of schooling among the 3,932 students in Oberlin are college / undergraduate (3,139 | 79.8%), elementary school (207 | 5.3%), and middle school (188 | 4.8%).
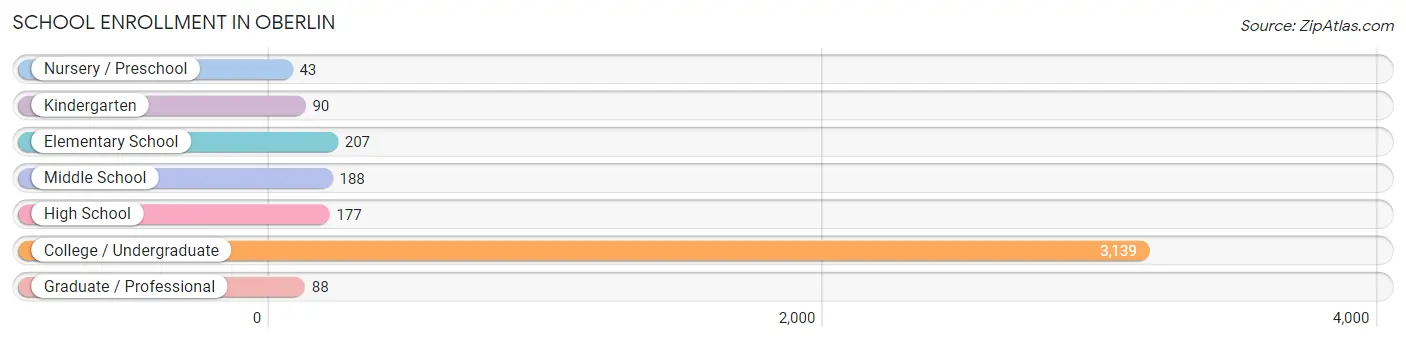
| School Level | # Students | % Students |
| Nursery / Preschool | 43 | 1.1% |
| Kindergarten | 90 | 2.3% |
| Elementary School | 207 | 5.3% |
| Middle School | 188 | 4.8% |
| High School | 177 | 4.5% |
| College / Undergraduate | 3,139 | 79.8% |
| Graduate / Professional | 88 | 2.2% |
| Total | 3,932 | 100.0% |
School Enrollment by Age by Funding Source in Oberlin
Out of a total of 3,932 students who are enrolled in schools in Oberlin, 2,375 (60.4%) attend a private institution, while the remaining 1,557 (39.6%) are enrolled in public schools. The age group of 35 years and over has the highest likelihood of being enrolled in private schools, with 44 (100.0% in the age bracket) enrolled. Conversely, the age group of 5 to 9 year old has the lowest likelihood of being enrolled in a private school, with 215 (84.3% in the age bracket) attending a public institution.
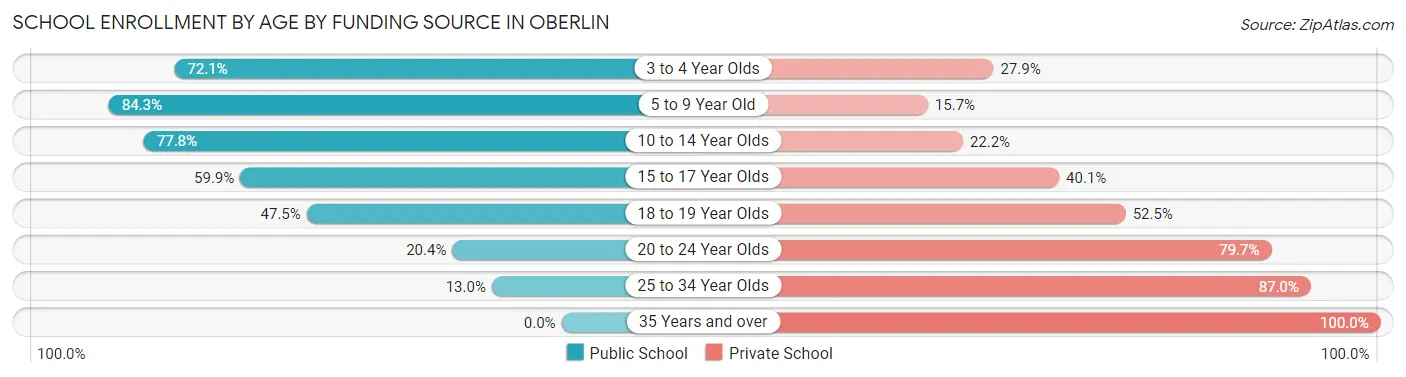
| Age Bracket | Public School | Private School |
| 3 to 4 Year Olds | 31 (72.1%) | 12 (27.9%) |
| 5 to 9 Year Old | 215 (84.3%) | 40 (15.7%) |
| 10 to 14 Year Olds | 196 (77.8%) | 56 (22.2%) |
| 15 to 17 Year Olds | 85 (59.9%) | 57 (40.1%) |
| 18 to 19 Year Olds | 676 (47.5%) | 748 (52.5%) |
| 20 to 24 Year Olds | 345 (20.3%) | 1,350 (79.6%) |
| 25 to 34 Year Olds | 10 (13.0%) | 67 (87.0%) |
| 35 Years and over | 0 (0.0%) | 44 (100.0%) |
| Total | 1,557 (39.6%) | 2,375 (60.4%) |
Educational Attainment by Field of Study in Oberlin
Business (333 | 13.6%), education (282 | 11.5%), literature & languages (278 | 11.4%), social sciences (252 | 10.3%), and visual & performing arts (241 | 9.9%) are the most common fields of study among 2,443 individuals in Oberlin who have obtained a bachelor's degree or higher.
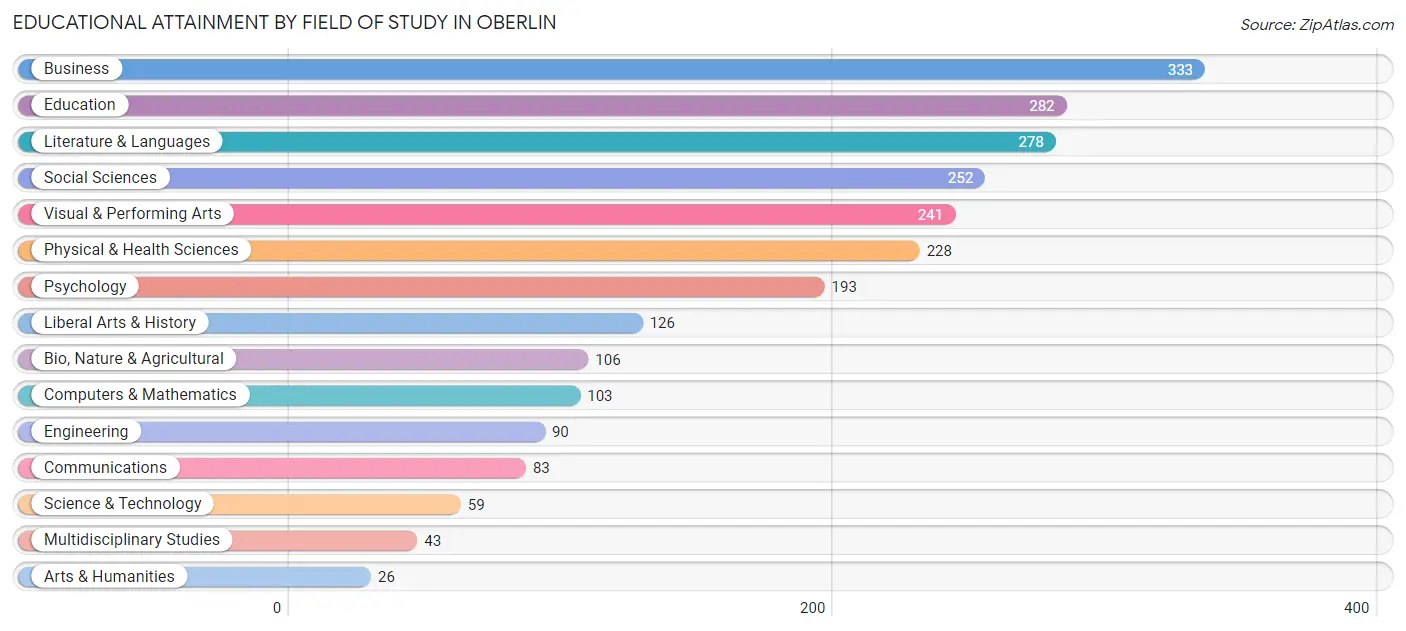
| Field of Study | # Graduates | % Graduates |
| Computers & Mathematics | 103 | 4.2% |
| Bio, Nature & Agricultural | 106 | 4.3% |
| Physical & Health Sciences | 228 | 9.3% |
| Psychology | 193 | 7.9% |
| Social Sciences | 252 | 10.3% |
| Engineering | 90 | 3.7% |
| Multidisciplinary Studies | 43 | 1.8% |
| Science & Technology | 59 | 2.4% |
| Business | 333 | 13.6% |
| Education | 282 | 11.5% |
| Literature & Languages | 278 | 11.4% |
| Liberal Arts & History | 126 | 5.2% |
| Visual & Performing Arts | 241 | 9.9% |
| Communications | 83 | 3.4% |
| Arts & Humanities | 26 | 1.1% |
| Total | 2,443 | 100.0% |
Transportation & Commute in Oberlin
Vehicle Availability by Sex in Oberlin
The most prevalent vehicle ownership categories in Oberlin are males with 2 vehicles (586, accounting for 48.0%) and females with 2 vehicles (517, making up 38.3%).
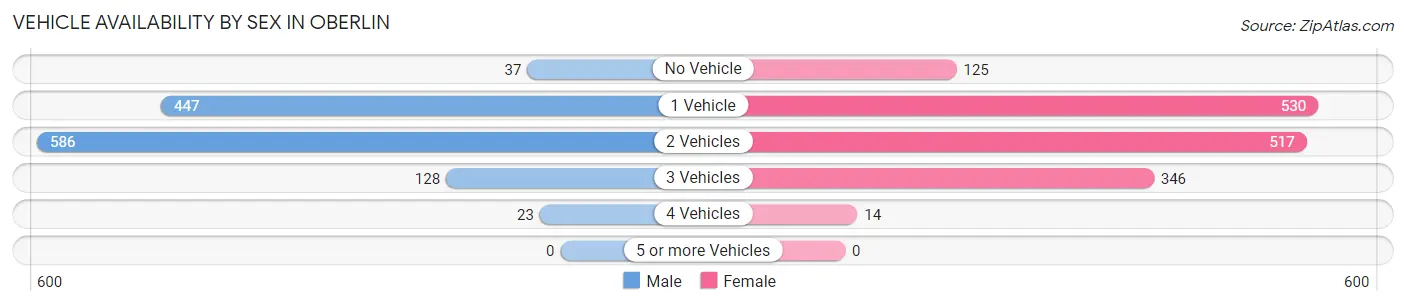
| Vehicles Available | Male | Female |
| No Vehicle | 37 (3.0%) | 125 (8.2%) |
| 1 Vehicle | 447 (36.6%) | 530 (34.6%) |
| 2 Vehicles | 586 (48.0%) | 517 (33.8%) |
| 3 Vehicles | 128 (10.5%) | 346 (22.6%) |
| 4 Vehicles | 23 (1.9%) | 14 (0.9%) |
| 5 or more Vehicles | 0 (0.0%) | 0 (0.0%) |
| Total | 1,221 (100.0%) | 1,532 (100.0%) |
Commute Time in Oberlin
The most frequently occuring commute durations in Oberlin are 5 to 9 minutes (727 commuters, 22.0%), less than 5 minutes (662 commuters, 20.0%), and 10 to 14 minutes (539 commuters, 16.3%).
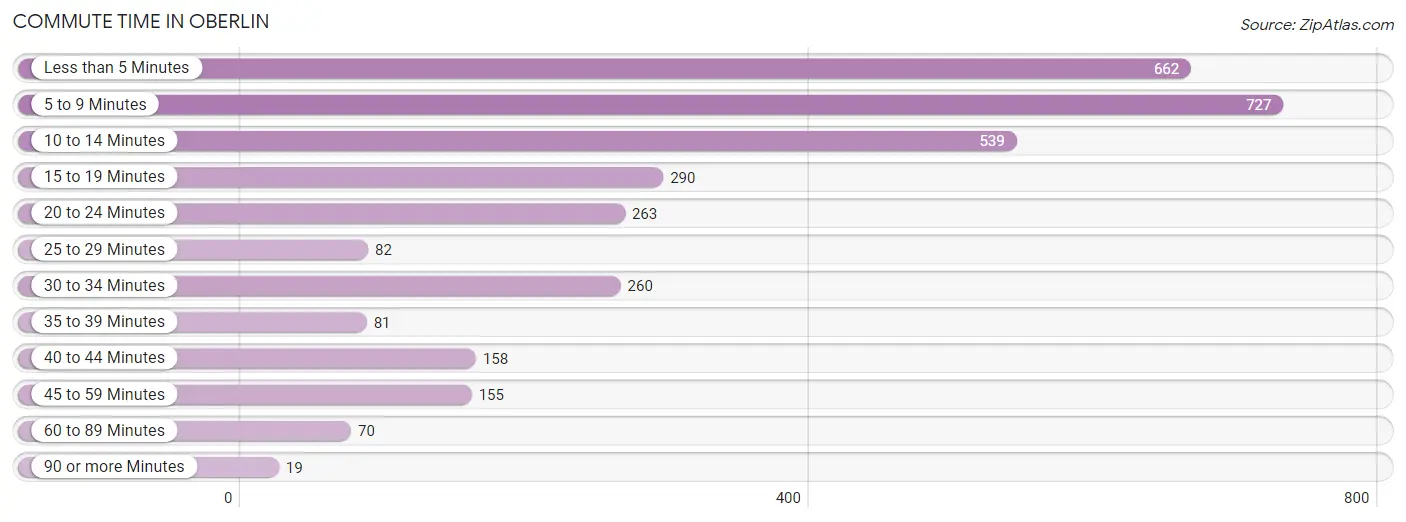
| Commute Time | # Commuters | % Commuters |
| Less than 5 Minutes | 662 | 20.0% |
| 5 to 9 Minutes | 727 | 22.0% |
| 10 to 14 Minutes | 539 | 16.3% |
| 15 to 19 Minutes | 290 | 8.8% |
| 20 to 24 Minutes | 263 | 8.0% |
| 25 to 29 Minutes | 82 | 2.5% |
| 30 to 34 Minutes | 260 | 7.9% |
| 35 to 39 Minutes | 81 | 2.5% |
| 40 to 44 Minutes | 158 | 4.8% |
| 45 to 59 Minutes | 155 | 4.7% |
| 60 to 89 Minutes | 70 | 2.1% |
| 90 or more Minutes | 19 | 0.6% |
Commute Time by Sex in Oberlin
The most common commute times in Oberlin are 5 to 9 minutes (330 commuters, 23.6%) for males and less than 5 minutes (471 commuters, 24.7%) for females.
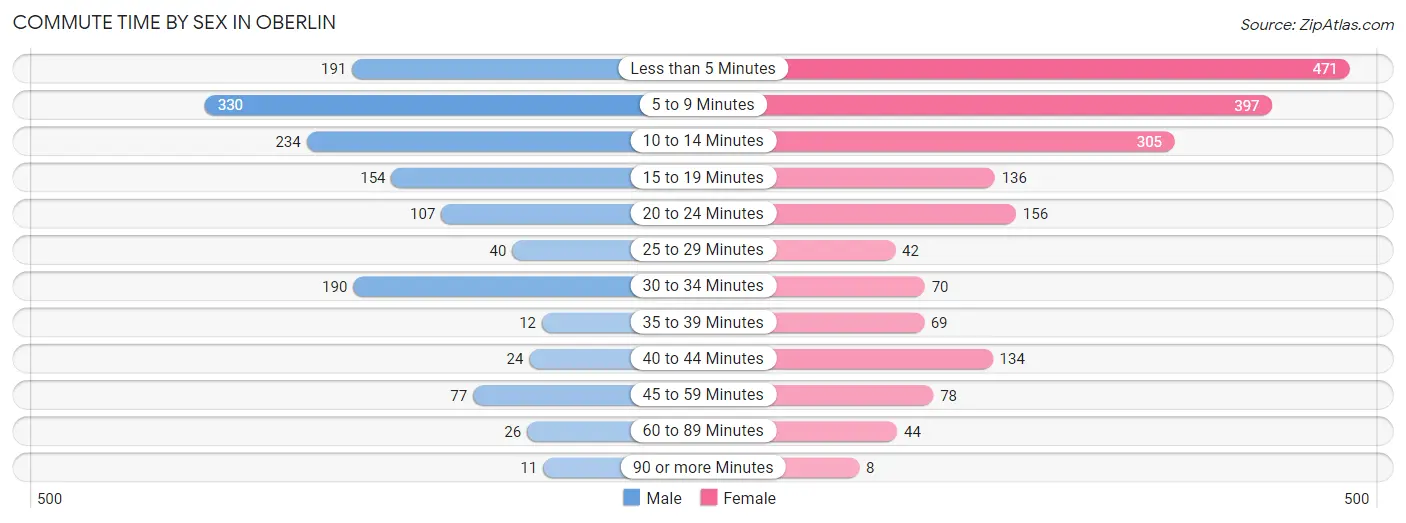
| Commute Time | Male | Female |
| Less than 5 Minutes | 191 (13.7%) | 471 (24.7%) |
| 5 to 9 Minutes | 330 (23.6%) | 397 (20.8%) |
| 10 to 14 Minutes | 234 (16.8%) | 305 (16.0%) |
| 15 to 19 Minutes | 154 (11.0%) | 136 (7.1%) |
| 20 to 24 Minutes | 107 (7.7%) | 156 (8.2%) |
| 25 to 29 Minutes | 40 (2.9%) | 42 (2.2%) |
| 30 to 34 Minutes | 190 (13.6%) | 70 (3.7%) |
| 35 to 39 Minutes | 12 (0.9%) | 69 (3.6%) |
| 40 to 44 Minutes | 24 (1.7%) | 134 (7.0%) |
| 45 to 59 Minutes | 77 (5.5%) | 78 (4.1%) |
| 60 to 89 Minutes | 26 (1.9%) | 44 (2.3%) |
| 90 or more Minutes | 11 (0.8%) | 8 (0.4%) |
Time of Departure to Work by Sex in Oberlin
The most frequent times of departure to work in Oberlin are 4:00 PM to 11:59 PM (225, 16.1%) for males and 12:00 PM to 3:59 PM (364, 19.1%) for females.
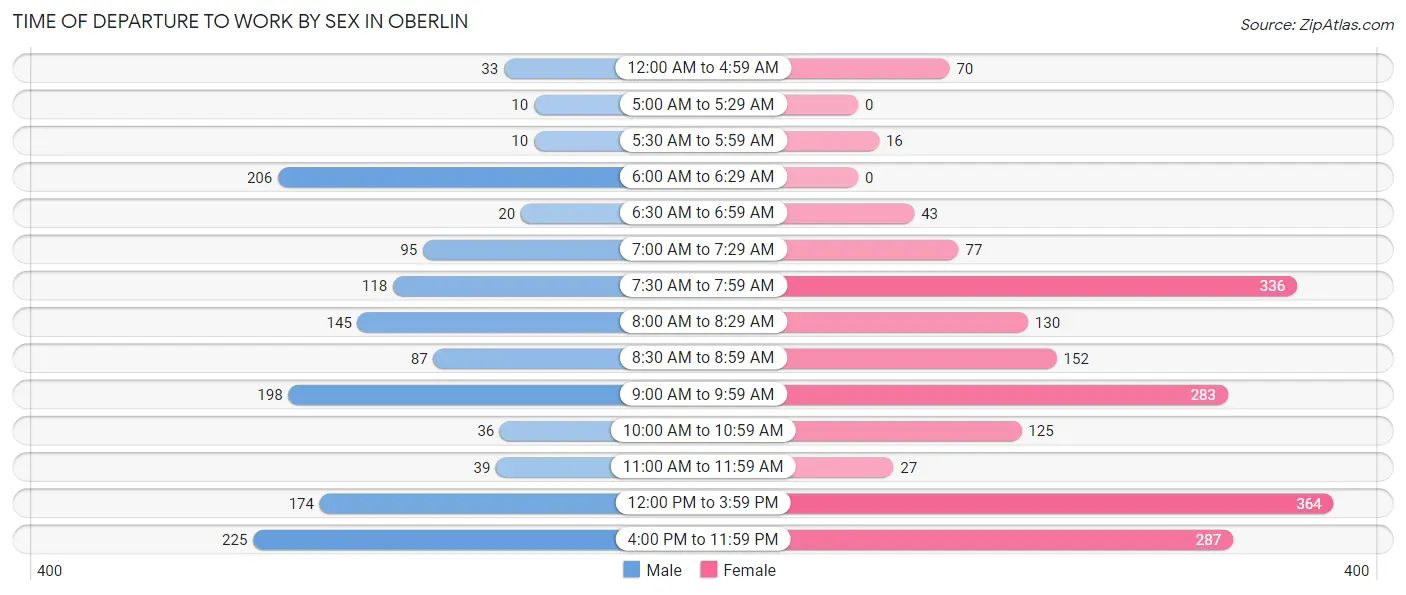
| Time of Departure | Male | Female |
| 12:00 AM to 4:59 AM | 33 (2.4%) | 70 (3.7%) |
| 5:00 AM to 5:29 AM | 10 (0.7%) | 0 (0.0%) |
| 5:30 AM to 5:59 AM | 10 (0.7%) | 16 (0.8%) |
| 6:00 AM to 6:29 AM | 206 (14.8%) | 0 (0.0%) |
| 6:30 AM to 6:59 AM | 20 (1.4%) | 43 (2.2%) |
| 7:00 AM to 7:29 AM | 95 (6.8%) | 77 (4.0%) |
| 7:30 AM to 7:59 AM | 118 (8.5%) | 336 (17.6%) |
| 8:00 AM to 8:29 AM | 145 (10.4%) | 130 (6.8%) |
| 8:30 AM to 8:59 AM | 87 (6.2%) | 152 (8.0%) |
| 9:00 AM to 9:59 AM | 198 (14.2%) | 283 (14.8%) |
| 10:00 AM to 10:59 AM | 36 (2.6%) | 125 (6.5%) |
| 11:00 AM to 11:59 AM | 39 (2.8%) | 27 (1.4%) |
| 12:00 PM to 3:59 PM | 174 (12.5%) | 364 (19.1%) |
| 4:00 PM to 11:59 PM | 225 (16.1%) | 287 (15.0%) |
| Total | 1,396 (100.0%) | 1,910 (100.0%) |
Housing Occupancy in Oberlin
Occupancy by Ownership in Oberlin
Of the total 2,464 dwellings in Oberlin, owner-occupied units account for 1,238 (50.2%), while renter-occupied units make up 1,226 (49.8%).
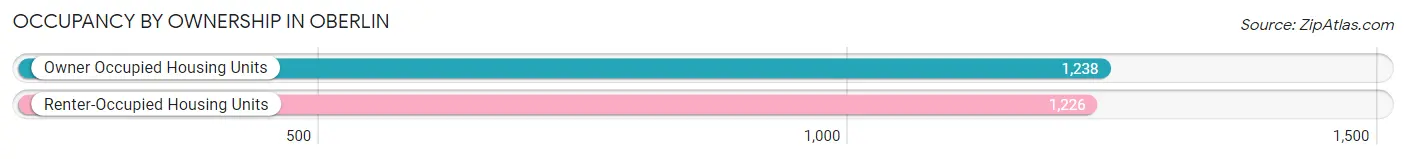
| Occupancy | # Housing Units | % Housing Units |
| Owner Occupied Housing Units | 1,238 | 50.2% |
| Renter-Occupied Housing Units | 1,226 | 49.8% |
| Total Occupied Housing Units | 2,464 | 100.0% |
Occupancy by Household Size in Oberlin
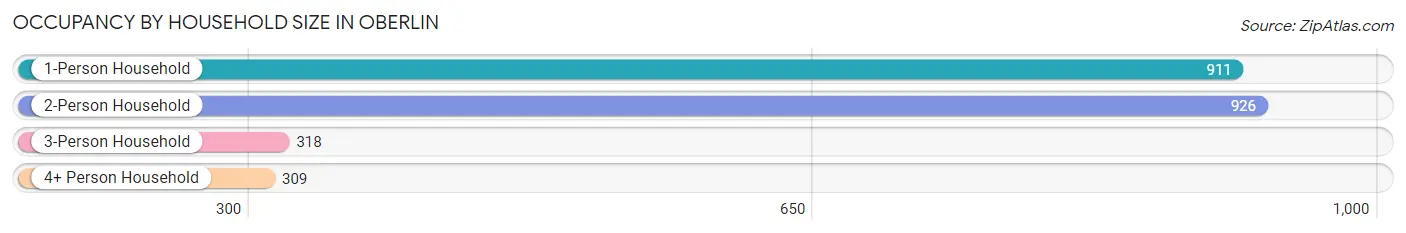
| Household Size | # Housing Units | % Housing Units |
| 1-Person Household | 911 | 37.0% |
| 2-Person Household | 926 | 37.6% |
| 3-Person Household | 318 | 12.9% |
| 4+ Person Household | 309 | 12.5% |
| Total Housing Units | 2,464 | 100.0% |
Occupancy by Ownership by Household Size in Oberlin
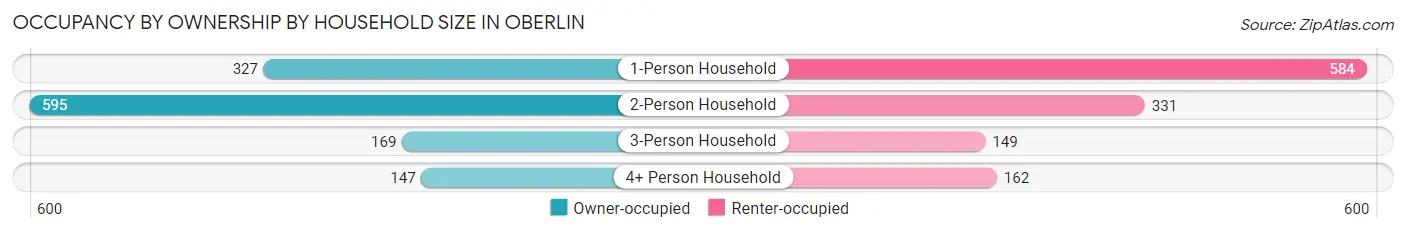
| Household Size | Owner-occupied | Renter-occupied |
| 1-Person Household | 327 (35.9%) | 584 (64.1%) |
| 2-Person Household | 595 (64.2%) | 331 (35.7%) |
| 3-Person Household | 169 (53.1%) | 149 (46.9%) |
| 4+ Person Household | 147 (47.6%) | 162 (52.4%) |
| Total Housing Units | 1,238 (50.2%) | 1,226 (49.8%) |
Occupancy by Educational Attainment in Oberlin
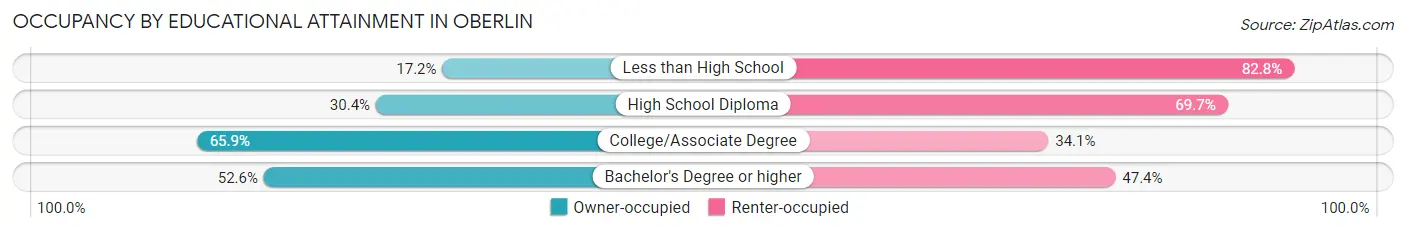
| Household Size | Owner-occupied | Renter-occupied |
| Less than High School | 17 (17.2%) | 82 (82.8%) |
| High School Diploma | 129 (30.3%) | 296 (69.7%) |
| College/Associate Degree | 357 (65.9%) | 185 (34.1%) |
| Bachelor's Degree or higher | 735 (52.6%) | 663 (47.4%) |
Occupancy by Age of Householder in Oberlin
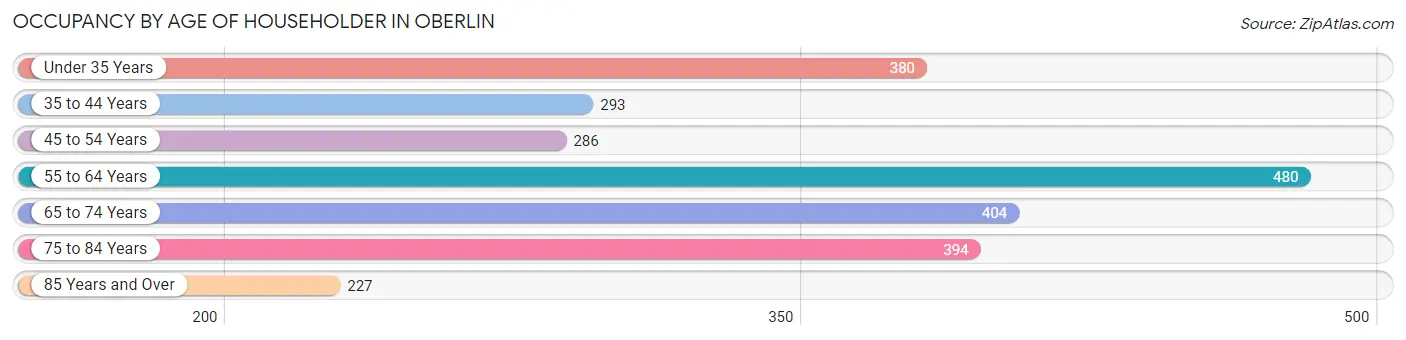
| Age Bracket | # Households | % Households |
| Under 35 Years | 380 | 15.4% |
| 35 to 44 Years | 293 | 11.9% |
| 45 to 54 Years | 286 | 11.6% |
| 55 to 64 Years | 480 | 19.5% |
| 65 to 74 Years | 404 | 16.4% |
| 75 to 84 Years | 394 | 16.0% |
| 85 Years and Over | 227 | 9.2% |
| Total | 2,464 | 100.0% |
Housing Finances in Oberlin
Median Income by Occupancy in Oberlin
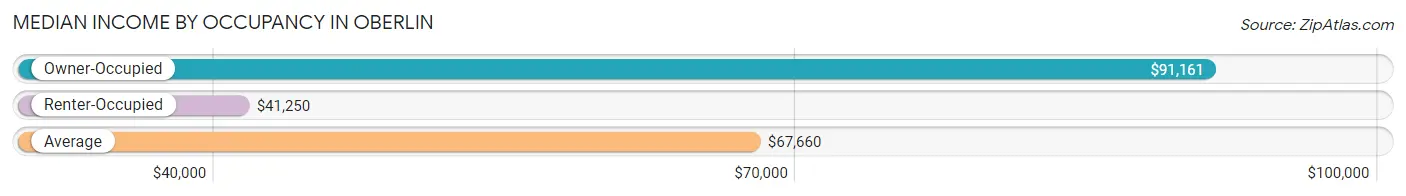
| Occupancy Type | # Households | Median Income |
| Owner-Occupied | 1,238 (50.2%) | $91,161 |
| Renter-Occupied | 1,226 (49.8%) | $41,250 |
| Average | 2,464 (100.0%) | $67,660 |
Occupancy by Householder Income Bracket in Oberlin
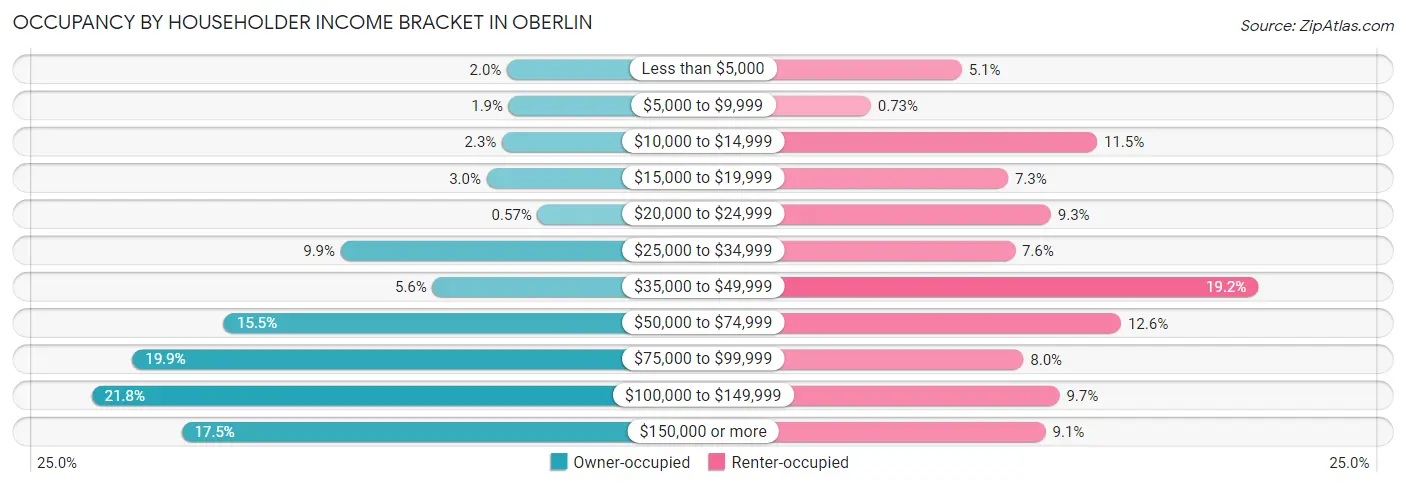
| Income Bracket | Owner-occupied | Renter-occupied |
| Less than $5,000 | 25 (2.0%) | 62 (5.1%) |
| $5,000 to $9,999 | 24 (1.9%) | 9 (0.7%) |
| $10,000 to $14,999 | 28 (2.3%) | 141 (11.5%) |
| $15,000 to $19,999 | 37 (3.0%) | 89 (7.3%) |
| $20,000 to $24,999 | 7 (0.6%) | 114 (9.3%) |
| $25,000 to $34,999 | 123 (9.9%) | 93 (7.6%) |
| $35,000 to $49,999 | 69 (5.6%) | 235 (19.2%) |
| $50,000 to $74,999 | 192 (15.5%) | 155 (12.6%) |
| $75,000 to $99,999 | 246 (19.9%) | 98 (8.0%) |
| $100,000 to $149,999 | 270 (21.8%) | 119 (9.7%) |
| $150,000 or more | 217 (17.5%) | 111 (9.0%) |
| Total | 1,238 (100.0%) | 1,226 (100.0%) |
Monthly Housing Cost Tiers in Oberlin
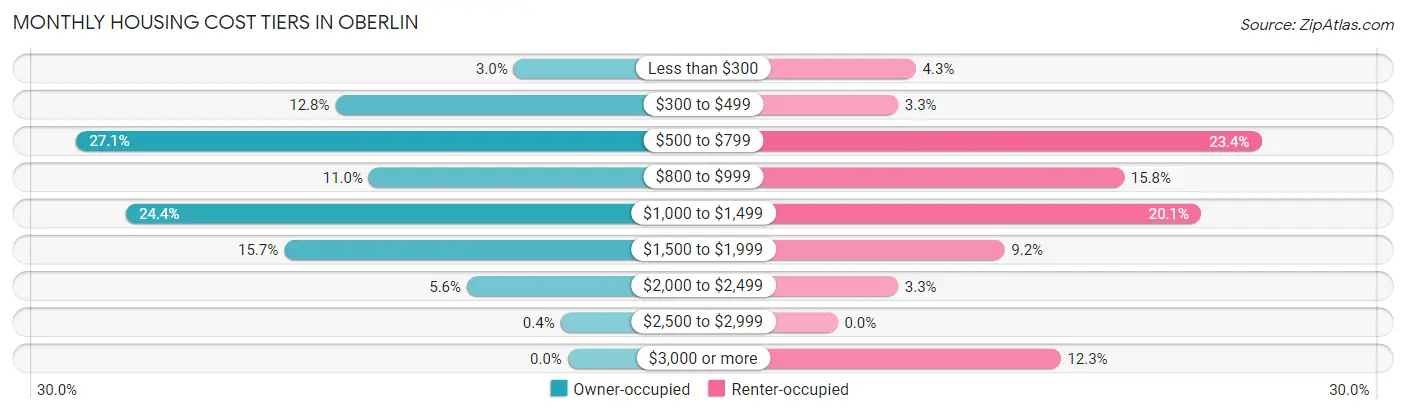
| Monthly Cost | Owner-occupied | Renter-occupied |
| Less than $300 | 37 (3.0%) | 53 (4.3%) |
| $300 to $499 | 159 (12.8%) | 41 (3.3%) |
| $500 to $799 | 336 (27.1%) | 287 (23.4%) |
| $800 to $999 | 136 (11.0%) | 194 (15.8%) |
| $1,000 to $1,499 | 302 (24.4%) | 246 (20.1%) |
| $1,500 to $1,999 | 194 (15.7%) | 113 (9.2%) |
| $2,000 to $2,499 | 69 (5.6%) | 41 (3.3%) |
| $2,500 to $2,999 | 5 (0.4%) | 0 (0.0%) |
| $3,000 or more | 0 (0.0%) | 151 (12.3%) |
| Total | 1,238 (100.0%) | 1,226 (100.0%) |
Physical Housing Characteristics in Oberlin
Housing Structures in Oberlin
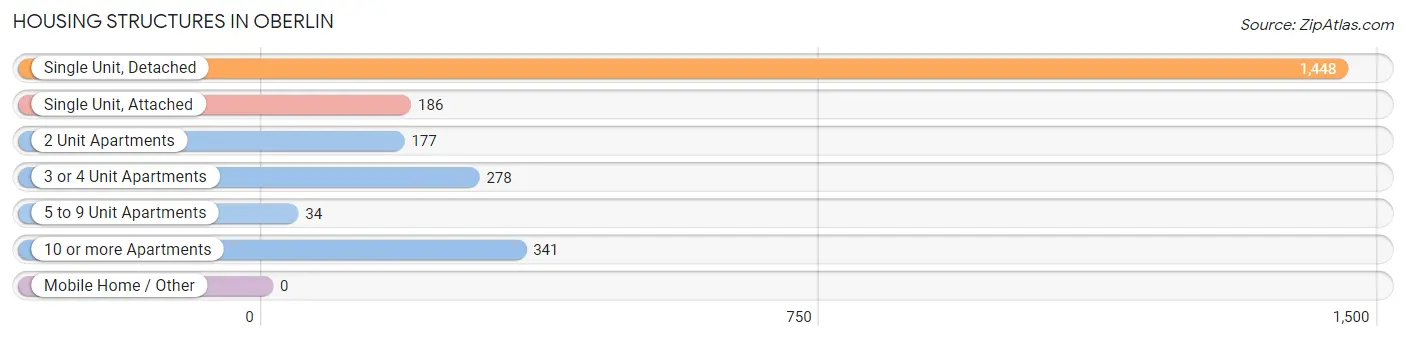
| Structure Type | # Housing Units | % Housing Units |
| Single Unit, Detached | 1,448 | 58.8% |
| Single Unit, Attached | 186 | 7.5% |
| 2 Unit Apartments | 177 | 7.2% |
| 3 or 4 Unit Apartments | 278 | 11.3% |
| 5 to 9 Unit Apartments | 34 | 1.4% |
| 10 or more Apartments | 341 | 13.8% |
| Mobile Home / Other | 0 | 0.0% |
| Total | 2,464 | 100.0% |
Housing Structures by Occupancy in Oberlin
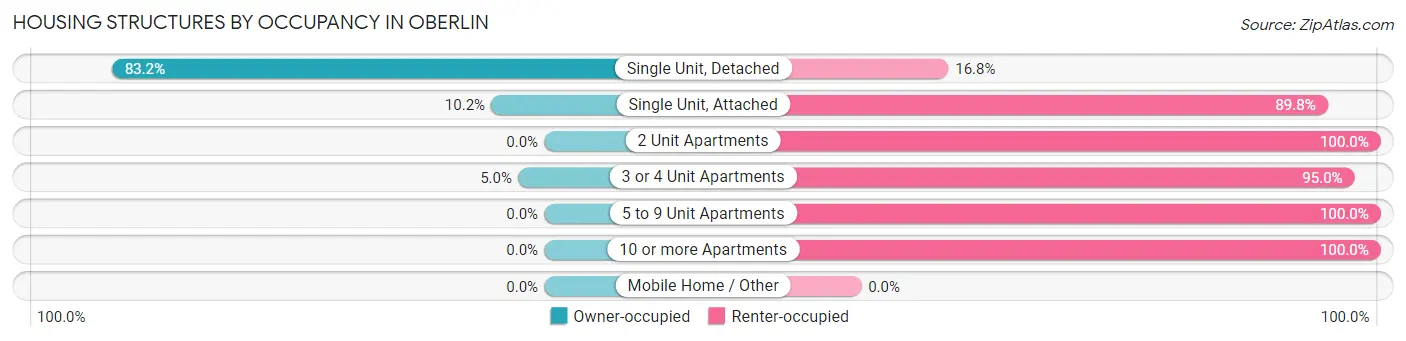
| Structure Type | Owner-occupied | Renter-occupied |
| Single Unit, Detached | 1,205 (83.2%) | 243 (16.8%) |
| Single Unit, Attached | 19 (10.2%) | 167 (89.8%) |
| 2 Unit Apartments | 0 (0.0%) | 177 (100.0%) |
| 3 or 4 Unit Apartments | 14 (5.0%) | 264 (95.0%) |
| 5 to 9 Unit Apartments | 0 (0.0%) | 34 (100.0%) |
| 10 or more Apartments | 0 (0.0%) | 341 (100.0%) |
| Mobile Home / Other | 0 (0.0%) | 0 (0.0%) |
| Total | 1,238 (50.2%) | 1,226 (49.8%) |
Housing Structures by Number of Rooms in Oberlin
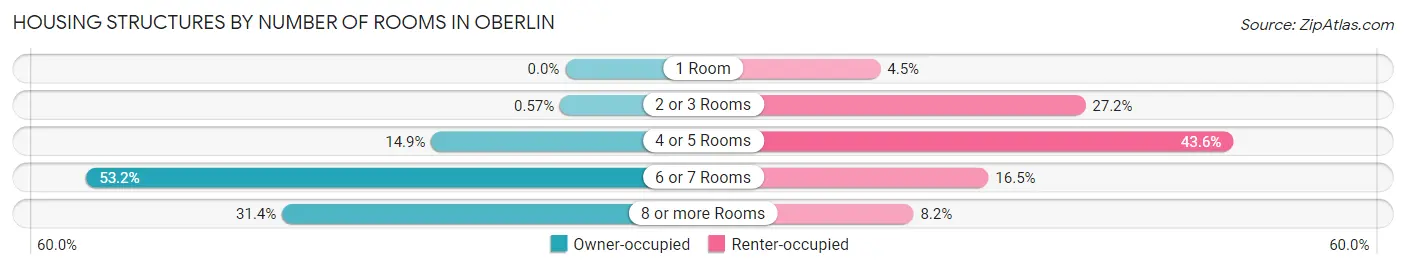
| Number of Rooms | Owner-occupied | Renter-occupied |
| 1 Room | 0 (0.0%) | 55 (4.5%) |
| 2 or 3 Rooms | 7 (0.6%) | 334 (27.2%) |
| 4 or 5 Rooms | 184 (14.9%) | 535 (43.6%) |
| 6 or 7 Rooms | 658 (53.1%) | 202 (16.5%) |
| 8 or more Rooms | 389 (31.4%) | 100 (8.2%) |
| Total | 1,238 (100.0%) | 1,226 (100.0%) |
Housing Structure by Heating Type in Oberlin
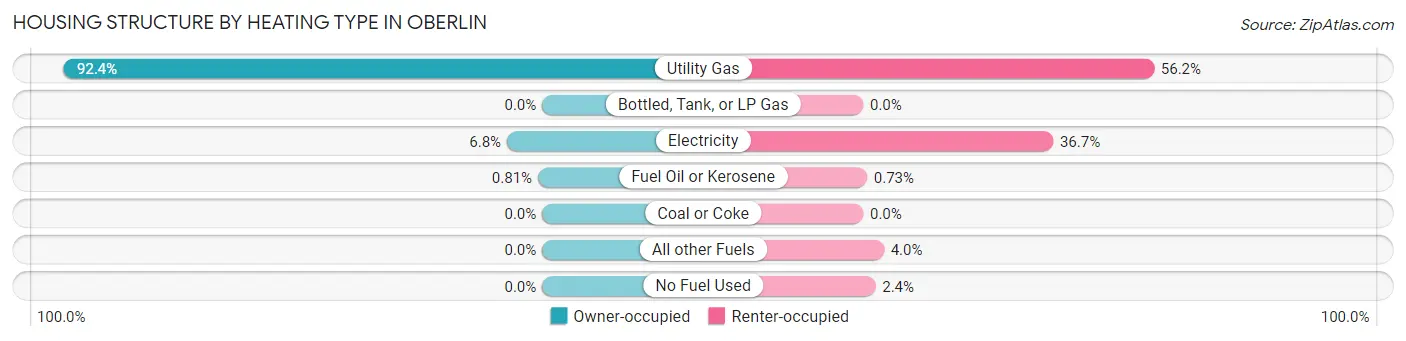
| Heating Type | Owner-occupied | Renter-occupied |
| Utility Gas | 1,144 (92.4%) | 689 (56.2%) |
| Bottled, Tank, or LP Gas | 0 (0.0%) | 0 (0.0%) |
| Electricity | 84 (6.8%) | 450 (36.7%) |
| Fuel Oil or Kerosene | 10 (0.8%) | 9 (0.7%) |
| Coal or Coke | 0 (0.0%) | 0 (0.0%) |
| All other Fuels | 0 (0.0%) | 49 (4.0%) |
| No Fuel Used | 0 (0.0%) | 29 (2.4%) |
| Total | 1,238 (100.0%) | 1,226 (100.0%) |
Household Vehicle Usage in Oberlin
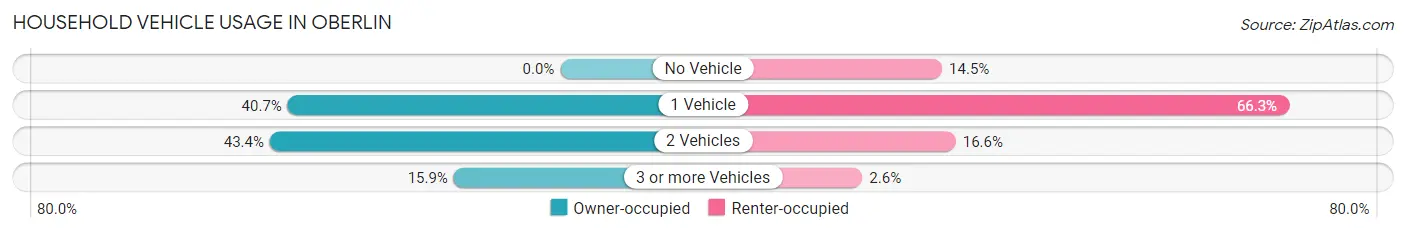
| Vehicles per Household | Owner-occupied | Renter-occupied |
| No Vehicle | 0 (0.0%) | 178 (14.5%) |
| 1 Vehicle | 504 (40.7%) | 813 (66.3%) |
| 2 Vehicles | 537 (43.4%) | 203 (16.6%) |
| 3 or more Vehicles | 197 (15.9%) | 32 (2.6%) |
| Total | 1,238 (100.0%) | 1,226 (100.0%) |
Real Estate & Mortgages in Oberlin
Real Estate and Mortgage Overview in Oberlin
| Characteristic | Without Mortgage | With Mortgage |
| Housing Units | 471 | 767 |
| Median Property Value | $197,200 | $182,100 |
| Median Household Income | $90,781 | $113 |
| Monthly Housing Costs | $606 | $0 |
| Real Estate Taxes | $3,153 | $0 |
Property Value by Mortgage Status in Oberlin
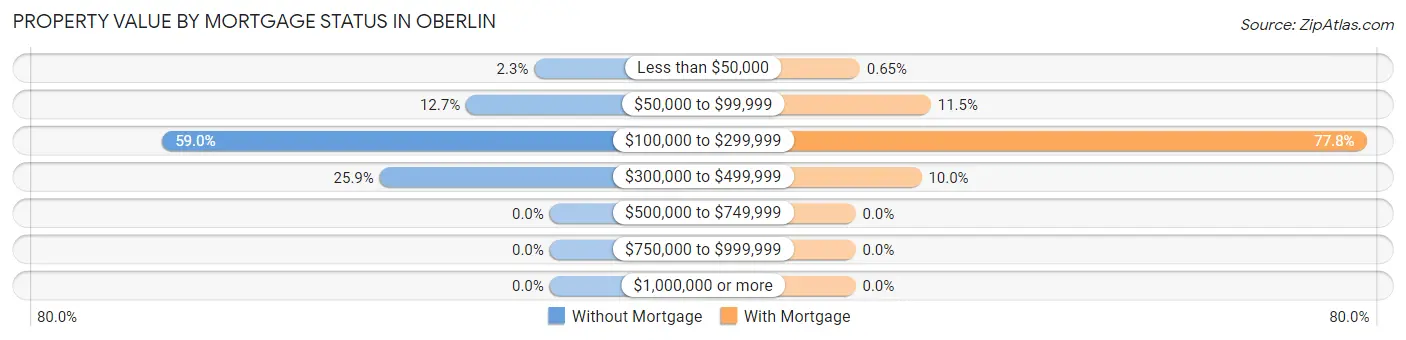
| Property Value | Without Mortgage | With Mortgage |
| Less than $50,000 | 11 (2.3%) | 5 (0.6%) |
| $50,000 to $99,999 | 60 (12.7%) | 88 (11.5%) |
| $100,000 to $299,999 | 278 (59.0%) | 597 (77.8%) |
| $300,000 to $499,999 | 122 (25.9%) | 77 (10.0%) |
| $500,000 to $749,999 | 0 (0.0%) | 0 (0.0%) |
| $750,000 to $999,999 | 0 (0.0%) | 0 (0.0%) |
| $1,000,000 or more | 0 (0.0%) | 0 (0.0%) |
| Total | 471 (100.0%) | 767 (100.0%) |
Household Income by Mortgage Status in Oberlin
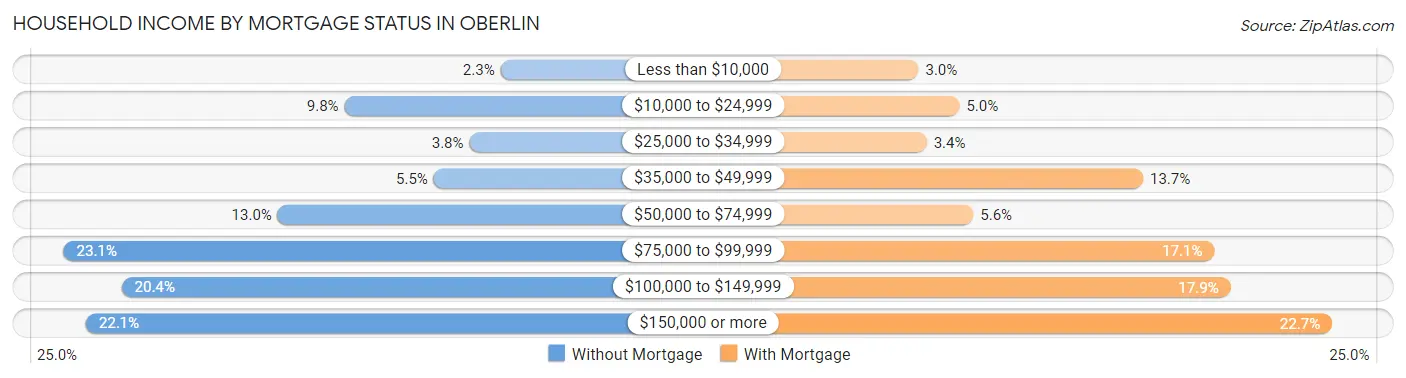
| Household Income | Without Mortgage | With Mortgage |
| Less than $10,000 | 11 (2.3%) | 23 (3.0%) |
| $10,000 to $24,999 | 46 (9.8%) | 38 (5.0%) |
| $25,000 to $34,999 | 18 (3.8%) | 26 (3.4%) |
| $35,000 to $49,999 | 26 (5.5%) | 105 (13.7%) |
| $50,000 to $74,999 | 61 (13.0%) | 43 (5.6%) |
| $75,000 to $99,999 | 109 (23.1%) | 131 (17.1%) |
| $100,000 to $149,999 | 96 (20.4%) | 137 (17.9%) |
| $150,000 or more | 104 (22.1%) | 174 (22.7%) |
| Total | 471 (100.0%) | 767 (100.0%) |
Property Value to Household Income Ratio in Oberlin
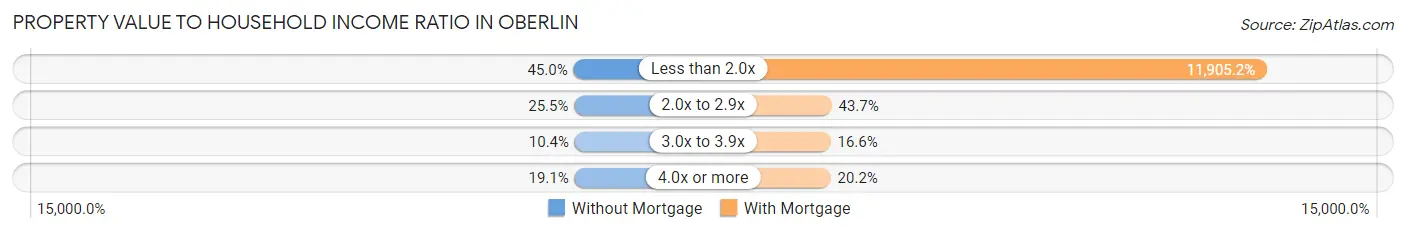
| Value-to-Income Ratio | Without Mortgage | With Mortgage |
| Less than 2.0x | 212 (45.0%) | 91,313 (11,905.2%) |
| 2.0x to 2.9x | 120 (25.5%) | 335 (43.7%) |
| 3.0x to 3.9x | 49 (10.4%) | 127 (16.6%) |
| 4.0x or more | 90 (19.1%) | 155 (20.2%) |
| Total | 471 (100.0%) | 767 (100.0%) |
Real Estate Taxes by Mortgage Status in Oberlin
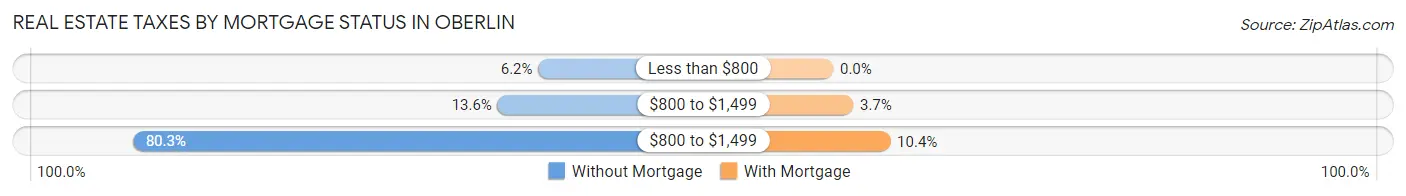
| Property Taxes | Without Mortgage | With Mortgage |
| Less than $800 | 29 (6.2%) | 0 (0.0%) |
| $800 to $1,499 | 64 (13.6%) | 28 (3.6%) |
| $800 to $1,499 | 378 (80.2%) | 80 (10.4%) |
| Total | 471 (100.0%) | 767 (100.0%) |
Health & Disability in Oberlin
Health Insurance Coverage by Age in Oberlin
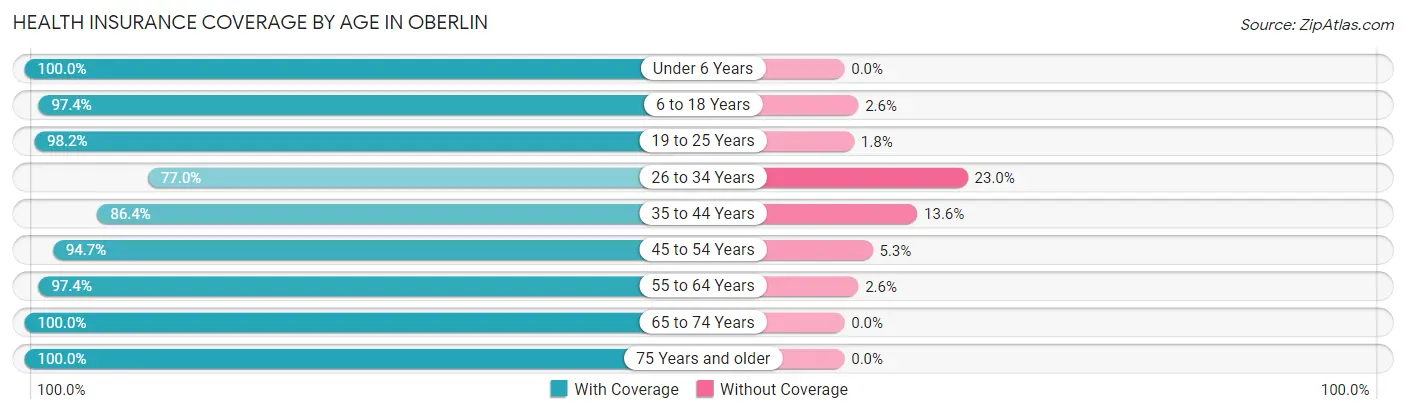
| Age Bracket | With Coverage | Without Coverage |
| Under 6 Years | 189 (100.0%) | 0 (0.0%) |
| 6 to 18 Years | 1,092 (97.4%) | 29 (2.6%) |
| 19 to 25 Years | 2,744 (98.2%) | 50 (1.8%) |
| 26 to 34 Years | 385 (77.0%) | 115 (23.0%) |
| 35 to 44 Years | 528 (86.4%) | 83 (13.6%) |
| 45 to 54 Years | 557 (94.7%) | 31 (5.3%) |
| 55 to 64 Years | 748 (97.4%) | 20 (2.6%) |
| 65 to 74 Years | 636 (100.0%) | 0 (0.0%) |
| 75 Years and older | 808 (100.0%) | 0 (0.0%) |
| Total | 7,687 (95.9%) | 328 (4.1%) |
Health Insurance Coverage by Citizenship Status in Oberlin
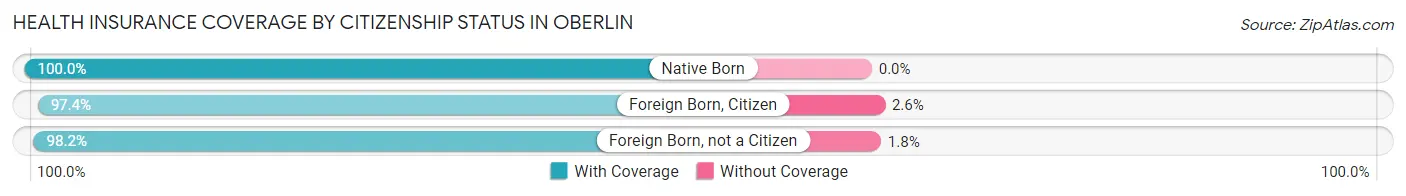
| Citizenship Status | With Coverage | Without Coverage |
| Native Born | 189 (100.0%) | 0 (0.0%) |
| Foreign Born, Citizen | 1,092 (97.4%) | 29 (2.6%) |
| Foreign Born, not a Citizen | 2,744 (98.2%) | 50 (1.8%) |
Health Insurance Coverage by Household Income in Oberlin
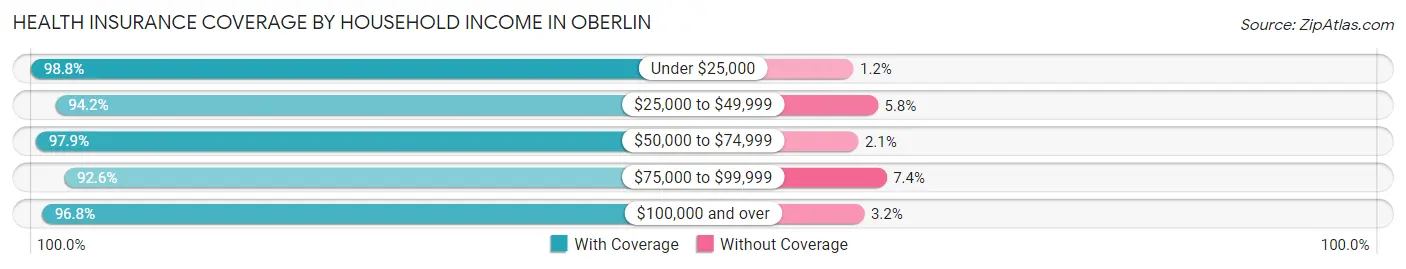
| Household Income | With Coverage | Without Coverage |
| Under $25,000 | 1,008 (98.8%) | 12 (1.2%) |
| $25,000 to $49,999 | 1,030 (94.2%) | 63 (5.8%) |
| $50,000 to $74,999 | 745 (97.9%) | 16 (2.1%) |
| $75,000 to $99,999 | 977 (92.6%) | 78 (7.4%) |
| $100,000 and over | 1,591 (96.8%) | 53 (3.2%) |
Public vs Private Health Insurance Coverage by Age in Oberlin
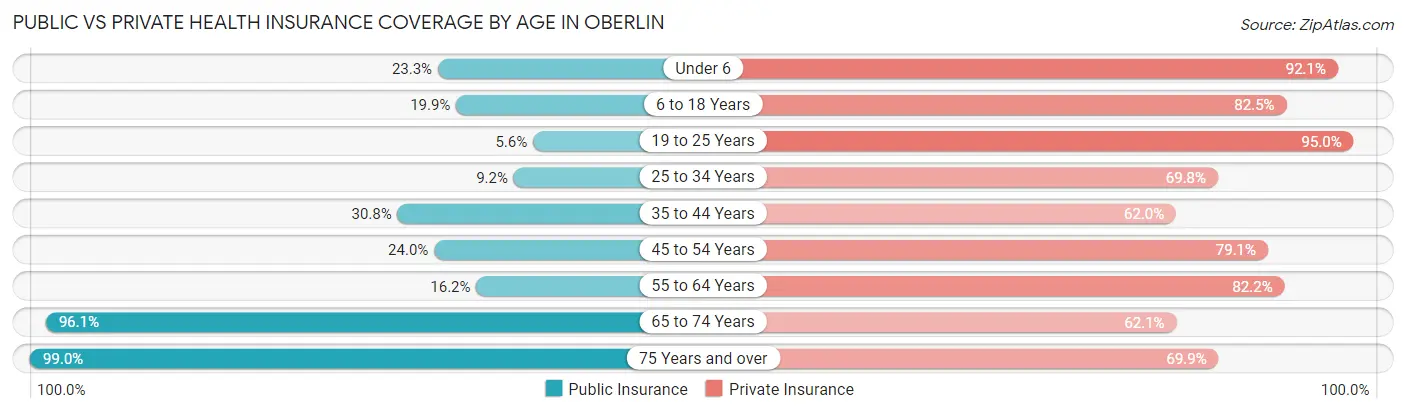
| Age Bracket | Public Insurance | Private Insurance |
| Under 6 | 44 (23.3%) | 174 (92.1%) |
| 6 to 18 Years | 223 (19.9%) | 925 (82.5%) |
| 19 to 25 Years | 157 (5.6%) | 2,654 (95.0%) |
| 25 to 34 Years | 46 (9.2%) | 349 (69.8%) |
| 35 to 44 Years | 188 (30.8%) | 379 (62.0%) |
| 45 to 54 Years | 141 (24.0%) | 465 (79.1%) |
| 55 to 64 Years | 124 (16.2%) | 631 (82.2%) |
| 65 to 74 Years | 611 (96.1%) | 395 (62.1%) |
| 75 Years and over | 800 (99.0%) | 565 (69.9%) |
| Total | 2,334 (29.1%) | 6,537 (81.6%) |
Disability Status by Sex by Age in Oberlin
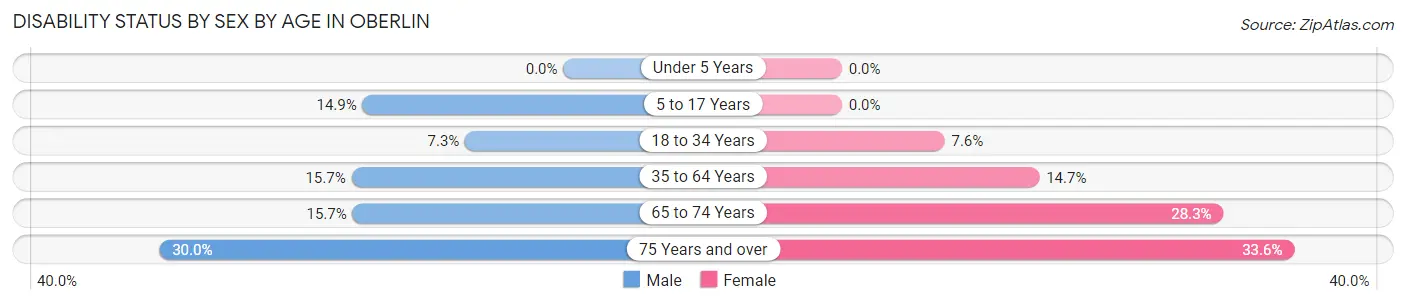
| Age Bracket | Male | Female |
| Under 5 Years | 0 (0.0%) | 0 (0.0%) |
| 5 to 17 Years | 41 (14.9%) | 0 (0.0%) |
| 18 to 34 Years | 127 (7.3%) | 159 (7.6%) |
| 35 to 64 Years | 142 (15.7%) | 156 (14.7%) |
| 65 to 74 Years | 36 (15.7%) | 115 (28.3%) |
| 75 Years and over | 87 (30.0%) | 174 (33.6%) |
Disability Class by Sex by Age in Oberlin
Disability Class: Hearing Difficulty
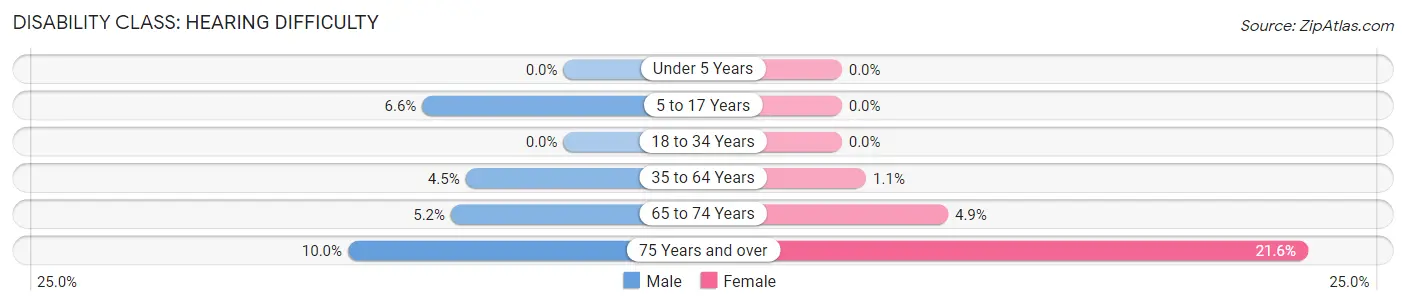
| Age Bracket | Male | Female |
| Under 5 Years | 0 (0.0%) | 0 (0.0%) |
| 5 to 17 Years | 18 (6.6%) | 0 (0.0%) |
| 18 to 34 Years | 0 (0.0%) | 0 (0.0%) |
| 35 to 64 Years | 41 (4.5%) | 12 (1.1%) |
| 65 to 74 Years | 12 (5.2%) | 20 (4.9%) |
| 75 Years and over | 29 (10.0%) | 112 (21.6%) |
Disability Class: Vision Difficulty
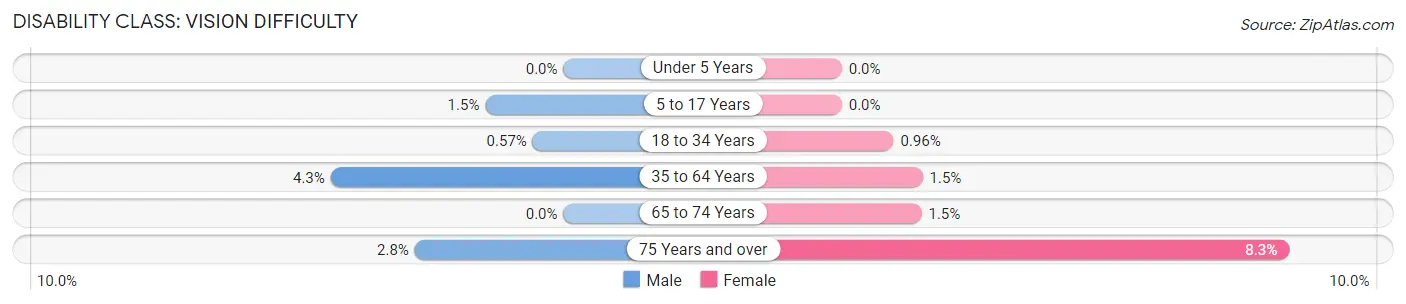
| Age Bracket | Male | Female |
| Under 5 Years | 0 (0.0%) | 0 (0.0%) |
| 5 to 17 Years | 4 (1.5%) | 0 (0.0%) |
| 18 to 34 Years | 10 (0.6%) | 20 (1.0%) |
| 35 to 64 Years | 39 (4.3%) | 16 (1.5%) |
| 65 to 74 Years | 0 (0.0%) | 6 (1.5%) |
| 75 Years and over | 8 (2.8%) | 43 (8.3%) |
Disability Class: Cognitive Difficulty
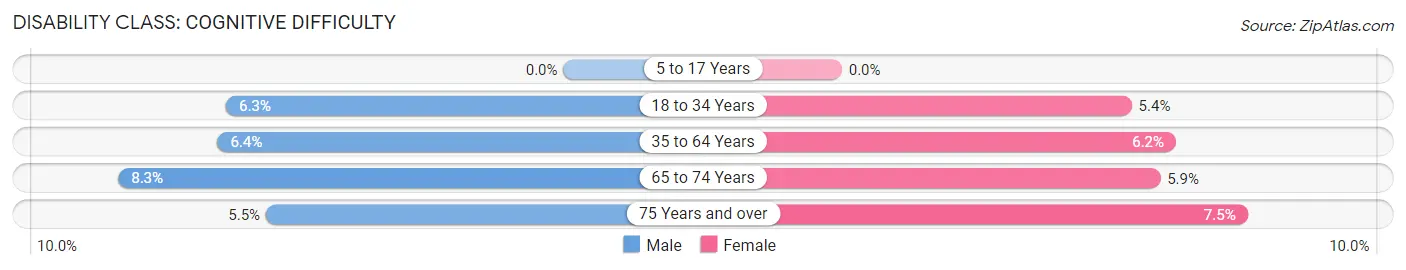
| Age Bracket | Male | Female |
| 5 to 17 Years | 0 (0.0%) | 0 (0.0%) |
| 18 to 34 Years | 109 (6.3%) | 112 (5.4%) |
| 35 to 64 Years | 58 (6.4%) | 66 (6.2%) |
| 65 to 74 Years | 19 (8.3%) | 24 (5.9%) |
| 75 Years and over | 16 (5.5%) | 39 (7.5%) |
Disability Class: Ambulatory Difficulty
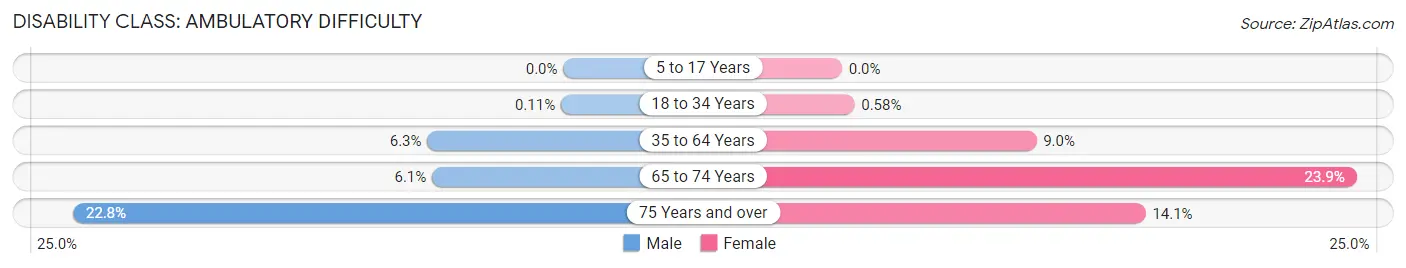
| Age Bracket | Male | Female |
| 5 to 17 Years | 0 (0.0%) | 0 (0.0%) |
| 18 to 34 Years | 2 (0.1%) | 12 (0.6%) |
| 35 to 64 Years | 57 (6.3%) | 96 (9.0%) |
| 65 to 74 Years | 14 (6.1%) | 97 (23.9%) |
| 75 Years and over | 66 (22.8%) | 73 (14.1%) |
Disability Class: Self-Care Difficulty
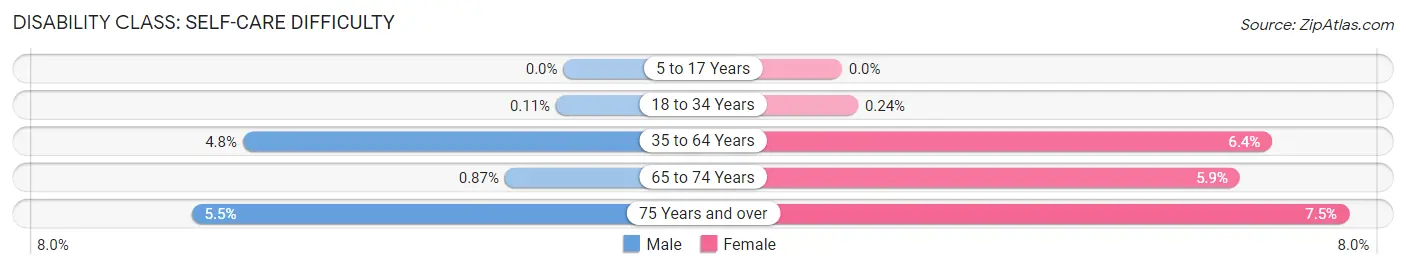
| Age Bracket | Male | Female |
| 5 to 17 Years | 0 (0.0%) | 0 (0.0%) |
| 18 to 34 Years | 2 (0.1%) | 5 (0.2%) |
| 35 to 64 Years | 43 (4.8%) | 68 (6.4%) |
| 65 to 74 Years | 2 (0.9%) | 24 (5.9%) |
| 75 Years and over | 16 (5.5%) | 39 (7.5%) |
Technology Access in Oberlin
Computing Device Access in Oberlin
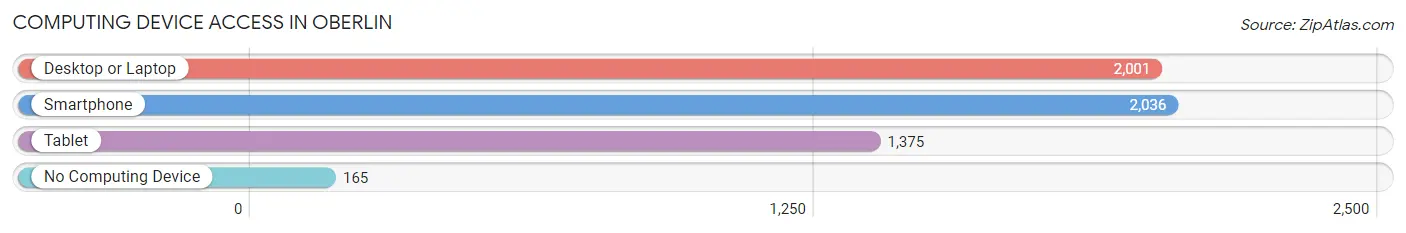
| Device Type | # Households | % Households |
| Desktop or Laptop | 2,001 | 81.2% |
| Smartphone | 2,036 | 82.6% |
| Tablet | 1,375 | 55.8% |
| No Computing Device | 165 | 6.7% |
| Total | 2,464 | 100.0% |
Internet Access in Oberlin
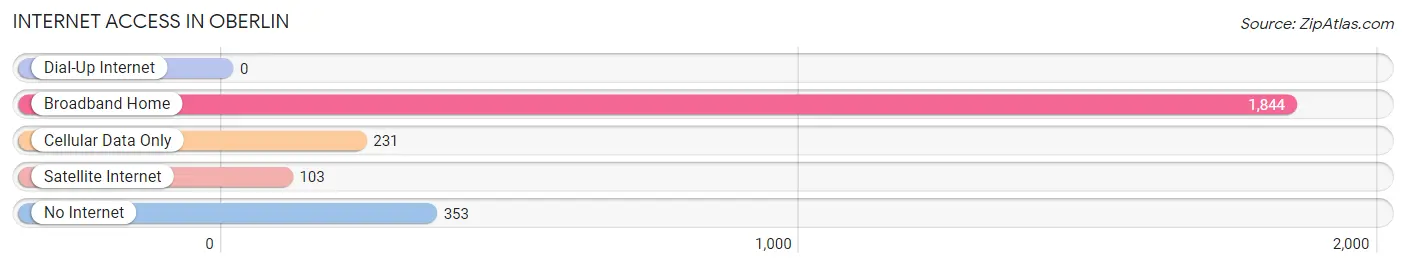
| Internet Type | # Households | % Households |
| Dial-Up Internet | 0 | 0.0% |
| Broadband Home | 1,844 | 74.8% |
| Cellular Data Only | 231 | 9.4% |
| Satellite Internet | 103 | 4.2% |
| No Internet | 353 | 14.3% |
| Total | 2,464 | 100.0% |
Oberlin Summary
Oberlin, Ohio is a small city located in Lorain County, Ohio, approximately 30 miles southwest of Cleveland. The city is home to Oberlin College, a private liberal arts college founded in 1833. The city has a population of 8,286 as of the 2010 census, and is the birthplace of the Oberlin Conservatory of Music, the oldest continuously operating conservatory in the United States.
History
Oberlin was founded in 1833 by two Presbyterian ministers, John J. Shipherd and Philo P. Stewart. The two men had a vision of creating a college that would provide education to all, regardless of race or gender. The college was named after Johann Friedrich Oberlin, a German pastor and philanthropist. The city was incorporated in 1844, and the college was chartered in 1851.
In the mid-19th century, Oberlin was a center of the abolitionist movement. The college was a stop on the Underground Railroad, and many of its students and faculty were active in the movement. Oberlin was also the first college in the United States to admit women and African Americans.
Geography
Oberlin is located in Lorain County, Ohio, approximately 30 miles southwest of Cleveland. The city is situated on the Black River, a tributary of the Huron River. The city has a total area of 4.2 square miles, of which 4.1 square miles is land and 0.1 square miles is water.
Economy
Oberlin’s economy is largely driven by Oberlin College, which is the city’s largest employer. The college employs over 1,000 people, and its students contribute to the local economy through their spending. Other major employers in the city include the Oberlin Public Schools, the Oberlin City Schools, and the Oberlin Medical Center.
Demographics
As of the 2010 census, Oberlin had a population of 8,286. The racial makeup of the city was 79.2% White, 11.2% African American, 0.3% Native American, 5.2% Asian, 0.1% Pacific Islander, 1.3% from other races, and 2.7% from two or more races. Hispanic or Latino of any race were 3.3% of the population.
The median income for a household in the city was $41,945, and the median income for a family was $60,917. The per capita income for the city was $22,945. About 11.2% of families and 24.2% of the population were below the poverty line, including 16.2% of those under age 18 and 8.2% of those age 65 or over.
Oberlin is a small city with a rich history and a diverse population. The city is home to Oberlin College, which has been a major contributor to the city’s economy and culture for over 150 years. The city has a strong sense of community, and its residents are proud of their city’s history and its commitment to social justice.
Common Questions
What is Per Capita Income in Oberlin?
Per Capita income in Oberlin is $28,443.
What is the Median Family Income in Oberlin?
Median Family Income in Oberlin is $93,807.
What is the Median Household income in Oberlin?
Median Household Income in Oberlin is $67,660.
What is Income or Wage Gap in Oberlin?
Income or Wage Gap in Oberlin is 23.1%.
Women in Oberlin earn 76.9 cents for every dollar earned by a man.
What is Inequality or Gini Index in Oberlin?
Inequality or Gini Index in Oberlin is 0.45.
What is the Total Population of Oberlin?
Total Population of Oberlin is 8,194.
What is the Total Male Population of Oberlin?
Total Male Population of Oberlin is 3,622.
What is the Total Female Population of Oberlin?
Total Female Population of Oberlin is 4,572.
What is the Ratio of Males per 100 Females in Oberlin?
There are 79.22 Males per 100 Females in Oberlin.
What is the Ratio of Females per 100 Males in Oberlin?
There are 126.23 Females per 100 Males in Oberlin.
What is the Median Population Age in Oberlin?
Median Population Age in Oberlin is 25.8 Years.
What is the Average Family Size in Oberlin
Average Family Size in Oberlin is 2.8 People.
What is the Average Household Size in Oberlin
Average Household Size in Oberlin is 2.3 People.
How Large is the Labor Force in Oberlin?
There are 4,111 People in the Labor Forcein in Oberlin.
What is the Percentage of People in the Labor Force in Oberlin?
54.8% of People are in the Labor Force in Oberlin.
What is the Unemployment Rate in Oberlin?
Unemployment Rate in Oberlin is 4.6%.