Zip Codes with the Highest Percentage of Population with a Degree in Literature and Languages in Cincinnati, OH
RELATED REPORTS & OPTIONS
Literature and Languages
Cincinnati
Compare Zip Codes
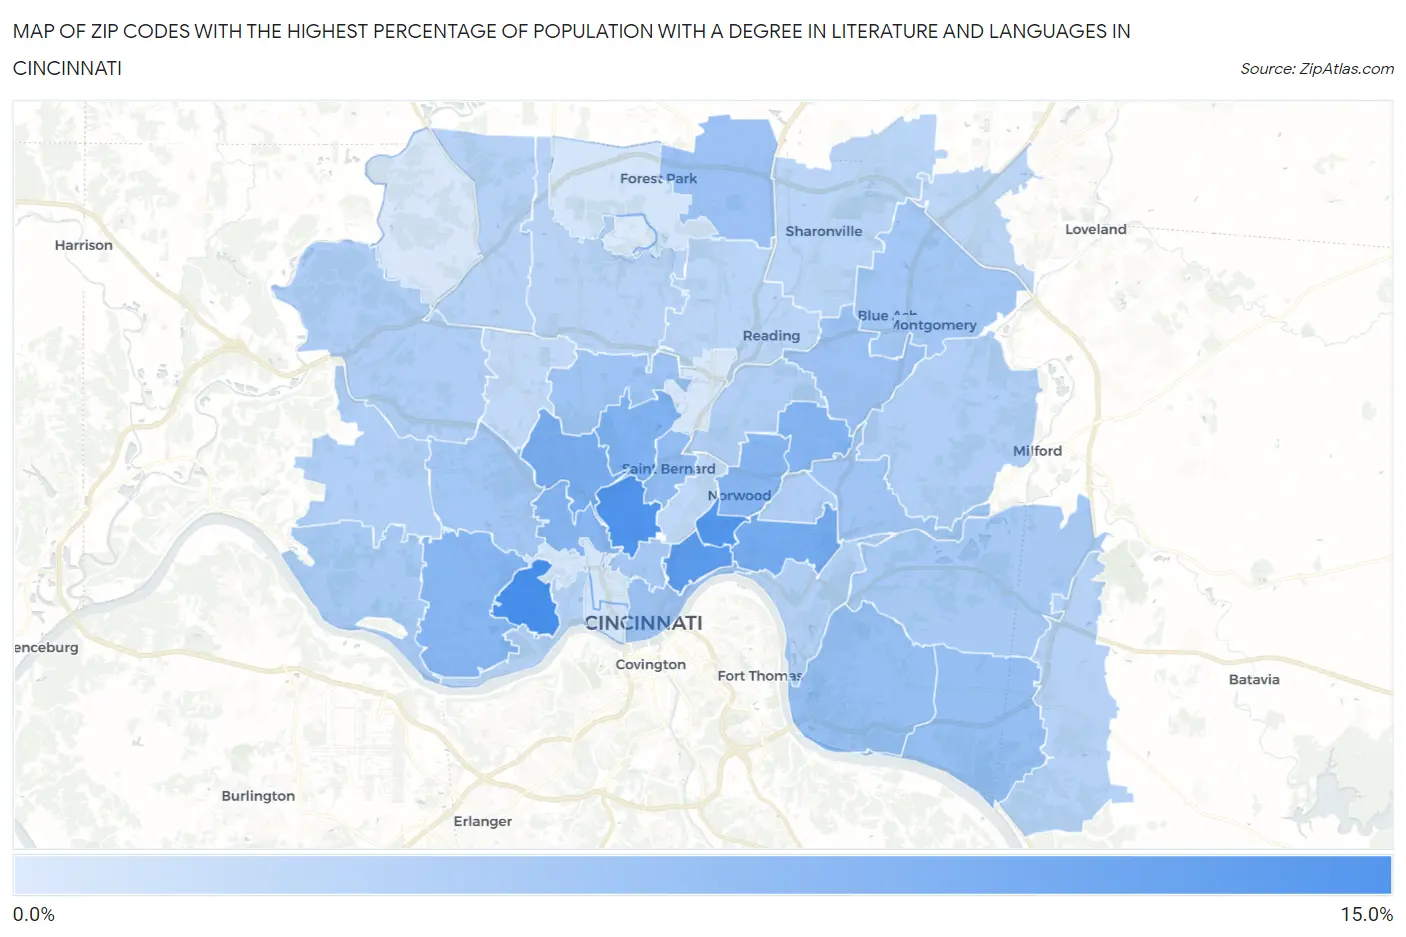
Map of Zip Codes with the Highest Percentage of Population with a Degree in Literature and Languages in Cincinnati
0.26%
10.8%
Zip Codes with the Highest Percentage of Population with a Degree in Literature and Languages in Cincinnati, OH
| Zip Code | % Graduates | vs State | vs National | |
| 1. | 45205 | 10.8% | 3.7%(+7.12)#35 | 4.4%(+6.38)#1,528 |
| 2. | 45220 | 10.1% | 3.7%(+6.42)#41 | 4.4%(+5.68)#1,782 |
| 3. | 45207 | 10.0% | 3.7%(+6.33)#43 | 4.4%(+5.60)#1,813 |
| 4. | 45206 | 9.3% | 3.7%(+5.62)#53 | 4.4%(+4.89)#2,150 |
| 5. | 45208 | 7.4% | 3.7%(+3.77)#77 | 4.4%(+3.04)#3,500 |
| 6. | 45223 | 7.1% | 3.7%(+3.39)#93 | 4.4%(+2.66)#3,921 |
| 7. | 45232 | 6.5% | 3.7%(+2.87)#116 | 4.4%(+2.14)#4,582 |
| 8. | 45213 | 6.4% | 3.7%(+2.69)#125 | 4.4%(+1.96)#4,837 |
| 9. | 45238 | 6.2% | 3.7%(+2.51)#133 | 4.4%(+1.78)#5,113 |
| 10. | 45225 | 6.1% | 3.7%(+2.47)#136 | 4.4%(+1.74)#5,178 |
| 11. | 45212 | 6.1% | 3.7%(+2.40)#139 | 4.4%(+1.67)#5,305 |
| 12. | 45217 | 5.4% | 3.7%(+1.75)#182 | 4.4%(+1.01)#6,469 |
| 13. | 45255 | 5.2% | 3.7%(+1.55)#196 | 4.4%(+0.811)#6,902 |
| 14. | 45230 | 5.2% | 3.7%(+1.53)#198 | 4.4%(+0.795)#6,933 |
| 15. | 45246 | 4.7% | 3.7%(+1.06)#230 | 4.4%(+0.326)#8,071 |
| 16. | 45236 | 4.7% | 3.7%(+1.04)#232 | 4.4%(+0.310)#8,118 |
| 17. | 45202 | 4.6% | 3.7%(+0.949)#240 | 4.4%(+0.216)#8,365 |
| 18. | 45224 | 4.5% | 3.7%(+0.798)#252 | 4.4%(+0.064)#8,782 |
| 19. | 45227 | 4.4% | 3.7%(+0.682)#263 | 4.4%(-0.051)#9,124 |
| 20. | 45242 | 4.1% | 3.7%(+0.439)#284 | 4.4%(-0.295)#9,862 |
| 21. | 45211 | 4.1% | 3.7%(+0.439)#285 | 4.4%(-0.295)#9,863 |
| 22. | 45219 | 4.0% | 3.7%(+0.276)#300 | 4.4%(-0.458)#10,324 |
| 23. | 45244 | 3.9% | 3.7%(+0.203)#306 | 4.4%(-0.531)#10,565 |
| 24. | 45233 | 3.8% | 3.7%(+0.123)#315 | 4.4%(-0.611)#10,821 |
| 25. | 45209 | 3.4% | 3.7%(-0.255)#358 | 4.4%(-0.988)#12,110 |
| 26. | 45247 | 3.4% | 3.7%(-0.319)#364 | 4.4%(-1.05)#12,316 |
| 27. | 45237 | 3.3% | 3.7%(-0.404)#382 | 4.4%(-1.14)#12,640 |
| 28. | 45248 | 3.3% | 3.7%(-0.415)#385 | 4.4%(-1.15)#12,682 |
| 29. | 45243 | 3.2% | 3.7%(-0.479)#403 | 4.4%(-1.21)#12,927 |
| 30. | 45226 | 3.0% | 3.7%(-0.638)#419 | 4.4%(-1.37)#13,446 |
| 31. | 45204 | 3.0% | 3.7%(-0.642)#420 | 4.4%(-1.38)#13,456 |
| 32. | 45251 | 2.9% | 3.7%(-0.756)#434 | 4.4%(-1.49)#13,826 |
| 33. | 45245 | 2.9% | 3.7%(-0.791)#444 | 4.4%(-1.52)#13,950 |
| 34. | 45231 | 2.8% | 3.7%(-0.894)#459 | 4.4%(-1.63)#14,324 |
| 35. | 45215 | 2.5% | 3.7%(-1.13)#493 | 4.4%(-1.86)#15,133 |
| 36. | 45241 | 2.5% | 3.7%(-1.15)#498 | 4.4%(-1.89)#15,226 |
| 37. | 45249 | 2.4% | 3.7%(-1.28)#524 | 4.4%(-2.01)#15,679 |
| 38. | 45229 | 2.3% | 3.7%(-1.40)#544 | 4.4%(-2.14)#16,155 |
| 39. | 45239 | 2.1% | 3.7%(-1.55)#564 | 4.4%(-2.29)#16,663 |
| 40. | 45203 | 1.0% | 3.7%(-2.64)#705 | 4.4%(-3.37)#20,040 |
| 41. | 45240 | 0.81% | 3.7%(-2.87)#721 | 4.4%(-3.60)#20,605 |
| 42. | 45214 | 0.68% | 3.7%(-3.00)#733 | 4.4%(-3.73)#20,896 |
| 43. | 45216 | 0.62% | 3.7%(-3.05)#737 | 4.4%(-3.79)#21,002 |
| 44. | 45252 | 0.51% | 3.7%(-3.16)#750 | 4.4%(-3.90)#21,231 |
| 45. | 45218 | 0.26% | 3.7%(-3.42)#762 | 4.4%(-4.15)#21,582 |
1
Common Questions
What are the Top 10 Zip Codes with the Highest Percentage of Population with a Degree in Literature and Languages in Cincinnati, OH?
Top 10 Zip Codes with the Highest Percentage of Population with a Degree in Literature and Languages in Cincinnati, OH are:
What zip code has the Highest Percentage of Population with a Degree in Literature and Languages in Cincinnati, OH?
45205 has the Highest Percentage of Population with a Degree in Literature and Languages in Cincinnati, OH with 10.8%.
What is the Percentage of Population with a Degree in Literature and Languages in Cincinnati, OH?
Percentage of Population with a Degree in Literature and Languages in Cincinnati is 5.9%.
What is the Percentage of Population with a Degree in Literature and Languages in Ohio?
Percentage of Population with a Degree in Literature and Languages in Ohio is 3.7%.
What is the Percentage of Population with a Degree in Literature and Languages in the United States?
Percentage of Population with a Degree in Literature and Languages in the United States is 4.4%.