Linndale, OH Map & Demographics
Linndale Map
Linndale Overview
$28,661
PER CAPITA INCOME
$71,786
AVG HOUSEHOLD INCOME
6.2%
WAGE / INCOME GAP [ % ]
93.8¢/ $1
WAGE / INCOME GAP [ $ ]
0.51
INEQUALITY / GINI INDEX
276
TOTAL POPULATION
195
MALE POPULATION
81
FEMALE POPULATION
240.74
MALES / 100 FEMALES
41.54
FEMALES / 100 MALES
37.8
MEDIAN AGE
4.7
AVG FAMILY SIZE
4.1
AVG HOUSEHOLD SIZE
147
LABOR FORCE [ PEOPLE ]
78.6%
PERCENT IN LABOR FORCE
8.8%
UNEMPLOYMENT RATE
Income in Linndale
Income Overview in Linndale
| Characteristic | Number | Measure |
| Per Capita Income | 276 | $28,661 |
| Median Family Income | 37 | $0 |
| Mean Family Income | 37 | $66,265 |
| Median Household Income | 68 | $71,786 |
| Mean Household Income | 68 | $97,191 |
| Income Deficit | 37 | $0 |
| Wage / Income Gap (%) | 276 | 6.18% |
| Wage / Income Gap ($) | 276 | 93.82¢ per $1 |
| Gini / Inequality Index | 276 | 0.51 |
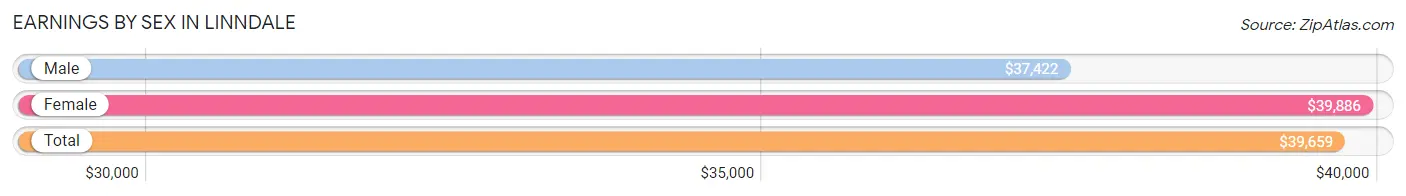
Earnings by Sex in Linndale
Average Earnings in Linndale are $39,659, $37,422 for men and $39,886 for women, a difference of 6.2%.
| Sex | Number | Average Earnings |
| Male | 92 (63.4%) | $37,422 |
| Female | 53 (36.5%) | $39,886 |
| Total | 145 (100.0%) | $39,659 |
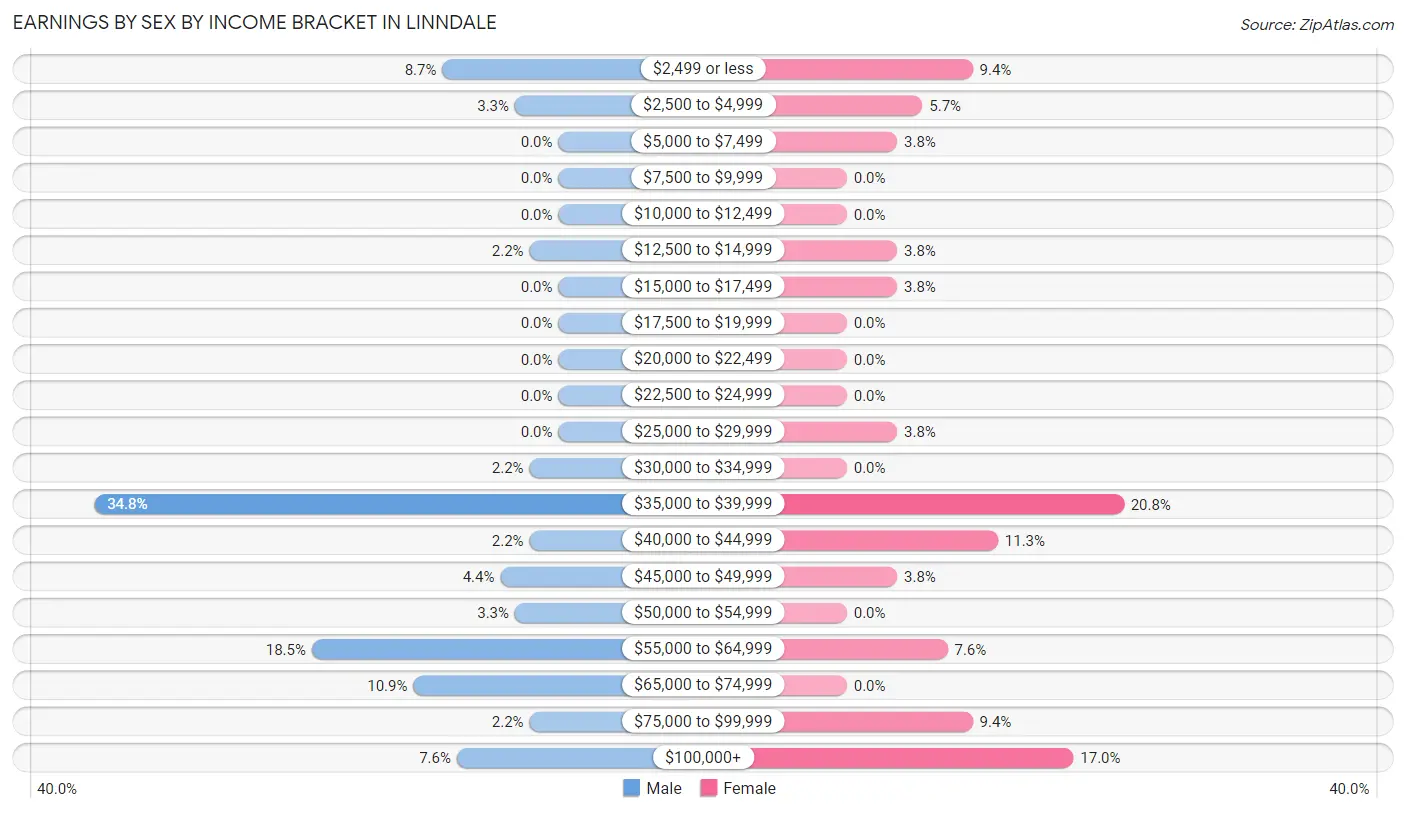
Earnings by Sex by Income Bracket in Linndale
The most common earnings brackets in Linndale are $35,000 to $39,999 for men (32 | 34.8%) and $35,000 to $39,999 for women (11 | 20.7%).
| Income | Male | Female |
| $2,499 or less | 8 (8.7%) | 5 (9.4%) |
| $2,500 to $4,999 | 3 (3.3%) | 3 (5.7%) |
| $5,000 to $7,499 | 0 (0.0%) | 2 (3.8%) |
| $7,500 to $9,999 | 0 (0.0%) | 0 (0.0%) |
| $10,000 to $12,499 | 0 (0.0%) | 0 (0.0%) |
| $12,500 to $14,999 | 2 (2.2%) | 2 (3.8%) |
| $15,000 to $17,499 | 0 (0.0%) | 2 (3.8%) |
| $17,500 to $19,999 | 0 (0.0%) | 0 (0.0%) |
| $20,000 to $22,499 | 0 (0.0%) | 0 (0.0%) |
| $22,500 to $24,999 | 0 (0.0%) | 0 (0.0%) |
| $25,000 to $29,999 | 0 (0.0%) | 2 (3.8%) |
| $30,000 to $34,999 | 2 (2.2%) | 0 (0.0%) |
| $35,000 to $39,999 | 32 (34.8%) | 11 (20.7%) |
| $40,000 to $44,999 | 2 (2.2%) | 6 (11.3%) |
| $45,000 to $49,999 | 4 (4.3%) | 2 (3.8%) |
| $50,000 to $54,999 | 3 (3.3%) | 0 (0.0%) |
| $55,000 to $64,999 | 17 (18.5%) | 4 (7.5%) |
| $65,000 to $74,999 | 10 (10.9%) | 0 (0.0%) |
| $75,000 to $99,999 | 2 (2.2%) | 5 (9.4%) |
| $100,000+ | 7 (7.6%) | 9 (17.0%) |
| Total | 92 (100.0%) | 53 (100.0%) |
Earnings by Sex by Educational Attainment in Linndale
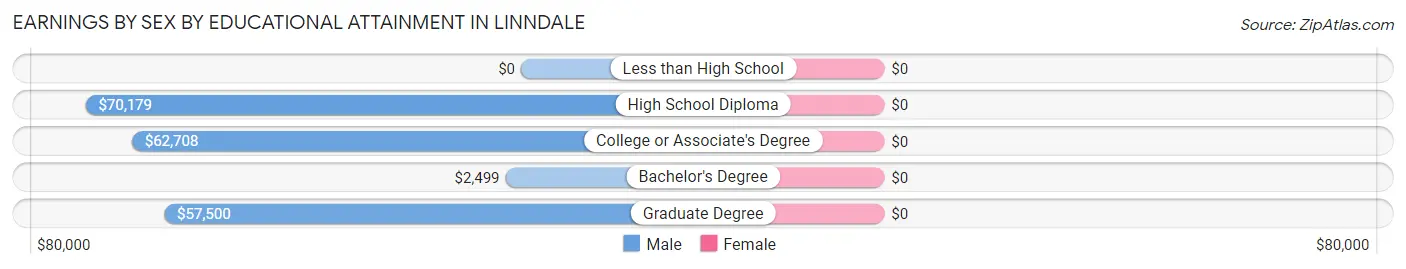
| Educational Attainment | Male Income | Female Income |
| Less than High School | - | - |
| High School Diploma | $70,179 | $0 |
| College or Associate's Degree | $62,708 | $0 |
| Bachelor's Degree | $2,499 | $0 |
| Graduate Degree | $57,500 | $0 |
| Total | $37,422 | $42,708 |
Family Income in Linndale
Family Income Brackets in Linndale
According to the Linndale family income data, there are 15 families falling into the $35,000 to $49,999 income range, which is the most common income bracket and makes up 40.5% of all families.
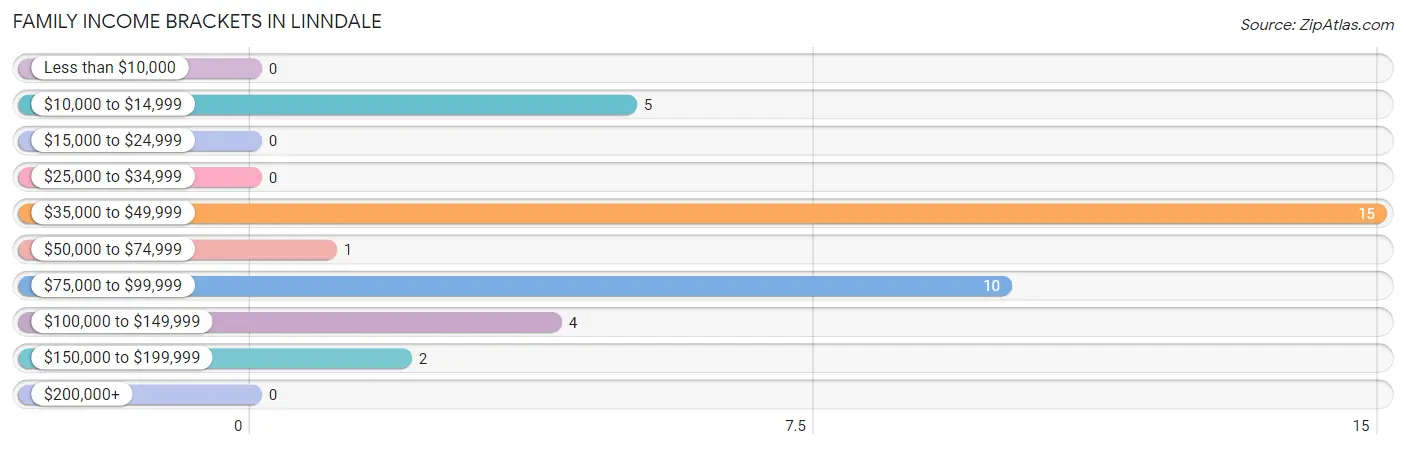
| Income Bracket | # Families | % Families |
| Less than $10,000 | 0 | 0.0% |
| $10,000 to $14,999 | 5 | 13.5% |
| $15,000 to $24,999 | 0 | 0.0% |
| $25,000 to $34,999 | 0 | 0.0% |
| $35,000 to $49,999 | 15 | 40.5% |
| $50,000 to $74,999 | 1 | 2.7% |
| $75,000 to $99,999 | 10 | 27.0% |
| $100,000 to $149,999 | 4 | 10.8% |
| $150,000 to $199,999 | 2 | 5.4% |
| $200,000+ | 0 | 0.0% |
Family Income by Famaliy Size in Linndale
2-person families (8 | 21.6%) account for the highest median family income in Linndale with $92,500 per family, while 2-person families (8 | 21.6%) have the highest median income of $46,250 per family member.
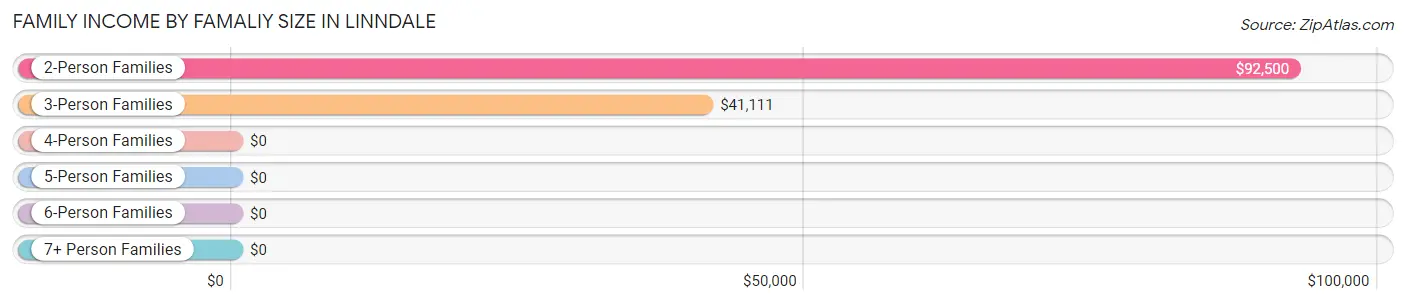
| Income Bracket | # Families | Median Income |
| 2-Person Families | 8 (21.6%) | $92,500 |
| 3-Person Families | 12 (32.4%) | $41,111 |
| 4-Person Families | 15 (40.5%) | $0 |
| 5-Person Families | 2 (5.4%) | $0 |
| 6-Person Families | 0 (0.0%) | $0 |
| 7+ Person Families | 0 (0.0%) | $0 |
| Total | 37 (100.0%) | $0 |
Family Income by Number of Earners in Linndale
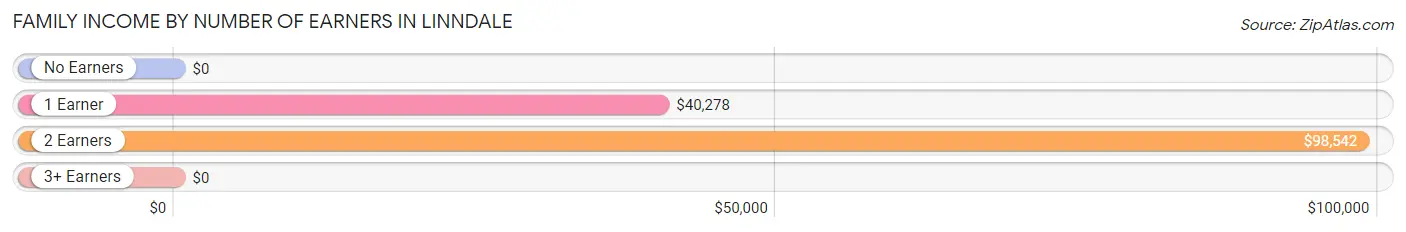
| Number of Earners | # Families | Median Income |
| No Earners | 0 (0.0%) | $0 |
| 1 Earner | 20 (54.0%) | $40,278 |
| 2 Earners | 15 (40.5%) | $98,542 |
| 3+ Earners | 2 (5.4%) | $0 |
| Total | 37 (100.0%) | $0 |
Household Income in Linndale
Household Income Brackets in Linndale
With 18 households falling in the category, the $75,000 to $99,999 income range is the most frequent in Linndale, accounting for 26.5% of all households.
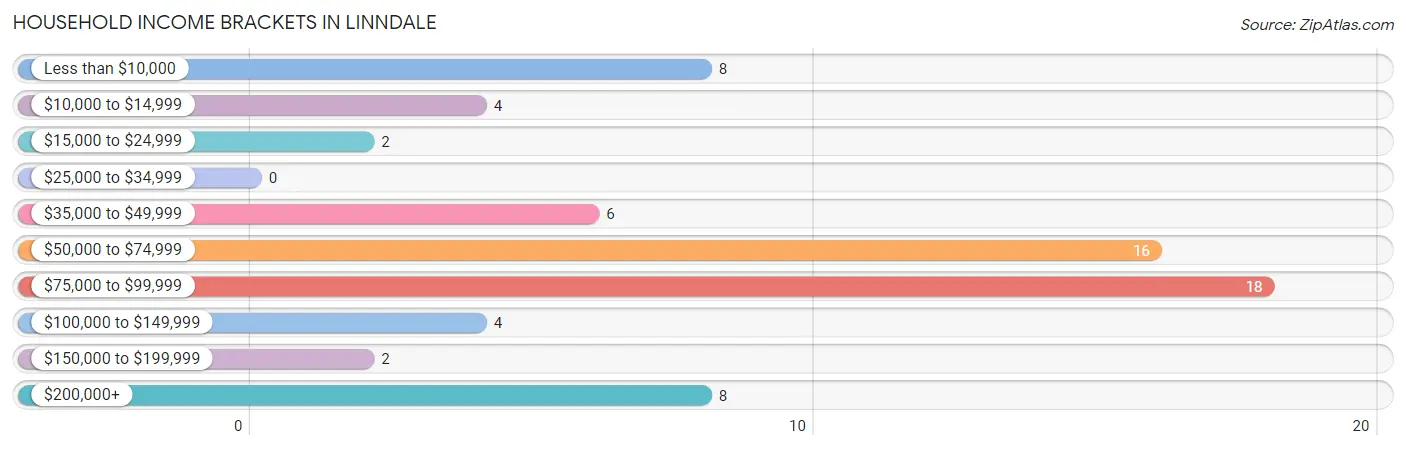
| Income Bracket | # Households | % Households |
| Less than $10,000 | 8 | 11.8% |
| $10,000 to $14,999 | 4 | 5.9% |
| $15,000 to $24,999 | 2 | 2.9% |
| $25,000 to $34,999 | 0 | 0.0% |
| $35,000 to $49,999 | 6 | 8.8% |
| $50,000 to $74,999 | 16 | 23.5% |
| $75,000 to $99,999 | 18 | 26.5% |
| $100,000 to $149,999 | 4 | 5.9% |
| $150,000 to $199,999 | 2 | 2.9% |
| $200,000+ | 8 | 11.8% |
Household Income by Householder Age in Linndale
The median household income in Linndale is $71,786, with the highest median household income of $75,804 found in the 25 to 44 years age bracket for the primary householder. A total of 35 households (51.5%) fall into this category.
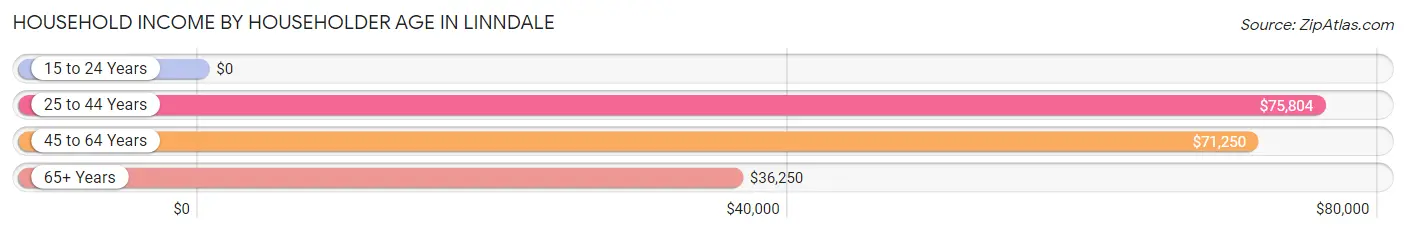
| Income Bracket | # Households | Median Income |
| 15 to 24 Years | 0 (0.0%) | $0 |
| 25 to 44 Years | 35 (51.5%) | $75,804 |
| 45 to 64 Years | 23 (33.8%) | $71,250 |
| 65+ Years | 10 (14.7%) | $36,250 |
| Total | 68 (100.0%) | $71,786 |
Poverty in Linndale
Income Below Poverty by Sex and Age in Linndale
With 14.4% poverty level for males and 23.5% for females among the residents of Linndale, 6 to 11 year old males and 6 to 11 year old females are the most vulnerable to poverty, with 6 males (54.5%) and 5 females (100.0%) in their respective age groups living below the poverty level.
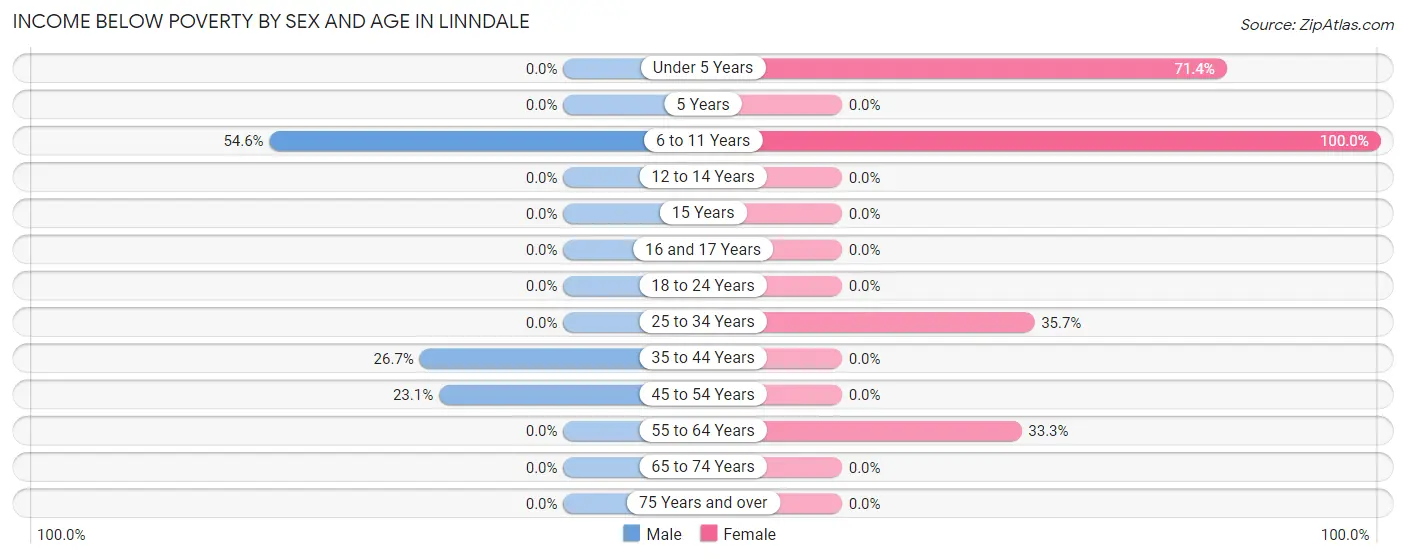
| Age Bracket | Male | Female |
| Under 5 Years | 0 (0.0%) | 5 (71.4%) |
| 5 Years | 0 (0.0%) | 0 (0.0%) |
| 6 to 11 Years | 6 (54.5%) | 5 (100.0%) |
| 12 to 14 Years | 0 (0.0%) | 0 (0.0%) |
| 15 Years | 0 (0.0%) | 0 (0.0%) |
| 16 and 17 Years | 0 (0.0%) | 0 (0.0%) |
| 18 to 24 Years | 0 (0.0%) | 0 (0.0%) |
| 25 to 34 Years | 0 (0.0%) | 5 (35.7%) |
| 35 to 44 Years | 16 (26.7%) | 0 (0.0%) |
| 45 to 54 Years | 6 (23.1%) | 0 (0.0%) |
| 55 to 64 Years | 0 (0.0%) | 4 (33.3%) |
| 65 to 74 Years | 0 (0.0%) | 0 (0.0%) |
| 75 Years and over | 0 (0.0%) | 0 (0.0%) |
| Total | 28 (14.4%) | 19 (23.5%) |
Income Above Poverty by Sex and Age in Linndale
According to the poverty statistics in Linndale, males aged under 5 years and females aged 15 years are the age groups that are most secure financially, with 100.0% of males and 100.0% of females in these age groups living above the poverty line.
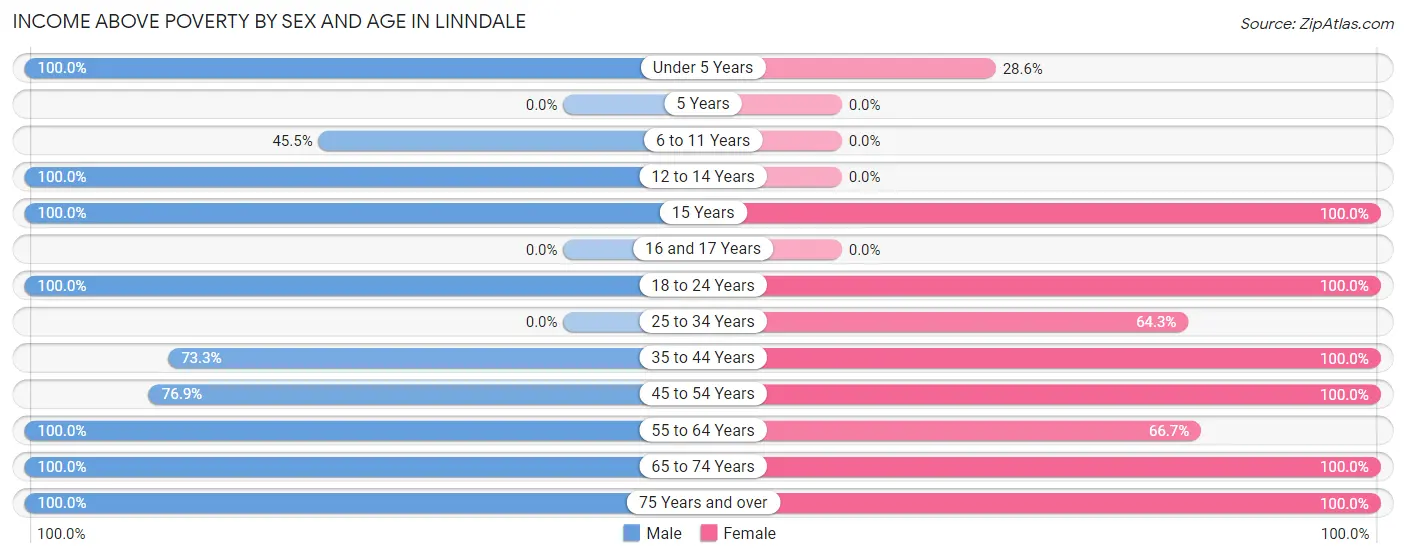
| Age Bracket | Male | Female |
| Under 5 Years | 41 (100.0%) | 2 (28.6%) |
| 5 Years | 0 (0.0%) | 0 (0.0%) |
| 6 to 11 Years | 5 (45.5%) | 0 (0.0%) |
| 12 to 14 Years | 3 (100.0%) | 0 (0.0%) |
| 15 Years | 21 (100.0%) | 1 (100.0%) |
| 16 and 17 Years | 0 (0.0%) | 0 (0.0%) |
| 18 to 24 Years | 2 (100.0%) | 2 (100.0%) |
| 25 to 34 Years | 0 (0.0%) | 9 (64.3%) |
| 35 to 44 Years | 44 (73.3%) | 25 (100.0%) |
| 45 to 54 Years | 20 (76.9%) | 4 (100.0%) |
| 55 to 64 Years | 17 (100.0%) | 8 (66.7%) |
| 65 to 74 Years | 6 (100.0%) | 4 (100.0%) |
| 75 Years and over | 8 (100.0%) | 7 (100.0%) |
| Total | 167 (85.6%) | 62 (76.5%) |
Income Below Poverty Among Married-Couple Families in Linndale
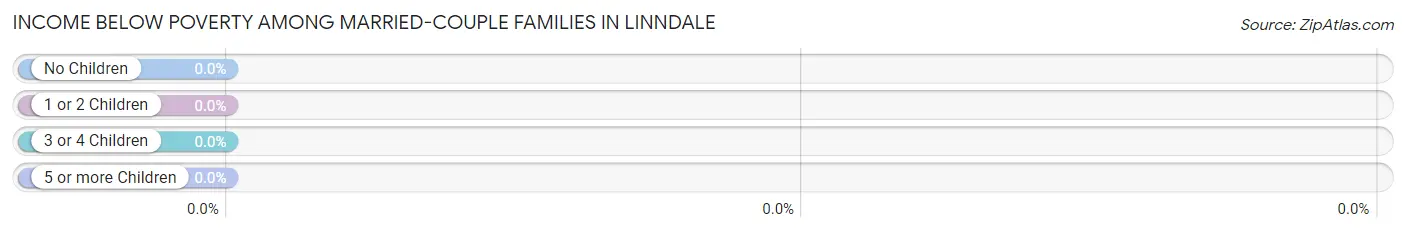
| Children | Above Poverty | Below Poverty |
| No Children | 15 (100.0%) | 0 (0.0%) |
| 1 or 2 Children | 4 (100.0%) | 0 (0.0%) |
| 3 or 4 Children | 0 (0.0%) | 0 (0.0%) |
| 5 or more Children | 0 (0.0%) | 0 (0.0%) |
| Total | 19 (100.0%) | 0 (0.0%) |
Income Below Poverty Among Single-Parent Households in Linndale
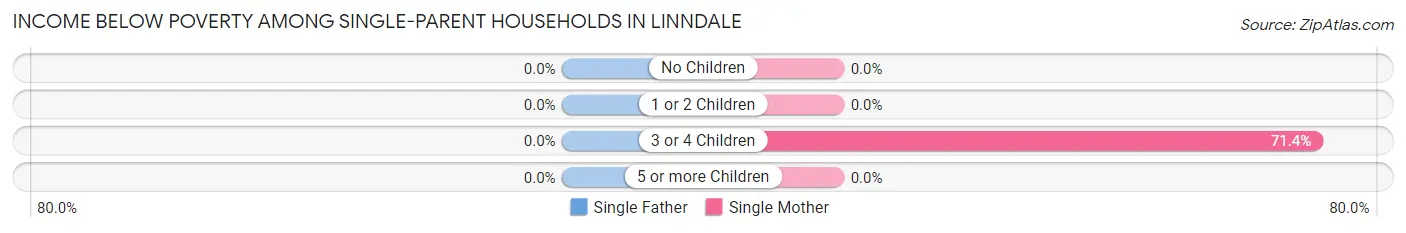
| Children | Single Father | Single Mother |
| No Children | 0 (0.0%) | 0 (0.0%) |
| 1 or 2 Children | 0 (0.0%) | 0 (0.0%) |
| 3 or 4 Children | 0 (0.0%) | 5 (71.4%) |
| 5 or more Children | 0 (0.0%) | 0 (0.0%) |
| Total | 0 (0.0%) | 5 (27.8%) |
Income Below Poverty Among Married-Couple vs Single-Parent Households in Linndale
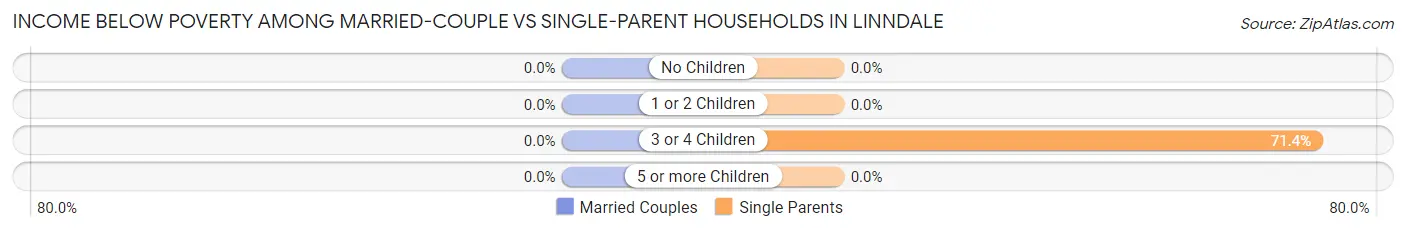
| Children | Married-Couple Families | Single-Parent Households |
| No Children | 0 (0.0%) | 0 (0.0%) |
| 1 or 2 Children | 0 (0.0%) | 0 (0.0%) |
| 3 or 4 Children | 0 (0.0%) | 5 (71.4%) |
| 5 or more Children | 0 (0.0%) | 0 (0.0%) |
| Total | 0 (0.0%) | 5 (27.8%) |
Race in Linndale
The most populous races in Linndale are Hispanic or Latino (135 | 48.9%), White / Caucasian (127 | 46.0%), and Some other Race (115 | 41.7%).
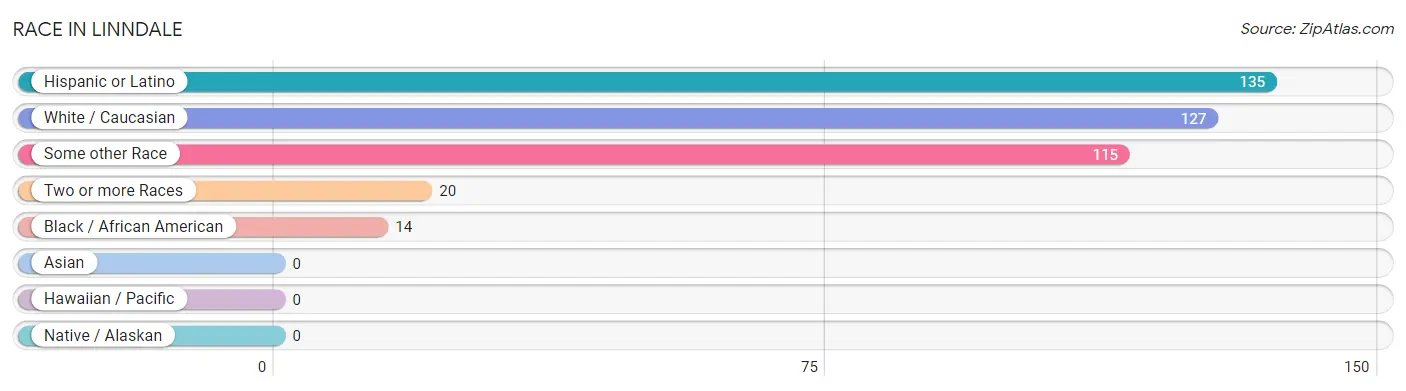
| Race | # Population | % Population |
| Asian | 0 | 0.0% |
| Black / African American | 14 | 5.1% |
| Hawaiian / Pacific | 0 | 0.0% |
| Hispanic or Latino | 135 | 48.9% |
| Native / Alaskan | 0 | 0.0% |
| White / Caucasian | 127 | 46.0% |
| Two or more Races | 20 | 7.2% |
| Some other Race | 115 | 41.7% |
| Total | 276 | 100.0% |
Ancestry in Linndale
The most populous ancestries reported in Linndale are Puerto Rican (128 | 46.4%), Irish (44 | 15.9%), Polish (35 | 12.7%), German (31 | 11.2%), and Italian (23 | 8.3%), together accounting for 94.6% of all Linndale residents.
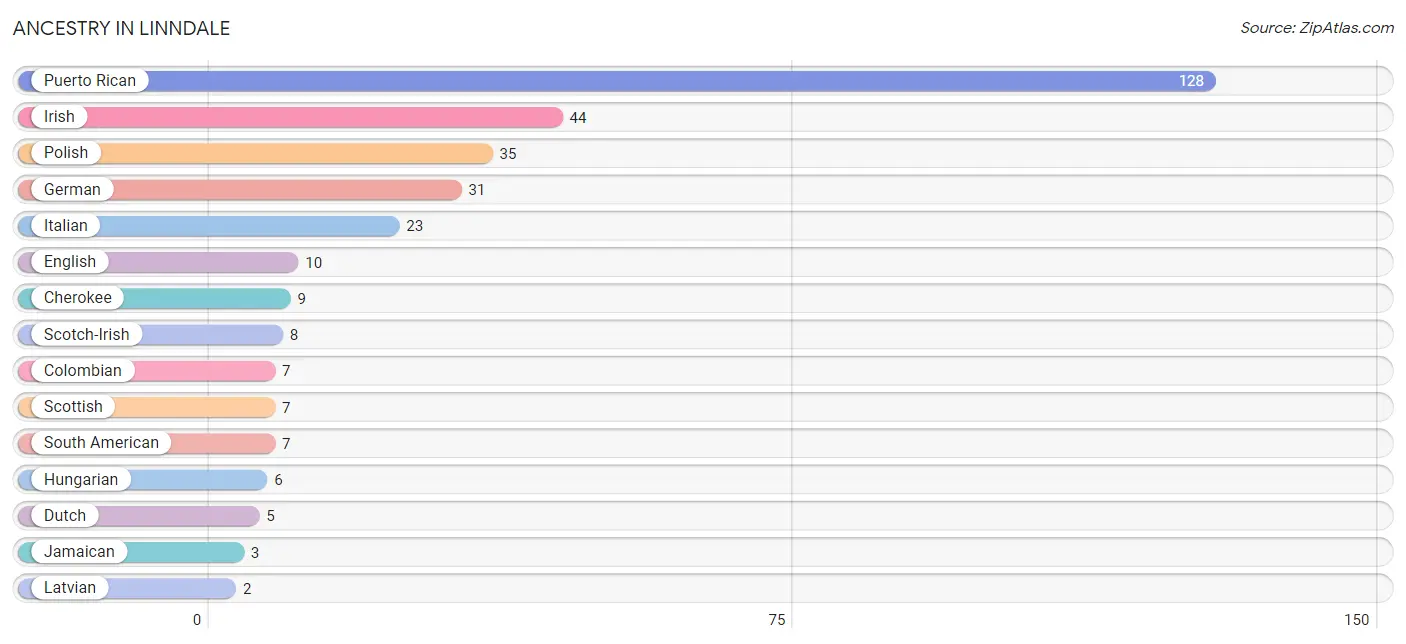
| Ancestry | # Population | % Population |
| Cherokee | 9 | 3.3% |
| Colombian | 7 | 2.5% |
| Dutch | 5 | 1.8% |
| English | 10 | 3.6% |
| German | 31 | 11.2% |
| Hungarian | 6 | 2.2% |
| Irish | 44 | 15.9% |
| Italian | 23 | 8.3% |
| Jamaican | 3 | 1.1% |
| Latvian | 2 | 0.7% |
| Polish | 35 | 12.7% |
| Puerto Rican | 128 | 46.4% |
| Russian | 2 | 0.7% |
| Scotch-Irish | 8 | 2.9% |
| Scottish | 7 | 2.5% |
| South American | 7 | 2.5% | View All 16 Rows |
Immigrants in Linndale

| Immigration Origin | # Population | % Population | View All 0 Rows |
Sex and Age in Linndale
Sex and Age in Linndale
The most populous age groups in Linndale are 35 to 39 Years (43 | 22.1%) for men and 40 to 44 Years (19 | 23.5%) for women.
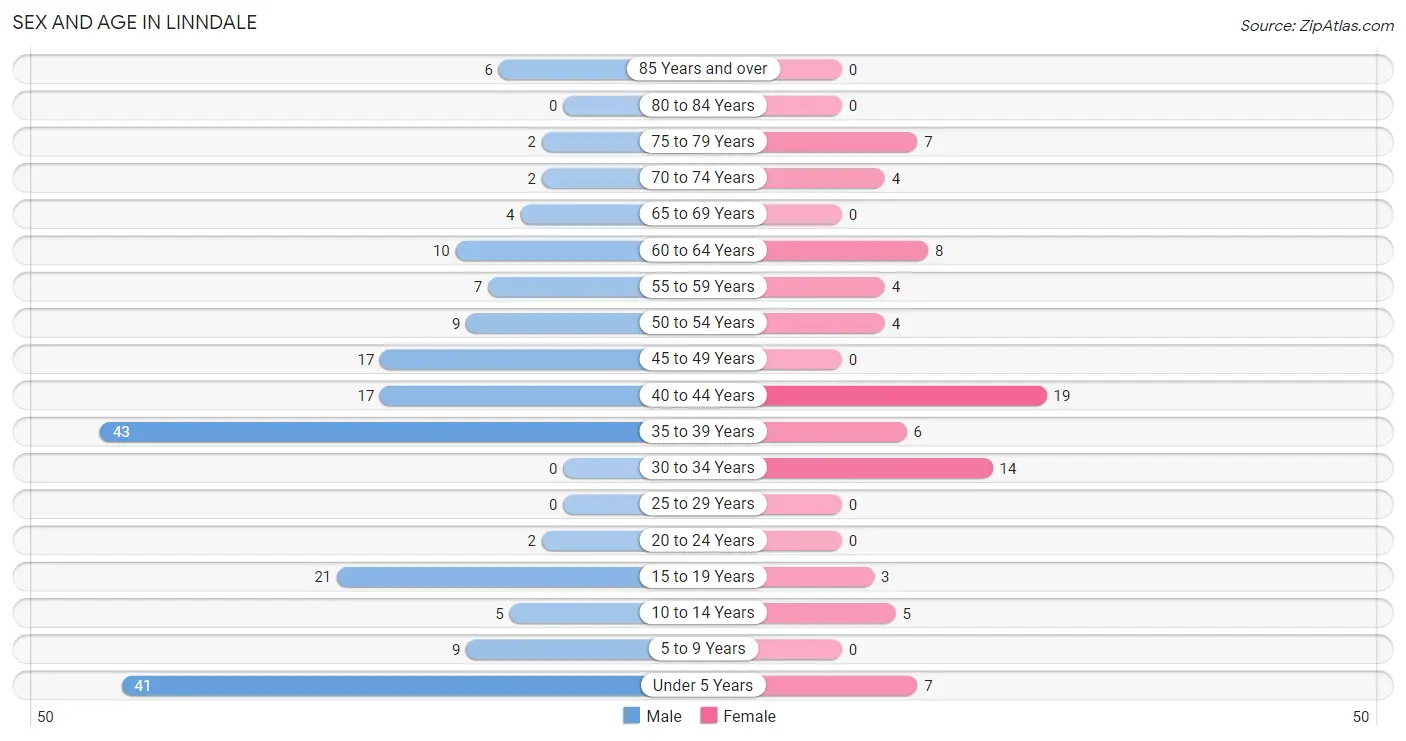
| Age Bracket | Male | Female |
| Under 5 Years | 41 (21.0%) | 7 (8.6%) |
| 5 to 9 Years | 9 (4.6%) | 0 (0.0%) |
| 10 to 14 Years | 5 (2.6%) | 5 (6.2%) |
| 15 to 19 Years | 21 (10.8%) | 3 (3.7%) |
| 20 to 24 Years | 2 (1.0%) | 0 (0.0%) |
| 25 to 29 Years | 0 (0.0%) | 0 (0.0%) |
| 30 to 34 Years | 0 (0.0%) | 14 (17.3%) |
| 35 to 39 Years | 43 (22.1%) | 6 (7.4%) |
| 40 to 44 Years | 17 (8.7%) | 19 (23.5%) |
| 45 to 49 Years | 17 (8.7%) | 0 (0.0%) |
| 50 to 54 Years | 9 (4.6%) | 4 (4.9%) |
| 55 to 59 Years | 7 (3.6%) | 4 (4.9%) |
| 60 to 64 Years | 10 (5.1%) | 8 (9.9%) |
| 65 to 69 Years | 4 (2.1%) | 0 (0.0%) |
| 70 to 74 Years | 2 (1.0%) | 4 (4.9%) |
| 75 to 79 Years | 2 (1.0%) | 7 (8.6%) |
| 80 to 84 Years | 0 (0.0%) | 0 (0.0%) |
| 85 Years and over | 6 (3.1%) | 0 (0.0%) |
| Total | 195 (100.0%) | 81 (100.0%) |
Families and Households in Linndale
Median Family Size in Linndale
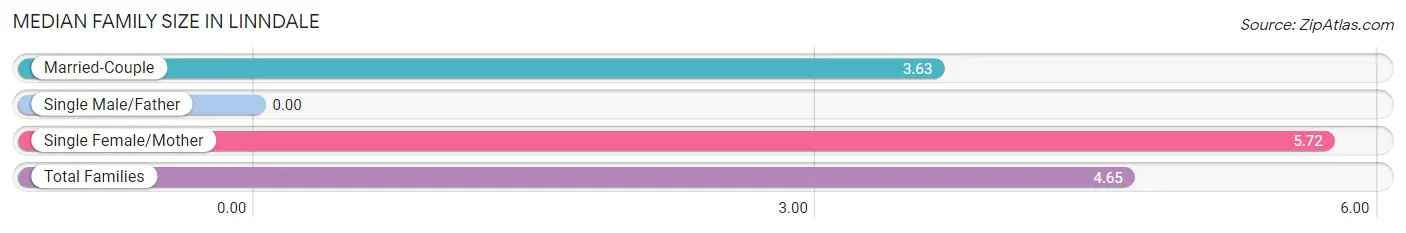
| Family Type | # Families | Family Size |
| Married-Couple | 19 (51.3%) | 3.63 |
| Single Male/Father | 0 (0.0%) | - |
| Single Female/Mother | 18 (48.6%) | 5.72 |
| Total Families | 37 (100.0%) | 4.65 |
Median Household Size in Linndale
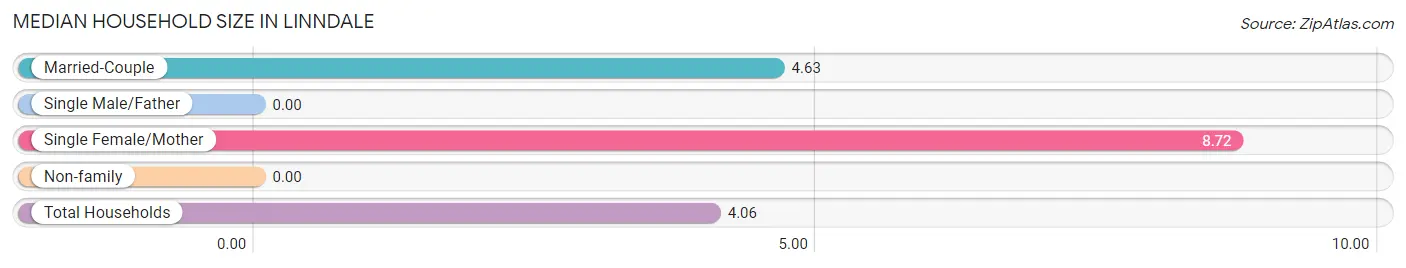
| Household Type | # Households | Household Size |
| Married-Couple | 19 (27.9%) | 4.63 |
| Single Male/Father | 0 (0.0%) | - |
| Single Female/Mother | 18 (26.5%) | 8.72 |
| Non-family | 31 (45.6%) | - |
| Total Households | 68 (100.0%) | 4.06 |
Household Size by Marriage Status in Linndale
Out of a total of 68 households in Linndale, 37 (54.4%) are family households, while 31 (45.6%) are nonfamily households. The most numerous type of family households are 4-person households, comprising 11, and the most common type of nonfamily households are 1-person households, comprising 31.
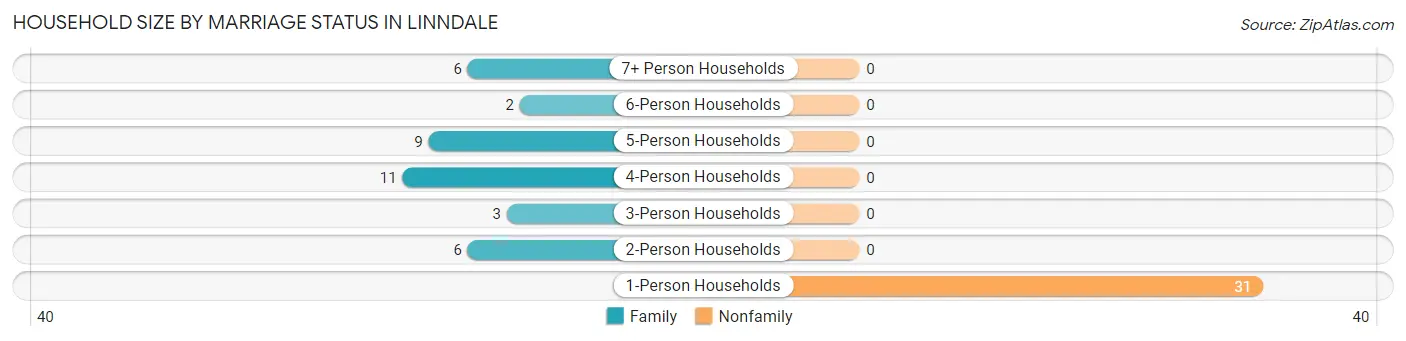
| Household Size | Family Households | Nonfamily Households |
| 1-Person Households | - | 31 (45.6%) |
| 2-Person Households | 6 (8.8%) | 0 (0.0%) |
| 3-Person Households | 3 (4.4%) | 0 (0.0%) |
| 4-Person Households | 11 (16.2%) | 0 (0.0%) |
| 5-Person Households | 9 (13.2%) | 0 (0.0%) |
| 6-Person Households | 2 (2.9%) | 0 (0.0%) |
| 7+ Person Households | 6 (8.8%) | 0 (0.0%) |
| Total | 37 (54.4%) | 31 (45.6%) |
Female Fertility in Linndale
Fertility by Age in Linndale
Average fertility rate in Linndale is 143.0 births per 1,000 women. Women in the age bracket of 20 to 34 years have the highest fertility rate with 429.0 births per 1,000 women. Women in the age bracket of 20 to 34 years acount for 100.0% of all women with births.
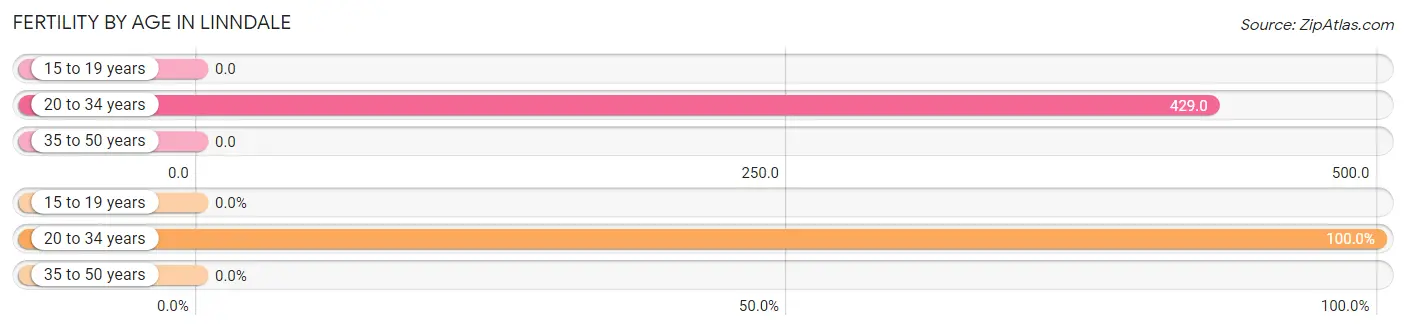
| Age Bracket | Women with Births | Births / 1,000 Women |
| 15 to 19 years | 0 (0.0%) | 0.0 |
| 20 to 34 years | 6 (100.0%) | 429.0 |
| 35 to 50 years | 0 (0.0%) | 0.0 |
| Total | 6 (100.0%) | 143.0 |
Fertility by Age by Marriage Status in Linndale
50.0% of women with births (6) in Linndale are married. The highest percentage of unmarried women with births falls into 20 to 34 years age bracket with 50.0% of them unmarried at the time of birth, while the lowest percentage of unmarried women with births belong to 20 to 34 years age bracket with 50.0% of them unmarried.
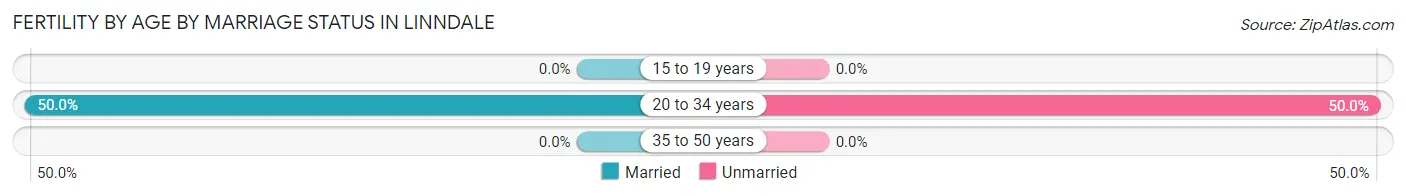
| Age Bracket | Married | Unmarried |
| 15 to 19 years | 0 (0.0%) | 0 (0.0%) |
| 20 to 34 years | 3 (50.0%) | 3 (50.0%) |
| 35 to 50 years | 0 (0.0%) | 0 (0.0%) |
| Total | 3 (50.0%) | 3 (50.0%) |
Fertility by Education in Linndale
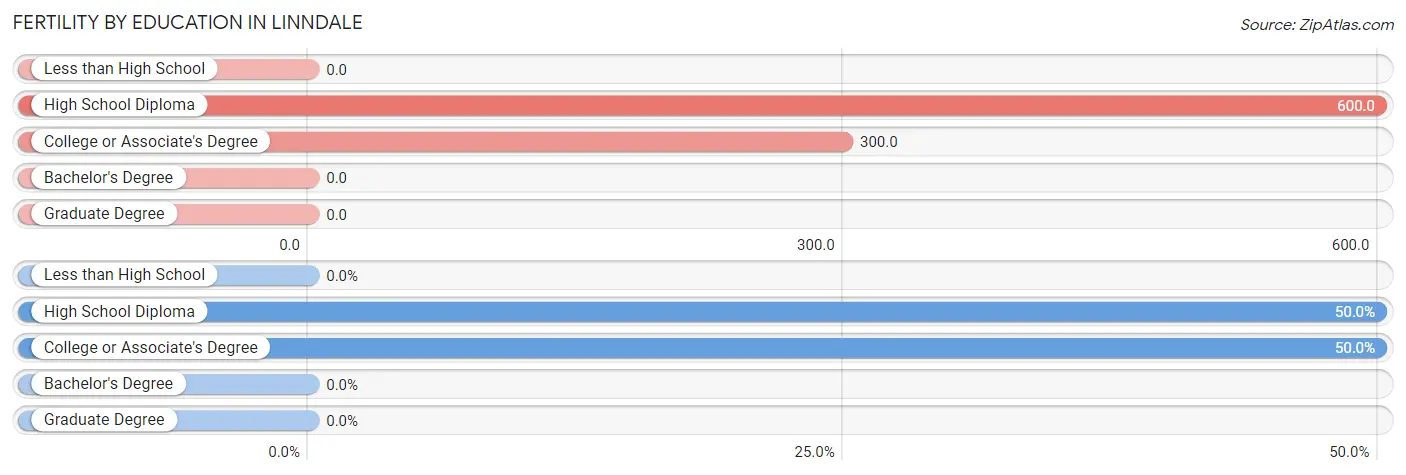
| Educational Attainment | Women with Births | Births / 1,000 Women |
| Less than High School | 0 (0.0%) | 0.0 |
| High School Diploma | 3 (50.0%) | 600.0 |
| College or Associate's Degree | 3 (50.0%) | 300.0 |
| Bachelor's Degree | 0 (0.0%) | 0.0 |
| Graduate Degree | 0 (0.0%) | 0.0 |
| Total | 6 (100.0%) | 143.0 |
Fertility by Education by Marriage Status in Linndale
50.0% of women with births in Linndale are unmarried. Women with the educational attainment of high school diploma are most likely to be married with 100.0% of them married at childbirth, while women with the educational attainment of college or associate's degree are least likely to be married with 100.0% of them unmarried at childbirth.
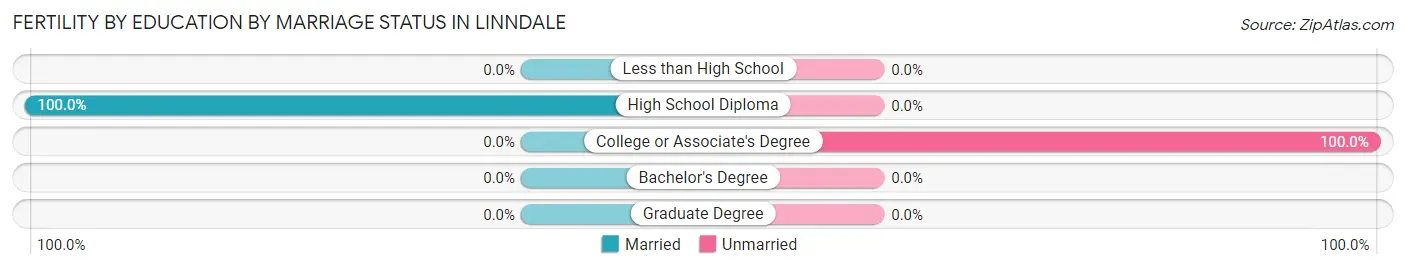
| Educational Attainment | Married | Unmarried |
| Less than High School | 0 (0.0%) | 0 (0.0%) |
| High School Diploma | 3 (100.0%) | 0 (0.0%) |
| College or Associate's Degree | 0 (0.0%) | 3 (100.0%) |
| Bachelor's Degree | 0 (0.0%) | 0 (0.0%) |
| Graduate Degree | 0 (0.0%) | 0 (0.0%) |
| Total | 3 (50.0%) | 3 (50.0%) |
Employment Characteristics in Linndale
Employment by Class of Employer in Linndale
Among the 127 employed individuals in Linndale, private company employees (72 | 56.7%), self-employed (incorporated) (13 | 10.2%), and not-for-profit organizations (13 | 10.2%) make up the most common classes of employment.
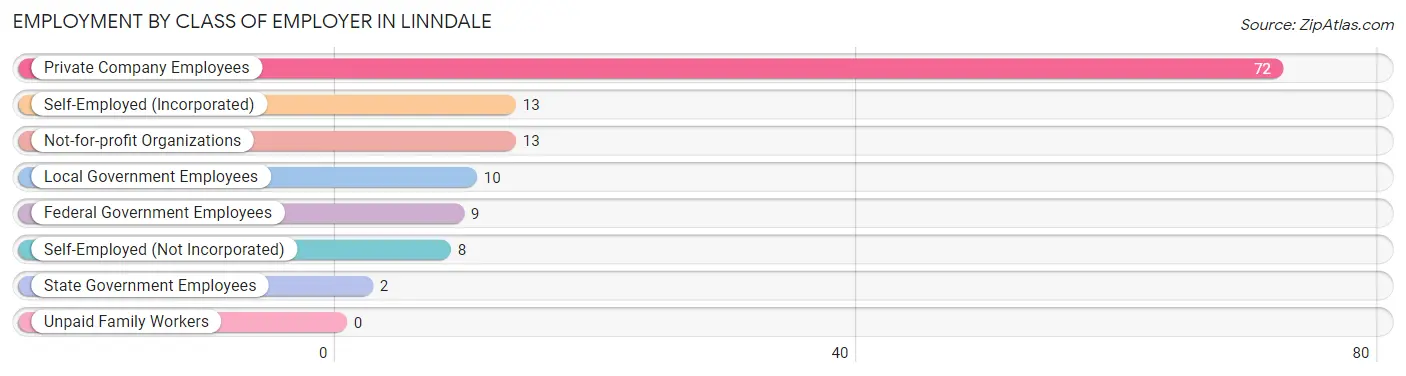
| Employer Class | # Employees | % Employees |
| Private Company Employees | 72 | 56.7% |
| Self-Employed (Incorporated) | 13 | 10.2% |
| Self-Employed (Not Incorporated) | 8 | 6.3% |
| Not-for-profit Organizations | 13 | 10.2% |
| Local Government Employees | 10 | 7.9% |
| State Government Employees | 2 | 1.6% |
| Federal Government Employees | 9 | 7.1% |
| Unpaid Family Workers | 0 | 0.0% |
| Total | 127 | 100.0% |
Employment Status by Age in Linndale
According to the labor force statistics for Linndale, out of the total population over 16 years of age (187), 78.6% or 147 individuals are in the labor force, with 8.8% or 13 of them unemployed. The age group with the highest labor force participation rate is 16 to 19 years, with 100.0% or 2 individuals in the labor force. Within the labor force, the 20 to 24 years age range has the highest percentage of unemployed individuals, with 100.0% or 2 of them being unemployed.
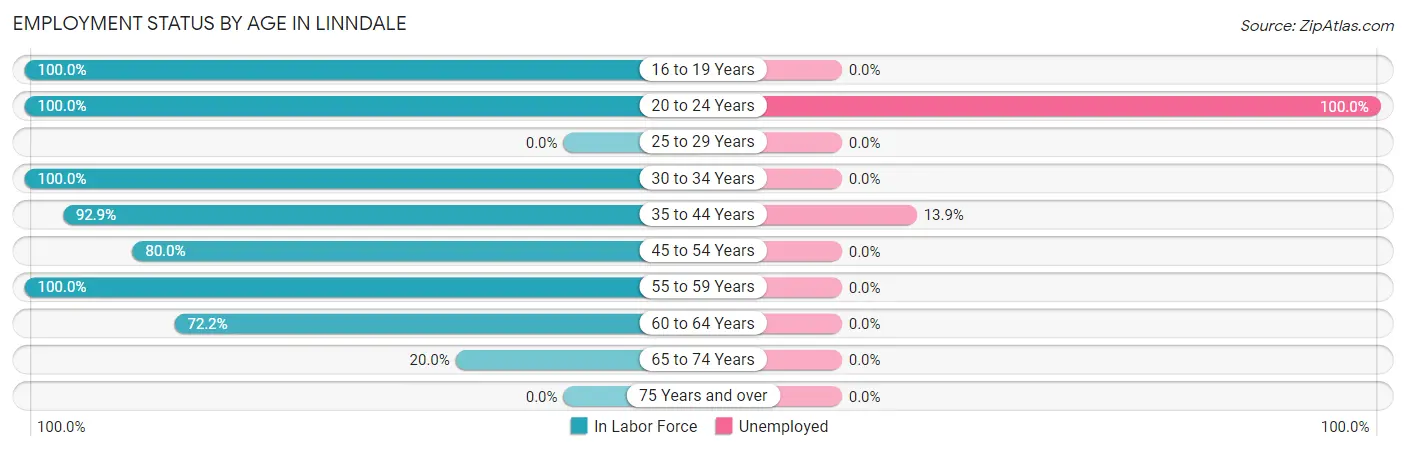
| Age Bracket | In Labor Force | Unemployed |
| 16 to 19 Years | 2 (100.0%) | 0 (0.0%) |
| 20 to 24 Years | 2 (100.0%) | 2 (100.0%) |
| 25 to 29 Years | 0 (0.0%) | 0 (0.0%) |
| 30 to 34 Years | 14 (100.0%) | 0 (0.0%) |
| 35 to 44 Years | 79 (92.9%) | 11 (13.9%) |
| 45 to 54 Years | 24 (80.0%) | 0 (0.0%) |
| 55 to 59 Years | 11 (100.0%) | 0 (0.0%) |
| 60 to 64 Years | 13 (72.2%) | 0 (0.0%) |
| 65 to 74 Years | 2 (20.0%) | 0 (0.0%) |
| 75 Years and over | 0 (0.0%) | 0 (0.0%) |
| Total | 147 (78.6%) | 13 (8.8%) |
Employment Status by Educational Attainment in Linndale
According to labor force statistics for Linndale, 89.2% of individuals (141) out of the total population between 25 and 64 years of age (158) are in the labor force, with 7.8% or 11 of them being unemployed. The group with the highest labor force participation rate are those with the educational attainment of college / associate degree, with 96.7% or 29 individuals in the labor force. Within the labor force, individuals with college / associate degree education have the highest percentage of unemployment, with 31.0% or 9 of them being unemployed.
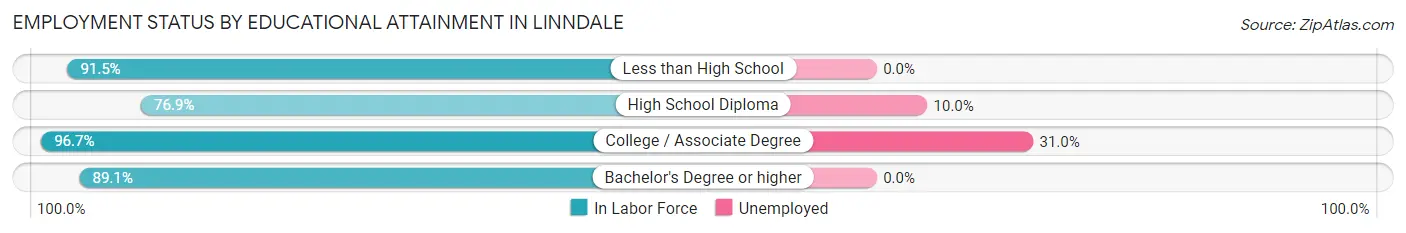
| Educational Attainment | In Labor Force | Unemployed |
| Less than High School | 43 (91.5%) | 0 (0.0%) |
| High School Diploma | 20 (76.9%) | 3 (10.0%) |
| College / Associate Degree | 29 (96.7%) | 9 (31.0%) |
| Bachelor's Degree or higher | 49 (89.1%) | 0 (0.0%) |
| Total | 141 (89.2%) | 12 (7.8%) |
Employment Occupations by Sex in Linndale
Management, Business, Science and Arts Occupations
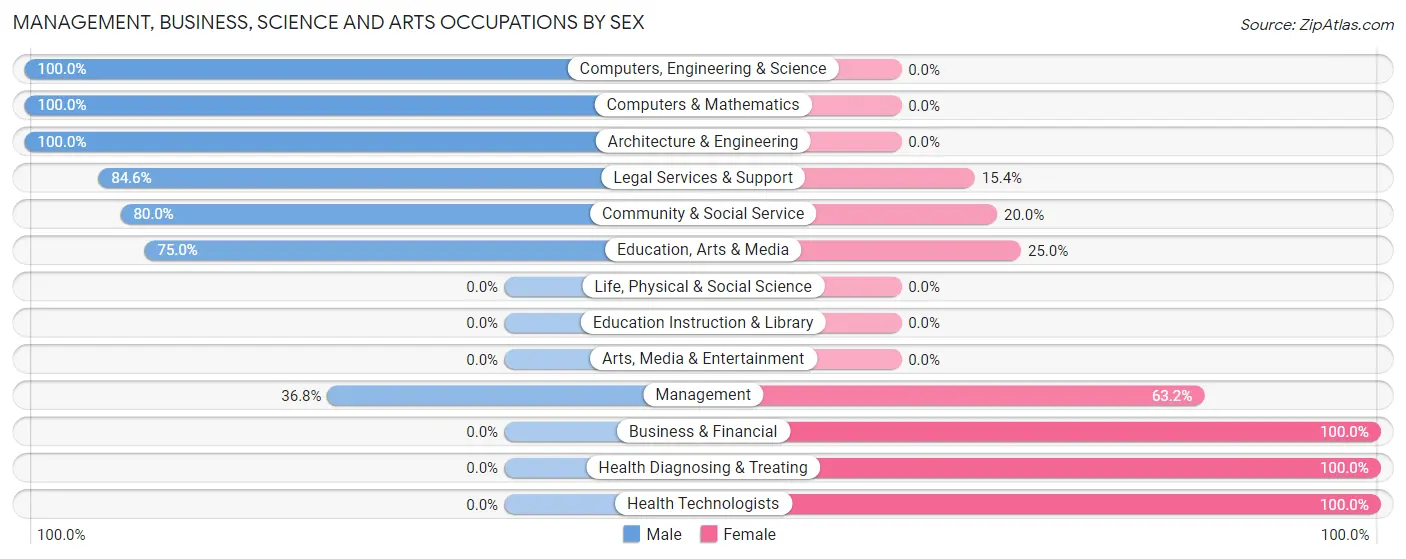
The most common Management, Business, Science and Arts occupations in Linndale are Community & Social Service (25 | 18.7%), Management (19 | 14.2%), Legal Services & Support (13 | 9.7%), Education, Arts & Media (12 | 9.0%), and Health Diagnosing & Treating (9 | 6.7%).
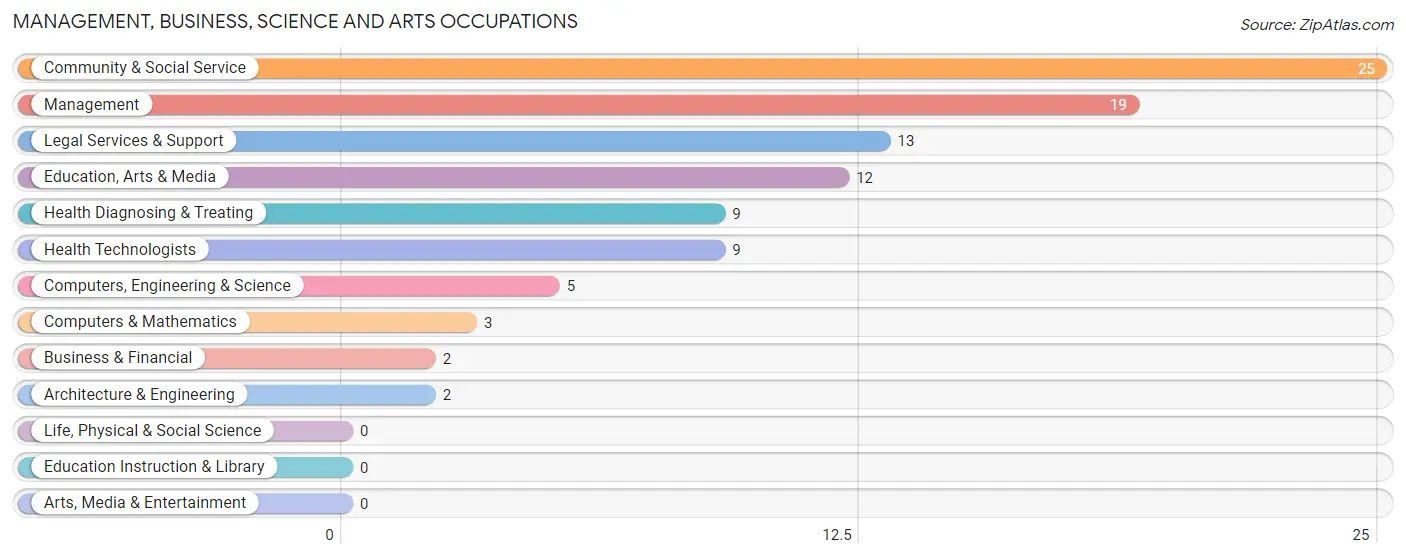
Management, Business, Science and Arts Occupations by Sex
Within the Management, Business, Science and Arts occupations in Linndale, the most male-oriented occupations are Computers, Engineering & Science (100.0%), Computers & Mathematics (100.0%), and Architecture & Engineering (100.0%), while the most female-oriented occupations are Business & Financial (100.0%), Health Diagnosing & Treating (100.0%), and Health Technologists (100.0%).
| Occupation | Male | Female |
| Management | 7 (36.8%) | 12 (63.2%) |
| Business & Financial | 0 (0.0%) | 2 (100.0%) |
| Computers, Engineering & Science | 5 (100.0%) | 0 (0.0%) |
| Computers & Mathematics | 3 (100.0%) | 0 (0.0%) |
| Architecture & Engineering | 2 (100.0%) | 0 (0.0%) |
| Life, Physical & Social Science | 0 (0.0%) | 0 (0.0%) |
| Community & Social Service | 20 (80.0%) | 5 (20.0%) |
| Education, Arts & Media | 9 (75.0%) | 3 (25.0%) |
| Legal Services & Support | 11 (84.6%) | 2 (15.4%) |
| Education Instruction & Library | 0 (0.0%) | 0 (0.0%) |
| Arts, Media & Entertainment | 0 (0.0%) | 0 (0.0%) |
| Health Diagnosing & Treating | 0 (0.0%) | 9 (100.0%) |
| Health Technologists | 0 (0.0%) | 9 (100.0%) |
| Total (Category) | 32 (53.3%) | 28 (46.7%) |
| Total (Overall) | 81 (60.5%) | 53 (39.6%) |
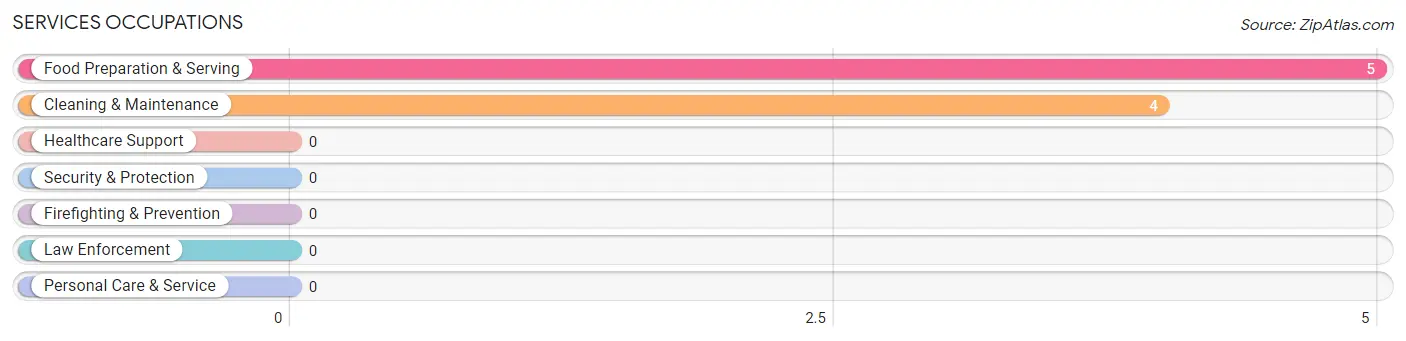
Services Occupations
The most common Services occupations in Linndale are Food Preparation & Serving (5 | 3.7%), and Cleaning & Maintenance (4 | 3.0%).
Services Occupations by Sex
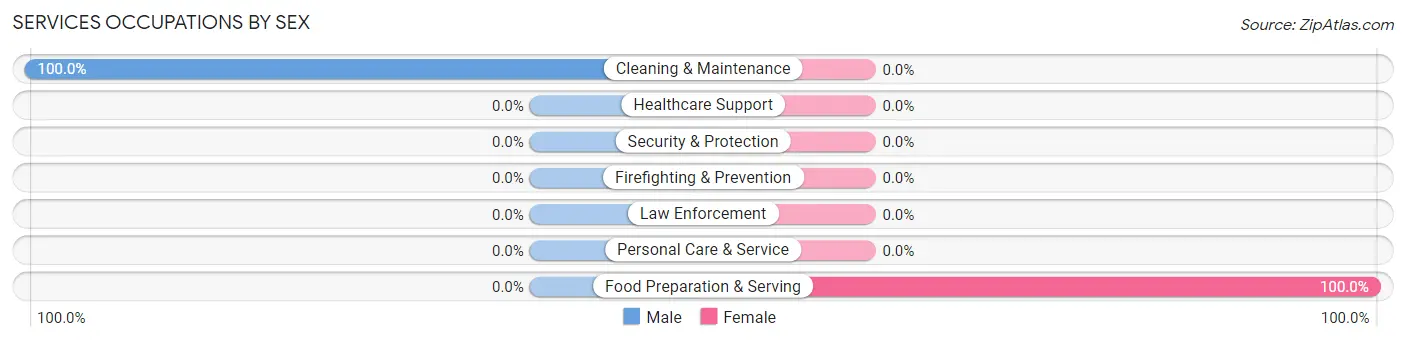
| Occupation | Male | Female |
| Healthcare Support | 0 (0.0%) | 0 (0.0%) |
| Security & Protection | 0 (0.0%) | 0 (0.0%) |
| Firefighting & Prevention | 0 (0.0%) | 0 (0.0%) |
| Law Enforcement | 0 (0.0%) | 0 (0.0%) |
| Food Preparation & Serving | 0 (0.0%) | 5 (100.0%) |
| Cleaning & Maintenance | 4 (100.0%) | 0 (0.0%) |
| Personal Care & Service | 0 (0.0%) | 0 (0.0%) |
| Total (Category) | 4 (44.4%) | 5 (55.6%) |
| Total (Overall) | 81 (60.5%) | 53 (39.6%) |
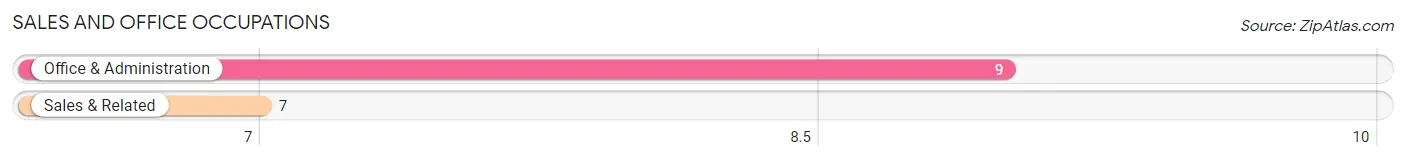
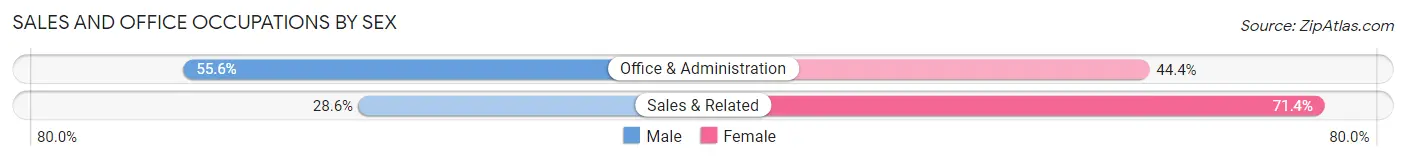
Sales and Office Occupations
The most common Sales and Office occupations in Linndale are Office & Administration (9 | 6.7%), and Sales & Related (7 | 5.2%).
Sales and Office Occupations by Sex
| Occupation | Male | Female |
| Sales & Related | 2 (28.6%) | 5 (71.4%) |
| Office & Administration | 5 (55.6%) | 4 (44.4%) |
| Total (Category) | 7 (43.8%) | 9 (56.2%) |
| Total (Overall) | 81 (60.5%) | 53 (39.6%) |
Natural Resources, Construction and Maintenance Occupations
Natural Resources, Construction and Maintenance Occupations by Sex
| Occupation | Male | Female |
| Farming, Fishing & Forestry | 0 (0.0%) | 0 (0.0%) |
| Construction & Extraction | 0 (0.0%) | 0 (0.0%) |
| Installation, Maintenance & Repair | 0 (0.0%) | 0 (0.0%) |
| Total (Category) | 0 (0.0%) | 0 (0.0%) |
| Total (Overall) | 81 (60.5%) | 53 (39.6%) |
Production, Transportation and Moving Occupations
The most common Production, Transportation and Moving occupations in Linndale are Material Moving (34 | 25.4%), and Production (15 | 11.2%).
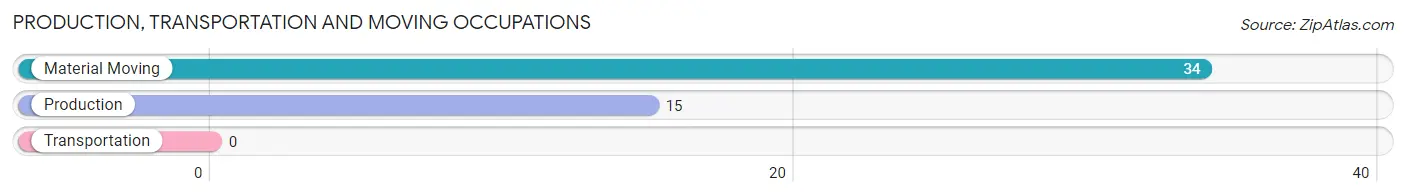
Production, Transportation and Moving Occupations by Sex
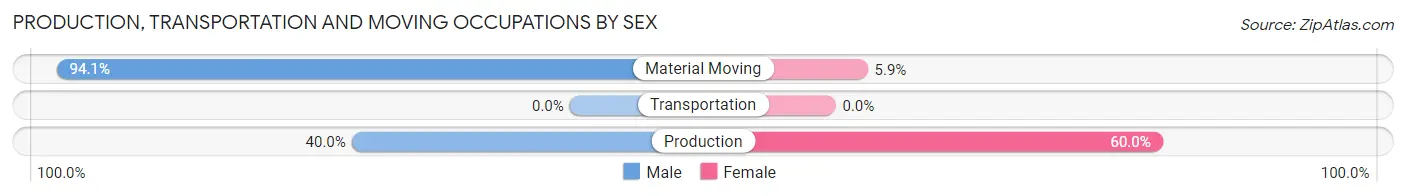
| Occupation | Male | Female |
| Production | 6 (40.0%) | 9 (60.0%) |
| Transportation | 0 (0.0%) | 0 (0.0%) |
| Material Moving | 32 (94.1%) | 2 (5.9%) |
| Total (Category) | 38 (77.5%) | 11 (22.5%) |
| Total (Overall) | 81 (60.5%) | 53 (39.6%) |
Employment Industries by Sex in Linndale
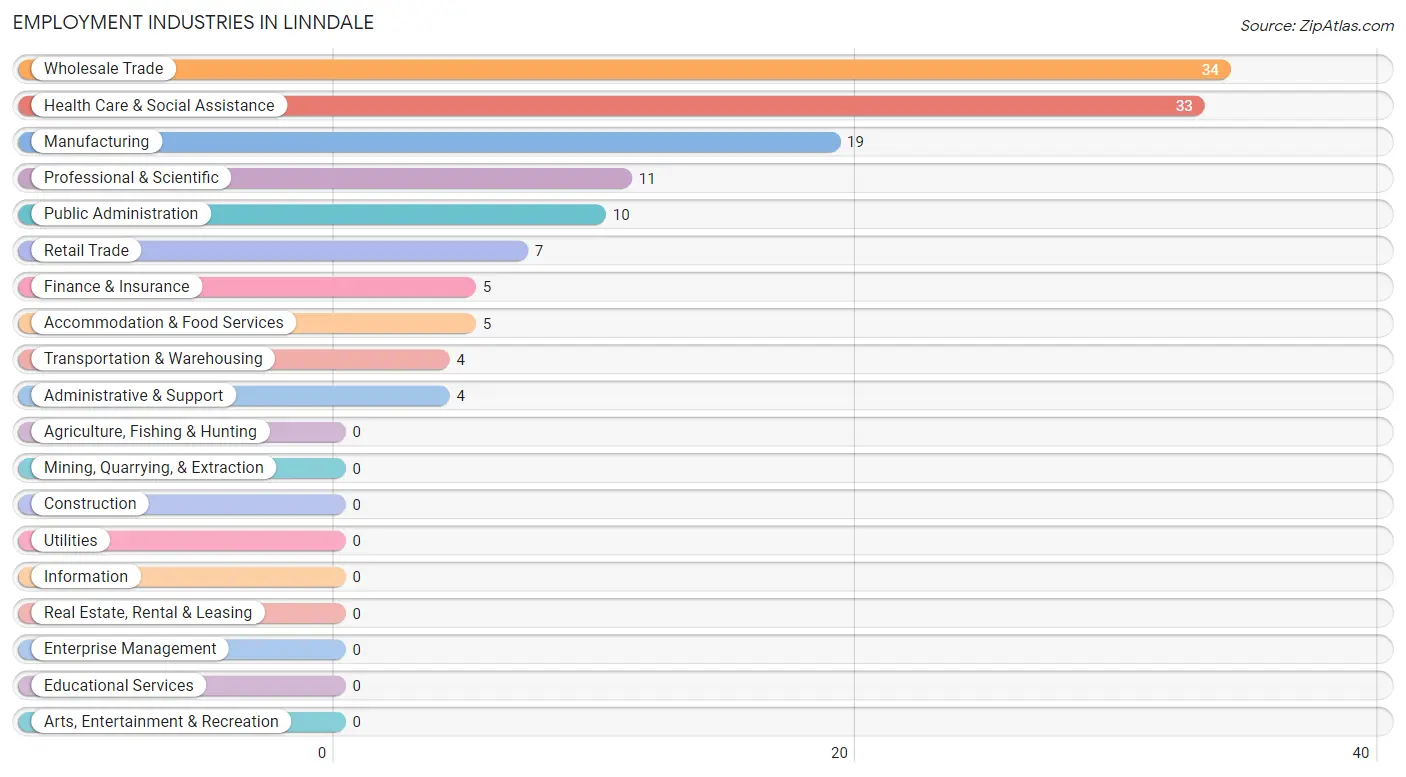
Employment Industries in Linndale
The major employment industries in Linndale include Wholesale Trade (34 | 25.4%), Health Care & Social Assistance (33 | 24.6%), Manufacturing (19 | 14.2%), Professional & Scientific (11 | 8.2%), and Public Administration (10 | 7.5%).
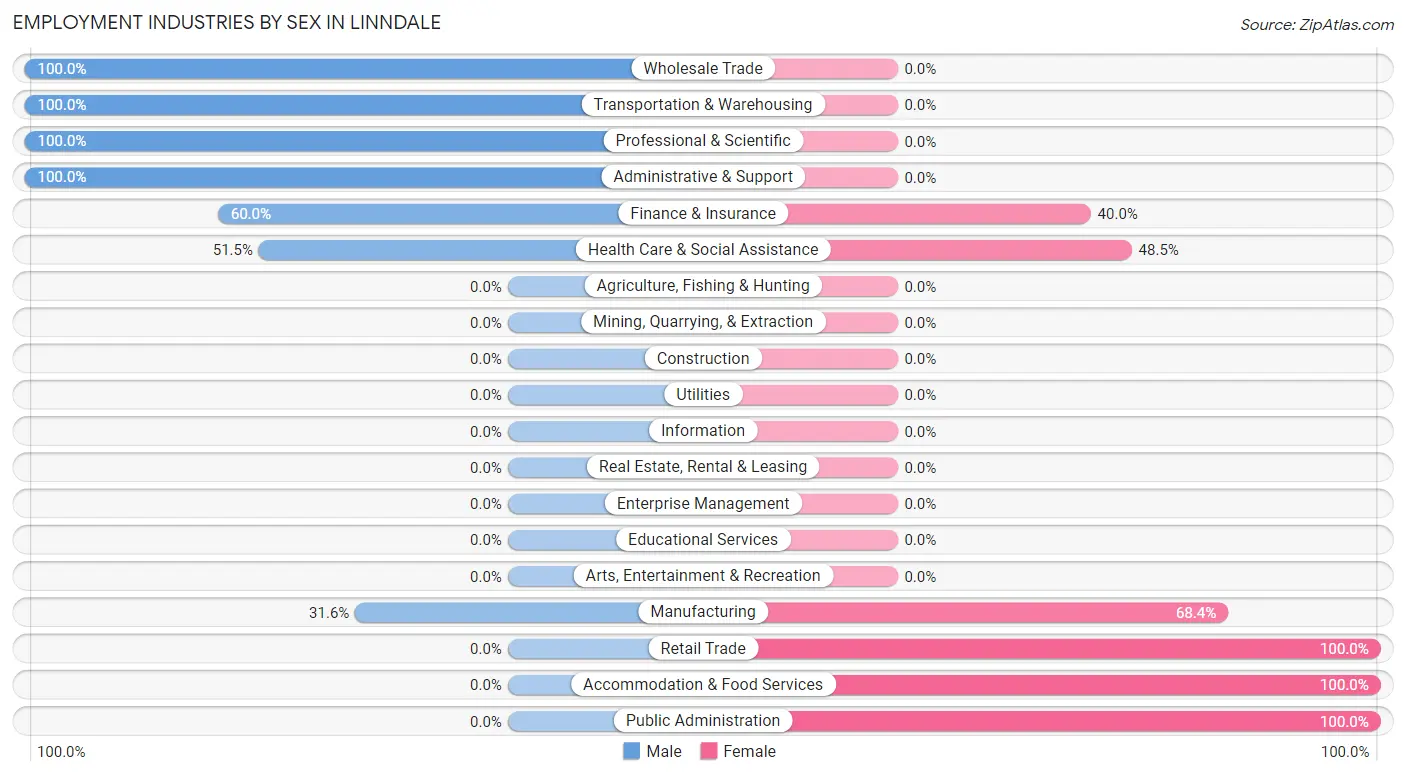
Employment Industries by Sex in Linndale
The Linndale industries that see more men than women are Wholesale Trade (100.0%), Transportation & Warehousing (100.0%), and Professional & Scientific (100.0%), whereas the industries that tend to have a higher number of women are Retail Trade (100.0%), Accommodation & Food Services (100.0%), and Public Administration (100.0%).
| Industry | Male | Female |
| Agriculture, Fishing & Hunting | 0 (0.0%) | 0 (0.0%) |
| Mining, Quarrying, & Extraction | 0 (0.0%) | 0 (0.0%) |
| Construction | 0 (0.0%) | 0 (0.0%) |
| Manufacturing | 6 (31.6%) | 13 (68.4%) |
| Wholesale Trade | 34 (100.0%) | 0 (0.0%) |
| Retail Trade | 0 (0.0%) | 7 (100.0%) |
| Transportation & Warehousing | 4 (100.0%) | 0 (0.0%) |
| Utilities | 0 (0.0%) | 0 (0.0%) |
| Information | 0 (0.0%) | 0 (0.0%) |
| Finance & Insurance | 3 (60.0%) | 2 (40.0%) |
| Real Estate, Rental & Leasing | 0 (0.0%) | 0 (0.0%) |
| Professional & Scientific | 11 (100.0%) | 0 (0.0%) |
| Enterprise Management | 0 (0.0%) | 0 (0.0%) |
| Administrative & Support | 4 (100.0%) | 0 (0.0%) |
| Educational Services | 0 (0.0%) | 0 (0.0%) |
| Health Care & Social Assistance | 17 (51.5%) | 16 (48.5%) |
| Arts, Entertainment & Recreation | 0 (0.0%) | 0 (0.0%) |
| Accommodation & Food Services | 0 (0.0%) | 5 (100.0%) |
| Public Administration | 0 (0.0%) | 10 (100.0%) |
| Total | 81 (60.5%) | 53 (39.6%) |
Education in Linndale
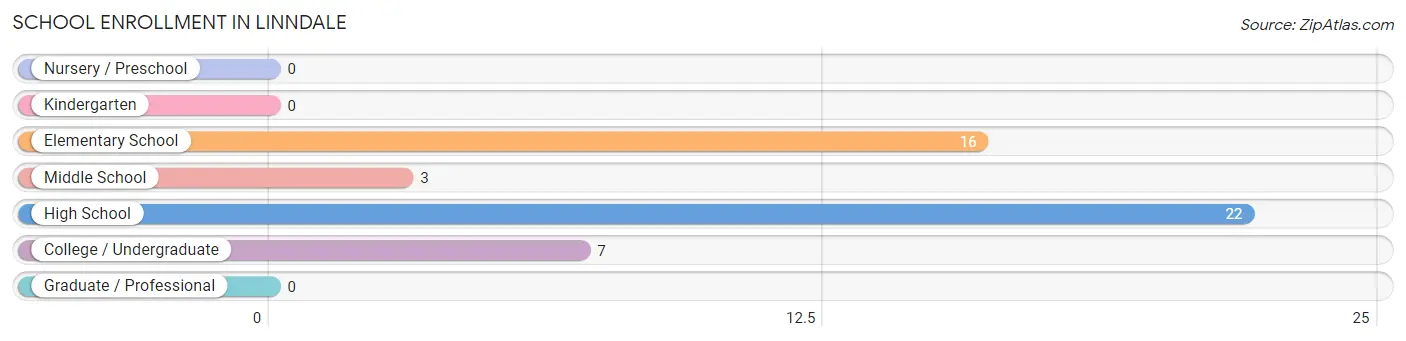
School Enrollment in Linndale
The most common levels of schooling among the 48 students in Linndale are high school (22 | 45.8%), elementary school (16 | 33.3%), and college / undergraduate (7 | 14.6%).
| School Level | # Students | % Students |
| Nursery / Preschool | 0 | 0.0% |
| Kindergarten | 0 | 0.0% |
| Elementary School | 16 | 33.3% |
| Middle School | 3 | 6.2% |
| High School | 22 | 45.8% |
| College / Undergraduate | 7 | 14.6% |
| Graduate / Professional | 0 | 0.0% |
| Total | 48 | 100.0% |
School Enrollment by Age by Funding Source in Linndale
Out of a total of 48 students who are enrolled in schools in Linndale, 5 (10.4%) attend a private institution, while the remaining 43 (89.6%) are enrolled in public schools. The age group of 18 to 19 year olds has the highest likelihood of being enrolled in private schools, with 2 (100.0% in the age bracket) enrolled. Conversely, the age group of 5 to 9 year old has the lowest likelihood of being enrolled in a private school, with 9 (100.0% in the age bracket) attending a public institution.
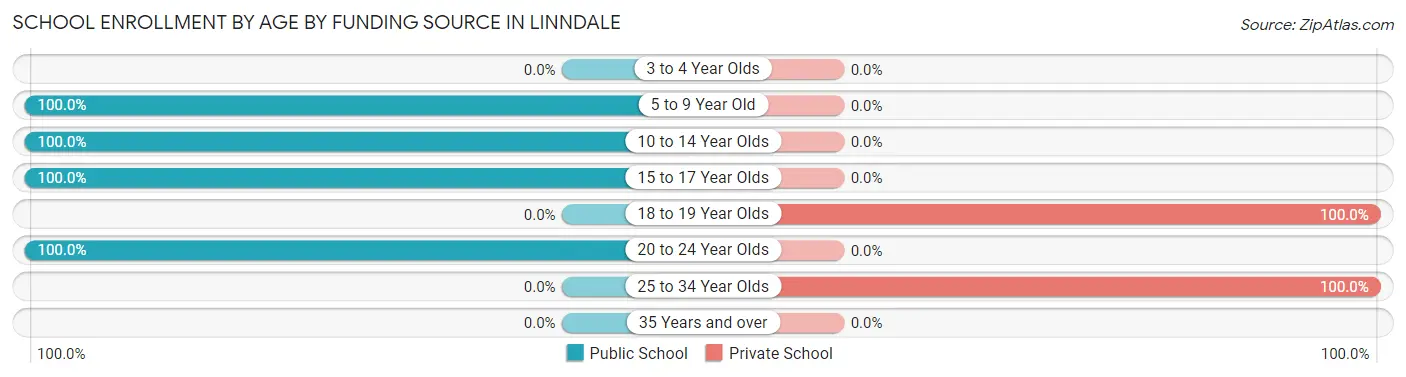
| Age Bracket | Public School | Private School |
| 3 to 4 Year Olds | 0 (0.0%) | 0 (0.0%) |
| 5 to 9 Year Old | 9 (100.0%) | 0 (0.0%) |
| 10 to 14 Year Olds | 10 (100.0%) | 0 (0.0%) |
| 15 to 17 Year Olds | 22 (100.0%) | 0 (0.0%) |
| 18 to 19 Year Olds | 0 (0.0%) | 2 (100.0%) |
| 20 to 24 Year Olds | 2 (100.0%) | 0 (0.0%) |
| 25 to 34 Year Olds | 0 (0.0%) | 3 (100.0%) |
| 35 Years and over | 0 (0.0%) | 0 (0.0%) |
| Total | 43 (89.6%) | 5 (10.4%) |
Educational Attainment by Field of Study in Linndale
Social sciences (13 | 20.6%), science & technology (13 | 20.6%), liberal arts & history (10 | 15.9%), bio, nature & agricultural (8 | 12.7%), and literature & languages (7 | 11.1%) are the most common fields of study among 63 individuals in Linndale who have obtained a bachelor's degree or higher.
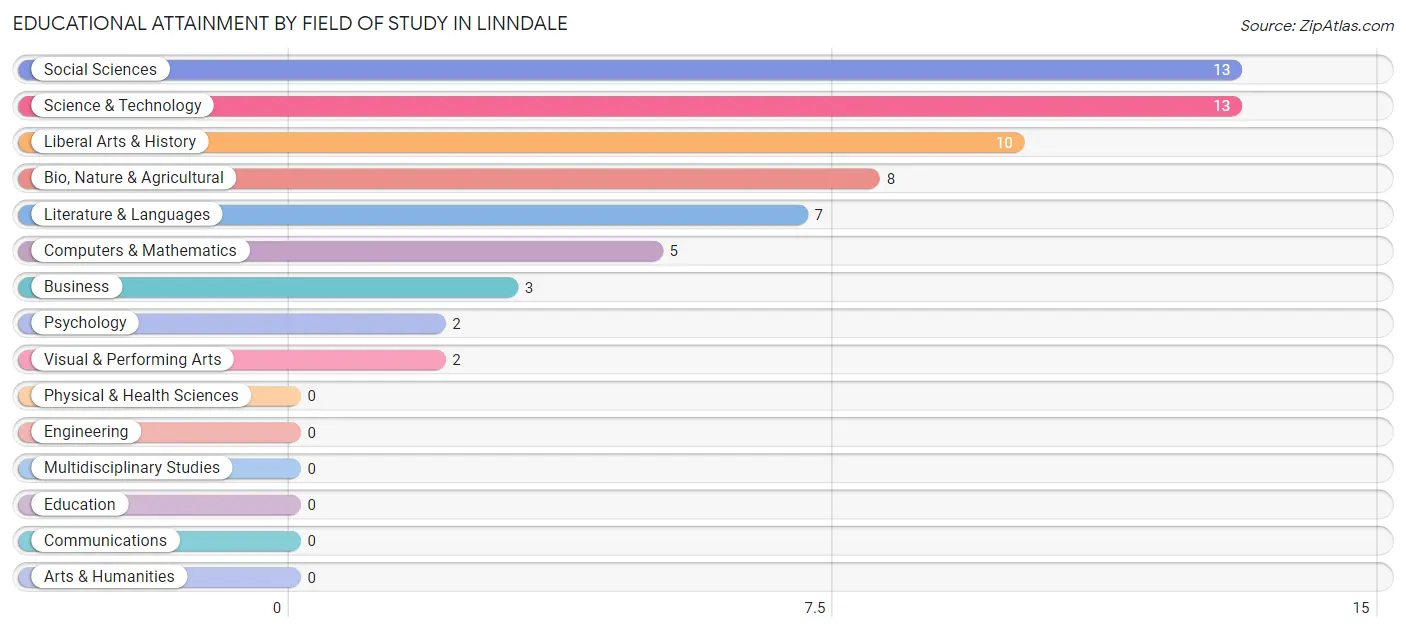
| Field of Study | # Graduates | % Graduates |
| Computers & Mathematics | 5 | 7.9% |
| Bio, Nature & Agricultural | 8 | 12.7% |
| Physical & Health Sciences | 0 | 0.0% |
| Psychology | 2 | 3.2% |
| Social Sciences | 13 | 20.6% |
| Engineering | 0 | 0.0% |
| Multidisciplinary Studies | 0 | 0.0% |
| Science & Technology | 13 | 20.6% |
| Business | 3 | 4.8% |
| Education | 0 | 0.0% |
| Literature & Languages | 7 | 11.1% |
| Liberal Arts & History | 10 | 15.9% |
| Visual & Performing Arts | 2 | 3.2% |
| Communications | 0 | 0.0% |
| Arts & Humanities | 0 | 0.0% |
| Total | 63 | 100.0% |
Transportation & Commute in Linndale
Vehicle Availability by Sex in Linndale
The most prevalent vehicle ownership categories in Linndale are males with 2 vehicles (42, accounting for 53.2%) and females with 2 vehicles (13, making up 87.5%).
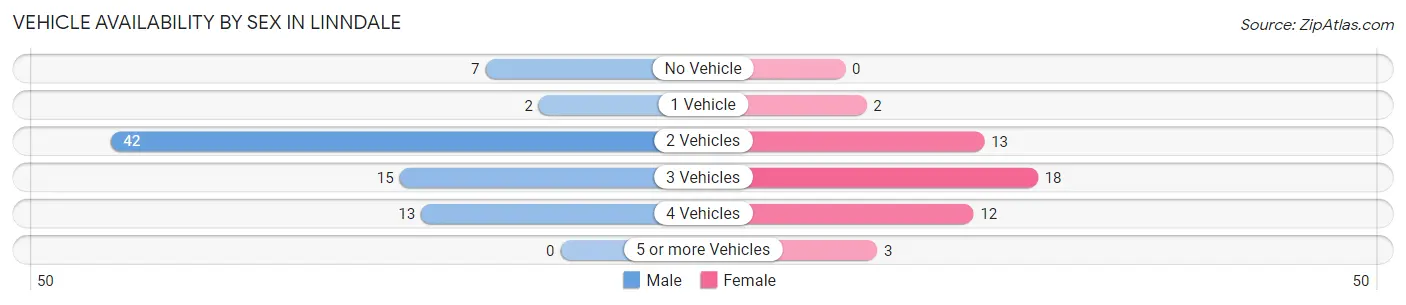
| Vehicles Available | Male | Female |
| No Vehicle | 7 (8.9%) | 0 (0.0%) |
| 1 Vehicle | 2 (2.5%) | 2 (4.2%) |
| 2 Vehicles | 42 (53.2%) | 13 (27.1%) |
| 3 Vehicles | 15 (19.0%) | 18 (37.5%) |
| 4 Vehicles | 13 (16.5%) | 12 (25.0%) |
| 5 or more Vehicles | 0 (0.0%) | 3 (6.2%) |
| Total | 79 (100.0%) | 48 (100.0%) |
Commute Time in Linndale
The most frequently occuring commute durations in Linndale are 10 to 14 minutes (55 commuters, 43.3%), 20 to 24 minutes (16 commuters, 12.6%), and 15 to 19 minutes (15 commuters, 11.8%).
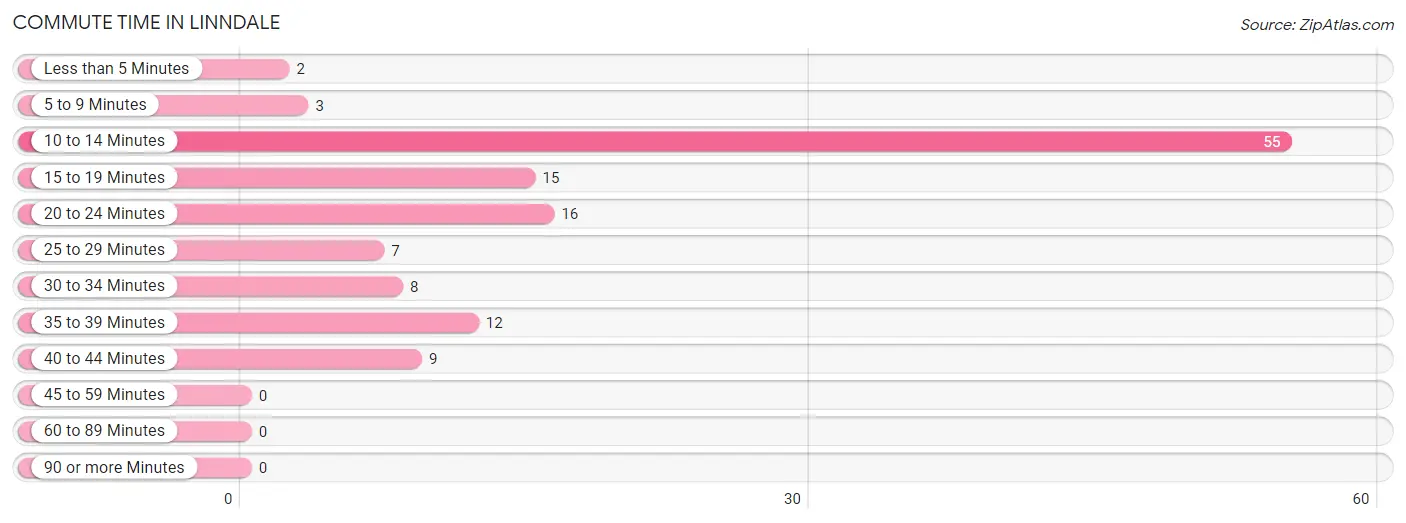
| Commute Time | # Commuters | % Commuters |
| Less than 5 Minutes | 2 | 1.6% |
| 5 to 9 Minutes | 3 | 2.4% |
| 10 to 14 Minutes | 55 | 43.3% |
| 15 to 19 Minutes | 15 | 11.8% |
| 20 to 24 Minutes | 16 | 12.6% |
| 25 to 29 Minutes | 7 | 5.5% |
| 30 to 34 Minutes | 8 | 6.3% |
| 35 to 39 Minutes | 12 | 9.5% |
| 40 to 44 Minutes | 9 | 7.1% |
| 45 to 59 Minutes | 0 | 0.0% |
| 60 to 89 Minutes | 0 | 0.0% |
| 90 or more Minutes | 0 | 0.0% |
Commute Time by Sex in Linndale
The most common commute times in Linndale are 10 to 14 minutes (41 commuters, 51.9%) for males and 10 to 14 minutes (14 commuters, 29.2%) for females.
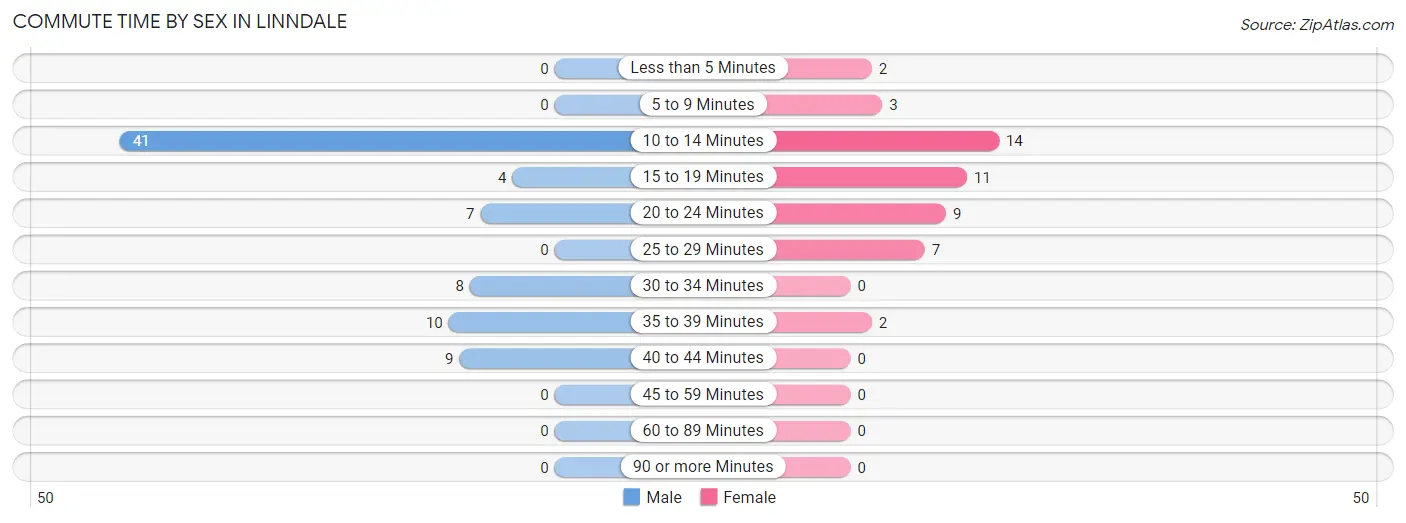
| Commute Time | Male | Female |
| Less than 5 Minutes | 0 (0.0%) | 2 (4.2%) |
| 5 to 9 Minutes | 0 (0.0%) | 3 (6.2%) |
| 10 to 14 Minutes | 41 (51.9%) | 14 (29.2%) |
| 15 to 19 Minutes | 4 (5.1%) | 11 (22.9%) |
| 20 to 24 Minutes | 7 (8.9%) | 9 (18.8%) |
| 25 to 29 Minutes | 0 (0.0%) | 7 (14.6%) |
| 30 to 34 Minutes | 8 (10.1%) | 0 (0.0%) |
| 35 to 39 Minutes | 10 (12.7%) | 2 (4.2%) |
| 40 to 44 Minutes | 9 (11.4%) | 0 (0.0%) |
| 45 to 59 Minutes | 0 (0.0%) | 0 (0.0%) |
| 60 to 89 Minutes | 0 (0.0%) | 0 (0.0%) |
| 90 or more Minutes | 0 (0.0%) | 0 (0.0%) |
Time of Departure to Work by Sex in Linndale
The most frequent times of departure to work in Linndale are 12:00 PM to 3:59 PM (49, 62.0%) for males and 7:00 AM to 7:29 AM (16, 33.3%) for females.
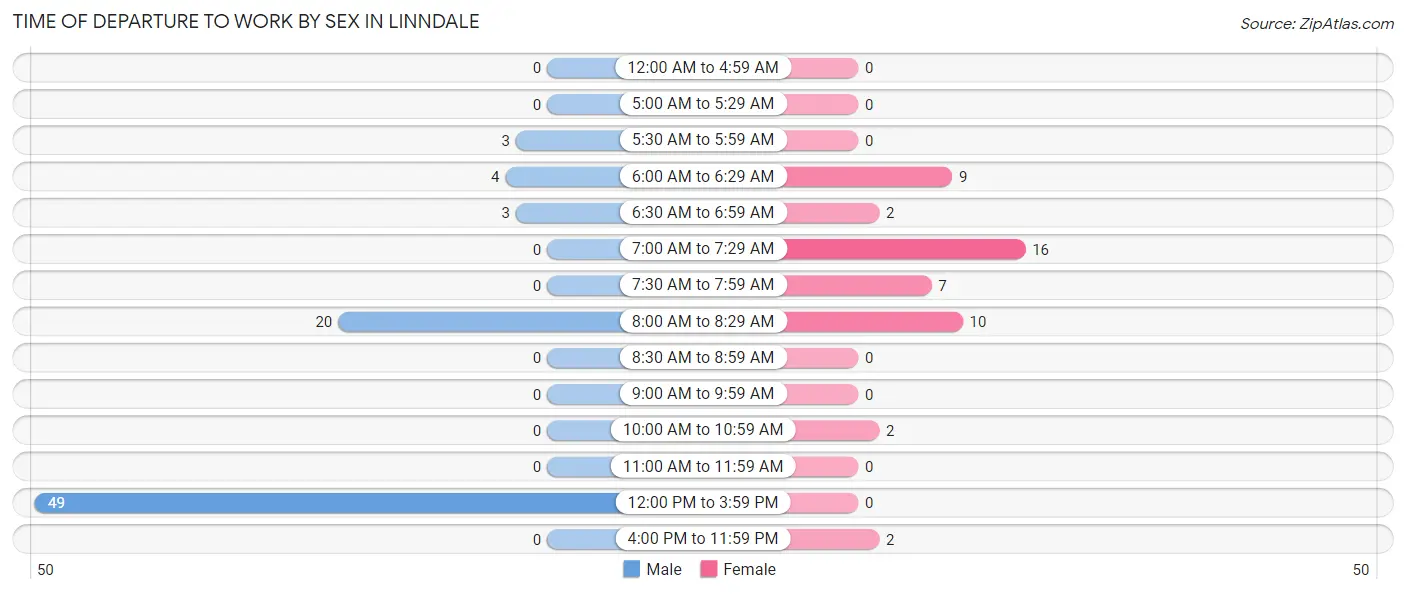
| Time of Departure | Male | Female |
| 12:00 AM to 4:59 AM | 0 (0.0%) | 0 (0.0%) |
| 5:00 AM to 5:29 AM | 0 (0.0%) | 0 (0.0%) |
| 5:30 AM to 5:59 AM | 3 (3.8%) | 0 (0.0%) |
| 6:00 AM to 6:29 AM | 4 (5.1%) | 9 (18.8%) |
| 6:30 AM to 6:59 AM | 3 (3.8%) | 2 (4.2%) |
| 7:00 AM to 7:29 AM | 0 (0.0%) | 16 (33.3%) |
| 7:30 AM to 7:59 AM | 0 (0.0%) | 7 (14.6%) |
| 8:00 AM to 8:29 AM | 20 (25.3%) | 10 (20.8%) |
| 8:30 AM to 8:59 AM | 0 (0.0%) | 0 (0.0%) |
| 9:00 AM to 9:59 AM | 0 (0.0%) | 0 (0.0%) |
| 10:00 AM to 10:59 AM | 0 (0.0%) | 2 (4.2%) |
| 11:00 AM to 11:59 AM | 0 (0.0%) | 0 (0.0%) |
| 12:00 PM to 3:59 PM | 49 (62.0%) | 0 (0.0%) |
| 4:00 PM to 11:59 PM | 0 (0.0%) | 2 (4.2%) |
| Total | 79 (100.0%) | 48 (100.0%) |
Housing Occupancy in Linndale
Occupancy by Ownership in Linndale
Of the total 68 dwellings in Linndale, owner-occupied units account for 26 (38.2%), while renter-occupied units make up 42 (61.8%).
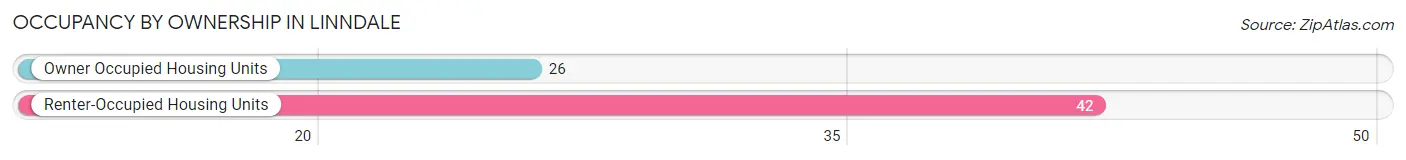
| Occupancy | # Housing Units | % Housing Units |
| Owner Occupied Housing Units | 26 | 38.2% |
| Renter-Occupied Housing Units | 42 | 61.8% |
| Total Occupied Housing Units | 68 | 100.0% |
Occupancy by Household Size in Linndale
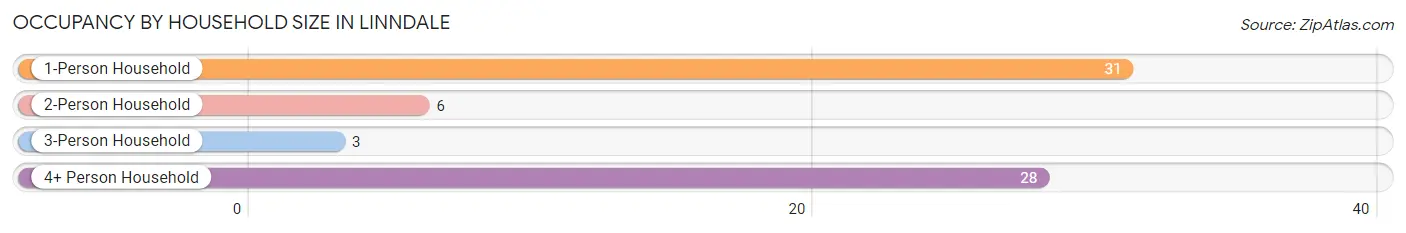
| Household Size | # Housing Units | % Housing Units |
| 1-Person Household | 31 | 45.6% |
| 2-Person Household | 6 | 8.8% |
| 3-Person Household | 3 | 4.4% |
| 4+ Person Household | 28 | 41.2% |
| Total Housing Units | 68 | 100.0% |
Occupancy by Ownership by Household Size in Linndale
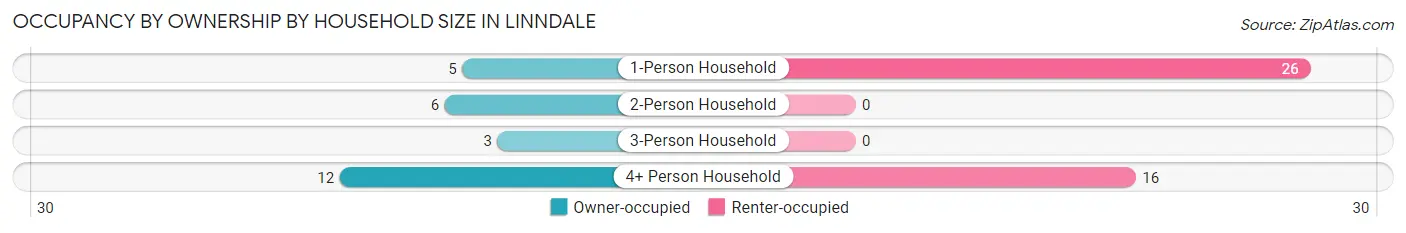
| Household Size | Owner-occupied | Renter-occupied |
| 1-Person Household | 5 (16.1%) | 26 (83.9%) |
| 2-Person Household | 6 (100.0%) | 0 (0.0%) |
| 3-Person Household | 3 (100.0%) | 0 (0.0%) |
| 4+ Person Household | 12 (42.9%) | 16 (57.1%) |
| Total Housing Units | 26 (38.2%) | 42 (61.8%) |
Occupancy by Educational Attainment in Linndale
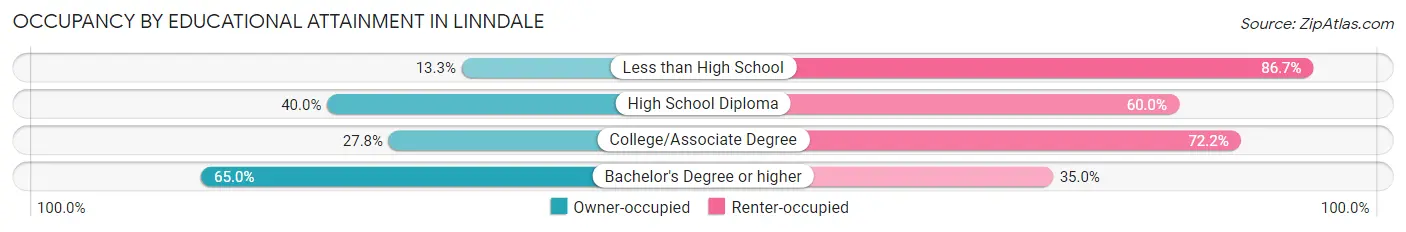
| Household Size | Owner-occupied | Renter-occupied |
| Less than High School | 2 (13.3%) | 13 (86.7%) |
| High School Diploma | 6 (40.0%) | 9 (60.0%) |
| College/Associate Degree | 5 (27.8%) | 13 (72.2%) |
| Bachelor's Degree or higher | 13 (65.0%) | 7 (35.0%) |
Occupancy by Age of Householder in Linndale
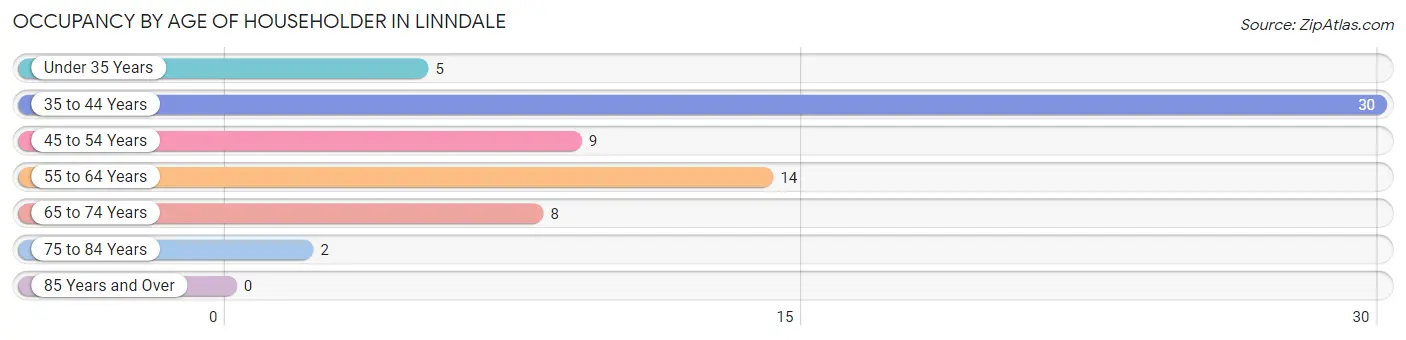
| Age Bracket | # Households | % Households |
| Under 35 Years | 5 | 7.3% |
| 35 to 44 Years | 30 | 44.1% |
| 45 to 54 Years | 9 | 13.2% |
| 55 to 64 Years | 14 | 20.6% |
| 65 to 74 Years | 8 | 11.8% |
| 75 to 84 Years | 2 | 2.9% |
| 85 Years and Over | 0 | 0.0% |
| Total | 68 | 100.0% |
Housing Finances in Linndale
Median Income by Occupancy in Linndale
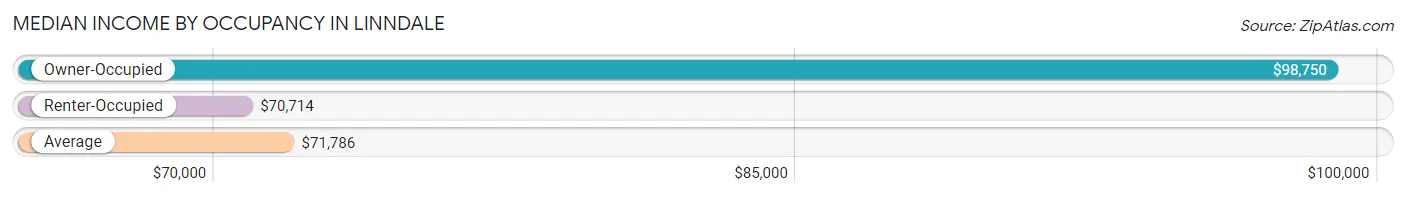
| Occupancy Type | # Households | Median Income |
| Owner-Occupied | 26 (38.2%) | $98,750 |
| Renter-Occupied | 42 (61.8%) | $70,714 |
| Average | 68 (100.0%) | $71,786 |
Occupancy by Householder Income Bracket in Linndale
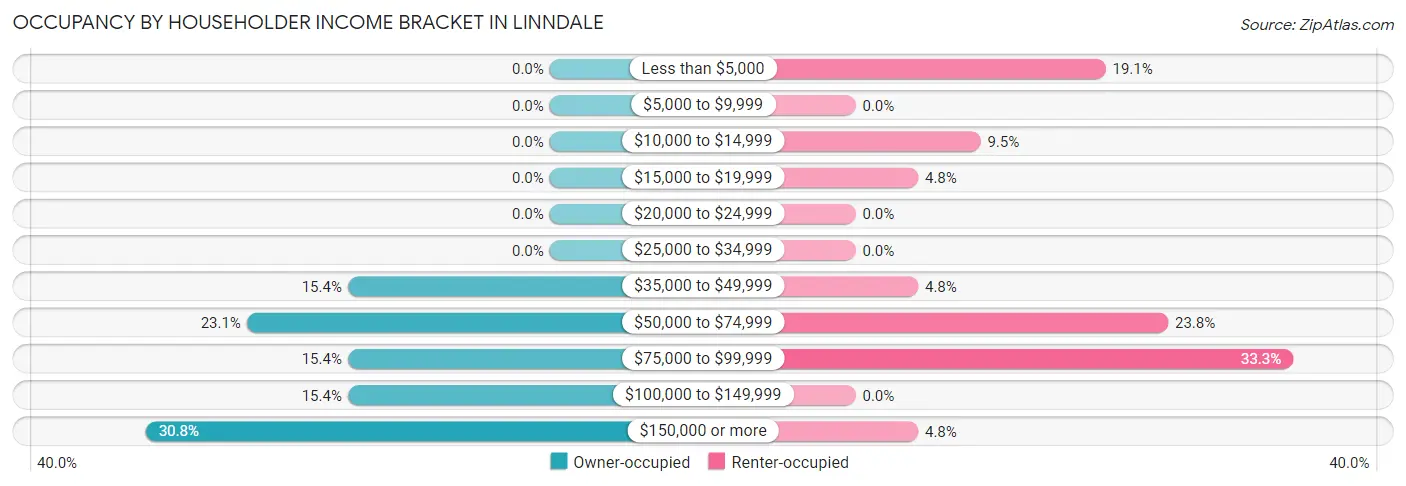
| Income Bracket | Owner-occupied | Renter-occupied |
| Less than $5,000 | 0 (0.0%) | 8 (19.1%) |
| $5,000 to $9,999 | 0 (0.0%) | 0 (0.0%) |
| $10,000 to $14,999 | 0 (0.0%) | 4 (9.5%) |
| $15,000 to $19,999 | 0 (0.0%) | 2 (4.8%) |
| $20,000 to $24,999 | 0 (0.0%) | 0 (0.0%) |
| $25,000 to $34,999 | 0 (0.0%) | 0 (0.0%) |
| $35,000 to $49,999 | 4 (15.4%) | 2 (4.8%) |
| $50,000 to $74,999 | 6 (23.1%) | 10 (23.8%) |
| $75,000 to $99,999 | 4 (15.4%) | 14 (33.3%) |
| $100,000 to $149,999 | 4 (15.4%) | 0 (0.0%) |
| $150,000 or more | 8 (30.8%) | 2 (4.8%) |
| Total | 26 (100.0%) | 42 (100.0%) |
Monthly Housing Cost Tiers in Linndale
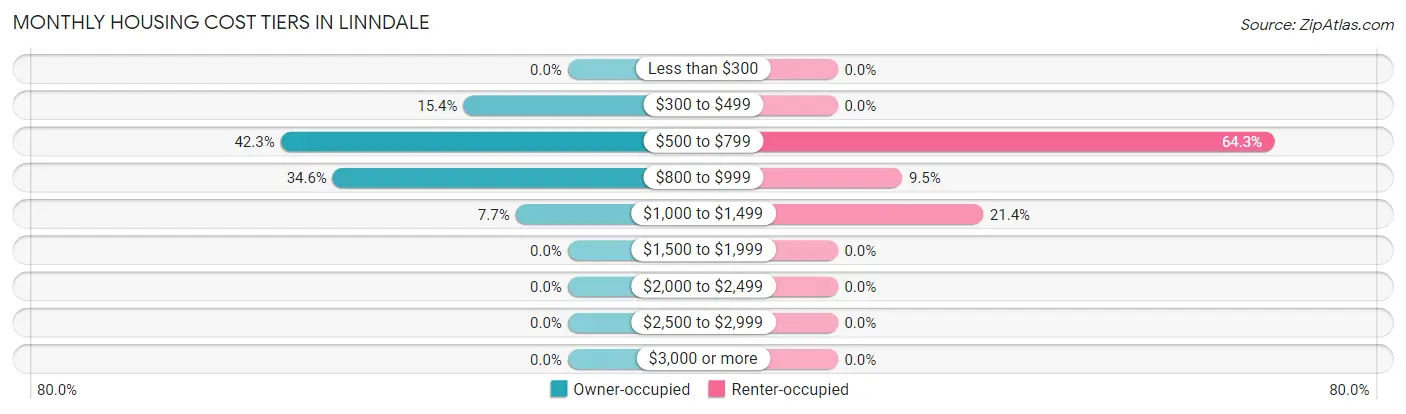
| Monthly Cost | Owner-occupied | Renter-occupied |
| Less than $300 | 0 (0.0%) | 0 (0.0%) |
| $300 to $499 | 4 (15.4%) | 0 (0.0%) |
| $500 to $799 | 11 (42.3%) | 27 (64.3%) |
| $800 to $999 | 9 (34.6%) | 4 (9.5%) |
| $1,000 to $1,499 | 2 (7.7%) | 9 (21.4%) |
| $1,500 to $1,999 | 0 (0.0%) | 0 (0.0%) |
| $2,000 to $2,499 | 0 (0.0%) | 0 (0.0%) |
| $2,500 to $2,999 | 0 (0.0%) | 0 (0.0%) |
| $3,000 or more | 0 (0.0%) | 0 (0.0%) |
| Total | 26 (100.0%) | 42 (100.0%) |
Physical Housing Characteristics in Linndale
Housing Structures in Linndale
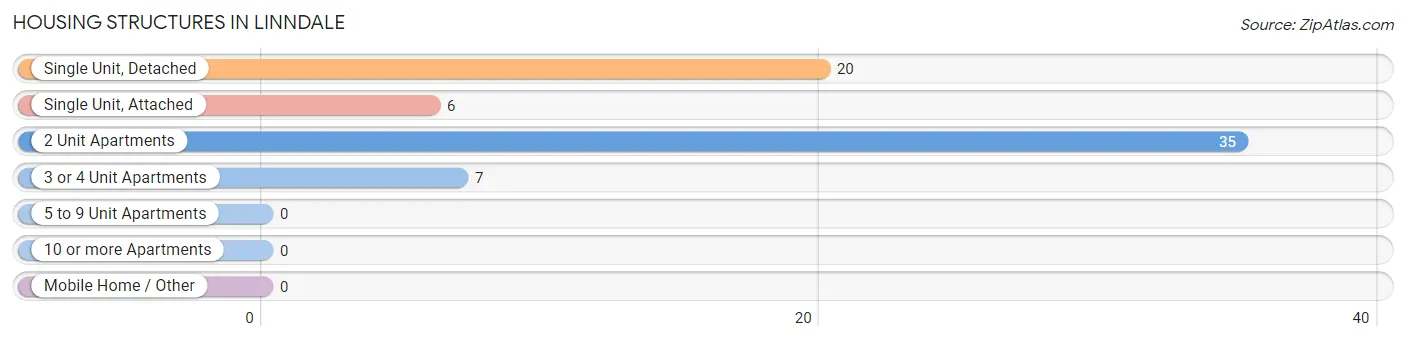
| Structure Type | # Housing Units | % Housing Units |
| Single Unit, Detached | 20 | 29.4% |
| Single Unit, Attached | 6 | 8.8% |
| 2 Unit Apartments | 35 | 51.5% |
| 3 or 4 Unit Apartments | 7 | 10.3% |
| 5 to 9 Unit Apartments | 0 | 0.0% |
| 10 or more Apartments | 0 | 0.0% |
| Mobile Home / Other | 0 | 0.0% |
| Total | 68 | 100.0% |
Housing Structures by Occupancy in Linndale
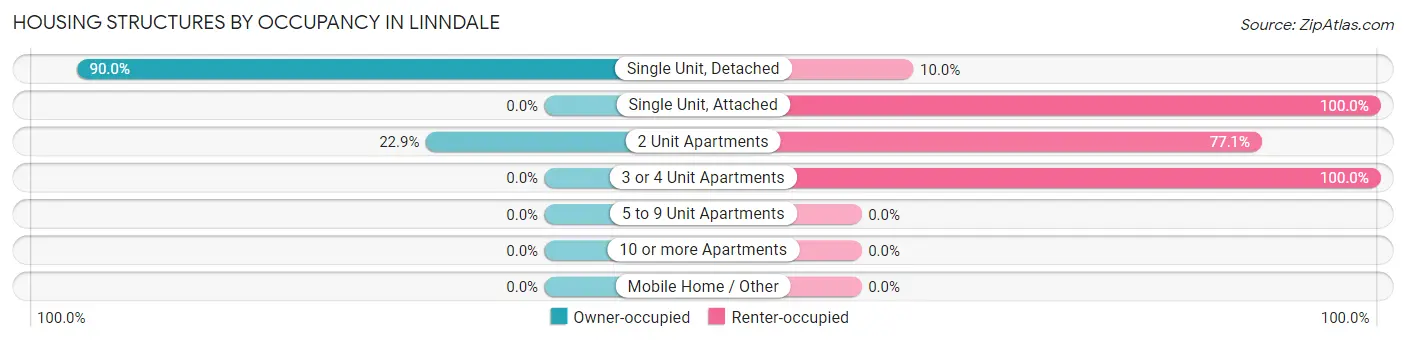
| Structure Type | Owner-occupied | Renter-occupied |
| Single Unit, Detached | 18 (90.0%) | 2 (10.0%) |
| Single Unit, Attached | 0 (0.0%) | 6 (100.0%) |
| 2 Unit Apartments | 8 (22.9%) | 27 (77.1%) |
| 3 or 4 Unit Apartments | 0 (0.0%) | 7 (100.0%) |
| 5 to 9 Unit Apartments | 0 (0.0%) | 0 (0.0%) |
| 10 or more Apartments | 0 (0.0%) | 0 (0.0%) |
| Mobile Home / Other | 0 (0.0%) | 0 (0.0%) |
| Total | 26 (38.2%) | 42 (61.8%) |
Housing Structures by Number of Rooms in Linndale
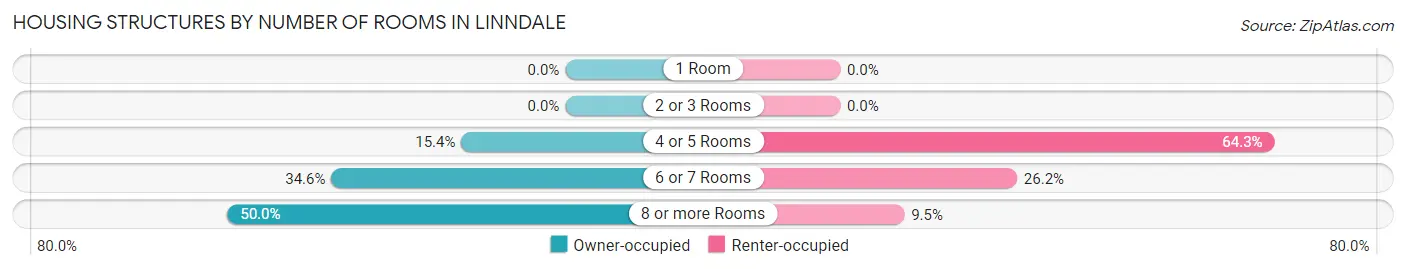
| Number of Rooms | Owner-occupied | Renter-occupied |
| 1 Room | 0 (0.0%) | 0 (0.0%) |
| 2 or 3 Rooms | 0 (0.0%) | 0 (0.0%) |
| 4 or 5 Rooms | 4 (15.4%) | 27 (64.3%) |
| 6 or 7 Rooms | 9 (34.6%) | 11 (26.2%) |
| 8 or more Rooms | 13 (50.0%) | 4 (9.5%) |
| Total | 26 (100.0%) | 42 (100.0%) |
Housing Structure by Heating Type in Linndale
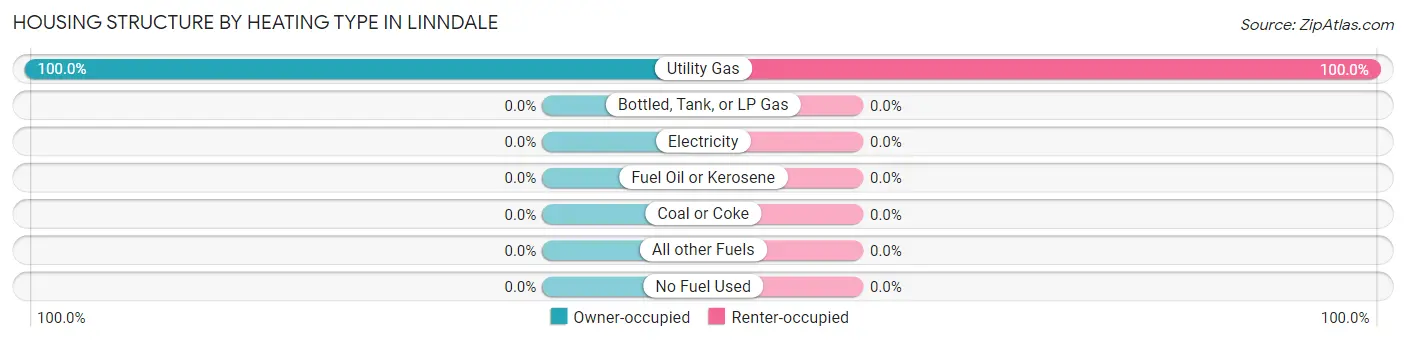
| Heating Type | Owner-occupied | Renter-occupied |
| Utility Gas | 26 (100.0%) | 42 (100.0%) |
| Bottled, Tank, or LP Gas | 0 (0.0%) | 0 (0.0%) |
| Electricity | 0 (0.0%) | 0 (0.0%) |
| Fuel Oil or Kerosene | 0 (0.0%) | 0 (0.0%) |
| Coal or Coke | 0 (0.0%) | 0 (0.0%) |
| All other Fuels | 0 (0.0%) | 0 (0.0%) |
| No Fuel Used | 0 (0.0%) | 0 (0.0%) |
| Total | 26 (100.0%) | 42 (100.0%) |
Household Vehicle Usage in Linndale
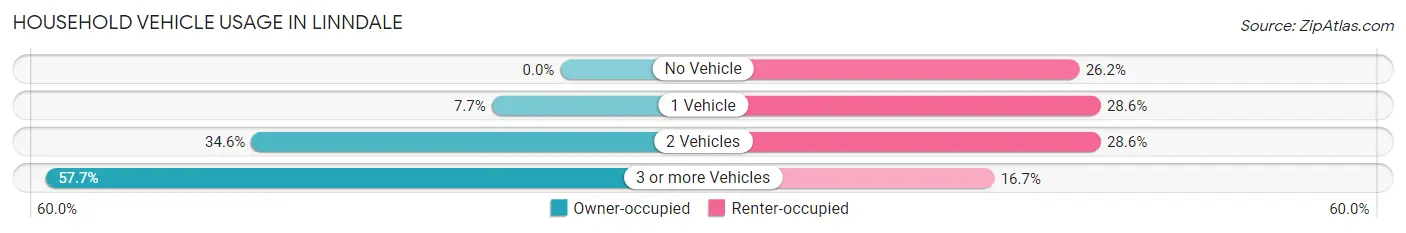
| Vehicles per Household | Owner-occupied | Renter-occupied |
| No Vehicle | 0 (0.0%) | 11 (26.2%) |
| 1 Vehicle | 2 (7.7%) | 12 (28.6%) |
| 2 Vehicles | 9 (34.6%) | 12 (28.6%) |
| 3 or more Vehicles | 15 (57.7%) | 7 (16.7%) |
| Total | 26 (100.0%) | 42 (100.0%) |
Real Estate & Mortgages in Linndale
Real Estate and Mortgage Overview in Linndale
| Characteristic | Without Mortgage | With Mortgage |
| Housing Units | 15 | 11 |
| Median Property Value | $92,500 | $73,800 |
| Median Household Income | $250,001 | $0 |
| Monthly Housing Costs | $625 | $0 |
| Real Estate Taxes | $2,083 | $0 |
Property Value by Mortgage Status in Linndale
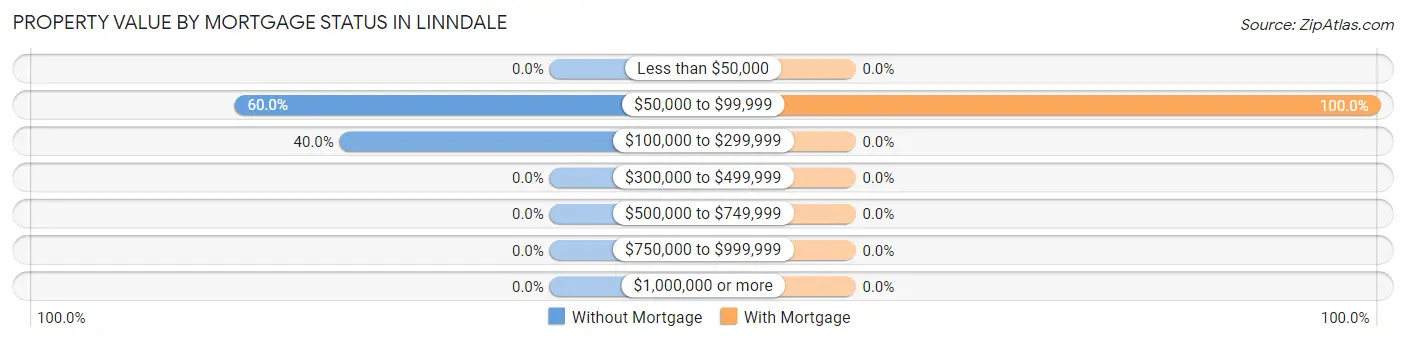
| Property Value | Without Mortgage | With Mortgage |
| Less than $50,000 | 0 (0.0%) | 0 (0.0%) |
| $50,000 to $99,999 | 9 (60.0%) | 11 (100.0%) |
| $100,000 to $299,999 | 6 (40.0%) | 0 (0.0%) |
| $300,000 to $499,999 | 0 (0.0%) | 0 (0.0%) |
| $500,000 to $749,999 | 0 (0.0%) | 0 (0.0%) |
| $750,000 to $999,999 | 0 (0.0%) | 0 (0.0%) |
| $1,000,000 or more | 0 (0.0%) | 0 (0.0%) |
| Total | 15 (100.0%) | 11 (100.0%) |
Household Income by Mortgage Status in Linndale
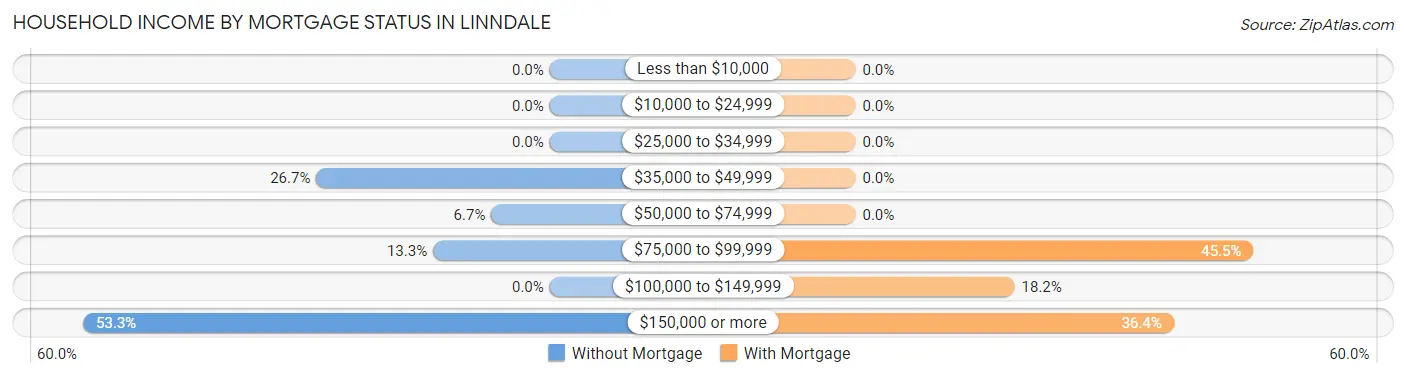
| Household Income | Without Mortgage | With Mortgage |
| Less than $10,000 | 0 (0.0%) | 0 (0.0%) |
| $10,000 to $24,999 | 0 (0.0%) | 0 (0.0%) |
| $25,000 to $34,999 | 0 (0.0%) | 0 (0.0%) |
| $35,000 to $49,999 | 4 (26.7%) | 0 (0.0%) |
| $50,000 to $74,999 | 1 (6.7%) | 0 (0.0%) |
| $75,000 to $99,999 | 2 (13.3%) | 5 (45.5%) |
| $100,000 to $149,999 | 0 (0.0%) | 2 (18.2%) |
| $150,000 or more | 8 (53.3%) | 4 (36.4%) |
| Total | 15 (100.0%) | 11 (100.0%) |
Property Value to Household Income Ratio in Linndale
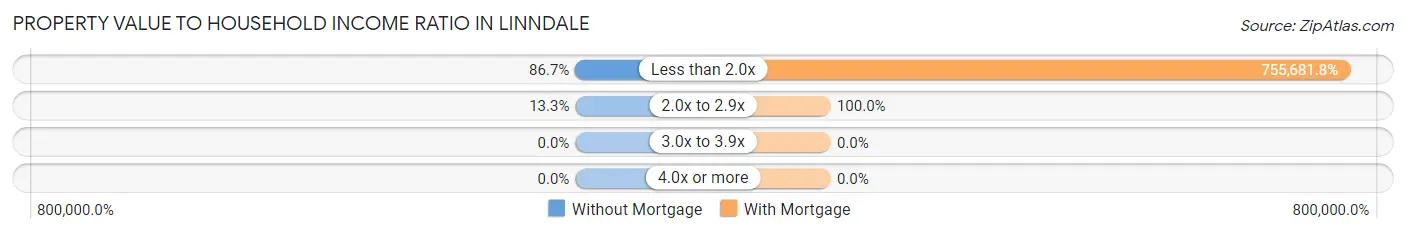
| Value-to-Income Ratio | Without Mortgage | With Mortgage |
| Less than 2.0x | 13 (86.7%) | 83,125 (755,681.8%) |
| 2.0x to 2.9x | 2 (13.3%) | 11 (100.0%) |
| 3.0x to 3.9x | 0 (0.0%) | 0 (0.0%) |
| 4.0x or more | 0 (0.0%) | 0 (0.0%) |
| Total | 15 (100.0%) | 11 (100.0%) |
Real Estate Taxes by Mortgage Status in Linndale
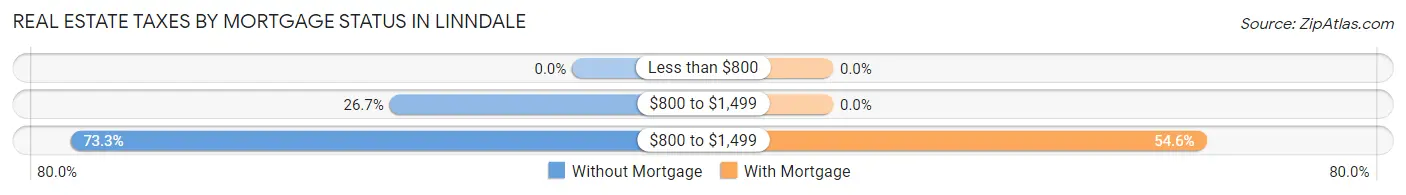
| Property Taxes | Without Mortgage | With Mortgage |
| Less than $800 | 0 (0.0%) | 0 (0.0%) |
| $800 to $1,499 | 4 (26.7%) | 0 (0.0%) |
| $800 to $1,499 | 11 (73.3%) | 6 (54.5%) |
| Total | 15 (100.0%) | 11 (100.0%) |
Health & Disability in Linndale
Health Insurance Coverage by Age in Linndale
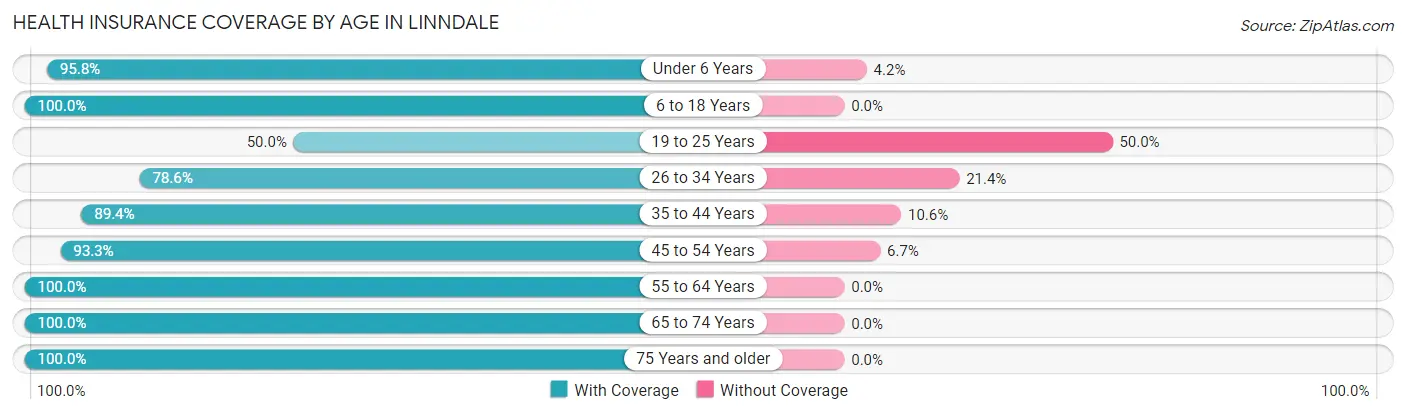
| Age Bracket | With Coverage | Without Coverage |
| Under 6 Years | 46 (95.8%) | 2 (4.2%) |
| 6 to 18 Years | 41 (100.0%) | 0 (0.0%) |
| 19 to 25 Years | 2 (50.0%) | 2 (50.0%) |
| 26 to 34 Years | 11 (78.6%) | 3 (21.4%) |
| 35 to 44 Years | 76 (89.4%) | 9 (10.6%) |
| 45 to 54 Years | 28 (93.3%) | 2 (6.7%) |
| 55 to 64 Years | 29 (100.0%) | 0 (0.0%) |
| 65 to 74 Years | 10 (100.0%) | 0 (0.0%) |
| 75 Years and older | 15 (100.0%) | 0 (0.0%) |
| Total | 258 (93.5%) | 18 (6.5%) |
Health Insurance Coverage by Citizenship Status in Linndale
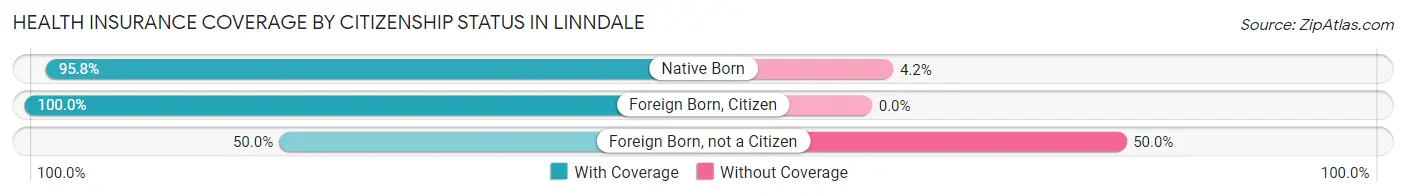
| Citizenship Status | With Coverage | Without Coverage |
| Native Born | 46 (95.8%) | 2 (4.2%) |
| Foreign Born, Citizen | 41 (100.0%) | 0 (0.0%) |
| Foreign Born, not a Citizen | 2 (50.0%) | 2 (50.0%) |
Health Insurance Coverage by Household Income in Linndale
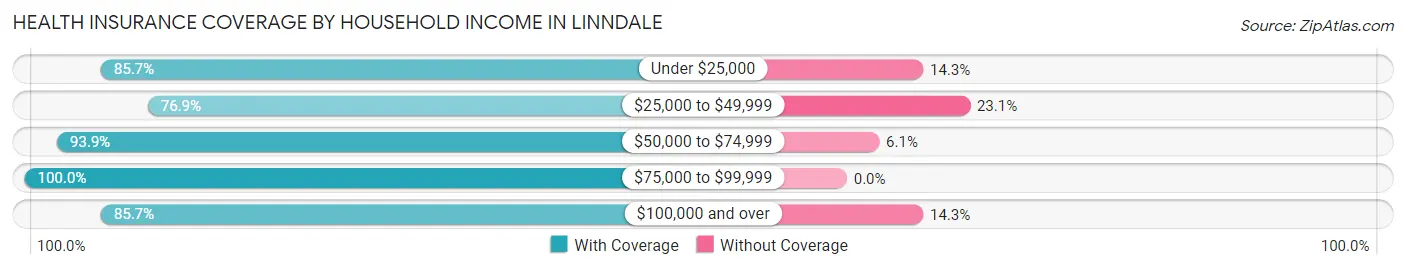
| Household Income | With Coverage | Without Coverage |
| Under $25,000 | 12 (85.7%) | 2 (14.3%) |
| $25,000 to $49,999 | 10 (76.9%) | 3 (23.1%) |
| $50,000 to $74,999 | 31 (93.9%) | 2 (6.1%) |
| $75,000 to $99,999 | 139 (100.0%) | 0 (0.0%) |
| $100,000 and over | 66 (85.7%) | 11 (14.3%) |
Public vs Private Health Insurance Coverage by Age in Linndale
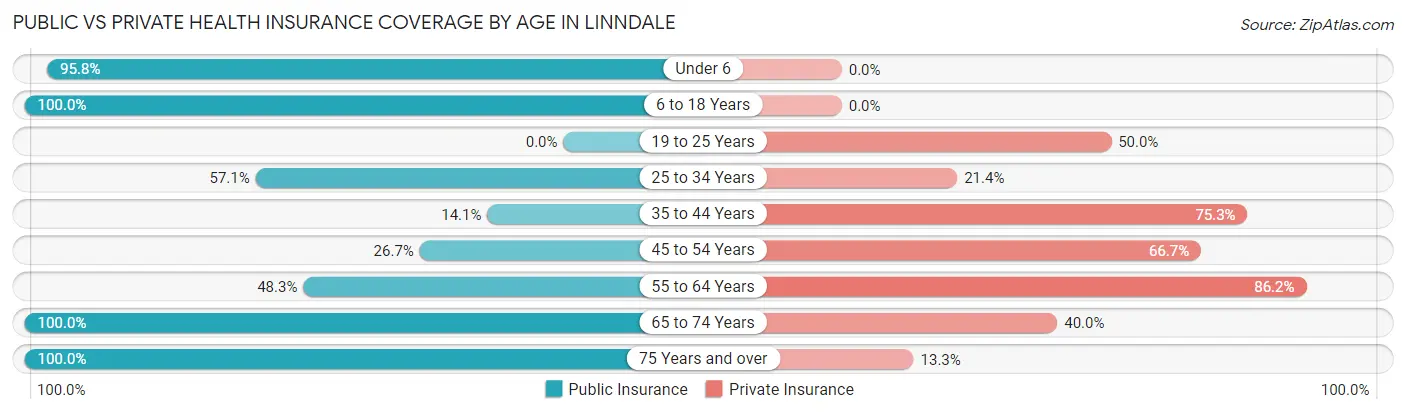
| Age Bracket | Public Insurance | Private Insurance |
| Under 6 | 46 (95.8%) | 0 (0.0%) |
| 6 to 18 Years | 41 (100.0%) | 0 (0.0%) |
| 19 to 25 Years | 0 (0.0%) | 2 (50.0%) |
| 25 to 34 Years | 8 (57.1%) | 3 (21.4%) |
| 35 to 44 Years | 12 (14.1%) | 64 (75.3%) |
| 45 to 54 Years | 8 (26.7%) | 20 (66.7%) |
| 55 to 64 Years | 14 (48.3%) | 25 (86.2%) |
| 65 to 74 Years | 10 (100.0%) | 4 (40.0%) |
| 75 Years and over | 15 (100.0%) | 2 (13.3%) |
| Total | 154 (55.8%) | 120 (43.5%) |
Disability Status by Sex by Age in Linndale
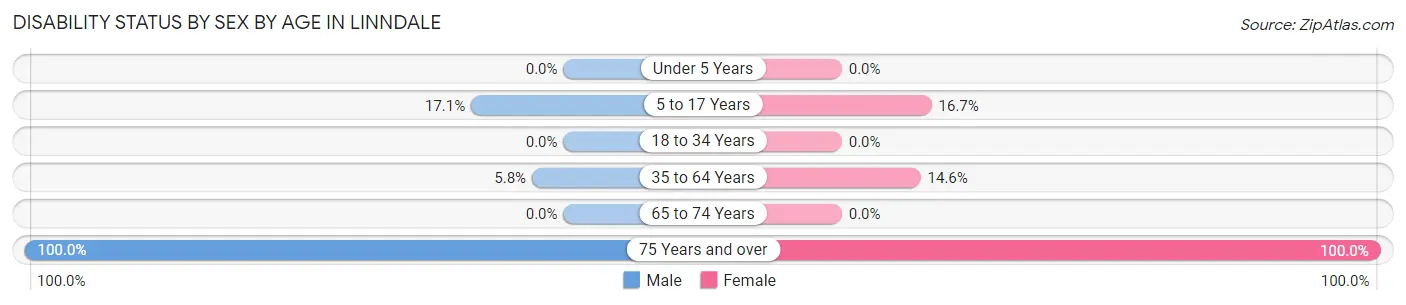
| Age Bracket | Male | Female |
| Under 5 Years | 0 (0.0%) | 0 (0.0%) |
| 5 to 17 Years | 6 (17.1%) | 1 (16.7%) |
| 18 to 34 Years | 0 (0.0%) | 0 (0.0%) |
| 35 to 64 Years | 6 (5.8%) | 6 (14.6%) |
| 65 to 74 Years | 0 (0.0%) | 0 (0.0%) |
| 75 Years and over | 8 (100.0%) | 7 (100.0%) |
Disability Class by Sex by Age in Linndale
Disability Class: Hearing Difficulty
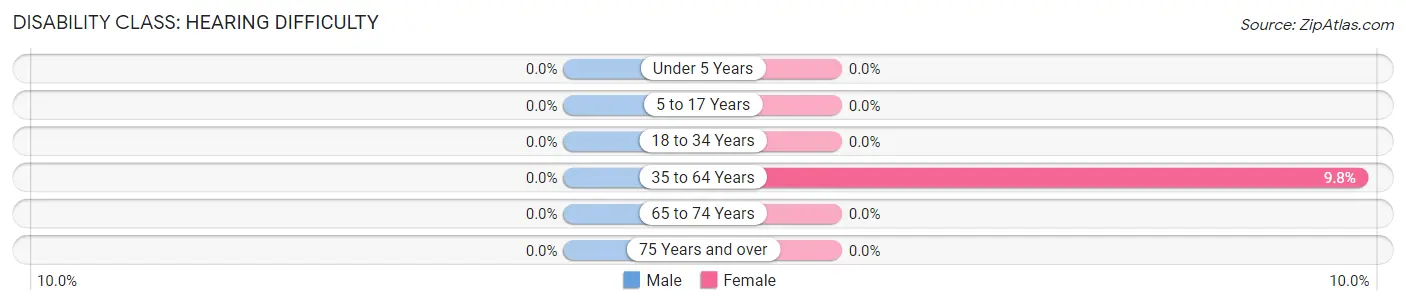
| Age Bracket | Male | Female |
| Under 5 Years | 0 (0.0%) | 0 (0.0%) |
| 5 to 17 Years | 0 (0.0%) | 0 (0.0%) |
| 18 to 34 Years | 0 (0.0%) | 0 (0.0%) |
| 35 to 64 Years | 0 (0.0%) | 4 (9.8%) |
| 65 to 74 Years | 0 (0.0%) | 0 (0.0%) |
| 75 Years and over | 0 (0.0%) | 0 (0.0%) |
Disability Class: Vision Difficulty

| Age Bracket | Male | Female |
| Under 5 Years | 0 (0.0%) | 0 (0.0%) |
| 5 to 17 Years | 0 (0.0%) | 0 (0.0%) |
| 18 to 34 Years | 0 (0.0%) | 0 (0.0%) |
| 35 to 64 Years | 0 (0.0%) | 2 (4.9%) |
| 65 to 74 Years | 0 (0.0%) | 0 (0.0%) |
| 75 Years and over | 0 (0.0%) | 0 (0.0%) |
Disability Class: Cognitive Difficulty
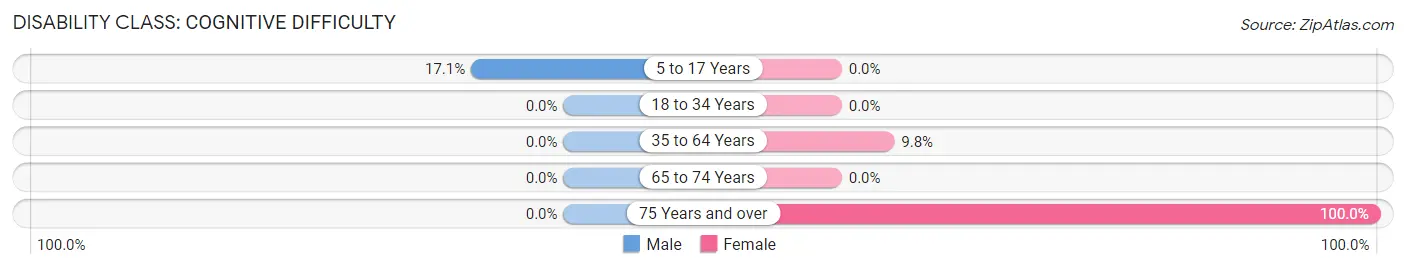
| Age Bracket | Male | Female |
| 5 to 17 Years | 6 (17.1%) | 0 (0.0%) |
| 18 to 34 Years | 0 (0.0%) | 0 (0.0%) |
| 35 to 64 Years | 0 (0.0%) | 4 (9.8%) |
| 65 to 74 Years | 0 (0.0%) | 0 (0.0%) |
| 75 Years and over | 0 (0.0%) | 7 (100.0%) |
Disability Class: Ambulatory Difficulty
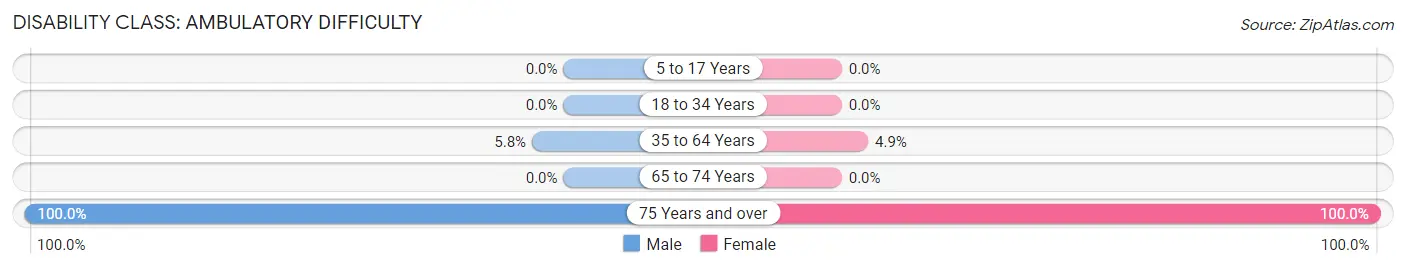
| Age Bracket | Male | Female |
| 5 to 17 Years | 0 (0.0%) | 0 (0.0%) |
| 18 to 34 Years | 0 (0.0%) | 0 (0.0%) |
| 35 to 64 Years | 6 (5.8%) | 2 (4.9%) |
| 65 to 74 Years | 0 (0.0%) | 0 (0.0%) |
| 75 Years and over | 8 (100.0%) | 7 (100.0%) |
Disability Class: Self-Care Difficulty
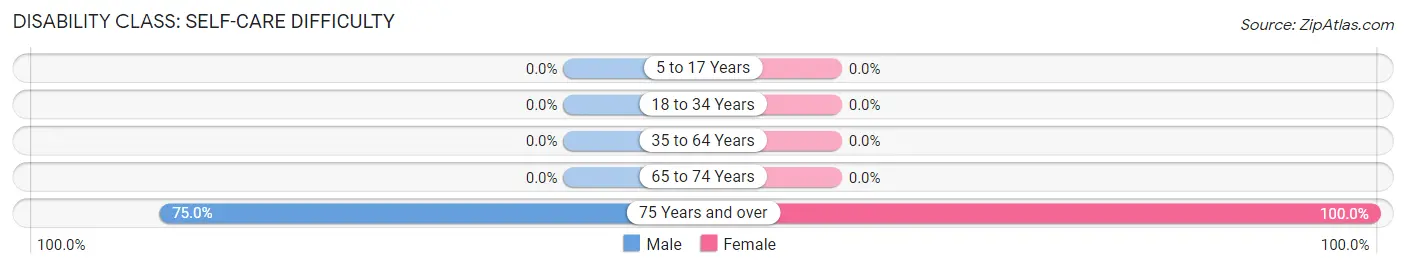
| Age Bracket | Male | Female |
| 5 to 17 Years | 0 (0.0%) | 0 (0.0%) |
| 18 to 34 Years | 0 (0.0%) | 0 (0.0%) |
| 35 to 64 Years | 0 (0.0%) | 0 (0.0%) |
| 65 to 74 Years | 0 (0.0%) | 0 (0.0%) |
| 75 Years and over | 6 (75.0%) | 7 (100.0%) |
Technology Access in Linndale
Computing Device Access in Linndale
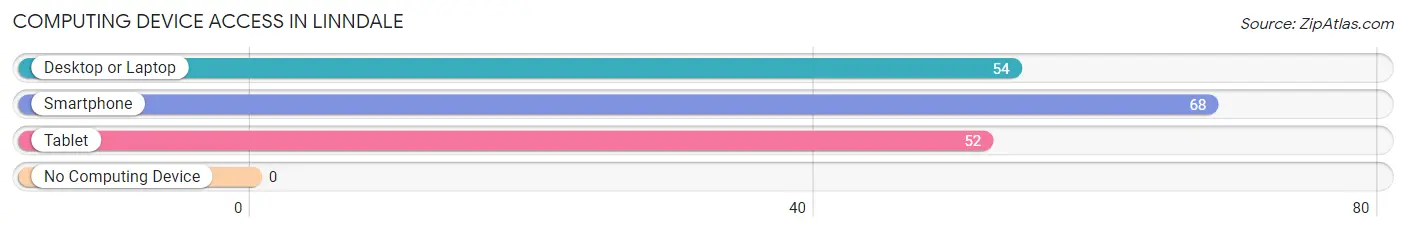
| Device Type | # Households | % Households |
| Desktop or Laptop | 54 | 79.4% |
| Smartphone | 68 | 100.0% |
| Tablet | 52 | 76.5% |
| No Computing Device | 0 | 0.0% |
| Total | 68 | 100.0% |
Internet Access in Linndale
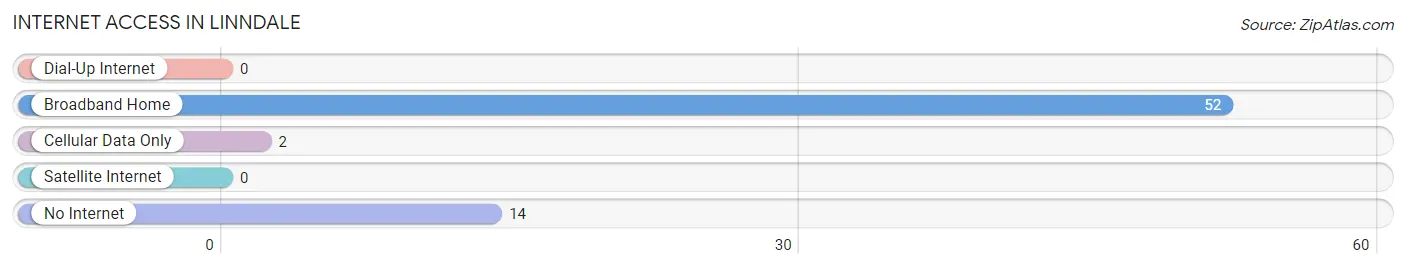
| Internet Type | # Households | % Households |
| Dial-Up Internet | 0 | 0.0% |
| Broadband Home | 52 | 76.5% |
| Cellular Data Only | 2 | 2.9% |
| Satellite Internet | 0 | 0.0% |
| No Internet | 14 | 20.6% |
| Total | 68 | 100.0% |
Linndale Summary
Lindale, Ohio is a small village located in Cuyahoga County, Ohio. It is situated on the western edge of Cleveland, Ohio, and is part of the Greater Cleveland metropolitan area. The village has a population of approximately 1,000 people, and is home to a variety of businesses, including a few small manufacturing companies.
History
Lindale was founded in 1818 by a group of settlers from Connecticut. The village was originally known as “Linndale”, after the first settler, John Lindale. The village was incorporated in 1867, and the name was changed to “Lindale”.
The village was originally a farming community, and the main crops were corn, wheat, and oats. In the late 19th century, the village began to industrialize, and several factories were built in the area. These factories included a paper mill, a brickyard, and a sawmill.
In the early 20th century, the village began to experience a population boom, as many people moved to the area to work in the factories. The population peaked in the 1950s, when the village had a population of over 2,000 people.
Geography
Lindale is located in Cuyahoga County, Ohio, and is situated on the western edge of Cleveland, Ohio. The village is bordered by the cities of Brooklyn, Parma, and Seven Hills. The village is located on the Cuyahoga River, and is approximately 10 miles from downtown Cleveland.
The village has a total area of 0.7 square miles, all of which is land. The village is located in a flat, low-lying area, and is surrounded by farmland.
Economy
The economy of Lindale is largely based on manufacturing. The village is home to several small manufacturing companies, including a paper mill, a brickyard, and a sawmill. The village also has a few retail stores, including a grocery store, a hardware store, and a few restaurants.
Demographics
As of the 2010 census, the population of Lindale was 1,000 people. The racial makeup of the village was 97.2% White, 0.7% African American, 0.3% Native American, 0.3% Asian, and 1.5% from other races. The median household income was $41,250, and the median family income was $50,000.
The village has a high rate of poverty, with 28.3% of the population living below the poverty line. The village also has a high rate of unemployment, with 8.3% of the population unemployed.
Conclusion
Lindale, Ohio is a small village located in Cuyahoga County, Ohio. It is situated on the western edge of Cleveland, Ohio, and is part of the Greater Cleveland metropolitan area. The village has a population of approximately 1,000 people, and is home to a variety of businesses, including a few small manufacturing companies. The economy of Lindale is largely based on manufacturing, and the village has a high rate of poverty and unemployment.
Common Questions
What is Per Capita Income in Linndale?
Per Capita income in Linndale is $28,661.
What is the Median Household income in Linndale?
Median Household Income in Linndale is $71,786.
What is Income or Wage Gap in Linndale?
Income or Wage Gap in Linndale is 6.2%.
Women in Linndale earn 93.8 cents for every dollar earned by a man.
What is Inequality or Gini Index in Linndale?
Inequality or Gini Index in Linndale is 0.51.
What is the Total Population of Linndale?
Total Population of Linndale is 276.
What is the Total Male Population of Linndale?
Total Male Population of Linndale is 195.
What is the Total Female Population of Linndale?
Total Female Population of Linndale is 81.
What is the Ratio of Males per 100 Females in Linndale?
There are 240.74 Males per 100 Females in Linndale.
What is the Ratio of Females per 100 Males in Linndale?
There are 41.54 Females per 100 Males in Linndale.
What is the Median Population Age in Linndale?
Median Population Age in Linndale is 37.8 Years.
What is the Average Family Size in Linndale
Average Family Size in Linndale is 4.7 People.
What is the Average Household Size in Linndale
Average Household Size in Linndale is 4.1 People.
How Large is the Labor Force in Linndale?
There are 147 People in the Labor Forcein in Linndale.
What is the Percentage of People in the Labor Force in Linndale?
78.6% of People are in the Labor Force in Linndale.
What is the Unemployment Rate in Linndale?
Unemployment Rate in Linndale is 8.8%.