Cities with the Highest Percentage of Population with a Degree in Visual and Performing Arts in Ohio
RELATED REPORTS & OPTIONS
Visual and Performing Arts
Ohio
Compare Cities
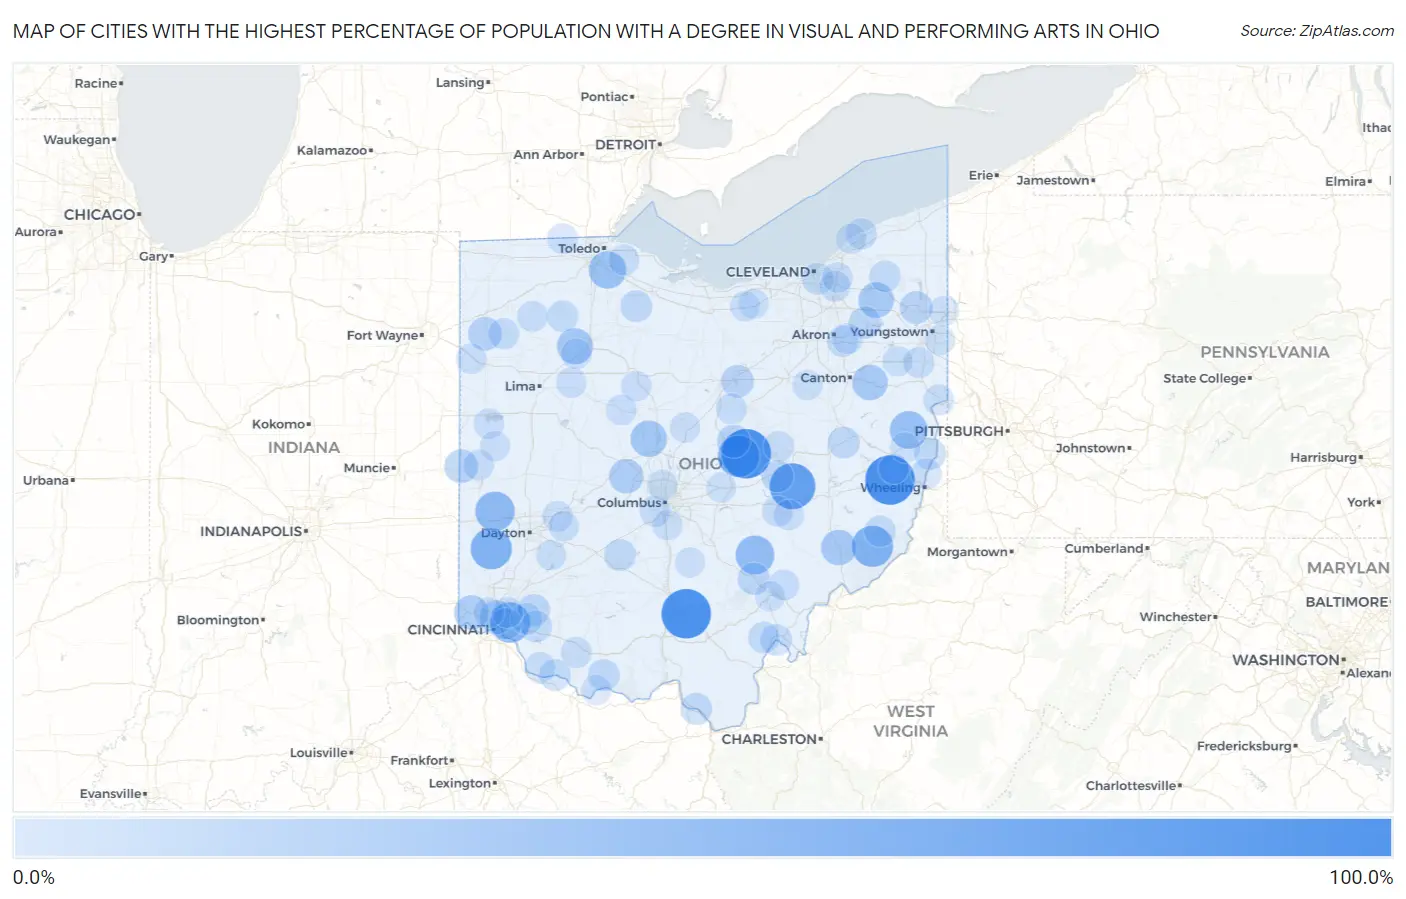
Map of Cities with the Highest Percentage of Population with a Degree in Visual and Performing Arts in Ohio
0.0%
100.0%
Cities with the Highest Percentage of Population with a Degree in Visual and Performing Arts in Ohio
| City | % Graduates | vs State | vs National | |
| 1. | Richmond Dale | 100.0% | 3.7%(+96.3)#1 | 4.3%(+95.7)#8 |
| 2. | Bladensburg | 100.0% | 3.7%(+96.3)#2 | 4.3%(+95.7)#14 |
| 3. | Birmingham | 100.0% | 3.7%(+96.3)#3 | 4.3%(+95.7)#28 |
| 4. | Lafferty | 100.0% | 3.7%(+96.3)#4 | 4.3%(+95.7)#30 |
| 5. | Adamsville | 82.1% | 3.7%(+78.4)#5 | 4.3%(+77.9)#51 |
| 6. | Martinsburg | 63.0% | 3.7%(+59.3)#6 | 4.3%(+58.7)#71 |
| 7. | Gratis | 60.0% | 3.7%(+56.3)#7 | 4.3%(+55.7)#80 |
| 8. | Graysville | 60.0% | 3.7%(+56.3)#8 | 4.3%(+55.7)#85 |
| 9. | Plainville | 56.4% | 3.7%(+52.7)#9 | 4.3%(+52.2)#92 |
| 10. | Verona | 51.4% | 3.7%(+47.6)#10 | 4.3%(+47.1)#103 |
| 11. | Shawnee | 48.3% | 3.7%(+44.6)#11 | 4.3%(+44.0)#136 |
| 12. | East Springfield | 44.1% | 3.7%(+40.4)#12 | 4.3%(+39.9)#155 |
| 13. | Stony Ridge | 42.4% | 3.7%(+38.7)#13 | 4.3%(+38.2)#162 |
| 14. | Radnor | 37.3% | 3.7%(+33.5)#14 | 4.3%(+33.0)#202 |
| 15. | Benton Ridge | 36.0% | 3.7%(+32.3)#15 | 4.3%(+31.7)#214 |
| 16. | Roachester | 35.7% | 3.7%(+32.0)#16 | 4.3%(+31.5)#218 |
| 17. | Hiram | 33.5% | 3.7%(+29.8)#17 | 4.3%(+29.2)#243 |
| 18. | Robertsville | 33.3% | 3.7%(+29.6)#18 | 4.3%(+29.1)#253 |
| 19. | Dexter City | 33.3% | 3.7%(+29.6)#19 | 4.3%(+29.1)#259 |
| 20. | Miamitown | 28.7% | 3.7%(+25.0)#20 | 4.3%(+24.4)#335 |
| 21. | Unionville Center | 28.6% | 3.7%(+24.9)#21 | 4.3%(+24.3)#339 |
| 22. | Elmwood Place | 25.2% | 3.7%(+21.5)#22 | 4.3%(+20.9)#413 |
| 23. | Union City | 25.0% | 3.7%(+21.3)#23 | 4.3%(+20.7)#416 |
| 24. | Latty | 25.0% | 3.7%(+21.3)#24 | 4.3%(+20.7)#436 |
| 25. | Ai | 23.3% | 3.7%(+19.6)#25 | 4.3%(+19.1)#479 |
| 26. | Gambier | 23.0% | 3.7%(+19.3)#26 | 4.3%(+18.8)#489 |
| 27. | Mifflin | 21.4% | 3.7%(+17.7)#27 | 4.3%(+17.2)#553 |
| 28. | Morgandale | 21.3% | 3.7%(+17.6)#28 | 4.3%(+17.1)#556 |
| 29. | Ravenna | 18.3% | 3.7%(+14.6)#29 | 4.3%(+14.1)#753 |
| 30. | Nelsonville | 18.3% | 3.7%(+14.6)#30 | 4.3%(+14.1)#754 |
| 31. | Goshen | 18.0% | 3.7%(+14.3)#31 | 4.3%(+13.7)#778 |
| 32. | Trinway | 17.9% | 3.7%(+14.2)#32 | 4.3%(+13.7)#785 |
| 33. | Madison Place | 17.3% | 3.7%(+13.6)#33 | 4.3%(+13.0)#831 |
| 34. | Gnadenhutten | 16.8% | 3.7%(+13.1)#34 | 4.3%(+12.5)#863 |
| 35. | Bloomingburg | 16.7% | 3.7%(+13.0)#35 | 4.3%(+12.4)#872 |
| 36. | New Alexandria | 16.7% | 3.7%(+13.0)#36 | 4.3%(+12.4)#885 |
| 37. | Burgoon | 16.7% | 3.7%(+13.0)#37 | 4.3%(+12.4)#889 |
| 38. | Hanging Rock | 16.7% | 3.7%(+13.0)#38 | 4.3%(+12.4)#900 |
| 39. | West Union | 16.4% | 3.7%(+12.7)#39 | 4.3%(+12.2)#918 |
| 40. | Day Heights | 15.6% | 3.7%(+11.9)#40 | 4.3%(+11.4)#996 |
| 41. | Newburgh Heights | 15.5% | 3.7%(+11.7)#41 | 4.3%(+11.2)#1,017 |
| 42. | Higginsport | 15.4% | 3.7%(+11.7)#42 | 4.3%(+11.1)#1,026 |
| 43. | Pomeroy | 15.3% | 3.7%(+11.6)#43 | 4.3%(+11.0)#1,036 |
| 44. | Woodsfield | 15.1% | 3.7%(+11.3)#44 | 4.3%(+10.8)#1,050 |
| 45. | Ridgewood | 14.9% | 3.7%(+11.2)#45 | 4.3%(+10.7)#1,073 |
| 46. | Deshler | 14.9% | 3.7%(+11.2)#46 | 4.3%(+10.6)#1,078 |
| 47. | Rutland | 14.7% | 3.7%(+11.0)#47 | 4.3%(+10.5)#1,095 |
| 48. | Sawyerwood | 14.7% | 3.7%(+10.9)#48 | 4.3%(+10.4)#1,099 |
| 49. | Middlefield | 14.5% | 3.7%(+10.8)#49 | 4.3%(+10.2)#1,124 |
| 50. | Owensville | 14.5% | 3.7%(+10.7)#50 | 4.3%(+10.2)#1,126 |
| 51. | Fairfax | 14.2% | 3.7%(+10.5)#51 | 4.3%(+9.94)#1,177 |
| 52. | Fairport Harbor | 13.4% | 3.7%(+9.72)#52 | 4.3%(+9.18)#1,275 |
| 53. | Melrose | 13.3% | 3.7%(+9.62)#53 | 4.3%(+9.08)#1,293 |
| 54. | Miller | 13.2% | 3.7%(+9.48)#54 | 4.3%(+8.93)#1,325 |
| 55. | Felicity | 13.0% | 3.7%(+9.33)#55 | 4.3%(+8.79)#1,342 |
| 56. | Urbancrest | 12.9% | 3.7%(+9.19)#56 | 4.3%(+8.65)#1,354 |
| 57. | Bedford Heights | 12.8% | 3.7%(+9.12)#57 | 4.3%(+8.58)#1,368 |
| 58. | Washingtonville | 12.5% | 3.7%(+8.79)#58 | 4.3%(+8.25)#1,412 |
| 59. | Clay Center | 12.5% | 3.7%(+8.79)#59 | 4.3%(+8.25)#1,419 |
| 60. | New Bavaria | 12.5% | 3.7%(+8.79)#60 | 4.3%(+8.25)#1,434 |
| 61. | Lake Waynoka | 12.4% | 3.7%(+8.64)#61 | 4.3%(+8.10)#1,449 |
| 62. | Amesville | 12.3% | 3.7%(+8.57)#62 | 4.3%(+8.03)#1,460 |
| 63. | La Croft | 12.3% | 3.7%(+8.55)#63 | 4.3%(+8.01)#1,463 |
| 64. | Yorkville | 12.2% | 3.7%(+8.48)#64 | 4.3%(+7.94)#1,481 |
| 65. | Rossmoyne | 12.2% | 3.7%(+8.46)#65 | 4.3%(+7.92)#1,490 |
| 66. | South Zanesville | 12.0% | 3.7%(+8.27)#66 | 4.3%(+7.73)#1,527 |
| 67. | Butler | 11.9% | 3.7%(+8.23)#67 | 4.3%(+7.69)#1,533 |
| 68. | Ansonia | 11.9% | 3.7%(+8.15)#68 | 4.3%(+7.61)#1,549 |
| 69. | Warsaw | 11.6% | 3.7%(+7.92)#69 | 4.3%(+7.38)#1,601 |
| 70. | Mogadore | 11.5% | 3.7%(+7.83)#70 | 4.3%(+7.29)#1,619 |
| 71. | La Rue | 11.5% | 3.7%(+7.83)#71 | 4.3%(+7.29)#1,621 |
| 72. | Green Meadows | 11.3% | 3.7%(+7.61)#72 | 4.3%(+7.07)#1,650 |
| 73. | Metamora | 11.2% | 3.7%(+7.53)#73 | 4.3%(+6.98)#1,666 |
| 74. | North College Hill | 11.2% | 3.7%(+7.46)#74 | 4.3%(+6.92)#1,679 |
| 75. | Ada | 11.1% | 3.7%(+7.43)#75 | 4.3%(+6.89)#1,684 |
| 76. | Rawson | 11.1% | 3.7%(+7.40)#76 | 4.3%(+6.86)#1,697 |
| 77. | Harpster | 11.1% | 3.7%(+7.40)#77 | 4.3%(+6.86)#1,711 |
| 78. | Montezuma | 11.1% | 3.7%(+7.40)#78 | 4.3%(+6.86)#1,726 |
| 79. | Woodmere | 11.0% | 3.7%(+7.33)#79 | 4.3%(+6.79)#1,745 |
| 80. | Fulton | 10.8% | 3.7%(+7.10)#80 | 4.3%(+6.56)#1,799 |
| 81. | Duncan Falls | 10.6% | 3.7%(+6.92)#81 | 4.3%(+6.38)#1,861 |
| 82. | Spring Valley | 10.4% | 3.7%(+6.71)#82 | 4.3%(+6.16)#1,927 |
| 83. | Convoy | 10.4% | 3.7%(+6.68)#83 | 4.3%(+6.14)#1,931 |
| 84. | Kidron | 10.3% | 3.7%(+6.63)#84 | 4.3%(+6.09)#1,948 |
| 85. | Yellow Springs | 10.3% | 3.7%(+6.62)#85 | 4.3%(+6.07)#1,956 |
| 86. | Riverlea | 10.3% | 3.7%(+6.55)#86 | 4.3%(+6.00)#1,976 |
| 87. | Damascus | 10.2% | 3.7%(+6.49)#87 | 4.3%(+5.95)#1,992 |
| 88. | Brookfield Center | 10.0% | 3.7%(+6.29)#88 | 4.3%(+5.75)#2,052 |
| 89. | Osgood | 10.0% | 3.7%(+6.29)#89 | 4.3%(+5.75)#2,067 |
| 90. | Lockbourne | 10.0% | 3.7%(+6.29)#90 | 4.3%(+5.75)#2,072 |
| 91. | Oberlin | 9.9% | 3.7%(+6.15)#91 | 4.3%(+5.61)#2,114 |
| 92. | Mentor On The Lake | 9.9% | 3.7%(+6.14)#92 | 4.3%(+5.60)#2,117 |
| 93. | Hopedale | 9.8% | 3.7%(+6.13)#93 | 4.3%(+5.58)#2,124 |
| 94. | Athens | 9.8% | 3.7%(+6.05)#94 | 4.3%(+5.51)#2,145 |
| 95. | Tarlton | 9.7% | 3.7%(+5.97)#95 | 4.3%(+5.43)#2,185 |
| 96. | Struthers | 9.6% | 3.7%(+5.91)#96 | 4.3%(+5.37)#2,203 |
| 97. | Manchester | 9.5% | 3.7%(+5.81)#97 | 4.3%(+5.27)#2,230 |
| 98. | New Athens | 9.5% | 3.7%(+5.81)#98 | 4.3%(+5.27)#2,240 |
| 99. | Kipton | 9.5% | 3.7%(+5.81)#99 | 4.3%(+5.27)#2,242 |
| 100. | Granville | 9.4% | 3.7%(+5.67)#100 | 4.3%(+5.13)#2,293 |
Common Questions
What are the Top 10 Cities with the Highest Percentage of Population with a Degree in Visual and Performing Arts in Ohio?
Top 10 Cities with the Highest Percentage of Population with a Degree in Visual and Performing Arts in Ohio are:
#1
100.0%
#2
100.0%
#3
100.0%
#4
82.1%
#5
63.0%
#6
60.0%
#7
60.0%
#8
56.4%
#9
51.4%
#10
48.3%
What city has the Highest Percentage of Population with a Degree in Visual and Performing Arts in Ohio?
Richmond Dale has the Highest Percentage of Population with a Degree in Visual and Performing Arts in Ohio with 100.0%.
What is the Percentage of Population with a Degree in Visual and Performing Arts in the State of Ohio?
Percentage of Population with a Degree in Visual and Performing Arts in Ohio is 3.7%.
What is the Percentage of Population with a Degree in Visual and Performing Arts in the United States?
Percentage of Population with a Degree in Visual and Performing Arts in the United States is 4.3%.