Mechanicsburg, OH Map & Demographics
Mechanicsburg Map
Mechanicsburg Overview
$26,060
PER CAPITA INCOME
$69,179
AVG FAMILY INCOME
$56,146
AVG HOUSEHOLD INCOME
15.3%
WAGE / INCOME GAP [ % ]
84.7¢/ $1
WAGE / INCOME GAP [ $ ]
0.38
INEQUALITY / GINI INDEX
1,860
TOTAL POPULATION
905
MALE POPULATION
955
FEMALE POPULATION
94.76
MALES / 100 FEMALES
105.52
FEMALES / 100 MALES
32.2
MEDIAN AGE
2.9
AVG FAMILY SIZE
2.3
AVG HOUSEHOLD SIZE
861
LABOR FORCE [ PEOPLE ]
57.5%
PERCENT IN LABOR FORCE
2.1%
UNEMPLOYMENT RATE
Mechanicsburg Zip Codes
Mechanicsburg Area Codes
Income in Mechanicsburg
Income Overview in Mechanicsburg
Per Capita Income in Mechanicsburg is $26,060, while median incomes of families and households are $69,179 and $56,146 respectively.
| Characteristic | Number | Measure |
| Per Capita Income | 1,860 | $26,060 |
| Median Family Income | 473 | $69,179 |
| Mean Family Income | 473 | $74,561 |
| Median Household Income | 739 | $56,146 |
| Mean Household Income | 739 | $62,325 |
| Income Deficit | 473 | $0 |
| Wage / Income Gap (%) | 1,860 | 15.27% |
| Wage / Income Gap ($) | 1,860 | 84.73¢ per $1 |
| Gini / Inequality Index | 1,860 | 0.38 |
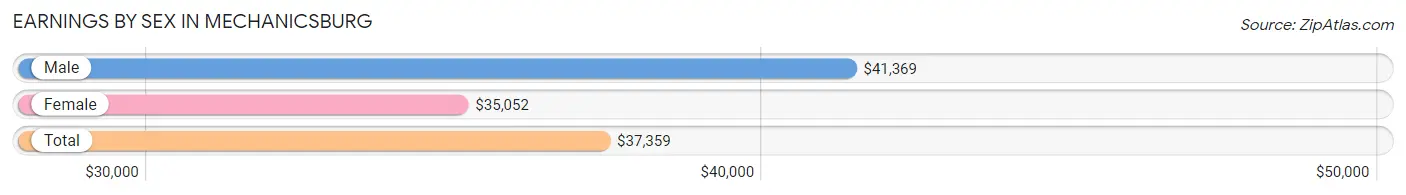
Earnings by Sex in Mechanicsburg
Average Earnings in Mechanicsburg are $37,359, $41,369 for men and $35,052 for women, a difference of 15.3%.
| Sex | Number | Average Earnings |
| Male | 535 (55.1%) | $41,369 |
| Female | 435 (44.9%) | $35,052 |
| Total | 970 (100.0%) | $37,359 |
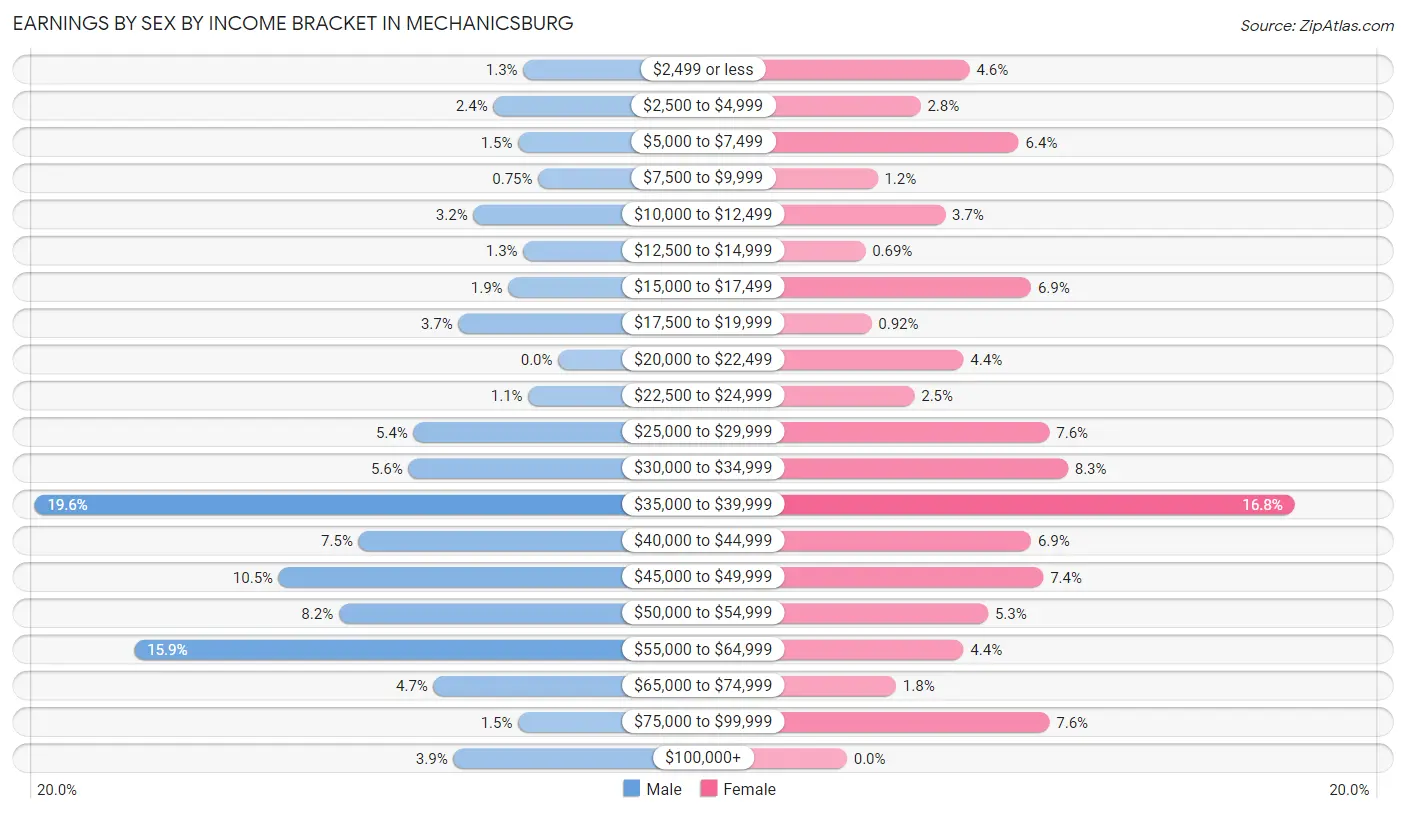
Earnings by Sex by Income Bracket in Mechanicsburg
The most common earnings brackets in Mechanicsburg are $35,000 to $39,999 for men (105 | 19.6%) and $35,000 to $39,999 for women (73 | 16.8%).
| Income | Male | Female |
| $2,499 or less | 7 (1.3%) | 20 (4.6%) |
| $2,500 to $4,999 | 13 (2.4%) | 12 (2.8%) |
| $5,000 to $7,499 | 8 (1.5%) | 28 (6.4%) |
| $7,500 to $9,999 | 4 (0.7%) | 5 (1.1%) |
| $10,000 to $12,499 | 17 (3.2%) | 16 (3.7%) |
| $12,500 to $14,999 | 7 (1.3%) | 3 (0.7%) |
| $15,000 to $17,499 | 10 (1.9%) | 30 (6.9%) |
| $17,500 to $19,999 | 20 (3.7%) | 4 (0.9%) |
| $20,000 to $22,499 | 0 (0.0%) | 19 (4.4%) |
| $22,500 to $24,999 | 6 (1.1%) | 11 (2.5%) |
| $25,000 to $29,999 | 29 (5.4%) | 33 (7.6%) |
| $30,000 to $34,999 | 30 (5.6%) | 36 (8.3%) |
| $35,000 to $39,999 | 105 (19.6%) | 73 (16.8%) |
| $40,000 to $44,999 | 40 (7.5%) | 30 (6.9%) |
| $45,000 to $49,999 | 56 (10.5%) | 32 (7.4%) |
| $50,000 to $54,999 | 44 (8.2%) | 23 (5.3%) |
| $55,000 to $64,999 | 85 (15.9%) | 19 (4.4%) |
| $65,000 to $74,999 | 25 (4.7%) | 8 (1.8%) |
| $75,000 to $99,999 | 8 (1.5%) | 33 (7.6%) |
| $100,000+ | 21 (3.9%) | 0 (0.0%) |
| Total | 535 (100.0%) | 435 (100.0%) |
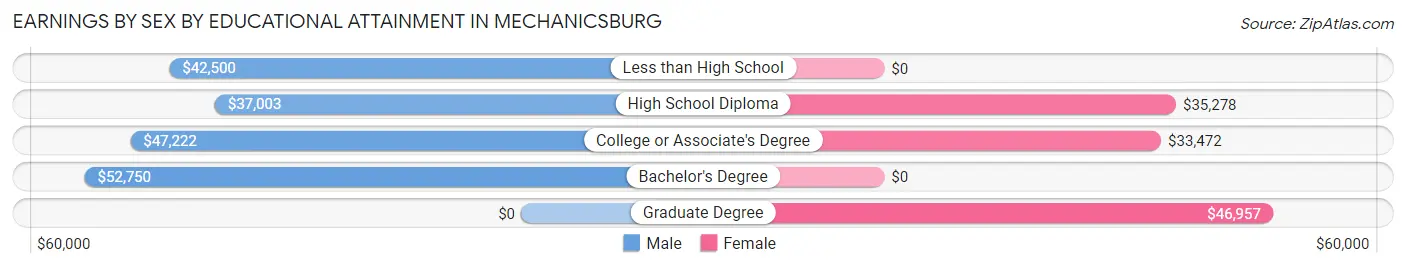
Earnings by Sex by Educational Attainment in Mechanicsburg
Average earnings in Mechanicsburg are $44,868 for men and $36,845 for women, a difference of 17.9%. Men with an educational attainment of bachelor's degree enjoy the highest average annual earnings of $52,750, while those with high school diploma education earn the least with $37,003. Women with an educational attainment of graduate degree earn the most with the average annual earnings of $46,957, while those with college or associate's degree education have the smallest earnings of $33,472.
| Educational Attainment | Male Income | Female Income |
| Less than High School | $42,500 | $0 |
| High School Diploma | $37,003 | $35,278 |
| College or Associate's Degree | $47,222 | $33,472 |
| Bachelor's Degree | $52,750 | $0 |
| Graduate Degree | - | - |
| Total | $44,868 | $36,845 |
Family Income in Mechanicsburg
Family Income Brackets in Mechanicsburg
According to the Mechanicsburg family income data, there are 125 families falling into the $50,000 to $74,999 income range, which is the most common income bracket and makes up 26.4% of all families. Conversely, the $10,000 to $14,999 income bracket is the least frequent group with only 3 families (0.6%) belonging to this category.
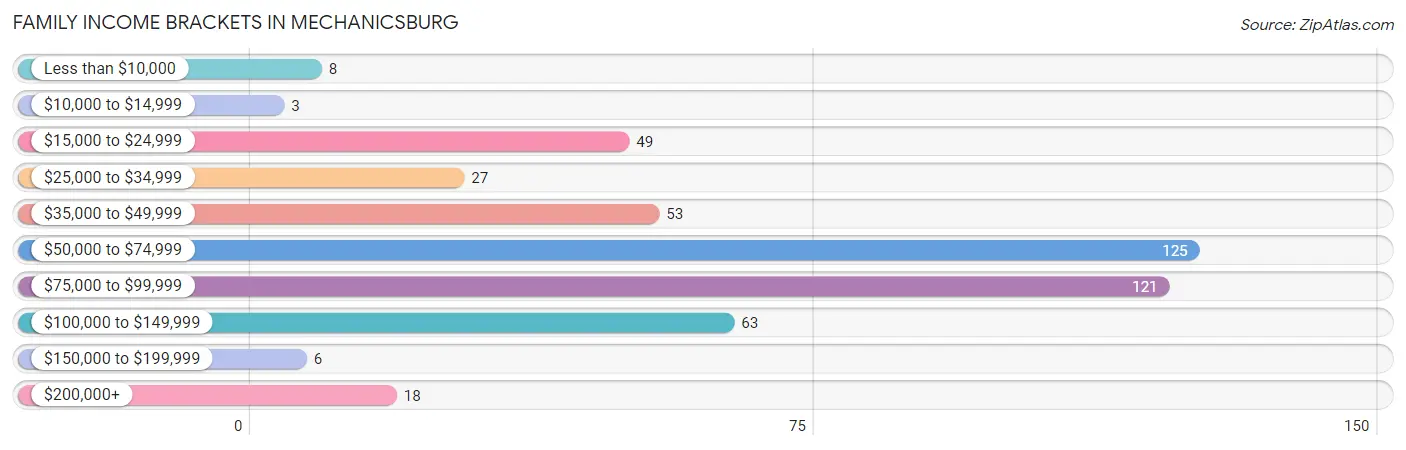
| Income Bracket | # Families | % Families |
| Less than $10,000 | 8 | 1.7% |
| $10,000 to $14,999 | 3 | 0.6% |
| $15,000 to $24,999 | 49 | 10.4% |
| $25,000 to $34,999 | 27 | 5.7% |
| $35,000 to $49,999 | 53 | 11.2% |
| $50,000 to $74,999 | 125 | 26.4% |
| $75,000 to $99,999 | 121 | 25.6% |
| $100,000 to $149,999 | 63 | 13.3% |
| $150,000 to $199,999 | 6 | 1.3% |
| $200,000+ | 18 | 3.8% |
Family Income by Famaliy Size in Mechanicsburg
4-person families (101 | 21.3%) account for the highest median family income in Mechanicsburg with $76,183 per family, while 2-person families (204 | 43.1%) have the highest median income of $26,111 per family member.
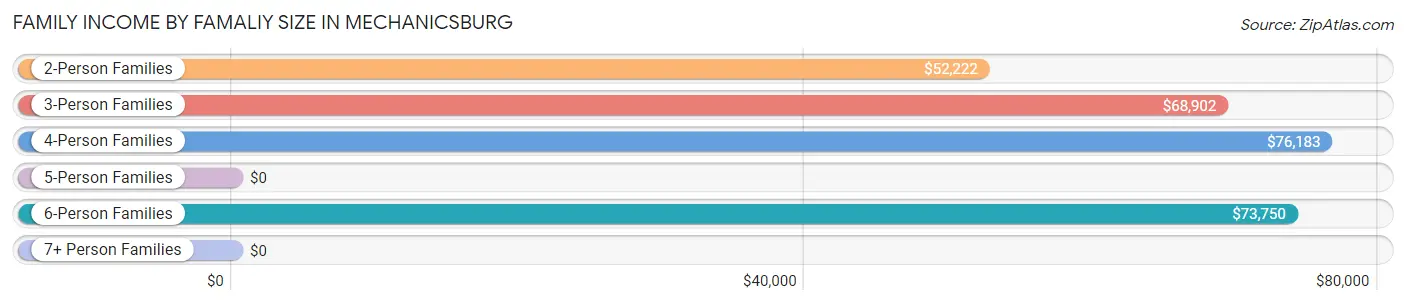
| Income Bracket | # Families | Median Income |
| 2-Person Families | 204 (43.1%) | $52,222 |
| 3-Person Families | 127 (26.9%) | $68,902 |
| 4-Person Families | 101 (21.3%) | $76,183 |
| 5-Person Families | 27 (5.7%) | $0 |
| 6-Person Families | 12 (2.5%) | $73,750 |
| 7+ Person Families | 2 (0.4%) | $0 |
| Total | 473 (100.0%) | $69,179 |
Family Income by Number of Earners in Mechanicsburg
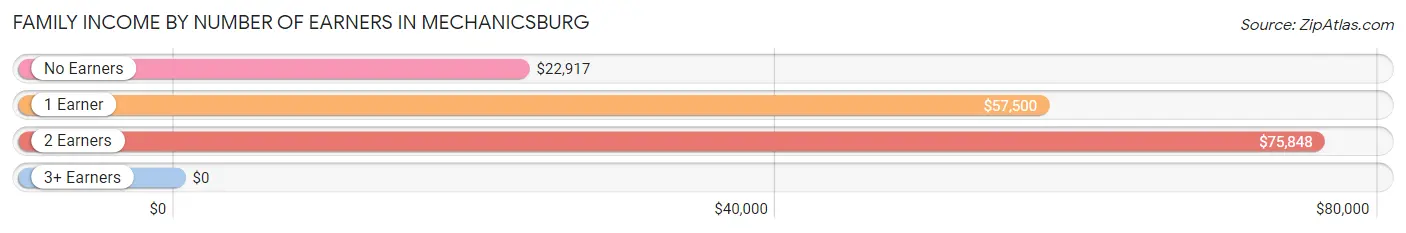
| Number of Earners | # Families | Median Income |
| No Earners | 69 (14.6%) | $22,917 |
| 1 Earner | 116 (24.5%) | $57,500 |
| 2 Earners | 270 (57.1%) | $75,848 |
| 3+ Earners | 18 (3.8%) | $0 |
| Total | 473 (100.0%) | $69,179 |
Household Income in Mechanicsburg
Household Income Brackets in Mechanicsburg
With 180 households falling in the category, the $50,000 to $74,999 income range is the most frequent in Mechanicsburg, accounting for 24.4% of all households. In contrast, only 2 households (0.3%) fall into the $150,000 to $199,999 income bracket, making it the least populous group.
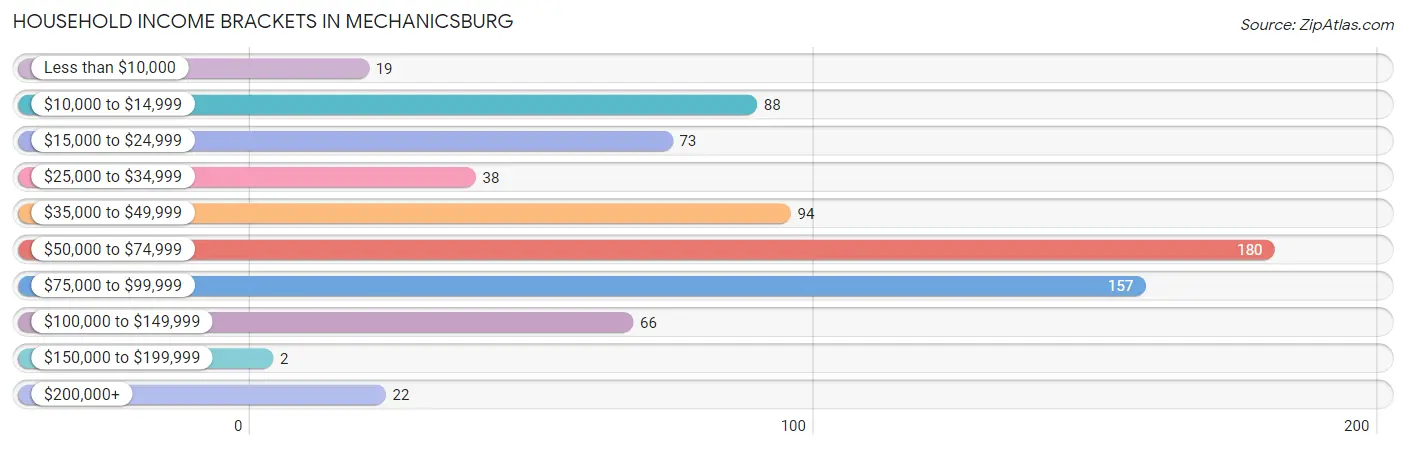
| Income Bracket | # Households | % Households |
| Less than $10,000 | 19 | 2.6% |
| $10,000 to $14,999 | 88 | 11.9% |
| $15,000 to $24,999 | 73 | 9.9% |
| $25,000 to $34,999 | 38 | 5.1% |
| $35,000 to $49,999 | 94 | 12.7% |
| $50,000 to $74,999 | 180 | 24.4% |
| $75,000 to $99,999 | 157 | 21.2% |
| $100,000 to $149,999 | 66 | 8.9% |
| $150,000 to $199,999 | 2 | 0.3% |
| $200,000+ | 22 | 3.0% |
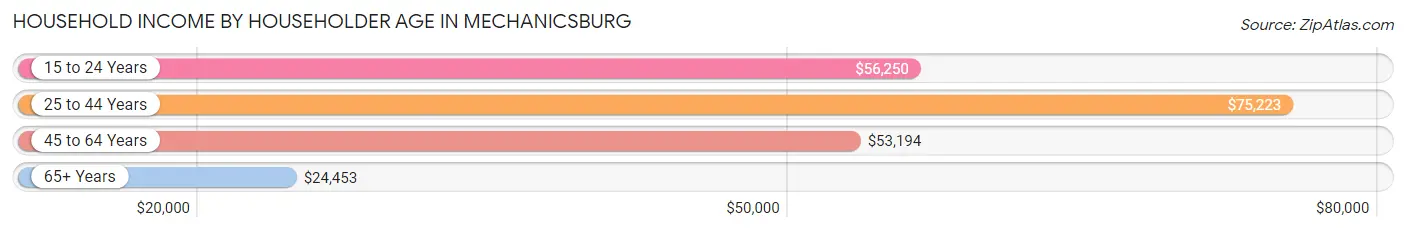
Household Income by Householder Age in Mechanicsburg
The median household income in Mechanicsburg is $56,146, with the highest median household income of $75,223 found in the 25 to 44 years age bracket for the primary householder. A total of 276 households (37.3%) fall into this category. Meanwhile, the 65+ years age bracket for the primary householder has the lowest median household income of $24,453, with 153 households (20.7%) in this group.
| Income Bracket | # Households | Median Income |
| 15 to 24 Years | 22 (3.0%) | $56,250 |
| 25 to 44 Years | 276 (37.3%) | $75,223 |
| 45 to 64 Years | 288 (39.0%) | $53,194 |
| 65+ Years | 153 (20.7%) | $24,453 |
| Total | 739 (100.0%) | $56,146 |
Poverty in Mechanicsburg
Income Below Poverty by Sex and Age in Mechanicsburg
With 13.0% poverty level for males and 19.9% for females among the residents of Mechanicsburg, 55 to 64 year old males and 12 to 14 year old females are the most vulnerable to poverty, with 56 males (40.9%) and 9 females (100.0%) in their respective age groups living below the poverty level.
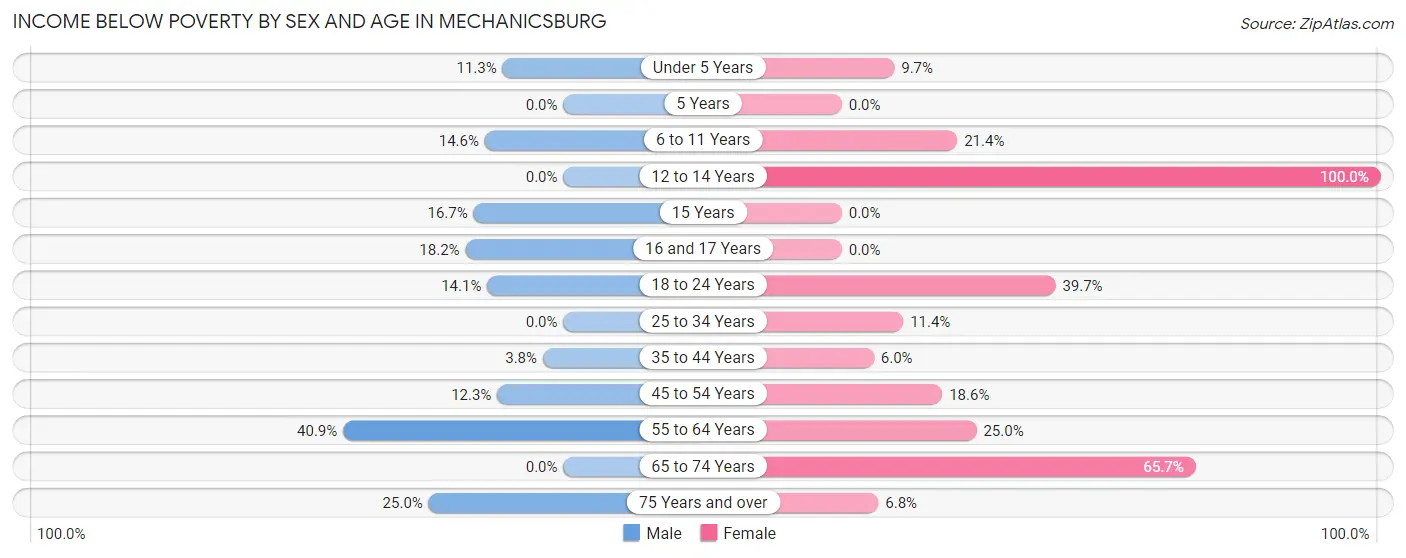
| Age Bracket | Male | Female |
| Under 5 Years | 7 (11.3%) | 15 (9.7%) |
| 5 Years | 0 (0.0%) | 0 (0.0%) |
| 6 to 11 Years | 7 (14.6%) | 6 (21.4%) |
| 12 to 14 Years | 0 (0.0%) | 9 (100.0%) |
| 15 Years | 1 (16.7%) | 0 (0.0%) |
| 16 and 17 Years | 6 (18.2%) | 0 (0.0%) |
| 18 to 24 Years | 13 (14.1%) | 23 (39.7%) |
| 25 to 34 Years | 0 (0.0%) | 22 (11.4%) |
| 35 to 44 Years | 3 (3.8%) | 5 (5.9%) |
| 45 to 54 Years | 7 (12.3%) | 11 (18.6%) |
| 55 to 64 Years | 56 (40.9%) | 38 (25.0%) |
| 65 to 74 Years | 0 (0.0%) | 44 (65.7%) |
| 75 Years and over | 8 (25.0%) | 4 (6.8%) |
| Total | 108 (13.0%) | 177 (19.9%) |
Income Above Poverty by Sex and Age in Mechanicsburg
According to the poverty statistics in Mechanicsburg, males aged 5 years and females aged 5 years are the age groups that are most secure financially, with 100.0% of males and 100.0% of females in these age groups living above the poverty line.
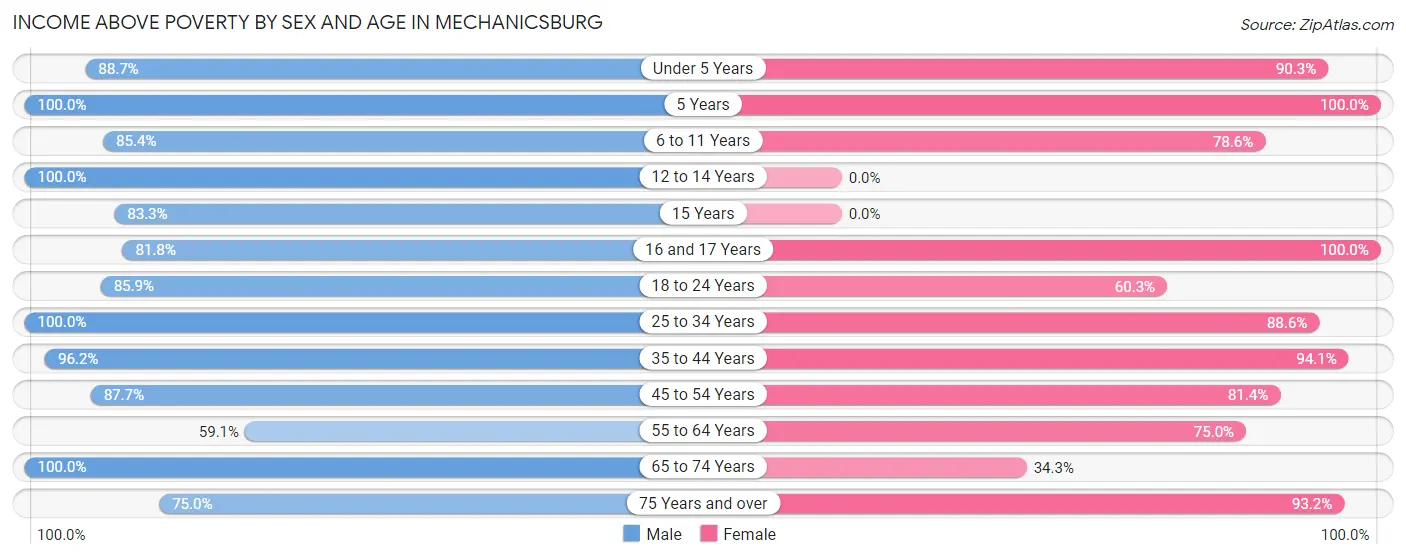
| Age Bracket | Male | Female |
| Under 5 Years | 55 (88.7%) | 139 (90.3%) |
| 5 Years | 17 (100.0%) | 3 (100.0%) |
| 6 to 11 Years | 41 (85.4%) | 22 (78.6%) |
| 12 to 14 Years | 32 (100.0%) | 0 (0.0%) |
| 15 Years | 5 (83.3%) | 0 (0.0%) |
| 16 and 17 Years | 27 (81.8%) | 24 (100.0%) |
| 18 to 24 Years | 79 (85.9%) | 35 (60.3%) |
| 25 to 34 Years | 203 (100.0%) | 171 (88.6%) |
| 35 to 44 Years | 76 (96.2%) | 79 (94.1%) |
| 45 to 54 Years | 50 (87.7%) | 48 (81.4%) |
| 55 to 64 Years | 81 (59.1%) | 114 (75.0%) |
| 65 to 74 Years | 33 (100.0%) | 23 (34.3%) |
| 75 Years and over | 24 (75.0%) | 55 (93.2%) |
| Total | 723 (87.0%) | 713 (80.1%) |
Income Below Poverty Among Married-Couple Families in Mechanicsburg
The poverty statistics for married-couple families in Mechanicsburg show that 4.8% or 15 of the total 310 families live below the poverty line. Families with 1 or 2 children have the highest poverty rate of 8.1%, comprising of 15 families. On the other hand, families with no children have the lowest poverty rate of 0.0%, which includes 0 families.
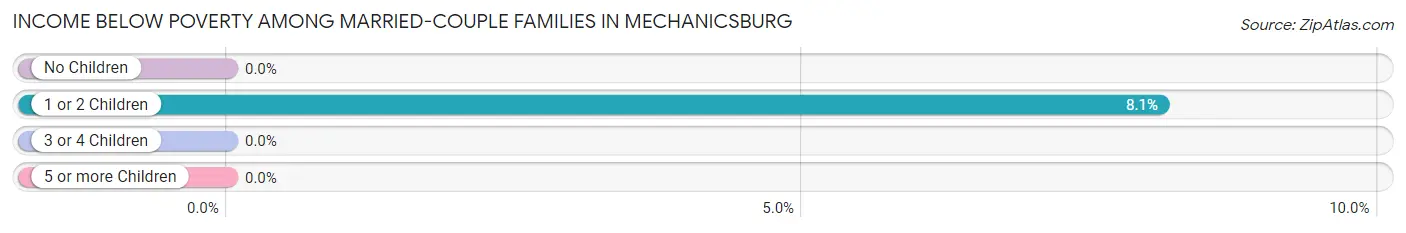
| Children | Above Poverty | Below Poverty |
| No Children | 117 (100.0%) | 0 (0.0%) |
| 1 or 2 Children | 170 (91.9%) | 15 (8.1%) |
| 3 or 4 Children | 8 (100.0%) | 0 (0.0%) |
| 5 or more Children | 0 (0.0%) | 0 (0.0%) |
| Total | 295 (95.2%) | 15 (4.8%) |
Income Below Poverty Among Single-Parent Households in Mechanicsburg
According to the poverty data in Mechanicsburg, 4.3% or 2 single-father households and 23.9% or 28 single-mother households are living below the poverty line. Among single-father households, those with 1 or 2 children have the highest poverty rate, with 2 households (8.0%) experiencing poverty. Likewise, among single-mother households, those with 3 or 4 children have the highest poverty rate, with 5 households (100.0%) falling below the poverty line.
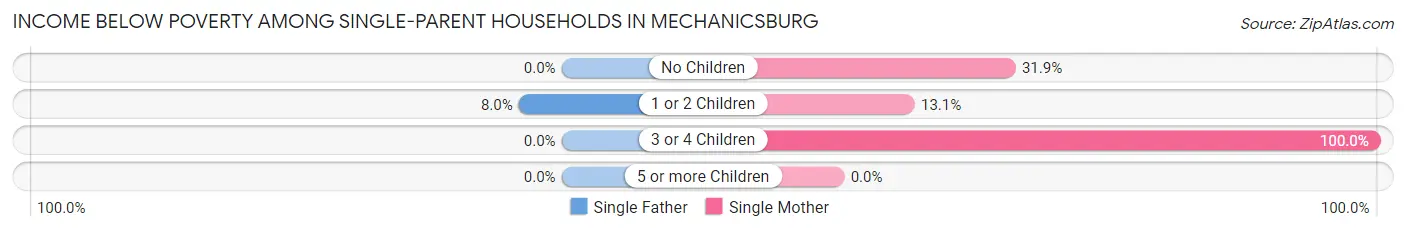
| Children | Single Father | Single Mother |
| No Children | 0 (0.0%) | 15 (31.9%) |
| 1 or 2 Children | 2 (8.0%) | 8 (13.1%) |
| 3 or 4 Children | 0 (0.0%) | 5 (100.0%) |
| 5 or more Children | 0 (0.0%) | 0 (0.0%) |
| Total | 2 (4.3%) | 28 (23.9%) |
Income Below Poverty Among Married-Couple vs Single-Parent Households in Mechanicsburg
The poverty data for Mechanicsburg shows that 15 of the married-couple family households (4.8%) and 30 of the single-parent households (18.4%) are living below the poverty level. Within the married-couple family households, those with 1 or 2 children have the highest poverty rate, with 15 households (8.1%) falling below the poverty line. Among the single-parent households, those with 3 or 4 children have the highest poverty rate, with 5 household (100.0%) living below poverty.
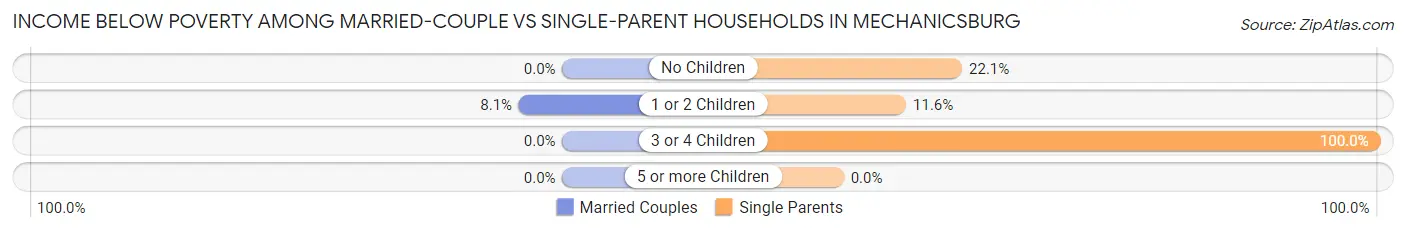
| Children | Married-Couple Families | Single-Parent Households |
| No Children | 0 (0.0%) | 15 (22.1%) |
| 1 or 2 Children | 15 (8.1%) | 10 (11.6%) |
| 3 or 4 Children | 0 (0.0%) | 5 (100.0%) |
| 5 or more Children | 0 (0.0%) | 0 (0.0%) |
| Total | 15 (4.8%) | 30 (18.4%) |
Race in Mechanicsburg
The most populous races in Mechanicsburg are White / Caucasian (1,721 | 92.5%), Two or more Races (69 | 3.7%), and Hispanic or Latino (67 | 3.6%).
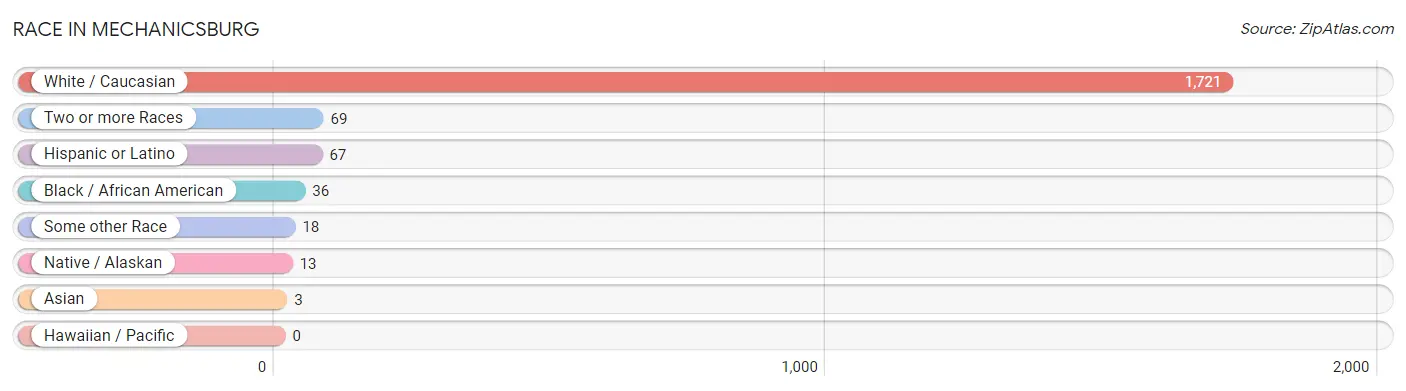
| Race | # Population | % Population |
| Asian | 3 | 0.2% |
| Black / African American | 36 | 1.9% |
| Hawaiian / Pacific | 0 | 0.0% |
| Hispanic or Latino | 67 | 3.6% |
| Native / Alaskan | 13 | 0.7% |
| White / Caucasian | 1,721 | 92.5% |
| Two or more Races | 69 | 3.7% |
| Some other Race | 18 | 1.0% |
| Total | 1,860 | 100.0% |
Ancestry in Mechanicsburg
The most populous ancestries reported in Mechanicsburg are German (365 | 19.6%), Irish (224 | 12.0%), American (204 | 11.0%), English (118 | 6.3%), and European (81 | 4.3%), together accounting for 53.3% of all Mechanicsburg residents.
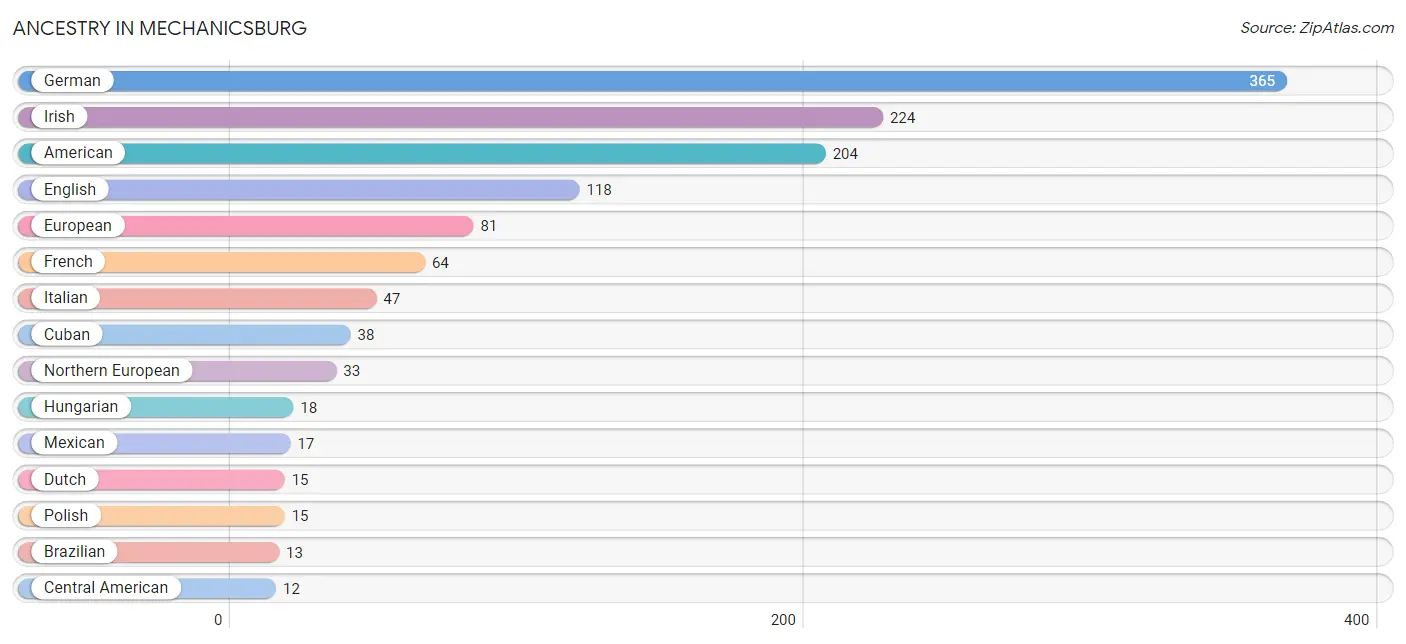
| Ancestry | # Population | % Population |
| African | 9 | 0.5% |
| American | 204 | 11.0% |
| Australian | 5 | 0.3% |
| Blackfeet | 7 | 0.4% |
| Brazilian | 13 | 0.7% |
| British | 2 | 0.1% |
| Central American | 12 | 0.6% |
| Creek | 2 | 0.1% |
| Cuban | 38 | 2.0% |
| Danish | 8 | 0.4% |
| Dutch | 15 | 0.8% |
| English | 118 | 6.3% |
| European | 81 | 4.3% |
| French | 64 | 3.4% |
| French Canadian | 3 | 0.2% |
| German | 365 | 19.6% |
| Greek | 5 | 0.3% |
| Guatemalan | 7 | 0.4% |
| Honduran | 5 | 0.3% |
| Hungarian | 18 | 1.0% |
| Irish | 224 | 12.0% |
| Italian | 47 | 2.5% |
| Korean | 3 | 0.2% |
| Mexican | 17 | 0.9% |
| Northern European | 33 | 1.8% |
| Polish | 15 | 0.8% |
| Russian | 4 | 0.2% |
| Scotch-Irish | 1 | 0.1% |
| Scottish | 3 | 0.2% |
| Subsaharan African | 9 | 0.5% |
| Swiss | 9 | 0.5% |
| Yugoslavian | 5 | 0.3% | View All 32 Rows |
Immigrants in Mechanicsburg
The most numerous immigrant groups reported in Mechanicsburg came from Latin America (12 | 0.6%), Brazil (7 | 0.4%), South America (7 | 0.4%), Central America (5 | 0.3%), and Honduras (5 | 0.3%), together accounting for 1.9% of all Mechanicsburg residents.
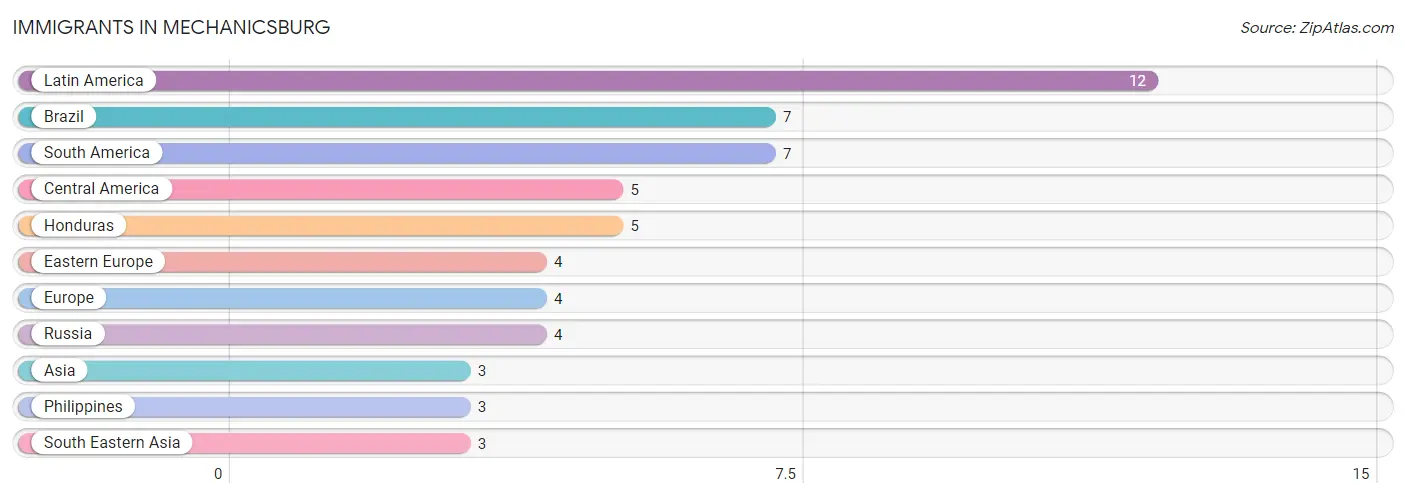
| Immigration Origin | # Population | % Population |
| Asia | 3 | 0.2% |
| Brazil | 7 | 0.4% |
| Central America | 5 | 0.3% |
| Eastern Europe | 4 | 0.2% |
| Europe | 4 | 0.2% |
| Honduras | 5 | 0.3% |
| Latin America | 12 | 0.6% |
| Philippines | 3 | 0.2% |
| Russia | 4 | 0.2% |
| South America | 7 | 0.4% |
| South Eastern Asia | 3 | 0.2% | View All 11 Rows |
Sex and Age in Mechanicsburg
Sex and Age in Mechanicsburg
The most populous age groups in Mechanicsburg are 25 to 29 Years (144 | 15.9%) for men and Under 5 Years (154 | 16.1%) for women.
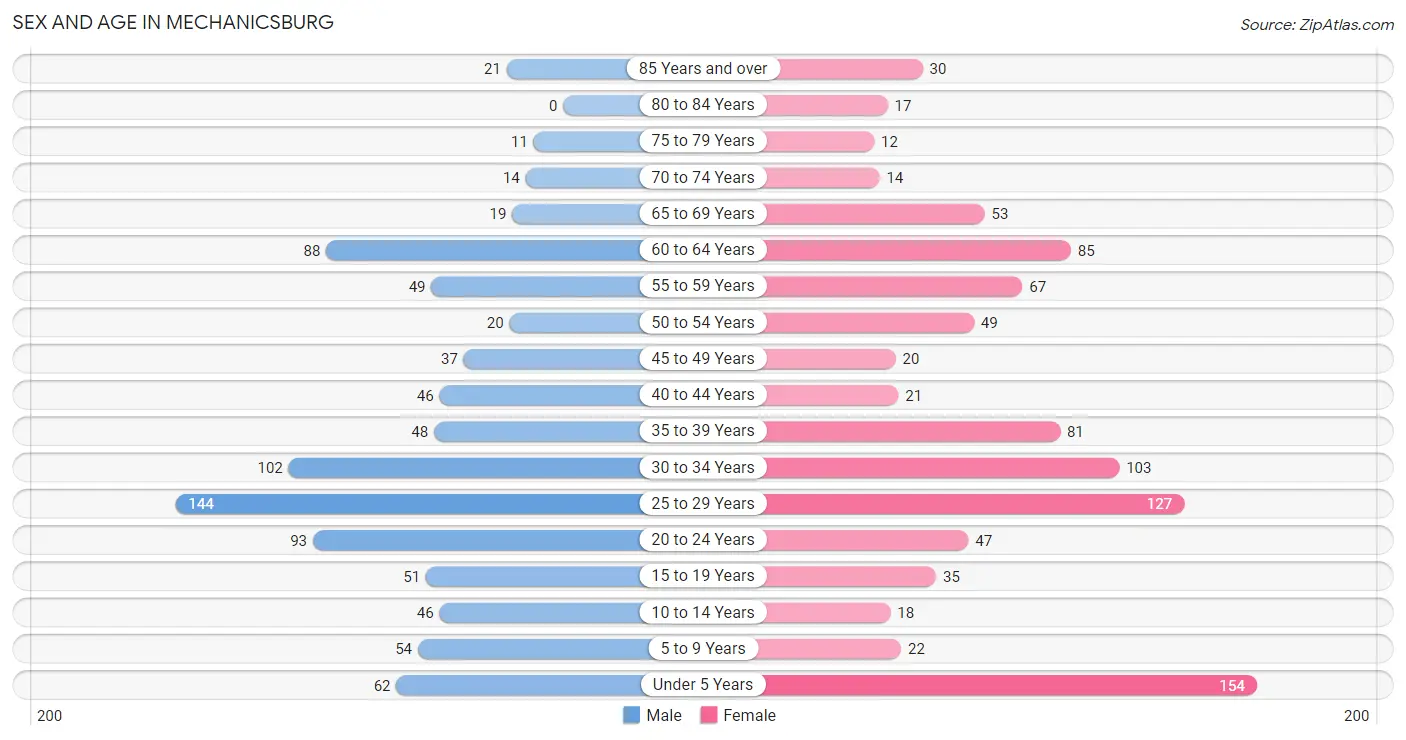
| Age Bracket | Male | Female |
| Under 5 Years | 62 (6.9%) | 154 (16.1%) |
| 5 to 9 Years | 54 (6.0%) | 22 (2.3%) |
| 10 to 14 Years | 46 (5.1%) | 18 (1.9%) |
| 15 to 19 Years | 51 (5.6%) | 35 (3.7%) |
| 20 to 24 Years | 93 (10.3%) | 47 (4.9%) |
| 25 to 29 Years | 144 (15.9%) | 127 (13.3%) |
| 30 to 34 Years | 102 (11.3%) | 103 (10.8%) |
| 35 to 39 Years | 48 (5.3%) | 81 (8.5%) |
| 40 to 44 Years | 46 (5.1%) | 21 (2.2%) |
| 45 to 49 Years | 37 (4.1%) | 20 (2.1%) |
| 50 to 54 Years | 20 (2.2%) | 49 (5.1%) |
| 55 to 59 Years | 49 (5.4%) | 67 (7.0%) |
| 60 to 64 Years | 88 (9.7%) | 85 (8.9%) |
| 65 to 69 Years | 19 (2.1%) | 53 (5.6%) |
| 70 to 74 Years | 14 (1.5%) | 14 (1.5%) |
| 75 to 79 Years | 11 (1.2%) | 12 (1.3%) |
| 80 to 84 Years | 0 (0.0%) | 17 (1.8%) |
| 85 Years and over | 21 (2.3%) | 30 (3.1%) |
| Total | 905 (100.0%) | 955 (100.0%) |
Families and Households in Mechanicsburg
Median Family Size in Mechanicsburg
The median family size in Mechanicsburg is 2.90 persons per family, with married-couple families (310 | 65.5%) accounting for the largest median family size of 2.98 persons per family. On the other hand, single male/father families (46 | 9.7%) represent the smallest median family size with 2.57 persons per family.
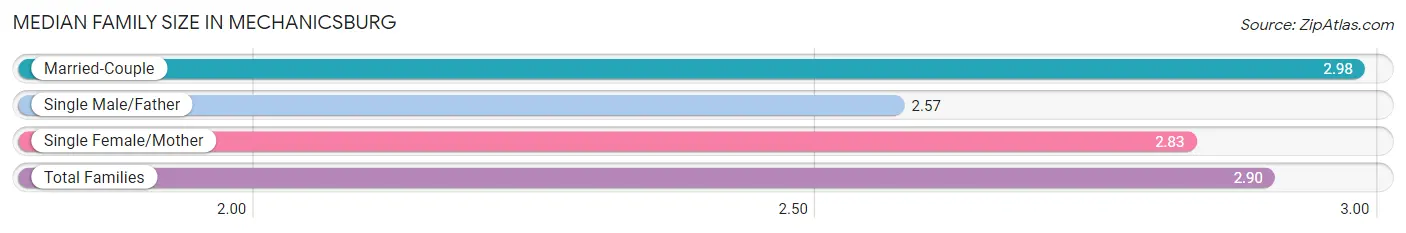
| Family Type | # Families | Family Size |
| Married-Couple | 310 (65.5%) | 2.98 |
| Single Male/Father | 46 (9.7%) | 2.57 |
| Single Female/Mother | 117 (24.7%) | 2.83 |
| Total Families | 473 (100.0%) | 2.90 |
Median Household Size in Mechanicsburg
The median household size in Mechanicsburg is 2.33 persons per household, with married-couple households (310 | 41.9%) accounting for the largest median household size of 3.04 persons per household. non-family households (266 | 36.0%) represent the smallest median household size with 1.17 persons per household.
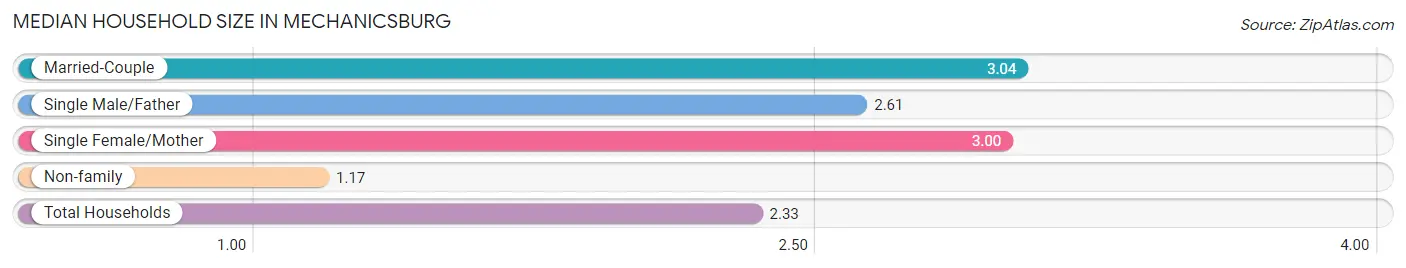
| Household Type | # Households | Household Size |
| Married-Couple | 310 (41.9%) | 3.04 |
| Single Male/Father | 46 (6.2%) | 2.61 |
| Single Female/Mother | 117 (15.8%) | 3.00 |
| Non-family | 266 (36.0%) | 1.17 |
| Total Households | 739 (100.0%) | 2.33 |
Household Size by Marriage Status in Mechanicsburg
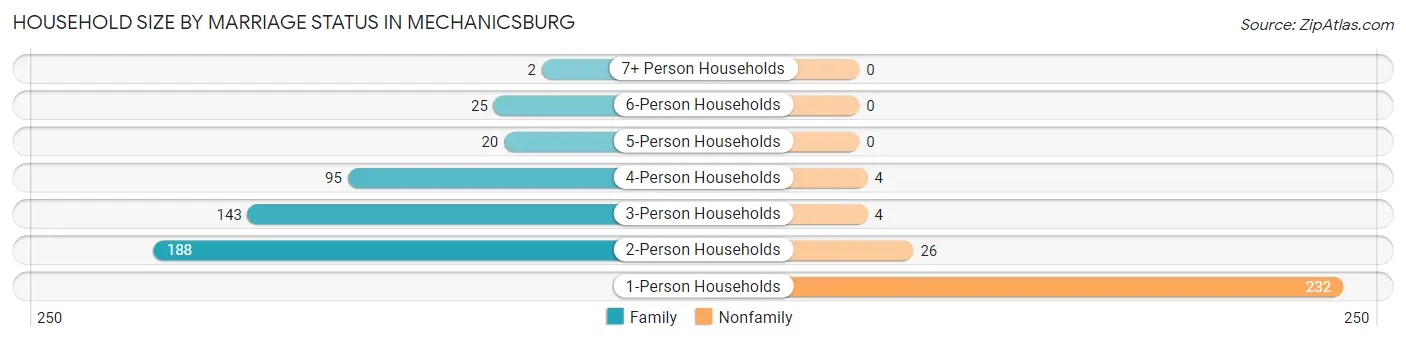
Out of a total of 739 households in Mechanicsburg, 473 (64.0%) are family households, while 266 (36.0%) are nonfamily households. The most numerous type of family households are 2-person households, comprising 188, and the most common type of nonfamily households are 1-person households, comprising 232.
| Household Size | Family Households | Nonfamily Households |
| 1-Person Households | - | 232 (31.4%) |
| 2-Person Households | 188 (25.4%) | 26 (3.5%) |
| 3-Person Households | 143 (19.4%) | 4 (0.5%) |
| 4-Person Households | 95 (12.9%) | 4 (0.5%) |
| 5-Person Households | 20 (2.7%) | 0 (0.0%) |
| 6-Person Households | 25 (3.4%) | 0 (0.0%) |
| 7+ Person Households | 2 (0.3%) | 0 (0.0%) |
| Total | 473 (64.0%) | 266 (36.0%) |
Female Fertility in Mechanicsburg
Fertility by Age in Mechanicsburg
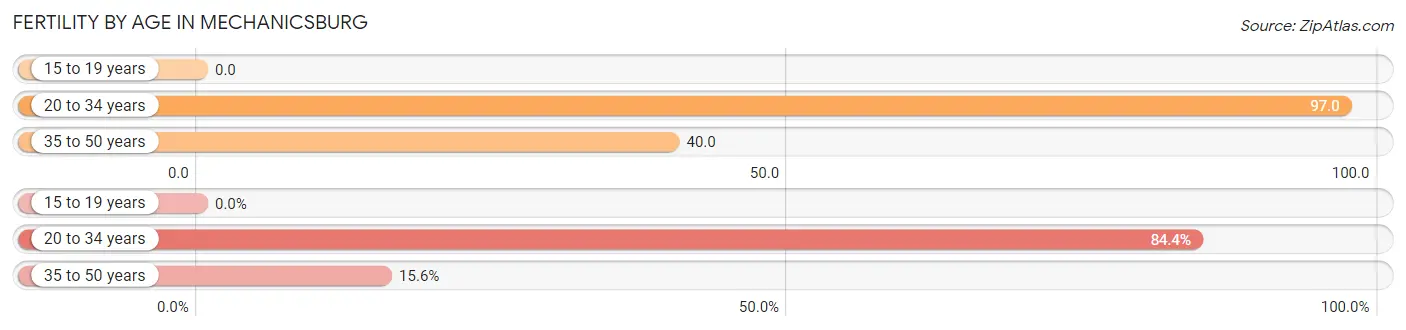
Average fertility rate in Mechanicsburg is 73.0 births per 1,000 women. Women in the age bracket of 20 to 34 years have the highest fertility rate with 97.0 births per 1,000 women. Women in the age bracket of 20 to 34 years acount for 84.4% of all women with births.
| Age Bracket | Women with Births | Births / 1,000 Women |
| 15 to 19 years | 0 (0.0%) | 0.0 |
| 20 to 34 years | 27 (84.4%) | 97.0 |
| 35 to 50 years | 5 (15.6%) | 40.0 |
| Total | 32 (100.0%) | 73.0 |
Fertility by Age by Marriage Status in Mechanicsburg
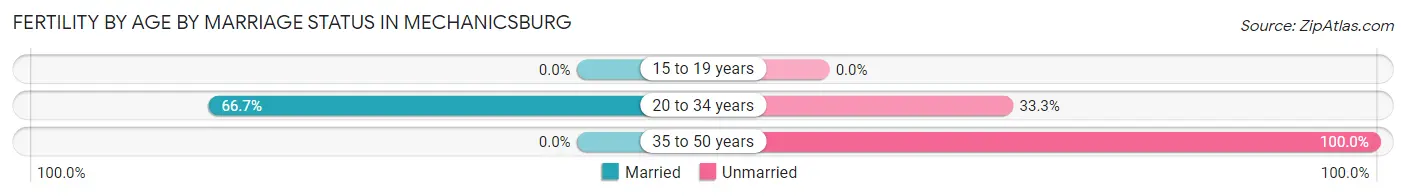
56.2% of women with births (32) in Mechanicsburg are married. The highest percentage of unmarried women with births falls into 35 to 50 years age bracket with 100.0% of them unmarried at the time of birth, while the lowest percentage of unmarried women with births belong to 20 to 34 years age bracket with 33.3% of them unmarried.
| Age Bracket | Married | Unmarried |
| 15 to 19 years | 0 (0.0%) | 0 (0.0%) |
| 20 to 34 years | 18 (66.7%) | 9 (33.3%) |
| 35 to 50 years | 0 (0.0%) | 5 (100.0%) |
| Total | 18 (56.2%) | 14 (43.8%) |
Fertility by Education in Mechanicsburg
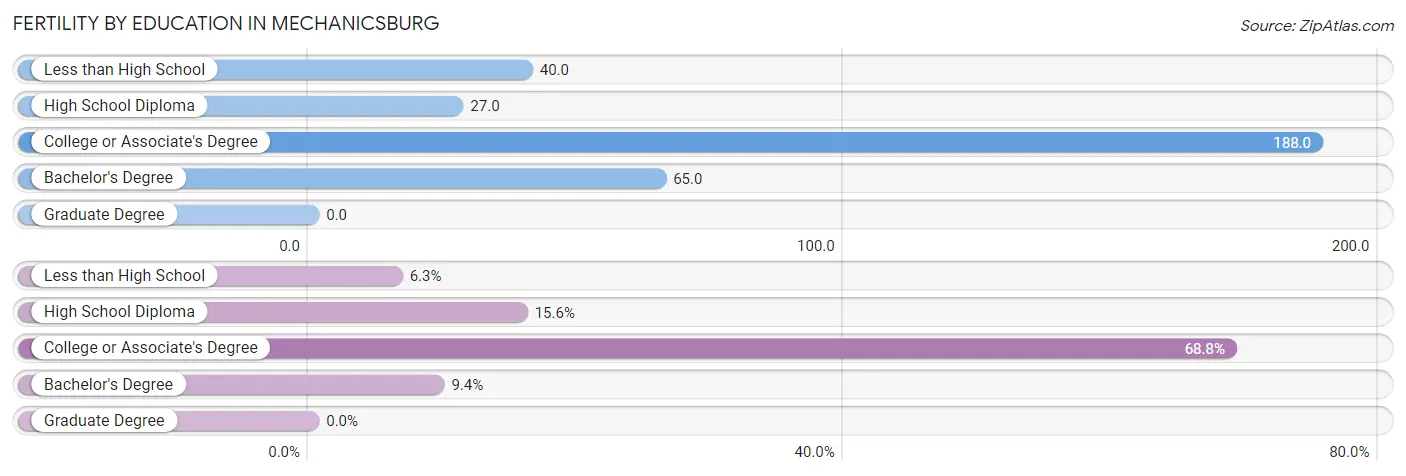
| Educational Attainment | Women with Births | Births / 1,000 Women |
| Less than High School | 2 (6.2%) | 40.0 |
| High School Diploma | 5 (15.6%) | 27.0 |
| College or Associate's Degree | 22 (68.8%) | 188.0 |
| Bachelor's Degree | 3 (9.4%) | 65.0 |
| Graduate Degree | 0 (0.0%) | 0.0 |
| Total | 32 (100.0%) | 73.0 |
Fertility by Education by Marriage Status in Mechanicsburg
43.8% of women with births in Mechanicsburg are unmarried. Women with the educational attainment of high school diploma are most likely to be married with 100.0% of them married at childbirth, while women with the educational attainment of less than high school are least likely to be married with 100.0% of them unmarried at childbirth.
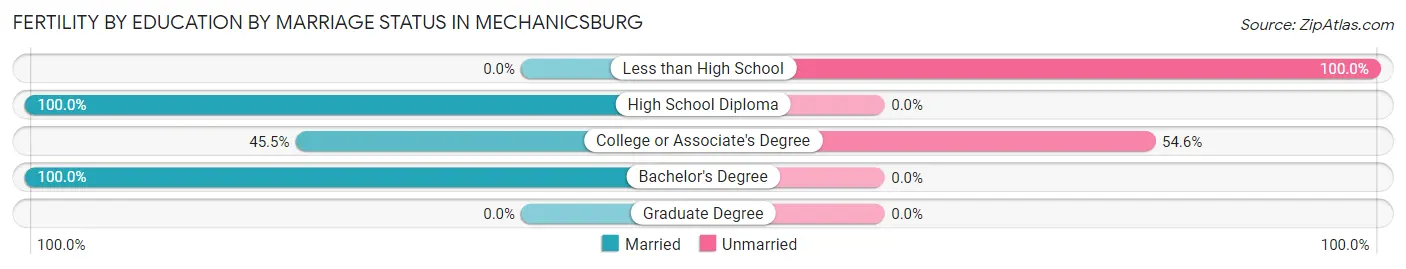
| Educational Attainment | Married | Unmarried |
| Less than High School | 0 (0.0%) | 2 (100.0%) |
| High School Diploma | 5 (100.0%) | 0 (0.0%) |
| College or Associate's Degree | 10 (45.5%) | 12 (54.5%) |
| Bachelor's Degree | 3 (100.0%) | 0 (0.0%) |
| Graduate Degree | 0 (0.0%) | 0 (0.0%) |
| Total | 18 (56.2%) | 14 (43.8%) |
Employment Characteristics in Mechanicsburg
Employment by Class of Employer in Mechanicsburg
Among the 803 employed individuals in Mechanicsburg, private company employees (590 | 73.5%), not-for-profit organizations (83 | 10.3%), and local government employees (50 | 6.2%) make up the most common classes of employment.
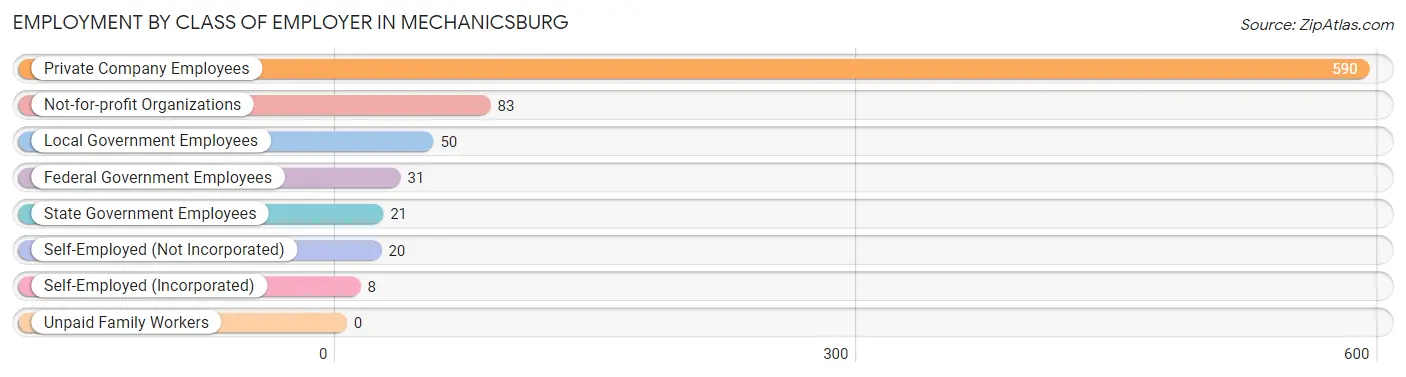
| Employer Class | # Employees | % Employees |
| Private Company Employees | 590 | 73.5% |
| Self-Employed (Incorporated) | 8 | 1.0% |
| Self-Employed (Not Incorporated) | 20 | 2.5% |
| Not-for-profit Organizations | 83 | 10.3% |
| Local Government Employees | 50 | 6.2% |
| State Government Employees | 21 | 2.6% |
| Federal Government Employees | 31 | 3.9% |
| Unpaid Family Workers | 0 | 0.0% |
| Total | 803 | 100.0% |
Employment Status by Age in Mechanicsburg
According to the labor force statistics for Mechanicsburg, out of the total population over 16 years of age (1,498), 57.5% or 861 individuals are in the labor force, with 2.1% or 18 of them unemployed. The age group with the highest labor force participation rate is 30 to 34 years, with 82.9% or 170 individuals in the labor force. Within the labor force, the 20 to 24 years age range has the highest percentage of unemployed individuals, with 13.8% or 15 of them being unemployed.
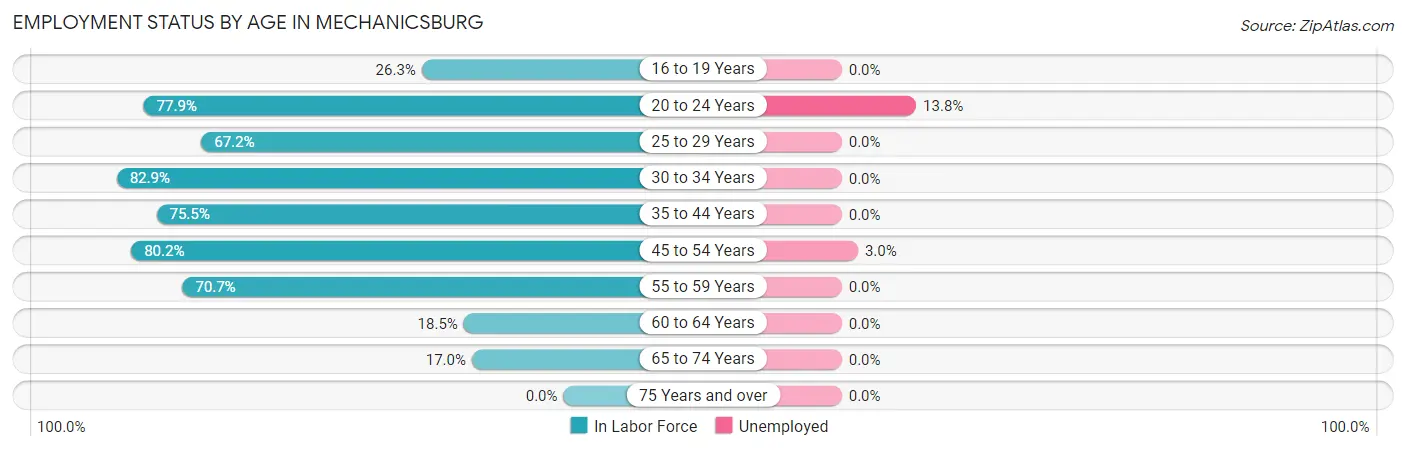
| Age Bracket | In Labor Force | Unemployed |
| 16 to 19 Years | 21 (26.3%) | 0 (0.0%) |
| 20 to 24 Years | 109 (77.9%) | 15 (13.8%) |
| 25 to 29 Years | 182 (67.2%) | 0 (0.0%) |
| 30 to 34 Years | 170 (82.9%) | 0 (0.0%) |
| 35 to 44 Years | 148 (75.5%) | 0 (0.0%) |
| 45 to 54 Years | 101 (80.2%) | 3 (3.0%) |
| 55 to 59 Years | 82 (70.7%) | 0 (0.0%) |
| 60 to 64 Years | 32 (18.5%) | 0 (0.0%) |
| 65 to 74 Years | 17 (17.0%) | 0 (0.0%) |
| 75 Years and over | 0 (0.0%) | 0 (0.0%) |
| Total | 861 (57.5%) | 18 (2.1%) |
Employment Status by Educational Attainment in Mechanicsburg
According to labor force statistics for Mechanicsburg, 65.8% of individuals (715) out of the total population between 25 and 64 years of age (1,087) are in the labor force, with 0.4% or 3 of them being unemployed. The group with the highest labor force participation rate are those with the educational attainment of bachelor's degree or higher, with 88.1% or 141 individuals in the labor force. Within the labor force, individuals with bachelor's degree or higher education have the highest percentage of unemployment, with 2.1% or 3 of them being unemployed.
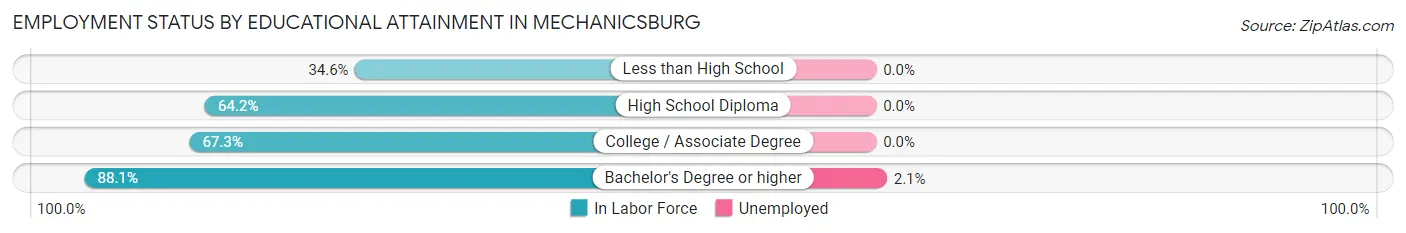
| Educational Attainment | In Labor Force | Unemployed |
| Less than High School | 37 (34.6%) | 0 (0.0%) |
| High School Diploma | 309 (64.2%) | 0 (0.0%) |
| College / Associate Degree | 228 (67.3%) | 0 (0.0%) |
| Bachelor's Degree or higher | 141 (88.1%) | 3 (2.1%) |
| Total | 715 (65.8%) | 4 (0.4%) |
Employment Occupations by Sex in Mechanicsburg
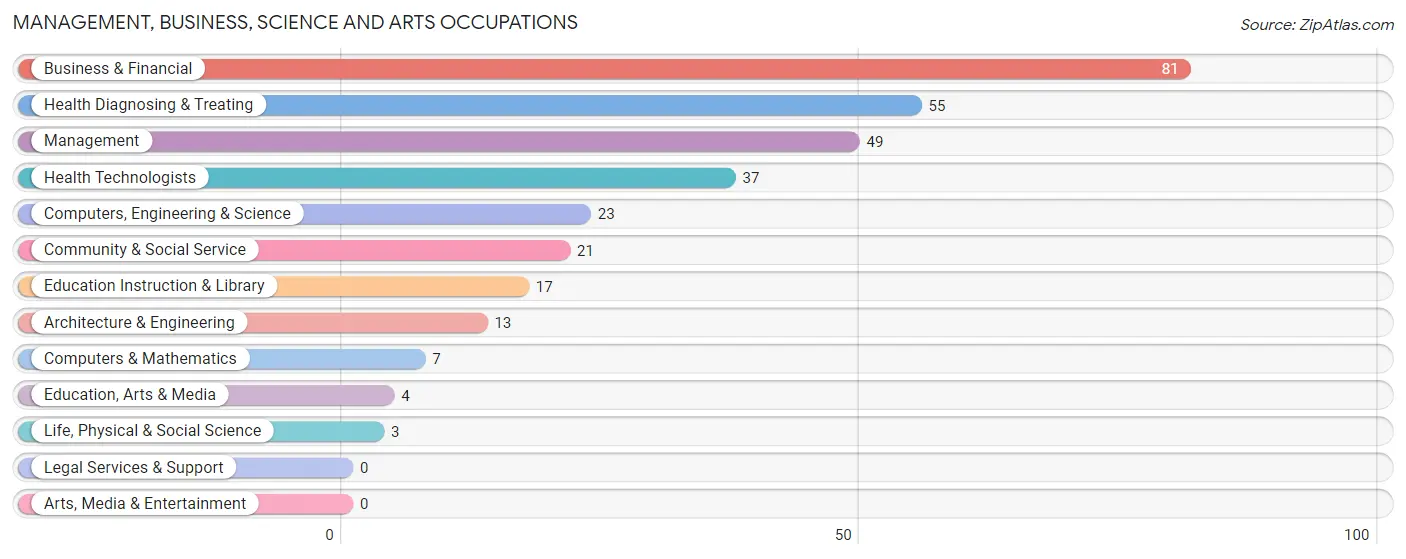
Management, Business, Science and Arts Occupations
The most common Management, Business, Science and Arts occupations in Mechanicsburg are Business & Financial (81 | 9.6%), Health Diagnosing & Treating (55 | 6.5%), Management (49 | 5.8%), Health Technologists (37 | 4.4%), and Computers, Engineering & Science (23 | 2.7%).
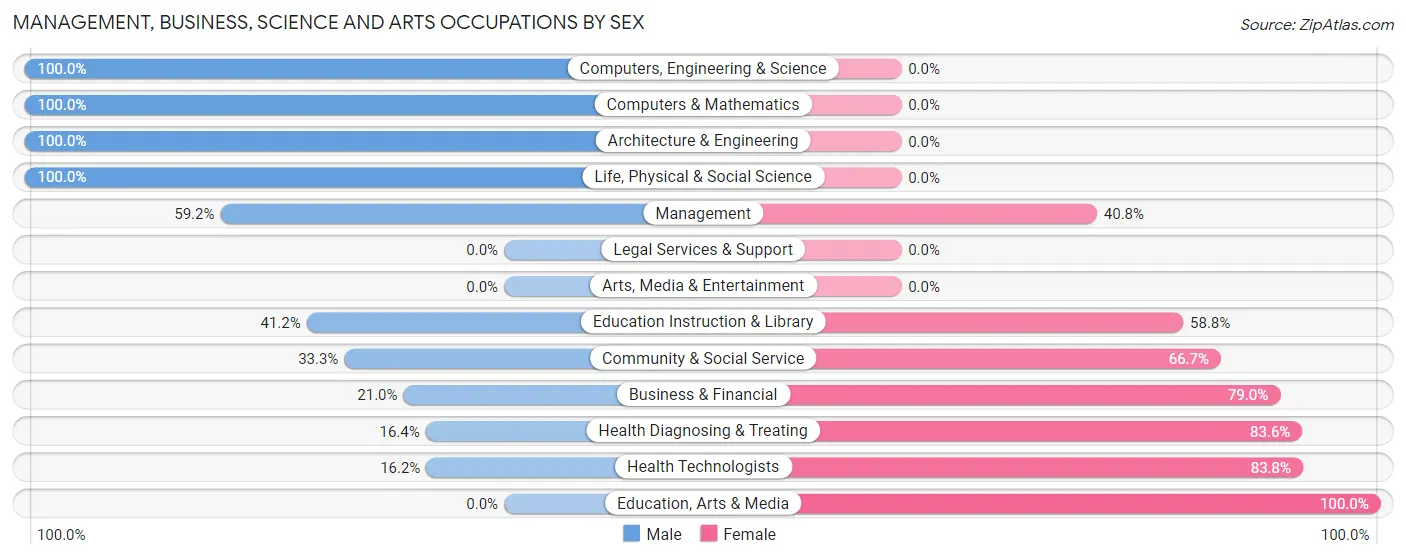
Management, Business, Science and Arts Occupations by Sex
Within the Management, Business, Science and Arts occupations in Mechanicsburg, the most male-oriented occupations are Computers, Engineering & Science (100.0%), Computers & Mathematics (100.0%), and Architecture & Engineering (100.0%), while the most female-oriented occupations are Education, Arts & Media (100.0%), Health Technologists (83.8%), and Health Diagnosing & Treating (83.6%).
| Occupation | Male | Female |
| Management | 29 (59.2%) | 20 (40.8%) |
| Business & Financial | 17 (21.0%) | 64 (79.0%) |
| Computers, Engineering & Science | 23 (100.0%) | 0 (0.0%) |
| Computers & Mathematics | 7 (100.0%) | 0 (0.0%) |
| Architecture & Engineering | 13 (100.0%) | 0 (0.0%) |
| Life, Physical & Social Science | 3 (100.0%) | 0 (0.0%) |
| Community & Social Service | 7 (33.3%) | 14 (66.7%) |
| Education, Arts & Media | 0 (0.0%) | 4 (100.0%) |
| Legal Services & Support | 0 (0.0%) | 0 (0.0%) |
| Education Instruction & Library | 7 (41.2%) | 10 (58.8%) |
| Arts, Media & Entertainment | 0 (0.0%) | 0 (0.0%) |
| Health Diagnosing & Treating | 9 (16.4%) | 46 (83.6%) |
| Health Technologists | 6 (16.2%) | 31 (83.8%) |
| Total (Category) | 85 (37.1%) | 144 (62.9%) |
| Total (Overall) | 467 (55.3%) | 377 (44.7%) |
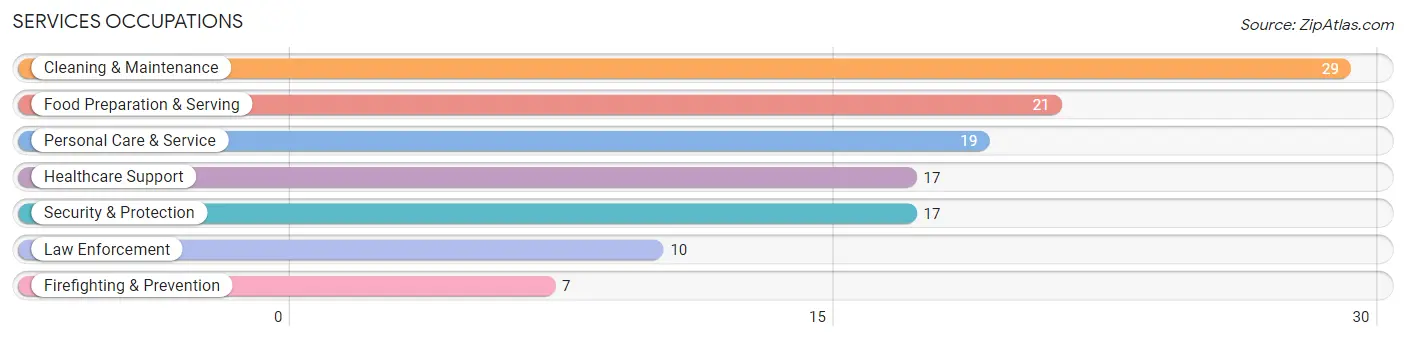
Services Occupations
The most common Services occupations in Mechanicsburg are Cleaning & Maintenance (29 | 3.4%), Food Preparation & Serving (21 | 2.5%), Personal Care & Service (19 | 2.2%), Healthcare Support (17 | 2.0%), and Security & Protection (17 | 2.0%).
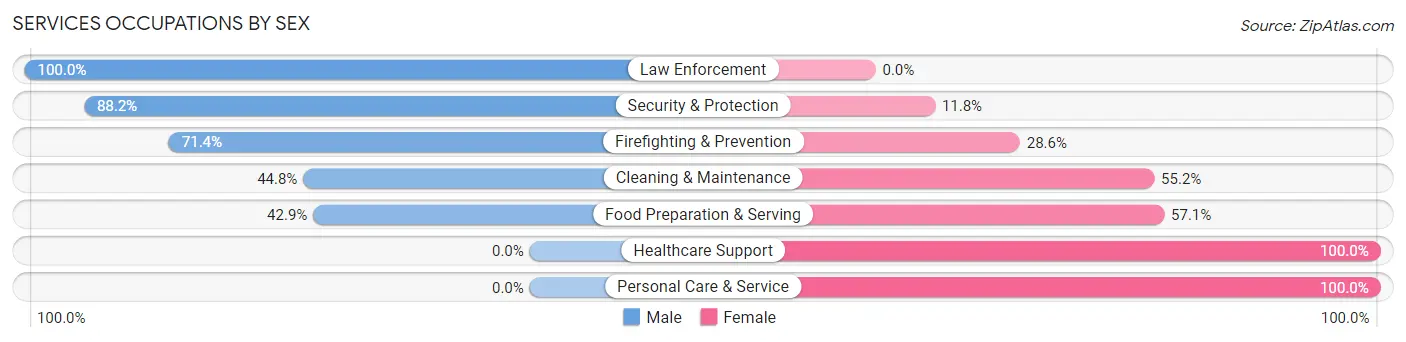
Services Occupations by Sex
Within the Services occupations in Mechanicsburg, the most male-oriented occupations are Law Enforcement (100.0%), Security & Protection (88.2%), and Firefighting & Prevention (71.4%), while the most female-oriented occupations are Healthcare Support (100.0%), Personal Care & Service (100.0%), and Food Preparation & Serving (57.1%).
| Occupation | Male | Female |
| Healthcare Support | 0 (0.0%) | 17 (100.0%) |
| Security & Protection | 15 (88.2%) | 2 (11.8%) |
| Firefighting & Prevention | 5 (71.4%) | 2 (28.6%) |
| Law Enforcement | 10 (100.0%) | 0 (0.0%) |
| Food Preparation & Serving | 9 (42.9%) | 12 (57.1%) |
| Cleaning & Maintenance | 13 (44.8%) | 16 (55.2%) |
| Personal Care & Service | 0 (0.0%) | 19 (100.0%) |
| Total (Category) | 37 (35.9%) | 66 (64.1%) |
| Total (Overall) | 467 (55.3%) | 377 (44.7%) |
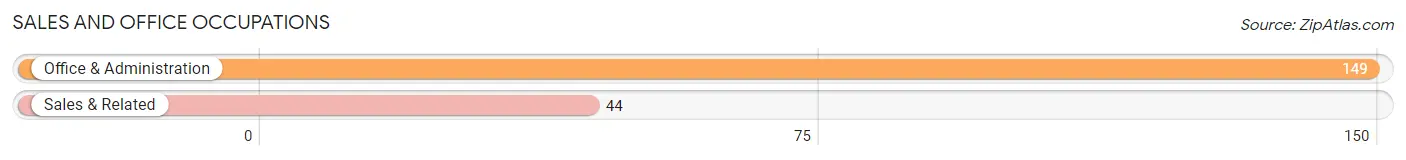
Sales and Office Occupations
The most common Sales and Office occupations in Mechanicsburg are Office & Administration (149 | 17.6%), and Sales & Related (44 | 5.2%).
Sales and Office Occupations by Sex
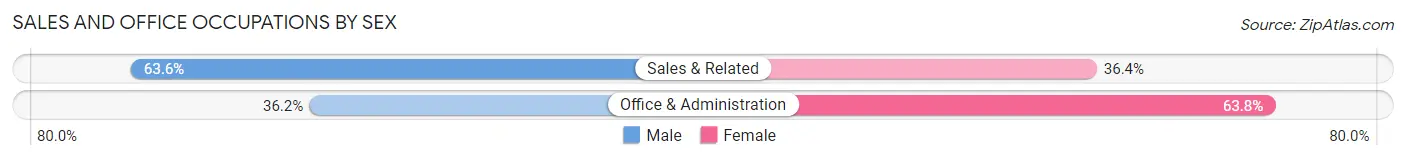
| Occupation | Male | Female |
| Sales & Related | 28 (63.6%) | 16 (36.4%) |
| Office & Administration | 54 (36.2%) | 95 (63.8%) |
| Total (Category) | 82 (42.5%) | 111 (57.5%) |
| Total (Overall) | 467 (55.3%) | 377 (44.7%) |
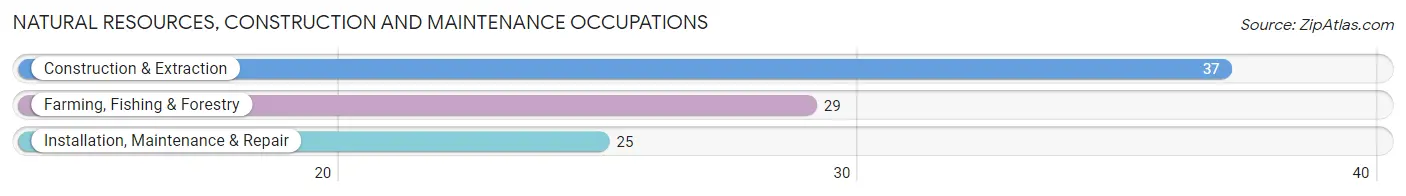
Natural Resources, Construction and Maintenance Occupations
The most common Natural Resources, Construction and Maintenance occupations in Mechanicsburg are Construction & Extraction (37 | 4.4%), Farming, Fishing & Forestry (29 | 3.4%), and Installation, Maintenance & Repair (25 | 3.0%).
Natural Resources, Construction and Maintenance Occupations by Sex
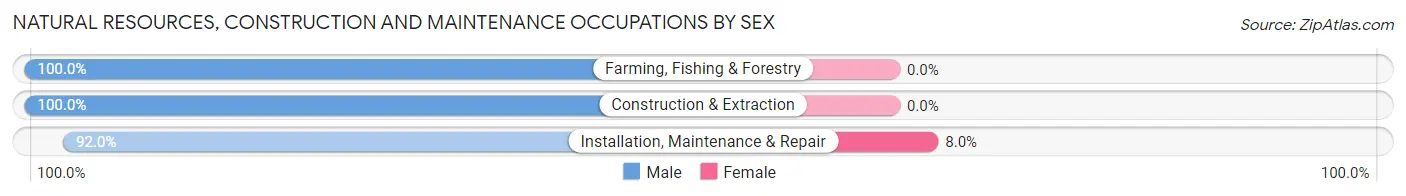
| Occupation | Male | Female |
| Farming, Fishing & Forestry | 29 (100.0%) | 0 (0.0%) |
| Construction & Extraction | 37 (100.0%) | 0 (0.0%) |
| Installation, Maintenance & Repair | 23 (92.0%) | 2 (8.0%) |
| Total (Category) | 89 (97.8%) | 2 (2.2%) |
| Total (Overall) | 467 (55.3%) | 377 (44.7%) |
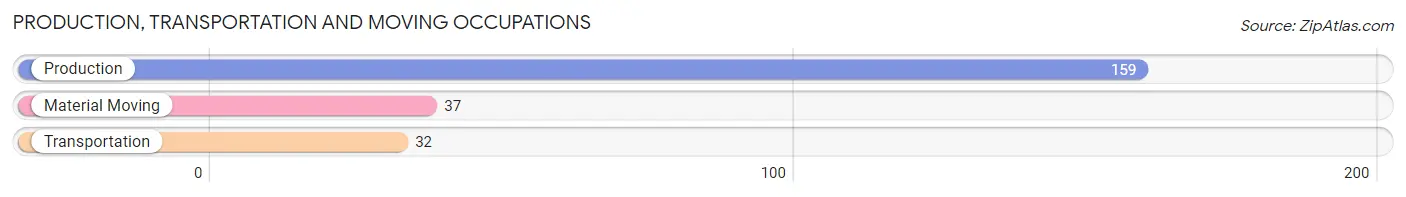
Production, Transportation and Moving Occupations
The most common Production, Transportation and Moving occupations in Mechanicsburg are Production (159 | 18.8%), Material Moving (37 | 4.4%), and Transportation (32 | 3.8%).
Production, Transportation and Moving Occupations by Sex
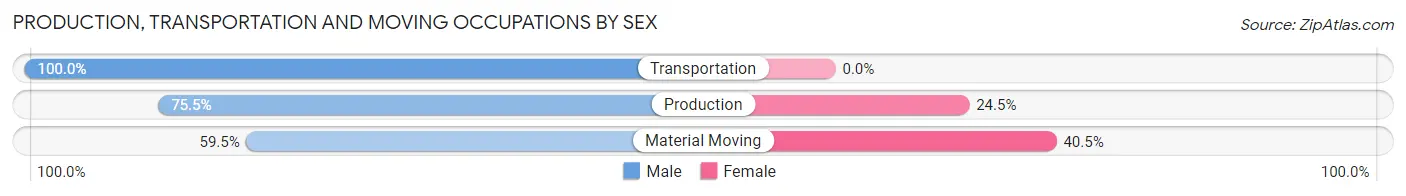
| Occupation | Male | Female |
| Production | 120 (75.5%) | 39 (24.5%) |
| Transportation | 32 (100.0%) | 0 (0.0%) |
| Material Moving | 22 (59.5%) | 15 (40.5%) |
| Total (Category) | 174 (76.3%) | 54 (23.7%) |
| Total (Overall) | 467 (55.3%) | 377 (44.7%) |
Employment Industries by Sex in Mechanicsburg
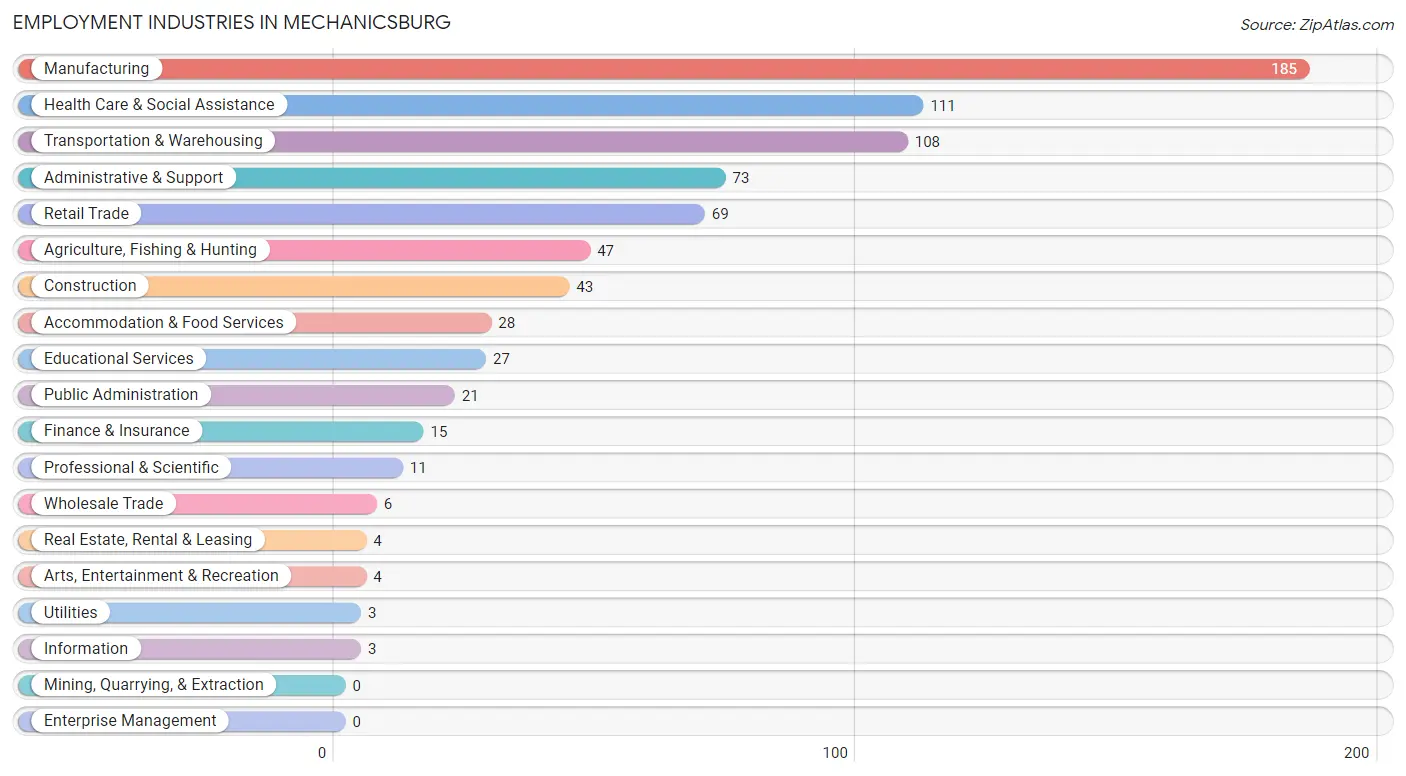
Employment Industries in Mechanicsburg
The major employment industries in Mechanicsburg include Manufacturing (185 | 21.9%), Health Care & Social Assistance (111 | 13.2%), Transportation & Warehousing (108 | 12.8%), Administrative & Support (73 | 8.6%), and Retail Trade (69 | 8.2%).
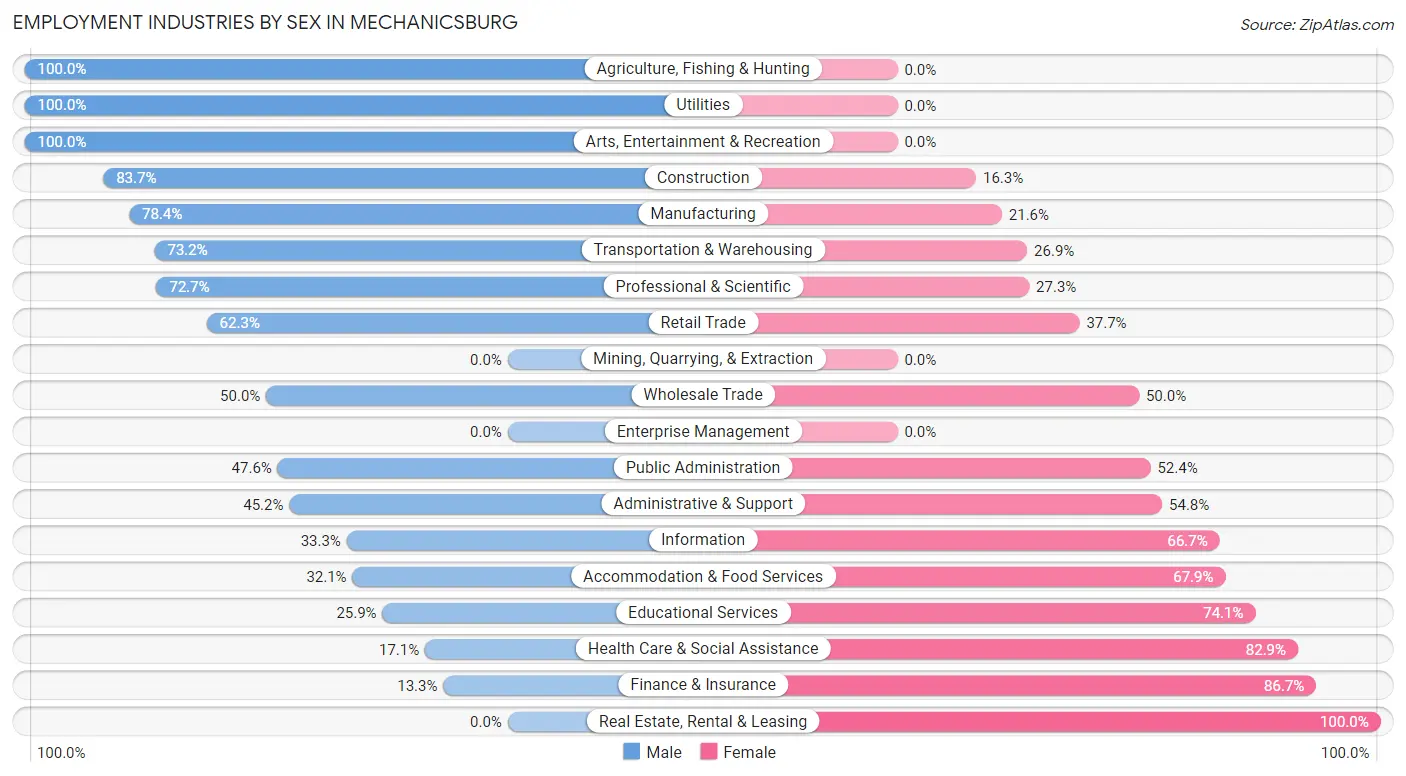
Employment Industries by Sex in Mechanicsburg
The Mechanicsburg industries that see more men than women are Agriculture, Fishing & Hunting (100.0%), Utilities (100.0%), and Arts, Entertainment & Recreation (100.0%), whereas the industries that tend to have a higher number of women are Real Estate, Rental & Leasing (100.0%), Finance & Insurance (86.7%), and Health Care & Social Assistance (82.9%).
| Industry | Male | Female |
| Agriculture, Fishing & Hunting | 47 (100.0%) | 0 (0.0%) |
| Mining, Quarrying, & Extraction | 0 (0.0%) | 0 (0.0%) |
| Construction | 36 (83.7%) | 7 (16.3%) |
| Manufacturing | 145 (78.4%) | 40 (21.6%) |
| Wholesale Trade | 3 (50.0%) | 3 (50.0%) |
| Retail Trade | 43 (62.3%) | 26 (37.7%) |
| Transportation & Warehousing | 79 (73.2%) | 29 (26.9%) |
| Utilities | 3 (100.0%) | 0 (0.0%) |
| Information | 1 (33.3%) | 2 (66.7%) |
| Finance & Insurance | 2 (13.3%) | 13 (86.7%) |
| Real Estate, Rental & Leasing | 0 (0.0%) | 4 (100.0%) |
| Professional & Scientific | 8 (72.7%) | 3 (27.3%) |
| Enterprise Management | 0 (0.0%) | 0 (0.0%) |
| Administrative & Support | 33 (45.2%) | 40 (54.8%) |
| Educational Services | 7 (25.9%) | 20 (74.1%) |
| Health Care & Social Assistance | 19 (17.1%) | 92 (82.9%) |
| Arts, Entertainment & Recreation | 4 (100.0%) | 0 (0.0%) |
| Accommodation & Food Services | 9 (32.1%) | 19 (67.9%) |
| Public Administration | 10 (47.6%) | 11 (52.4%) |
| Total | 467 (55.3%) | 377 (44.7%) |
Education in Mechanicsburg
School Enrollment in Mechanicsburg
The most common levels of schooling among the 248 students in Mechanicsburg are high school (97 | 39.1%), elementary school (52 | 21.0%), and middle school (31 | 12.5%).
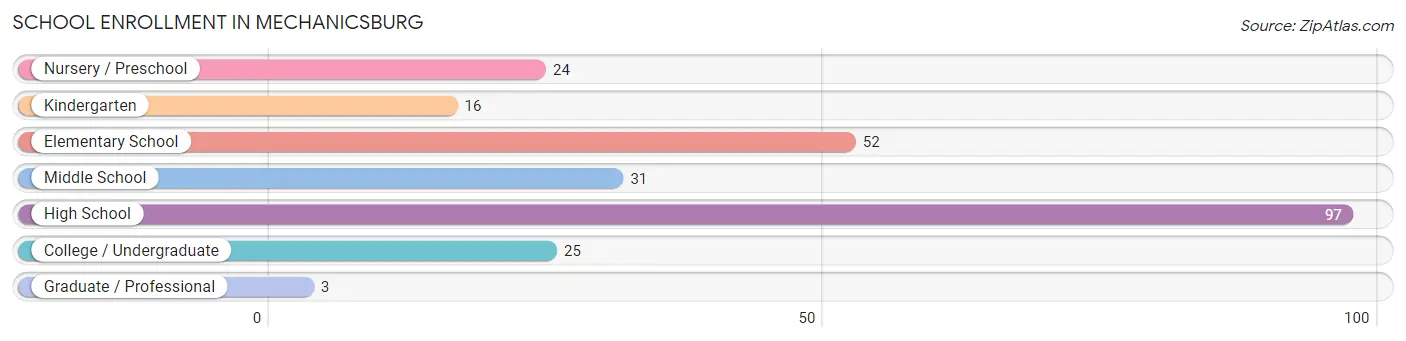
| School Level | # Students | % Students |
| Nursery / Preschool | 24 | 9.7% |
| Kindergarten | 16 | 6.5% |
| Elementary School | 52 | 21.0% |
| Middle School | 31 | 12.5% |
| High School | 97 | 39.1% |
| College / Undergraduate | 25 | 10.1% |
| Graduate / Professional | 3 | 1.2% |
| Total | 248 | 100.0% |
School Enrollment by Age by Funding Source in Mechanicsburg
Out of a total of 248 students who are enrolled in schools in Mechanicsburg, 21 (8.5%) attend a private institution, while the remaining 227 (91.5%) are enrolled in public schools. The age group of 15 to 17 year olds has the highest likelihood of being enrolled in private schools, with 11 (17.5% in the age bracket) enrolled. Conversely, the age group of 3 to 4 year olds has the lowest likelihood of being enrolled in a private school, with 7 (100.0% in the age bracket) attending a public institution.
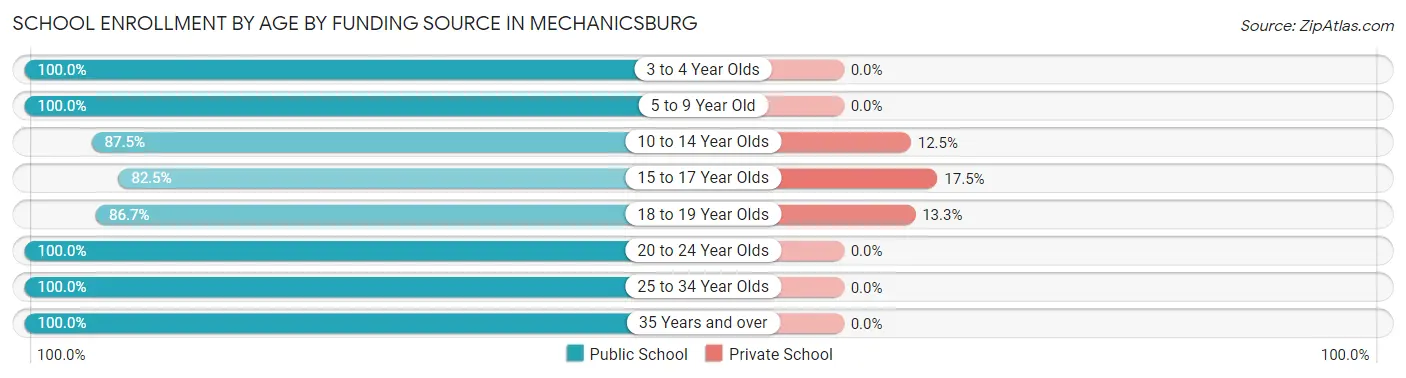
| Age Bracket | Public School | Private School |
| 3 to 4 Year Olds | 7 (100.0%) | 0 (0.0%) |
| 5 to 9 Year Old | 76 (100.0%) | 0 (0.0%) |
| 10 to 14 Year Olds | 56 (87.5%) | 8 (12.5%) |
| 15 to 17 Year Olds | 52 (82.5%) | 11 (17.5%) |
| 18 to 19 Year Olds | 13 (86.7%) | 2 (13.3%) |
| 20 to 24 Year Olds | 3 (100.0%) | 0 (0.0%) |
| 25 to 34 Year Olds | 12 (100.0%) | 0 (0.0%) |
| 35 Years and over | 8 (100.0%) | 0 (0.0%) |
| Total | 227 (91.5%) | 21 (8.5%) |
Educational Attainment by Field of Study in Mechanicsburg
Education (46 | 22.9%), business (31 | 15.4%), science & technology (26 | 12.9%), literature & languages (24 | 11.9%), and engineering (17 | 8.5%) are the most common fields of study among 201 individuals in Mechanicsburg who have obtained a bachelor's degree or higher.
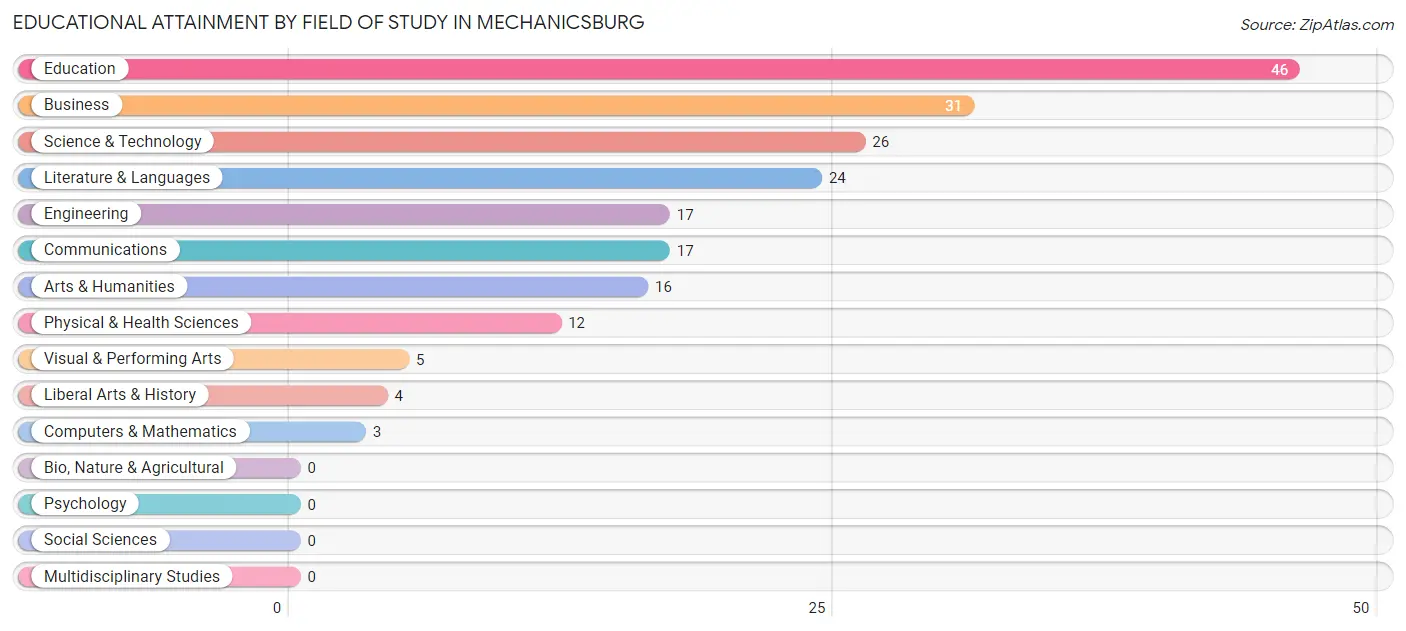
| Field of Study | # Graduates | % Graduates |
| Computers & Mathematics | 3 | 1.5% |
| Bio, Nature & Agricultural | 0 | 0.0% |
| Physical & Health Sciences | 12 | 6.0% |
| Psychology | 0 | 0.0% |
| Social Sciences | 0 | 0.0% |
| Engineering | 17 | 8.5% |
| Multidisciplinary Studies | 0 | 0.0% |
| Science & Technology | 26 | 12.9% |
| Business | 31 | 15.4% |
| Education | 46 | 22.9% |
| Literature & Languages | 24 | 11.9% |
| Liberal Arts & History | 4 | 2.0% |
| Visual & Performing Arts | 5 | 2.5% |
| Communications | 17 | 8.5% |
| Arts & Humanities | 16 | 8.0% |
| Total | 201 | 100.0% |
Transportation & Commute in Mechanicsburg
Vehicle Availability by Sex in Mechanicsburg
The most prevalent vehicle ownership categories in Mechanicsburg are males with 2 vehicles (260, accounting for 57.8%) and females with 2 vehicles (181, making up 73.7%).
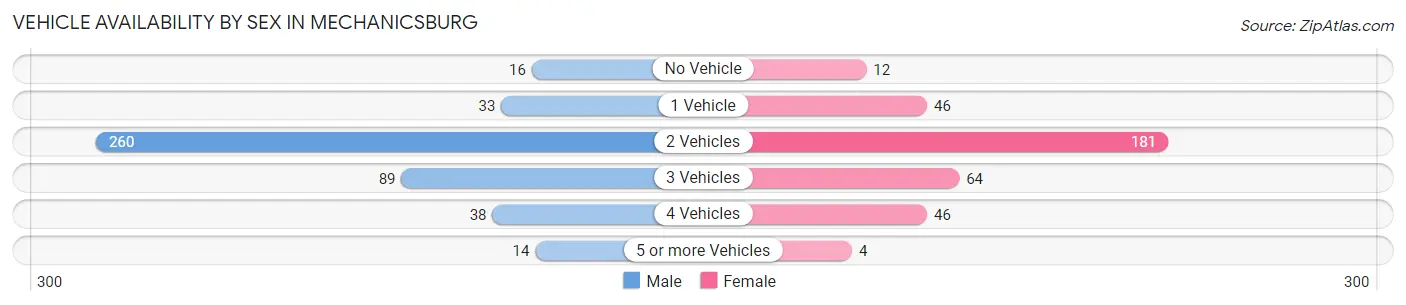
| Vehicles Available | Male | Female |
| No Vehicle | 16 (3.6%) | 12 (3.4%) |
| 1 Vehicle | 33 (7.3%) | 46 (13.0%) |
| 2 Vehicles | 260 (57.8%) | 181 (51.3%) |
| 3 Vehicles | 89 (19.8%) | 64 (18.1%) |
| 4 Vehicles | 38 (8.4%) | 46 (13.0%) |
| 5 or more Vehicles | 14 (3.1%) | 4 (1.1%) |
| Total | 450 (100.0%) | 353 (100.0%) |
Commute Time in Mechanicsburg
The most frequently occuring commute durations in Mechanicsburg are 25 to 29 minutes (148 commuters, 20.3%), 20 to 24 minutes (105 commuters, 14.4%), and 40 to 44 minutes (93 commuters, 12.7%).
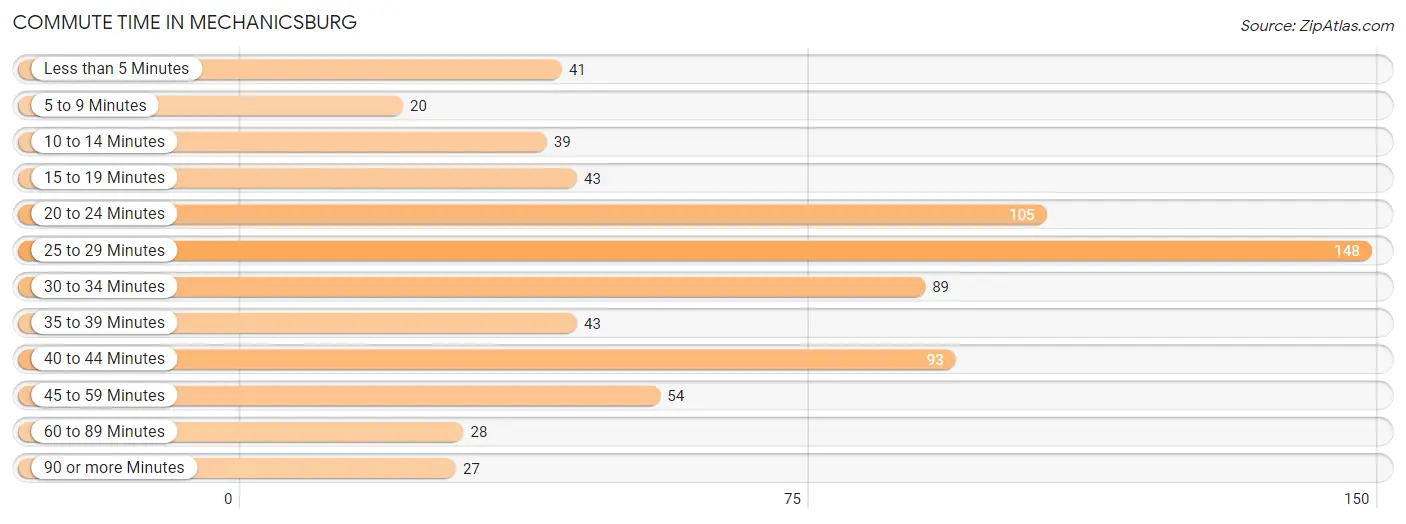
| Commute Time | # Commuters | % Commuters |
| Less than 5 Minutes | 41 | 5.6% |
| 5 to 9 Minutes | 20 | 2.7% |
| 10 to 14 Minutes | 39 | 5.3% |
| 15 to 19 Minutes | 43 | 5.9% |
| 20 to 24 Minutes | 105 | 14.4% |
| 25 to 29 Minutes | 148 | 20.3% |
| 30 to 34 Minutes | 89 | 12.2% |
| 35 to 39 Minutes | 43 | 5.9% |
| 40 to 44 Minutes | 93 | 12.7% |
| 45 to 59 Minutes | 54 | 7.4% |
| 60 to 89 Minutes | 28 | 3.8% |
| 90 or more Minutes | 27 | 3.7% |
Commute Time by Sex in Mechanicsburg
The most common commute times in Mechanicsburg are 25 to 29 minutes (113 commuters, 25.9%) for males and 40 to 44 minutes (52 commuters, 17.7%) for females.
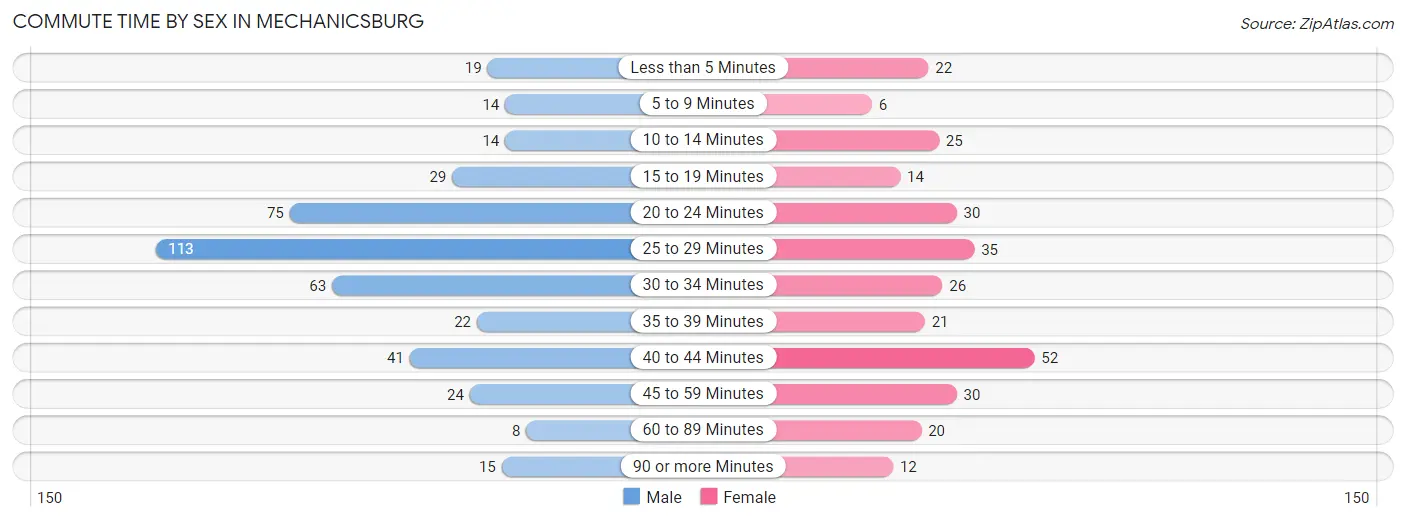
| Commute Time | Male | Female |
| Less than 5 Minutes | 19 (4.3%) | 22 (7.5%) |
| 5 to 9 Minutes | 14 (3.2%) | 6 (2.1%) |
| 10 to 14 Minutes | 14 (3.2%) | 25 (8.5%) |
| 15 to 19 Minutes | 29 (6.6%) | 14 (4.8%) |
| 20 to 24 Minutes | 75 (17.2%) | 30 (10.2%) |
| 25 to 29 Minutes | 113 (25.9%) | 35 (11.9%) |
| 30 to 34 Minutes | 63 (14.4%) | 26 (8.9%) |
| 35 to 39 Minutes | 22 (5.0%) | 21 (7.2%) |
| 40 to 44 Minutes | 41 (9.4%) | 52 (17.7%) |
| 45 to 59 Minutes | 24 (5.5%) | 30 (10.2%) |
| 60 to 89 Minutes | 8 (1.8%) | 20 (6.8%) |
| 90 or more Minutes | 15 (3.4%) | 12 (4.1%) |
Time of Departure to Work by Sex in Mechanicsburg
The most frequent times of departure to work in Mechanicsburg are 6:00 AM to 6:29 AM (132, 30.2%) for males and 7:00 AM to 7:29 AM (68, 23.2%) for females.
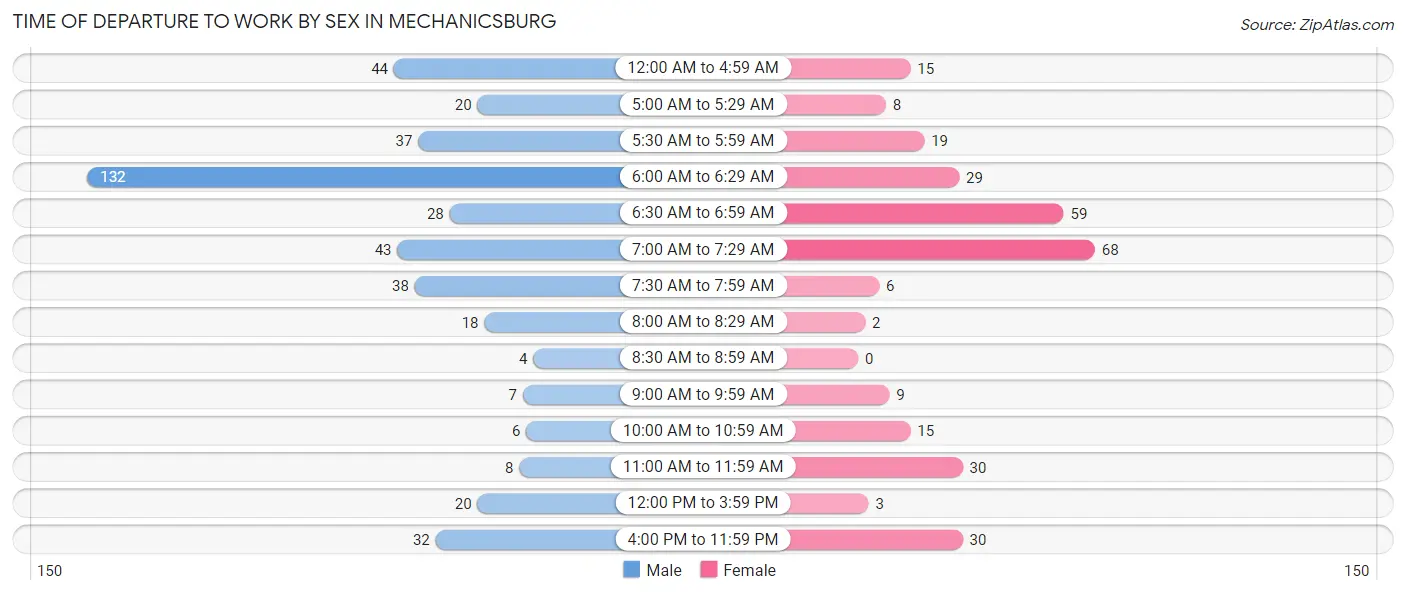
| Time of Departure | Male | Female |
| 12:00 AM to 4:59 AM | 44 (10.1%) | 15 (5.1%) |
| 5:00 AM to 5:29 AM | 20 (4.6%) | 8 (2.7%) |
| 5:30 AM to 5:59 AM | 37 (8.5%) | 19 (6.5%) |
| 6:00 AM to 6:29 AM | 132 (30.2%) | 29 (9.9%) |
| 6:30 AM to 6:59 AM | 28 (6.4%) | 59 (20.1%) |
| 7:00 AM to 7:29 AM | 43 (9.8%) | 68 (23.2%) |
| 7:30 AM to 7:59 AM | 38 (8.7%) | 6 (2.1%) |
| 8:00 AM to 8:29 AM | 18 (4.1%) | 2 (0.7%) |
| 8:30 AM to 8:59 AM | 4 (0.9%) | 0 (0.0%) |
| 9:00 AM to 9:59 AM | 7 (1.6%) | 9 (3.1%) |
| 10:00 AM to 10:59 AM | 6 (1.4%) | 15 (5.1%) |
| 11:00 AM to 11:59 AM | 8 (1.8%) | 30 (10.2%) |
| 12:00 PM to 3:59 PM | 20 (4.6%) | 3 (1.0%) |
| 4:00 PM to 11:59 PM | 32 (7.3%) | 30 (10.2%) |
| Total | 437 (100.0%) | 293 (100.0%) |
Housing Occupancy in Mechanicsburg
Occupancy by Ownership in Mechanicsburg
Of the total 739 dwellings in Mechanicsburg, owner-occupied units account for 353 (47.8%), while renter-occupied units make up 386 (52.2%).
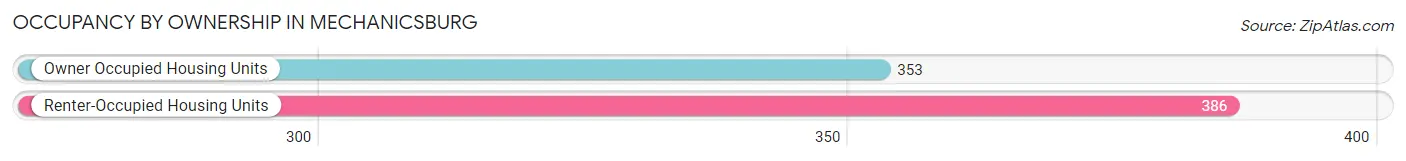
| Occupancy | # Housing Units | % Housing Units |
| Owner Occupied Housing Units | 353 | 47.8% |
| Renter-Occupied Housing Units | 386 | 52.2% |
| Total Occupied Housing Units | 739 | 100.0% |
Occupancy by Household Size in Mechanicsburg
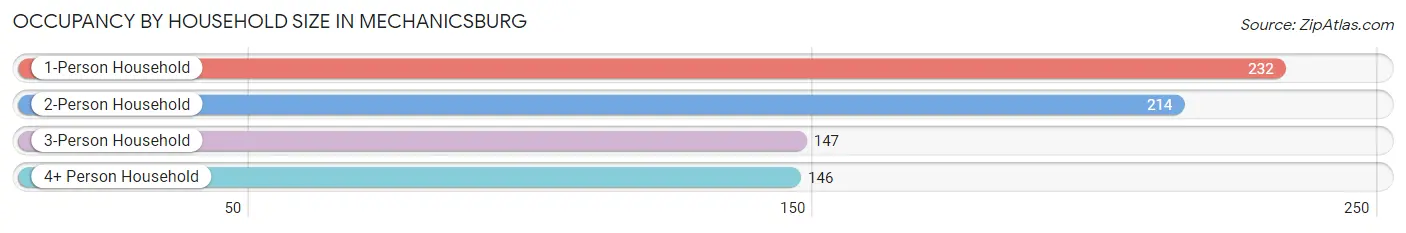
| Household Size | # Housing Units | % Housing Units |
| 1-Person Household | 232 | 31.4% |
| 2-Person Household | 214 | 29.0% |
| 3-Person Household | 147 | 19.9% |
| 4+ Person Household | 146 | 19.8% |
| Total Housing Units | 739 | 100.0% |
Occupancy by Ownership by Household Size in Mechanicsburg
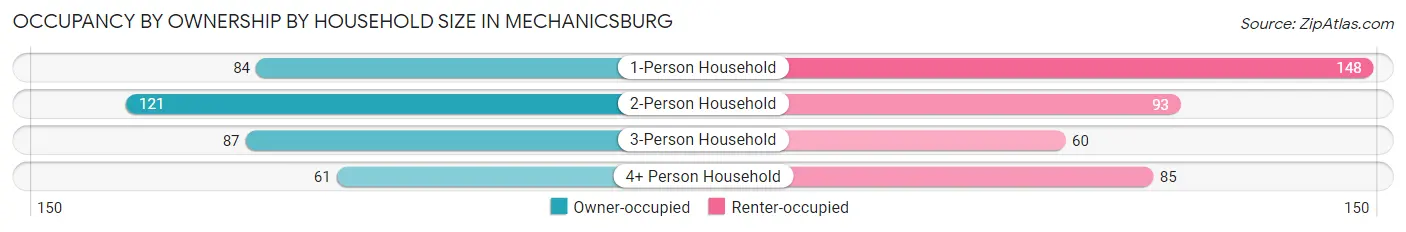
| Household Size | Owner-occupied | Renter-occupied |
| 1-Person Household | 84 (36.2%) | 148 (63.8%) |
| 2-Person Household | 121 (56.5%) | 93 (43.5%) |
| 3-Person Household | 87 (59.2%) | 60 (40.8%) |
| 4+ Person Household | 61 (41.8%) | 85 (58.2%) |
| Total Housing Units | 353 (47.8%) | 386 (52.2%) |
Occupancy by Educational Attainment in Mechanicsburg
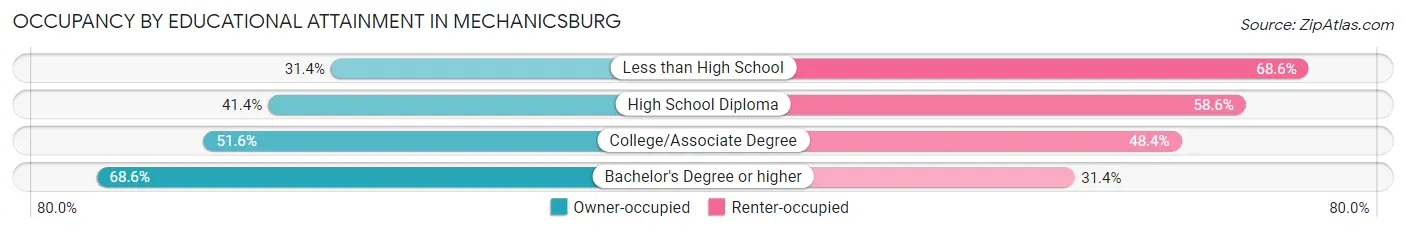
| Household Size | Owner-occupied | Renter-occupied |
| Less than High School | 22 (31.4%) | 48 (68.6%) |
| High School Diploma | 130 (41.4%) | 184 (58.6%) |
| College/Associate Degree | 129 (51.6%) | 121 (48.4%) |
| Bachelor's Degree or higher | 72 (68.6%) | 33 (31.4%) |
Occupancy by Age of Householder in Mechanicsburg
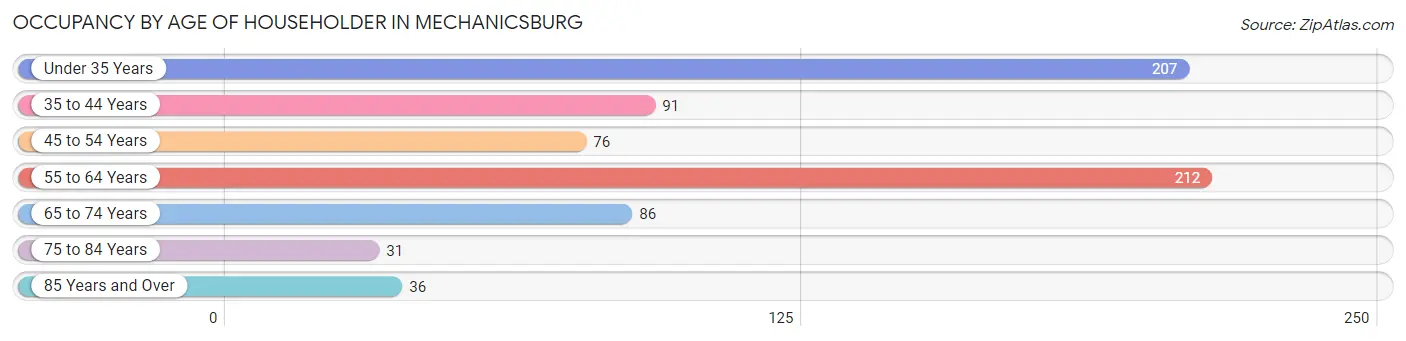
| Age Bracket | # Households | % Households |
| Under 35 Years | 207 | 28.0% |
| 35 to 44 Years | 91 | 12.3% |
| 45 to 54 Years | 76 | 10.3% |
| 55 to 64 Years | 212 | 28.7% |
| 65 to 74 Years | 86 | 11.6% |
| 75 to 84 Years | 31 | 4.2% |
| 85 Years and Over | 36 | 4.9% |
| Total | 739 | 100.0% |
Housing Finances in Mechanicsburg
Median Income by Occupancy in Mechanicsburg
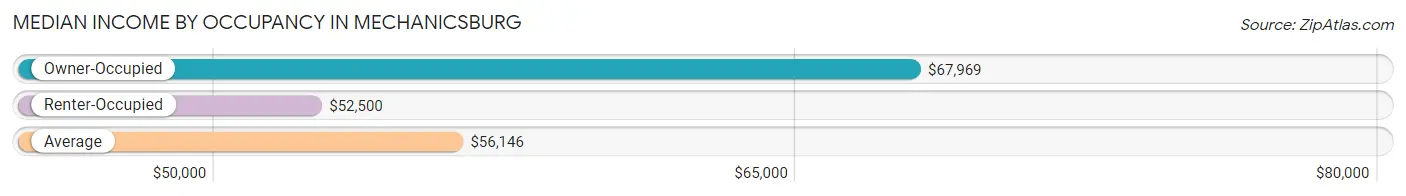
| Occupancy Type | # Households | Median Income |
| Owner-Occupied | 353 (47.8%) | $67,969 |
| Renter-Occupied | 386 (52.2%) | $52,500 |
| Average | 739 (100.0%) | $56,146 |
Occupancy by Householder Income Bracket in Mechanicsburg
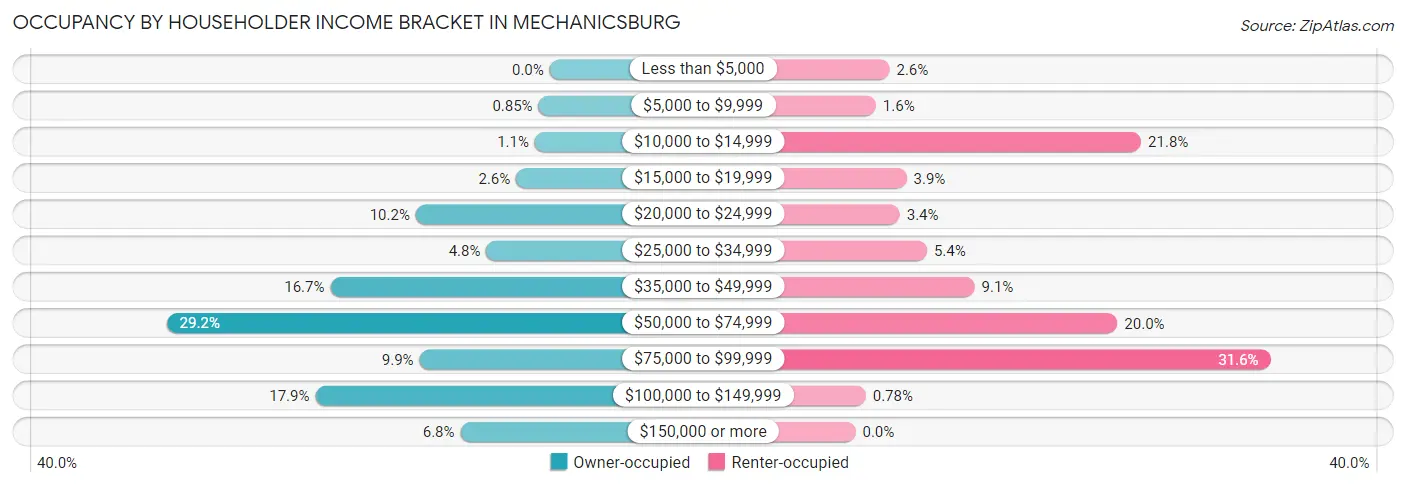
| Income Bracket | Owner-occupied | Renter-occupied |
| Less than $5,000 | 0 (0.0%) | 10 (2.6%) |
| $5,000 to $9,999 | 3 (0.9%) | 6 (1.5%) |
| $10,000 to $14,999 | 4 (1.1%) | 84 (21.8%) |
| $15,000 to $19,999 | 9 (2.5%) | 15 (3.9%) |
| $20,000 to $24,999 | 36 (10.2%) | 13 (3.4%) |
| $25,000 to $34,999 | 17 (4.8%) | 21 (5.4%) |
| $35,000 to $49,999 | 59 (16.7%) | 35 (9.1%) |
| $50,000 to $74,999 | 103 (29.2%) | 77 (20.0%) |
| $75,000 to $99,999 | 35 (9.9%) | 122 (31.6%) |
| $100,000 to $149,999 | 63 (17.8%) | 3 (0.8%) |
| $150,000 or more | 24 (6.8%) | 0 (0.0%) |
| Total | 353 (100.0%) | 386 (100.0%) |
Monthly Housing Cost Tiers in Mechanicsburg
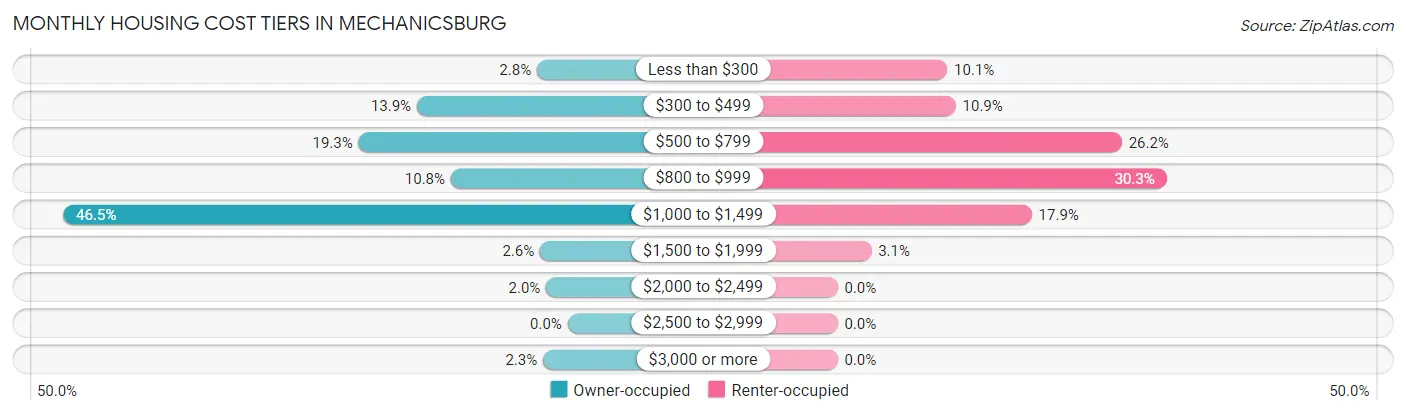
| Monthly Cost | Owner-occupied | Renter-occupied |
| Less than $300 | 10 (2.8%) | 39 (10.1%) |
| $300 to $499 | 49 (13.9%) | 42 (10.9%) |
| $500 to $799 | 68 (19.3%) | 101 (26.2%) |
| $800 to $999 | 38 (10.8%) | 117 (30.3%) |
| $1,000 to $1,499 | 164 (46.5%) | 69 (17.9%) |
| $1,500 to $1,999 | 9 (2.5%) | 12 (3.1%) |
| $2,000 to $2,499 | 7 (2.0%) | 0 (0.0%) |
| $2,500 to $2,999 | 0 (0.0%) | 0 (0.0%) |
| $3,000 or more | 8 (2.3%) | 0 (0.0%) |
| Total | 353 (100.0%) | 386 (100.0%) |
Physical Housing Characteristics in Mechanicsburg
Housing Structures in Mechanicsburg
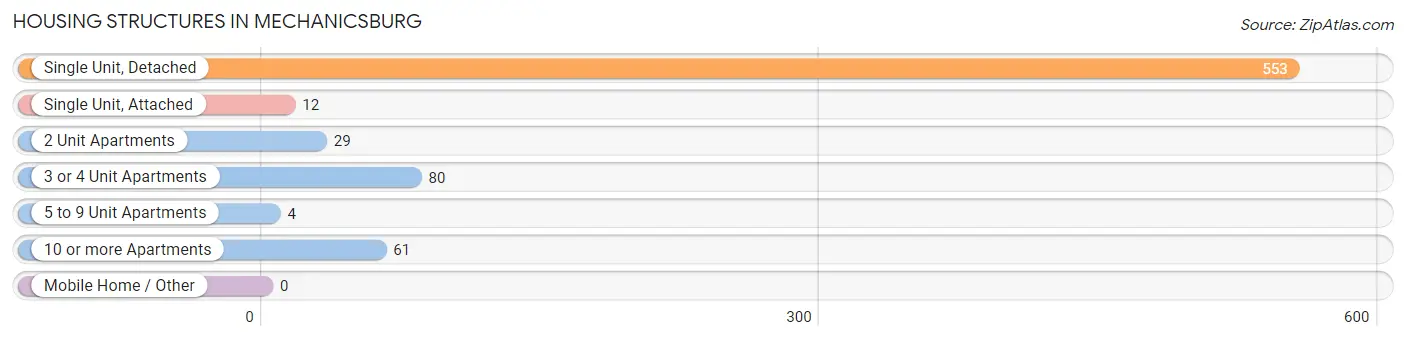
| Structure Type | # Housing Units | % Housing Units |
| Single Unit, Detached | 553 | 74.8% |
| Single Unit, Attached | 12 | 1.6% |
| 2 Unit Apartments | 29 | 3.9% |
| 3 or 4 Unit Apartments | 80 | 10.8% |
| 5 to 9 Unit Apartments | 4 | 0.5% |
| 10 or more Apartments | 61 | 8.3% |
| Mobile Home / Other | 0 | 0.0% |
| Total | 739 | 100.0% |
Housing Structures by Occupancy in Mechanicsburg
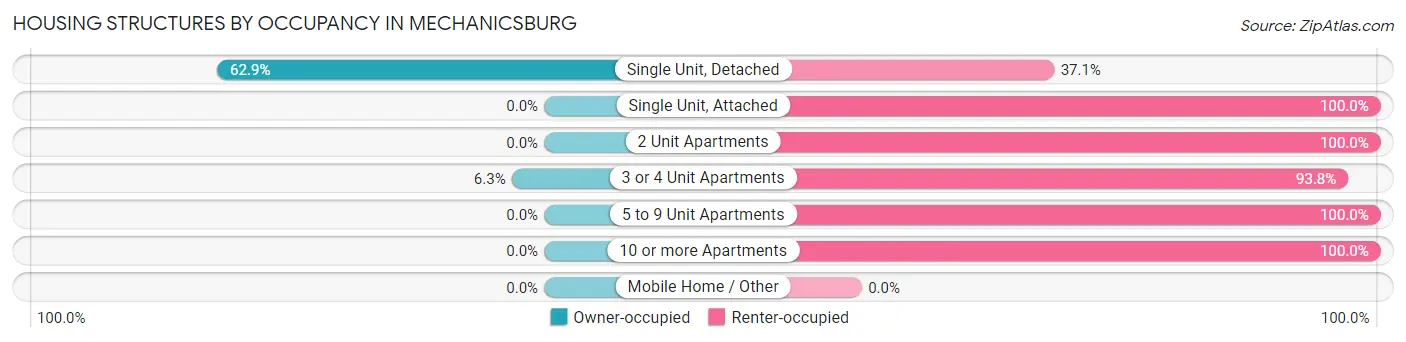
| Structure Type | Owner-occupied | Renter-occupied |
| Single Unit, Detached | 348 (62.9%) | 205 (37.1%) |
| Single Unit, Attached | 0 (0.0%) | 12 (100.0%) |
| 2 Unit Apartments | 0 (0.0%) | 29 (100.0%) |
| 3 or 4 Unit Apartments | 5 (6.2%) | 75 (93.8%) |
| 5 to 9 Unit Apartments | 0 (0.0%) | 4 (100.0%) |
| 10 or more Apartments | 0 (0.0%) | 61 (100.0%) |
| Mobile Home / Other | 0 (0.0%) | 0 (0.0%) |
| Total | 353 (47.8%) | 386 (52.2%) |
Housing Structures by Number of Rooms in Mechanicsburg
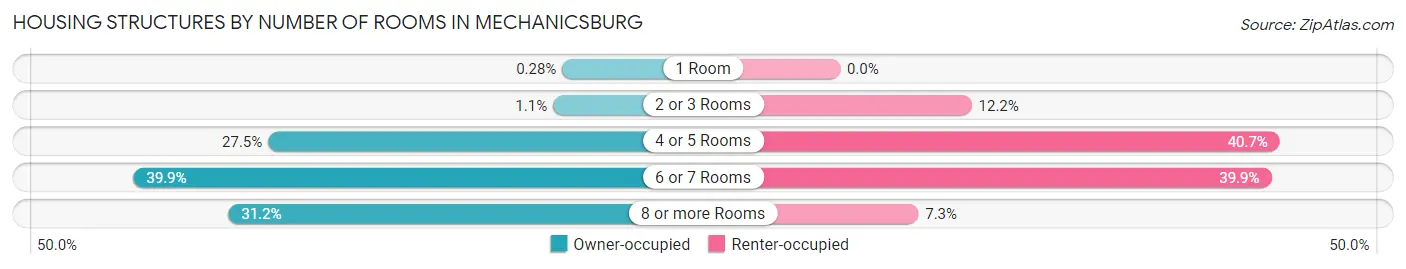
| Number of Rooms | Owner-occupied | Renter-occupied |
| 1 Room | 1 (0.3%) | 0 (0.0%) |
| 2 or 3 Rooms | 4 (1.1%) | 47 (12.2%) |
| 4 or 5 Rooms | 97 (27.5%) | 157 (40.7%) |
| 6 or 7 Rooms | 141 (39.9%) | 154 (39.9%) |
| 8 or more Rooms | 110 (31.2%) | 28 (7.2%) |
| Total | 353 (100.0%) | 386 (100.0%) |
Housing Structure by Heating Type in Mechanicsburg
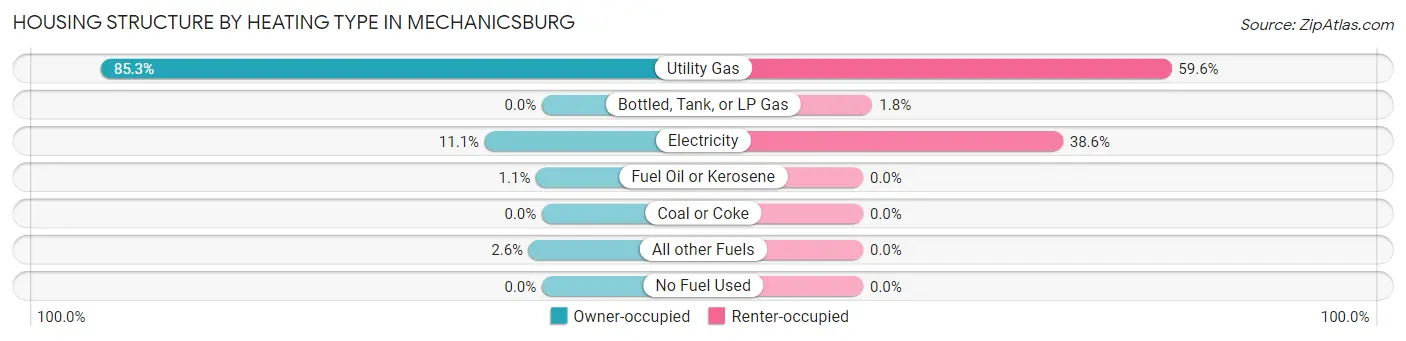
| Heating Type | Owner-occupied | Renter-occupied |
| Utility Gas | 301 (85.3%) | 230 (59.6%) |
| Bottled, Tank, or LP Gas | 0 (0.0%) | 7 (1.8%) |
| Electricity | 39 (11.1%) | 149 (38.6%) |
| Fuel Oil or Kerosene | 4 (1.1%) | 0 (0.0%) |
| Coal or Coke | 0 (0.0%) | 0 (0.0%) |
| All other Fuels | 9 (2.5%) | 0 (0.0%) |
| No Fuel Used | 0 (0.0%) | 0 (0.0%) |
| Total | 353 (100.0%) | 386 (100.0%) |
Household Vehicle Usage in Mechanicsburg
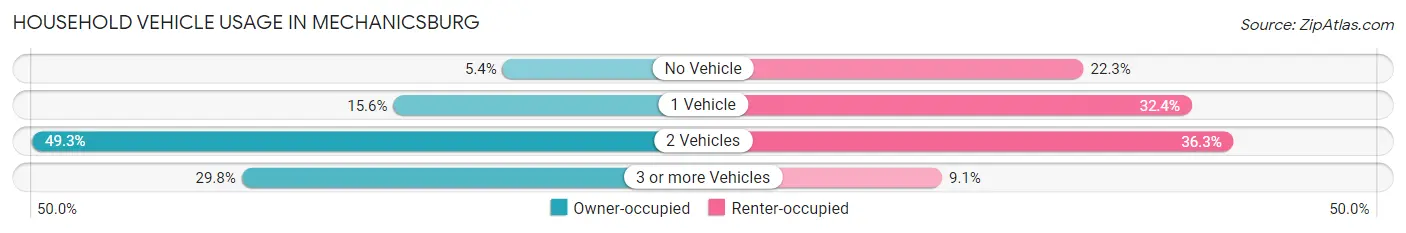
| Vehicles per Household | Owner-occupied | Renter-occupied |
| No Vehicle | 19 (5.4%) | 86 (22.3%) |
| 1 Vehicle | 55 (15.6%) | 125 (32.4%) |
| 2 Vehicles | 174 (49.3%) | 140 (36.3%) |
| 3 or more Vehicles | 105 (29.7%) | 35 (9.1%) |
| Total | 353 (100.0%) | 386 (100.0%) |
Real Estate & Mortgages in Mechanicsburg
Real Estate and Mortgage Overview in Mechanicsburg
| Characteristic | Without Mortgage | With Mortgage |
| Housing Units | 93 | 260 |
| Median Property Value | $129,200 | $136,300 |
| Median Household Income | $45,250 | $16 |
| Monthly Housing Costs | $450 | $8 |
| Real Estate Taxes | $1,330 | $3 |
Property Value by Mortgage Status in Mechanicsburg
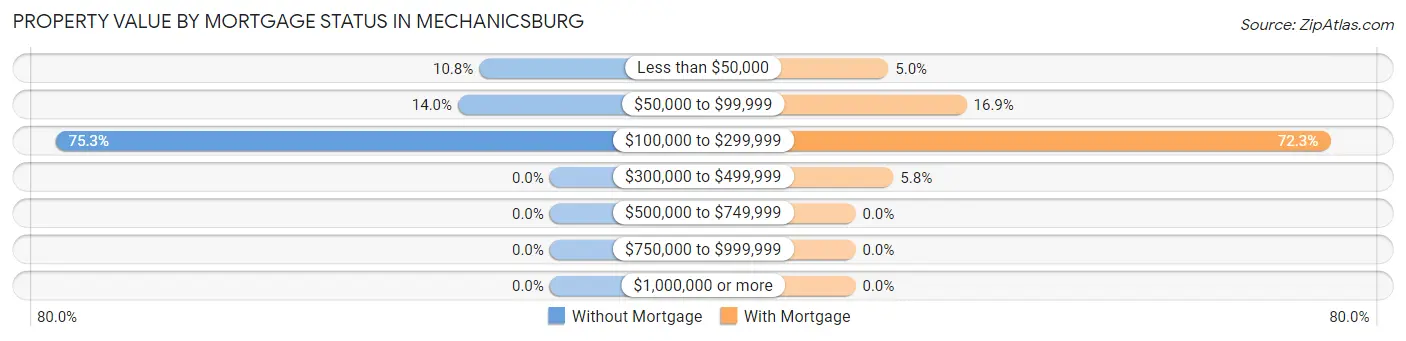
| Property Value | Without Mortgage | With Mortgage |
| Less than $50,000 | 10 (10.7%) | 13 (5.0%) |
| $50,000 to $99,999 | 13 (14.0%) | 44 (16.9%) |
| $100,000 to $299,999 | 70 (75.3%) | 188 (72.3%) |
| $300,000 to $499,999 | 0 (0.0%) | 15 (5.8%) |
| $500,000 to $749,999 | 0 (0.0%) | 0 (0.0%) |
| $750,000 to $999,999 | 0 (0.0%) | 0 (0.0%) |
| $1,000,000 or more | 0 (0.0%) | 0 (0.0%) |
| Total | 93 (100.0%) | 260 (100.0%) |
Household Income by Mortgage Status in Mechanicsburg
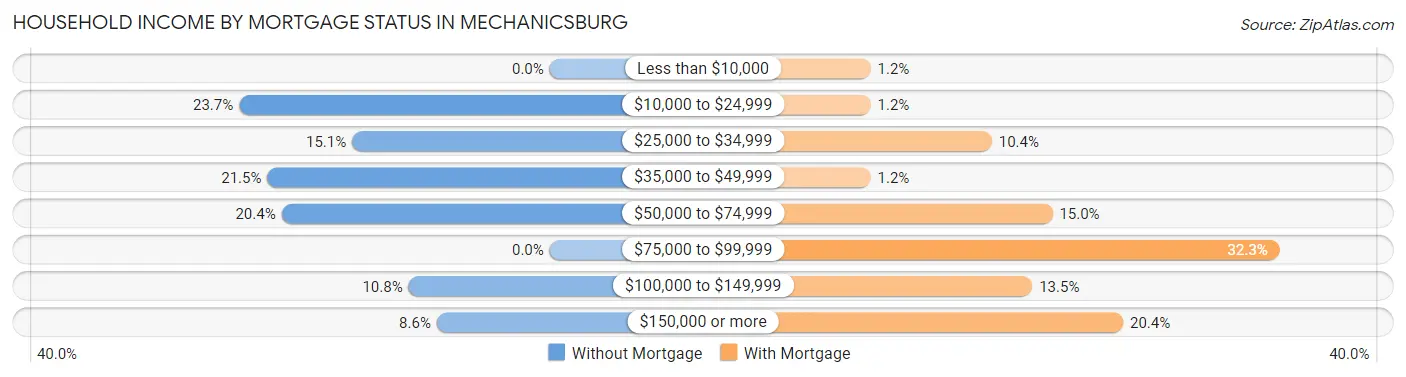
| Household Income | Without Mortgage | With Mortgage |
| Less than $10,000 | 0 (0.0%) | 3 (1.1%) |
| $10,000 to $24,999 | 22 (23.7%) | 3 (1.1%) |
| $25,000 to $34,999 | 14 (15.0%) | 27 (10.4%) |
| $35,000 to $49,999 | 20 (21.5%) | 3 (1.1%) |
| $50,000 to $74,999 | 19 (20.4%) | 39 (15.0%) |
| $75,000 to $99,999 | 0 (0.0%) | 84 (32.3%) |
| $100,000 to $149,999 | 10 (10.7%) | 35 (13.5%) |
| $150,000 or more | 8 (8.6%) | 53 (20.4%) |
| Total | 93 (100.0%) | 260 (100.0%) |
Property Value to Household Income Ratio in Mechanicsburg
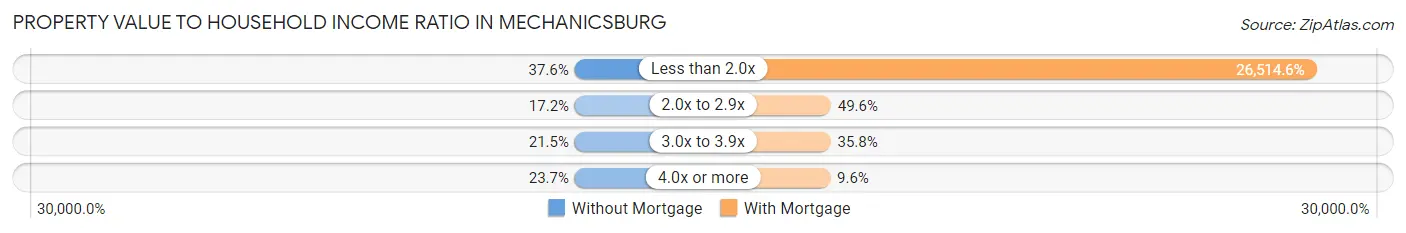
| Value-to-Income Ratio | Without Mortgage | With Mortgage |
| Less than 2.0x | 35 (37.6%) | 68,938 (26,514.6%) |
| 2.0x to 2.9x | 16 (17.2%) | 129 (49.6%) |
| 3.0x to 3.9x | 20 (21.5%) | 93 (35.8%) |
| 4.0x or more | 22 (23.7%) | 25 (9.6%) |
| Total | 93 (100.0%) | 260 (100.0%) |
Real Estate Taxes by Mortgage Status in Mechanicsburg
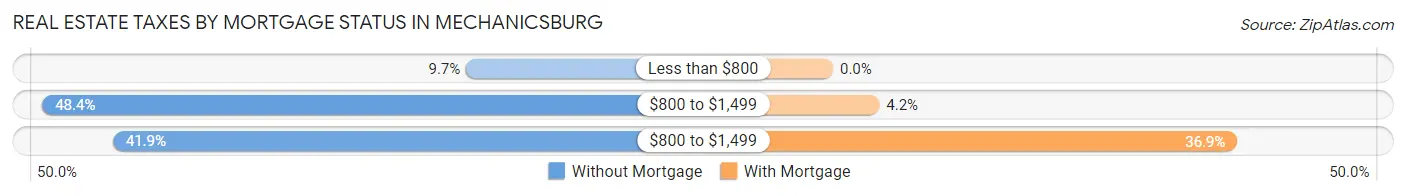
| Property Taxes | Without Mortgage | With Mortgage |
| Less than $800 | 9 (9.7%) | 0 (0.0%) |
| $800 to $1,499 | 45 (48.4%) | 11 (4.2%) |
| $800 to $1,499 | 39 (41.9%) | 96 (36.9%) |
| Total | 93 (100.0%) | 260 (100.0%) |
Health & Disability in Mechanicsburg
Health Insurance Coverage by Age in Mechanicsburg
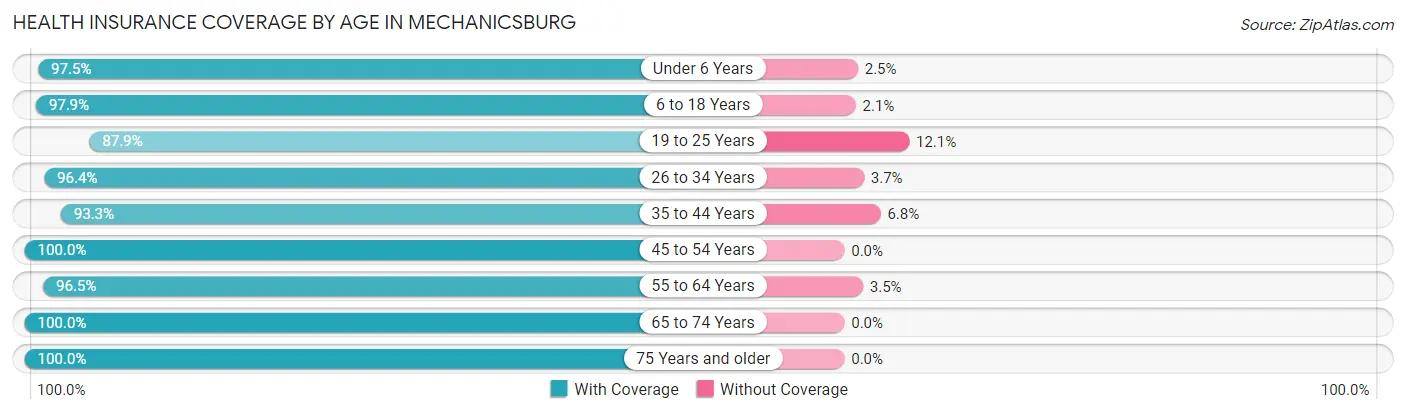
| Age Bracket | With Coverage | Without Coverage |
| Under 6 Years | 233 (97.5%) | 6 (2.5%) |
| 6 to 18 Years | 186 (97.9%) | 4 (2.1%) |
| 19 to 25 Years | 182 (87.9%) | 25 (12.1%) |
| 26 to 34 Years | 317 (96.4%) | 12 (3.6%) |
| 35 to 44 Years | 152 (93.2%) | 11 (6.8%) |
| 45 to 54 Years | 116 (100.0%) | 0 (0.0%) |
| 55 to 64 Years | 279 (96.5%) | 10 (3.5%) |
| 65 to 74 Years | 100 (100.0%) | 0 (0.0%) |
| 75 Years and older | 91 (100.0%) | 0 (0.0%) |
| Total | 1,656 (96.1%) | 68 (3.9%) |
Health Insurance Coverage by Citizenship Status in Mechanicsburg
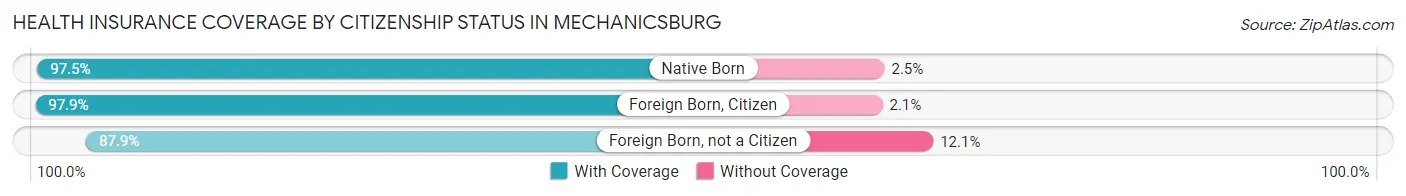
| Citizenship Status | With Coverage | Without Coverage |
| Native Born | 233 (97.5%) | 6 (2.5%) |
| Foreign Born, Citizen | 186 (97.9%) | 4 (2.1%) |
| Foreign Born, not a Citizen | 182 (87.9%) | 25 (12.1%) |
Health Insurance Coverage by Household Income in Mechanicsburg
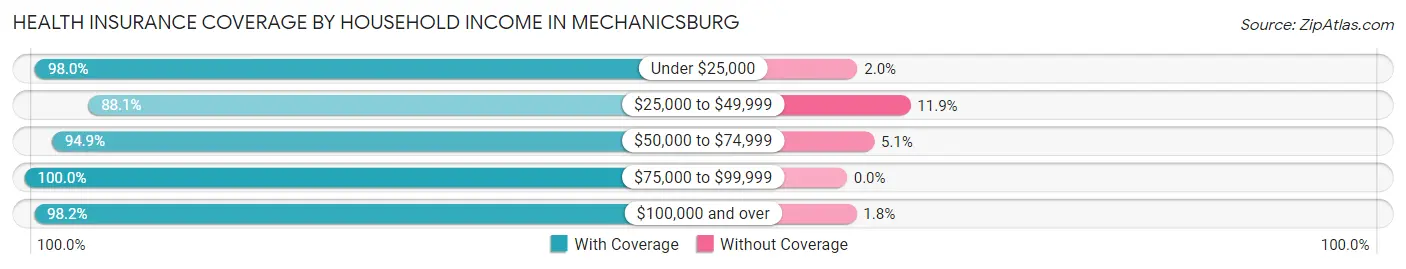
| Household Income | With Coverage | Without Coverage |
| Under $25,000 | 249 (98.0%) | 5 (2.0%) |
| $25,000 to $49,999 | 229 (88.1%) | 31 (11.9%) |
| $50,000 to $74,999 | 502 (94.9%) | 27 (5.1%) |
| $75,000 to $99,999 | 403 (100.0%) | 0 (0.0%) |
| $100,000 and over | 273 (98.2%) | 5 (1.8%) |
Public vs Private Health Insurance Coverage by Age in Mechanicsburg
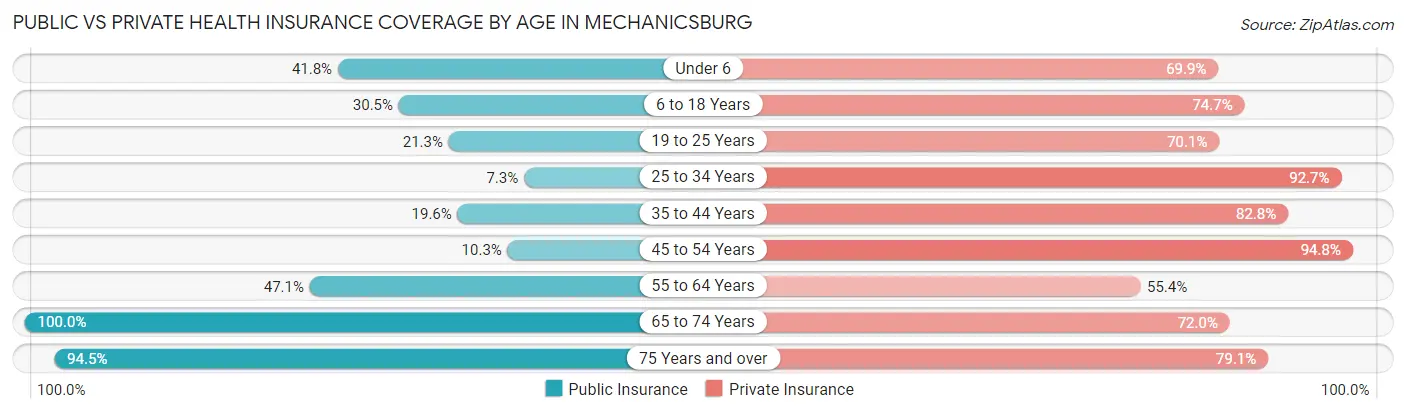
| Age Bracket | Public Insurance | Private Insurance |
| Under 6 | 100 (41.8%) | 167 (69.9%) |
| 6 to 18 Years | 58 (30.5%) | 142 (74.7%) |
| 19 to 25 Years | 44 (21.3%) | 145 (70.1%) |
| 25 to 34 Years | 24 (7.3%) | 305 (92.7%) |
| 35 to 44 Years | 32 (19.6%) | 135 (82.8%) |
| 45 to 54 Years | 12 (10.3%) | 110 (94.8%) |
| 55 to 64 Years | 136 (47.1%) | 160 (55.4%) |
| 65 to 74 Years | 100 (100.0%) | 72 (72.0%) |
| 75 Years and over | 86 (94.5%) | 72 (79.1%) |
| Total | 592 (34.3%) | 1,308 (75.9%) |
Disability Status by Sex by Age in Mechanicsburg
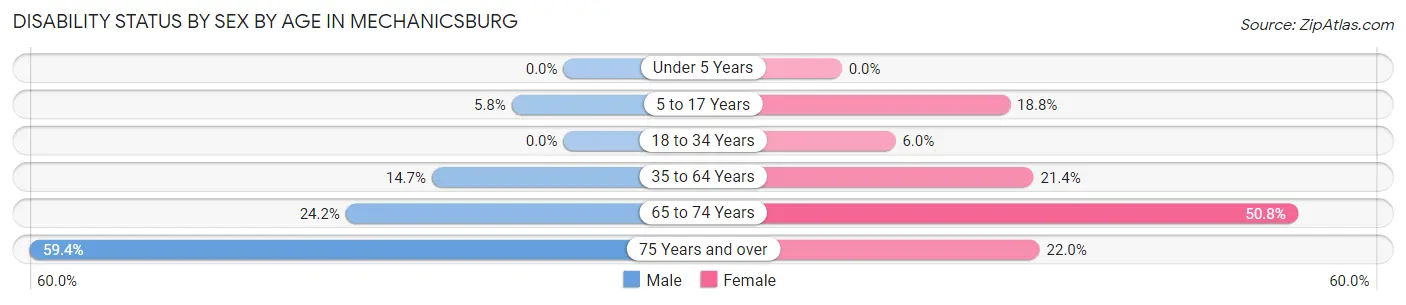
| Age Bracket | Male | Female |
| Under 5 Years | 0 (0.0%) | 0 (0.0%) |
| 5 to 17 Years | 8 (5.8%) | 12 (18.8%) |
| 18 to 34 Years | 0 (0.0%) | 15 (6.0%) |
| 35 to 64 Years | 40 (14.6%) | 63 (21.4%) |
| 65 to 74 Years | 8 (24.2%) | 34 (50.7%) |
| 75 Years and over | 19 (59.4%) | 13 (22.0%) |
Disability Class by Sex by Age in Mechanicsburg
Disability Class: Hearing Difficulty
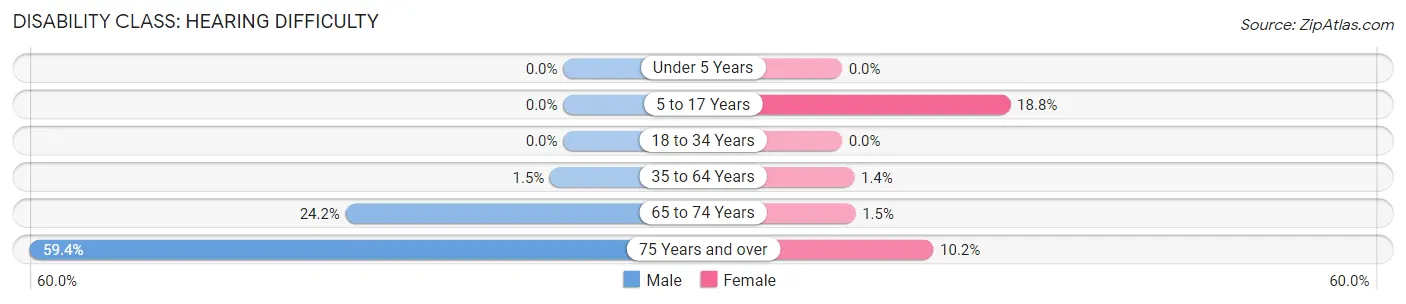
| Age Bracket | Male | Female |
| Under 5 Years | 0 (0.0%) | 0 (0.0%) |
| 5 to 17 Years | 0 (0.0%) | 12 (18.8%) |
| 18 to 34 Years | 0 (0.0%) | 0 (0.0%) |
| 35 to 64 Years | 4 (1.5%) | 4 (1.4%) |
| 65 to 74 Years | 8 (24.2%) | 1 (1.5%) |
| 75 Years and over | 19 (59.4%) | 6 (10.2%) |
Disability Class: Vision Difficulty
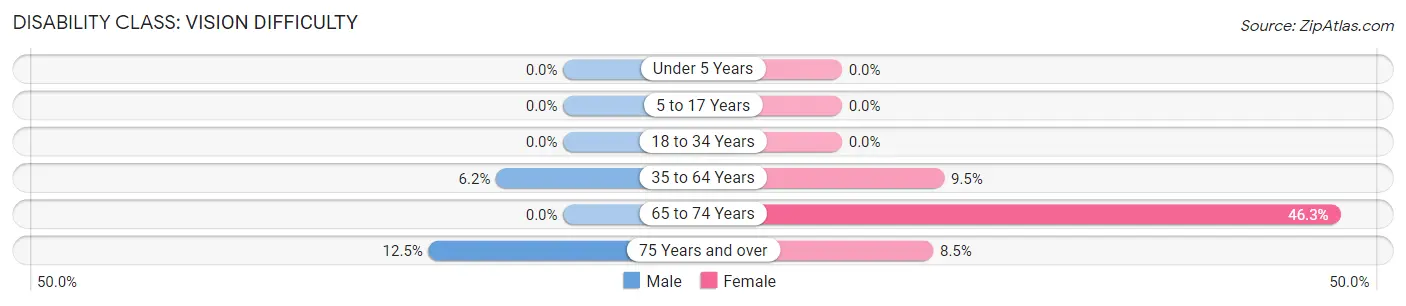
| Age Bracket | Male | Female |
| Under 5 Years | 0 (0.0%) | 0 (0.0%) |
| 5 to 17 Years | 0 (0.0%) | 0 (0.0%) |
| 18 to 34 Years | 0 (0.0%) | 0 (0.0%) |
| 35 to 64 Years | 17 (6.2%) | 28 (9.5%) |
| 65 to 74 Years | 0 (0.0%) | 31 (46.3%) |
| 75 Years and over | 4 (12.5%) | 5 (8.5%) |
Disability Class: Cognitive Difficulty
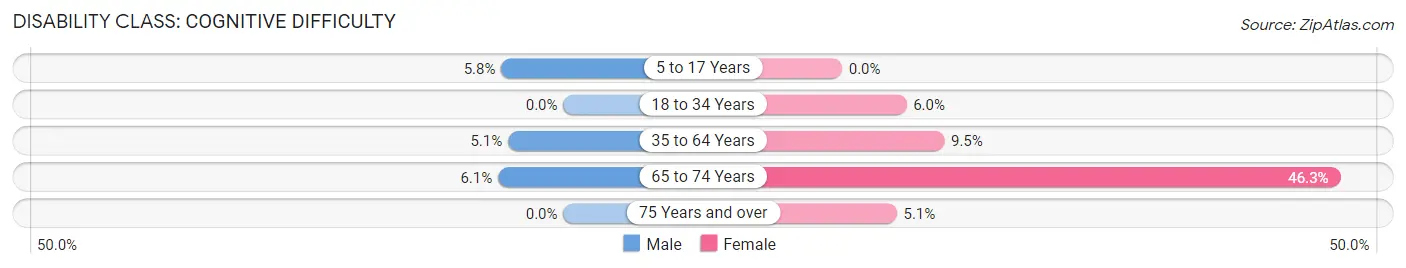
| Age Bracket | Male | Female |
| 5 to 17 Years | 8 (5.8%) | 0 (0.0%) |
| 18 to 34 Years | 0 (0.0%) | 15 (6.0%) |
| 35 to 64 Years | 14 (5.1%) | 28 (9.5%) |
| 65 to 74 Years | 2 (6.1%) | 31 (46.3%) |
| 75 Years and over | 0 (0.0%) | 3 (5.1%) |
Disability Class: Ambulatory Difficulty
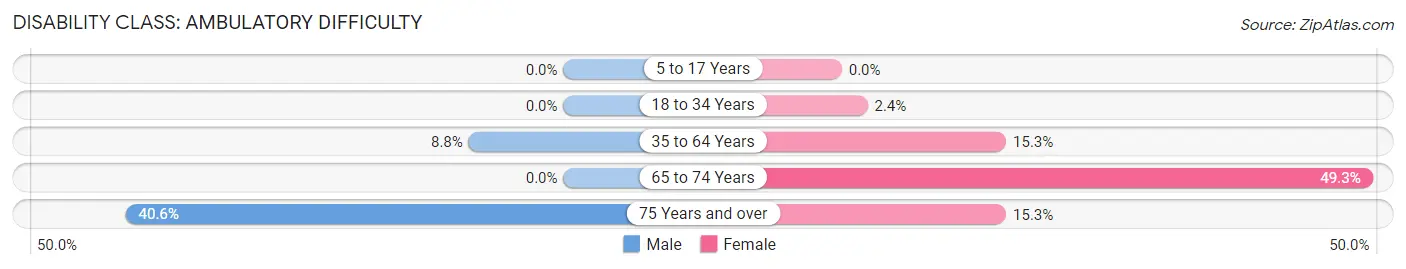
| Age Bracket | Male | Female |
| 5 to 17 Years | 0 (0.0%) | 0 (0.0%) |
| 18 to 34 Years | 0 (0.0%) | 6 (2.4%) |
| 35 to 64 Years | 24 (8.8%) | 45 (15.2%) |
| 65 to 74 Years | 0 (0.0%) | 33 (49.2%) |
| 75 Years and over | 13 (40.6%) | 9 (15.2%) |
Disability Class: Self-Care Difficulty
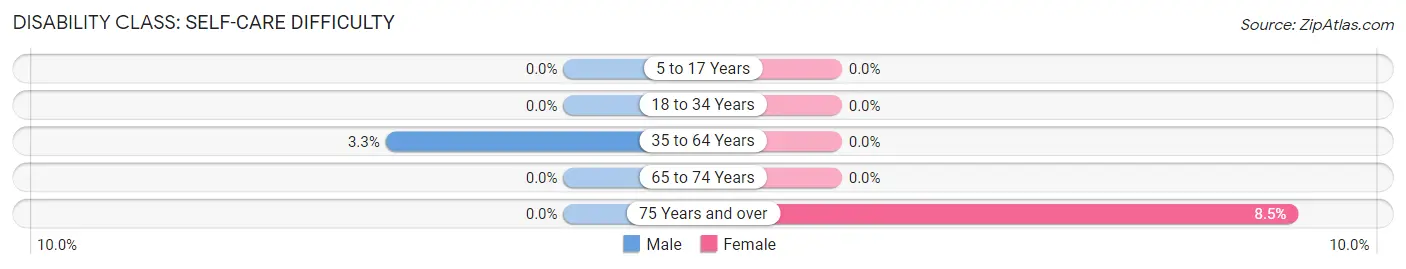
| Age Bracket | Male | Female |
| 5 to 17 Years | 0 (0.0%) | 0 (0.0%) |
| 18 to 34 Years | 0 (0.0%) | 0 (0.0%) |
| 35 to 64 Years | 9 (3.3%) | 0 (0.0%) |
| 65 to 74 Years | 0 (0.0%) | 0 (0.0%) |
| 75 Years and over | 0 (0.0%) | 5 (8.5%) |
Technology Access in Mechanicsburg
Computing Device Access in Mechanicsburg
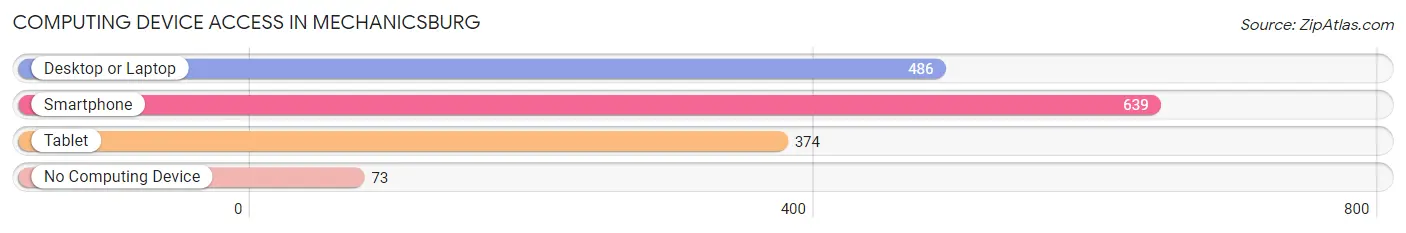
| Device Type | # Households | % Households |
| Desktop or Laptop | 486 | 65.8% |
| Smartphone | 639 | 86.5% |
| Tablet | 374 | 50.6% |
| No Computing Device | 73 | 9.9% |
| Total | 739 | 100.0% |
Internet Access in Mechanicsburg
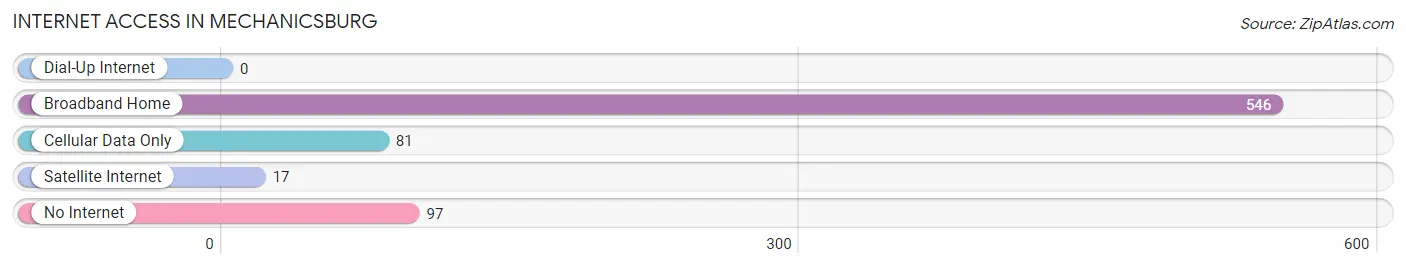
| Internet Type | # Households | % Households |
| Dial-Up Internet | 0 | 0.0% |
| Broadband Home | 546 | 73.9% |
| Cellular Data Only | 81 | 11.0% |
| Satellite Internet | 17 | 2.3% |
| No Internet | 97 | 13.1% |
| Total | 739 | 100.0% |
Mechanicsburg Summary
Mechanicsburg, Ohio is a small village located in Champaign County, Ohio. It is situated in the western part of the state, approximately 30 miles west of Columbus. The village has a population of approximately 1,500 people and is part of the Urbana Micropolitan Statistical Area.
History
The area that is now Mechanicsburg was first settled in 1805 by a group of settlers from Pennsylvania. The village was originally known as “Mechanicsburg” due to the large number of mechanics and craftsmen who settled in the area. The village was officially incorporated in 1837.
In the late 19th century, Mechanicsburg was a thriving agricultural community. The village was home to several mills, including a flour mill, a saw mill, and a grist mill. The village also had a blacksmith shop, a wagon shop, and a harness shop.
In the early 20th century, the village began to decline as the agricultural industry shifted away from the area. The village was also affected by the Great Depression and World War II. In the 1950s, the village began to experience a resurgence as new businesses moved into the area.
Geography
Mechanicsburg is located in western Champaign County, Ohio. The village is situated on the banks of the Mad River, which flows through the village. The village is located approximately 30 miles west of Columbus and is part of the Urbana Micropolitan Statistical Area.
The village is located in a rural area and is surrounded by farmland. The village is located near several state parks, including Buck Creek State Park, Mad River Gorge State Nature Preserve, and John Bryan State Park.
Economy
The economy of Mechanicsburg is largely based on agriculture. The village is home to several farms, including dairy farms, beef farms, and vegetable farms. The village is also home to several small businesses, including restaurants, retail stores, and service providers.
The village is also home to several manufacturing companies, including a plastics manufacturer and a metal fabrication company. The village is also home to a number of small technology companies, including a software development company and a web design company.
Demographics
As of the 2010 census, the population of Mechanicsburg was 1,500. The village is predominantly white, with approximately 95% of the population identifying as white. The village is also home to a small Hispanic population, with approximately 3% of the population identifying as Hispanic.
The median household income in Mechanicsburg is approximately $45,000. The village has a poverty rate of approximately 10%, which is slightly higher than the national average. The village also has a high rate of homeownership, with approximately 75% of the population owning their own homes.
Common Questions
What is Per Capita Income in Mechanicsburg?
Per Capita income in Mechanicsburg is $26,060.
What is the Median Family Income in Mechanicsburg?
Median Family Income in Mechanicsburg is $69,179.
What is the Median Household income in Mechanicsburg?
Median Household Income in Mechanicsburg is $56,146.
What is Income or Wage Gap in Mechanicsburg?
Income or Wage Gap in Mechanicsburg is 15.3%.
Women in Mechanicsburg earn 84.7 cents for every dollar earned by a man.
What is Inequality or Gini Index in Mechanicsburg?
Inequality or Gini Index in Mechanicsburg is 0.38.
What is the Total Population of Mechanicsburg?
Total Population of Mechanicsburg is 1,860.
What is the Total Male Population of Mechanicsburg?
Total Male Population of Mechanicsburg is 905.
What is the Total Female Population of Mechanicsburg?
Total Female Population of Mechanicsburg is 955.
What is the Ratio of Males per 100 Females in Mechanicsburg?
There are 94.76 Males per 100 Females in Mechanicsburg.
What is the Ratio of Females per 100 Males in Mechanicsburg?
There are 105.52 Females per 100 Males in Mechanicsburg.
What is the Median Population Age in Mechanicsburg?
Median Population Age in Mechanicsburg is 32.2 Years.
What is the Average Family Size in Mechanicsburg
Average Family Size in Mechanicsburg is 2.9 People.
What is the Average Household Size in Mechanicsburg
Average Household Size in Mechanicsburg is 2.3 People.
How Large is the Labor Force in Mechanicsburg?
There are 861 People in the Labor Forcein in Mechanicsburg.
What is the Percentage of People in the Labor Force in Mechanicsburg?
57.5% of People are in the Labor Force in Mechanicsburg.
What is the Unemployment Rate in Mechanicsburg?
Unemployment Rate in Mechanicsburg is 2.1%.