Conneaut, OH Map & Demographics
Conneaut Map
Conneaut Overview
$28,196
PER CAPITA INCOME
$60,342
AVG FAMILY INCOME
$55,708
AVG HOUSEHOLD INCOME
8.5%
WAGE / INCOME GAP [ % ]
91.5¢/ $1
WAGE / INCOME GAP [ $ ]
$8,526
FAMILY INCOME DEFICIT
0.47
INEQUALITY / GINI INDEX
12,372
TOTAL POPULATION
7,230
MALE POPULATION
5,142
FEMALE POPULATION
140.61
MALES / 100 FEMALES
71.12
FEMALES / 100 MALES
40.0
MEDIAN AGE
2.7
AVG FAMILY SIZE
2.3
AVG HOUSEHOLD SIZE
5,452
LABOR FORCE [ PEOPLE ]
53.3%
PERCENT IN LABOR FORCE
12.0%
UNEMPLOYMENT RATE
Conneaut Zip Codes
Conneaut Area Codes
Income in Conneaut
Income Overview in Conneaut
Per Capita Income in Conneaut is $28,196, while median incomes of families and households are $60,342 and $55,708 respectively.
| Characteristic | Number | Measure |
| Per Capita Income | 12,372 | $28,196 |
| Median Family Income | 2,946 | $60,342 |
| Mean Family Income | 2,946 | $82,041 |
| Median Household Income | 4,686 | $55,708 |
| Mean Household Income | 4,686 | $70,146 |
| Income Deficit | 2,946 | $8,526 |
| Wage / Income Gap (%) | 12,372 | 8.53% |
| Wage / Income Gap ($) | 12,372 | 91.47¢ per $1 |
| Gini / Inequality Index | 12,372 | 0.47 |
Earnings by Sex in Conneaut
Average Earnings in Conneaut are $27,013, $28,661 for men and $26,217 for women, a difference of 8.5%.
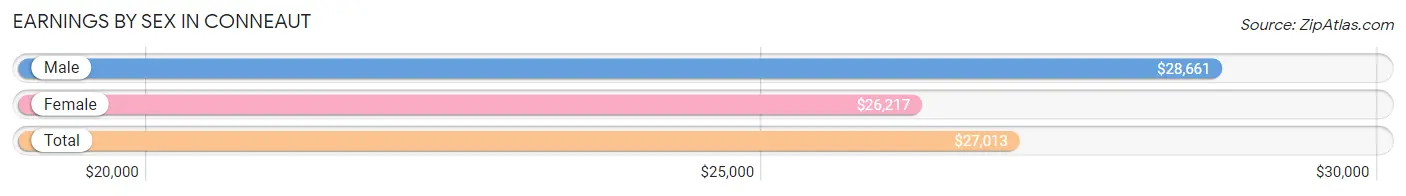
| Sex | Number | Average Earnings |
| Male | 3,878 (59.4%) | $28,661 |
| Female | 2,648 (40.6%) | $26,217 |
| Total | 6,526 (100.0%) | $27,013 |
Earnings by Sex by Income Bracket in Conneaut
The most common earnings brackets in Conneaut are $2,499 or less for men (363 | 9.4%) and $25,000 to $29,999 for women (318 | 12.0%).
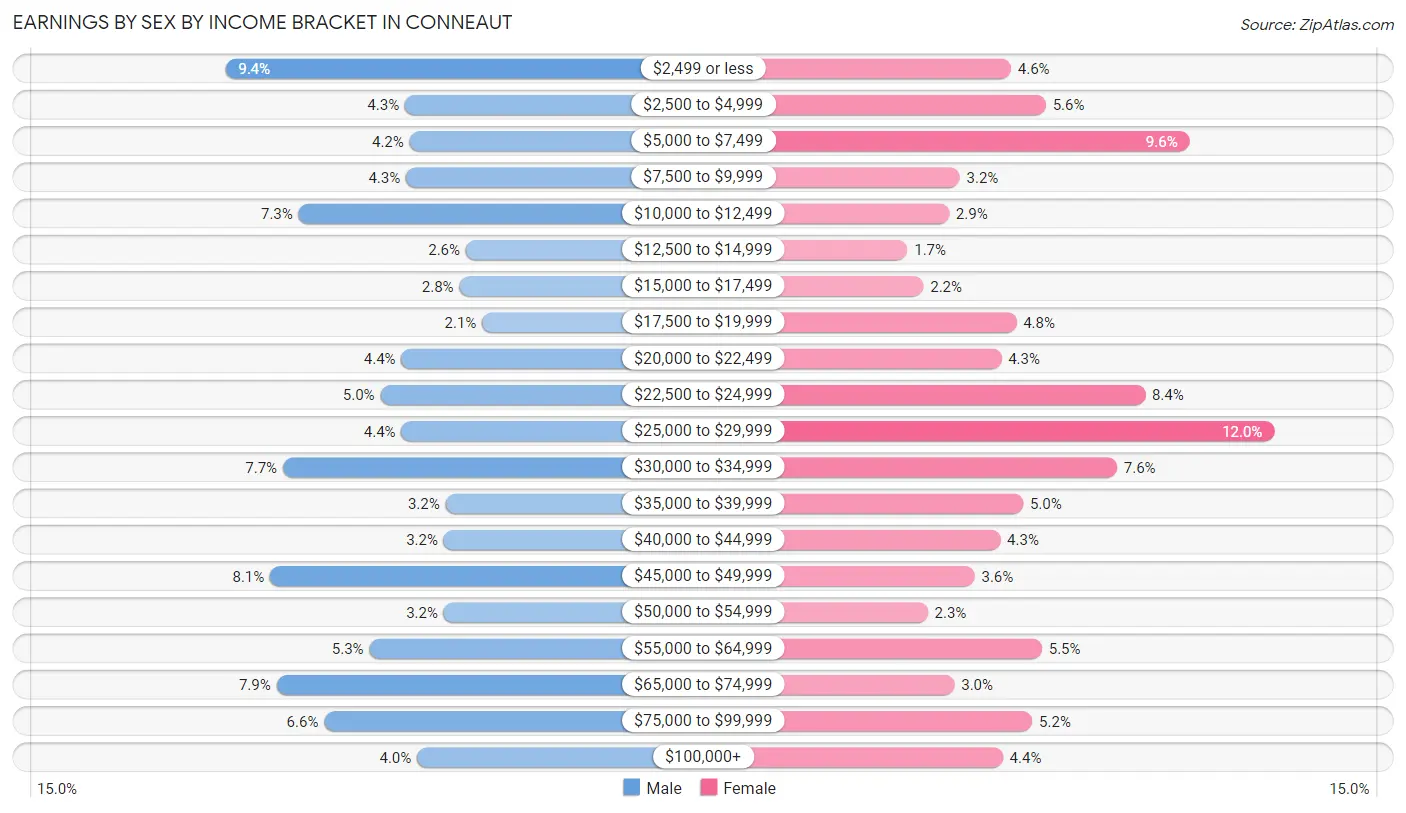
| Income | Male | Female |
| $2,499 or less | 363 (9.4%) | 122 (4.6%) |
| $2,500 to $4,999 | 167 (4.3%) | 148 (5.6%) |
| $5,000 to $7,499 | 162 (4.2%) | 255 (9.6%) |
| $7,500 to $9,999 | 166 (4.3%) | 84 (3.2%) |
| $10,000 to $12,499 | 283 (7.3%) | 76 (2.9%) |
| $12,500 to $14,999 | 101 (2.6%) | 45 (1.7%) |
| $15,000 to $17,499 | 108 (2.8%) | 57 (2.1%) |
| $17,500 to $19,999 | 83 (2.1%) | 126 (4.8%) |
| $20,000 to $22,499 | 171 (4.4%) | 115 (4.3%) |
| $22,500 to $24,999 | 194 (5.0%) | 222 (8.4%) |
| $25,000 to $29,999 | 171 (4.4%) | 318 (12.0%) |
| $30,000 to $34,999 | 300 (7.7%) | 201 (7.6%) |
| $35,000 to $39,999 | 123 (3.2%) | 131 (5.0%) |
| $40,000 to $44,999 | 125 (3.2%) | 114 (4.3%) |
| $45,000 to $49,999 | 314 (8.1%) | 95 (3.6%) |
| $50,000 to $54,999 | 125 (3.2%) | 60 (2.3%) |
| $55,000 to $64,999 | 206 (5.3%) | 145 (5.5%) |
| $65,000 to $74,999 | 307 (7.9%) | 80 (3.0%) |
| $75,000 to $99,999 | 255 (6.6%) | 138 (5.2%) |
| $100,000+ | 154 (4.0%) | 116 (4.4%) |
| Total | 3,878 (100.0%) | 2,648 (100.0%) |
Earnings by Sex by Educational Attainment in Conneaut
Average earnings in Conneaut are $33,412 for men and $27,839 for women, a difference of 16.7%. Men with an educational attainment of graduate degree enjoy the highest average annual earnings of $59,861, while those with high school diploma education earn the least with $25,772. Women with an educational attainment of graduate degree earn the most with the average annual earnings of $57,955, while those with high school diploma education have the smallest earnings of $22,971.
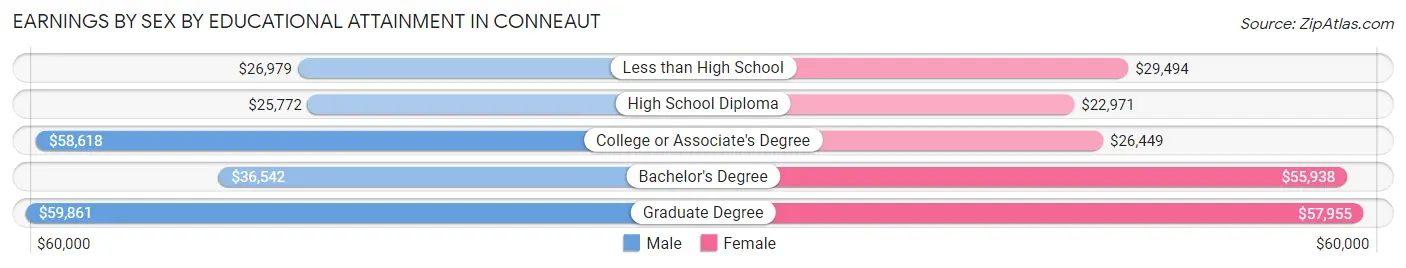
| Educational Attainment | Male Income | Female Income |
| Less than High School | $26,979 | $29,494 |
| High School Diploma | $25,772 | $22,971 |
| College or Associate's Degree | $58,618 | $26,449 |
| Bachelor's Degree | $36,542 | $55,938 |
| Graduate Degree | $59,861 | $57,955 |
| Total | $33,412 | $27,839 |
Family Income in Conneaut
Family Income Brackets in Conneaut
According to the Conneaut family income data, there are 577 families falling into the $50,000 to $74,999 income range, which is the most common income bracket and makes up 19.6% of all families. Conversely, the $200,000+ income bracket is the least frequent group with only 53 families (1.8%) belonging to this category.
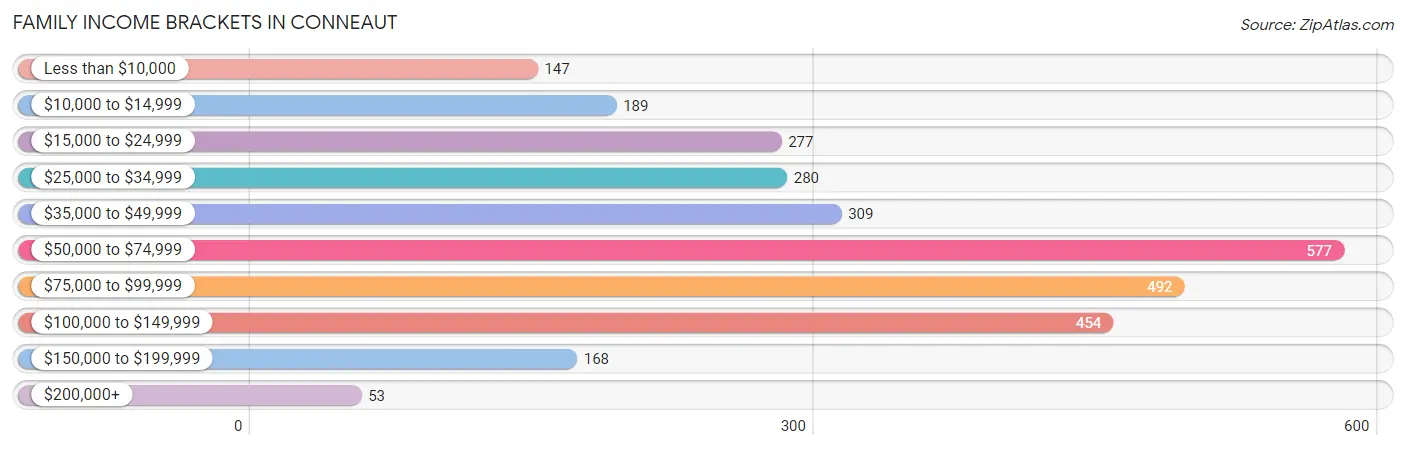
| Income Bracket | # Families | % Families |
| Less than $10,000 | 147 | 5.0% |
| $10,000 to $14,999 | 189 | 6.4% |
| $15,000 to $24,999 | 277 | 9.4% |
| $25,000 to $34,999 | 280 | 9.5% |
| $35,000 to $49,999 | 309 | 10.5% |
| $50,000 to $74,999 | 577 | 19.6% |
| $75,000 to $99,999 | 492 | 16.7% |
| $100,000 to $149,999 | 454 | 15.4% |
| $150,000 to $199,999 | 168 | 5.7% |
| $200,000+ | 53 | 1.8% |
Family Income by Famaliy Size in Conneaut
5-person families (133 | 4.5%) account for the highest median family income in Conneaut with $84,205 per family, while 2-person families (1,662 | 56.4%) have the highest median income of $29,059 per family member.
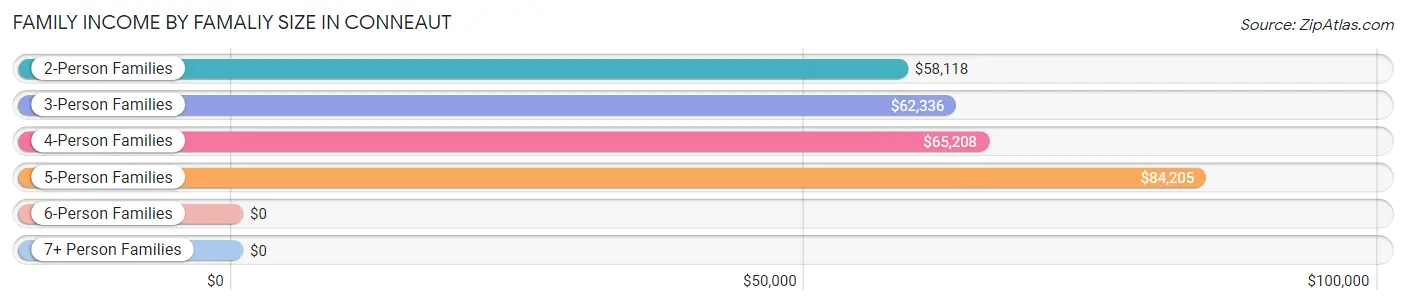
| Income Bracket | # Families | Median Income |
| 2-Person Families | 1,662 (56.4%) | $58,118 |
| 3-Person Families | 817 (27.7%) | $62,336 |
| 4-Person Families | 317 (10.8%) | $65,208 |
| 5-Person Families | 133 (4.5%) | $84,205 |
| 6-Person Families | 17 (0.6%) | $0 |
| 7+ Person Families | 0 (0.0%) | $0 |
| Total | 2,946 (100.0%) | $60,342 |
Family Income by Number of Earners in Conneaut
The median family income in Conneaut is $60,342, with families comprising 3+ earners (223) having the highest median family income of $84,940, while families with no earners (562) have the lowest median family income of $34,324, accounting for 7.6% and 19.1% of families, respectively.
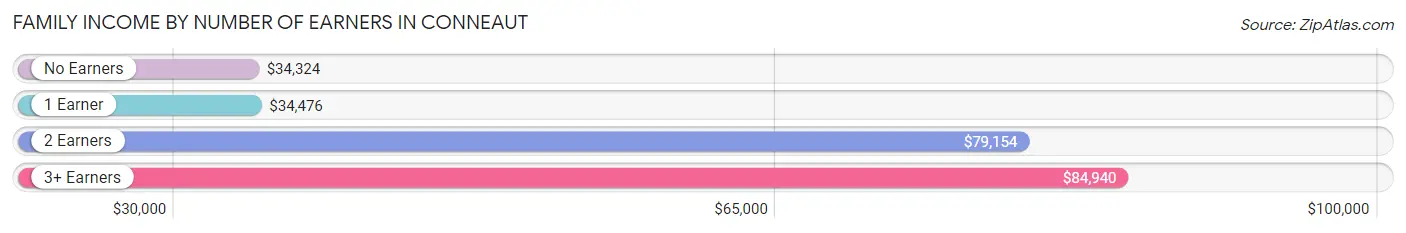
| Number of Earners | # Families | Median Income |
| No Earners | 562 (19.1%) | $34,324 |
| 1 Earner | 1,065 (36.1%) | $34,476 |
| 2 Earners | 1,096 (37.2%) | $79,154 |
| 3+ Earners | 223 (7.6%) | $84,940 |
| Total | 2,946 (100.0%) | $60,342 |
Household Income in Conneaut
Household Income Brackets in Conneaut
With 881 households falling in the category, the $50,000 to $74,999 income range is the most frequent in Conneaut, accounting for 18.8% of all households. In contrast, only 80 households (1.7%) fall into the $200,000+ income bracket, making it the least populous group.
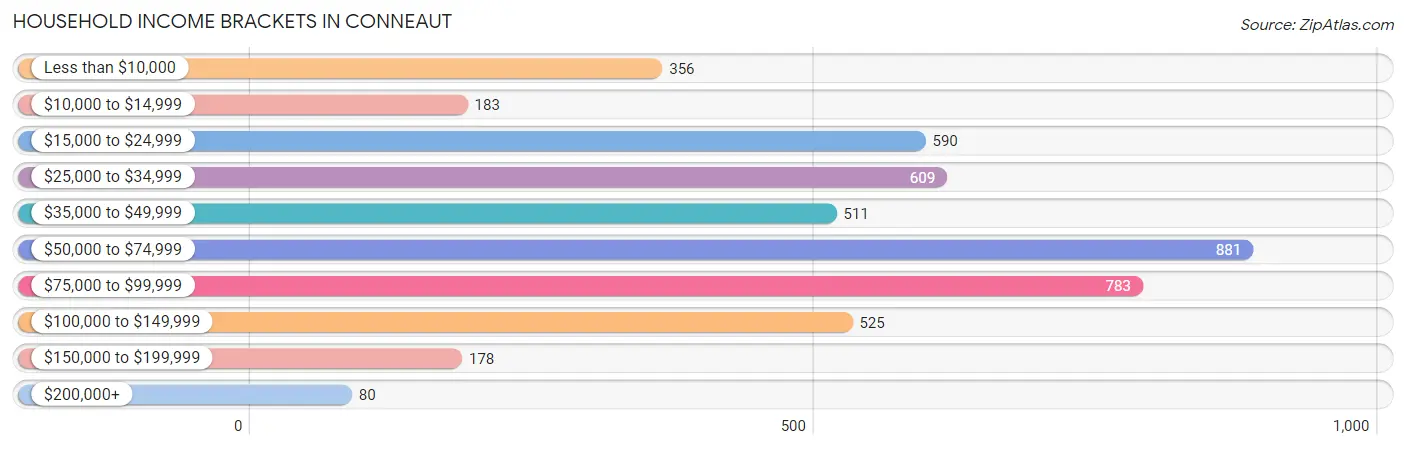
| Income Bracket | # Households | % Households |
| Less than $10,000 | 356 | 7.6% |
| $10,000 to $14,999 | 183 | 3.9% |
| $15,000 to $24,999 | 590 | 12.6% |
| $25,000 to $34,999 | 609 | 13.0% |
| $35,000 to $49,999 | 511 | 10.9% |
| $50,000 to $74,999 | 881 | 18.8% |
| $75,000 to $99,999 | 783 | 16.7% |
| $100,000 to $149,999 | 525 | 11.2% |
| $150,000 to $199,999 | 178 | 3.8% |
| $200,000+ | 80 | 1.7% |
Household Income by Householder Age in Conneaut
The median household income in Conneaut is $55,708, with the highest median household income of $65,491 found in the 25 to 44 years age bracket for the primary householder. A total of 1,399 households (29.8%) fall into this category. Meanwhile, the 15 to 24 years age bracket for the primary householder has the lowest median household income of $33,969, with 93 households (2.0%) in this group.
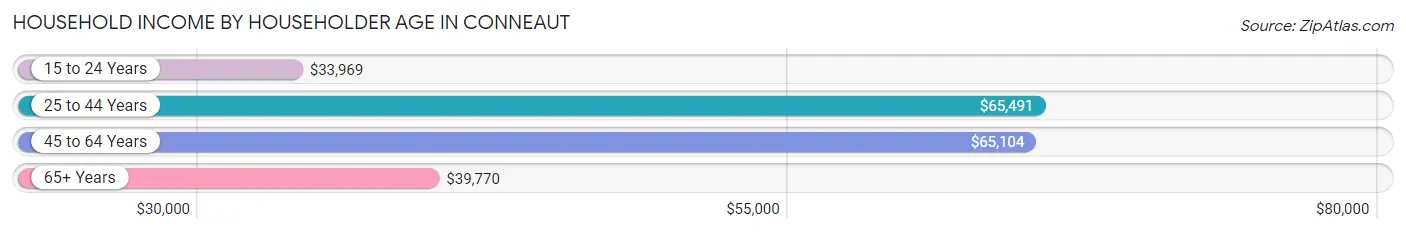
| Income Bracket | # Households | Median Income |
| 15 to 24 Years | 93 (2.0%) | $33,969 |
| 25 to 44 Years | 1,399 (29.8%) | $65,491 |
| 45 to 64 Years | 1,791 (38.2%) | $65,104 |
| 65+ Years | 1,403 (29.9%) | $39,770 |
| Total | 4,686 (100.0%) | $55,708 |
Poverty in Conneaut
Income Below Poverty by Sex and Age in Conneaut
With 18.3% poverty level for males and 19.6% for females among the residents of Conneaut, 12 to 14 year old males and 35 to 44 year old females are the most vulnerable to poverty, with 167 males (52.8%) and 186 females (34.4%) in their respective age groups living below the poverty level.
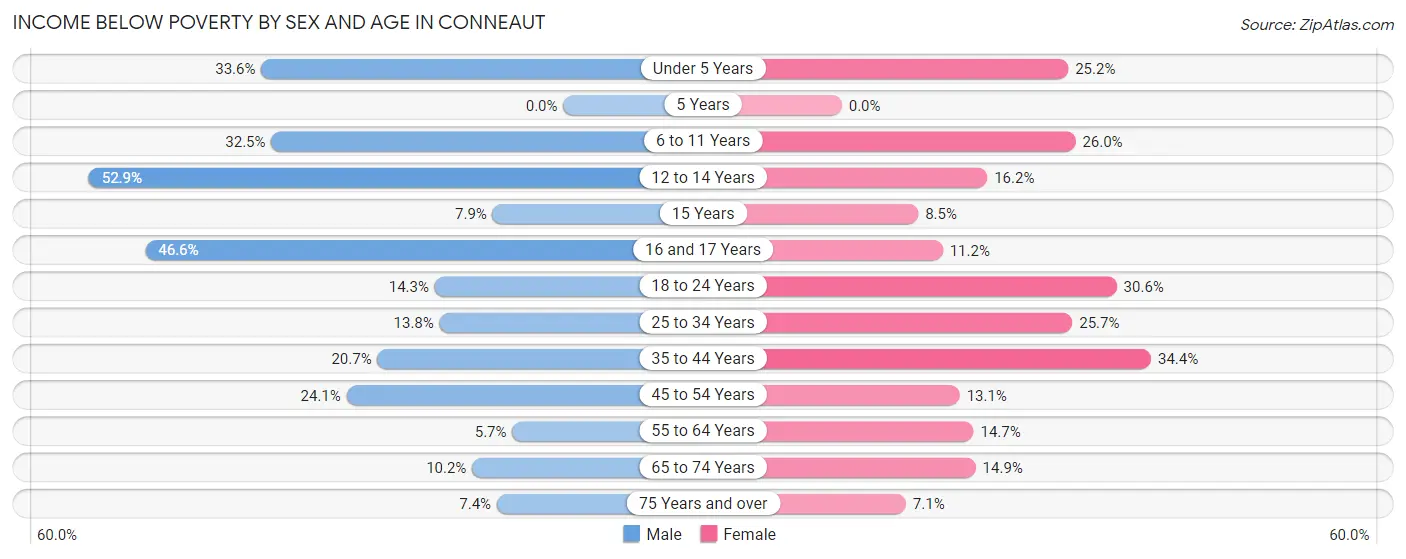
| Age Bracket | Male | Female |
| Under 5 Years | 73 (33.6%) | 85 (25.2%) |
| 5 Years | 0 (0.0%) | 0 (0.0%) |
| 6 to 11 Years | 134 (32.5%) | 96 (26.0%) |
| 12 to 14 Years | 167 (52.8%) | 29 (16.2%) |
| 15 Years | 10 (7.9%) | 8 (8.5%) |
| 16 and 17 Years | 27 (46.6%) | 20 (11.2%) |
| 18 to 24 Years | 59 (14.3%) | 60 (30.6%) |
| 25 to 34 Years | 110 (13.8%) | 220 (25.7%) |
| 35 to 44 Years | 113 (20.7%) | 186 (34.4%) |
| 45 to 54 Years | 182 (24.1%) | 83 (13.1%) |
| 55 to 64 Years | 47 (5.7%) | 114 (14.7%) |
| 65 to 74 Years | 61 (10.2%) | 65 (14.9%) |
| 75 Years and over | 31 (7.4%) | 35 (7.1%) |
| Total | 1,014 (18.3%) | 1,001 (19.6%) |
Income Above Poverty by Sex and Age in Conneaut
According to the poverty statistics in Conneaut, males aged 5 years and females aged 5 years are the age groups that are most secure financially, with 100.0% of males and 100.0% of females in these age groups living above the poverty line.
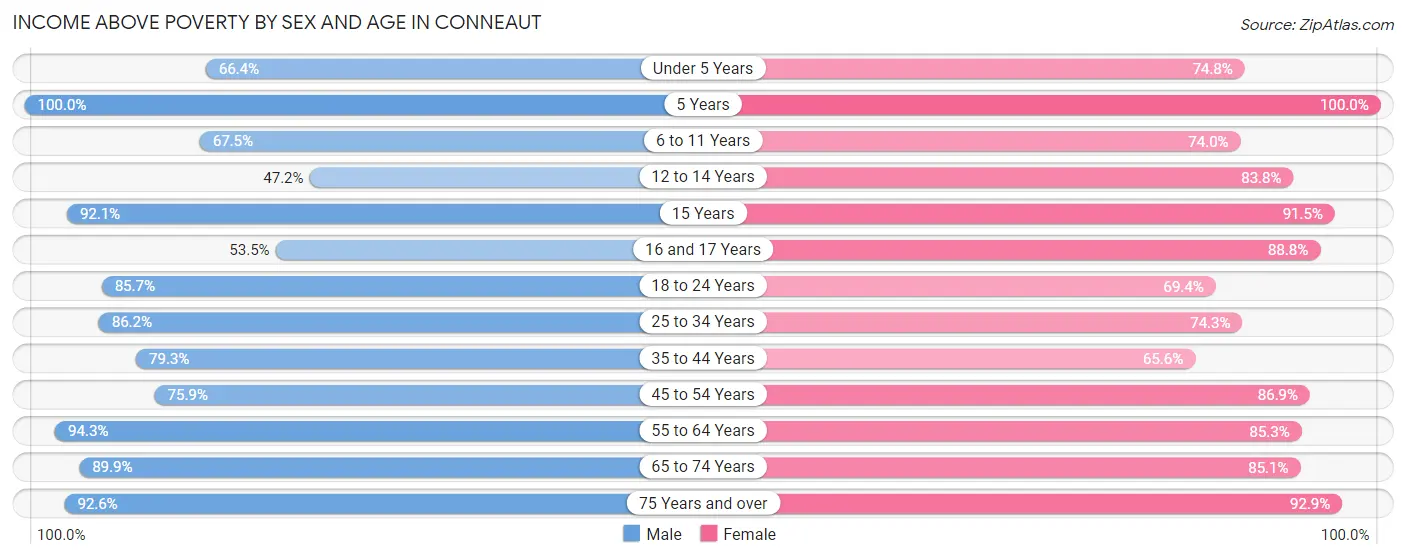
| Age Bracket | Male | Female |
| Under 5 Years | 144 (66.4%) | 252 (74.8%) |
| 5 Years | 52 (100.0%) | 17 (100.0%) |
| 6 to 11 Years | 278 (67.5%) | 273 (74.0%) |
| 12 to 14 Years | 149 (47.1%) | 150 (83.8%) |
| 15 Years | 117 (92.1%) | 86 (91.5%) |
| 16 and 17 Years | 31 (53.4%) | 158 (88.8%) |
| 18 to 24 Years | 353 (85.7%) | 136 (69.4%) |
| 25 to 34 Years | 688 (86.2%) | 637 (74.3%) |
| 35 to 44 Years | 433 (79.3%) | 354 (65.6%) |
| 45 to 54 Years | 572 (75.9%) | 549 (86.9%) |
| 55 to 64 Years | 781 (94.3%) | 663 (85.3%) |
| 65 to 74 Years | 540 (89.8%) | 371 (85.1%) |
| 75 Years and over | 388 (92.6%) | 455 (92.9%) |
| Total | 4,526 (81.7%) | 4,101 (80.4%) |
Income Below Poverty Among Married-Couple Families in Conneaut
The poverty statistics for married-couple families in Conneaut show that 5.8% or 109 of the total 1,870 families live below the poverty line. Families with 1 or 2 children have the highest poverty rate of 6.3%, comprising of 34 families. On the other hand, families with 3 or 4 children have the lowest poverty rate of 0.0%, which includes 0 families.
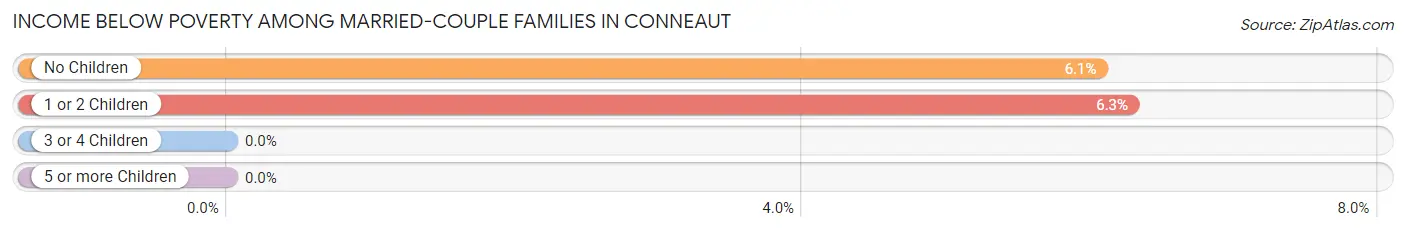
| Children | Above Poverty | Below Poverty |
| No Children | 1,163 (93.9%) | 75 (6.1%) |
| 1 or 2 Children | 507 (93.7%) | 34 (6.3%) |
| 3 or 4 Children | 91 (100.0%) | 0 (0.0%) |
| 5 or more Children | 0 (0.0%) | 0 (0.0%) |
| Total | 1,761 (94.2%) | 109 (5.8%) |
Income Below Poverty Among Single-Parent Households in Conneaut
According to the poverty data in Conneaut, 48.2% or 81 single-father households and 38.7% or 351 single-mother households are living below the poverty line. Among single-father households, those with 1 or 2 children have the highest poverty rate, with 81 households (79.4%) experiencing poverty. Likewise, among single-mother households, those with 1 or 2 children have the highest poverty rate, with 297 households (52.4%) falling below the poverty line.
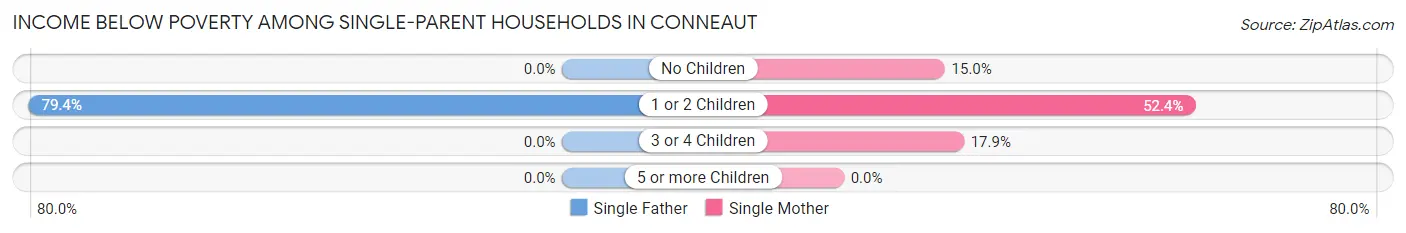
| Children | Single Father | Single Mother |
| No Children | 0 (0.0%) | 37 (15.0%) |
| 1 or 2 Children | 81 (79.4%) | 297 (52.4%) |
| 3 or 4 Children | 0 (0.0%) | 17 (17.9%) |
| 5 or more Children | 0 (0.0%) | 0 (0.0%) |
| Total | 81 (48.2%) | 351 (38.7%) |
Income Below Poverty Among Married-Couple vs Single-Parent Households in Conneaut
The poverty data for Conneaut shows that 109 of the married-couple family households (5.8%) and 432 of the single-parent households (40.2%) are living below the poverty level. Within the married-couple family households, those with 1 or 2 children have the highest poverty rate, with 34 households (6.3%) falling below the poverty line. Among the single-parent households, those with 1 or 2 children have the highest poverty rate, with 378 household (56.5%) living below poverty.
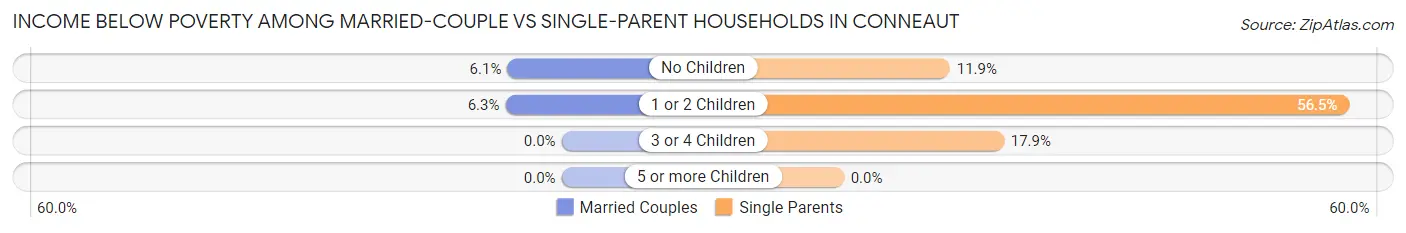
| Children | Married-Couple Families | Single-Parent Households |
| No Children | 75 (6.1%) | 37 (11.9%) |
| 1 or 2 Children | 34 (6.3%) | 378 (56.5%) |
| 3 or 4 Children | 0 (0.0%) | 17 (17.9%) |
| 5 or more Children | 0 (0.0%) | 0 (0.0%) |
| Total | 109 (5.8%) | 432 (40.2%) |
Race in Conneaut
The most populous races in Conneaut are White / Caucasian (10,899 | 88.1%), Black / African American (873 | 7.1%), and Two or more Races (497 | 4.0%).
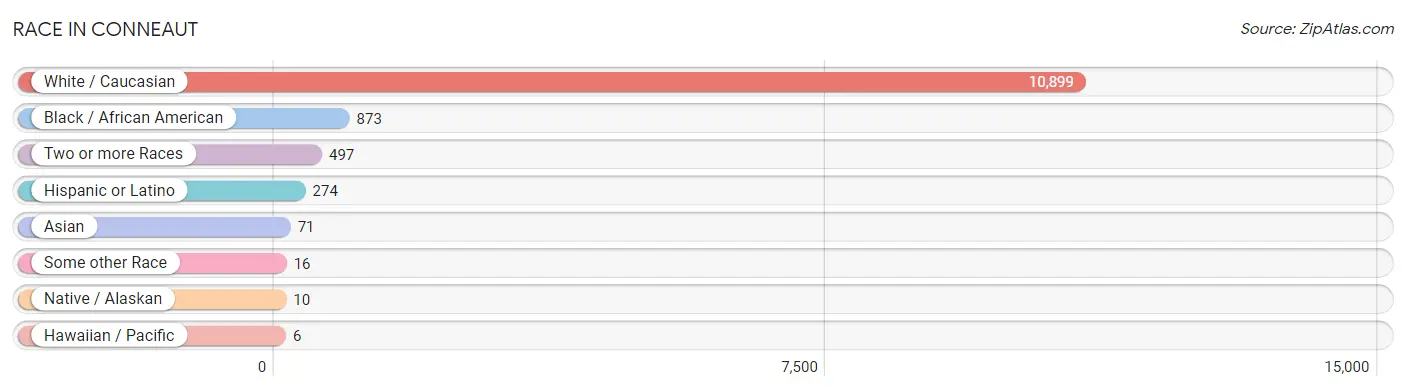
| Race | # Population | % Population |
| Asian | 71 | 0.6% |
| Black / African American | 873 | 7.1% |
| Hawaiian / Pacific | 6 | 0.1% |
| Hispanic or Latino | 274 | 2.2% |
| Native / Alaskan | 10 | 0.1% |
| White / Caucasian | 10,899 | 88.1% |
| Two or more Races | 497 | 4.0% |
| Some other Race | 16 | 0.1% |
| Total | 12,372 | 100.0% |
Ancestry in Conneaut
The most populous ancestries reported in Conneaut are German (2,805 | 22.7%), Irish (1,931 | 15.6%), English (1,399 | 11.3%), Italian (1,395 | 11.3%), and American (1,380 | 11.2%), together accounting for 72.0% of all Conneaut residents.
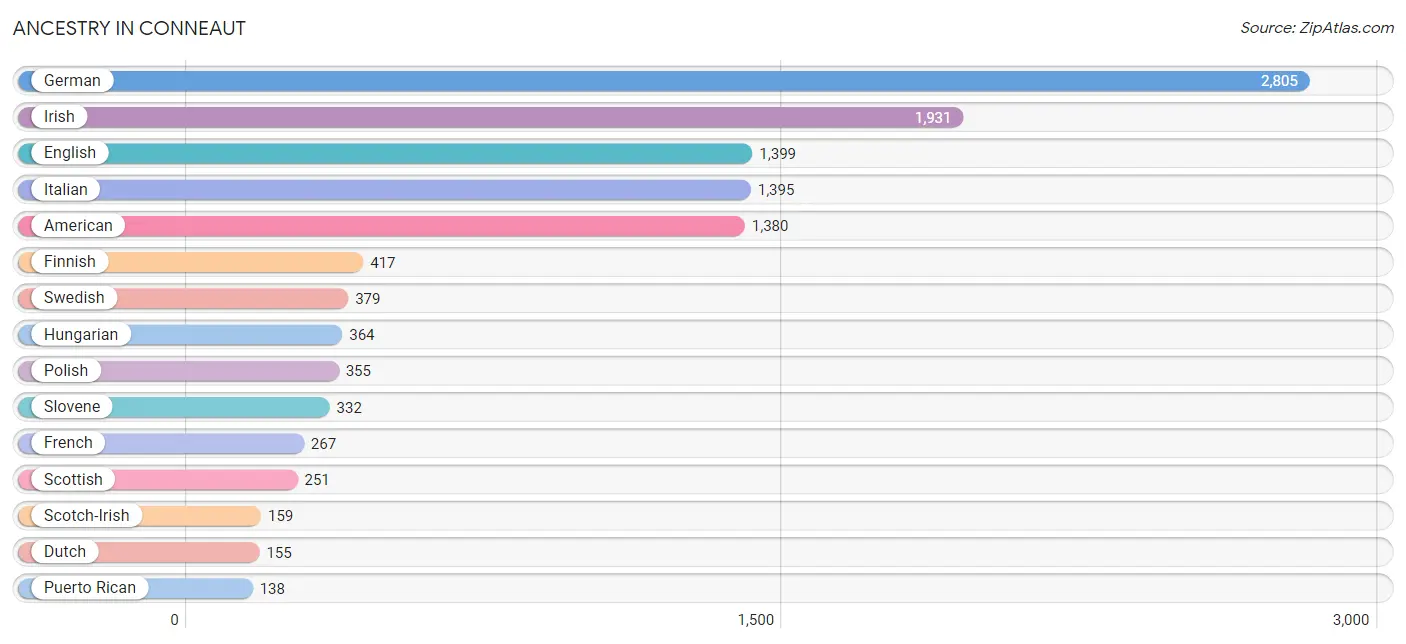
| Ancestry | # Population | % Population |
| African | 18 | 0.2% |
| American | 1,380 | 11.2% |
| Apache | 37 | 0.3% |
| Arab | 31 | 0.3% |
| Blackfeet | 60 | 0.5% |
| British | 73 | 0.6% |
| Canadian | 9 | 0.1% |
| Cherokee | 59 | 0.5% |
| Cree | 5 | 0.0% |
| Croatian | 21 | 0.2% |
| Cuban | 3 | 0.0% |
| Czech | 28 | 0.2% |
| Dominican | 11 | 0.1% |
| Dutch | 155 | 1.3% |
| Eastern European | 26 | 0.2% |
| English | 1,399 | 11.3% |
| Estonian | 7 | 0.1% |
| European | 51 | 0.4% |
| Finnish | 417 | 3.4% |
| French | 267 | 2.2% |
| French Canadian | 12 | 0.1% |
| German | 2,805 | 22.7% |
| Greek | 61 | 0.5% |
| Hungarian | 364 | 2.9% |
| Indian (Asian) | 57 | 0.5% |
| Irish | 1,931 | 15.6% |
| Iroquois | 6 | 0.1% |
| Italian | 1,395 | 11.3% |
| Jamaican | 5 | 0.0% |
| Korean | 10 | 0.1% |
| Lebanese | 25 | 0.2% |
| Mexican | 55 | 0.4% |
| Native Hawaiian | 26 | 0.2% |
| Navajo | 4 | 0.0% |
| Nigerian | 8 | 0.1% |
| Northern European | 12 | 0.1% |
| Norwegian | 46 | 0.4% |
| Pennsylvania German | 19 | 0.2% |
| Polish | 355 | 2.9% |
| Portuguese | 24 | 0.2% |
| Puerto Rican | 138 | 1.1% |
| Romanian | 15 | 0.1% |
| Russian | 99 | 0.8% |
| Scandinavian | 53 | 0.4% |
| Scotch-Irish | 159 | 1.3% |
| Scottish | 251 | 2.0% |
| Slovak | 57 | 0.5% |
| Slovene | 332 | 2.7% |
| Spanish | 67 | 0.5% |
| Sri Lankan | 107 | 0.9% |
| Subsaharan African | 26 | 0.2% |
| Swedish | 379 | 3.1% |
| Swiss | 8 | 0.1% |
| Welsh | 88 | 0.7% | View All 54 Rows |
Immigrants in Conneaut
The most numerous immigrant groups reported in Conneaut came from Europe (24 | 0.2%), Asia (20 | 0.2%), Latin America (16 | 0.1%), Eastern Europe (15 | 0.1%), and Romania (15 | 0.1%), together accounting for 0.7% of all Conneaut residents.
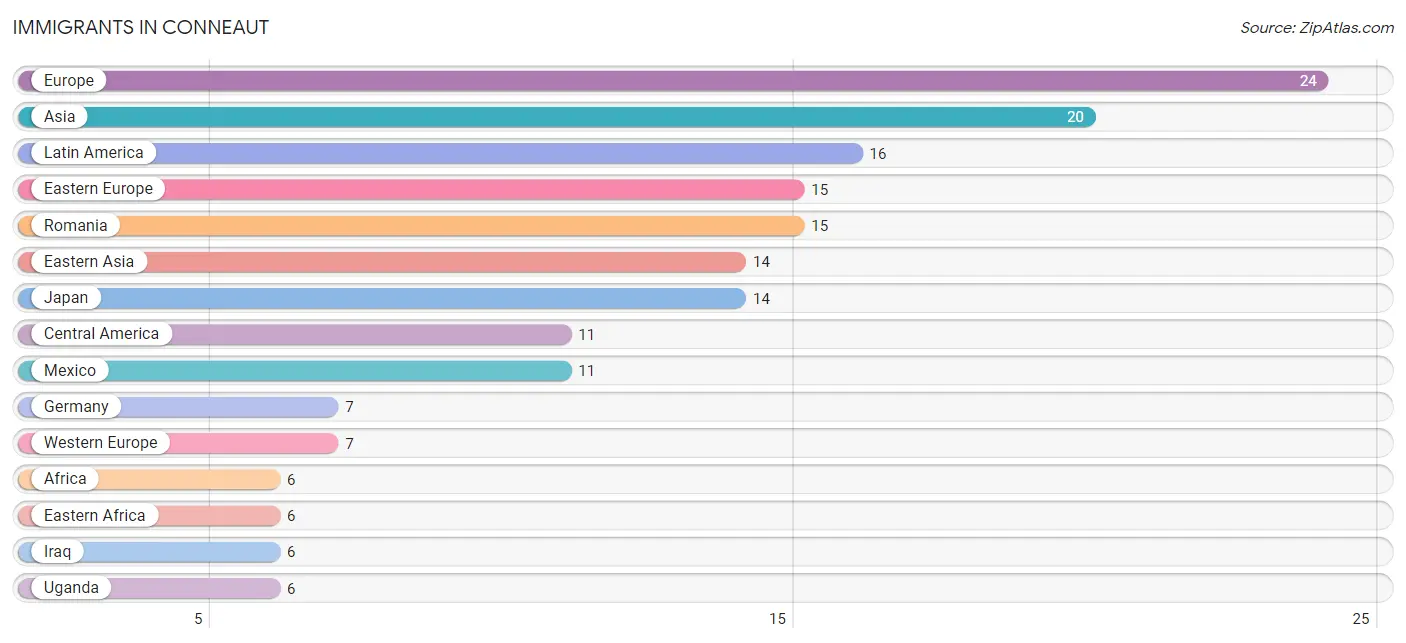
| Immigration Origin | # Population | % Population |
| Africa | 6 | 0.1% |
| Asia | 20 | 0.2% |
| Caribbean | 5 | 0.0% |
| Central America | 11 | 0.1% |
| Eastern Africa | 6 | 0.1% |
| Eastern Asia | 14 | 0.1% |
| Eastern Europe | 15 | 0.1% |
| Europe | 24 | 0.2% |
| Germany | 7 | 0.1% |
| Iraq | 6 | 0.1% |
| Italy | 2 | 0.0% |
| Jamaica | 5 | 0.0% |
| Japan | 14 | 0.1% |
| Latin America | 16 | 0.1% |
| Mexico | 11 | 0.1% |
| Romania | 15 | 0.1% |
| Southern Europe | 2 | 0.0% |
| Uganda | 6 | 0.1% |
| Western Asia | 6 | 0.1% |
| Western Europe | 7 | 0.1% | View All 20 Rows |
Sex and Age in Conneaut
Sex and Age in Conneaut
The most populous age groups in Conneaut are 25 to 29 Years (694 | 9.6%) for men and 25 to 29 Years (539 | 10.5%) for women.
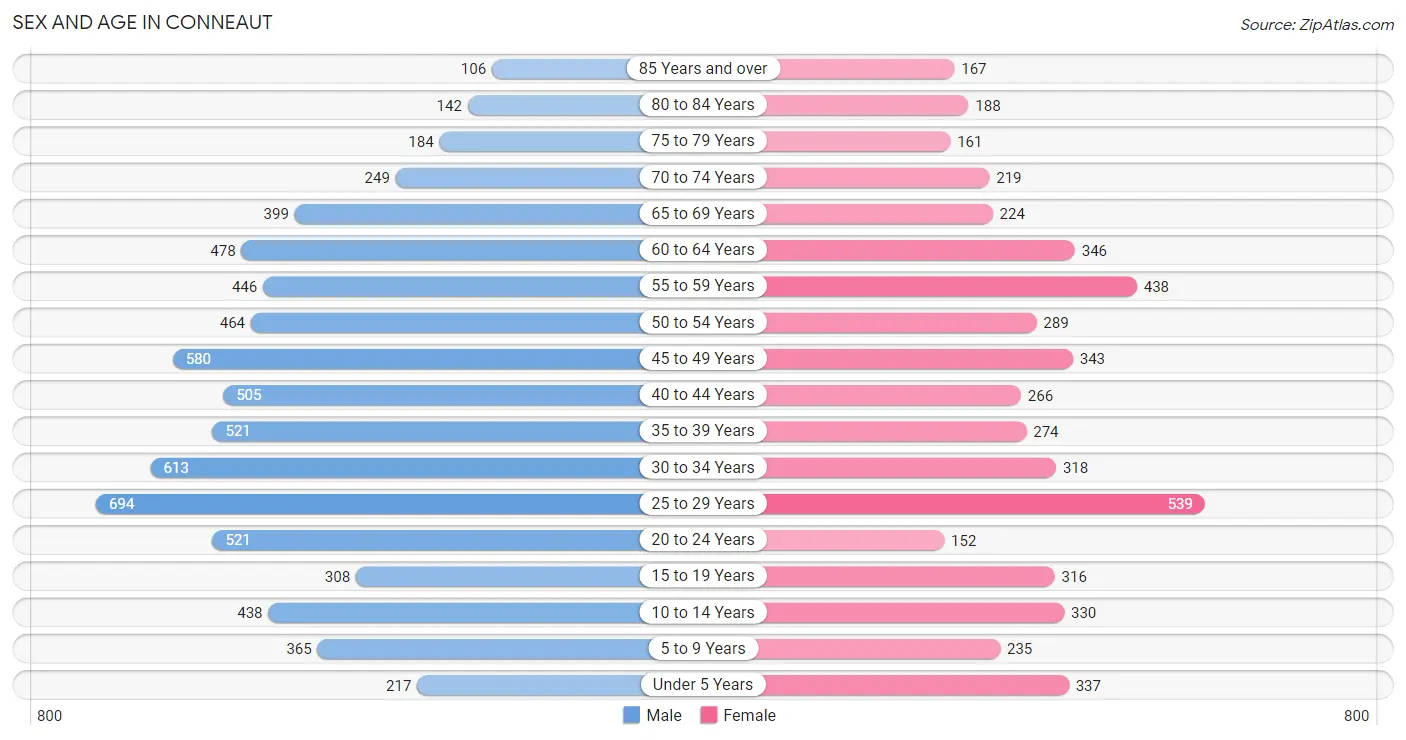
| Age Bracket | Male | Female |
| Under 5 Years | 217 (3.0%) | 337 (6.6%) |
| 5 to 9 Years | 365 (5.1%) | 235 (4.6%) |
| 10 to 14 Years | 438 (6.1%) | 330 (6.4%) |
| 15 to 19 Years | 308 (4.3%) | 316 (6.1%) |
| 20 to 24 Years | 521 (7.2%) | 152 (3.0%) |
| 25 to 29 Years | 694 (9.6%) | 539 (10.5%) |
| 30 to 34 Years | 613 (8.5%) | 318 (6.2%) |
| 35 to 39 Years | 521 (7.2%) | 274 (5.3%) |
| 40 to 44 Years | 505 (7.0%) | 266 (5.2%) |
| 45 to 49 Years | 580 (8.0%) | 343 (6.7%) |
| 50 to 54 Years | 464 (6.4%) | 289 (5.6%) |
| 55 to 59 Years | 446 (6.2%) | 438 (8.5%) |
| 60 to 64 Years | 478 (6.6%) | 346 (6.7%) |
| 65 to 69 Years | 399 (5.5%) | 224 (4.4%) |
| 70 to 74 Years | 249 (3.4%) | 219 (4.3%) |
| 75 to 79 Years | 184 (2.5%) | 161 (3.1%) |
| 80 to 84 Years | 142 (2.0%) | 188 (3.7%) |
| 85 Years and over | 106 (1.5%) | 167 (3.3%) |
| Total | 7,230 (100.0%) | 5,142 (100.0%) |
Families and Households in Conneaut
Median Family Size in Conneaut
The median family size in Conneaut is 2.70 persons per family, with single female/mother families (908 | 30.8%) accounting for the largest median family size of 2.9 persons per family. On the other hand, single male/father families (168 | 5.7%) represent the smallest median family size with 1.92 persons per family.
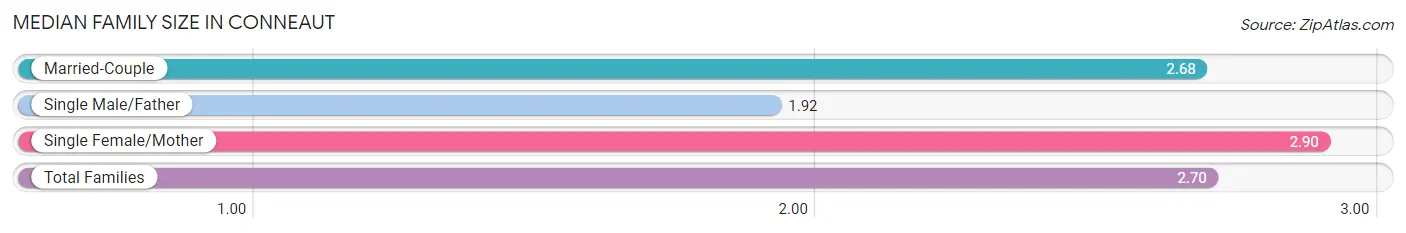
| Family Type | # Families | Family Size |
| Married-Couple | 1,870 (63.5%) | 2.68 |
| Single Male/Father | 168 (5.7%) | 1.92 |
| Single Female/Mother | 908 (30.8%) | 2.90 |
| Total Families | 2,946 (100.0%) | 2.70 |
Median Household Size in Conneaut
The median household size in Conneaut is 2.27 persons per household, with single female/mother households (908 | 19.4%) accounting for the largest median household size of 3.49 persons per household. non-family households (1,740 | 37.1%) represent the smallest median household size with 1.14 persons per household.
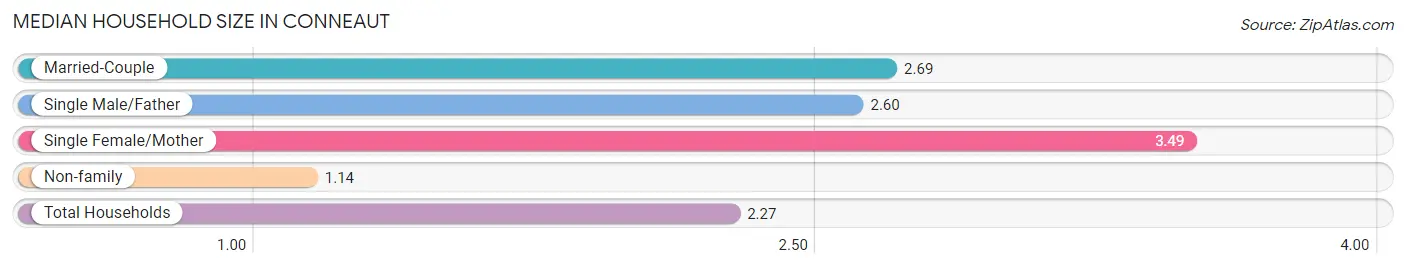
| Household Type | # Households | Household Size |
| Married-Couple | 1,870 (39.9%) | 2.69 |
| Single Male/Father | 168 (3.6%) | 2.60 |
| Single Female/Mother | 908 (19.4%) | 3.49 |
| Non-family | 1,740 (37.1%) | 1.14 |
| Total Households | 4,686 (100.0%) | 2.27 |
Household Size by Marriage Status in Conneaut
Out of a total of 4,686 households in Conneaut, 2,946 (62.9%) are family households, while 1,740 (37.1%) are nonfamily households. The most numerous type of family households are 2-person households, comprising 1,363, and the most common type of nonfamily households are 1-person households, comprising 1,503.
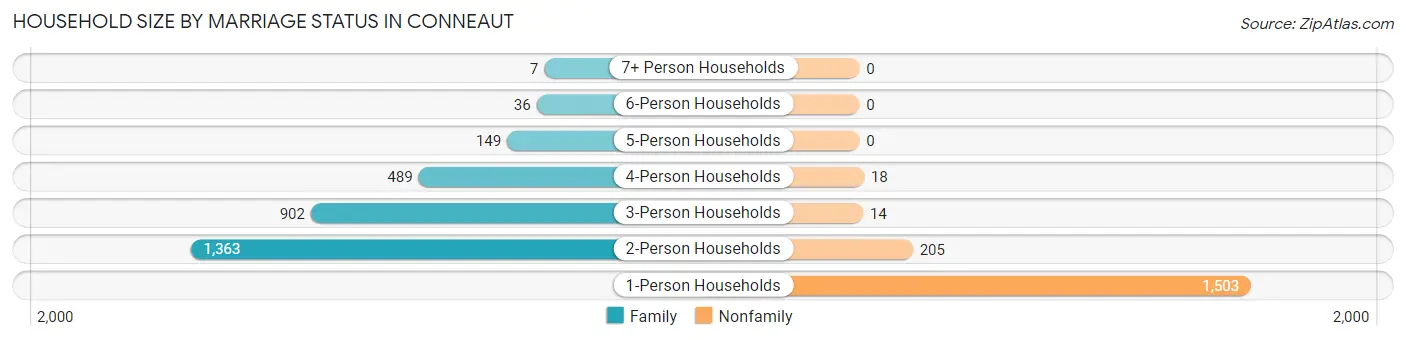
| Household Size | Family Households | Nonfamily Households |
| 1-Person Households | - | 1,503 (32.1%) |
| 2-Person Households | 1,363 (29.1%) | 205 (4.4%) |
| 3-Person Households | 902 (19.3%) | 14 (0.3%) |
| 4-Person Households | 489 (10.4%) | 18 (0.4%) |
| 5-Person Households | 149 (3.2%) | 0 (0.0%) |
| 6-Person Households | 36 (0.8%) | 0 (0.0%) |
| 7+ Person Households | 7 (0.2%) | 0 (0.0%) |
| Total | 2,946 (62.9%) | 1,740 (37.1%) |
Female Fertility in Conneaut
Fertility by Age in Conneaut
Average fertility rate in Conneaut is 106.0 births per 1,000 women. Women in the age bracket of 20 to 34 years have the highest fertility rate with 231.0 births per 1,000 women. Women in the age bracket of 20 to 34 years acount for 96.7% of all women with births.
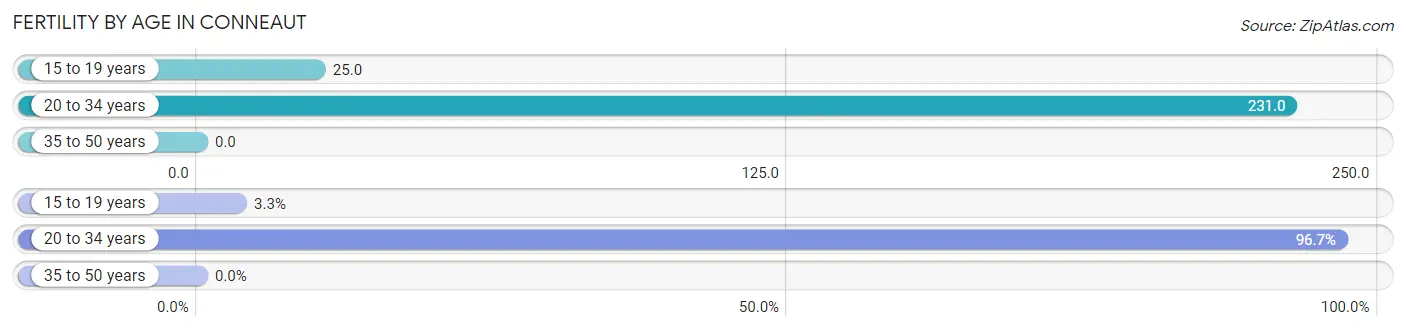
| Age Bracket | Women with Births | Births / 1,000 Women |
| 15 to 19 years | 8 (3.3%) | 25.0 |
| 20 to 34 years | 233 (96.7%) | 231.0 |
| 35 to 50 years | 0 (0.0%) | 0.0 |
| Total | 241 (100.0%) | 106.0 |
Fertility by Age by Marriage Status in Conneaut
78.8% of women with births (241) in Conneaut are married. The highest percentage of unmarried women with births falls into 15 to 19 years age bracket with 100.0% of them unmarried at the time of birth, while the lowest percentage of unmarried women with births belong to 20 to 34 years age bracket with 18.4% of them unmarried.
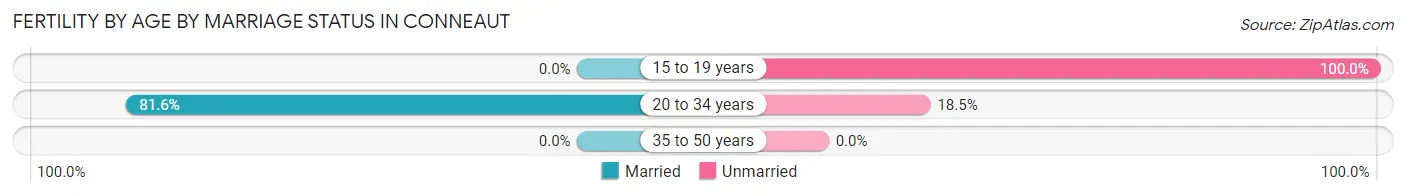
| Age Bracket | Married | Unmarried |
| 15 to 19 years | 0 (0.0%) | 8 (100.0%) |
| 20 to 34 years | 190 (81.6%) | 43 (18.4%) |
| 35 to 50 years | 0 (0.0%) | 0 (0.0%) |
| Total | 190 (78.8%) | 51 (21.2%) |
Fertility by Education in Conneaut
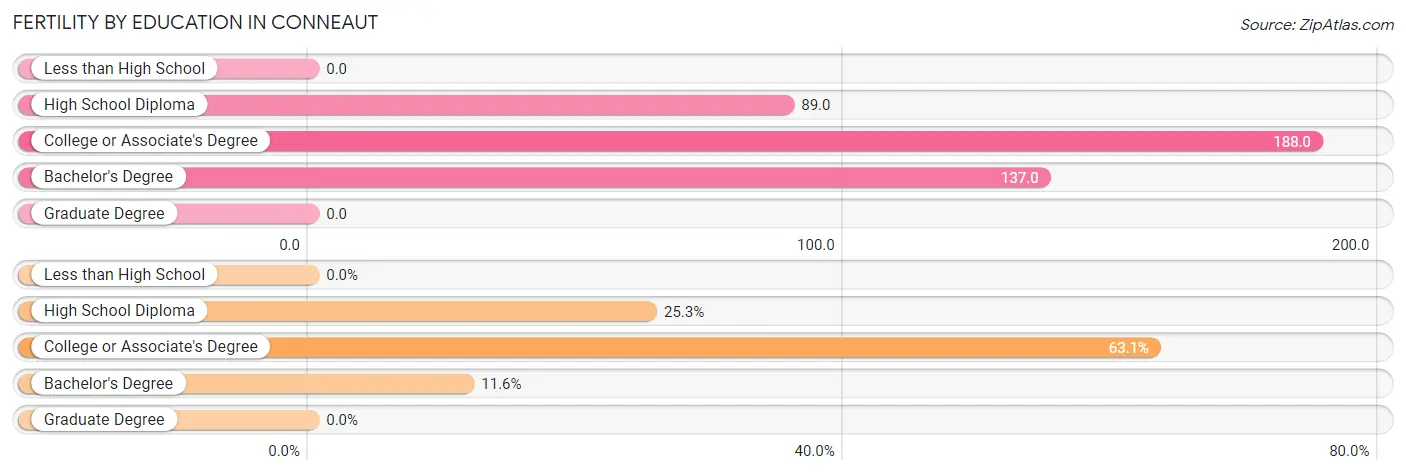
| Educational Attainment | Women with Births | Births / 1,000 Women |
| Less than High School | 0 (0.0%) | 0.0 |
| High School Diploma | 61 (25.3%) | 89.0 |
| College or Associate's Degree | 152 (63.1%) | 188.0 |
| Bachelor's Degree | 28 (11.6%) | 137.0 |
| Graduate Degree | 0 (0.0%) | 0.0 |
| Total | 241 (100.0%) | 106.0 |
Fertility by Education by Marriage Status in Conneaut
21.2% of women with births in Conneaut are unmarried. Women with the educational attainment of college or associate's degree are most likely to be married with 100.0% of them married at childbirth, while women with the educational attainment of high school diploma are least likely to be married with 83.6% of them unmarried at childbirth.
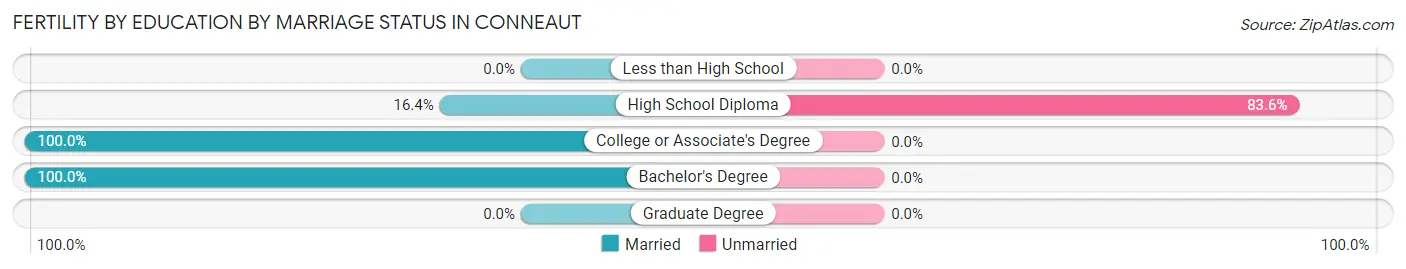
| Educational Attainment | Married | Unmarried |
| Less than High School | 0 (0.0%) | 0 (0.0%) |
| High School Diploma | 10 (16.4%) | 51 (83.6%) |
| College or Associate's Degree | 152 (100.0%) | 0 (0.0%) |
| Bachelor's Degree | 28 (100.0%) | 0 (0.0%) |
| Graduate Degree | 0 (0.0%) | 0 (0.0%) |
| Total | 190 (78.8%) | 51 (21.2%) |
Employment Characteristics in Conneaut
Employment by Class of Employer in Conneaut
Among the 4,722 employed individuals in Conneaut, private company employees (3,363 | 71.2%), local government employees (554 | 11.7%), and not-for-profit organizations (272 | 5.8%) make up the most common classes of employment.
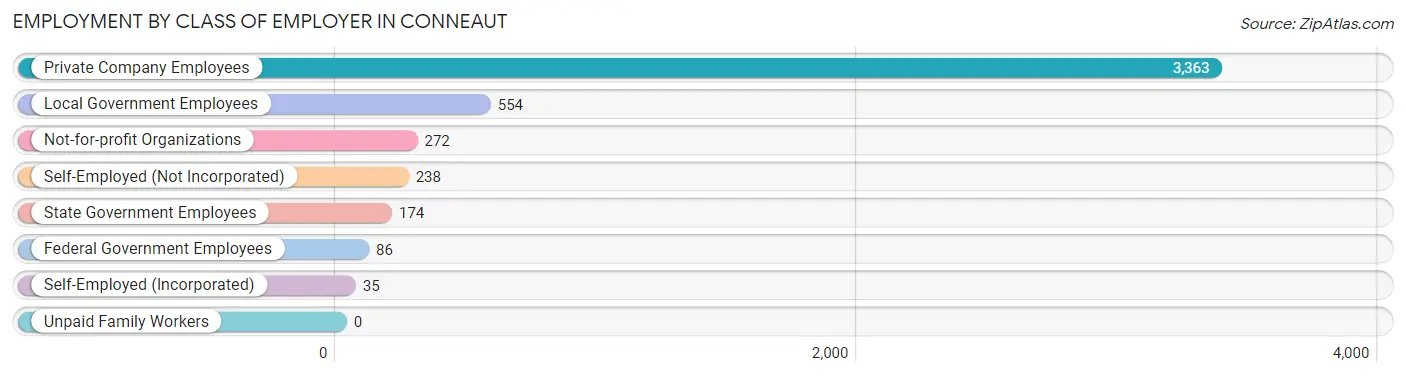
| Employer Class | # Employees | % Employees |
| Private Company Employees | 3,363 | 71.2% |
| Self-Employed (Incorporated) | 35 | 0.7% |
| Self-Employed (Not Incorporated) | 238 | 5.0% |
| Not-for-profit Organizations | 272 | 5.8% |
| Local Government Employees | 554 | 11.7% |
| State Government Employees | 174 | 3.7% |
| Federal Government Employees | 86 | 1.8% |
| Unpaid Family Workers | 0 | 0.0% |
| Total | 4,722 | 100.0% |
Employment Status by Age in Conneaut
According to the labor force statistics for Conneaut, out of the total population over 16 years of age (10,229), 53.3% or 5,452 individuals are in the labor force, with 12.0% or 654 of them unemployed. The age group with the highest labor force participation rate is 45 to 54 years, with 67.7% or 1,135 individuals in the labor force. Within the labor force, the 16 to 19 years age range has the highest percentage of unemployed individuals, with 25.9% or 55 of them being unemployed.
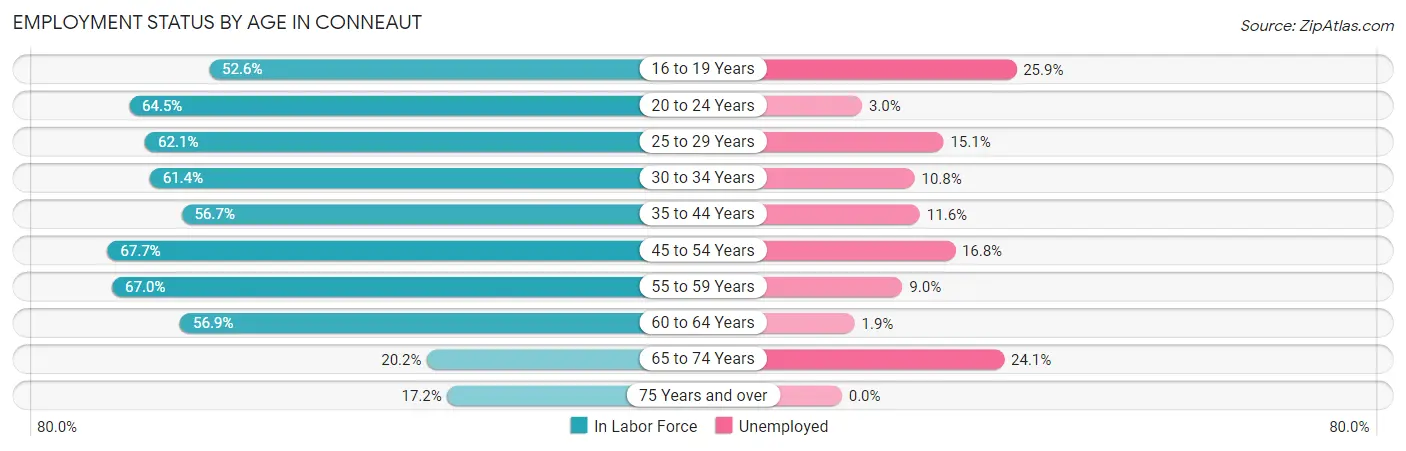
| Age Bracket | In Labor Force | Unemployed |
| 16 to 19 Years | 212 (52.6%) | 55 (25.9%) |
| 20 to 24 Years | 434 (64.5%) | 13 (3.0%) |
| 25 to 29 Years | 766 (62.1%) | 116 (15.1%) |
| 30 to 34 Years | 572 (61.4%) | 62 (10.8%) |
| 35 to 44 Years | 888 (56.7%) | 103 (11.6%) |
| 45 to 54 Years | 1,135 (67.7%) | 191 (16.8%) |
| 55 to 59 Years | 592 (67.0%) | 53 (9.0%) |
| 60 to 64 Years | 469 (56.9%) | 9 (1.9%) |
| 65 to 74 Years | 220 (20.2%) | 53 (24.1%) |
| 75 Years and over | 163 (17.2%) | 0 (0.0%) |
| Total | 5,452 (53.3%) | 654 (12.0%) |
Employment Status by Educational Attainment in Conneaut
According to labor force statistics for Conneaut, 62.2% of individuals (4,425) out of the total population between 25 and 64 years of age (7,114) are in the labor force, with 12.1% or 535 of them being unemployed. The group with the highest labor force participation rate are those with the educational attainment of bachelor's degree or higher, with 80.2% or 882 individuals in the labor force. Within the labor force, individuals with less than high school education have the highest percentage of unemployment, with 20.0% or 64 of them being unemployed.
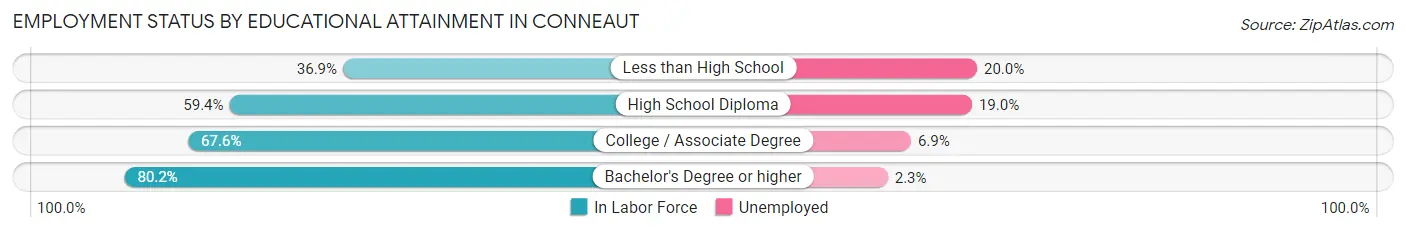
| Educational Attainment | In Labor Force | Unemployed |
| Less than High School | 320 (36.9%) | 173 (20.0%) |
| High School Diploma | 1,878 (59.4%) | 601 (19.0%) |
| College / Associate Degree | 1,342 (67.6%) | 137 (6.9%) |
| Bachelor's Degree or higher | 882 (80.2%) | 25 (2.3%) |
| Total | 4,425 (62.2%) | 861 (12.1%) |
Employment Occupations by Sex in Conneaut
Management, Business, Science and Arts Occupations
The most common Management, Business, Science and Arts occupations in Conneaut are Community & Social Service (454 | 9.5%), Health Diagnosing & Treating (307 | 6.4%), Management (283 | 5.9%), Education Instruction & Library (275 | 5.7%), and Computers, Engineering & Science (150 | 3.1%).
Management, Business, Science and Arts Occupations by Sex
Within the Management, Business, Science and Arts occupations in Conneaut, the most male-oriented occupations are Computers & Mathematics (100.0%), Life, Physical & Social Science (86.7%), and Computers, Engineering & Science (84.7%), while the most female-oriented occupations are Legal Services & Support (100.0%), Health Diagnosing & Treating (94.1%), and Education, Arts & Media (93.3%).
| Occupation | Male | Female |
| Management | 108 (38.2%) | 175 (61.8%) |
| Business & Financial | 88 (63.3%) | 51 (36.7%) |
| Computers, Engineering & Science | 127 (84.7%) | 23 (15.3%) |
| Computers & Mathematics | 67 (100.0%) | 0 (0.0%) |
| Architecture & Engineering | 21 (55.3%) | 17 (44.7%) |
| Life, Physical & Social Science | 39 (86.7%) | 6 (13.3%) |
| Community & Social Service | 136 (30.0%) | 318 (70.0%) |
| Education, Arts & Media | 7 (6.7%) | 97 (93.3%) |
| Legal Services & Support | 0 (0.0%) | 35 (100.0%) |
| Education Instruction & Library | 99 (36.0%) | 176 (64.0%) |
| Arts, Media & Entertainment | 30 (75.0%) | 10 (25.0%) |
| Health Diagnosing & Treating | 18 (5.9%) | 289 (94.1%) |
| Health Technologists | 18 (13.7%) | 113 (86.3%) |
| Total (Category) | 477 (35.8%) | 856 (64.2%) |
| Total (Overall) | 2,562 (53.4%) | 2,234 (46.6%) |
Services Occupations
The most common Services occupations in Conneaut are Cleaning & Maintenance (375 | 7.8%), Food Preparation & Serving (256 | 5.3%), Healthcare Support (163 | 3.4%), Security & Protection (114 | 2.4%), and Law Enforcement (78 | 1.6%).
Services Occupations by Sex
Within the Services occupations in Conneaut, the most male-oriented occupations are Law Enforcement (100.0%), Security & Protection (91.2%), and Cleaning & Maintenance (85.1%), while the most female-oriented occupations are Healthcare Support (100.0%), Personal Care & Service (90.7%), and Food Preparation & Serving (68.8%).
| Occupation | Male | Female |
| Healthcare Support | 0 (0.0%) | 163 (100.0%) |
| Security & Protection | 104 (91.2%) | 10 (8.8%) |
| Firefighting & Prevention | 26 (72.2%) | 10 (27.8%) |
| Law Enforcement | 78 (100.0%) | 0 (0.0%) |
| Food Preparation & Serving | 80 (31.2%) | 176 (68.8%) |
| Cleaning & Maintenance | 319 (85.1%) | 56 (14.9%) |
| Personal Care & Service | 7 (9.3%) | 68 (90.7%) |
| Total (Category) | 510 (51.9%) | 473 (48.1%) |
| Total (Overall) | 2,562 (53.4%) | 2,234 (46.6%) |
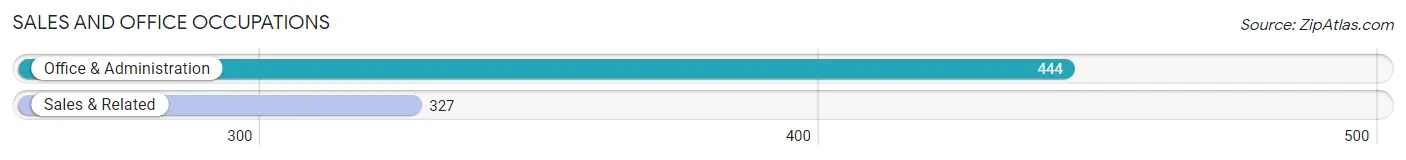
Sales and Office Occupations
The most common Sales and Office occupations in Conneaut are Office & Administration (444 | 9.3%), and Sales & Related (327 | 6.8%).
Sales and Office Occupations by Sex
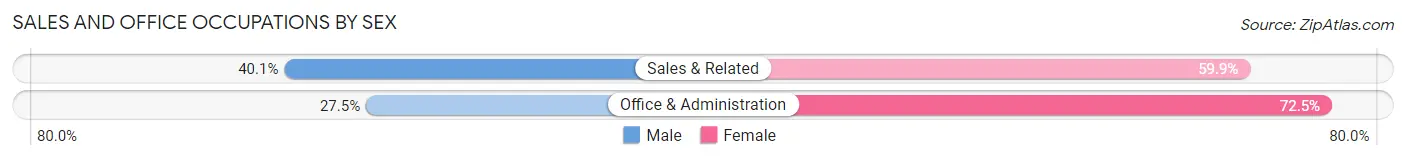
| Occupation | Male | Female |
| Sales & Related | 131 (40.1%) | 196 (59.9%) |
| Office & Administration | 122 (27.5%) | 322 (72.5%) |
| Total (Category) | 253 (32.8%) | 518 (67.2%) |
| Total (Overall) | 2,562 (53.4%) | 2,234 (46.6%) |
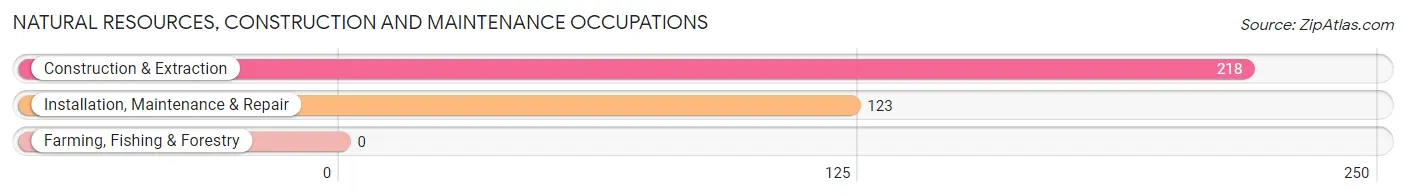
Natural Resources, Construction and Maintenance Occupations
The most common Natural Resources, Construction and Maintenance occupations in Conneaut are Construction & Extraction (218 | 4.5%), and Installation, Maintenance & Repair (123 | 2.6%).
Natural Resources, Construction and Maintenance Occupations by Sex
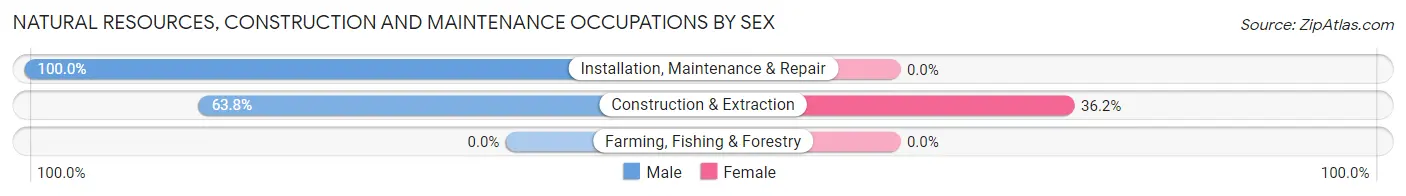
| Occupation | Male | Female |
| Farming, Fishing & Forestry | 0 (0.0%) | 0 (0.0%) |
| Construction & Extraction | 139 (63.8%) | 79 (36.2%) |
| Installation, Maintenance & Repair | 123 (100.0%) | 0 (0.0%) |
| Total (Category) | 262 (76.8%) | 79 (23.2%) |
| Total (Overall) | 2,562 (53.4%) | 2,234 (46.6%) |
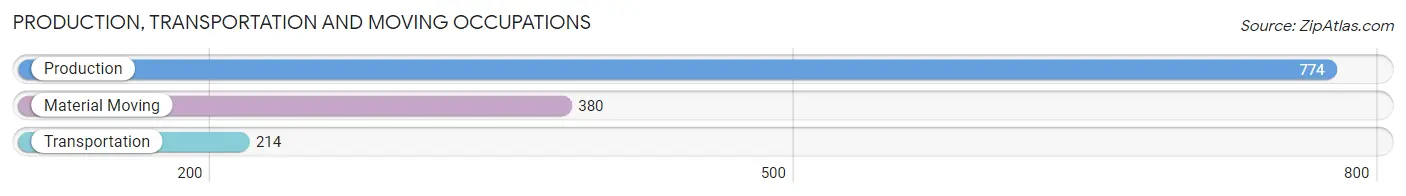
Production, Transportation and Moving Occupations
The most common Production, Transportation and Moving occupations in Conneaut are Production (774 | 16.1%), Material Moving (380 | 7.9%), and Transportation (214 | 4.5%).
Production, Transportation and Moving Occupations by Sex
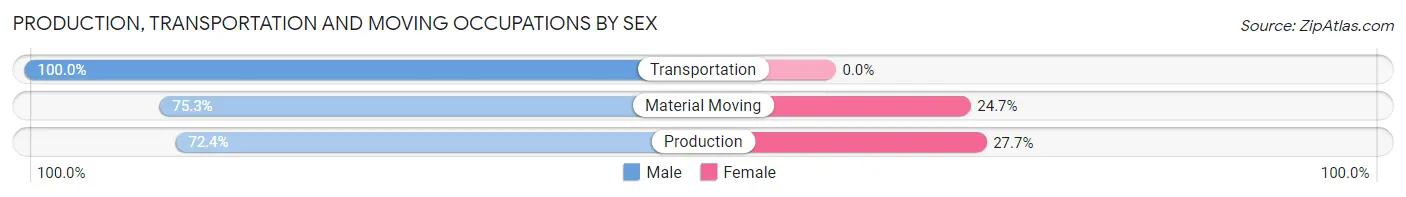
| Occupation | Male | Female |
| Production | 560 (72.4%) | 214 (27.7%) |
| Transportation | 214 (100.0%) | 0 (0.0%) |
| Material Moving | 286 (75.3%) | 94 (24.7%) |
| Total (Category) | 1,060 (77.5%) | 308 (22.5%) |
| Total (Overall) | 2,562 (53.4%) | 2,234 (46.6%) |
Employment Industries by Sex in Conneaut
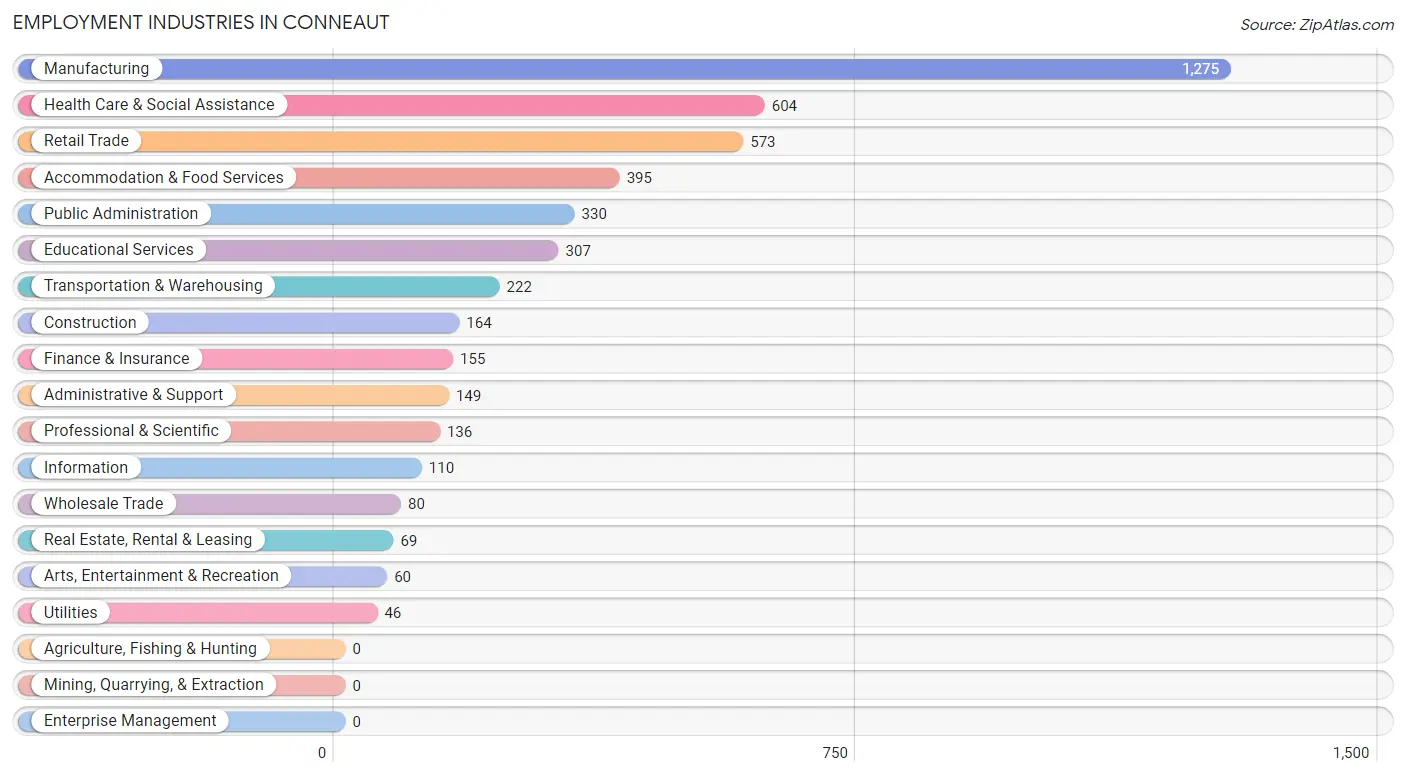
Employment Industries in Conneaut
The major employment industries in Conneaut include Manufacturing (1,275 | 26.6%), Health Care & Social Assistance (604 | 12.6%), Retail Trade (573 | 11.9%), Accommodation & Food Services (395 | 8.2%), and Public Administration (330 | 6.9%).
Employment Industries by Sex in Conneaut
The Conneaut industries that see more men than women are Transportation & Warehousing (94.1%), Construction (85.4%), and Utilities (76.1%), whereas the industries that tend to have a higher number of women are Health Care & Social Assistance (92.2%), Finance & Insurance (71.0%), and Accommodation & Food Services (70.9%).
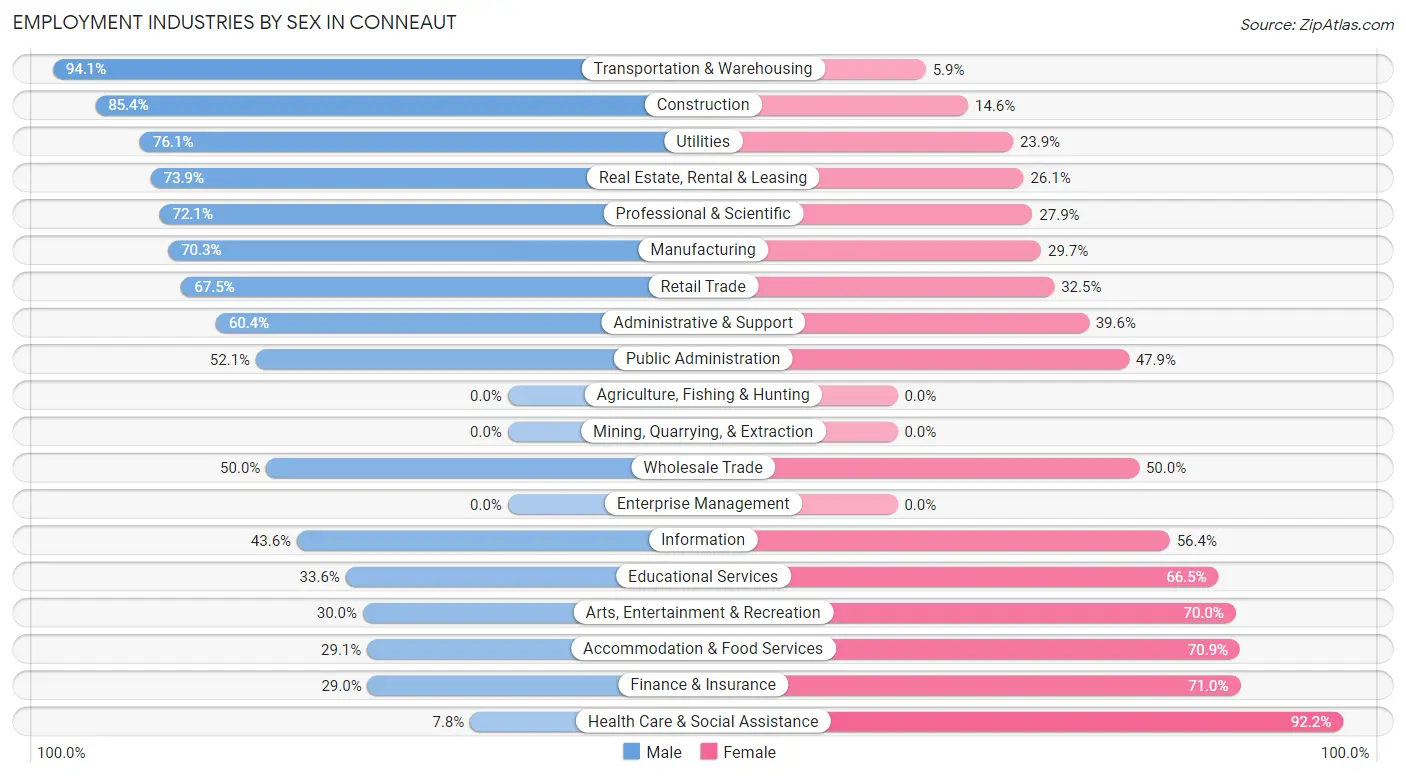
| Industry | Male | Female |
| Agriculture, Fishing & Hunting | 0 (0.0%) | 0 (0.0%) |
| Mining, Quarrying, & Extraction | 0 (0.0%) | 0 (0.0%) |
| Construction | 140 (85.4%) | 24 (14.6%) |
| Manufacturing | 896 (70.3%) | 379 (29.7%) |
| Wholesale Trade | 40 (50.0%) | 40 (50.0%) |
| Retail Trade | 387 (67.5%) | 186 (32.5%) |
| Transportation & Warehousing | 209 (94.1%) | 13 (5.9%) |
| Utilities | 35 (76.1%) | 11 (23.9%) |
| Information | 48 (43.6%) | 62 (56.4%) |
| Finance & Insurance | 45 (29.0%) | 110 (71.0%) |
| Real Estate, Rental & Leasing | 51 (73.9%) | 18 (26.1%) |
| Professional & Scientific | 98 (72.1%) | 38 (27.9%) |
| Enterprise Management | 0 (0.0%) | 0 (0.0%) |
| Administrative & Support | 90 (60.4%) | 59 (39.6%) |
| Educational Services | 103 (33.6%) | 204 (66.4%) |
| Health Care & Social Assistance | 47 (7.8%) | 557 (92.2%) |
| Arts, Entertainment & Recreation | 18 (30.0%) | 42 (70.0%) |
| Accommodation & Food Services | 115 (29.1%) | 280 (70.9%) |
| Public Administration | 172 (52.1%) | 158 (47.9%) |
| Total | 2,562 (53.4%) | 2,234 (46.6%) |
Education in Conneaut
School Enrollment in Conneaut
The most common levels of schooling among the 2,367 students in Conneaut are high school (767 | 32.4%), middle school (494 | 20.9%), and elementary school (449 | 19.0%).
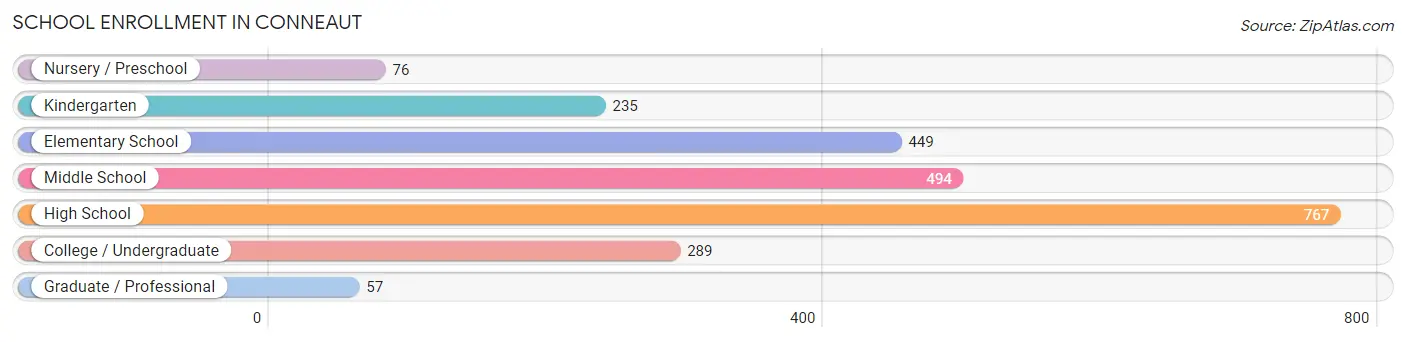
| School Level | # Students | % Students |
| Nursery / Preschool | 76 | 3.2% |
| Kindergarten | 235 | 9.9% |
| Elementary School | 449 | 19.0% |
| Middle School | 494 | 20.9% |
| High School | 767 | 32.4% |
| College / Undergraduate | 289 | 12.2% |
| Graduate / Professional | 57 | 2.4% |
| Total | 2,367 | 100.0% |
School Enrollment by Age by Funding Source in Conneaut
Out of a total of 2,367 students who are enrolled in schools in Conneaut, 528 (22.3%) attend a private institution, while the remaining 1,839 (77.7%) are enrolled in public schools. The age group of 18 to 19 year olds has the highest likelihood of being enrolled in private schools, with 85 (63.9% in the age bracket) enrolled. Conversely, the age group of 5 to 9 year old has the lowest likelihood of being enrolled in a private school, with 556 (97.9% in the age bracket) attending a public institution.
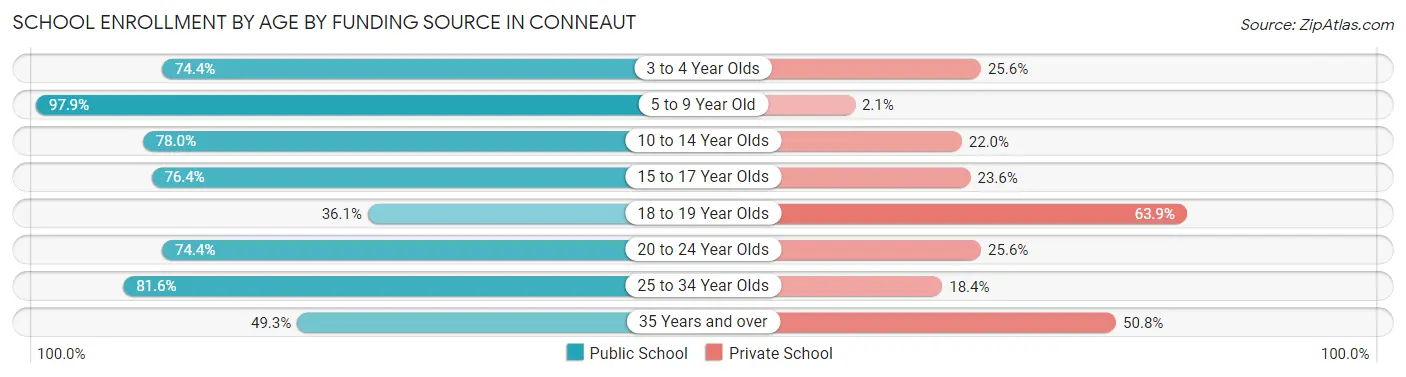
| Age Bracket | Public School | Private School |
| 3 to 4 Year Olds | 32 (74.4%) | 11 (25.6%) |
| 5 to 9 Year Old | 556 (97.9%) | 12 (2.1%) |
| 10 to 14 Year Olds | 574 (78.0%) | 162 (22.0%) |
| 15 to 17 Year Olds | 349 (76.4%) | 108 (23.6%) |
| 18 to 19 Year Olds | 48 (36.1%) | 85 (63.9%) |
| 20 to 24 Year Olds | 61 (74.4%) | 21 (25.6%) |
| 25 to 34 Year Olds | 120 (81.6%) | 27 (18.4%) |
| 35 Years and over | 99 (49.2%) | 102 (50.7%) |
| Total | 1,839 (77.7%) | 528 (22.3%) |
Educational Attainment by Field of Study in Conneaut
Education (403 | 24.6%), science & technology (180 | 11.0%), literature & languages (137 | 8.4%), business (136 | 8.3%), and liberal arts & history (130 | 7.9%) are the most common fields of study among 1,639 individuals in Conneaut who have obtained a bachelor's degree or higher.
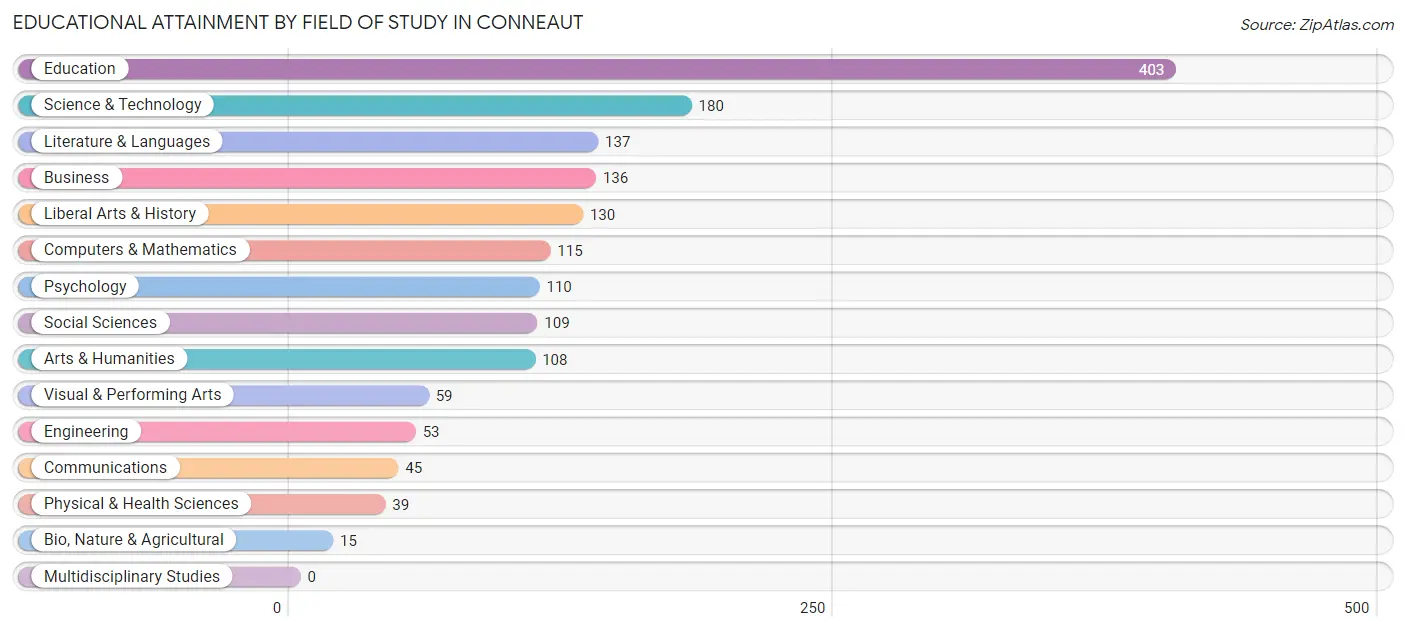
| Field of Study | # Graduates | % Graduates |
| Computers & Mathematics | 115 | 7.0% |
| Bio, Nature & Agricultural | 15 | 0.9% |
| Physical & Health Sciences | 39 | 2.4% |
| Psychology | 110 | 6.7% |
| Social Sciences | 109 | 6.7% |
| Engineering | 53 | 3.2% |
| Multidisciplinary Studies | 0 | 0.0% |
| Science & Technology | 180 | 11.0% |
| Business | 136 | 8.3% |
| Education | 403 | 24.6% |
| Literature & Languages | 137 | 8.4% |
| Liberal Arts & History | 130 | 7.9% |
| Visual & Performing Arts | 59 | 3.6% |
| Communications | 45 | 2.8% |
| Arts & Humanities | 108 | 6.6% |
| Total | 1,639 | 100.0% |
Transportation & Commute in Conneaut
Vehicle Availability by Sex in Conneaut
The most prevalent vehicle ownership categories in Conneaut are males with 2 vehicles (1,228, accounting for 48.5%) and females with 2 vehicles (993, making up 56.4%).
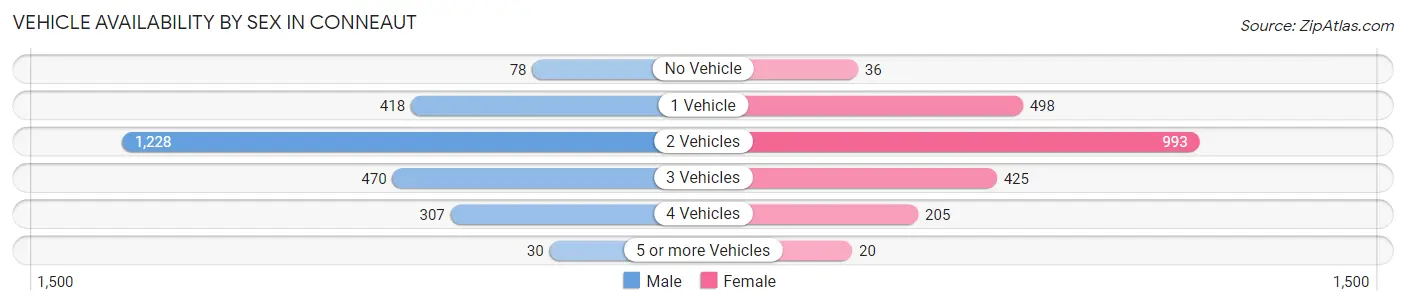
| Vehicles Available | Male | Female |
| No Vehicle | 78 (3.1%) | 36 (1.7%) |
| 1 Vehicle | 418 (16.5%) | 498 (22.9%) |
| 2 Vehicles | 1,228 (48.5%) | 993 (45.6%) |
| 3 Vehicles | 470 (18.6%) | 425 (19.5%) |
| 4 Vehicles | 307 (12.1%) | 205 (9.4%) |
| 5 or more Vehicles | 30 (1.2%) | 20 (0.9%) |
| Total | 2,531 (100.0%) | 2,177 (100.0%) |
Commute Time in Conneaut
The most frequently occuring commute durations in Conneaut are 5 to 9 minutes (907 commuters, 19.9%), 10 to 14 minutes (694 commuters, 15.2%), and 20 to 24 minutes (505 commuters, 11.1%).
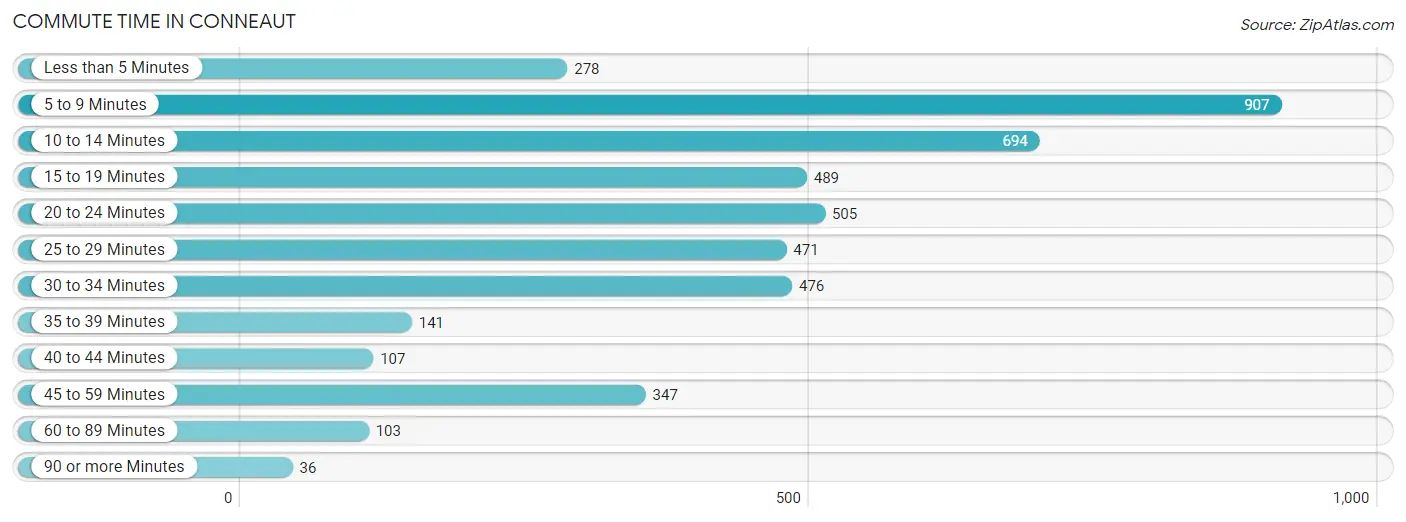
| Commute Time | # Commuters | % Commuters |
| Less than 5 Minutes | 278 | 6.1% |
| 5 to 9 Minutes | 907 | 19.9% |
| 10 to 14 Minutes | 694 | 15.2% |
| 15 to 19 Minutes | 489 | 10.7% |
| 20 to 24 Minutes | 505 | 11.1% |
| 25 to 29 Minutes | 471 | 10.3% |
| 30 to 34 Minutes | 476 | 10.4% |
| 35 to 39 Minutes | 141 | 3.1% |
| 40 to 44 Minutes | 107 | 2.4% |
| 45 to 59 Minutes | 347 | 7.6% |
| 60 to 89 Minutes | 103 | 2.3% |
| 90 or more Minutes | 36 | 0.8% |
Commute Time by Sex in Conneaut
The most common commute times in Conneaut are 5 to 9 minutes (373 commuters, 15.2%) for males and 5 to 9 minutes (534 commuters, 25.4%) for females.
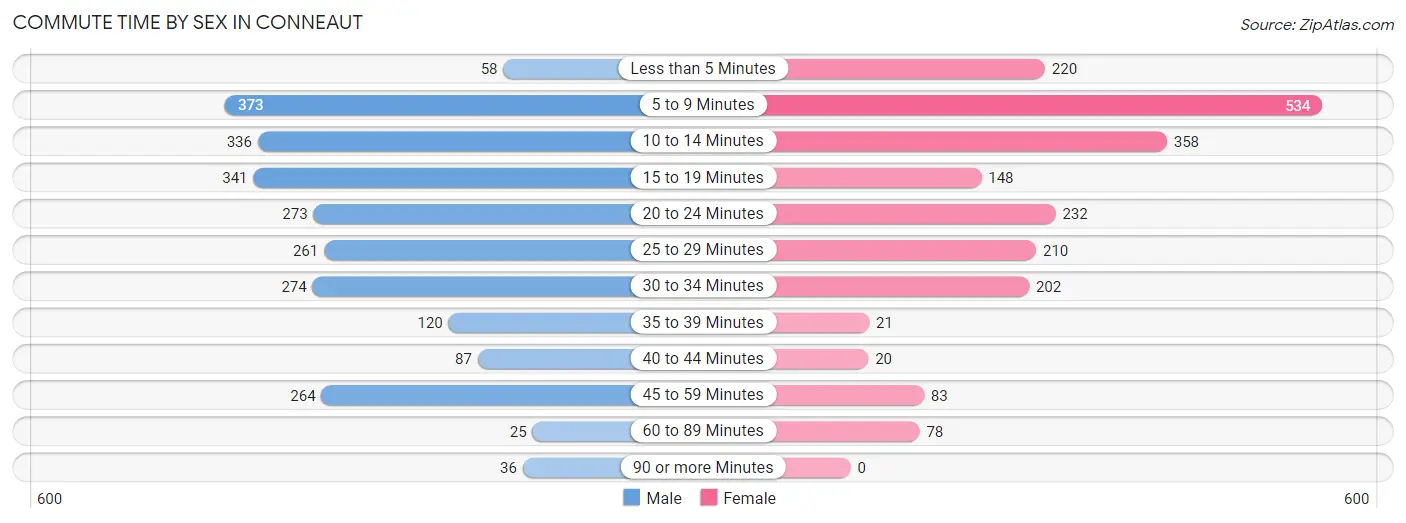
| Commute Time | Male | Female |
| Less than 5 Minutes | 58 (2.4%) | 220 (10.4%) |
| 5 to 9 Minutes | 373 (15.2%) | 534 (25.4%) |
| 10 to 14 Minutes | 336 (13.7%) | 358 (17.0%) |
| 15 to 19 Minutes | 341 (13.9%) | 148 (7.0%) |
| 20 to 24 Minutes | 273 (11.2%) | 232 (11.0%) |
| 25 to 29 Minutes | 261 (10.7%) | 210 (10.0%) |
| 30 to 34 Minutes | 274 (11.2%) | 202 (9.6%) |
| 35 to 39 Minutes | 120 (4.9%) | 21 (1.0%) |
| 40 to 44 Minutes | 87 (3.5%) | 20 (0.9%) |
| 45 to 59 Minutes | 264 (10.8%) | 83 (3.9%) |
| 60 to 89 Minutes | 25 (1.0%) | 78 (3.7%) |
| 90 or more Minutes | 36 (1.5%) | 0 (0.0%) |
Time of Departure to Work by Sex in Conneaut
The most frequent times of departure to work in Conneaut are 12:00 PM to 3:59 PM (408, 16.7%) for males and 6:30 AM to 6:59 AM (392, 18.6%) for females.
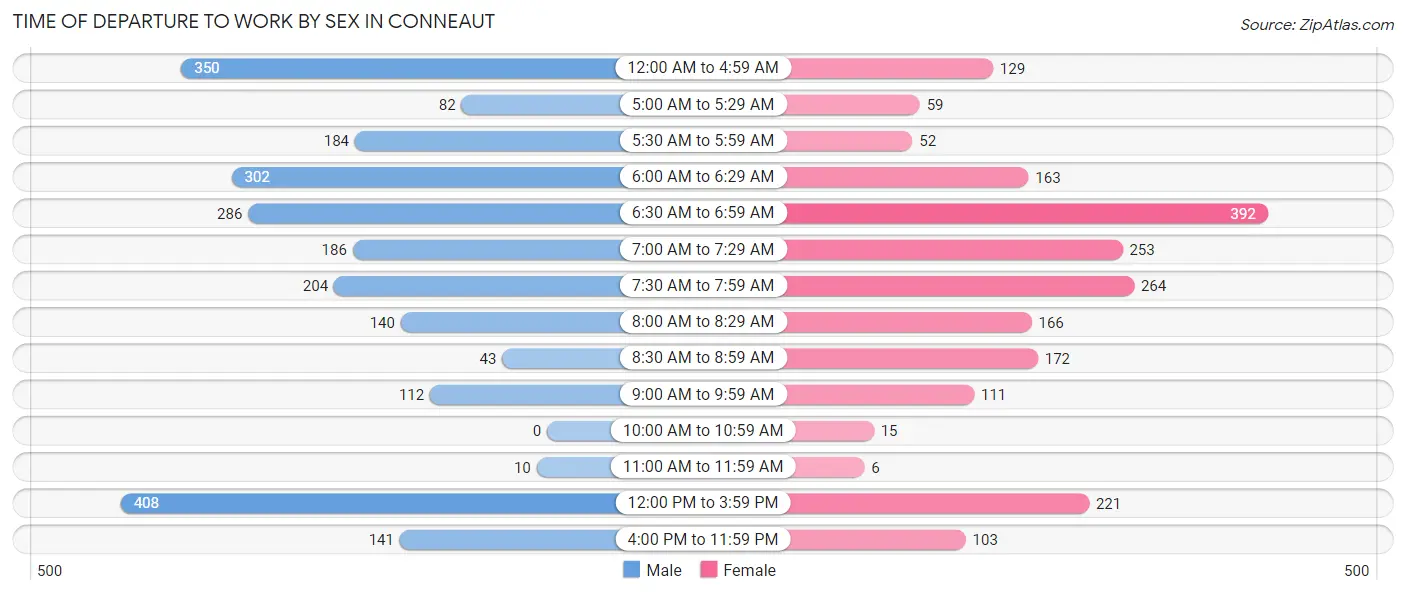
| Time of Departure | Male | Female |
| 12:00 AM to 4:59 AM | 350 (14.3%) | 129 (6.1%) |
| 5:00 AM to 5:29 AM | 82 (3.4%) | 59 (2.8%) |
| 5:30 AM to 5:59 AM | 184 (7.5%) | 52 (2.5%) |
| 6:00 AM to 6:29 AM | 302 (12.3%) | 163 (7.7%) |
| 6:30 AM to 6:59 AM | 286 (11.7%) | 392 (18.6%) |
| 7:00 AM to 7:29 AM | 186 (7.6%) | 253 (12.0%) |
| 7:30 AM to 7:59 AM | 204 (8.3%) | 264 (12.5%) |
| 8:00 AM to 8:29 AM | 140 (5.7%) | 166 (7.9%) |
| 8:30 AM to 8:59 AM | 43 (1.8%) | 172 (8.2%) |
| 9:00 AM to 9:59 AM | 112 (4.6%) | 111 (5.3%) |
| 10:00 AM to 10:59 AM | 0 (0.0%) | 15 (0.7%) |
| 11:00 AM to 11:59 AM | 10 (0.4%) | 6 (0.3%) |
| 12:00 PM to 3:59 PM | 408 (16.7%) | 221 (10.5%) |
| 4:00 PM to 11:59 PM | 141 (5.8%) | 103 (4.9%) |
| Total | 2,448 (100.0%) | 2,106 (100.0%) |
Housing Occupancy in Conneaut
Occupancy by Ownership in Conneaut
Of the total 4,686 dwellings in Conneaut, owner-occupied units account for 3,379 (72.1%), while renter-occupied units make up 1,307 (27.9%).
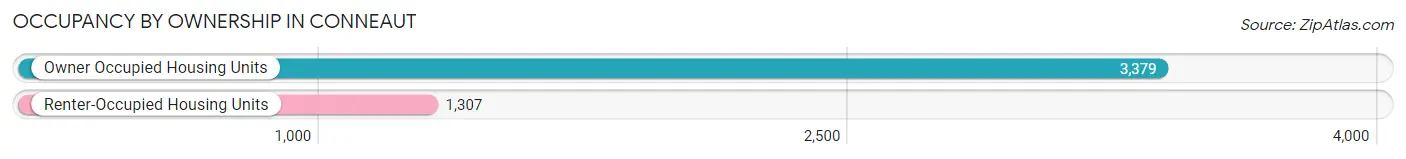
| Occupancy | # Housing Units | % Housing Units |
| Owner Occupied Housing Units | 3,379 | 72.1% |
| Renter-Occupied Housing Units | 1,307 | 27.9% |
| Total Occupied Housing Units | 4,686 | 100.0% |
Occupancy by Household Size in Conneaut
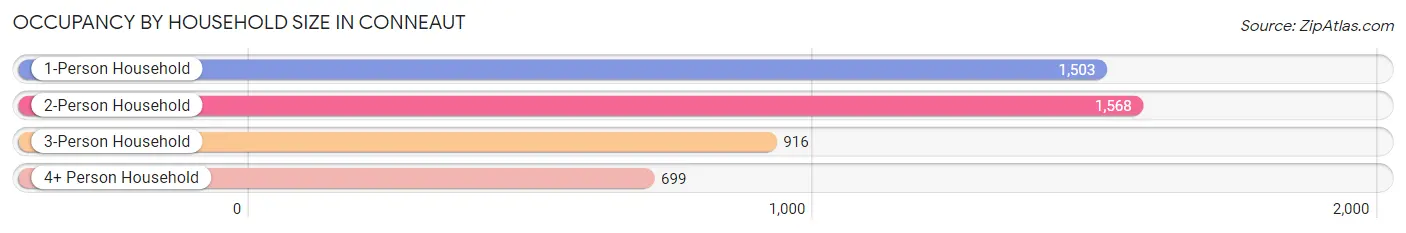
| Household Size | # Housing Units | % Housing Units |
| 1-Person Household | 1,503 | 32.1% |
| 2-Person Household | 1,568 | 33.5% |
| 3-Person Household | 916 | 19.6% |
| 4+ Person Household | 699 | 14.9% |
| Total Housing Units | 4,686 | 100.0% |
Occupancy by Ownership by Household Size in Conneaut
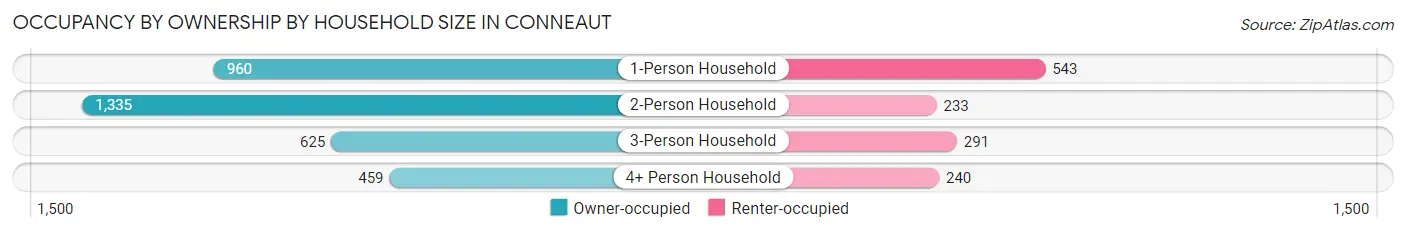
| Household Size | Owner-occupied | Renter-occupied |
| 1-Person Household | 960 (63.9%) | 543 (36.1%) |
| 2-Person Household | 1,335 (85.1%) | 233 (14.9%) |
| 3-Person Household | 625 (68.2%) | 291 (31.8%) |
| 4+ Person Household | 459 (65.7%) | 240 (34.3%) |
| Total Housing Units | 3,379 (72.1%) | 1,307 (27.9%) |
Occupancy by Educational Attainment in Conneaut
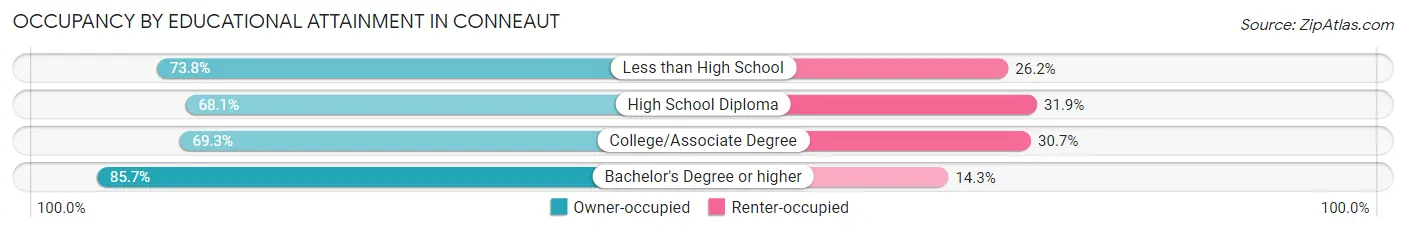
| Household Size | Owner-occupied | Renter-occupied |
| Less than High School | 287 (73.8%) | 102 (26.2%) |
| High School Diploma | 1,336 (68.1%) | 626 (31.9%) |
| College/Associate Degree | 1,033 (69.3%) | 458 (30.7%) |
| Bachelor's Degree or higher | 723 (85.7%) | 121 (14.3%) |
Occupancy by Age of Householder in Conneaut
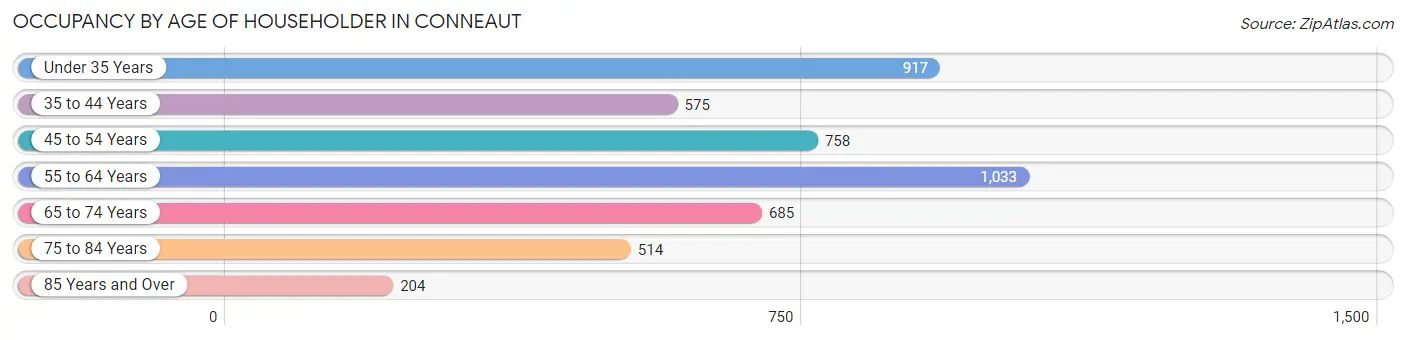
| Age Bracket | # Households | % Households |
| Under 35 Years | 917 | 19.6% |
| 35 to 44 Years | 575 | 12.3% |
| 45 to 54 Years | 758 | 16.2% |
| 55 to 64 Years | 1,033 | 22.0% |
| 65 to 74 Years | 685 | 14.6% |
| 75 to 84 Years | 514 | 11.0% |
| 85 Years and Over | 204 | 4.3% |
| Total | 4,686 | 100.0% |
Housing Finances in Conneaut
Median Income by Occupancy in Conneaut
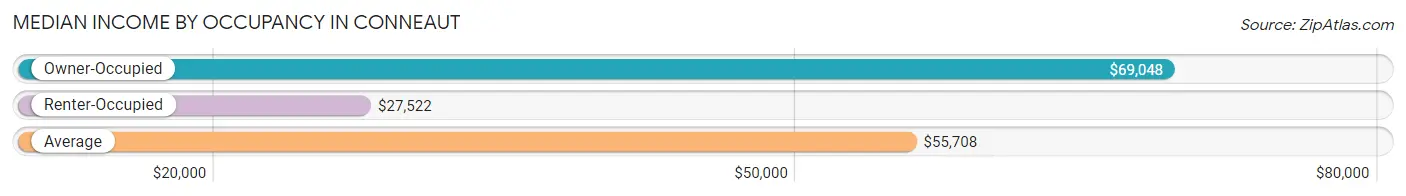
| Occupancy Type | # Households | Median Income |
| Owner-Occupied | 3,379 (72.1%) | $69,048 |
| Renter-Occupied | 1,307 (27.9%) | $27,522 |
| Average | 4,686 (100.0%) | $55,708 |
Occupancy by Householder Income Bracket in Conneaut
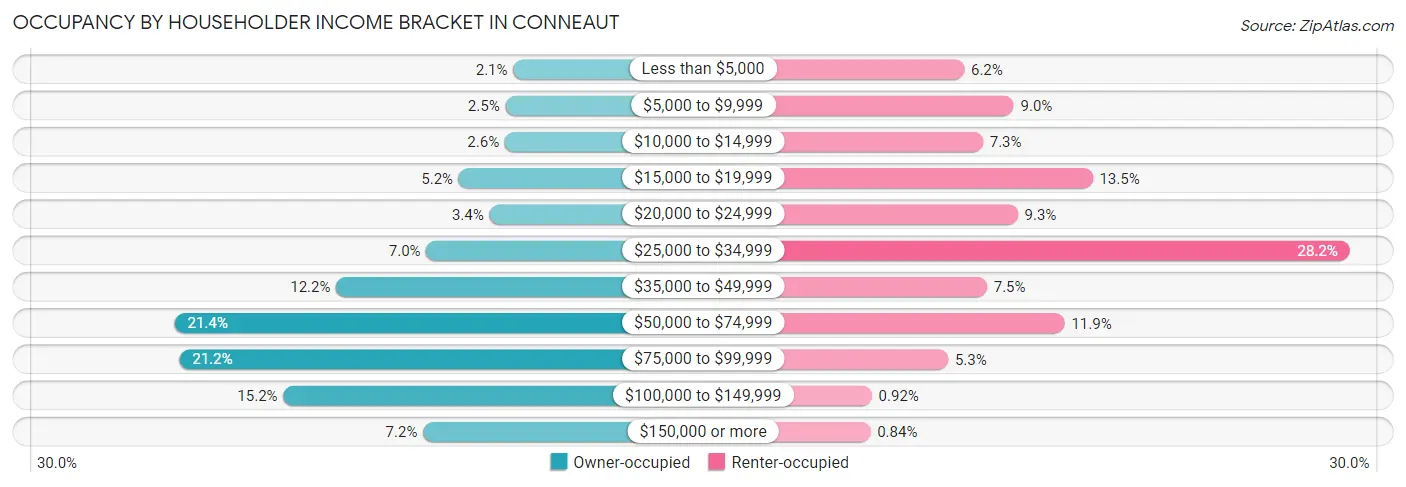
| Income Bracket | Owner-occupied | Renter-occupied |
| Less than $5,000 | 70 (2.1%) | 81 (6.2%) |
| $5,000 to $9,999 | 85 (2.5%) | 118 (9.0%) |
| $10,000 to $14,999 | 86 (2.5%) | 95 (7.3%) |
| $15,000 to $19,999 | 175 (5.2%) | 177 (13.5%) |
| $20,000 to $24,999 | 116 (3.4%) | 121 (9.3%) |
| $25,000 to $34,999 | 238 (7.0%) | 369 (28.2%) |
| $35,000 to $49,999 | 412 (12.2%) | 98 (7.5%) |
| $50,000 to $74,999 | 724 (21.4%) | 156 (11.9%) |
| $75,000 to $99,999 | 715 (21.2%) | 69 (5.3%) |
| $100,000 to $149,999 | 514 (15.2%) | 12 (0.9%) |
| $150,000 or more | 244 (7.2%) | 11 (0.8%) |
| Total | 3,379 (100.0%) | 1,307 (100.0%) |
Monthly Housing Cost Tiers in Conneaut
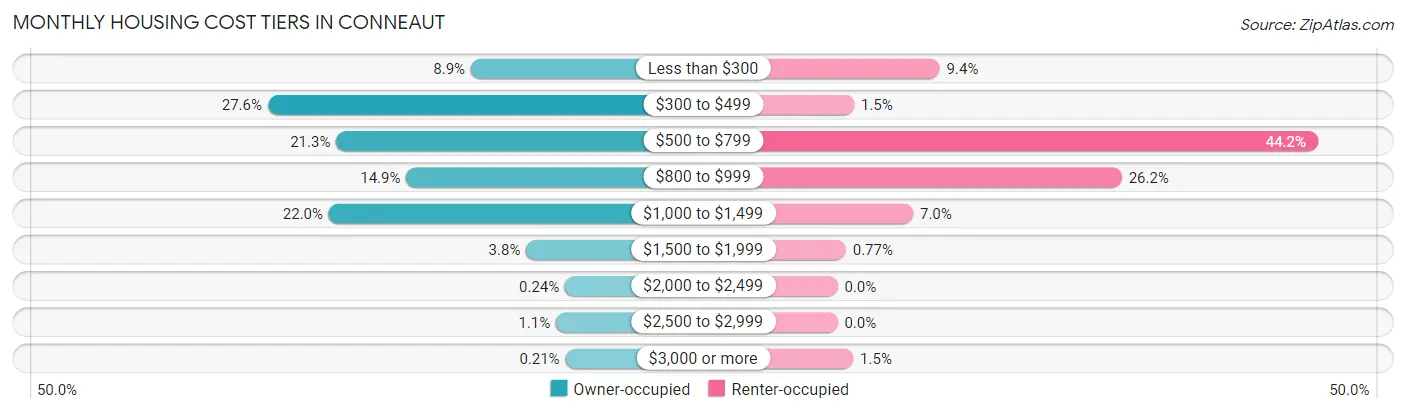
| Monthly Cost | Owner-occupied | Renter-occupied |
| Less than $300 | 301 (8.9%) | 123 (9.4%) |
| $300 to $499 | 933 (27.6%) | 20 (1.5%) |
| $500 to $799 | 720 (21.3%) | 578 (44.2%) |
| $800 to $999 | 502 (14.9%) | 342 (26.2%) |
| $1,000 to $1,499 | 743 (22.0%) | 91 (7.0%) |
| $1,500 to $1,999 | 129 (3.8%) | 10 (0.8%) |
| $2,000 to $2,499 | 8 (0.2%) | 0 (0.0%) |
| $2,500 to $2,999 | 36 (1.1%) | 0 (0.0%) |
| $3,000 or more | 7 (0.2%) | 19 (1.5%) |
| Total | 3,379 (100.0%) | 1,307 (100.0%) |
Physical Housing Characteristics in Conneaut
Housing Structures in Conneaut
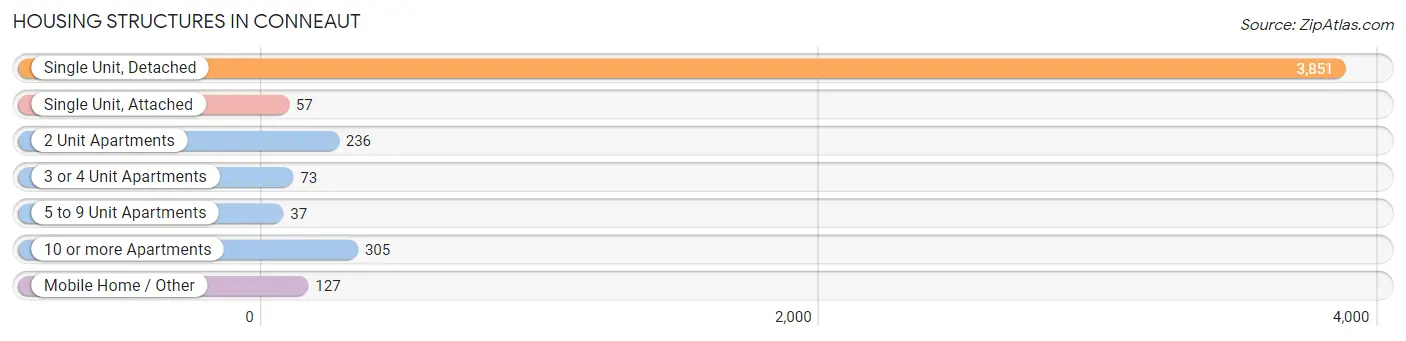
| Structure Type | # Housing Units | % Housing Units |
| Single Unit, Detached | 3,851 | 82.2% |
| Single Unit, Attached | 57 | 1.2% |
| 2 Unit Apartments | 236 | 5.0% |
| 3 or 4 Unit Apartments | 73 | 1.6% |
| 5 to 9 Unit Apartments | 37 | 0.8% |
| 10 or more Apartments | 305 | 6.5% |
| Mobile Home / Other | 127 | 2.7% |
| Total | 4,686 | 100.0% |
Housing Structures by Occupancy in Conneaut
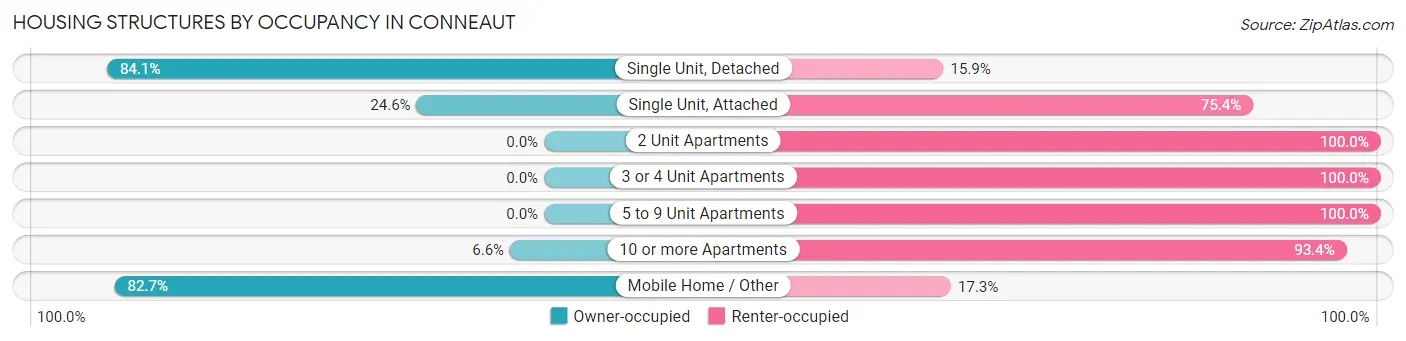
| Structure Type | Owner-occupied | Renter-occupied |
| Single Unit, Detached | 3,240 (84.1%) | 611 (15.9%) |
| Single Unit, Attached | 14 (24.6%) | 43 (75.4%) |
| 2 Unit Apartments | 0 (0.0%) | 236 (100.0%) |
| 3 or 4 Unit Apartments | 0 (0.0%) | 73 (100.0%) |
| 5 to 9 Unit Apartments | 0 (0.0%) | 37 (100.0%) |
| 10 or more Apartments | 20 (6.6%) | 285 (93.4%) |
| Mobile Home / Other | 105 (82.7%) | 22 (17.3%) |
| Total | 3,379 (72.1%) | 1,307 (27.9%) |
Housing Structures by Number of Rooms in Conneaut
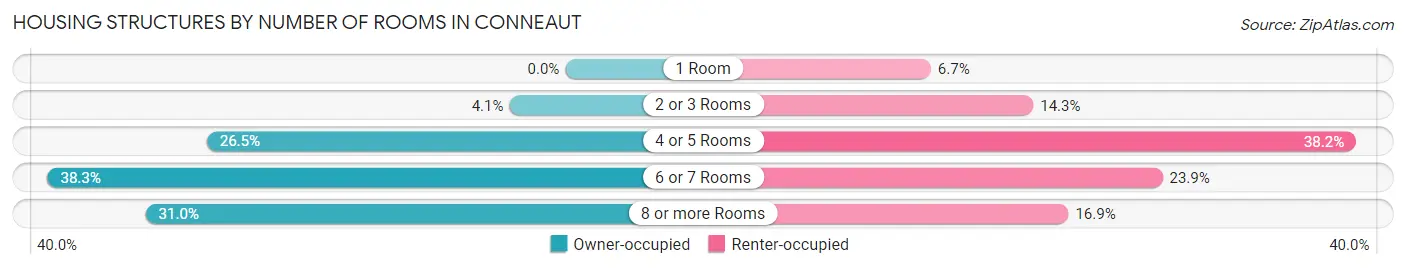
| Number of Rooms | Owner-occupied | Renter-occupied |
| 1 Room | 0 (0.0%) | 88 (6.7%) |
| 2 or 3 Rooms | 140 (4.1%) | 187 (14.3%) |
| 4 or 5 Rooms | 896 (26.5%) | 499 (38.2%) |
| 6 or 7 Rooms | 1,294 (38.3%) | 312 (23.9%) |
| 8 or more Rooms | 1,049 (31.0%) | 221 (16.9%) |
| Total | 3,379 (100.0%) | 1,307 (100.0%) |
Housing Structure by Heating Type in Conneaut
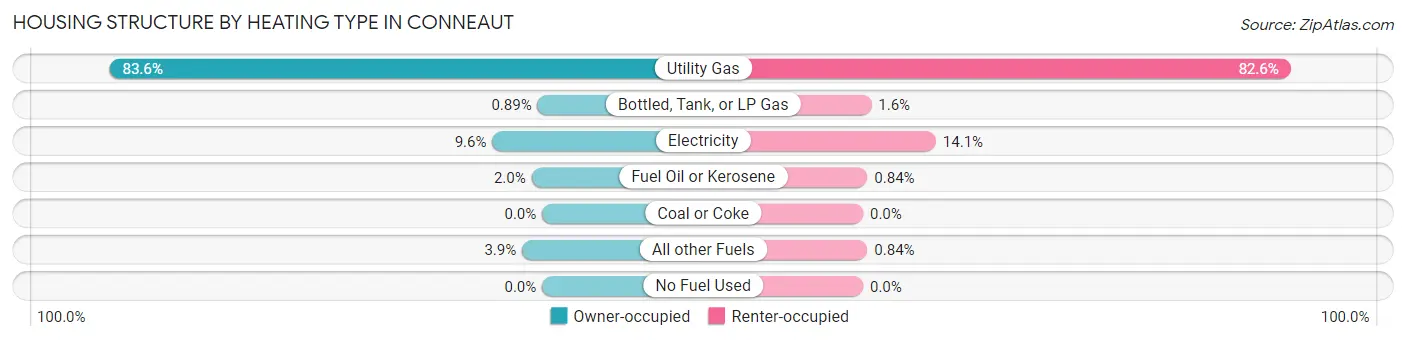
| Heating Type | Owner-occupied | Renter-occupied |
| Utility Gas | 2,824 (83.6%) | 1,080 (82.6%) |
| Bottled, Tank, or LP Gas | 30 (0.9%) | 21 (1.6%) |
| Electricity | 325 (9.6%) | 184 (14.1%) |
| Fuel Oil or Kerosene | 69 (2.0%) | 11 (0.8%) |
| Coal or Coke | 0 (0.0%) | 0 (0.0%) |
| All other Fuels | 131 (3.9%) | 11 (0.8%) |
| No Fuel Used | 0 (0.0%) | 0 (0.0%) |
| Total | 3,379 (100.0%) | 1,307 (100.0%) |
Household Vehicle Usage in Conneaut
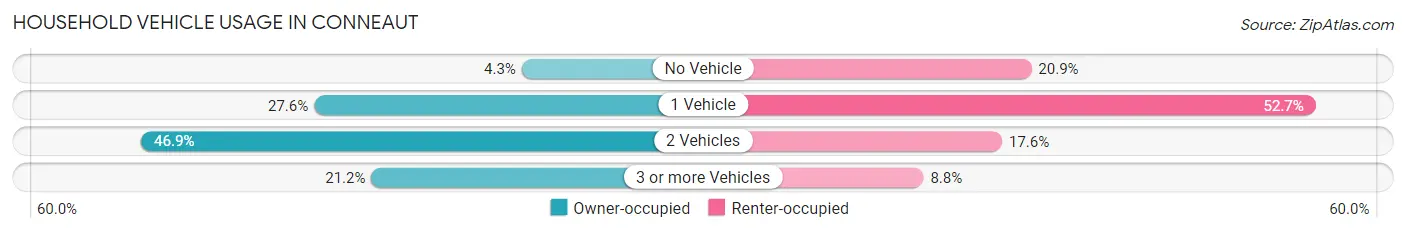
| Vehicles per Household | Owner-occupied | Renter-occupied |
| No Vehicle | 146 (4.3%) | 273 (20.9%) |
| 1 Vehicle | 932 (27.6%) | 689 (52.7%) |
| 2 Vehicles | 1,586 (46.9%) | 230 (17.6%) |
| 3 or more Vehicles | 715 (21.2%) | 115 (8.8%) |
| Total | 3,379 (100.0%) | 1,307 (100.0%) |
Real Estate & Mortgages in Conneaut
Real Estate and Mortgage Overview in Conneaut
| Characteristic | Without Mortgage | With Mortgage |
| Housing Units | 1,552 | 1,827 |
| Median Property Value | $101,100 | $120,500 |
| Median Household Income | $67,956 | $129 |
| Monthly Housing Costs | $399 | $7 |
| Real Estate Taxes | $1,352 | $61 |
Property Value by Mortgage Status in Conneaut
| Property Value | Without Mortgage | With Mortgage |
| Less than $50,000 | 306 (19.7%) | 129 (7.1%) |
| $50,000 to $99,999 | 462 (29.8%) | 589 (32.2%) |
| $100,000 to $299,999 | 726 (46.8%) | 1,083 (59.3%) |
| $300,000 to $499,999 | 32 (2.1%) | 12 (0.7%) |
| $500,000 to $749,999 | 26 (1.7%) | 0 (0.0%) |
| $750,000 to $999,999 | 0 (0.0%) | 7 (0.4%) |
| $1,000,000 or more | 0 (0.0%) | 7 (0.4%) |
| Total | 1,552 (100.0%) | 1,827 (100.0%) |
Household Income by Mortgage Status in Conneaut
| Household Income | Without Mortgage | With Mortgage |
| Less than $10,000 | 107 (6.9%) | 41 (2.2%) |
| $10,000 to $24,999 | 165 (10.6%) | 48 (2.6%) |
| $25,000 to $34,999 | 145 (9.3%) | 212 (11.6%) |
| $35,000 to $49,999 | 215 (13.9%) | 93 (5.1%) |
| $50,000 to $74,999 | 370 (23.8%) | 197 (10.8%) |
| $75,000 to $99,999 | 146 (9.4%) | 354 (19.4%) |
| $100,000 to $149,999 | 289 (18.6%) | 569 (31.1%) |
| $150,000 or more | 115 (7.4%) | 225 (12.3%) |
| Total | 1,552 (100.0%) | 1,827 (100.0%) |
Property Value to Household Income Ratio in Conneaut
| Value-to-Income Ratio | Without Mortgage | With Mortgage |
| Less than 2.0x | 954 (61.5%) | 75,720 (4,144.5%) |
| 2.0x to 2.9x | 191 (12.3%) | 1,028 (56.3%) |
| 3.0x to 3.9x | 69 (4.4%) | 442 (24.2%) |
| 4.0x or more | 319 (20.5%) | 148 (8.1%) |
| Total | 1,552 (100.0%) | 1,827 (100.0%) |
Real Estate Taxes by Mortgage Status in Conneaut
| Property Taxes | Without Mortgage | With Mortgage |
| Less than $800 | 442 (28.5%) | 0 (0.0%) |
| $800 to $1,499 | 395 (25.5%) | 239 (13.1%) |
| $800 to $1,499 | 670 (43.2%) | 579 (31.7%) |
| Total | 1,552 (100.0%) | 1,827 (100.0%) |
Health & Disability in Conneaut
Health Insurance Coverage by Age in Conneaut
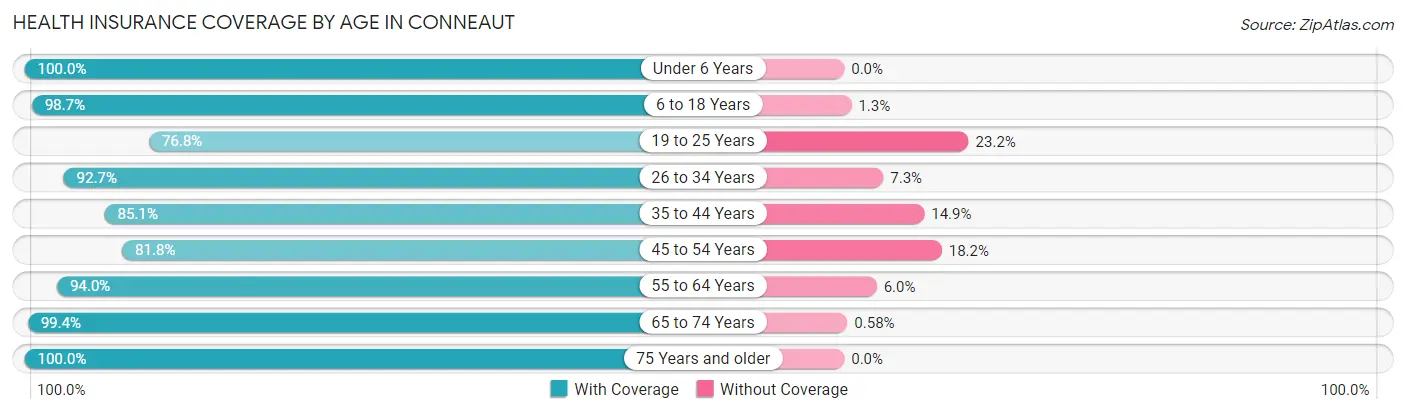
| Age Bracket | With Coverage | Without Coverage |
| Under 6 Years | 623 (100.0%) | 0 (0.0%) |
| 6 to 18 Years | 1,835 (98.7%) | 25 (1.3%) |
| 19 to 25 Years | 477 (76.8%) | 144 (23.2%) |
| 26 to 34 Years | 1,426 (92.7%) | 112 (7.3%) |
| 35 to 44 Years | 924 (85.1%) | 162 (14.9%) |
| 45 to 54 Years | 1,134 (81.8%) | 252 (18.2%) |
| 55 to 64 Years | 1,508 (94.0%) | 97 (6.0%) |
| 65 to 74 Years | 1,031 (99.4%) | 6 (0.6%) |
| 75 Years and older | 909 (100.0%) | 0 (0.0%) |
| Total | 9,867 (92.5%) | 798 (7.5%) |
Health Insurance Coverage by Citizenship Status in Conneaut
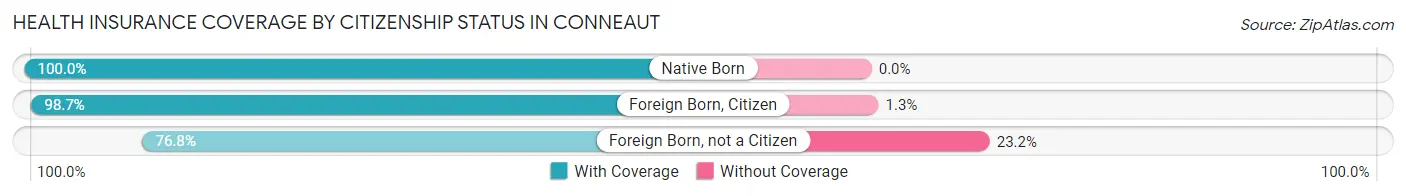
| Citizenship Status | With Coverage | Without Coverage |
| Native Born | 623 (100.0%) | 0 (0.0%) |
| Foreign Born, Citizen | 1,835 (98.7%) | 25 (1.3%) |
| Foreign Born, not a Citizen | 477 (76.8%) | 144 (23.2%) |
Health Insurance Coverage by Household Income in Conneaut
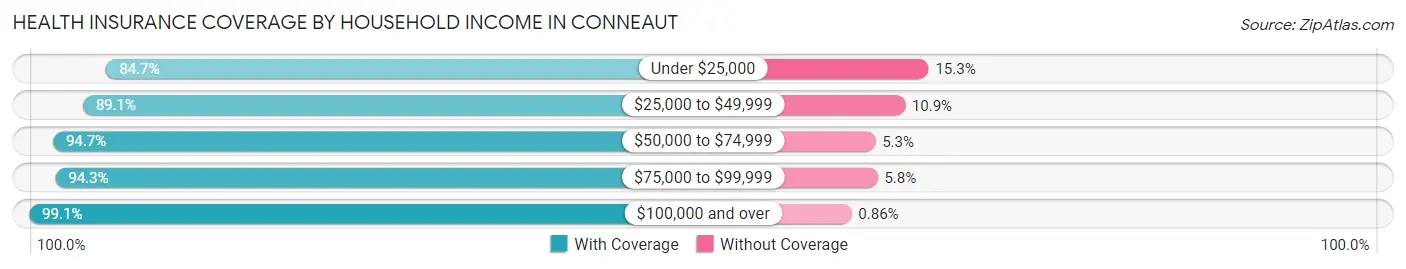
| Household Income | With Coverage | Without Coverage |
| Under $25,000 | 1,500 (84.7%) | 271 (15.3%) |
| $25,000 to $49,999 | 2,161 (89.1%) | 264 (10.9%) |
| $50,000 to $74,999 | 2,206 (94.7%) | 124 (5.3%) |
| $75,000 to $99,999 | 1,998 (94.3%) | 122 (5.8%) |
| $100,000 and over | 1,964 (99.1%) | 17 (0.9%) |
Public vs Private Health Insurance Coverage by Age in Conneaut
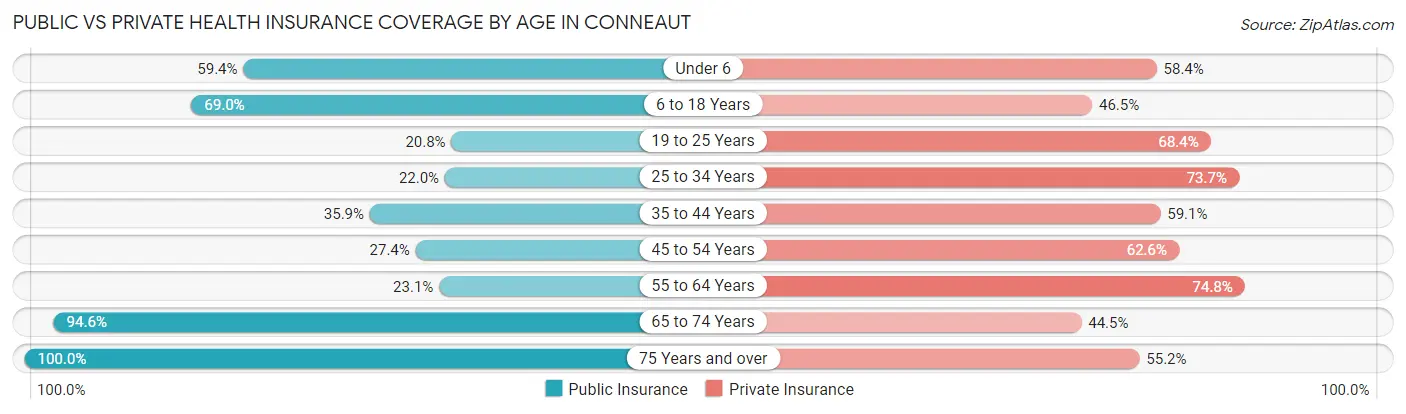
| Age Bracket | Public Insurance | Private Insurance |
| Under 6 | 370 (59.4%) | 364 (58.4%) |
| 6 to 18 Years | 1,284 (69.0%) | 864 (46.5%) |
| 19 to 25 Years | 129 (20.8%) | 425 (68.4%) |
| 25 to 34 Years | 338 (22.0%) | 1,133 (73.7%) |
| 35 to 44 Years | 390 (35.9%) | 642 (59.1%) |
| 45 to 54 Years | 380 (27.4%) | 867 (62.5%) |
| 55 to 64 Years | 370 (23.1%) | 1,200 (74.8%) |
| 65 to 74 Years | 981 (94.6%) | 461 (44.5%) |
| 75 Years and over | 909 (100.0%) | 502 (55.2%) |
| Total | 5,151 (48.3%) | 6,458 (60.6%) |
Disability Status by Sex by Age in Conneaut
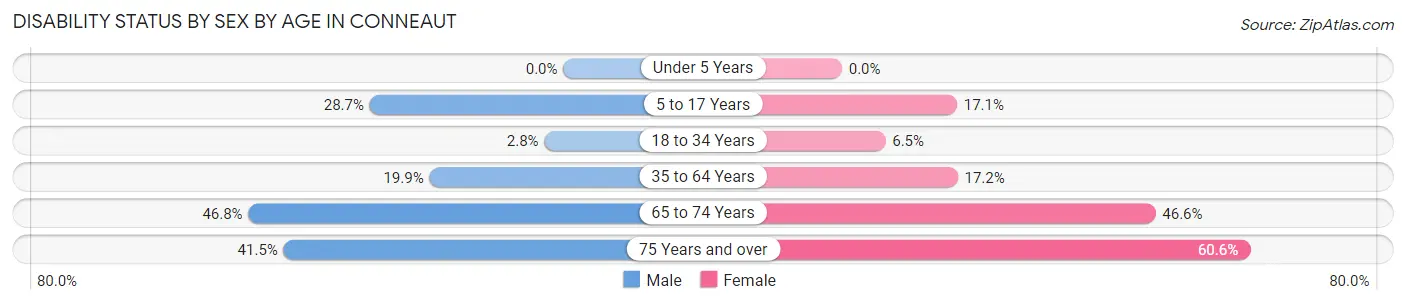
| Age Bracket | Male | Female |
| Under 5 Years | 0 (0.0%) | 0 (0.0%) |
| 5 to 17 Years | 284 (28.7%) | 143 (17.1%) |
| 18 to 34 Years | 34 (2.8%) | 68 (6.5%) |
| 35 to 64 Years | 423 (19.9%) | 335 (17.2%) |
| 65 to 74 Years | 281 (46.8%) | 203 (46.6%) |
| 75 Years and over | 174 (41.5%) | 297 (60.6%) |
Disability Class by Sex by Age in Conneaut
Disability Class: Hearing Difficulty
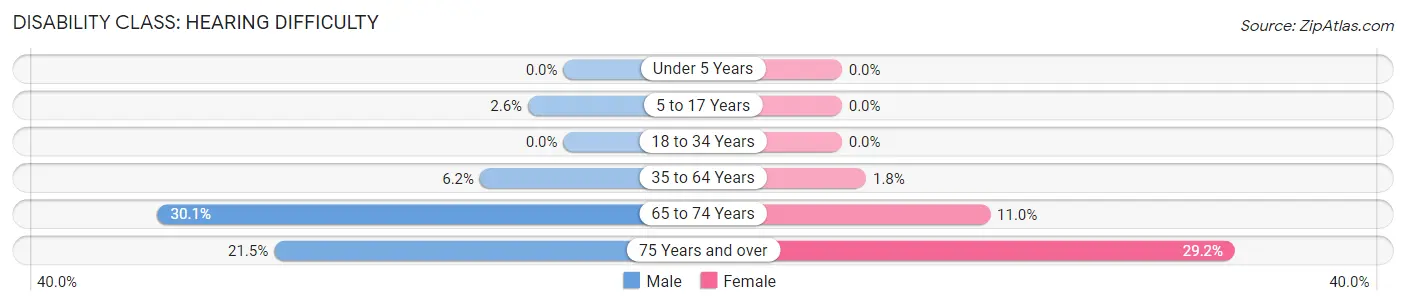
| Age Bracket | Male | Female |
| Under 5 Years | 0 (0.0%) | 0 (0.0%) |
| 5 to 17 Years | 26 (2.6%) | 0 (0.0%) |
| 18 to 34 Years | 0 (0.0%) | 0 (0.0%) |
| 35 to 64 Years | 132 (6.2%) | 35 (1.8%) |
| 65 to 74 Years | 181 (30.1%) | 48 (11.0%) |
| 75 Years and over | 90 (21.5%) | 143 (29.2%) |
Disability Class: Vision Difficulty
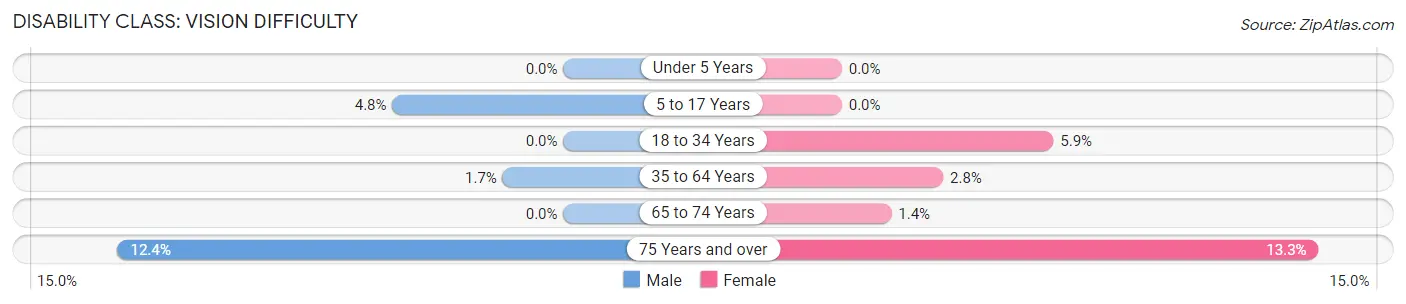
| Age Bracket | Male | Female |
| Under 5 Years | 0 (0.0%) | 0 (0.0%) |
| 5 to 17 Years | 47 (4.8%) | 0 (0.0%) |
| 18 to 34 Years | 0 (0.0%) | 62 (5.9%) |
| 35 to 64 Years | 36 (1.7%) | 55 (2.8%) |
| 65 to 74 Years | 0 (0.0%) | 6 (1.4%) |
| 75 Years and over | 52 (12.4%) | 65 (13.3%) |
Disability Class: Cognitive Difficulty
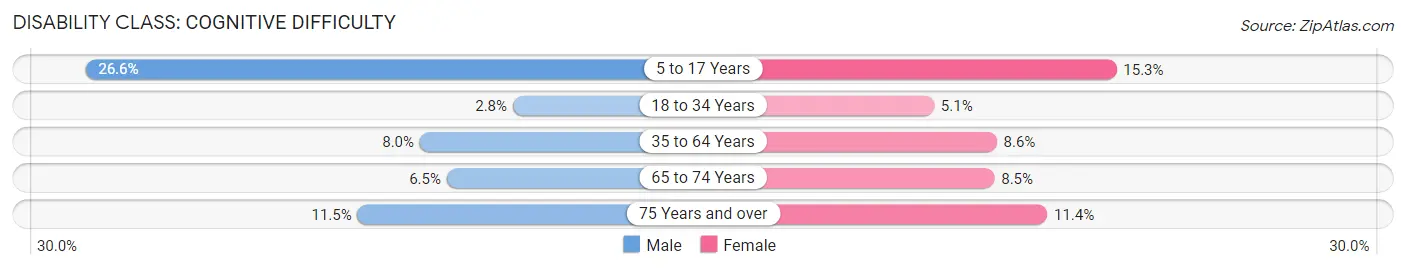
| Age Bracket | Male | Female |
| 5 to 17 Years | 263 (26.6%) | 128 (15.3%) |
| 18 to 34 Years | 34 (2.8%) | 54 (5.1%) |
| 35 to 64 Years | 170 (8.0%) | 168 (8.6%) |
| 65 to 74 Years | 39 (6.5%) | 37 (8.5%) |
| 75 Years and over | 48 (11.5%) | 56 (11.4%) |
Disability Class: Ambulatory Difficulty
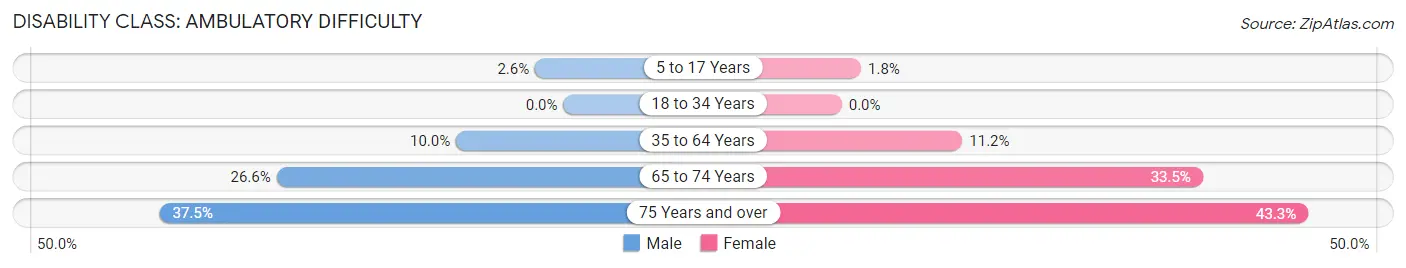
| Age Bracket | Male | Female |
| 5 to 17 Years | 26 (2.6%) | 15 (1.8%) |
| 18 to 34 Years | 0 (0.0%) | 0 (0.0%) |
| 35 to 64 Years | 212 (10.0%) | 218 (11.2%) |
| 65 to 74 Years | 160 (26.6%) | 146 (33.5%) |
| 75 Years and over | 157 (37.5%) | 212 (43.3%) |
Disability Class: Self-Care Difficulty
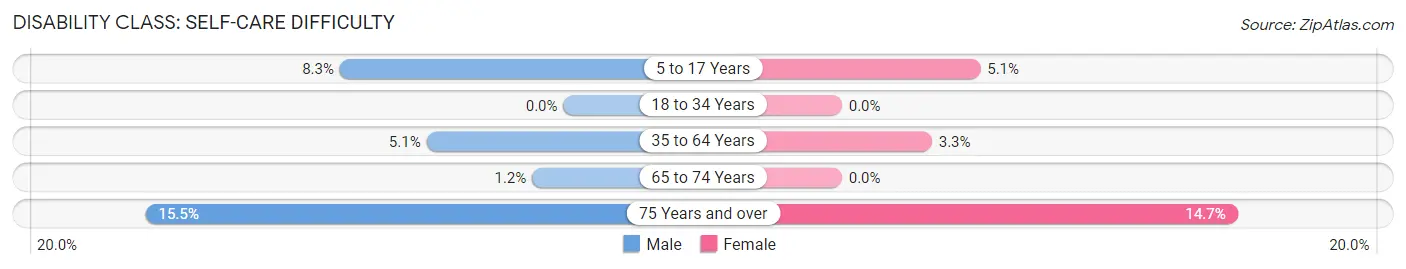
| Age Bracket | Male | Female |
| 5 to 17 Years | 82 (8.3%) | 43 (5.1%) |
| 18 to 34 Years | 0 (0.0%) | 0 (0.0%) |
| 35 to 64 Years | 108 (5.1%) | 65 (3.3%) |
| 65 to 74 Years | 7 (1.2%) | 0 (0.0%) |
| 75 Years and over | 65 (15.5%) | 72 (14.7%) |
Technology Access in Conneaut
Computing Device Access in Conneaut
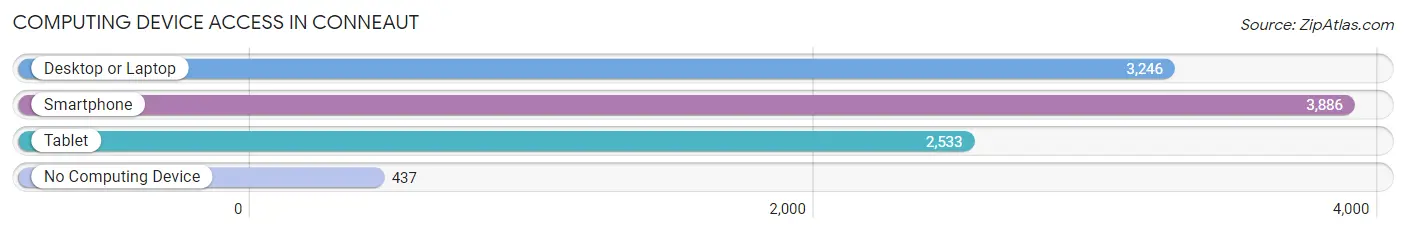
| Device Type | # Households | % Households |
| Desktop or Laptop | 3,246 | 69.3% |
| Smartphone | 3,886 | 82.9% |
| Tablet | 2,533 | 54.0% |
| No Computing Device | 437 | 9.3% |
| Total | 4,686 | 100.0% |
Internet Access in Conneaut
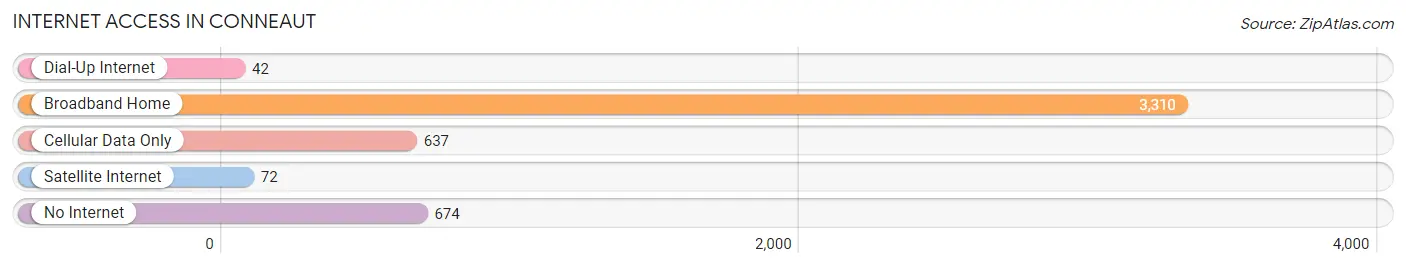
| Internet Type | # Households | % Households |
| Dial-Up Internet | 42 | 0.9% |
| Broadband Home | 3,310 | 70.6% |
| Cellular Data Only | 637 | 13.6% |
| Satellite Internet | 72 | 1.5% |
| No Internet | 674 | 14.4% |
| Total | 4,686 | 100.0% |
Conneaut Summary
Conneaut, Ohio is a city located in Ashtabula County, Ohio, United States. It is situated on the shores of Lake Erie, at the mouth of Conneaut Creek. The city is the largest in Ashtabula County, with a population of 12,841 as of the 2010 census.
History
The area that is now Conneaut was first settled in 1798 by a group of settlers from Connecticut. The town was originally known as "New Connecticut," and was later renamed Conneaut. The name is derived from the Native American word "Kon-ne-aut," which means "snow-white."
The town was officially incorporated in 1831, and was a major port on Lake Erie. It was a major stop on the Underground Railroad, and was home to a large number of abolitionists.
In the late 19th century, Conneaut was a major center for the iron and steel industry. The city was home to several steel mills, and was a major producer of steel products.
Geography
Conneaut is located at 41°51'N 80°35'W (41.851, -80.583). According to the United States Census Bureau, the city has a total area of 8.2 square miles (21.2 km2), of which 7.9 square miles (20.5 km2) is land and 0.3 square miles (0.7 km2) is water.
The city is located on the shores of Lake Erie, at the mouth of Conneaut Creek. The city is bordered by the townships of Conneaut, Plymouth, and Saybrook.
Economy
Conneaut is a major center for the steel industry. The city is home to several steel mills, including the Conneaut Steel Mill, which is the largest steel mill in the state of Ohio. The city is also home to several other industries, including manufacturing, transportation, and tourism.
The city is home to several major employers, including the Conneaut Steel Mill, the Conneaut Port Authority, and the Conneaut Area Chamber of Commerce.
Demographics
As of the 2010 census, there were 12,841 people, 5,541 households, and 3,541 families residing in the city. The population density was 1,622.3 people per square mile (625.3/km2). There were 6,093 housing units at an average density of 772.3 per square mile (297.7/km2). The racial makeup of the city was 94.2% White, 2.3% African American, 0.3% Native American, 0.5% Asian, 0.1% Pacific Islander, 0.7% from other races, and 1.9% from two or more races. Hispanic or Latino of any race were 2.2% of the population.
There were 5,541 households, out of which 28.2% had children under the age of 18 living with them, 44.2% were married couples living together, 14.3% had a female householder with no husband present, and 36.3% were non-families. 30.7% of all households were made up of individuals, and 13.2% had someone living alone who was 65 years of age or older. The average household size was 2.31 and the average family size was 2.86.
In the city, the population was spread out, with 23.2% under the age of 18, 8.2% from 18 to 24, 25.7% from 25 to 44, 25.2% from 45 to 64, and 17.7% who were 65 years of age or older. The median age was 40 years. For every 100 females, there were 91.2 males. For every 100 females age 18 and over, there were 87.2 males.
The median income for a household in the city was $33,917, and the median income for a family was $41,945. Males had a median income of $35,945 versus $25,917 for females. The per capita income for the city was $17,945. About 11.2% of families and 14.2% of the population were below the poverty line, including 20.2% of those under age 18 and 8.2% of those age 65 or over.
Common Questions
What is Per Capita Income in Conneaut?
Per Capita income in Conneaut is $28,196.
What is the Median Family Income in Conneaut?
Median Family Income in Conneaut is $60,342.
What is the Median Household income in Conneaut?
Median Household Income in Conneaut is $55,708.
What is Income or Wage Gap in Conneaut?
Income or Wage Gap in Conneaut is 8.5%.
Women in Conneaut earn 91.5 cents for every dollar earned by a man.
What is Family Income Deficit in Conneaut?
Family Income Deficit in Conneaut is $8,526.
Families that are below poverty line in Conneaut earn $8,526 less on average than the poverty threshold level.
What is Inequality or Gini Index in Conneaut?
Inequality or Gini Index in Conneaut is 0.47.
What is the Total Population of Conneaut?
Total Population of Conneaut is 12,372.
What is the Total Male Population of Conneaut?
Total Male Population of Conneaut is 7,230.
What is the Total Female Population of Conneaut?
Total Female Population of Conneaut is 5,142.
What is the Ratio of Males per 100 Females in Conneaut?
There are 140.61 Males per 100 Females in Conneaut.
What is the Ratio of Females per 100 Males in Conneaut?
There are 71.12 Females per 100 Males in Conneaut.
What is the Median Population Age in Conneaut?
Median Population Age in Conneaut is 40.0 Years.
What is the Average Family Size in Conneaut
Average Family Size in Conneaut is 2.7 People.
What is the Average Household Size in Conneaut
Average Household Size in Conneaut is 2.3 People.
How Large is the Labor Force in Conneaut?
There are 5,452 People in the Labor Forcein in Conneaut.
What is the Percentage of People in the Labor Force in Conneaut?
53.3% of People are in the Labor Force in Conneaut.
What is the Unemployment Rate in Conneaut?
Unemployment Rate in Conneaut is 12.0%.