Cities with the Highest Unemployment Rate Among Males in Ohio
RELATED REPORTS & OPTIONS
Highest Unemployment | Male
Ohio
Compare Cities
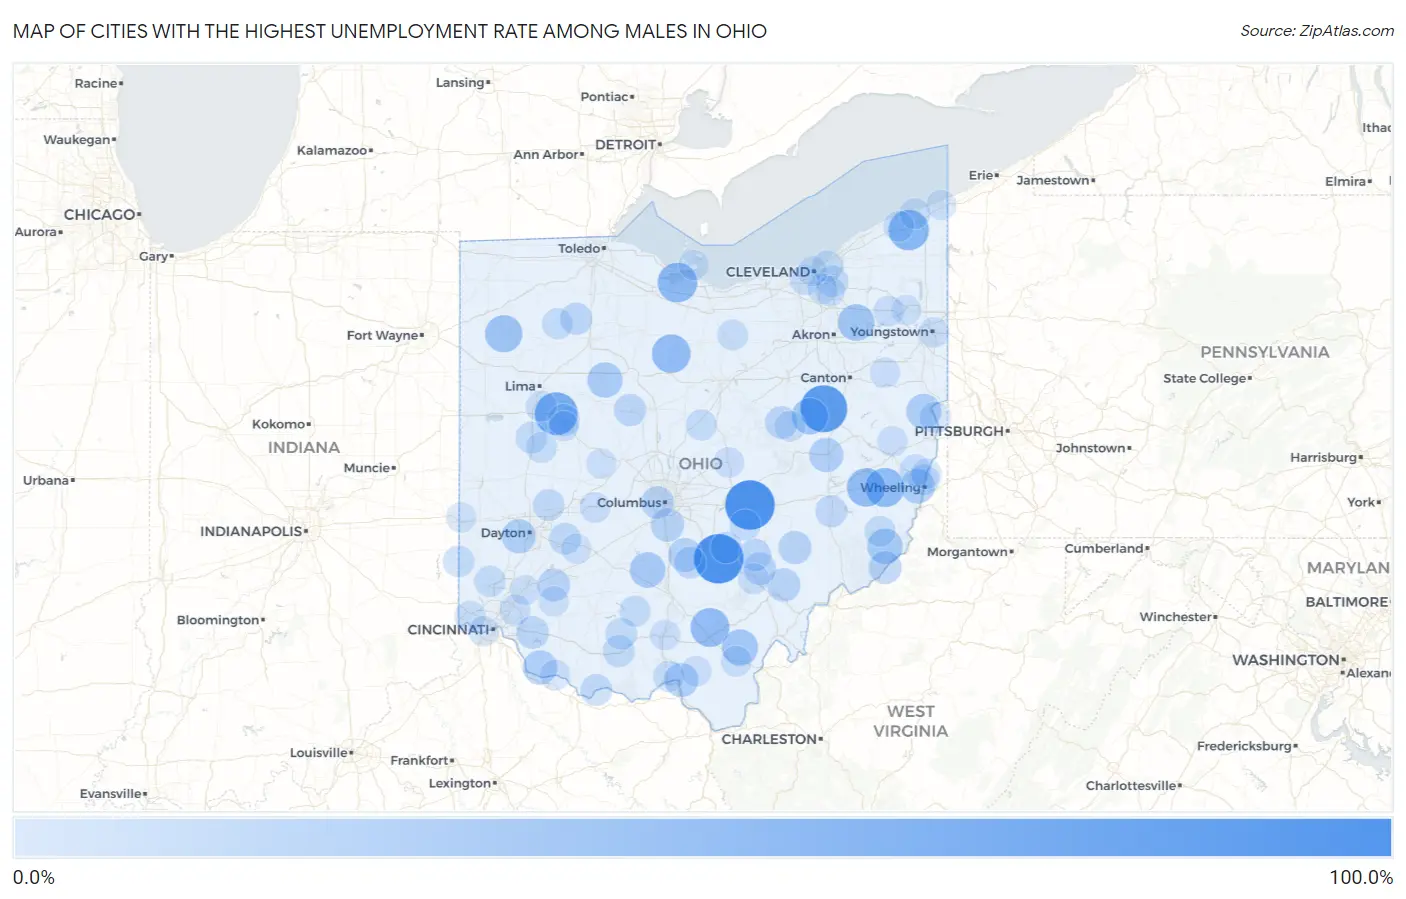
Map of Cities with the Highest Unemployment Rate Among Males in Ohio
0.0%
100.0%
Cities with the Highest Unemployment Rate Among Males in Ohio
| City | Male Unemployment | vs State | vs National | |
| 1. | Brownsville | 100.0% | 4.9%(+95.1)#1 | 5.0%(+95.0)#4 |
| 2. | Rockbridge | 100.0% | 4.9%(+95.1)#2 | 5.0%(+95.0)#42 |
| 3. | Dundee | 88.1% | 4.9%(+83.2)#3 | 5.0%(+83.1)#75 |
| 4. | New Hampshire | 69.8% | 4.9%(+64.9)#4 | 5.0%(+64.8)#117 |
| 5. | Austinburg | 58.2% | 4.9%(+53.3)#5 | 5.0%(+53.2)#172 |
| 6. | Whites Landing | 54.3% | 4.9%(+49.4)#6 | 5.0%(+49.3)#208 |
| 7. | Morristown | 51.7% | 4.9%(+46.8)#7 | 5.0%(+46.7)#238 |
| 8. | Coalton | 50.9% | 4.9%(+46.0)#8 | 5.0%(+45.9)#245 |
| 9. | Chatfield | 50.0% | 4.9%(+45.1)#9 | 5.0%(+45.0)#254 |
| 10. | Fairview | 50.0% | 4.9%(+45.1)#10 | 5.0%(+45.0)#268 |
| 11. | East Alliance | 47.4% | 4.9%(+42.5)#11 | 5.0%(+42.4)#297 |
| 12. | Melrose | 43.8% | 4.9%(+38.9)#12 | 5.0%(+38.8)#349 |
| 13. | Brady Lake | 41.1% | 4.9%(+36.2)#13 | 5.0%(+36.1)#400 |
| 14. | Walnut Creek | 39.7% | 4.9%(+34.8)#14 | 5.0%(+34.7)#430 |
| 15. | Vinton | 39.3% | 4.9%(+34.4)#15 | 5.0%(+34.3)#438 |
| 16. | Clarksburg | 36.0% | 4.9%(+31.1)#16 | 5.0%(+31.0)#534 |
| 17. | Antioch | 35.3% | 4.9%(+30.4)#17 | 5.0%(+30.3)#554 |
| 18. | Patterson | 34.9% | 4.9%(+30.0)#18 | 5.0%(+29.9)#559 |
| 19. | Irondale | 33.3% | 4.9%(+28.4)#19 | 5.0%(+28.3)#604 |
| 20. | Wolfhurst | 32.0% | 4.9%(+27.1)#20 | 5.0%(+27.0)#678 |
| 21. | Felicity | 30.5% | 4.9%(+25.6)#21 | 5.0%(+25.5)#750 |
| 22. | Newcomerstown | 30.4% | 4.9%(+25.5)#22 | 5.0%(+25.4)#751 |
| 23. | Drexel | 30.2% | 4.9%(+25.3)#23 | 5.0%(+25.2)#756 |
| 24. | Sciotodale | 29.6% | 4.9%(+24.7)#24 | 5.0%(+24.6)#785 |
| 25. | South Mount Vernon | 29.4% | 4.9%(+24.5)#25 | 5.0%(+24.4)#798 |
| 26. | West Logan | 29.3% | 4.9%(+24.4)#26 | 5.0%(+24.3)#809 |
| 27. | Stoutsville | 28.7% | 4.9%(+23.8)#27 | 5.0%(+23.7)#842 |
| 28. | Nankin | 27.7% | 4.9%(+22.8)#28 | 5.0%(+22.7)#923 |
| 29. | Lockbourne | 26.5% | 4.9%(+21.6)#29 | 5.0%(+21.5)#994 |
| 30. | Amesville | 26.3% | 4.9%(+21.4)#30 | 5.0%(+21.3)#1,004 |
| 31. | Malta | 25.9% | 4.9%(+21.0)#31 | 5.0%(+20.9)#1,034 |
| 32. | Massieville | 25.6% | 4.9%(+20.7)#32 | 5.0%(+20.6)#1,045 |
| 33. | Matamoras | 25.5% | 4.9%(+20.6)#33 | 5.0%(+20.5)#1,052 |
| 34. | Valleyview | 24.2% | 4.9%(+19.3)#34 | 5.0%(+19.2)#1,171 |
| 35. | Clarksville | 23.9% | 4.9%(+19.0)#35 | 5.0%(+18.9)#1,198 |
| 36. | Batavia | 23.7% | 4.9%(+18.8)#36 | 5.0%(+18.7)#1,210 |
| 37. | Killbuck | 23.6% | 4.9%(+18.7)#37 | 5.0%(+18.6)#1,226 |
| 38. | Fort Mckinley | 23.4% | 4.9%(+18.5)#38 | 5.0%(+18.4)#1,244 |
| 39. | Murray City | 23.3% | 4.9%(+18.4)#39 | 5.0%(+18.3)#1,267 |
| 40. | Brunersburg | 22.9% | 4.9%(+18.0)#40 | 5.0%(+17.9)#1,304 |
| 41. | Shawnee | 22.8% | 4.9%(+17.9)#41 | 5.0%(+17.8)#1,318 |
| 42. | New Bloomington | 22.2% | 4.9%(+17.3)#42 | 5.0%(+17.2)#1,374 |
| 43. | Hoytville | 21.7% | 4.9%(+16.8)#43 | 5.0%(+16.7)#1,439 |
| 44. | Wilberforce | 20.8% | 4.9%(+15.9)#44 | 5.0%(+15.8)#1,510 |
| 45. | Chippewa Park | 20.5% | 4.9%(+15.6)#45 | 5.0%(+15.5)#1,556 |
| 46. | Tarlton | 20.5% | 4.9%(+15.6)#46 | 5.0%(+15.5)#1,559 |
| 47. | Pleasant City | 20.4% | 4.9%(+15.5)#47 | 5.0%(+15.4)#1,570 |
| 48. | Peebles | 20.3% | 4.9%(+15.4)#48 | 5.0%(+15.3)#1,577 |
| 49. | New Carlisle | 19.5% | 4.9%(+14.6)#49 | 5.0%(+14.5)#1,679 |
| 50. | Manchester | 19.5% | 4.9%(+14.6)#50 | 5.0%(+14.5)#1,682 |
| 51. | Sinking Spring | 19.4% | 4.9%(+14.5)#51 | 5.0%(+14.4)#1,704 |
| 52. | College Corner | 19.2% | 4.9%(+14.3)#52 | 5.0%(+14.2)#1,735 |
| 53. | Anna | 19.1% | 4.9%(+14.2)#53 | 5.0%(+14.1)#1,740 |
| 54. | North Randall | 19.1% | 4.9%(+14.2)#54 | 5.0%(+14.1)#1,742 |
| 55. | Hide A Way Hills | 19.1% | 4.9%(+14.2)#55 | 5.0%(+14.1)#1,743 |
| 56. | Stratton | 17.9% | 4.9%(+13.0)#56 | 5.0%(+12.9)#1,941 |
| 57. | East Cleveland | 17.6% | 4.9%(+12.7)#57 | 5.0%(+12.6)#1,965 |
| 58. | Mount Pleasant | 17.5% | 4.9%(+12.6)#58 | 5.0%(+12.5)#1,998 |
| 59. | Belmore | 17.4% | 4.9%(+12.5)#59 | 5.0%(+12.4)#2,019 |
| 60. | New Miami | 17.3% | 4.9%(+12.4)#60 | 5.0%(+12.3)#2,022 |
| 61. | Woodsfield | 17.2% | 4.9%(+12.3)#61 | 5.0%(+12.2)#2,035 |
| 62. | Bainbridge | 17.1% | 4.9%(+12.2)#62 | 5.0%(+12.1)#2,072 |
| 63. | Martins Ferry | 16.8% | 4.9%(+11.9)#63 | 5.0%(+11.8)#2,121 |
| 64. | Somerset | 16.7% | 4.9%(+11.8)#64 | 5.0%(+11.7)#2,148 |
| 65. | Chesterville | 16.7% | 4.9%(+11.8)#65 | 5.0%(+11.7)#2,168 |
| 66. | Rosemount | 16.6% | 4.9%(+11.7)#66 | 5.0%(+11.6)#2,189 |
| 67. | Remington | 16.5% | 4.9%(+11.6)#67 | 5.0%(+11.5)#2,207 |
| 68. | Uniopolis | 16.5% | 4.9%(+11.6)#68 | 5.0%(+11.5)#2,211 |
| 69. | Grandview | 16.0% | 4.9%(+11.1)#69 | 5.0%(+11.0)#2,304 |
| 70. | Port Jefferson | 16.0% | 4.9%(+11.1)#70 | 5.0%(+11.0)#2,313 |
| 71. | Nelsonville | 15.9% | 4.9%(+11.0)#71 | 5.0%(+10.9)#2,329 |
| 72. | Rio Grande | 15.9% | 4.9%(+11.0)#72 | 5.0%(+10.9)#2,342 |
| 73. | Lake Buckhorn | 15.9% | 4.9%(+11.0)#73 | 5.0%(+10.9)#2,344 |
| 74. | New London | 15.6% | 4.9%(+10.7)#74 | 5.0%(+10.6)#2,412 |
| 75. | Ashtabula | 15.5% | 4.9%(+10.6)#75 | 5.0%(+10.5)#2,431 |
| 76. | Windham | 15.4% | 4.9%(+10.5)#76 | 5.0%(+10.4)#2,457 |
| 77. | Geneva | 15.3% | 4.9%(+10.4)#77 | 5.0%(+10.3)#2,493 |
| 78. | Utica | 14.9% | 4.9%(+10.00)#78 | 5.0%(+9.90)#2,601 |
| 79. | South Webster | 14.7% | 4.9%(+9.80)#79 | 5.0%(+9.70)#2,661 |
| 80. | Higginsport | 14.6% | 4.9%(+9.70)#80 | 5.0%(+9.60)#2,695 |
| 81. | Youngstown | 14.5% | 4.9%(+9.60)#81 | 5.0%(+9.50)#2,699 |
| 82. | Yorkville | 14.5% | 4.9%(+9.60)#82 | 5.0%(+9.50)#2,716 |
| 83. | Jewett | 14.5% | 4.9%(+9.60)#83 | 5.0%(+9.50)#2,720 |
| 84. | Piketon | 14.2% | 4.9%(+9.30)#84 | 5.0%(+9.20)#2,803 |
| 85. | Linndale | 14.1% | 4.9%(+9.20)#85 | 5.0%(+9.10)#2,843 |
| 86. | South Vienna | 14.0% | 4.9%(+9.10)#86 | 5.0%(+9.00)#2,866 |
| 87. | Delshire | 13.9% | 4.9%(+9.00)#87 | 5.0%(+8.90)#2,889 |
| 88. | Homeworth | 13.8% | 4.9%(+8.90)#88 | 5.0%(+8.80)#2,942 |
| 89. | Russells Point | 13.7% | 4.9%(+8.80)#89 | 5.0%(+8.70)#2,974 |
| 90. | Blanchester | 13.6% | 4.9%(+8.70)#90 | 5.0%(+8.60)#2,992 |
| 91. | North Lewisburg | 13.6% | 4.9%(+8.70)#91 | 5.0%(+8.60)#2,995 |
| 92. | Valley View | 13.3% | 4.9%(+8.40)#92 | 5.0%(+8.30)#3,081 |
| 93. | New Paris | 13.3% | 4.9%(+8.40)#93 | 5.0%(+8.30)#3,084 |
| 94. | Leavittsburg | 13.3% | 4.9%(+8.40)#94 | 5.0%(+8.30)#3,089 |
| 95. | Lakeside | 13.2% | 4.9%(+8.30)#95 | 5.0%(+8.20)#3,147 |
| 96. | Shawnee Hills | 13.1% | 4.9%(+8.20)#96 | 5.0%(+8.10)#3,165 |
| 97. | Walton Hills | 13.1% | 4.9%(+8.20)#97 | 5.0%(+8.10)#3,167 |
| 98. | Conneaut | 13.0% | 4.9%(+8.10)#98 | 5.0%(+8.00)#3,187 |
| 99. | South Lebanon | 13.0% | 4.9%(+8.10)#99 | 5.0%(+8.00)#3,189 |
| 100. | Cleveland | 12.9% | 4.9%(+8.00)#100 | 5.0%(+7.90)#3,237 |
Common Questions
What are the Top 10 Cities with the Highest Unemployment Rate Among Males in Ohio?
Top 10 Cities with the Highest Unemployment Rate Among Males in Ohio are:
#1
100.0%
#2
100.0%
#3
88.1%
#4
69.8%
#5
58.2%
#6
54.3%
#7
51.7%
#8
50.9%
#9
50.0%
#10
50.0%
What city has the Highest Unemployment Rate Among Males in Ohio?
Brownsville has the Highest Unemployment Rate Among Males in Ohio with 100.0%.
What is the Unemployment Rate Among Males in the State of Ohio?
Unemployment Rate Among Males in Ohio is 4.9%.
What is the Unemployment Rate Among Males in the United States?
Unemployment Rate Among Males in the United States is 5.0%.