Zip Codes with the Highest Percentage of Population with a Degree in Literature and Languages in Columbus, OH

RELATED REPORTS & OPTIONS

Literature and Languages
Population
Families and Households
Female Fertility
Female Fertility (Unmarried)
Race (Community Size)
Race (Percentage)
Ancestry (Community Size)
AfghanAfricanAlbanianAlsatianAmericanApacheArabArgentineanArmenianAustralianAustrianBahamianBangladeshiBarbadianBasqueBelgianBelizeanBhutaneseBlackfeetBolivianBrazilianBritishBritish West IndianBulgarianBurmeseCambodianCanadianCape VerdeanCarpatho RusynCelticCentral AmericanCentral American IndianCherokeeChileanChippewaChoctawColombianCosta RicanCreeCreekCroatianCrowCubanCzechCzechoslovakianDanishDelawareDominicanDutchDutch West IndianEastern EuropeanEcuadorianEgyptianEnglishEstonianEthiopianEuropeanFilipinoFinnishFrenchFrench American IndianFrench CanadianGermanGerman RussianGhanaianGreekGuamanian / ChamorroGuatemalanGuyaneseHaitianHonduranHungarianIcelanderIndian (Asian)IndonesianInupiatIranianIraqiIrishIroquoisIsraeliItalianJamaicanJapaneseJordanianKenyanKoreanLaotianLatvianLebaneseLiberianLithuanianLumbeeLuxembourgerMacedonianMalaysianMalteseMexicanMexican American IndianMongolianMoroccanNative HawaiianNavajoNew ZealanderNicaraguanNigerianNorthern EuropeanNorwegianPakistaniPalestinianPanamanianParaguayanPennsylvania GermanPeruvianPolishPortuguesePuerto RicanRomanianRussianSalvadoranSamoanScandinavianScotch-IrishScottishSeminoleSenegaleseSerbianSierra LeoneanSiouxSlavicSlovakSloveneSomaliSouth AfricanSouth AmericanSouth American IndianSpaniardSpanishSri LankanSubsaharan AfricanSudaneseSwedishSwissSyrianThaiTrinidadian and TobagonianTurkishUgandanUkrainianUruguayanVenezuelanVietnameseWelshWest IndianYaquiYugoslavianZimbabwean
Ancestry (Percentage)
AfghanAfricanAlbanianAlsatianAmericanApacheArabArgentineanArmenianAustralianAustrianBahamianBangladeshiBarbadianBasqueBelgianBelizeanBhutaneseBlackfeetBolivianBrazilianBritishBritish West IndianBulgarianBurmeseCambodianCanadianCape VerdeanCarpatho RusynCelticCentral AmericanCentral American IndianCherokeeChileanChippewaChoctawColombianCosta RicanCreeCreekCroatianCrowCubanCzechCzechoslovakianDanishDelawareDominicanDutchDutch West IndianEastern EuropeanEcuadorianEgyptianEnglishEstonianEthiopianEuropeanFilipinoFinnishFrenchFrench American IndianFrench CanadianGermanGerman RussianGhanaianGreekGuamanian / ChamorroGuatemalanGuyaneseHaitianHonduranHungarianIcelanderIndian (Asian)IndonesianInupiatIranianIraqiIrishIroquoisIsraeliItalianJamaicanJapaneseJordanianKenyanKoreanLaotianLatvianLebaneseLiberianLithuanianLumbeeLuxembourgerMacedonianMalaysianMalteseMexicanMexican American IndianMongolianMoroccanNative HawaiianNavajoNew ZealanderNicaraguanNigerianNorthern EuropeanNorwegianPakistaniPalestinianPanamanianParaguayanPennsylvania GermanPeruvianPolishPortuguesePuerto RicanRomanianRussianSalvadoranSamoanScandinavianScotch-IrishScottishSeminoleSenegaleseSerbianSierra LeoneanSiouxSlavicSlovakSloveneSomaliSouth AfricanSouth AmericanSouth American IndianSpaniardSpanishSri LankanSubsaharan AfricanSudaneseSwedishSwissSyrianThaiTrinidadian and TobagonianTurkishUgandanUkrainianUruguayanVenezuelanVietnameseWelshWest IndianYaquiYugoslavianZimbabwean
Immigrant Origin (Total)
AfghanistanAfricaAlbaniaArgentinaArmeniaAsiaAustraliaBahamasBangladeshBarbadosBelarusBelgiumBelizeBosnia and HerzegovinaBrazilBulgariaBurma / MyanmarCambodiaCameroonCanadaCaribbeanCentral AmericaChileChinaColombiaCongoCosta RicaCubaCzechoslovakiaDominican RepublicEastern AfricaEastern AsiaEastern EuropeEcuadorEgyptEl SalvadorEnglandEritreaEthiopiaEuropeFranceGermanyGhanaGreeceGuatemalaGuyanaHaitiHondurasHong KongHungaryIndiaIndonesiaIranIraqIrelandIsraelItalyJamaicaJapanJordanKazakhstanKenyaKoreaKuwaitLaosLatin AmericaLatviaLebanonLiberiaLithuaniaMalaysiaMexicoMiddle AfricaMoroccoNepalNetherlandsNigeriaNorth MacedoniaNorthern AfricaNorthern EuropeOceaniaPakistanPanamaPeruPhilippinesPolandRomaniaRussiaSaudi ArabiaScotlandSenegalSerbiaSierra LeoneSingaporeSomaliaSouth AfricaSouth AmericaSouth Central AsiaSouth Eastern AsiaSouthern EuropeSpainSri LankaSudanSwitzerlandSyriaTaiwanThailandTrinidad and TobagoTurkeyUgandaUkraineUruguayUzbekistanVenezuelaVietnamWestern AfricaWestern AsiaWestern EuropeZaireZimbabwe
Immigrant Origin (Percentage)
AfghanistanAfricaAlbaniaArgentinaArmeniaAsiaAustraliaBahamasBangladeshBarbadosBelarusBelgiumBelizeBosnia and HerzegovinaBrazilBulgariaBurma / MyanmarCambodiaCameroonCanadaCaribbeanCentral AmericaChileChinaColombiaCongoCosta RicaCubaCzechoslovakiaDominican RepublicEastern AfricaEastern AsiaEastern EuropeEcuadorEgyptEl SalvadorEnglandEritreaEthiopiaEuropeFranceGermanyGhanaGreeceGuatemalaGuyanaHaitiHondurasHong KongHungaryIndiaIndonesiaIranIraqIrelandIsraelItalyJamaicaJapanJordanKazakhstanKenyaKoreaKuwaitLaosLatin AmericaLatviaLebanonLiberiaLithuaniaMalaysiaMexicoMiddle AfricaMoroccoNepalNetherlandsNigeriaNorth MacedoniaNorthern AfricaNorthern EuropeOceaniaPakistanPanamaPeruPhilippinesPolandRomaniaRussiaSaudi ArabiaScotlandSenegalSerbiaSierra LeoneSingaporeSomaliaSouth AfricaSouth AmericaSouth Central AsiaSouth Eastern AsiaSouthern EuropeSpainSri LankaSudanSwitzerlandSyriaTaiwanThailandTrinidad and TobagoTurkeyUgandaUkraineUruguayUzbekistanVenezuelaVietnamWestern AfricaWestern AsiaWestern EuropeZaireZimbabwe
Income
Income (Families)
Income (Households)
Poverty
Poverty (Families)
Unemployment
Employment Occupations
Employment Industries
Employer Class
Commute Time
Commute Means
School Enrollment
Education by Degree Field
Occupancy
Finances
Physical Characteristics
Columbus
Compare Zip Codes
Comparison Subject

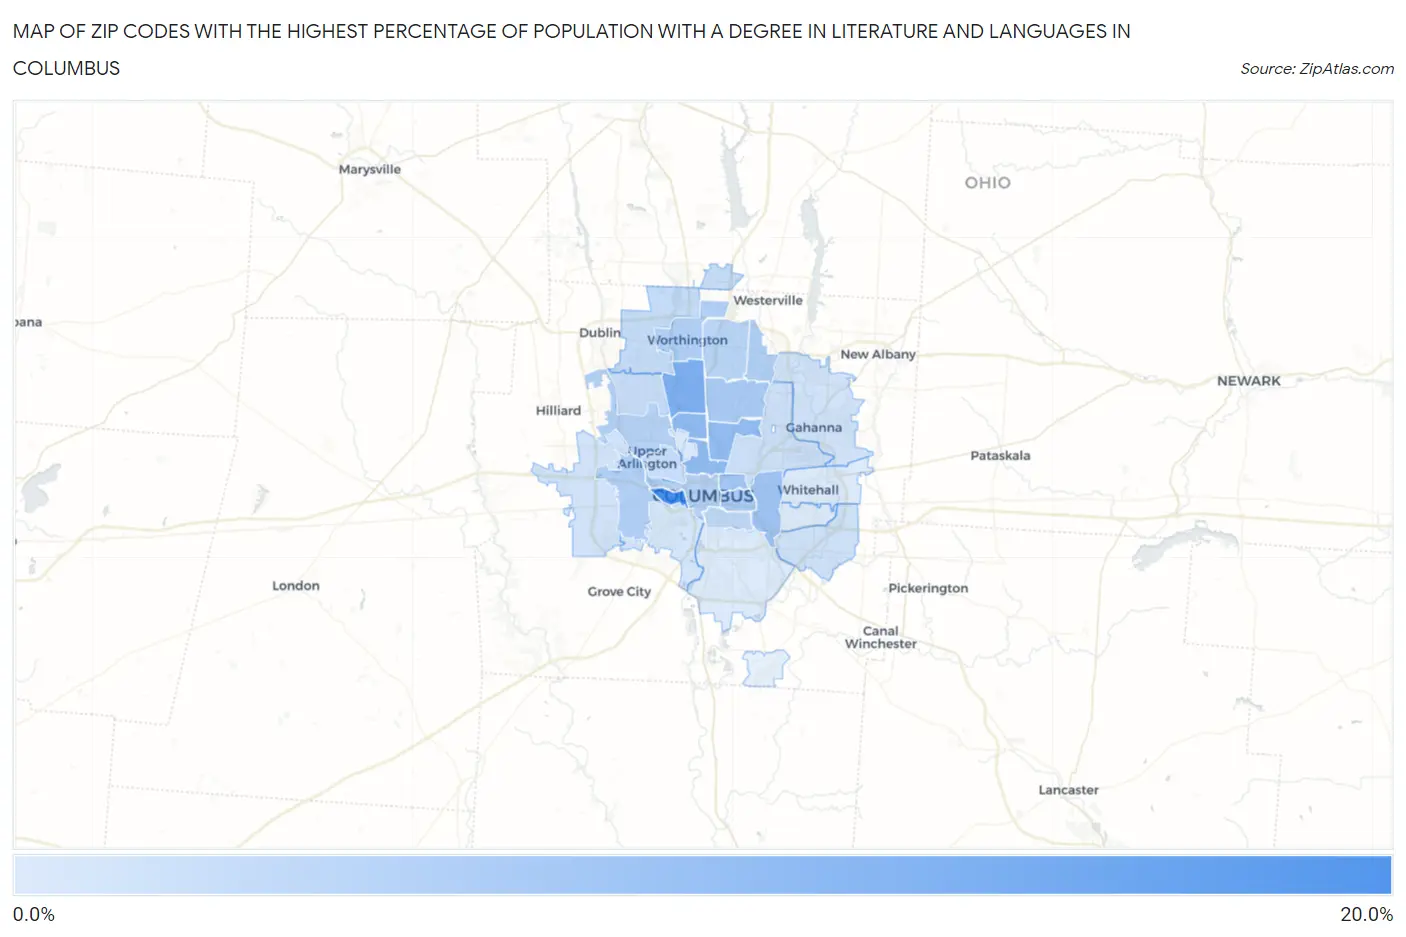
Map of Zip Codes with the Highest Percentage of Population with a Degree in Literature and Languages in Columbus

0.0%
20.0%
Zip Codes with the Highest Percentage of Population with a Degree in Literature and Languages in Columbus Map

Zip Codes with the Highest Percentage of Population with a Degree in Literature and Languages in Columbus, OH

Zip Code % Graduates vs State vs National
1.4322215.2%3.7%(+11.5)#184.4%(+10.8)#802
2.4321410.2%3.7%(+6.52)#394.4%(+5.78)#1,745
3.432018.7%3.7%(+4.99)#614.4%(+4.26)#2,504
4.432028.6%3.7%(+4.88)#624.4%(+4.15)#2,573
5.432118.4%3.7%(+4.72)#634.4%(+3.98)#2,686
6.432097.3%3.7%(+3.58)#854.4%(+2.84)#3,704
7.432037.1%3.7%(+3.42)#914.4%(+2.69)#3,870
8.432246.4%3.7%(+2.74)#1234.4%(+2.01)#4,765
9.432056.2%3.7%(+2.49)#1354.4%(+1.76)#5,140
10.432315.8%3.7%(+2.17)#1514.4%(+1.43)#5,689
11.432045.8%3.7%(+2.08)#1544.4%(+1.35)#5,825
12.430855.7%3.7%(+1.98)#1674.4%(+1.25)#6,019
13.432215.5%3.7%(+1.86)#1744.4%(+1.12)#6,258
14.432155.5%3.7%(+1.80)#1784.4%(+1.07)#6,362
15.432295.0%3.7%(+1.36)#2074.4%(+0.623)#7,278
16.432064.8%3.7%(+1.11)#2254.4%(+0.378)#7,925
17.432354.2%3.7%(+0.553)#2774.4%(-0.181)#9,519
18.432404.2%3.7%(+0.542)#2784.4%(-0.192)#9,544
19.432124.0%3.7%(+0.364)#2934.4%(-0.369)#10,073
20.432203.9%3.7%(+0.254)#3024.4%(-0.479)#10,387
21.432193.5%3.7%(-0.167)#3464.4%(-0.900)#11,817
22.432323.3%3.7%(-0.380)#3784.4%(-1.11)#12,546
23.432303.3%3.7%(-0.395)#3814.4%(-1.13)#12,600
24.432283.2%3.7%(-0.469)#3984.4%(-1.20)#12,889
25.432232.8%3.7%(-0.828)#4494.4%(-1.56)#14,081
26.432102.5%3.7%(-1.19)#5064.4%(-1.92)#15,343
27.432132.3%3.7%(-1.33)#5344.4%(-2.06)#15,871
28.432272.3%3.7%(-1.34)#5354.4%(-2.07)#15,893
29.432072.3%3.7%(-1.42)#5464.4%(-2.15)#16,203

Common Questions

What are the Top 10 Zip Codes with the Highest Percentage of Population with a Degree in Literature and Languages in Columbus, OH?
Top 10 Zip Codes with the Highest Percentage of Population with a Degree in Literature and Languages in Columbus, OH are:
#1
15.2%
#2
10.2%
#3
8.7%
#4
8.6%
#5
8.4%
#6
7.3%
#7
7.1%
#8
6.4%
#9
6.2%
#10
5.8%
What zip code has the Highest Percentage of Population with a Degree in Literature and Languages in Columbus, OH?
43222 has the Highest Percentage of Population with a Degree in Literature and Languages in Columbus, OH with 15.2%.
What is the Percentage of Population with a Degree in Literature and Languages in Columbus, OH?
Percentage of Population with a Degree in Literature and Languages in Columbus is 5.2%.
What is the Percentage of Population with a Degree in Literature and Languages in Ohio?
Percentage of Population with a Degree in Literature and Languages in Ohio is 3.7%.
What is the Percentage of Population with a Degree in Literature and Languages in the United States?
Percentage of Population with a Degree in Literature and Languages in the United States is 4.4%.