Cities with the Highest Percentage of Population Employed in Life, Physical & Social Science in Ohio
RELATED REPORTS & OPTIONS
Life, Physical & Social Science
Ohio
Compare Cities
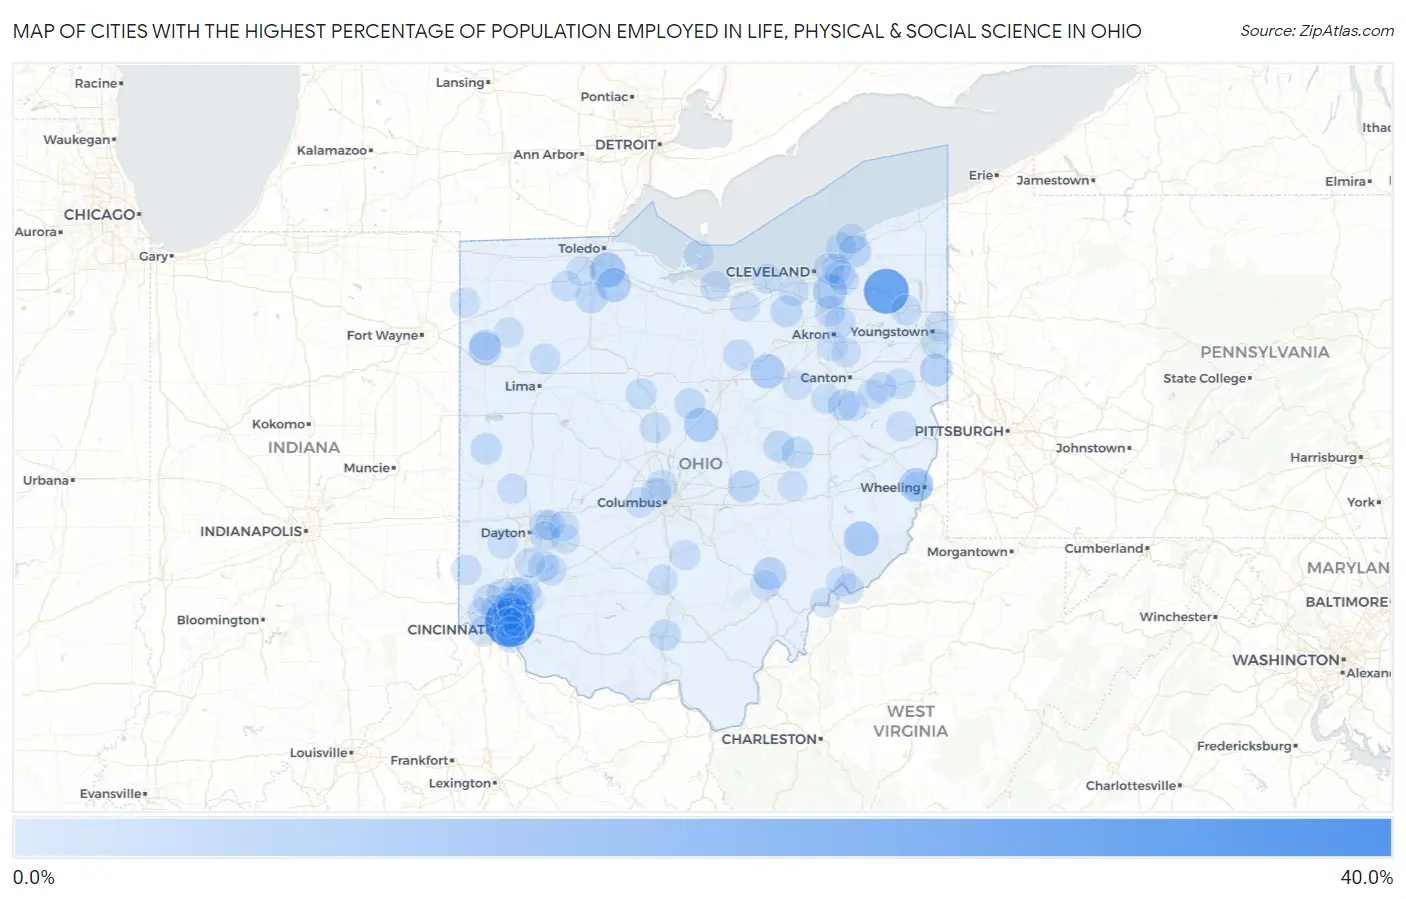
Map of Cities with the Highest Percentage of Population Employed in Life, Physical & Social Science in Ohio
0.0%
40.0%
Cities with the Highest Percentage of Population Employed in Life, Physical & Social Science in Ohio
| City | % Employed | vs State | vs National | |
| 1. | Plainville | 39.3% | 0.90%(+38.4)#1 | 1.1%(+38.2)#26 |
| 2. | Parkman | 30.0% | 0.90%(+29.1)#2 | 1.1%(+28.9)#45 |
| 3. | Sixteen Mile Stand | 12.3% | 0.90%(+11.4)#3 | 1.1%(+11.2)#168 |
| 4. | Stony Ridge | 11.5% | 0.90%(+10.6)#4 | 1.1%(+10.4)#186 |
| 5. | Stafford | 10.7% | 0.90%(+9.82)#5 | 1.1%(+9.62)#208 |
| 6. | Walton Hills | 10.1% | 0.90%(+9.19)#6 | 1.1%(+9.00)#223 |
| 7. | New Pittsburg | 10.0% | 0.90%(+9.10)#7 | 1.1%(+8.91)#227 |
| 8. | Chesterville | 9.7% | 0.90%(+8.82)#8 | 1.1%(+8.63)#241 |
| 9. | Pemberville | 9.5% | 0.90%(+8.63)#9 | 1.1%(+8.44)#253 |
| 10. | Lansing | 9.4% | 0.90%(+8.54)#10 | 1.1%(+8.34)#259 |
| 11. | New Waterford | 7.3% | 0.90%(+6.39)#11 | 1.1%(+6.20)#396 |
| 12. | Scott | 7.3% | 0.90%(+6.39)#12 | 1.1%(+6.19)#397 |
| 13. | Jacksonville | 7.2% | 0.90%(+6.34)#13 | 1.1%(+6.15)#405 |
| 14. | Camp Dennison | 7.2% | 0.90%(+6.28)#14 | 1.1%(+6.09)#409 |
| 15. | Kirtland Hills | 5.8% | 0.90%(+4.93)#15 | 1.1%(+4.74)#613 |
| 16. | Marne | 5.6% | 0.90%(+4.66)#16 | 1.1%(+4.46)#654 |
| 17. | Portage | 5.1% | 0.90%(+4.23)#17 | 1.1%(+4.04)#760 |
| 18. | Valley City | 5.0% | 0.90%(+4.12)#18 | 1.1%(+3.92)#784 |
| 19. | Zoar | 5.0% | 0.90%(+4.05)#19 | 1.1%(+3.86)#802 |
| 20. | Piketon | 4.8% | 0.90%(+3.94)#20 | 1.1%(+3.75)#831 |
| 21. | Canal Lewisville | 4.8% | 0.90%(+3.93)#21 | 1.1%(+3.73)#836 |
| 22. | North Star | 4.8% | 0.90%(+3.92)#22 | 1.1%(+3.73)#841 |
| 23. | Warsaw | 4.4% | 0.90%(+3.52)#23 | 1.1%(+3.33)#987 |
| 24. | Pleasant Run Farm | 4.2% | 0.90%(+3.33)#24 | 1.1%(+3.13)#1,068 |
| 25. | Silver Lake | 4.0% | 0.90%(+3.10)#25 | 1.1%(+2.90)#1,173 |
| 26. | Morral | 3.9% | 0.90%(+3.00)#26 | 1.1%(+2.81)#1,224 |
| 27. | Candlewood Lake | 3.9% | 0.90%(+2.97)#27 | 1.1%(+2.77)#1,242 |
| 28. | Bailey Lakes | 3.8% | 0.90%(+2.93)#28 | 1.1%(+2.74)#1,262 |
| 29. | Guilford Lake | 3.7% | 0.90%(+2.83)#29 | 1.1%(+2.63)#1,306 |
| 30. | Haviland | 3.7% | 0.90%(+2.81)#30 | 1.1%(+2.61)#1,325 |
| 31. | Wright Patterson Afb | 3.7% | 0.90%(+2.77)#31 | 1.1%(+2.57)#1,360 |
| 32. | Peninsula | 3.6% | 0.90%(+2.67)#32 | 1.1%(+2.48)#1,416 |
| 33. | Hanoverton | 3.5% | 0.90%(+2.61)#33 | 1.1%(+2.42)#1,476 |
| 34. | Waldo | 3.3% | 0.90%(+2.42)#34 | 1.1%(+2.22)#1,602 |
| 35. | Landen | 3.2% | 0.90%(+2.35)#35 | 1.1%(+2.15)#1,658 |
| 36. | Corwin | 3.2% | 0.90%(+2.34)#36 | 1.1%(+2.15)#1,665 |
| 37. | Cleveland Heights | 3.2% | 0.90%(+2.32)#37 | 1.1%(+2.13)#1,689 |
| 38. | Leavittsburg | 3.1% | 0.90%(+2.23)#38 | 1.1%(+2.04)#1,761 |
| 39. | Kenwood | 3.1% | 0.90%(+2.22)#39 | 1.1%(+2.03)#1,779 |
| 40. | South Lebanon | 3.1% | 0.90%(+2.21)#40 | 1.1%(+2.01)#1,790 |
| 41. | Minerva | 3.1% | 0.90%(+2.20)#41 | 1.1%(+2.01)#1,798 |
| 42. | Columbus Grove | 3.1% | 0.90%(+2.16)#42 | 1.1%(+1.97)#1,834 |
| 43. | Stoutsville | 3.0% | 0.90%(+2.10)#43 | 1.1%(+1.91)#1,888 |
| 44. | Harveysburg | 3.0% | 0.90%(+2.06)#44 | 1.1%(+1.86)#1,921 |
| 45. | Ridgewood | 2.9% | 0.90%(+2.02)#45 | 1.1%(+1.82)#1,952 |
| 46. | Delshire | 2.9% | 0.90%(+2.02)#46 | 1.1%(+1.82)#1,953 |
| 47. | Five Points | 2.9% | 0.90%(+2.01)#47 | 1.1%(+1.81)#1,966 |
| 48. | Mason | 2.9% | 0.90%(+1.97)#48 | 1.1%(+1.77)#1,997 |
| 49. | Pleasant Hill | 2.8% | 0.90%(+1.91)#49 | 1.1%(+1.72)#2,071 |
| 50. | Maplewood Park | 2.8% | 0.90%(+1.91)#50 | 1.1%(+1.71)#2,076 |
| 51. | Riverlea | 2.8% | 0.90%(+1.90)#51 | 1.1%(+1.71)#2,088 |
| 52. | Grand Rapids | 2.8% | 0.90%(+1.87)#52 | 1.1%(+1.68)#2,127 |
| 53. | Blue Ash | 2.8% | 0.90%(+1.87)#53 | 1.1%(+1.68)#2,132 |
| 54. | Oxford | 2.8% | 0.90%(+1.86)#54 | 1.1%(+1.67)#2,143 |
| 55. | Amsterdam | 2.7% | 0.90%(+1.84)#55 | 1.1%(+1.65)#2,170 |
| 56. | Lakeline | 2.7% | 0.90%(+1.83)#56 | 1.1%(+1.64)#2,194 |
| 57. | Reno | 2.7% | 0.90%(+1.81)#57 | 1.1%(+1.61)#2,220 |
| 58. | Berea | 2.7% | 0.90%(+1.78)#58 | 1.1%(+1.59)#2,244 |
| 59. | Upper Arlington | 2.6% | 0.90%(+1.72)#59 | 1.1%(+1.52)#2,333 |
| 60. | Sheffield | 2.6% | 0.90%(+1.70)#60 | 1.1%(+1.50)#2,367 |
| 61. | Silverton | 2.6% | 0.90%(+1.68)#61 | 1.1%(+1.48)#2,395 |
| 62. | Mentor On The Lake | 2.6% | 0.90%(+1.68)#62 | 1.1%(+1.48)#2,397 |
| 63. | Lake Darby | 2.5% | 0.90%(+1.64)#63 | 1.1%(+1.45)#2,455 |
| 64. | Beach City | 2.5% | 0.90%(+1.63)#64 | 1.1%(+1.44)#2,471 |
| 65. | Wyoming | 2.5% | 0.90%(+1.61)#65 | 1.1%(+1.42)#2,508 |
| 66. | Huron | 2.5% | 0.90%(+1.60)#66 | 1.1%(+1.41)#2,525 |
| 67. | Andersonville | 2.5% | 0.90%(+1.59)#67 | 1.1%(+1.39)#2,548 |
| 68. | Poland | 2.5% | 0.90%(+1.57)#68 | 1.1%(+1.38)#2,571 |
| 69. | Pepper Pike | 2.5% | 0.90%(+1.57)#69 | 1.1%(+1.37)#2,580 |
| 70. | Beckett Ridge | 2.4% | 0.90%(+1.55)#70 | 1.1%(+1.35)#2,616 |
| 71. | Kelleys Island | 2.4% | 0.90%(+1.51)#71 | 1.1%(+1.32)#2,668 |
| 72. | Maineville | 2.4% | 0.90%(+1.49)#72 | 1.1%(+1.29)#2,707 |
| 73. | Chauncey | 2.4% | 0.90%(+1.46)#73 | 1.1%(+1.27)#2,754 |
| 74. | Lyndhurst | 2.4% | 0.90%(+1.46)#74 | 1.1%(+1.26)#2,768 |
| 75. | Wilberforce | 2.4% | 0.90%(+1.46)#75 | 1.1%(+1.26)#2,770 |
| 76. | Summerside | 2.3% | 0.90%(+1.45)#76 | 1.1%(+1.26)#2,781 |
| 77. | Portage Lakes | 2.3% | 0.90%(+1.45)#77 | 1.1%(+1.25)#2,786 |
| 78. | Moreland Hills | 2.3% | 0.90%(+1.44)#78 | 1.1%(+1.25)#2,799 |
| 79. | White Oak | 2.3% | 0.90%(+1.43)#79 | 1.1%(+1.24)#2,806 |
| 80. | Hicksville | 2.3% | 0.90%(+1.43)#80 | 1.1%(+1.23)#2,815 |
| 81. | Apple Creek | 2.3% | 0.90%(+1.43)#81 | 1.1%(+1.23)#2,816 |
| 82. | Kipton | 2.3% | 0.90%(+1.43)#82 | 1.1%(+1.23)#2,821 |
| 83. | Belpre | 2.3% | 0.90%(+1.42)#83 | 1.1%(+1.23)#2,828 |
| 84. | Coldstream | 2.3% | 0.90%(+1.42)#84 | 1.1%(+1.23)#2,831 |
| 85. | Yellow Springs | 2.3% | 0.90%(+1.39)#85 | 1.1%(+1.20)#2,861 |
| 86. | Terrace Park | 2.3% | 0.90%(+1.39)#86 | 1.1%(+1.19)#2,874 |
| 87. | Farmersville | 2.3% | 0.90%(+1.36)#87 | 1.1%(+1.17)#2,922 |
| 88. | Mineral City | 2.3% | 0.90%(+1.35)#88 | 1.1%(+1.16)#2,945 |
| 89. | Montgomery | 2.2% | 0.90%(+1.35)#89 | 1.1%(+1.15)#2,961 |
| 90. | Fairborn | 2.2% | 0.90%(+1.34)#90 | 1.1%(+1.15)#2,969 |
| 91. | Beavercreek | 2.2% | 0.90%(+1.32)#91 | 1.1%(+1.13)#2,994 |
| 92. | Marietta | 2.2% | 0.90%(+1.31)#92 | 1.1%(+1.12)#3,019 |
| 93. | Adamsville | 2.2% | 0.90%(+1.31)#93 | 1.1%(+1.11)#3,031 |
| 94. | Malvern | 2.2% | 0.90%(+1.29)#94 | 1.1%(+1.10)#3,061 |
| 95. | Mariemont | 2.2% | 0.90%(+1.29)#95 | 1.1%(+1.10)#3,062 |
| 96. | Sherwood | 2.2% | 0.90%(+1.28)#96 | 1.1%(+1.09)#3,077 |
| 97. | Oakwood | 2.2% | 0.90%(+1.28)#97 | 1.1%(+1.09)#3,080 |
| 98. | Uniontown | 2.2% | 0.90%(+1.28)#98 | 1.1%(+1.08)#3,081 |
| 99. | Wolfhurst | 2.1% | 0.90%(+1.24)#99 | 1.1%(+1.04)#3,163 |
| 100. | Waterville | 2.1% | 0.90%(+1.23)#100 | 1.1%(+1.04)#3,164 |
Common Questions
What are the Top 10 Cities with the Highest Percentage of Population Employed in Life, Physical & Social Science in Ohio?
Top 10 Cities with the Highest Percentage of Population Employed in Life, Physical & Social Science in Ohio are:
#1
39.3%
#2
30.0%
#3
12.3%
#4
11.5%
#5
10.7%
#6
10.1%
#7
10.0%
#8
9.7%
#9
9.5%
#10
9.4%
What city has the Highest Percentage of Population Employed in Life, Physical & Social Science in Ohio?
Plainville has the Highest Percentage of Population Employed in Life, Physical & Social Science in Ohio with 39.3%.
What is the Percentage of Population Employed in Life, Physical & Social Science in the State of Ohio?
Percentage of Population Employed in Life, Physical & Social Science in Ohio is 0.90%.
What is the Percentage of Population Employed in Life, Physical & Social Science in the United States?
Percentage of Population Employed in Life, Physical & Social Science in the United States is 1.1%.