Jeffersonville, OH Map & Demographics
Jeffersonville Map
Jeffersonville Overview
$21,392
PER CAPITA INCOME
$39,688
AVG FAMILY INCOME
$38,438
AVG HOUSEHOLD INCOME
59.6%
WAGE / INCOME GAP [ % ]
40.4¢/ $1
WAGE / INCOME GAP [ $ ]
0.48
INEQUALITY / GINI INDEX
1,085
TOTAL POPULATION
516
MALE POPULATION
569
FEMALE POPULATION
90.69
MALES / 100 FEMALES
110.27
FEMALES / 100 MALES
35.3
MEDIAN AGE
3.0
AVG FAMILY SIZE
2.4
AVG HOUSEHOLD SIZE
452
LABOR FORCE [ PEOPLE ]
57.7%
PERCENT IN LABOR FORCE
8.9%
UNEMPLOYMENT RATE
Jeffersonville Zip Codes
Income in Jeffersonville
Income Overview in Jeffersonville
Per Capita Income in Jeffersonville is $21,392, while median incomes of families and households are $39,688 and $38,438 respectively.
| Characteristic | Number | Measure |
| Per Capita Income | 1,085 | $21,392 |
| Median Family Income | 283 | $39,688 |
| Mean Family Income | 283 | $61,566 |
| Median Household Income | 457 | $38,438 |
| Mean Household Income | 457 | $50,663 |
| Income Deficit | 283 | $0 |
| Wage / Income Gap (%) | 1,085 | 59.59% |
| Wage / Income Gap ($) | 1,085 | 40.41¢ per $1 |
| Gini / Inequality Index | 1,085 | 0.48 |
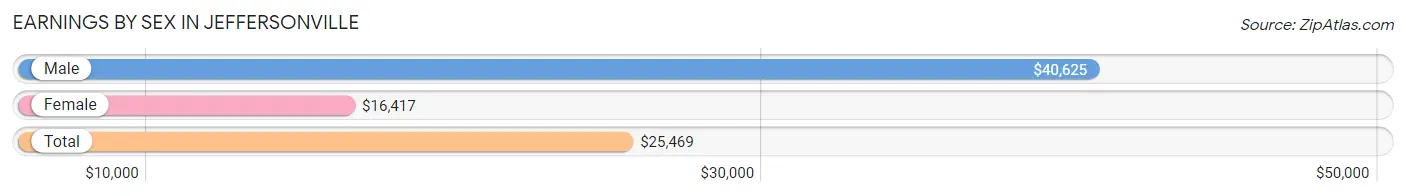
Earnings by Sex in Jeffersonville
Average Earnings in Jeffersonville are $25,469, $40,625 for men and $16,417 for women, a difference of 59.6%.
| Sex | Number | Average Earnings |
| Male | 255 (53.2%) | $40,625 |
| Female | 224 (46.8%) | $16,417 |
| Total | 479 (100.0%) | $25,469 |
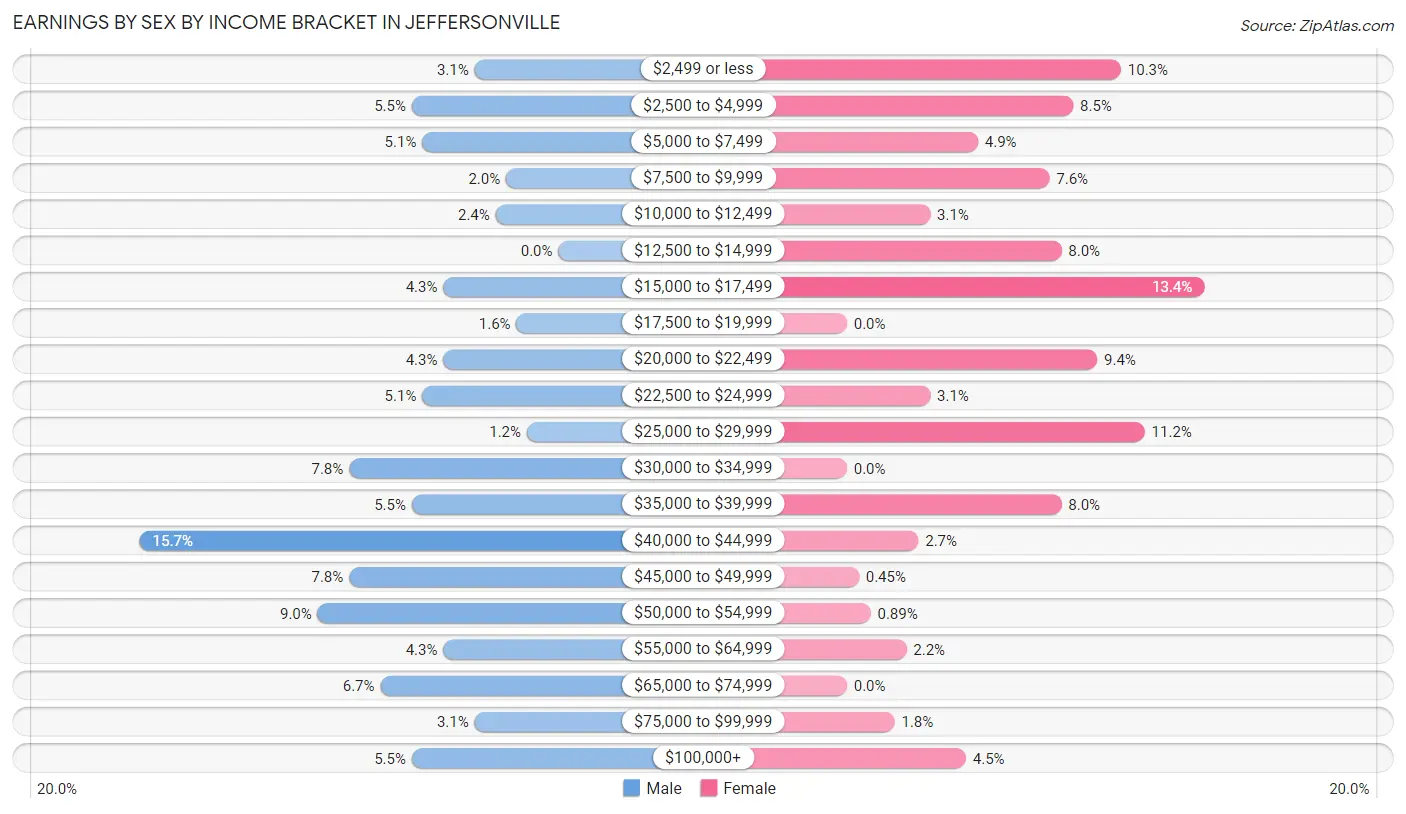
Earnings by Sex by Income Bracket in Jeffersonville
The most common earnings brackets in Jeffersonville are $40,000 to $44,999 for men (40 | 15.7%) and $15,000 to $17,499 for women (30 | 13.4%).
| Income | Male | Female |
| $2,499 or less | 8 (3.1%) | 23 (10.3%) |
| $2,500 to $4,999 | 14 (5.5%) | 19 (8.5%) |
| $5,000 to $7,499 | 13 (5.1%) | 11 (4.9%) |
| $7,500 to $9,999 | 5 (2.0%) | 17 (7.6%) |
| $10,000 to $12,499 | 6 (2.4%) | 7 (3.1%) |
| $12,500 to $14,999 | 0 (0.0%) | 18 (8.0%) |
| $15,000 to $17,499 | 11 (4.3%) | 30 (13.4%) |
| $17,500 to $19,999 | 4 (1.6%) | 0 (0.0%) |
| $20,000 to $22,499 | 11 (4.3%) | 21 (9.4%) |
| $22,500 to $24,999 | 13 (5.1%) | 7 (3.1%) |
| $25,000 to $29,999 | 3 (1.2%) | 25 (11.2%) |
| $30,000 to $34,999 | 20 (7.8%) | 0 (0.0%) |
| $35,000 to $39,999 | 14 (5.5%) | 18 (8.0%) |
| $40,000 to $44,999 | 40 (15.7%) | 6 (2.7%) |
| $45,000 to $49,999 | 20 (7.8%) | 1 (0.4%) |
| $50,000 to $54,999 | 23 (9.0%) | 2 (0.9%) |
| $55,000 to $64,999 | 11 (4.3%) | 5 (2.2%) |
| $65,000 to $74,999 | 17 (6.7%) | 0 (0.0%) |
| $75,000 to $99,999 | 8 (3.1%) | 4 (1.8%) |
| $100,000+ | 14 (5.5%) | 10 (4.5%) |
| Total | 255 (100.0%) | 224 (100.0%) |
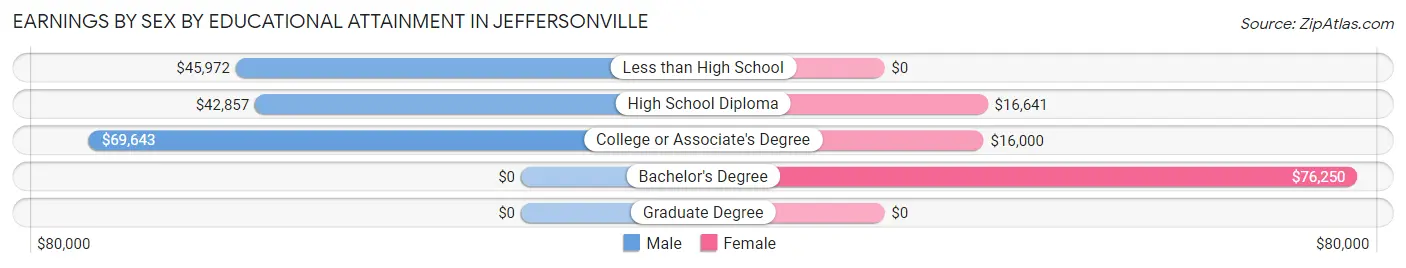
Earnings by Sex by Educational Attainment in Jeffersonville
Average earnings in Jeffersonville are $45,139 for men and $16,683 for women, a difference of 63.0%. Men with an educational attainment of college or associate's degree enjoy the highest average annual earnings of $69,643, while those with high school diploma education earn the least with $42,857. Women with an educational attainment of bachelor's degree earn the most with the average annual earnings of $76,250, while those with college or associate's degree education have the smallest earnings of $16,000.
| Educational Attainment | Male Income | Female Income |
| Less than High School | $45,972 | $0 |
| High School Diploma | $42,857 | $16,641 |
| College or Associate's Degree | $69,643 | $16,000 |
| Bachelor's Degree | - | - |
| Graduate Degree | - | - |
| Total | $45,139 | $16,683 |
Family Income in Jeffersonville
Family Income Brackets in Jeffersonville
According to the Jeffersonville family income data, there are 54 families falling into the $50,000 to $74,999 income range, which is the most common income bracket and makes up 19.1% of all families.
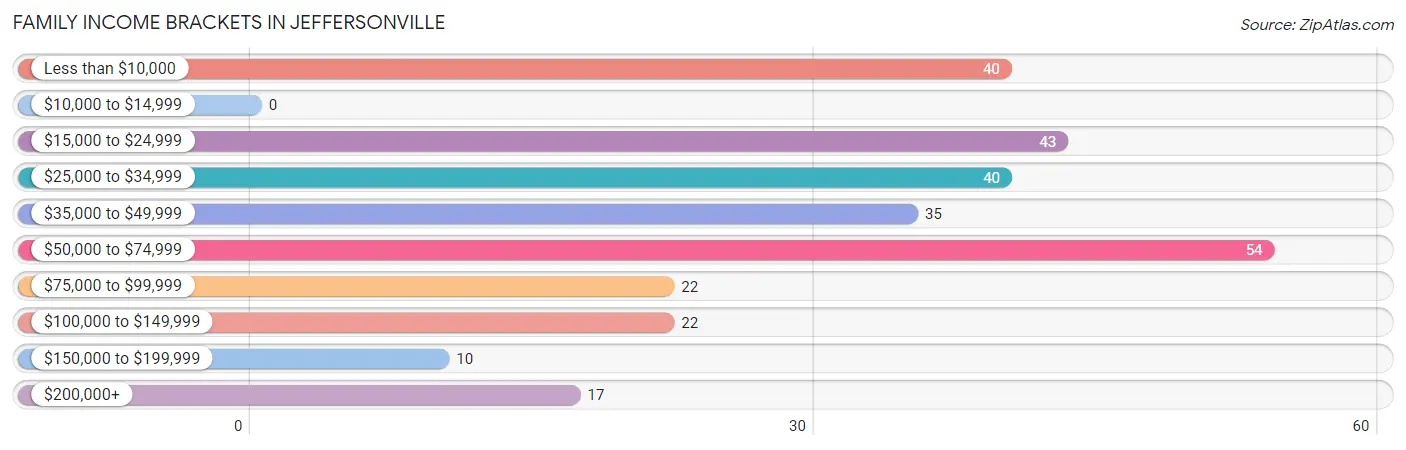
| Income Bracket | # Families | % Families |
| Less than $10,000 | 40 | 14.1% |
| $10,000 to $14,999 | 0 | 0.0% |
| $15,000 to $24,999 | 43 | 15.2% |
| $25,000 to $34,999 | 40 | 14.1% |
| $35,000 to $49,999 | 35 | 12.4% |
| $50,000 to $74,999 | 54 | 19.1% |
| $75,000 to $99,999 | 22 | 7.8% |
| $100,000 to $149,999 | 22 | 7.8% |
| $150,000 to $199,999 | 10 | 3.5% |
| $200,000+ | 17 | 6.0% |
Family Income by Famaliy Size in Jeffersonville
3-person families (68 | 24.0%) account for the highest median family income in Jeffersonville with $50,833 per family, while 2-person families (130 | 45.9%) have the highest median income of $23,194 per family member.
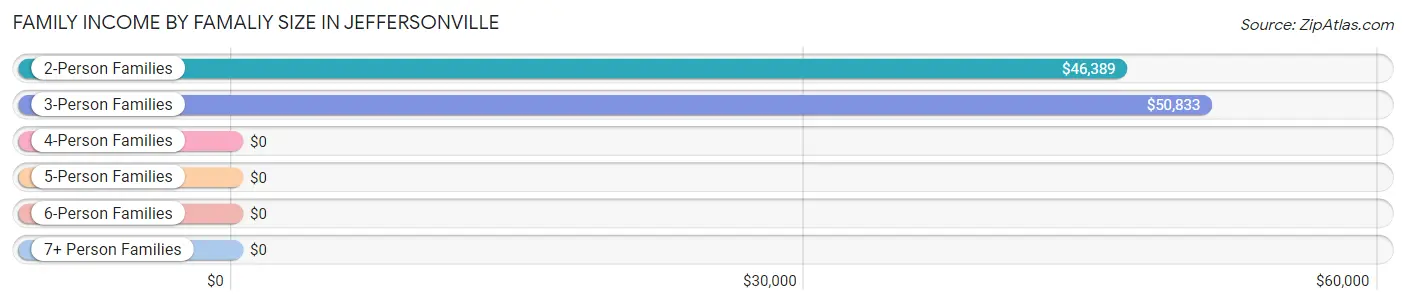
| Income Bracket | # Families | Median Income |
| 2-Person Families | 130 (45.9%) | $46,389 |
| 3-Person Families | 68 (24.0%) | $50,833 |
| 4-Person Families | 52 (18.4%) | $0 |
| 5-Person Families | 22 (7.8%) | $0 |
| 6-Person Families | 0 (0.0%) | $0 |
| 7+ Person Families | 11 (3.9%) | $0 |
| Total | 283 (100.0%) | $39,688 |
Family Income by Number of Earners in Jeffersonville
The median family income in Jeffersonville is $39,688, with families comprising 3+ earners (13) having the highest median family income of $137,917, while families with 1 earner (108) have the lowest median family income of $24,625, accounting for 4.6% and 38.2% of families, respectively.
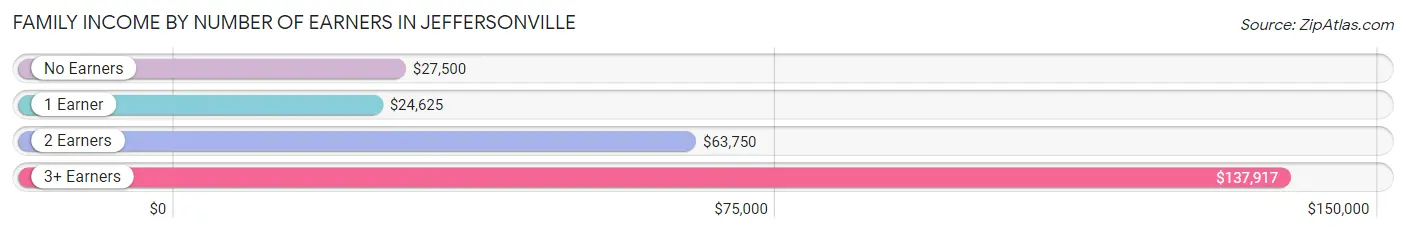
| Number of Earners | # Families | Median Income |
| No Earners | 56 (19.8%) | $27,500 |
| 1 Earner | 108 (38.2%) | $24,625 |
| 2 Earners | 106 (37.5%) | $63,750 |
| 3+ Earners | 13 (4.6%) | $137,917 |
| Total | 283 (100.0%) | $39,688 |
Household Income in Jeffersonville
Household Income Brackets in Jeffersonville
With 94 households falling in the category, the $50,000 to $74,999 income range is the most frequent in Jeffersonville, accounting for 20.6% of all households. In contrast, only 10 households (2.2%) fall into the $150,000 to $199,999 income bracket, making it the least populous group.
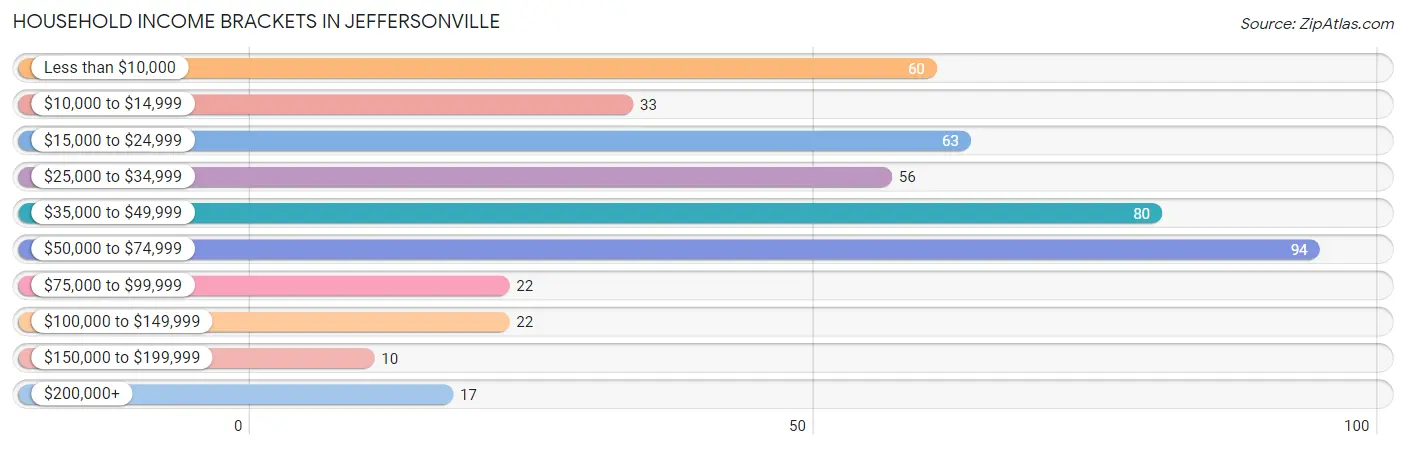
| Income Bracket | # Households | % Households |
| Less than $10,000 | 60 | 13.1% |
| $10,000 to $14,999 | 33 | 7.2% |
| $15,000 to $24,999 | 63 | 13.8% |
| $25,000 to $34,999 | 56 | 12.3% |
| $35,000 to $49,999 | 80 | 17.5% |
| $50,000 to $74,999 | 94 | 20.6% |
| $75,000 to $99,999 | 22 | 4.8% |
| $100,000 to $149,999 | 22 | 4.8% |
| $150,000 to $199,999 | 10 | 2.2% |
| $200,000+ | 17 | 3.7% |
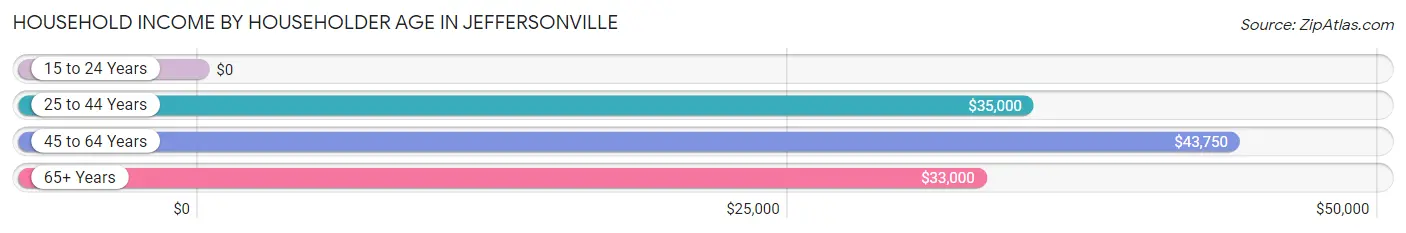
Household Income by Householder Age in Jeffersonville
The median household income in Jeffersonville is $38,438, with the highest median household income of $43,750 found in the 45 to 64 years age bracket for the primary householder. A total of 184 households (40.3%) fall into this category. Meanwhile, the 15 to 24 years age bracket for the primary householder has the lowest median household income of $0, with 31 households (6.8%) in this group.
| Income Bracket | # Households | Median Income |
| 15 to 24 Years | 31 (6.8%) | $0 |
| 25 to 44 Years | 142 (31.1%) | $35,000 |
| 45 to 64 Years | 184 (40.3%) | $43,750 |
| 65+ Years | 100 (21.9%) | $33,000 |
| Total | 457 (100.0%) | $38,438 |
Poverty in Jeffersonville
Income Below Poverty by Sex and Age in Jeffersonville
With 23.6% poverty level for males and 49.8% for females among the residents of Jeffersonville, 6 to 11 year old males and 16 and 17 year old females are the most vulnerable to poverty, with 56 males (90.3%) and 6 females (100.0%) in their respective age groups living below the poverty level.
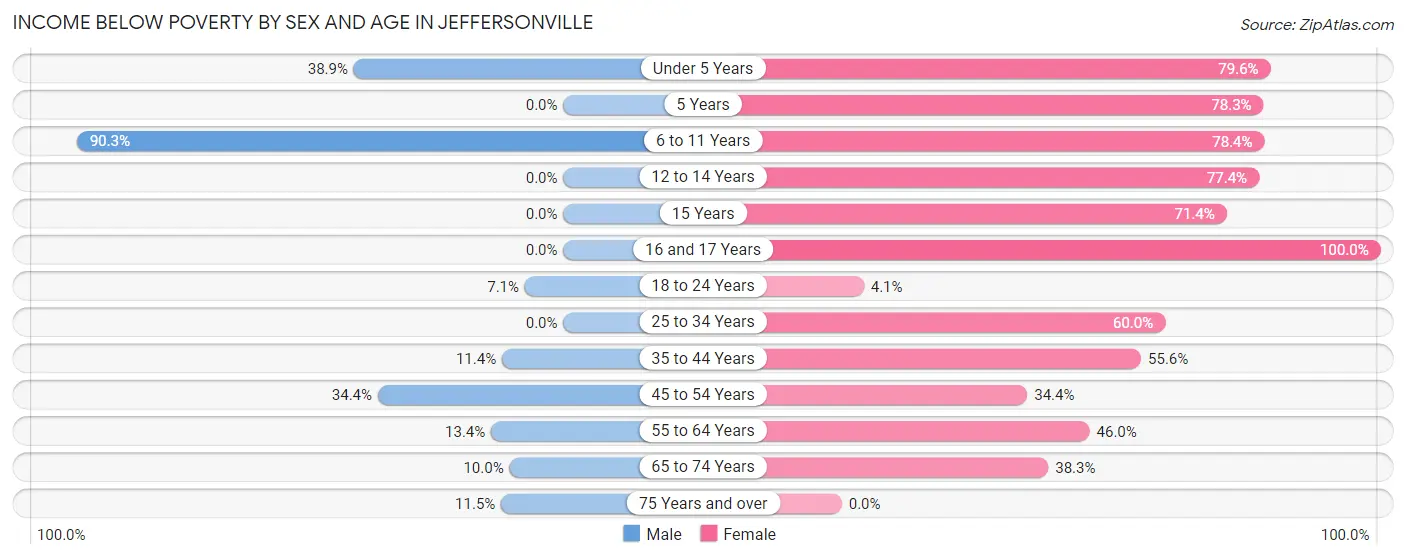
| Age Bracket | Male | Female |
| Under 5 Years | 14 (38.9%) | 35 (79.5%) |
| 5 Years | 0 (0.0%) | 18 (78.3%) |
| 6 to 11 Years | 56 (90.3%) | 40 (78.4%) |
| 12 to 14 Years | 0 (0.0%) | 24 (77.4%) |
| 15 Years | 0 (0.0%) | 10 (71.4%) |
| 16 and 17 Years | 0 (0.0%) | 6 (100.0%) |
| 18 to 24 Years | 5 (7.1%) | 2 (4.1%) |
| 25 to 34 Years | 0 (0.0%) | 42 (60.0%) |
| 35 to 44 Years | 9 (11.4%) | 25 (55.6%) |
| 45 to 54 Years | 21 (34.4%) | 31 (34.4%) |
| 55 to 64 Years | 11 (13.4%) | 23 (46.0%) |
| 65 to 74 Years | 3 (10.0%) | 23 (38.3%) |
| 75 Years and over | 3 (11.5%) | 0 (0.0%) |
| Total | 122 (23.6%) | 279 (49.8%) |
Income Above Poverty by Sex and Age in Jeffersonville
According to the poverty statistics in Jeffersonville, males aged 5 years and females aged 75 years and over are the age groups that are most secure financially, with 100.0% of males and 100.0% of females in these age groups living above the poverty line.
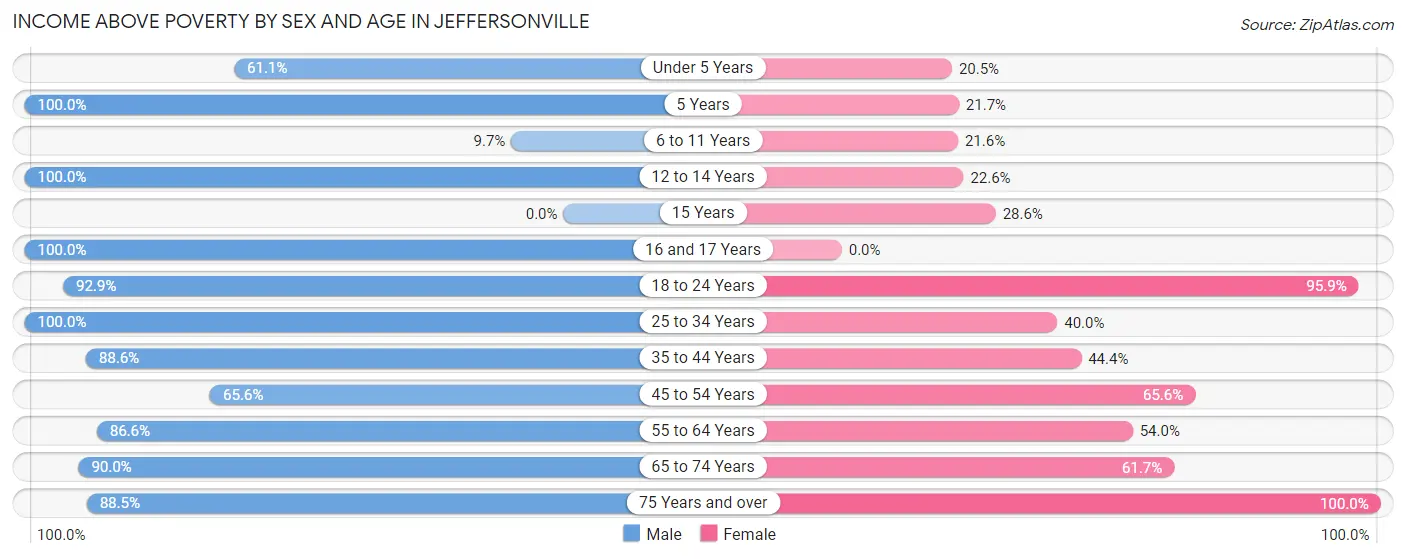
| Age Bracket | Male | Female |
| Under 5 Years | 22 (61.1%) | 9 (20.4%) |
| 5 Years | 20 (100.0%) | 5 (21.7%) |
| 6 to 11 Years | 6 (9.7%) | 11 (21.6%) |
| 12 to 14 Years | 11 (100.0%) | 7 (22.6%) |
| 15 Years | 0 (0.0%) | 4 (28.6%) |
| 16 and 17 Years | 2 (100.0%) | 0 (0.0%) |
| 18 to 24 Years | 65 (92.9%) | 47 (95.9%) |
| 25 to 34 Years | 37 (100.0%) | 28 (40.0%) |
| 35 to 44 Years | 70 (88.6%) | 20 (44.4%) |
| 45 to 54 Years | 40 (65.6%) | 59 (65.6%) |
| 55 to 64 Years | 71 (86.6%) | 27 (54.0%) |
| 65 to 74 Years | 27 (90.0%) | 37 (61.7%) |
| 75 Years and over | 23 (88.5%) | 27 (100.0%) |
| Total | 394 (76.4%) | 281 (50.2%) |
Income Below Poverty Among Married-Couple Families in Jeffersonville
The poverty statistics for married-couple families in Jeffersonville show that 10.4% or 14 of the total 135 families live below the poverty line. Families with 3 or 4 children have the highest poverty rate of 78.6%, comprising of 11 families. On the other hand, families with no children have the lowest poverty rate of 0.0%, which includes 0 families.
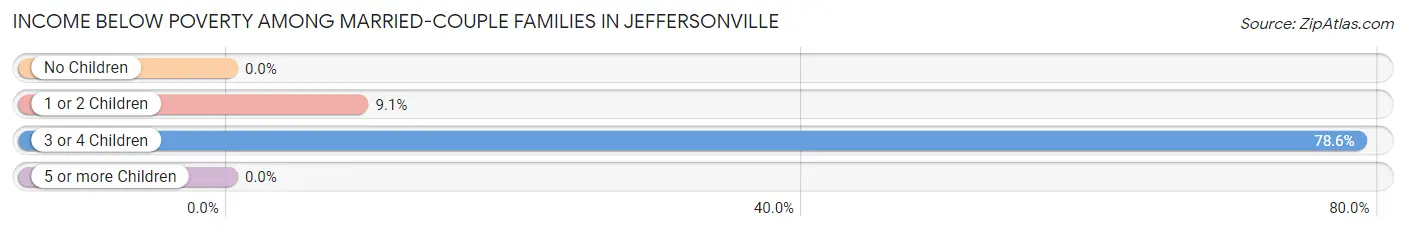
| Children | Above Poverty | Below Poverty |
| No Children | 88 (100.0%) | 0 (0.0%) |
| 1 or 2 Children | 30 (90.9%) | 3 (9.1%) |
| 3 or 4 Children | 3 (21.4%) | 11 (78.6%) |
| 5 or more Children | 0 (0.0%) | 0 (0.0%) |
| Total | 121 (89.6%) | 14 (10.4%) |
Income Below Poverty Among Single-Parent Households in Jeffersonville
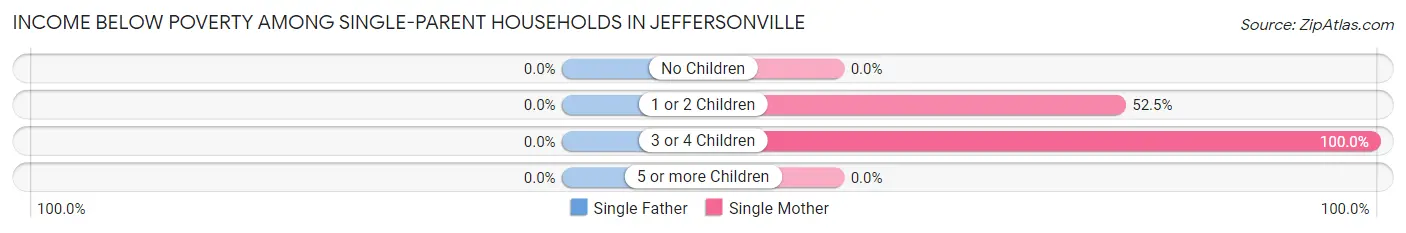
| Children | Single Father | Single Mother |
| No Children | 0 (0.0%) | 0 (0.0%) |
| 1 or 2 Children | 0 (0.0%) | 32 (52.5%) |
| 3 or 4 Children | 0 (0.0%) | 37 (100.0%) |
| 5 or more Children | 0 (0.0%) | 0 (0.0%) |
| Total | 0 (0.0%) | 69 (63.3%) |
Income Below Poverty Among Married-Couple vs Single-Parent Households in Jeffersonville
The poverty data for Jeffersonville shows that 14 of the married-couple family households (10.4%) and 69 of the single-parent households (46.6%) are living below the poverty level. Within the married-couple family households, those with 3 or 4 children have the highest poverty rate, with 11 households (78.6%) falling below the poverty line. Among the single-parent households, those with 3 or 4 children have the highest poverty rate, with 37 household (100.0%) living below poverty.
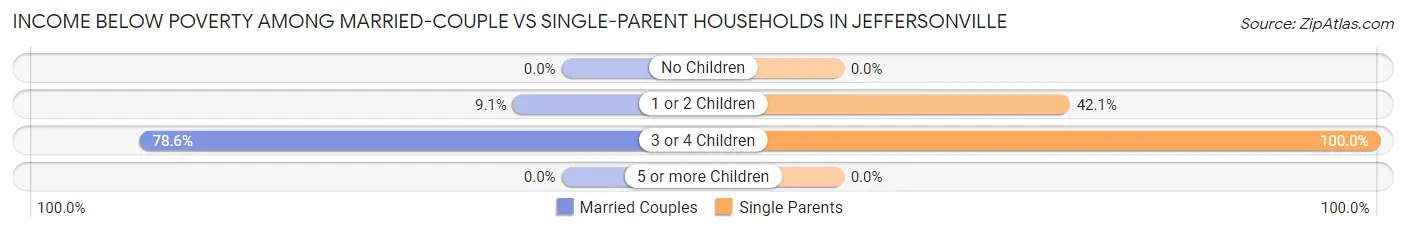
| Children | Married-Couple Families | Single-Parent Households |
| No Children | 0 (0.0%) | 0 (0.0%) |
| 1 or 2 Children | 3 (9.1%) | 32 (42.1%) |
| 3 or 4 Children | 11 (78.6%) | 37 (100.0%) |
| 5 or more Children | 0 (0.0%) | 0 (0.0%) |
| Total | 14 (10.4%) | 69 (46.6%) |
Race in Jeffersonville
The most populous races in Jeffersonville are White / Caucasian (1,017 | 93.7%), Two or more Races (52 | 4.8%), and Hispanic or Latino (21 | 1.9%).
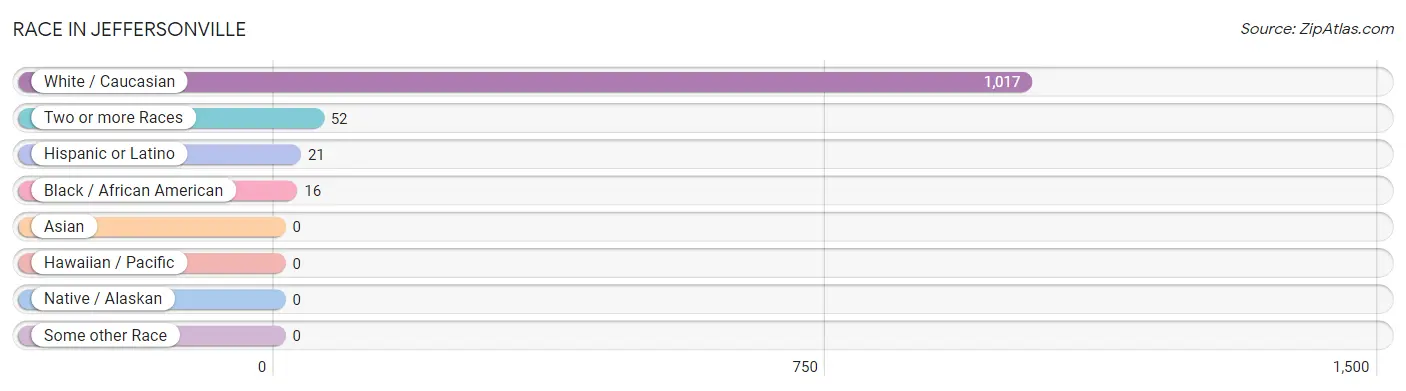
| Race | # Population | % Population |
| Asian | 0 | 0.0% |
| Black / African American | 16 | 1.5% |
| Hawaiian / Pacific | 0 | 0.0% |
| Hispanic or Latino | 21 | 1.9% |
| Native / Alaskan | 0 | 0.0% |
| White / Caucasian | 1,017 | 93.7% |
| Two or more Races | 52 | 4.8% |
| Some other Race | 0 | 0.0% |
| Total | 1,085 | 100.0% |
Ancestry in Jeffersonville
The most populous ancestries reported in Jeffersonville are German (174 | 16.0%), American (127 | 11.7%), Irish (112 | 10.3%), English (85 | 7.8%), and Italian (54 | 5.0%), together accounting for 50.9% of all Jeffersonville residents.
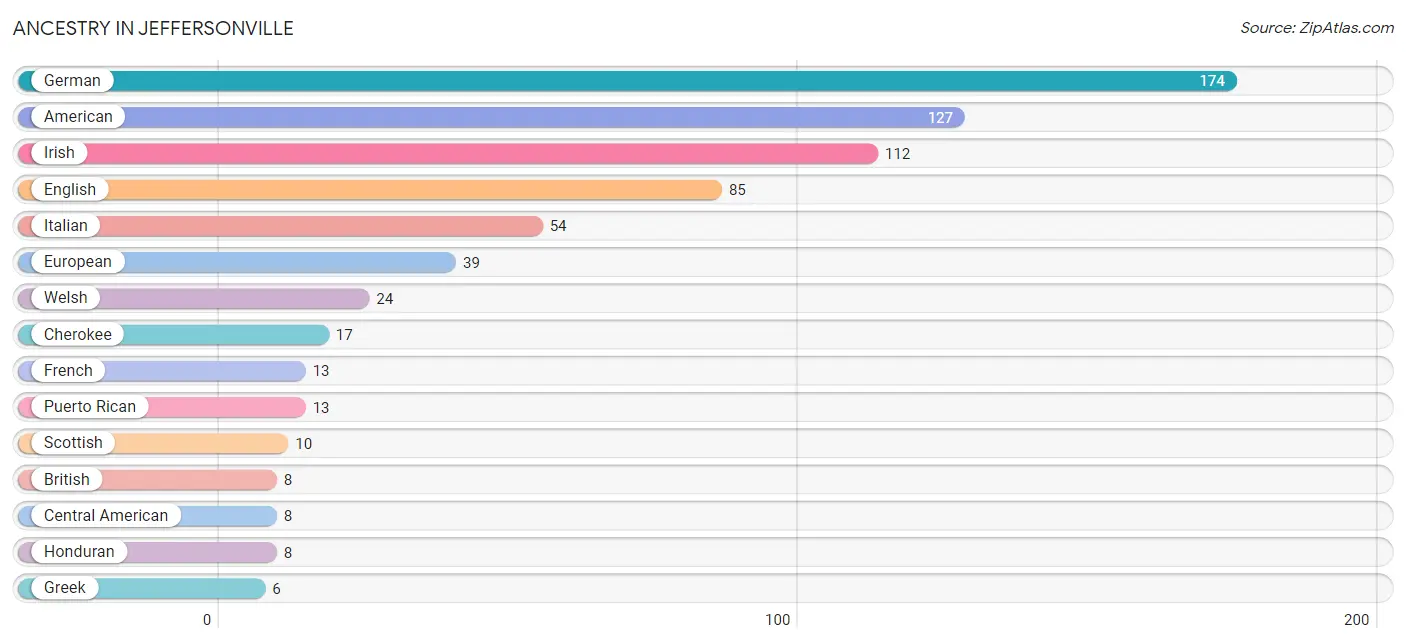
| Ancestry | # Population | % Population |
| American | 127 | 11.7% |
| British | 8 | 0.7% |
| Canadian | 3 | 0.3% |
| Central American | 8 | 0.7% |
| Cherokee | 17 | 1.6% |
| English | 85 | 7.8% |
| European | 39 | 3.6% |
| French | 13 | 1.2% |
| German | 174 | 16.0% |
| Greek | 6 | 0.5% |
| Honduran | 8 | 0.7% |
| Irish | 112 | 10.3% |
| Italian | 54 | 5.0% |
| Polish | 3 | 0.3% |
| Puerto Rican | 13 | 1.2% |
| Scottish | 10 | 0.9% |
| Welsh | 24 | 2.2% | View All 17 Rows |
Immigrants in Jeffersonville
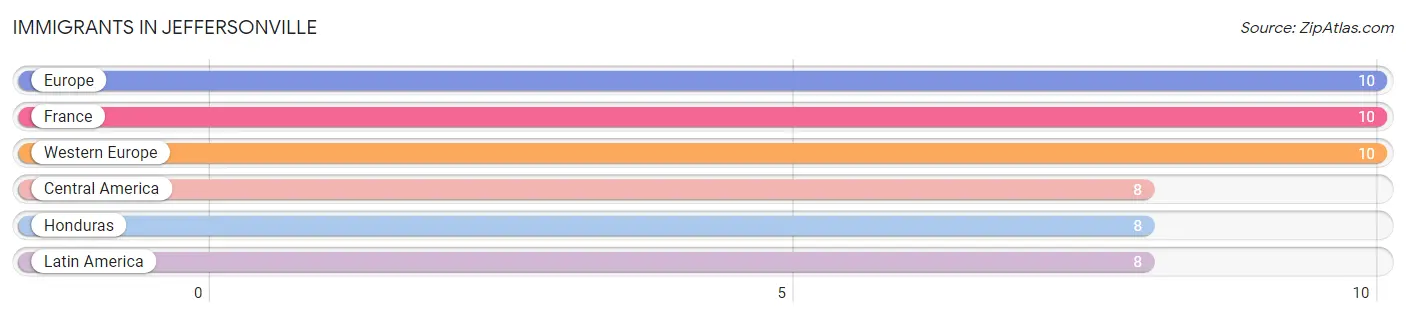
The most numerous immigrant groups reported in Jeffersonville came from Europe (10 | 0.9%), France (10 | 0.9%), Western Europe (10 | 0.9%), Central America (8 | 0.7%), and Honduras (8 | 0.7%), together accounting for 4.2% of all Jeffersonville residents.
| Immigration Origin | # Population | % Population |
| Central America | 8 | 0.7% |
| Europe | 10 | 0.9% |
| France | 10 | 0.9% |
| Honduras | 8 | 0.7% |
| Latin America | 8 | 0.7% |
| Western Europe | 10 | 0.9% | View All 6 Rows |
Sex and Age in Jeffersonville
Sex and Age in Jeffersonville
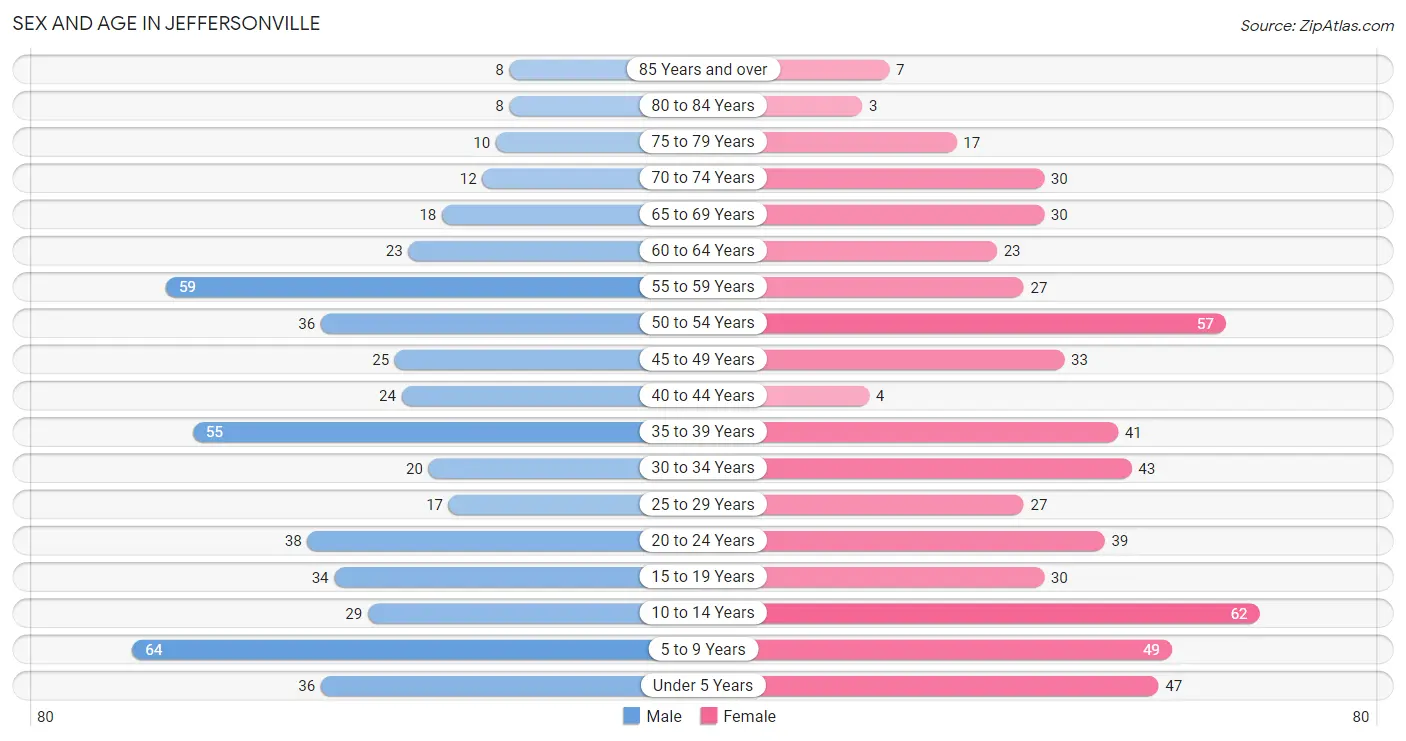
The most populous age groups in Jeffersonville are 5 to 9 Years (64 | 12.4%) for men and 10 to 14 Years (62 | 10.9%) for women.
| Age Bracket | Male | Female |
| Under 5 Years | 36 (7.0%) | 47 (8.3%) |
| 5 to 9 Years | 64 (12.4%) | 49 (8.6%) |
| 10 to 14 Years | 29 (5.6%) | 62 (10.9%) |
| 15 to 19 Years | 34 (6.6%) | 30 (5.3%) |
| 20 to 24 Years | 38 (7.4%) | 39 (6.9%) |
| 25 to 29 Years | 17 (3.3%) | 27 (4.8%) |
| 30 to 34 Years | 20 (3.9%) | 43 (7.6%) |
| 35 to 39 Years | 55 (10.7%) | 41 (7.2%) |
| 40 to 44 Years | 24 (4.6%) | 4 (0.7%) |
| 45 to 49 Years | 25 (4.8%) | 33 (5.8%) |
| 50 to 54 Years | 36 (7.0%) | 57 (10.0%) |
| 55 to 59 Years | 59 (11.4%) | 27 (4.8%) |
| 60 to 64 Years | 23 (4.5%) | 23 (4.0%) |
| 65 to 69 Years | 18 (3.5%) | 30 (5.3%) |
| 70 to 74 Years | 12 (2.3%) | 30 (5.3%) |
| 75 to 79 Years | 10 (1.9%) | 17 (3.0%) |
| 80 to 84 Years | 8 (1.5%) | 3 (0.5%) |
| 85 Years and over | 8 (1.5%) | 7 (1.2%) |
| Total | 516 (100.0%) | 569 (100.0%) |
Families and Households in Jeffersonville
Median Family Size in Jeffersonville
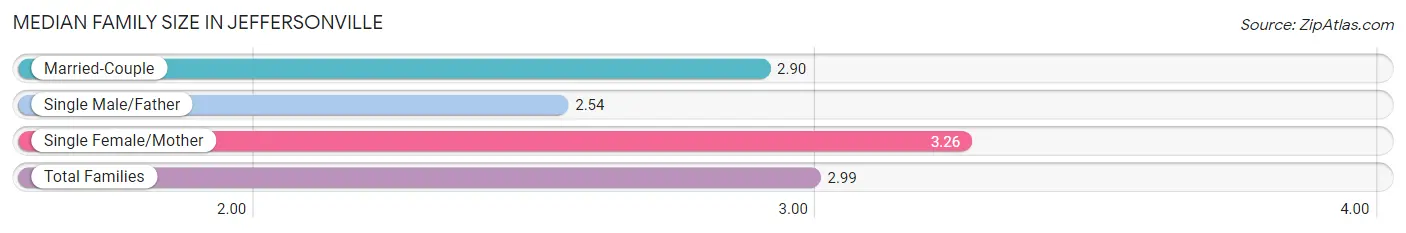
The median family size in Jeffersonville is 2.99 persons per family, with single female/mother families (109 | 38.5%) accounting for the largest median family size of 3.26 persons per family. On the other hand, single male/father families (39 | 13.8%) represent the smallest median family size with 2.54 persons per family.
| Family Type | # Families | Family Size |
| Married-Couple | 135 (47.7%) | 2.90 |
| Single Male/Father | 39 (13.8%) | 2.54 |
| Single Female/Mother | 109 (38.5%) | 3.26 |
| Total Families | 283 (100.0%) | 2.99 |
Median Household Size in Jeffersonville
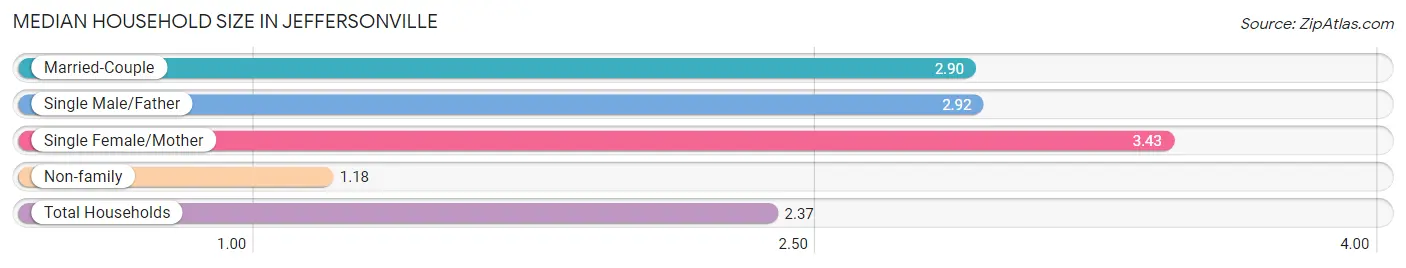
The median household size in Jeffersonville is 2.37 persons per household, with single female/mother households (109 | 23.8%) accounting for the largest median household size of 3.43 persons per household. non-family households (174 | 38.1%) represent the smallest median household size with 1.18 persons per household.
| Household Type | # Households | Household Size |
| Married-Couple | 135 (29.5%) | 2.90 |
| Single Male/Father | 39 (8.5%) | 2.92 |
| Single Female/Mother | 109 (23.8%) | 3.43 |
| Non-family | 174 (38.1%) | 1.18 |
| Total Households | 457 (100.0%) | 2.37 |
Household Size by Marriage Status in Jeffersonville
Out of a total of 457 households in Jeffersonville, 283 (61.9%) are family households, while 174 (38.1%) are nonfamily households. The most numerous type of family households are 2-person households, comprising 118, and the most common type of nonfamily households are 1-person households, comprising 144.
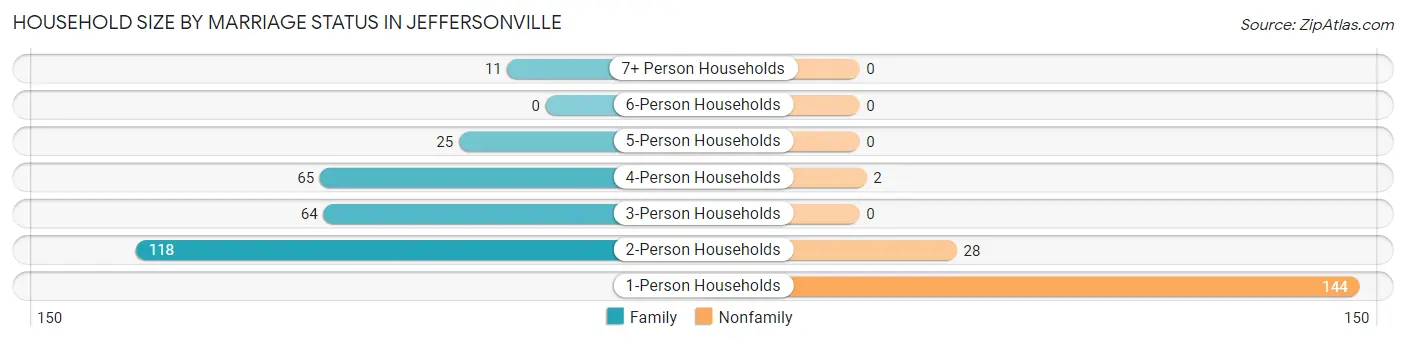
| Household Size | Family Households | Nonfamily Households |
| 1-Person Households | - | 144 (31.5%) |
| 2-Person Households | 118 (25.8%) | 28 (6.1%) |
| 3-Person Households | 64 (14.0%) | 0 (0.0%) |
| 4-Person Households | 65 (14.2%) | 2 (0.4%) |
| 5-Person Households | 25 (5.5%) | 0 (0.0%) |
| 6-Person Households | 0 (0.0%) | 0 (0.0%) |
| 7+ Person Households | 11 (2.4%) | 0 (0.0%) |
| Total | 283 (61.9%) | 174 (38.1%) |
Female Fertility in Jeffersonville
Fertility by Age in Jeffersonville
Average fertility rate in Jeffersonville is 41.0 births per 1,000 women. Women in the age bracket of 20 to 34 years have the highest fertility rate with 55.0 births per 1,000 women. Women in the age bracket of 20 to 34 years acount for 66.7% of all women with births.
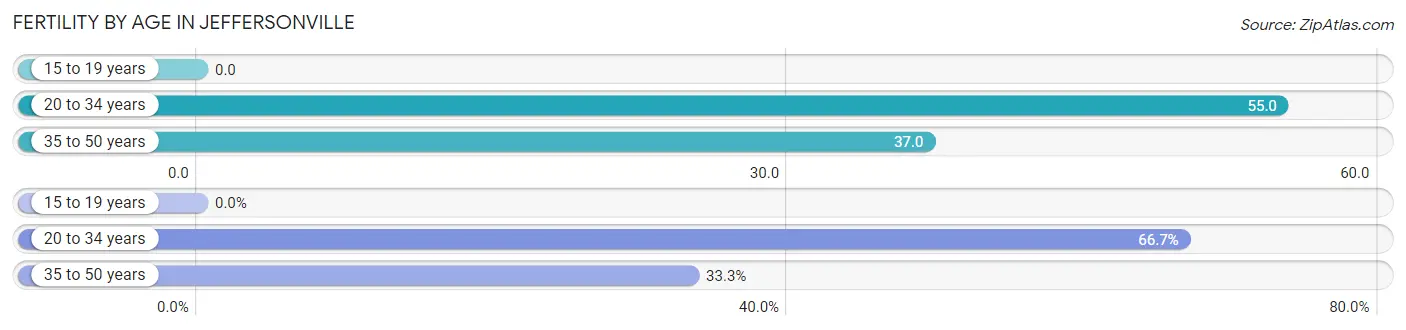
| Age Bracket | Women with Births | Births / 1,000 Women |
| 15 to 19 years | 0 (0.0%) | 0.0 |
| 20 to 34 years | 6 (66.7%) | 55.0 |
| 35 to 50 years | 3 (33.3%) | 37.0 |
| Total | 9 (100.0%) | 41.0 |
Fertility by Age by Marriage Status in Jeffersonville
66.7% of women with births (9) in Jeffersonville are married. The highest percentage of unmarried women with births falls into 20 to 34 years age bracket with 50.0% of them unmarried at the time of birth, while the lowest percentage of unmarried women with births belong to 35 to 50 years age bracket with 0.0% of them unmarried.
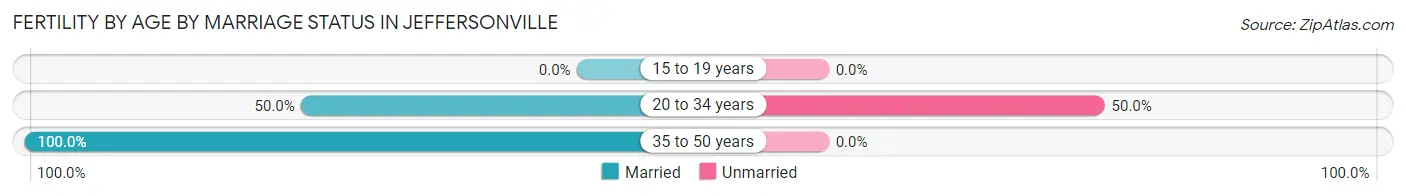
| Age Bracket | Married | Unmarried |
| 15 to 19 years | 0 (0.0%) | 0 (0.0%) |
| 20 to 34 years | 3 (50.0%) | 3 (50.0%) |
| 35 to 50 years | 3 (100.0%) | 0 (0.0%) |
| Total | 6 (66.7%) | 3 (33.3%) |
Fertility by Education in Jeffersonville
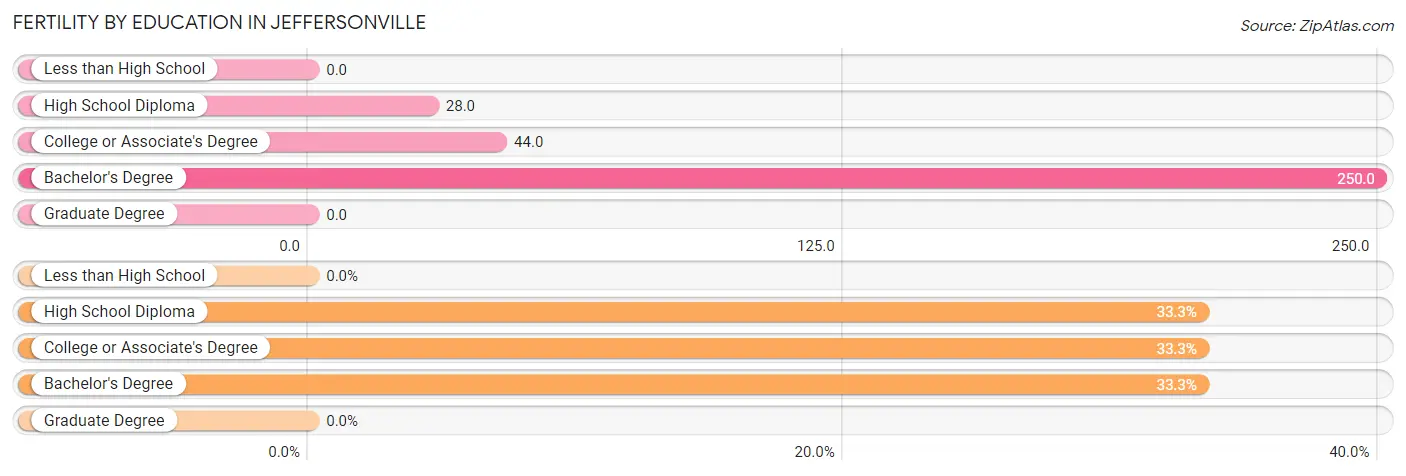
| Educational Attainment | Women with Births | Births / 1,000 Women |
| Less than High School | 0 (0.0%) | 0.0 |
| High School Diploma | 3 (33.3%) | 28.0 |
| College or Associate's Degree | 3 (33.3%) | 44.0 |
| Bachelor's Degree | 3 (33.3%) | 250.0 |
| Graduate Degree | 0 (0.0%) | 0.0 |
| Total | 9 (100.0%) | 41.0 |
Fertility by Education by Marriage Status in Jeffersonville
33.3% of women with births in Jeffersonville are unmarried. Women with the educational attainment of high school diploma are most likely to be married with 100.0% of them married at childbirth, while women with the educational attainment of college or associate's degree are least likely to be married with 100.0% of them unmarried at childbirth.
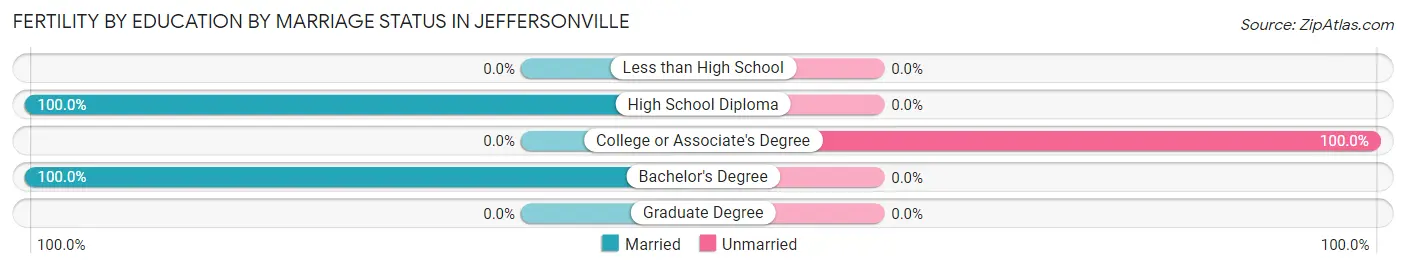
| Educational Attainment | Married | Unmarried |
| Less than High School | 0 (0.0%) | 0 (0.0%) |
| High School Diploma | 3 (100.0%) | 0 (0.0%) |
| College or Associate's Degree | 0 (0.0%) | 3 (100.0%) |
| Bachelor's Degree | 3 (100.0%) | 0 (0.0%) |
| Graduate Degree | 0 (0.0%) | 0 (0.0%) |
| Total | 6 (66.7%) | 3 (33.3%) |
Employment Characteristics in Jeffersonville
Employment by Class of Employer in Jeffersonville
Among the 398 employed individuals in Jeffersonville, private company employees (325 | 81.7%), not-for-profit organizations (24 | 6.0%), and state government employees (23 | 5.8%) make up the most common classes of employment.
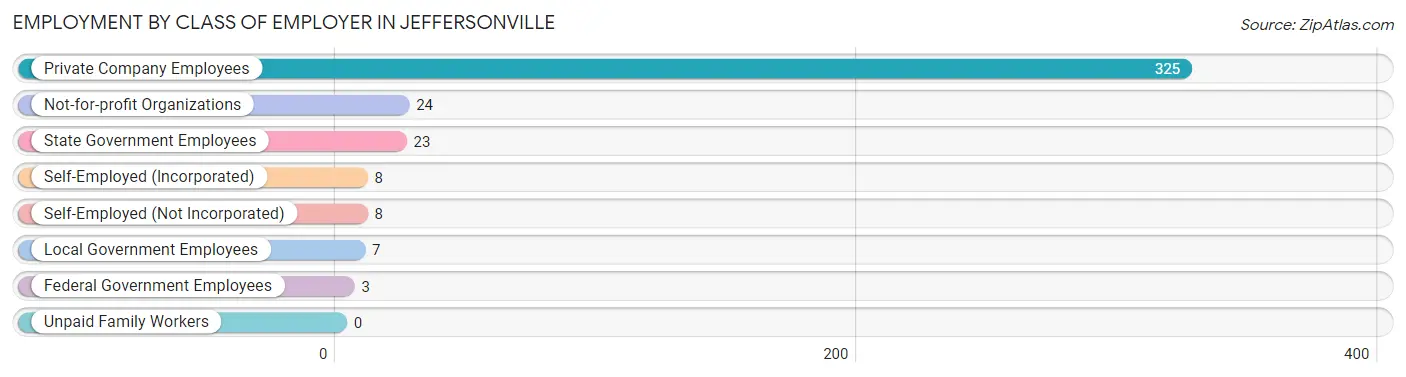
| Employer Class | # Employees | % Employees |
| Private Company Employees | 325 | 81.7% |
| Self-Employed (Incorporated) | 8 | 2.0% |
| Self-Employed (Not Incorporated) | 8 | 2.0% |
| Not-for-profit Organizations | 24 | 6.0% |
| Local Government Employees | 7 | 1.8% |
| State Government Employees | 23 | 5.8% |
| Federal Government Employees | 3 | 0.7% |
| Unpaid Family Workers | 0 | 0.0% |
| Total | 398 | 100.0% |
Employment Status by Age in Jeffersonville
According to the labor force statistics for Jeffersonville, out of the total population over 16 years of age (784), 57.7% or 452 individuals are in the labor force, with 8.9% or 40 of them unemployed. The age group with the highest labor force participation rate is 20 to 24 years, with 96.1% or 74 individuals in the labor force. Within the labor force, the 16 to 19 years age range has the highest percentage of unemployed individuals, with 64.3% or 18 of them being unemployed.
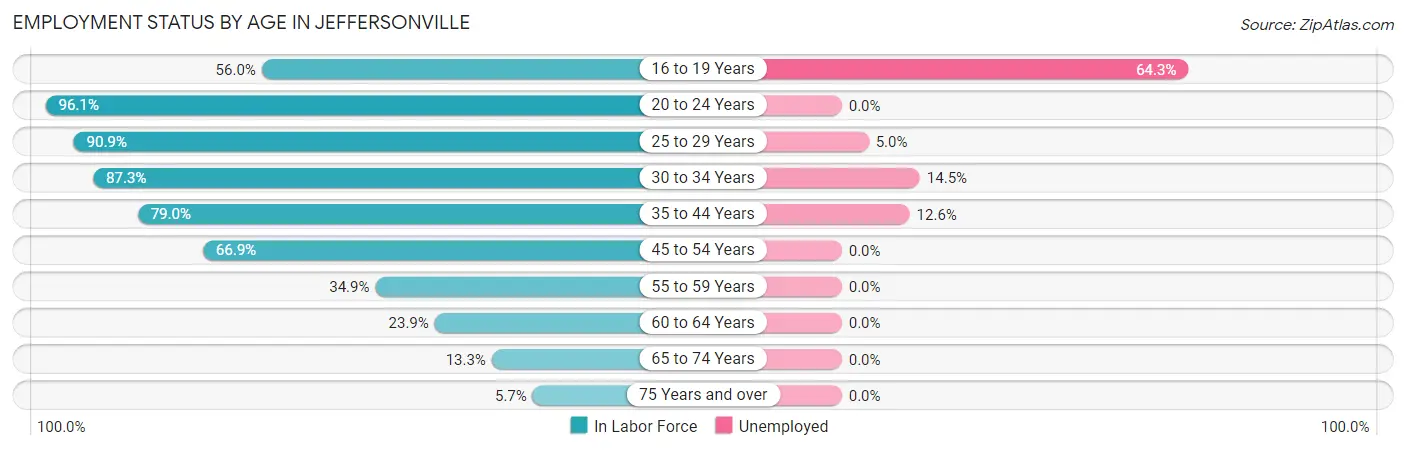
| Age Bracket | In Labor Force | Unemployed |
| 16 to 19 Years | 28 (56.0%) | 18 (64.3%) |
| 20 to 24 Years | 74 (96.1%) | 0 (0.0%) |
| 25 to 29 Years | 40 (90.9%) | 2 (5.0%) |
| 30 to 34 Years | 55 (87.3%) | 8 (14.5%) |
| 35 to 44 Years | 98 (79.0%) | 12 (12.6%) |
| 45 to 54 Years | 101 (66.9%) | 0 (0.0%) |
| 55 to 59 Years | 30 (34.9%) | 0 (0.0%) |
| 60 to 64 Years | 11 (23.9%) | 0 (0.0%) |
| 65 to 74 Years | 12 (13.3%) | 0 (0.0%) |
| 75 Years and over | 3 (5.7%) | 0 (0.0%) |
| Total | 452 (57.7%) | 40 (8.9%) |
Employment Status by Educational Attainment in Jeffersonville
According to labor force statistics for Jeffersonville, 65.2% of individuals (335) out of the total population between 25 and 64 years of age (514) are in the labor force, with 6.6% or 22 of them being unemployed. The group with the highest labor force participation rate are those with the educational attainment of bachelor's degree or higher, with 100.0% or 25 individuals in the labor force. Within the labor force, individuals with less than high school education have the highest percentage of unemployment, with 25.7% or 9 of them being unemployed.
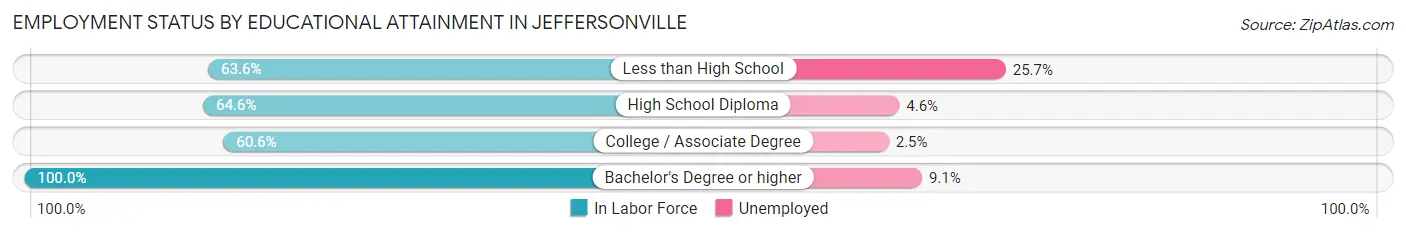
| Educational Attainment | In Labor Force | Unemployed |
| Less than High School | 35 (63.6%) | 14 (25.7%) |
| High School Diploma | 195 (64.6%) | 14 (4.6%) |
| College / Associate Degree | 80 (60.6%) | 3 (2.5%) |
| Bachelor's Degree or higher | 25 (100.0%) | 2 (9.1%) |
| Total | 335 (65.2%) | 34 (6.6%) |
Employment Occupations by Sex in Jeffersonville
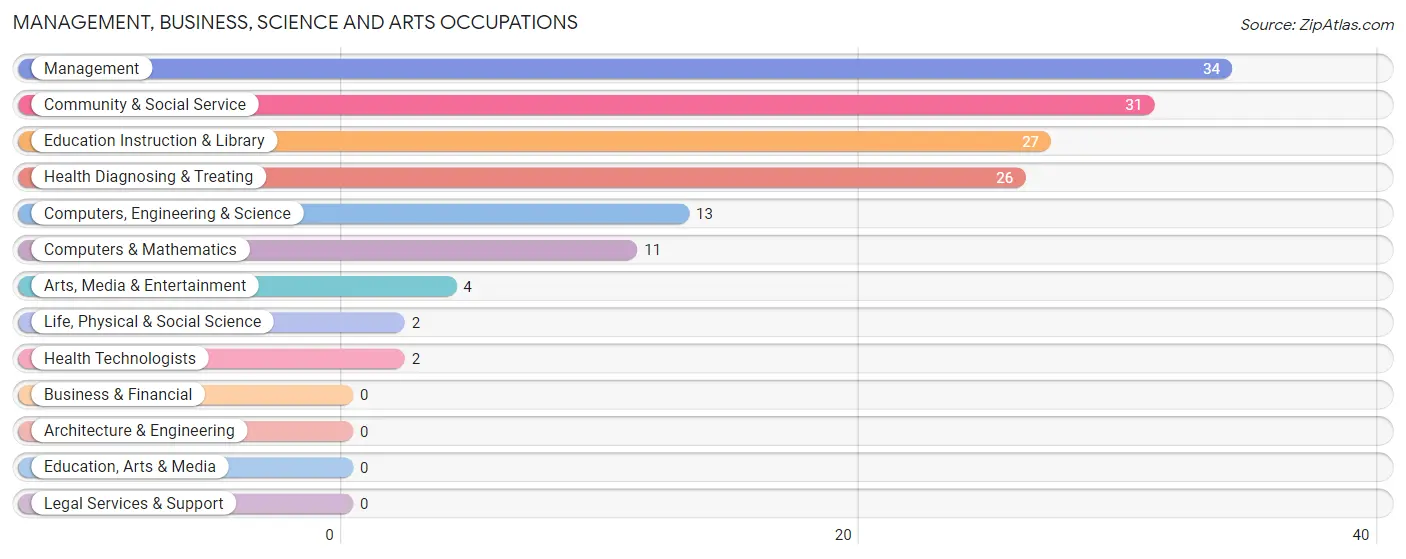
Management, Business, Science and Arts Occupations
The most common Management, Business, Science and Arts occupations in Jeffersonville are Management (34 | 8.3%), Community & Social Service (31 | 7.6%), Education Instruction & Library (27 | 6.6%), Health Diagnosing & Treating (26 | 6.4%), and Computers, Engineering & Science (13 | 3.2%).
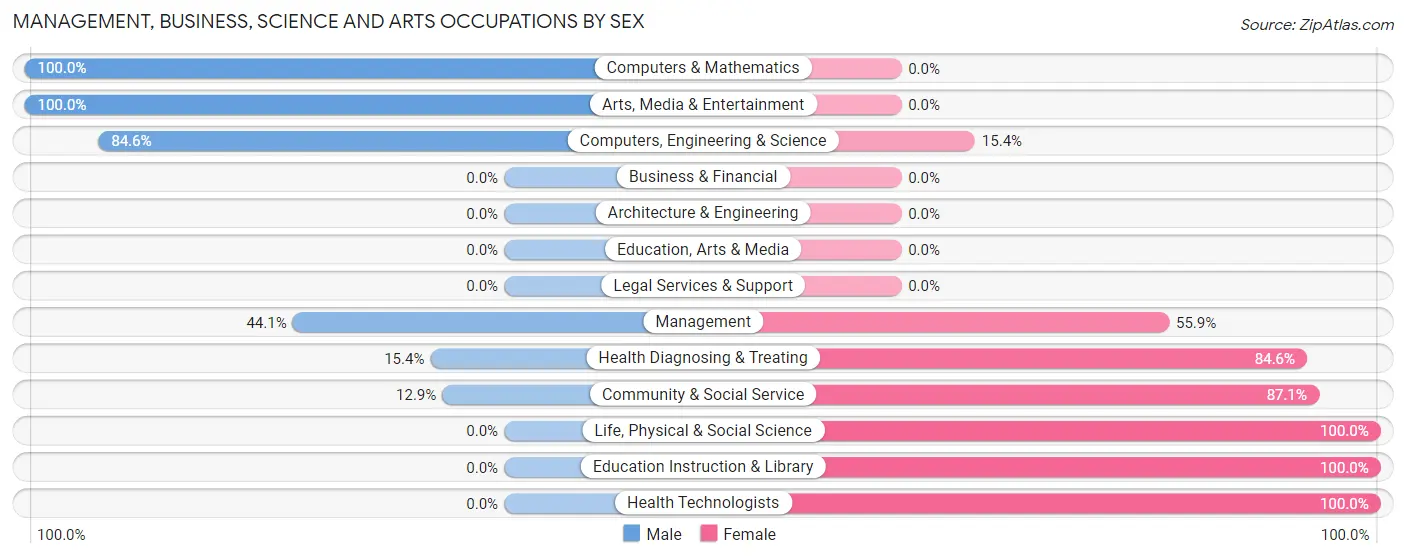
Management, Business, Science and Arts Occupations by Sex
Within the Management, Business, Science and Arts occupations in Jeffersonville, the most male-oriented occupations are Computers & Mathematics (100.0%), Arts, Media & Entertainment (100.0%), and Computers, Engineering & Science (84.6%), while the most female-oriented occupations are Life, Physical & Social Science (100.0%), Education Instruction & Library (100.0%), and Health Technologists (100.0%).
| Occupation | Male | Female |
| Management | 15 (44.1%) | 19 (55.9%) |
| Business & Financial | 0 (0.0%) | 0 (0.0%) |
| Computers, Engineering & Science | 11 (84.6%) | 2 (15.4%) |
| Computers & Mathematics | 11 (100.0%) | 0 (0.0%) |
| Architecture & Engineering | 0 (0.0%) | 0 (0.0%) |
| Life, Physical & Social Science | 0 (0.0%) | 2 (100.0%) |
| Community & Social Service | 4 (12.9%) | 27 (87.1%) |
| Education, Arts & Media | 0 (0.0%) | 0 (0.0%) |
| Legal Services & Support | 0 (0.0%) | 0 (0.0%) |
| Education Instruction & Library | 0 (0.0%) | 27 (100.0%) |
| Arts, Media & Entertainment | 4 (100.0%) | 0 (0.0%) |
| Health Diagnosing & Treating | 4 (15.4%) | 22 (84.6%) |
| Health Technologists | 0 (0.0%) | 2 (100.0%) |
| Total (Category) | 34 (32.7%) | 70 (67.3%) |
| Total (Overall) | 221 (54.0%) | 188 (46.0%) |
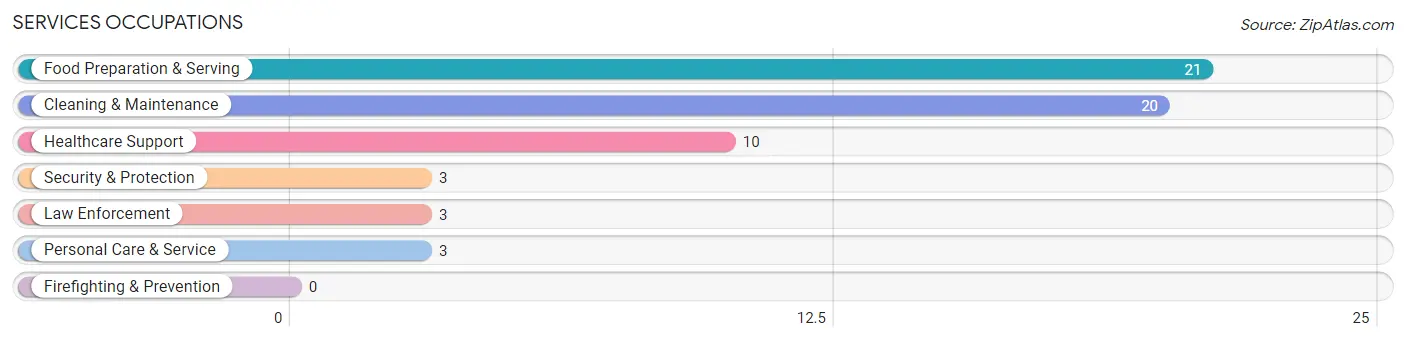
Services Occupations
The most common Services occupations in Jeffersonville are Food Preparation & Serving (21 | 5.1%), Cleaning & Maintenance (20 | 4.9%), Healthcare Support (10 | 2.4%), Security & Protection (3 | 0.7%), and Law Enforcement (3 | 0.7%).
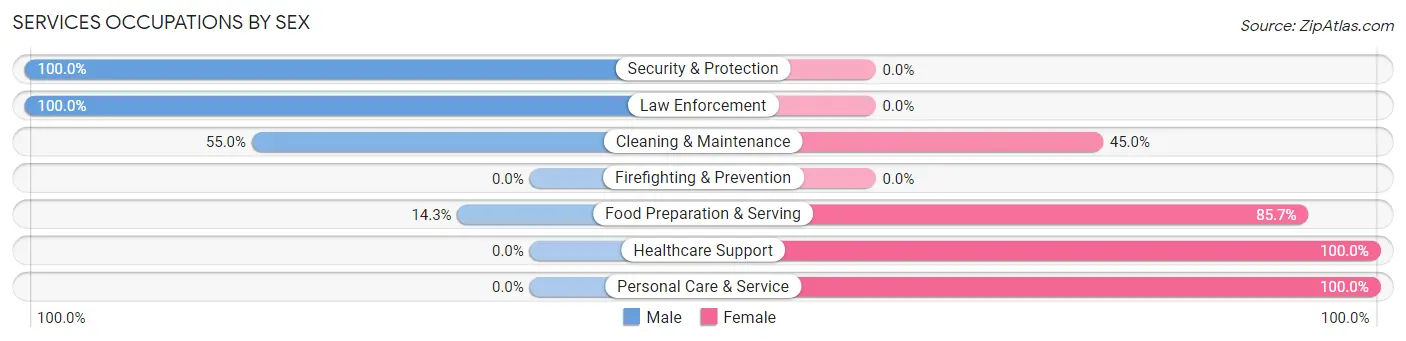
Services Occupations by Sex
Within the Services occupations in Jeffersonville, the most male-oriented occupations are Security & Protection (100.0%), Law Enforcement (100.0%), and Cleaning & Maintenance (55.0%), while the most female-oriented occupations are Healthcare Support (100.0%), Personal Care & Service (100.0%), and Food Preparation & Serving (85.7%).
| Occupation | Male | Female |
| Healthcare Support | 0 (0.0%) | 10 (100.0%) |
| Security & Protection | 3 (100.0%) | 0 (0.0%) |
| Firefighting & Prevention | 0 (0.0%) | 0 (0.0%) |
| Law Enforcement | 3 (100.0%) | 0 (0.0%) |
| Food Preparation & Serving | 3 (14.3%) | 18 (85.7%) |
| Cleaning & Maintenance | 11 (55.0%) | 9 (45.0%) |
| Personal Care & Service | 0 (0.0%) | 3 (100.0%) |
| Total (Category) | 17 (29.8%) | 40 (70.2%) |
| Total (Overall) | 221 (54.0%) | 188 (46.0%) |
Sales and Office Occupations
The most common Sales and Office occupations in Jeffersonville are Sales & Related (27 | 6.6%), and Office & Administration (18 | 4.4%).

Sales and Office Occupations by Sex
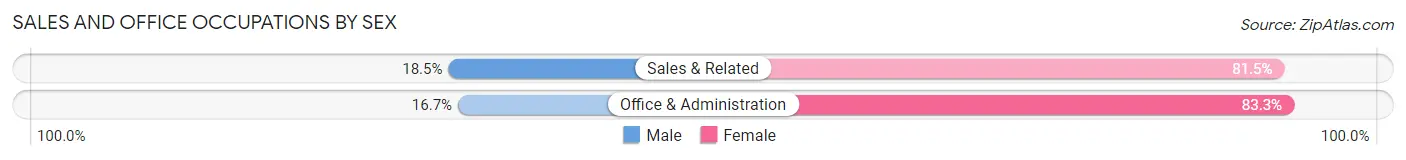
| Occupation | Male | Female |
| Sales & Related | 5 (18.5%) | 22 (81.5%) |
| Office & Administration | 3 (16.7%) | 15 (83.3%) |
| Total (Category) | 8 (17.8%) | 37 (82.2%) |
| Total (Overall) | 221 (54.0%) | 188 (46.0%) |
Natural Resources, Construction and Maintenance Occupations
The most common Natural Resources, Construction and Maintenance occupations in Jeffersonville are Construction & Extraction (31 | 7.6%), Installation, Maintenance & Repair (12 | 2.9%), and Farming, Fishing & Forestry (11 | 2.7%).

Natural Resources, Construction and Maintenance Occupations by Sex
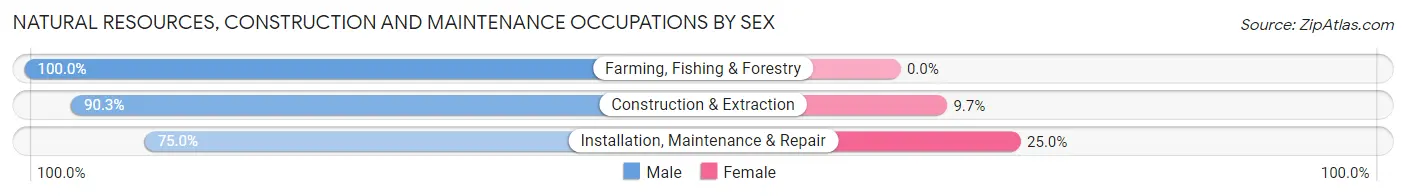
| Occupation | Male | Female |
| Farming, Fishing & Forestry | 11 (100.0%) | 0 (0.0%) |
| Construction & Extraction | 28 (90.3%) | 3 (9.7%) |
| Installation, Maintenance & Repair | 9 (75.0%) | 3 (25.0%) |
| Total (Category) | 48 (88.9%) | 6 (11.1%) |
| Total (Overall) | 221 (54.0%) | 188 (46.0%) |
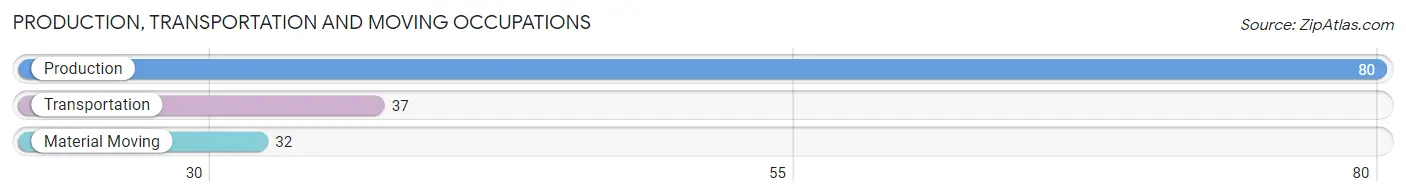
Production, Transportation and Moving Occupations
The most common Production, Transportation and Moving occupations in Jeffersonville are Production (80 | 19.6%), Transportation (37 | 9.0%), and Material Moving (32 | 7.8%).
Production, Transportation and Moving Occupations by Sex
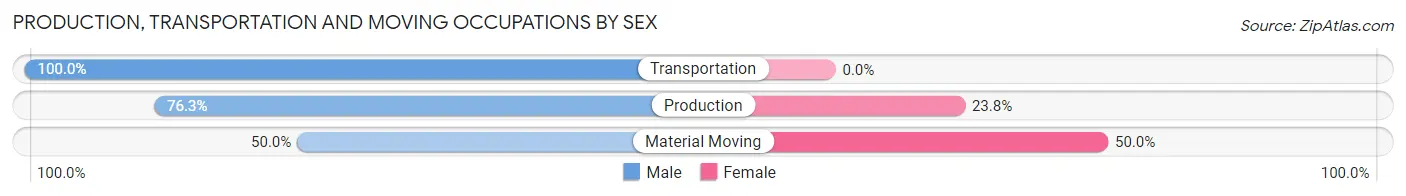
| Occupation | Male | Female |
| Production | 61 (76.2%) | 19 (23.7%) |
| Transportation | 37 (100.0%) | 0 (0.0%) |
| Material Moving | 16 (50.0%) | 16 (50.0%) |
| Total (Category) | 114 (76.5%) | 35 (23.5%) |
| Total (Overall) | 221 (54.0%) | 188 (46.0%) |
Employment Industries by Sex in Jeffersonville
Employment Industries in Jeffersonville
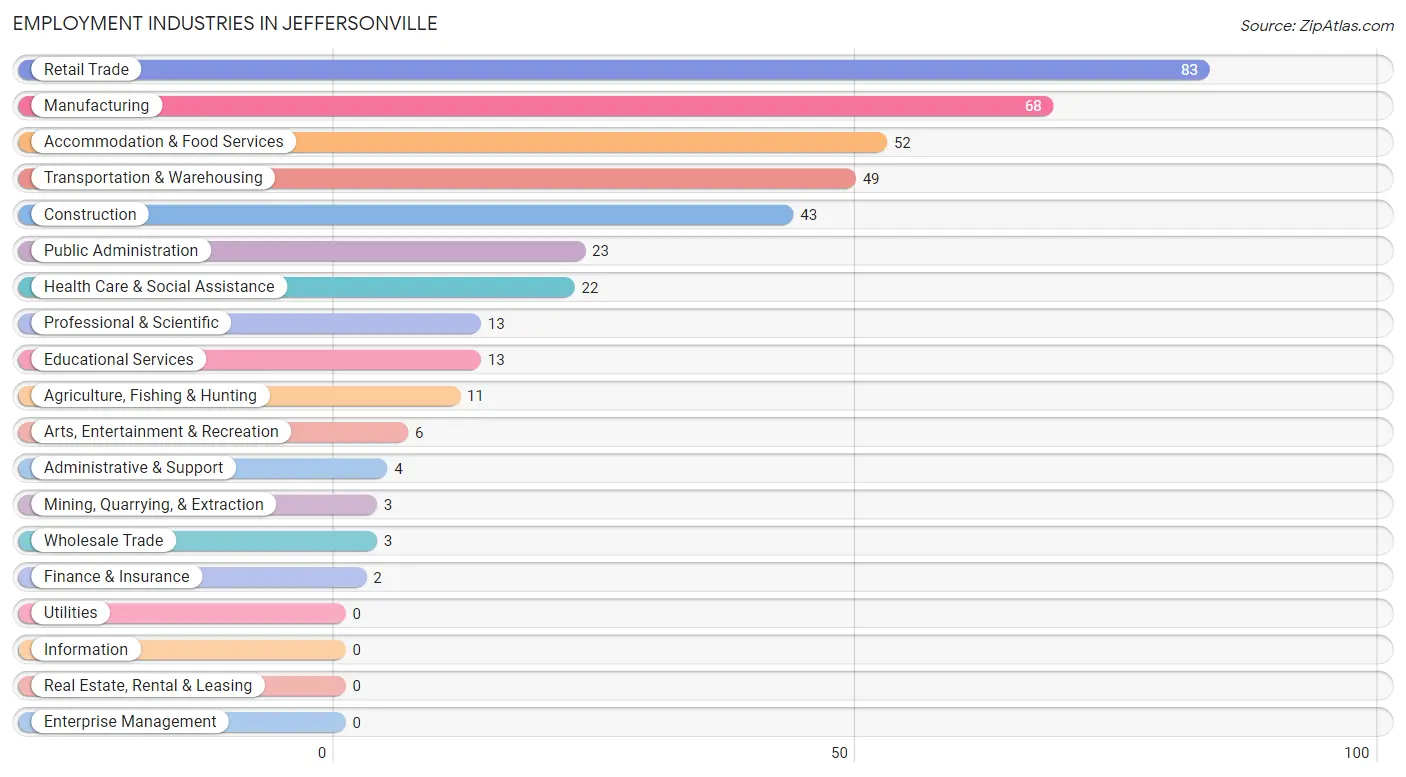
The major employment industries in Jeffersonville include Retail Trade (83 | 20.3%), Manufacturing (68 | 16.6%), Accommodation & Food Services (52 | 12.7%), Transportation & Warehousing (49 | 12.0%), and Construction (43 | 10.5%).
Employment Industries by Sex in Jeffersonville
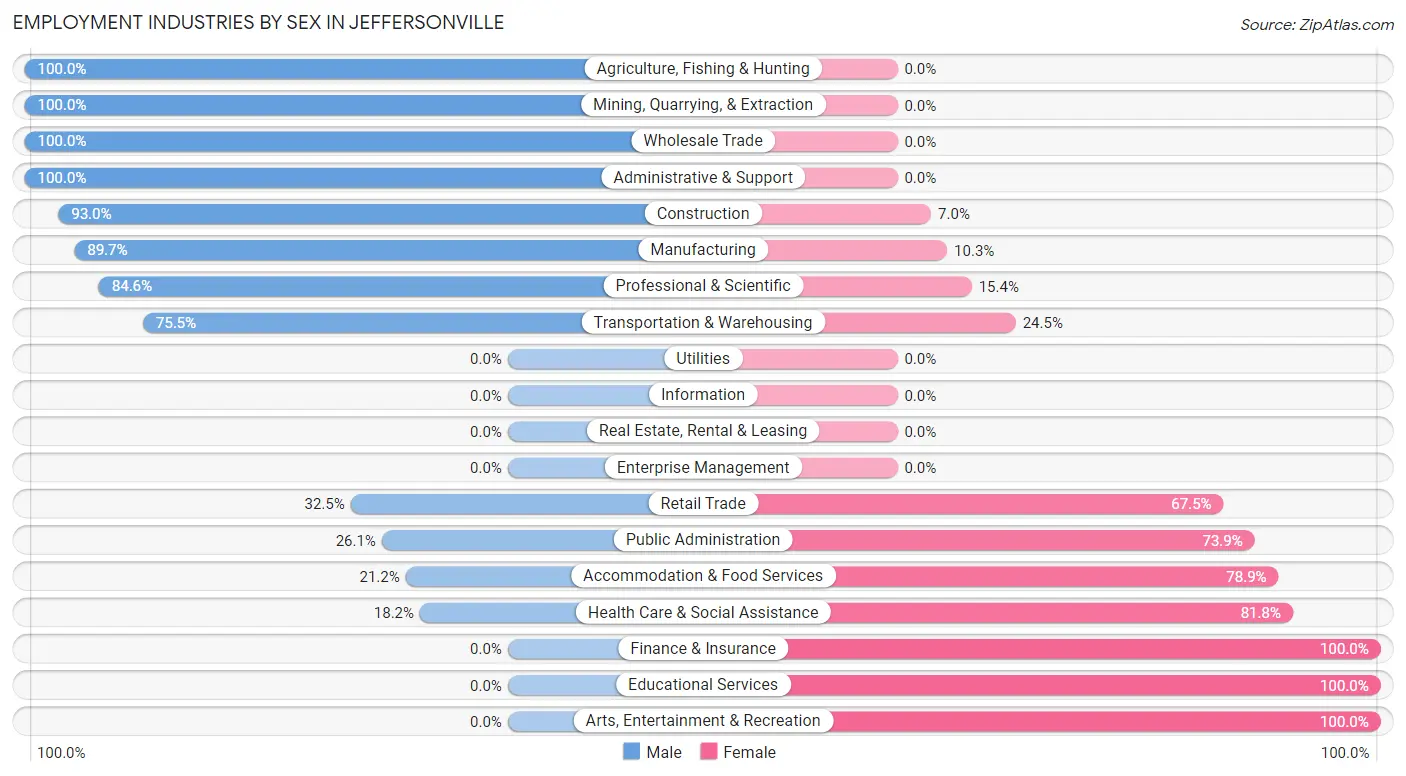
The Jeffersonville industries that see more men than women are Agriculture, Fishing & Hunting (100.0%), Mining, Quarrying, & Extraction (100.0%), and Wholesale Trade (100.0%), whereas the industries that tend to have a higher number of women are Finance & Insurance (100.0%), Educational Services (100.0%), and Arts, Entertainment & Recreation (100.0%).
| Industry | Male | Female |
| Agriculture, Fishing & Hunting | 11 (100.0%) | 0 (0.0%) |
| Mining, Quarrying, & Extraction | 3 (100.0%) | 0 (0.0%) |
| Construction | 40 (93.0%) | 3 (7.0%) |
| Manufacturing | 61 (89.7%) | 7 (10.3%) |
| Wholesale Trade | 3 (100.0%) | 0 (0.0%) |
| Retail Trade | 27 (32.5%) | 56 (67.5%) |
| Transportation & Warehousing | 37 (75.5%) | 12 (24.5%) |
| Utilities | 0 (0.0%) | 0 (0.0%) |
| Information | 0 (0.0%) | 0 (0.0%) |
| Finance & Insurance | 0 (0.0%) | 2 (100.0%) |
| Real Estate, Rental & Leasing | 0 (0.0%) | 0 (0.0%) |
| Professional & Scientific | 11 (84.6%) | 2 (15.4%) |
| Enterprise Management | 0 (0.0%) | 0 (0.0%) |
| Administrative & Support | 4 (100.0%) | 0 (0.0%) |
| Educational Services | 0 (0.0%) | 13 (100.0%) |
| Health Care & Social Assistance | 4 (18.2%) | 18 (81.8%) |
| Arts, Entertainment & Recreation | 0 (0.0%) | 6 (100.0%) |
| Accommodation & Food Services | 11 (21.1%) | 41 (78.8%) |
| Public Administration | 6 (26.1%) | 17 (73.9%) |
| Total | 221 (54.0%) | 188 (46.0%) |
Education in Jeffersonville
School Enrollment in Jeffersonville
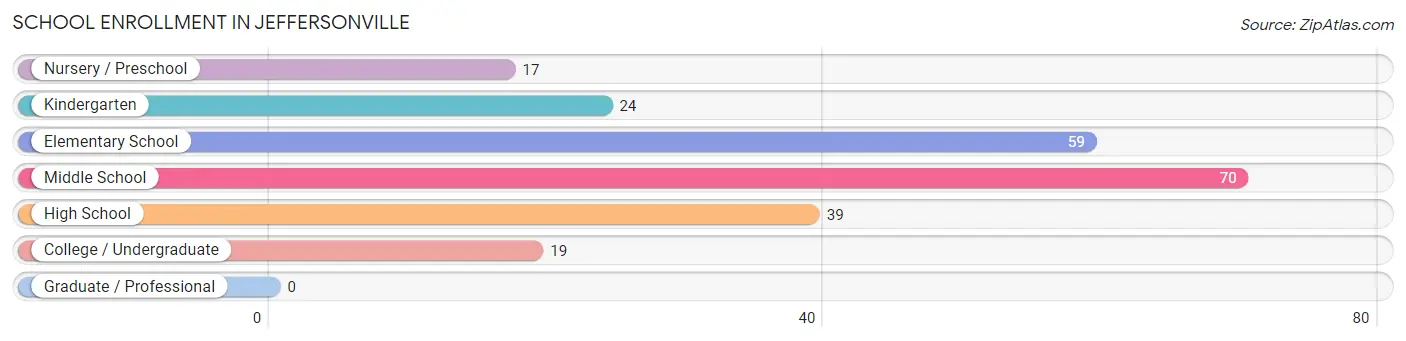
The most common levels of schooling among the 228 students in Jeffersonville are middle school (70 | 30.7%), elementary school (59 | 25.9%), and high school (39 | 17.1%).
| School Level | # Students | % Students |
| Nursery / Preschool | 17 | 7.5% |
| Kindergarten | 24 | 10.5% |
| Elementary School | 59 | 25.9% |
| Middle School | 70 | 30.7% |
| High School | 39 | 17.1% |
| College / Undergraduate | 19 | 8.3% |
| Graduate / Professional | 0 | 0.0% |
| Total | 228 | 100.0% |
School Enrollment by Age by Funding Source in Jeffersonville
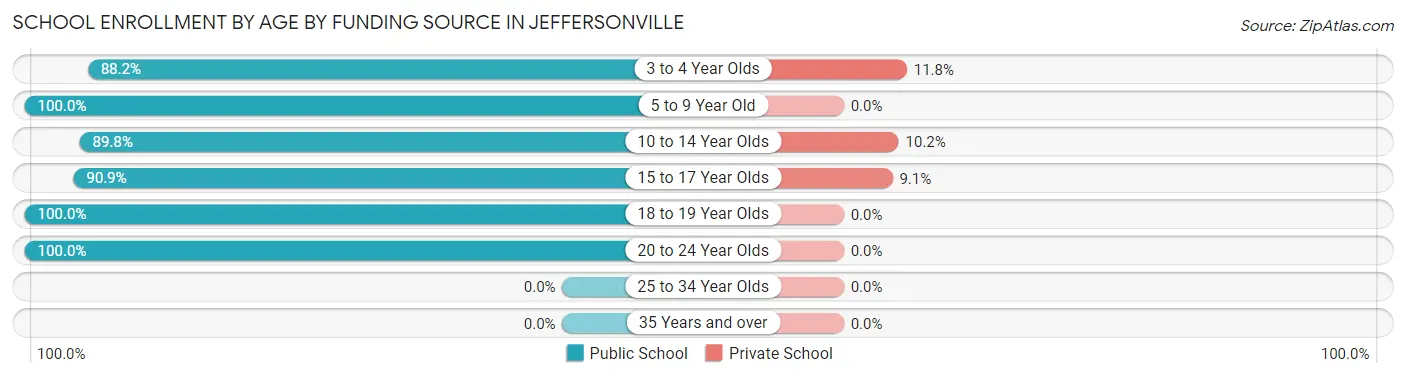
Out of a total of 228 students who are enrolled in schools in Jeffersonville, 13 (5.7%) attend a private institution, while the remaining 215 (94.3%) are enrolled in public schools. The age group of 3 to 4 year olds has the highest likelihood of being enrolled in private schools, with 2 (11.8% in the age bracket) enrolled. Conversely, the age group of 5 to 9 year old has the lowest likelihood of being enrolled in a private school, with 72 (100.0% in the age bracket) attending a public institution.
| Age Bracket | Public School | Private School |
| 3 to 4 Year Olds | 15 (88.2%) | 2 (11.8%) |
| 5 to 9 Year Old | 72 (100.0%) | 0 (0.0%) |
| 10 to 14 Year Olds | 79 (89.8%) | 9 (10.2%) |
| 15 to 17 Year Olds | 20 (90.9%) | 2 (9.1%) |
| 18 to 19 Year Olds | 24 (100.0%) | 0 (0.0%) |
| 20 to 24 Year Olds | 5 (100.0%) | 0 (0.0%) |
| 25 to 34 Year Olds | 0 (0.0%) | 0 (0.0%) |
| 35 Years and over | 0 (0.0%) | 0 (0.0%) |
| Total | 215 (94.3%) | 13 (5.7%) |
Educational Attainment by Field of Study in Jeffersonville
Science & technology (11 | 24.4%), bio, nature & agricultural (9 | 20.0%), business (7 | 15.6%), education (7 | 15.6%), and physical & health sciences (4 | 8.9%) are the most common fields of study among 45 individuals in Jeffersonville who have obtained a bachelor's degree or higher.
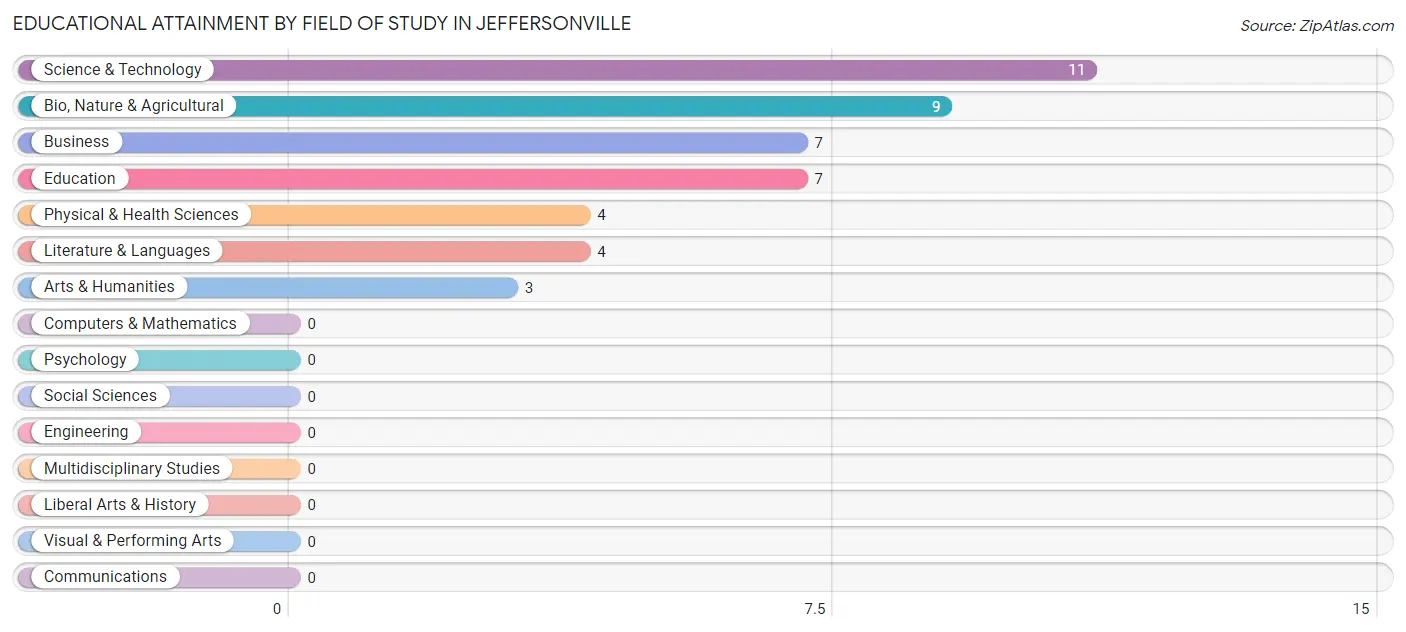
| Field of Study | # Graduates | % Graduates |
| Computers & Mathematics | 0 | 0.0% |
| Bio, Nature & Agricultural | 9 | 20.0% |
| Physical & Health Sciences | 4 | 8.9% |
| Psychology | 0 | 0.0% |
| Social Sciences | 0 | 0.0% |
| Engineering | 0 | 0.0% |
| Multidisciplinary Studies | 0 | 0.0% |
| Science & Technology | 11 | 24.4% |
| Business | 7 | 15.6% |
| Education | 7 | 15.6% |
| Literature & Languages | 4 | 8.9% |
| Liberal Arts & History | 0 | 0.0% |
| Visual & Performing Arts | 0 | 0.0% |
| Communications | 0 | 0.0% |
| Arts & Humanities | 3 | 6.7% |
| Total | 45 | 100.0% |
Transportation & Commute in Jeffersonville
Vehicle Availability by Sex in Jeffersonville
The most prevalent vehicle ownership categories in Jeffersonville are males with 2 vehicles (117, accounting for 54.9%) and females with 2 vehicles (81, making up 63.2%).
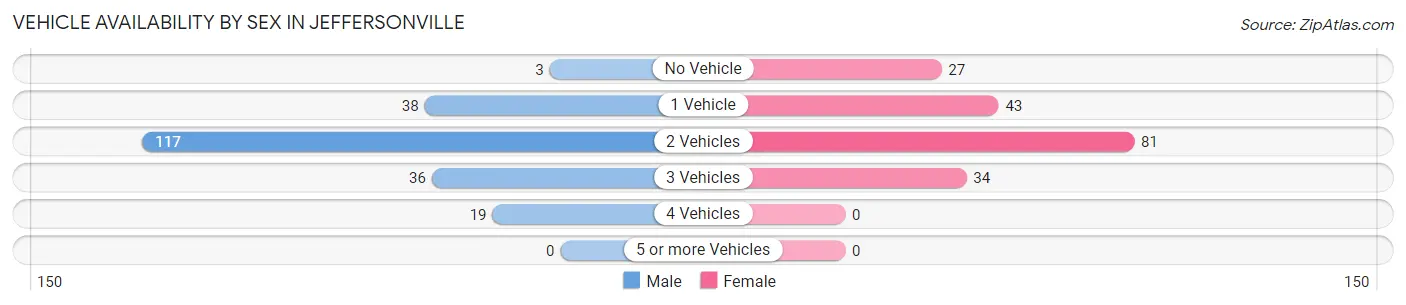
| Vehicles Available | Male | Female |
| No Vehicle | 3 (1.4%) | 27 (14.6%) |
| 1 Vehicle | 38 (17.8%) | 43 (23.2%) |
| 2 Vehicles | 117 (54.9%) | 81 (43.8%) |
| 3 Vehicles | 36 (16.9%) | 34 (18.4%) |
| 4 Vehicles | 19 (8.9%) | 0 (0.0%) |
| 5 or more Vehicles | 0 (0.0%) | 0 (0.0%) |
| Total | 213 (100.0%) | 185 (100.0%) |
Commute Time in Jeffersonville
The most frequently occuring commute durations in Jeffersonville are 20 to 24 minutes (63 commuters, 16.5%), 45 to 59 minutes (61 commuters, 16.0%), and 10 to 14 minutes (57 commuters, 14.9%).
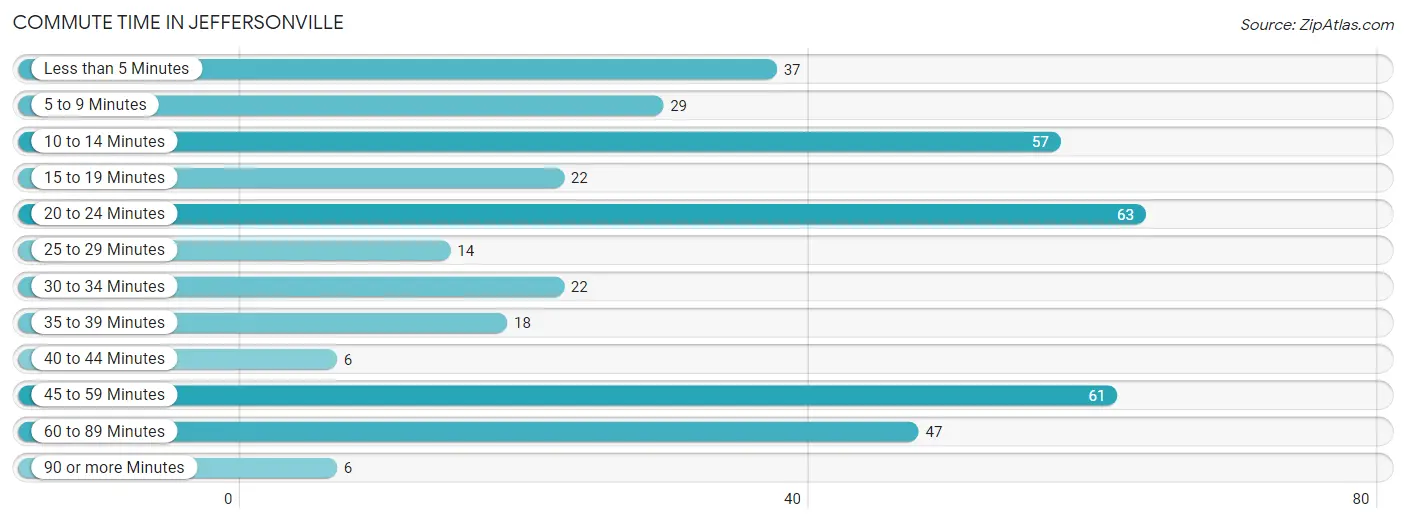
| Commute Time | # Commuters | % Commuters |
| Less than 5 Minutes | 37 | 9.7% |
| 5 to 9 Minutes | 29 | 7.6% |
| 10 to 14 Minutes | 57 | 14.9% |
| 15 to 19 Minutes | 22 | 5.8% |
| 20 to 24 Minutes | 63 | 16.5% |
| 25 to 29 Minutes | 14 | 3.7% |
| 30 to 34 Minutes | 22 | 5.8% |
| 35 to 39 Minutes | 18 | 4.7% |
| 40 to 44 Minutes | 6 | 1.6% |
| 45 to 59 Minutes | 61 | 16.0% |
| 60 to 89 Minutes | 47 | 12.3% |
| 90 or more Minutes | 6 | 1.6% |
Commute Time by Sex in Jeffersonville
The most common commute times in Jeffersonville are 60 to 89 minutes (42 commuters, 21.3%) for males and 10 to 14 minutes (44 commuters, 23.8%) for females.
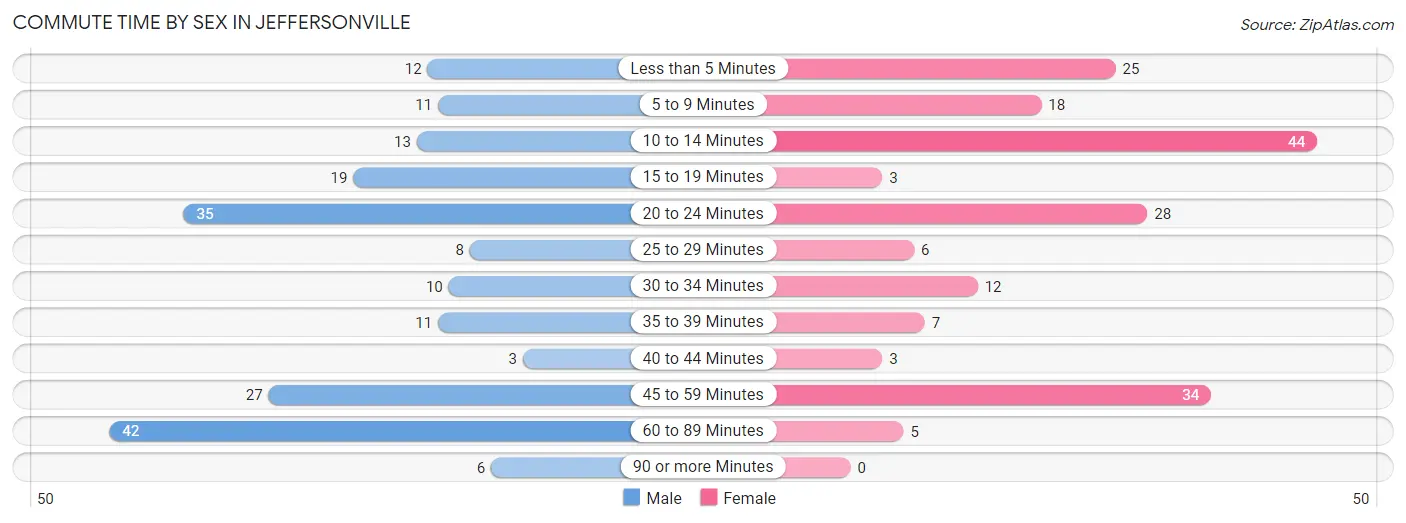
| Commute Time | Male | Female |
| Less than 5 Minutes | 12 (6.1%) | 25 (13.5%) |
| 5 to 9 Minutes | 11 (5.6%) | 18 (9.7%) |
| 10 to 14 Minutes | 13 (6.6%) | 44 (23.8%) |
| 15 to 19 Minutes | 19 (9.6%) | 3 (1.6%) |
| 20 to 24 Minutes | 35 (17.8%) | 28 (15.1%) |
| 25 to 29 Minutes | 8 (4.1%) | 6 (3.2%) |
| 30 to 34 Minutes | 10 (5.1%) | 12 (6.5%) |
| 35 to 39 Minutes | 11 (5.6%) | 7 (3.8%) |
| 40 to 44 Minutes | 3 (1.5%) | 3 (1.6%) |
| 45 to 59 Minutes | 27 (13.7%) | 34 (18.4%) |
| 60 to 89 Minutes | 42 (21.3%) | 5 (2.7%) |
| 90 or more Minutes | 6 (3.0%) | 0 (0.0%) |
Time of Departure to Work by Sex in Jeffersonville
The most frequent times of departure to work in Jeffersonville are 6:30 AM to 6:59 AM (35, 17.8%) for males and 5:30 AM to 5:59 AM (42, 22.7%) for females.
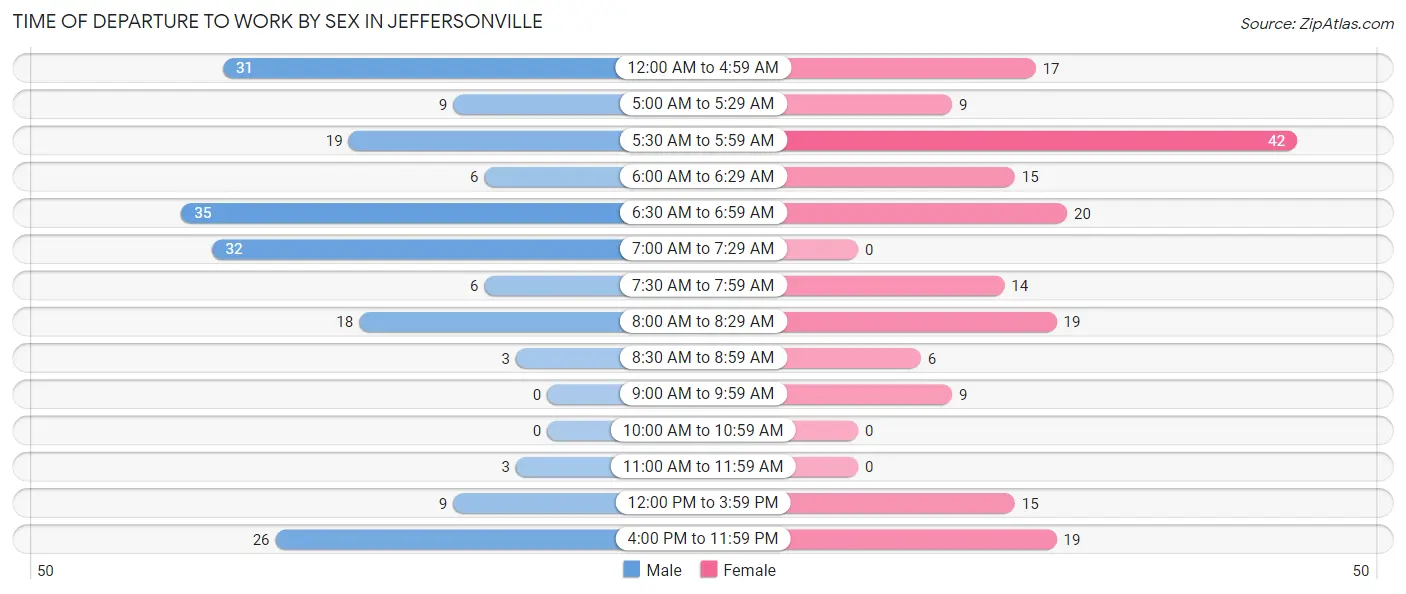
| Time of Departure | Male | Female |
| 12:00 AM to 4:59 AM | 31 (15.7%) | 17 (9.2%) |
| 5:00 AM to 5:29 AM | 9 (4.6%) | 9 (4.9%) |
| 5:30 AM to 5:59 AM | 19 (9.6%) | 42 (22.7%) |
| 6:00 AM to 6:29 AM | 6 (3.0%) | 15 (8.1%) |
| 6:30 AM to 6:59 AM | 35 (17.8%) | 20 (10.8%) |
| 7:00 AM to 7:29 AM | 32 (16.2%) | 0 (0.0%) |
| 7:30 AM to 7:59 AM | 6 (3.0%) | 14 (7.6%) |
| 8:00 AM to 8:29 AM | 18 (9.1%) | 19 (10.3%) |
| 8:30 AM to 8:59 AM | 3 (1.5%) | 6 (3.2%) |
| 9:00 AM to 9:59 AM | 0 (0.0%) | 9 (4.9%) |
| 10:00 AM to 10:59 AM | 0 (0.0%) | 0 (0.0%) |
| 11:00 AM to 11:59 AM | 3 (1.5%) | 0 (0.0%) |
| 12:00 PM to 3:59 PM | 9 (4.6%) | 15 (8.1%) |
| 4:00 PM to 11:59 PM | 26 (13.2%) | 19 (10.3%) |
| Total | 197 (100.0%) | 185 (100.0%) |
Housing Occupancy in Jeffersonville
Occupancy by Ownership in Jeffersonville
Of the total 457 dwellings in Jeffersonville, owner-occupied units account for 185 (40.5%), while renter-occupied units make up 272 (59.5%).
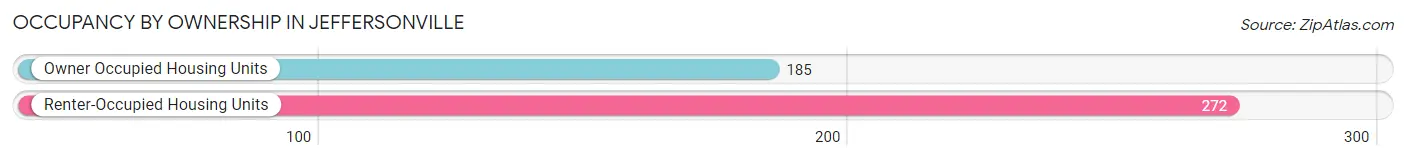
| Occupancy | # Housing Units | % Housing Units |
| Owner Occupied Housing Units | 185 | 40.5% |
| Renter-Occupied Housing Units | 272 | 59.5% |
| Total Occupied Housing Units | 457 | 100.0% |
Occupancy by Household Size in Jeffersonville
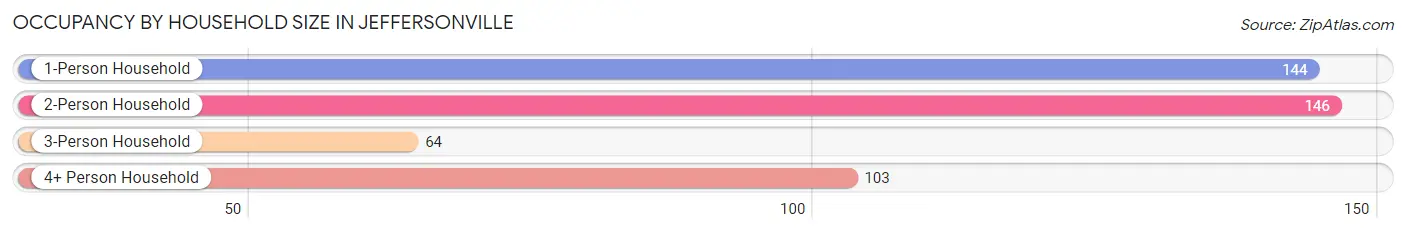
| Household Size | # Housing Units | % Housing Units |
| 1-Person Household | 144 | 31.5% |
| 2-Person Household | 146 | 32.0% |
| 3-Person Household | 64 | 14.0% |
| 4+ Person Household | 103 | 22.5% |
| Total Housing Units | 457 | 100.0% |
Occupancy by Ownership by Household Size in Jeffersonville
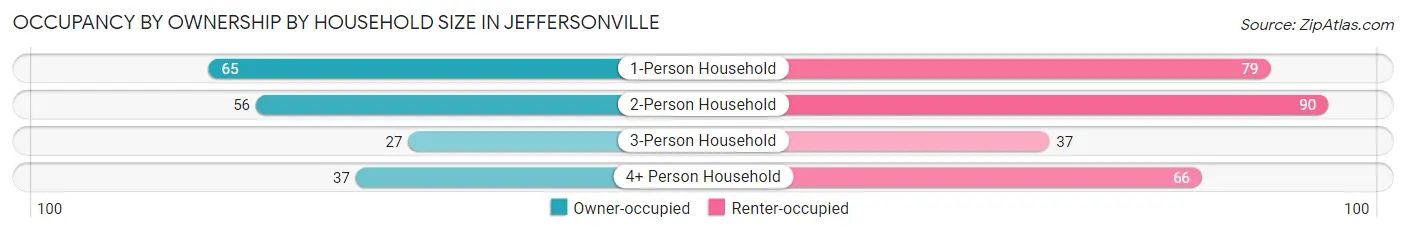
| Household Size | Owner-occupied | Renter-occupied |
| 1-Person Household | 65 (45.1%) | 79 (54.9%) |
| 2-Person Household | 56 (38.4%) | 90 (61.6%) |
| 3-Person Household | 27 (42.2%) | 37 (57.8%) |
| 4+ Person Household | 37 (35.9%) | 66 (64.1%) |
| Total Housing Units | 185 (40.5%) | 272 (59.5%) |
Occupancy by Educational Attainment in Jeffersonville
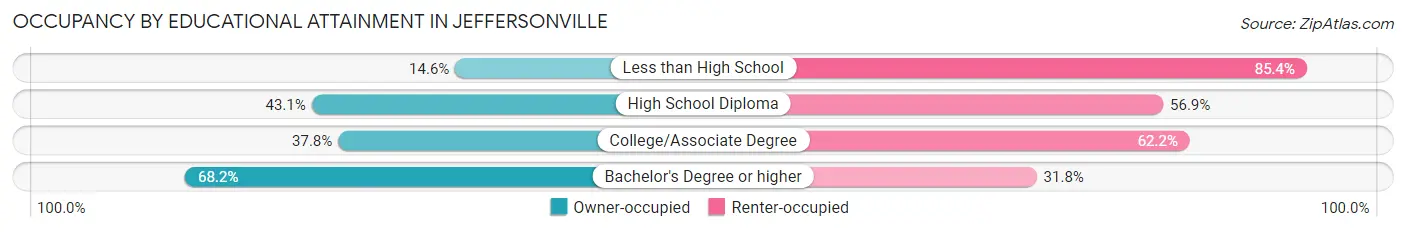
| Household Size | Owner-occupied | Renter-occupied |
| Less than High School | 6 (14.6%) | 35 (85.4%) |
| High School Diploma | 122 (43.1%) | 161 (56.9%) |
| College/Associate Degree | 42 (37.8%) | 69 (62.2%) |
| Bachelor's Degree or higher | 15 (68.2%) | 7 (31.8%) |
Occupancy by Age of Householder in Jeffersonville
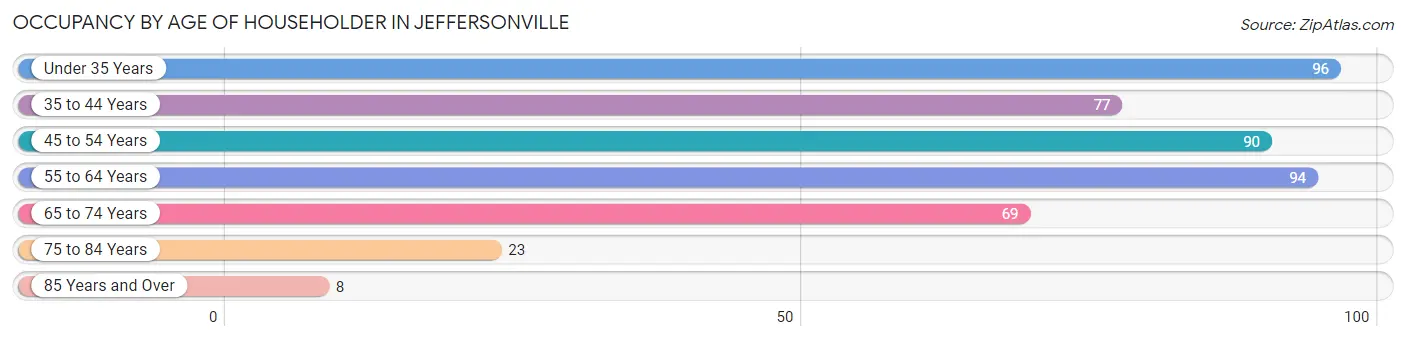
| Age Bracket | # Households | % Households |
| Under 35 Years | 96 | 21.0% |
| 35 to 44 Years | 77 | 16.9% |
| 45 to 54 Years | 90 | 19.7% |
| 55 to 64 Years | 94 | 20.6% |
| 65 to 74 Years | 69 | 15.1% |
| 75 to 84 Years | 23 | 5.0% |
| 85 Years and Over | 8 | 1.8% |
| Total | 457 | 100.0% |
Housing Finances in Jeffersonville
Median Income by Occupancy in Jeffersonville
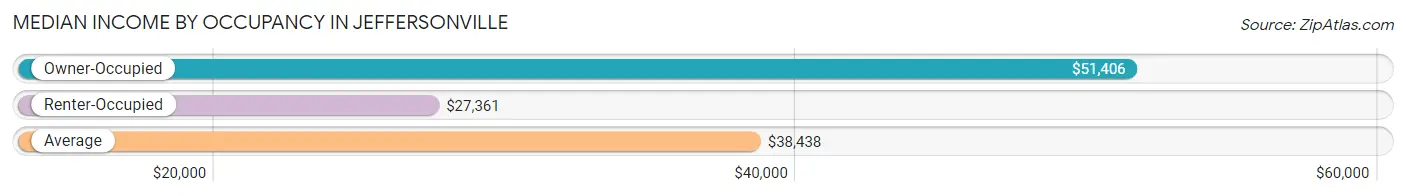
| Occupancy Type | # Households | Median Income |
| Owner-Occupied | 185 (40.5%) | $51,406 |
| Renter-Occupied | 272 (59.5%) | $27,361 |
| Average | 457 (100.0%) | $38,438 |
Occupancy by Householder Income Bracket in Jeffersonville
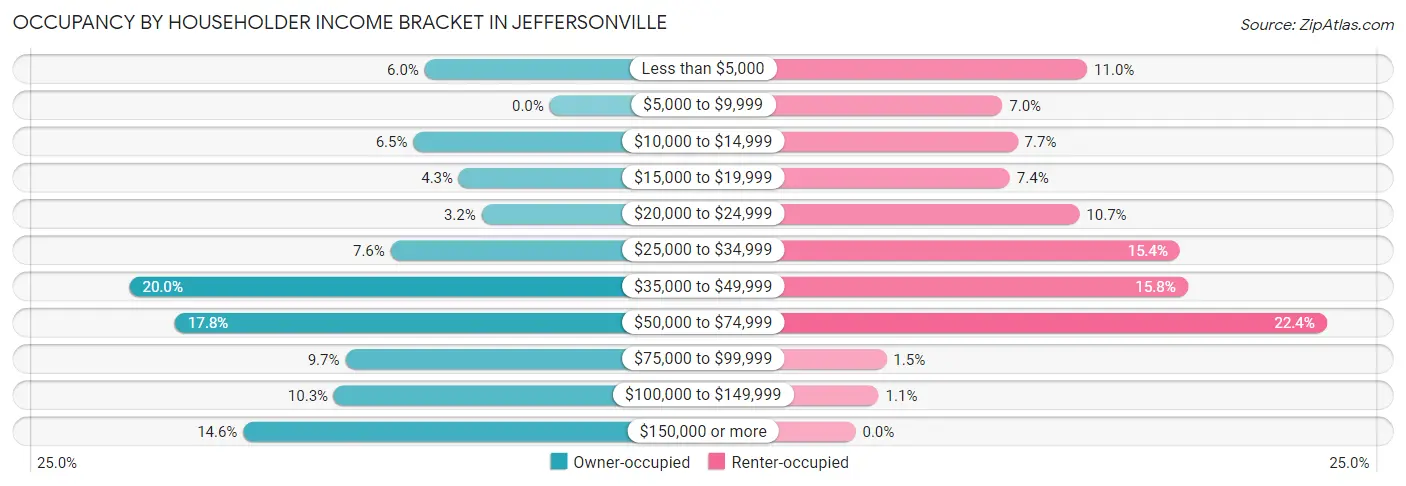
| Income Bracket | Owner-occupied | Renter-occupied |
| Less than $5,000 | 11 (5.9%) | 30 (11.0%) |
| $5,000 to $9,999 | 0 (0.0%) | 19 (7.0%) |
| $10,000 to $14,999 | 12 (6.5%) | 21 (7.7%) |
| $15,000 to $19,999 | 8 (4.3%) | 20 (7.3%) |
| $20,000 to $24,999 | 6 (3.2%) | 29 (10.7%) |
| $25,000 to $34,999 | 14 (7.6%) | 42 (15.4%) |
| $35,000 to $49,999 | 37 (20.0%) | 43 (15.8%) |
| $50,000 to $74,999 | 33 (17.8%) | 61 (22.4%) |
| $75,000 to $99,999 | 18 (9.7%) | 4 (1.5%) |
| $100,000 to $149,999 | 19 (10.3%) | 3 (1.1%) |
| $150,000 or more | 27 (14.6%) | 0 (0.0%) |
| Total | 185 (100.0%) | 272 (100.0%) |
Monthly Housing Cost Tiers in Jeffersonville
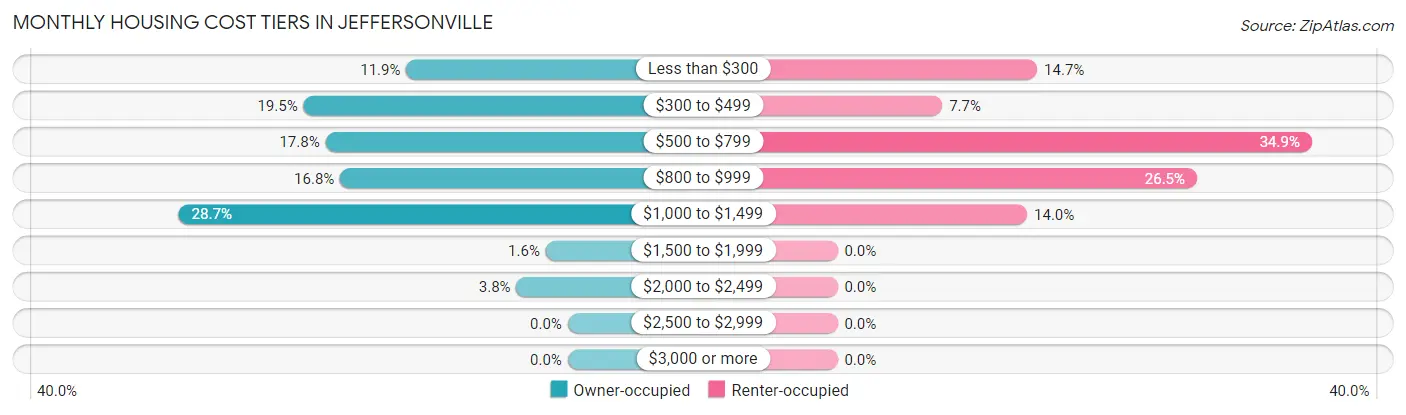
| Monthly Cost | Owner-occupied | Renter-occupied |
| Less than $300 | 22 (11.9%) | 40 (14.7%) |
| $300 to $499 | 36 (19.5%) | 21 (7.7%) |
| $500 to $799 | 33 (17.8%) | 95 (34.9%) |
| $800 to $999 | 31 (16.8%) | 72 (26.5%) |
| $1,000 to $1,499 | 53 (28.6%) | 38 (14.0%) |
| $1,500 to $1,999 | 3 (1.6%) | 0 (0.0%) |
| $2,000 to $2,499 | 7 (3.8%) | 0 (0.0%) |
| $2,500 to $2,999 | 0 (0.0%) | 0 (0.0%) |
| $3,000 or more | 0 (0.0%) | 0 (0.0%) |
| Total | 185 (100.0%) | 272 (100.0%) |
Physical Housing Characteristics in Jeffersonville
Housing Structures in Jeffersonville
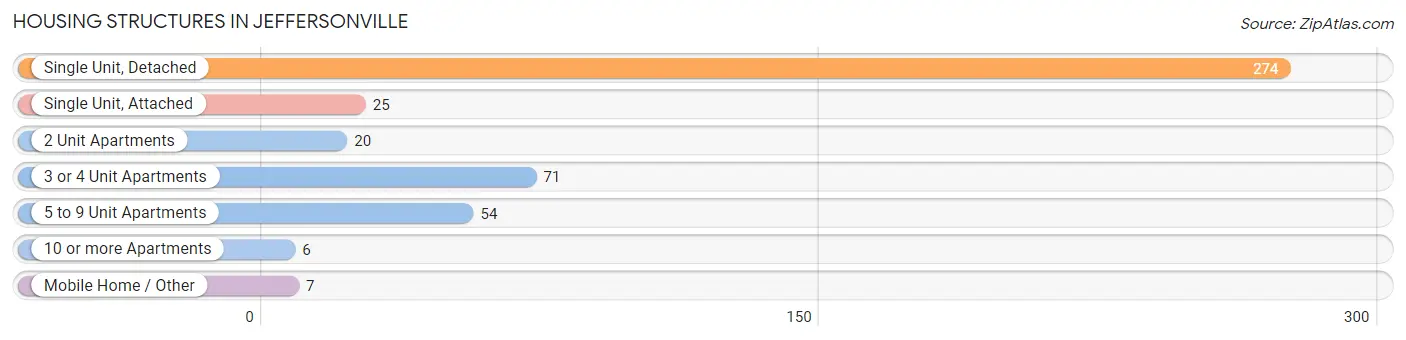
| Structure Type | # Housing Units | % Housing Units |
| Single Unit, Detached | 274 | 60.0% |
| Single Unit, Attached | 25 | 5.5% |
| 2 Unit Apartments | 20 | 4.4% |
| 3 or 4 Unit Apartments | 71 | 15.5% |
| 5 to 9 Unit Apartments | 54 | 11.8% |
| 10 or more Apartments | 6 | 1.3% |
| Mobile Home / Other | 7 | 1.5% |
| Total | 457 | 100.0% |
Housing Structures by Occupancy in Jeffersonville
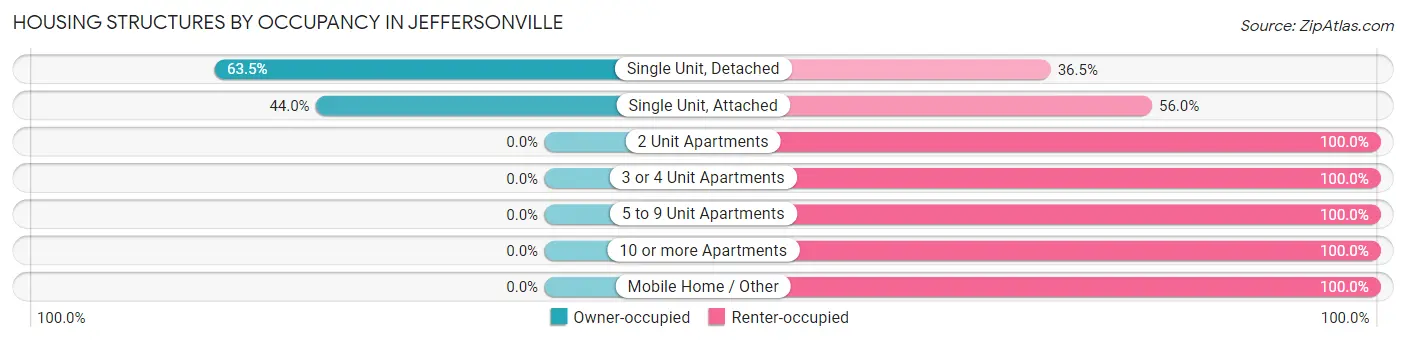
| Structure Type | Owner-occupied | Renter-occupied |
| Single Unit, Detached | 174 (63.5%) | 100 (36.5%) |
| Single Unit, Attached | 11 (44.0%) | 14 (56.0%) |
| 2 Unit Apartments | 0 (0.0%) | 20 (100.0%) |
| 3 or 4 Unit Apartments | 0 (0.0%) | 71 (100.0%) |
| 5 to 9 Unit Apartments | 0 (0.0%) | 54 (100.0%) |
| 10 or more Apartments | 0 (0.0%) | 6 (100.0%) |
| Mobile Home / Other | 0 (0.0%) | 7 (100.0%) |
| Total | 185 (40.5%) | 272 (59.5%) |
Housing Structures by Number of Rooms in Jeffersonville
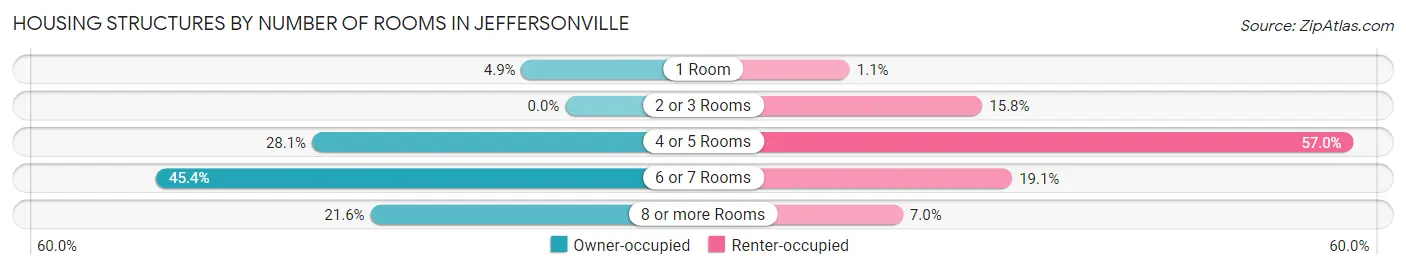
| Number of Rooms | Owner-occupied | Renter-occupied |
| 1 Room | 9 (4.9%) | 3 (1.1%) |
| 2 or 3 Rooms | 0 (0.0%) | 43 (15.8%) |
| 4 or 5 Rooms | 52 (28.1%) | 155 (57.0%) |
| 6 or 7 Rooms | 84 (45.4%) | 52 (19.1%) |
| 8 or more Rooms | 40 (21.6%) | 19 (7.0%) |
| Total | 185 (100.0%) | 272 (100.0%) |
Housing Structure by Heating Type in Jeffersonville
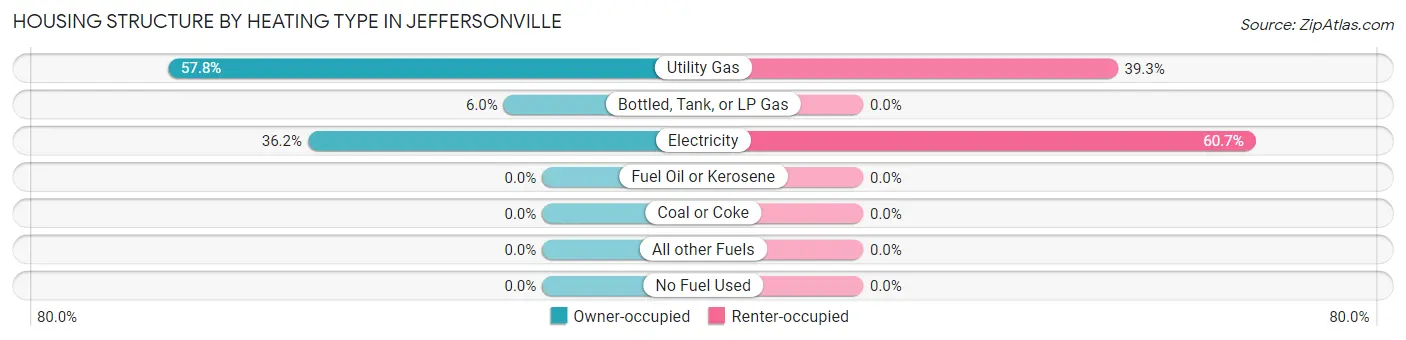
| Heating Type | Owner-occupied | Renter-occupied |
| Utility Gas | 107 (57.8%) | 107 (39.3%) |
| Bottled, Tank, or LP Gas | 11 (5.9%) | 0 (0.0%) |
| Electricity | 67 (36.2%) | 165 (60.7%) |
| Fuel Oil or Kerosene | 0 (0.0%) | 0 (0.0%) |
| Coal or Coke | 0 (0.0%) | 0 (0.0%) |
| All other Fuels | 0 (0.0%) | 0 (0.0%) |
| No Fuel Used | 0 (0.0%) | 0 (0.0%) |
| Total | 185 (100.0%) | 272 (100.0%) |
Household Vehicle Usage in Jeffersonville
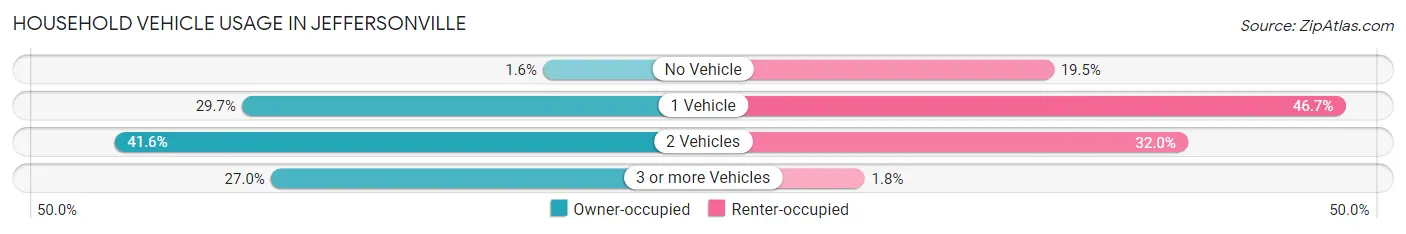
| Vehicles per Household | Owner-occupied | Renter-occupied |
| No Vehicle | 3 (1.6%) | 53 (19.5%) |
| 1 Vehicle | 55 (29.7%) | 127 (46.7%) |
| 2 Vehicles | 77 (41.6%) | 87 (32.0%) |
| 3 or more Vehicles | 50 (27.0%) | 5 (1.8%) |
| Total | 185 (100.0%) | 272 (100.0%) |
Real Estate & Mortgages in Jeffersonville
Real Estate and Mortgage Overview in Jeffersonville
| Characteristic | Without Mortgage | With Mortgage |
| Housing Units | 83 | 102 |
| Median Property Value | $101,400 | $129,400 |
| Median Household Income | $45,417 | $20 |
| Monthly Housing Costs | $395 | $0 |
| Real Estate Taxes | $1,375 | $0 |
Property Value by Mortgage Status in Jeffersonville
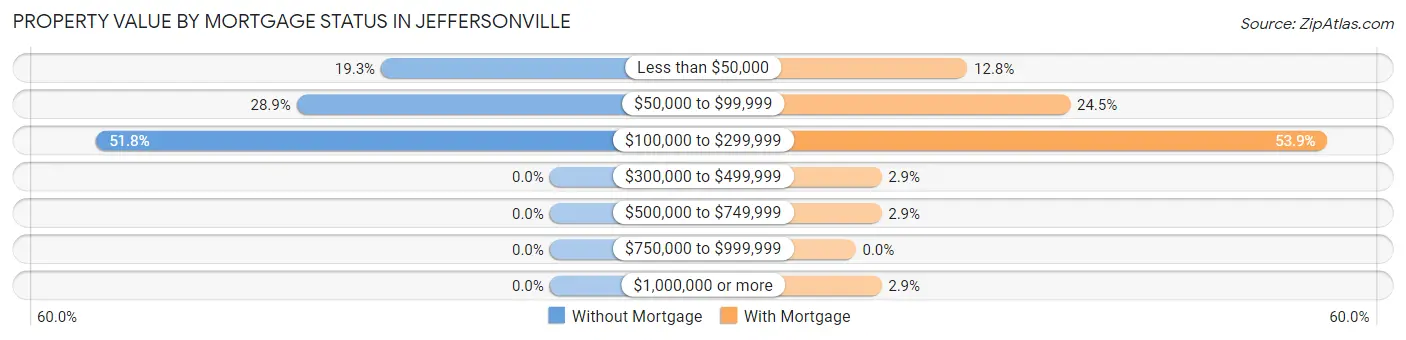
| Property Value | Without Mortgage | With Mortgage |
| Less than $50,000 | 16 (19.3%) | 13 (12.8%) |
| $50,000 to $99,999 | 24 (28.9%) | 25 (24.5%) |
| $100,000 to $299,999 | 43 (51.8%) | 55 (53.9%) |
| $300,000 to $499,999 | 0 (0.0%) | 3 (2.9%) |
| $500,000 to $749,999 | 0 (0.0%) | 3 (2.9%) |
| $750,000 to $999,999 | 0 (0.0%) | 0 (0.0%) |
| $1,000,000 or more | 0 (0.0%) | 3 (2.9%) |
| Total | 83 (100.0%) | 102 (100.0%) |
Household Income by Mortgage Status in Jeffersonville
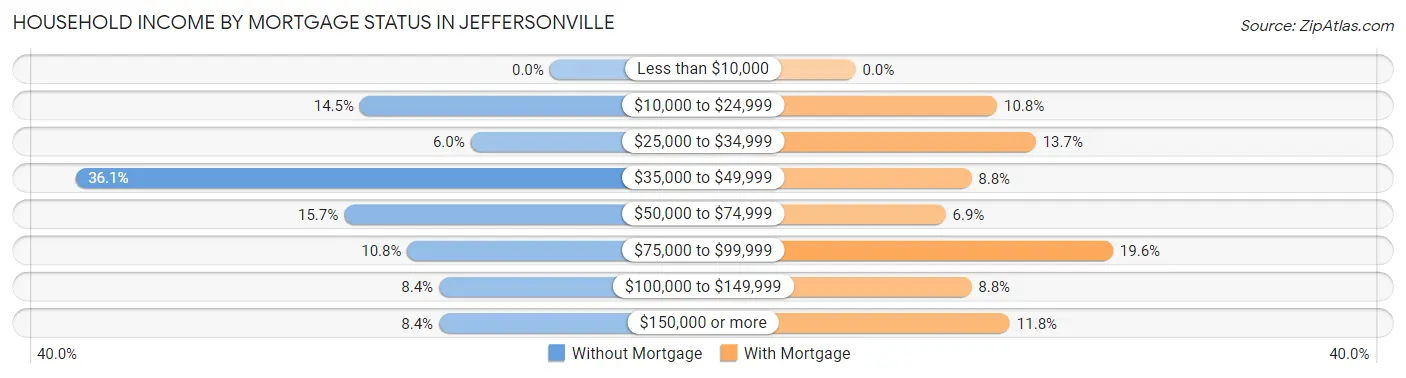
| Household Income | Without Mortgage | With Mortgage |
| Less than $10,000 | 0 (0.0%) | 0 (0.0%) |
| $10,000 to $24,999 | 12 (14.5%) | 11 (10.8%) |
| $25,000 to $34,999 | 5 (6.0%) | 14 (13.7%) |
| $35,000 to $49,999 | 30 (36.1%) | 9 (8.8%) |
| $50,000 to $74,999 | 13 (15.7%) | 7 (6.9%) |
| $75,000 to $99,999 | 9 (10.8%) | 20 (19.6%) |
| $100,000 to $149,999 | 7 (8.4%) | 9 (8.8%) |
| $150,000 or more | 7 (8.4%) | 12 (11.8%) |
| Total | 83 (100.0%) | 102 (100.0%) |
Property Value to Household Income Ratio in Jeffersonville
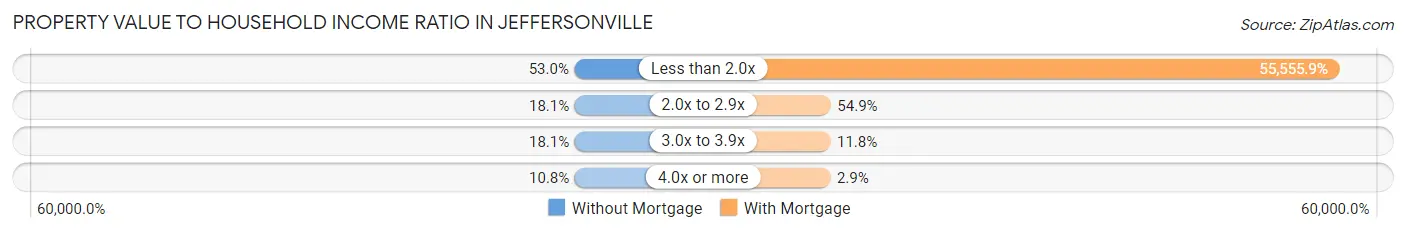
| Value-to-Income Ratio | Without Mortgage | With Mortgage |
| Less than 2.0x | 44 (53.0%) | 56,667 (55,555.9%) |
| 2.0x to 2.9x | 15 (18.1%) | 56 (54.9%) |
| 3.0x to 3.9x | 15 (18.1%) | 12 (11.8%) |
| 4.0x or more | 9 (10.8%) | 3 (2.9%) |
| Total | 83 (100.0%) | 102 (100.0%) |
Real Estate Taxes by Mortgage Status in Jeffersonville
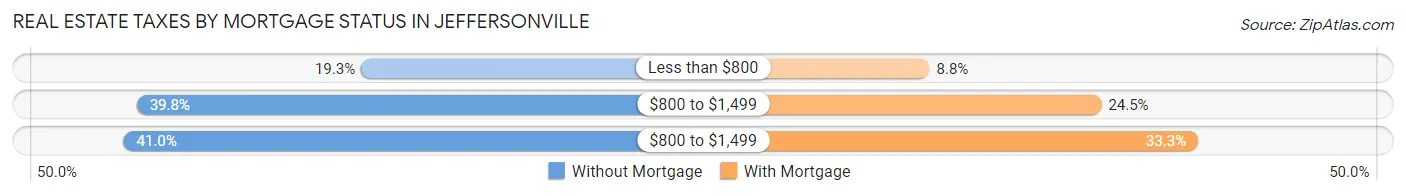
| Property Taxes | Without Mortgage | With Mortgage |
| Less than $800 | 16 (19.3%) | 9 (8.8%) |
| $800 to $1,499 | 33 (39.8%) | 25 (24.5%) |
| $800 to $1,499 | 34 (41.0%) | 34 (33.3%) |
| Total | 83 (100.0%) | 102 (100.0%) |
Health & Disability in Jeffersonville
Health Insurance Coverage by Age in Jeffersonville
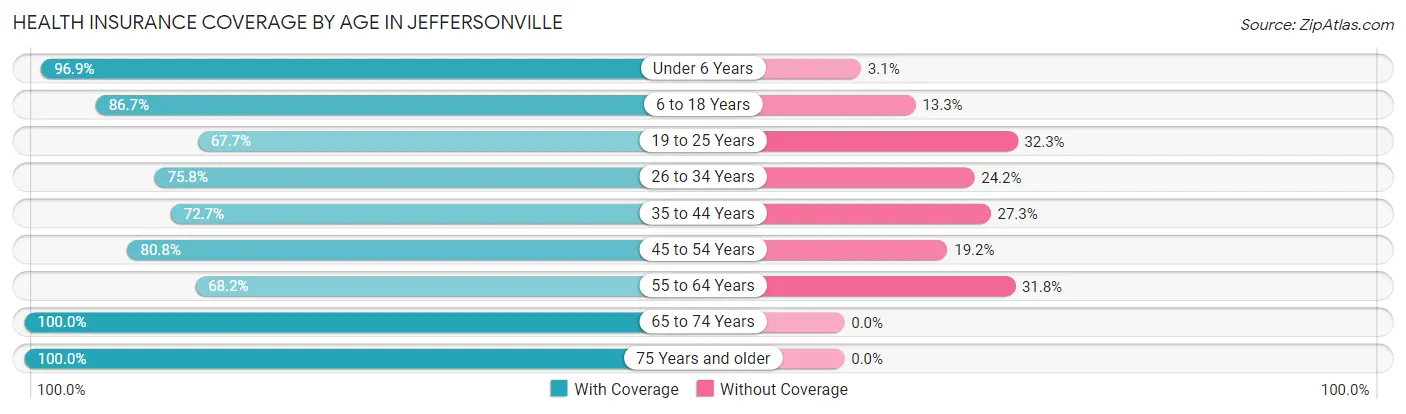
| Age Bracket | With Coverage | Without Coverage |
| Under 6 Years | 125 (96.9%) | 4 (3.1%) |
| 6 to 18 Years | 183 (86.7%) | 28 (13.3%) |
| 19 to 25 Years | 65 (67.7%) | 31 (32.3%) |
| 26 to 34 Years | 75 (75.8%) | 24 (24.2%) |
| 35 to 44 Years | 88 (72.7%) | 33 (27.3%) |
| 45 to 54 Years | 122 (80.8%) | 29 (19.2%) |
| 55 to 64 Years | 90 (68.2%) | 42 (31.8%) |
| 65 to 74 Years | 90 (100.0%) | 0 (0.0%) |
| 75 Years and older | 53 (100.0%) | 0 (0.0%) |
| Total | 891 (82.4%) | 191 (17.6%) |
Health Insurance Coverage by Citizenship Status in Jeffersonville
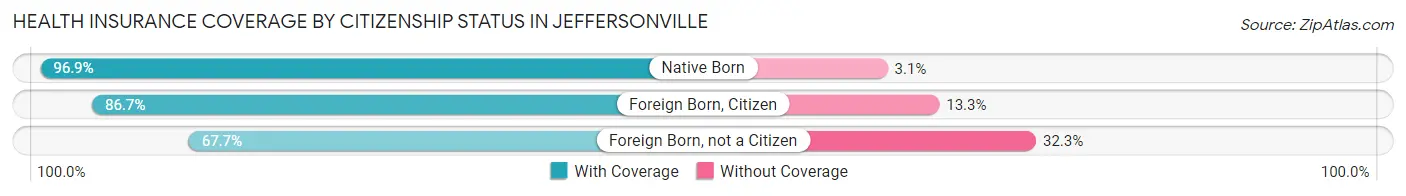
| Citizenship Status | With Coverage | Without Coverage |
| Native Born | 125 (96.9%) | 4 (3.1%) |
| Foreign Born, Citizen | 183 (86.7%) | 28 (13.3%) |
| Foreign Born, not a Citizen | 65 (67.7%) | 31 (32.3%) |
Health Insurance Coverage by Household Income in Jeffersonville
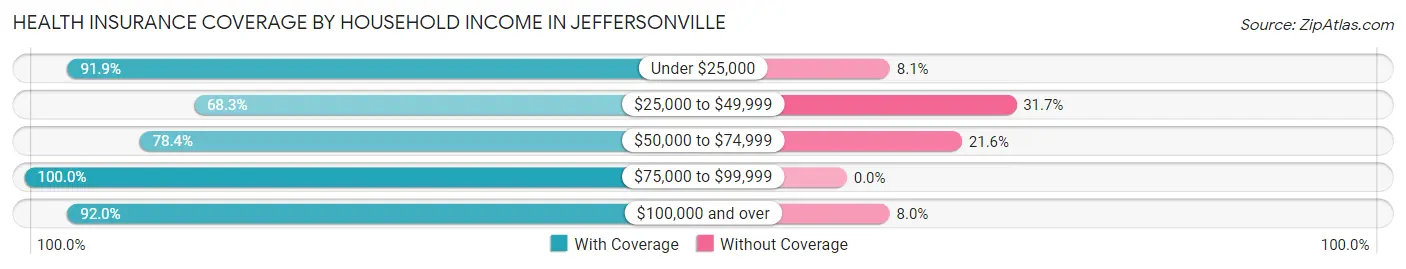
| Household Income | With Coverage | Without Coverage |
| Under $25,000 | 285 (91.9%) | 25 (8.1%) |
| $25,000 to $49,999 | 228 (68.3%) | 106 (31.7%) |
| $50,000 to $74,999 | 171 (78.4%) | 47 (21.6%) |
| $75,000 to $99,999 | 58 (100.0%) | 0 (0.0%) |
| $100,000 and over | 149 (92.0%) | 13 (8.0%) |
Public vs Private Health Insurance Coverage by Age in Jeffersonville
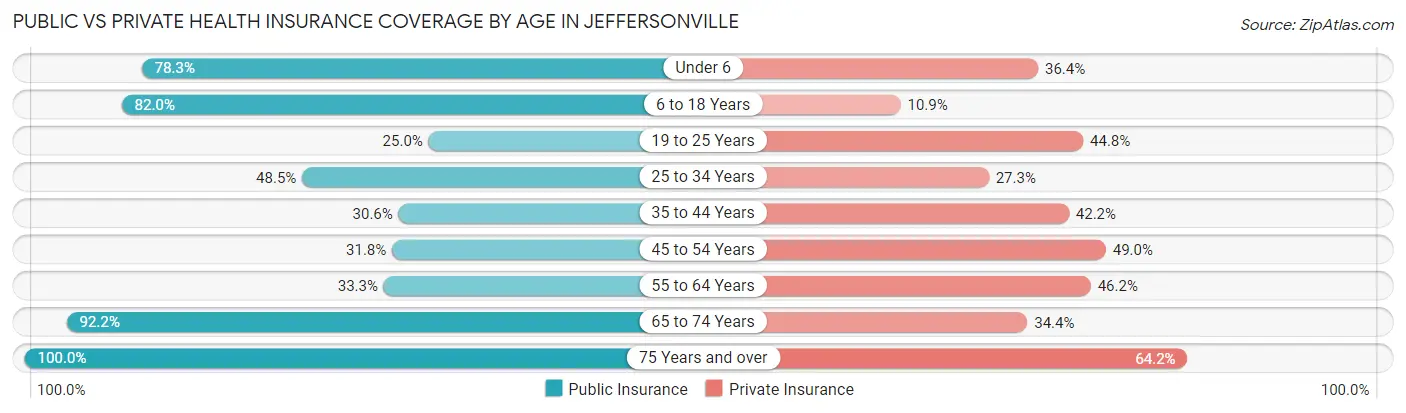
| Age Bracket | Public Insurance | Private Insurance |
| Under 6 | 101 (78.3%) | 47 (36.4%) |
| 6 to 18 Years | 173 (82.0%) | 23 (10.9%) |
| 19 to 25 Years | 24 (25.0%) | 43 (44.8%) |
| 25 to 34 Years | 48 (48.5%) | 27 (27.3%) |
| 35 to 44 Years | 37 (30.6%) | 51 (42.1%) |
| 45 to 54 Years | 48 (31.8%) | 74 (49.0%) |
| 55 to 64 Years | 44 (33.3%) | 61 (46.2%) |
| 65 to 74 Years | 83 (92.2%) | 31 (34.4%) |
| 75 Years and over | 53 (100.0%) | 34 (64.1%) |
| Total | 611 (56.5%) | 391 (36.1%) |
Disability Status by Sex by Age in Jeffersonville
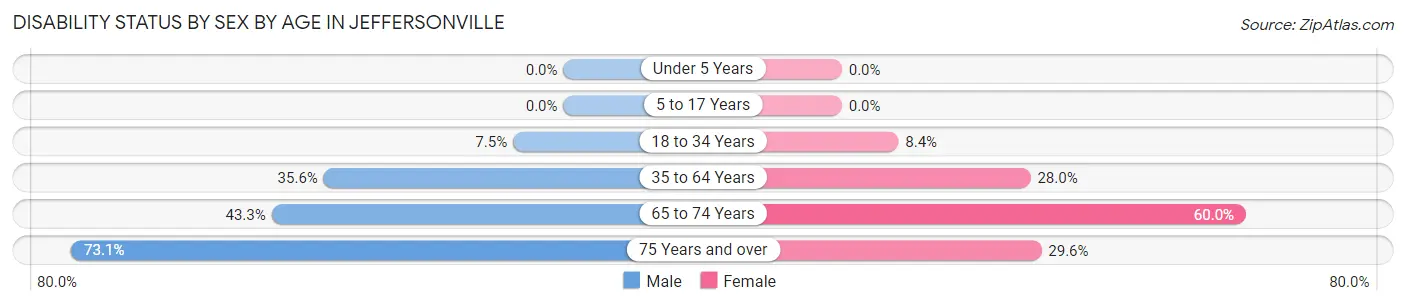
| Age Bracket | Male | Female |
| Under 5 Years | 0 (0.0%) | 0 (0.0%) |
| 5 to 17 Years | 0 (0.0%) | 0 (0.0%) |
| 18 to 34 Years | 8 (7.5%) | 10 (8.4%) |
| 35 to 64 Years | 79 (35.6%) | 51 (28.0%) |
| 65 to 74 Years | 13 (43.3%) | 36 (60.0%) |
| 75 Years and over | 19 (73.1%) | 8 (29.6%) |
Disability Class by Sex by Age in Jeffersonville
Disability Class: Hearing Difficulty
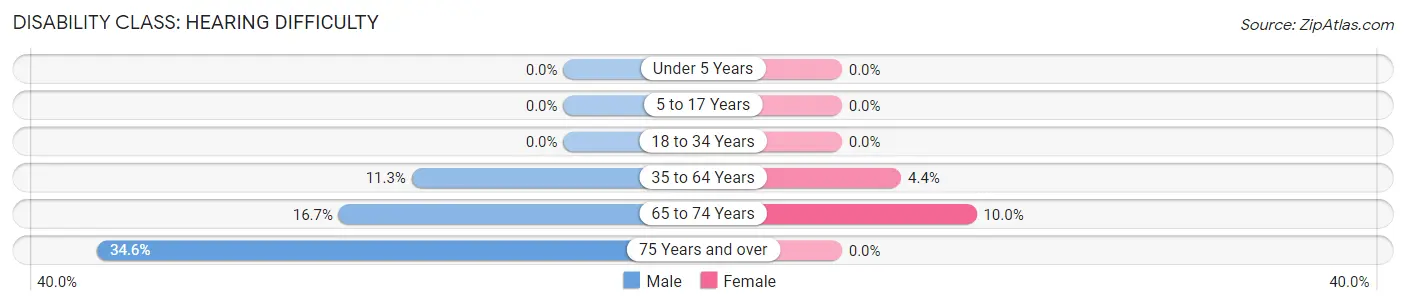
| Age Bracket | Male | Female |
| Under 5 Years | 0 (0.0%) | 0 (0.0%) |
| 5 to 17 Years | 0 (0.0%) | 0 (0.0%) |
| 18 to 34 Years | 0 (0.0%) | 0 (0.0%) |
| 35 to 64 Years | 25 (11.3%) | 8 (4.4%) |
| 65 to 74 Years | 5 (16.7%) | 6 (10.0%) |
| 75 Years and over | 9 (34.6%) | 0 (0.0%) |
Disability Class: Vision Difficulty
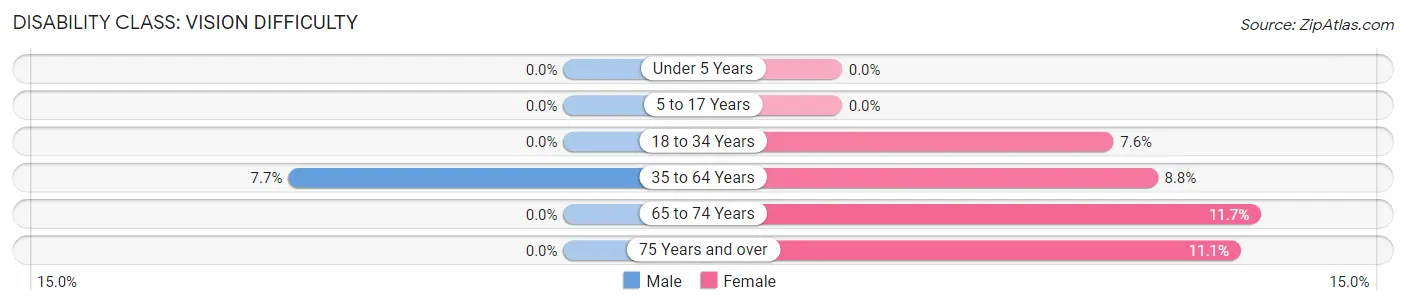
| Age Bracket | Male | Female |
| Under 5 Years | 0 (0.0%) | 0 (0.0%) |
| 5 to 17 Years | 0 (0.0%) | 0 (0.0%) |
| 18 to 34 Years | 0 (0.0%) | 9 (7.6%) |
| 35 to 64 Years | 17 (7.7%) | 16 (8.8%) |
| 65 to 74 Years | 0 (0.0%) | 7 (11.7%) |
| 75 Years and over | 0 (0.0%) | 3 (11.1%) |
Disability Class: Cognitive Difficulty
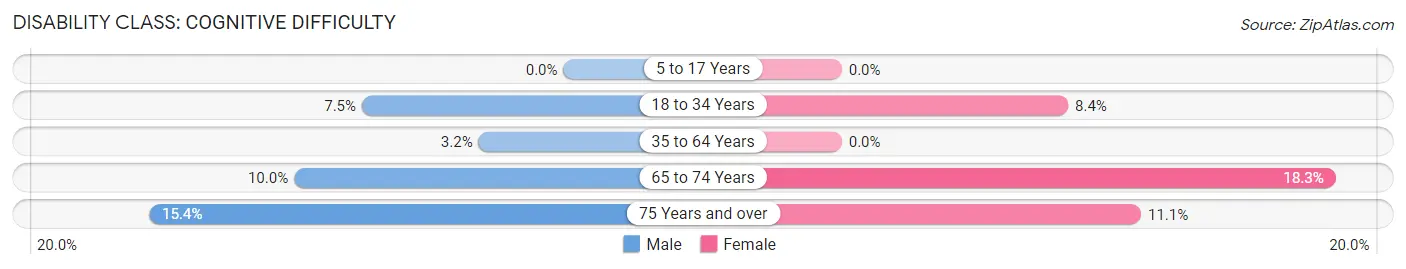
| Age Bracket | Male | Female |
| 5 to 17 Years | 0 (0.0%) | 0 (0.0%) |
| 18 to 34 Years | 8 (7.5%) | 10 (8.4%) |
| 35 to 64 Years | 7 (3.2%) | 0 (0.0%) |
| 65 to 74 Years | 3 (10.0%) | 11 (18.3%) |
| 75 Years and over | 4 (15.4%) | 3 (11.1%) |
Disability Class: Ambulatory Difficulty
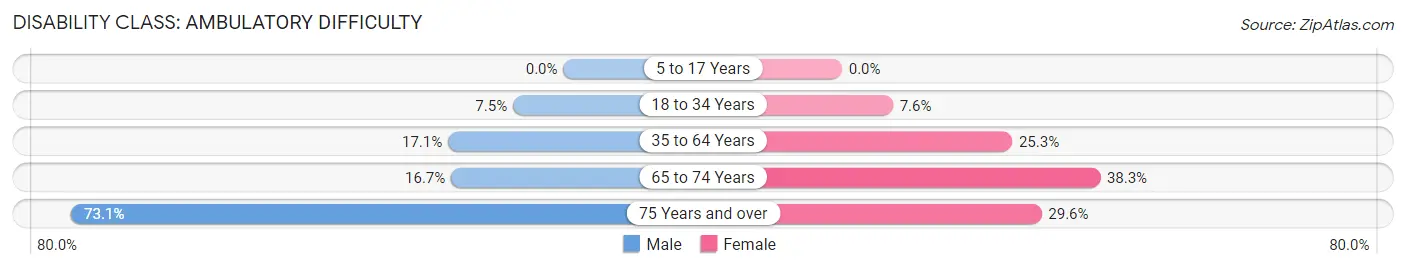
| Age Bracket | Male | Female |
| 5 to 17 Years | 0 (0.0%) | 0 (0.0%) |
| 18 to 34 Years | 8 (7.5%) | 9 (7.6%) |
| 35 to 64 Years | 38 (17.1%) | 46 (25.3%) |
| 65 to 74 Years | 5 (16.7%) | 23 (38.3%) |
| 75 Years and over | 19 (73.1%) | 8 (29.6%) |
Disability Class: Self-Care Difficulty
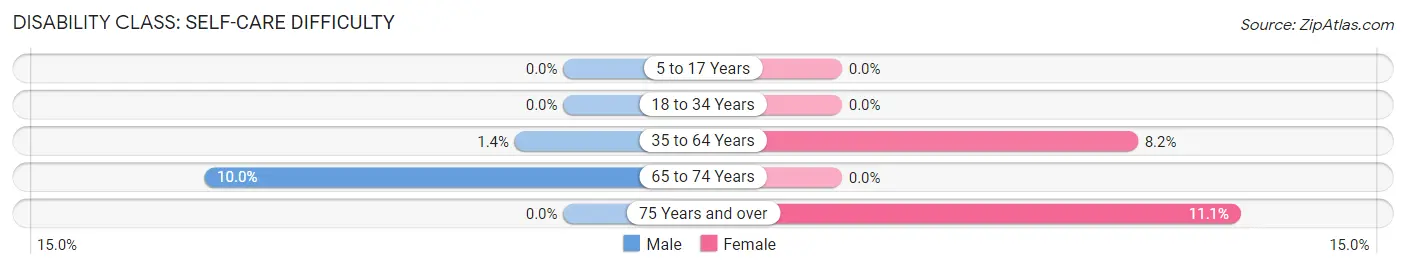
| Age Bracket | Male | Female |
| 5 to 17 Years | 0 (0.0%) | 0 (0.0%) |
| 18 to 34 Years | 0 (0.0%) | 0 (0.0%) |
| 35 to 64 Years | 3 (1.3%) | 15 (8.2%) |
| 65 to 74 Years | 3 (10.0%) | 0 (0.0%) |
| 75 Years and over | 0 (0.0%) | 3 (11.1%) |
Technology Access in Jeffersonville
Computing Device Access in Jeffersonville
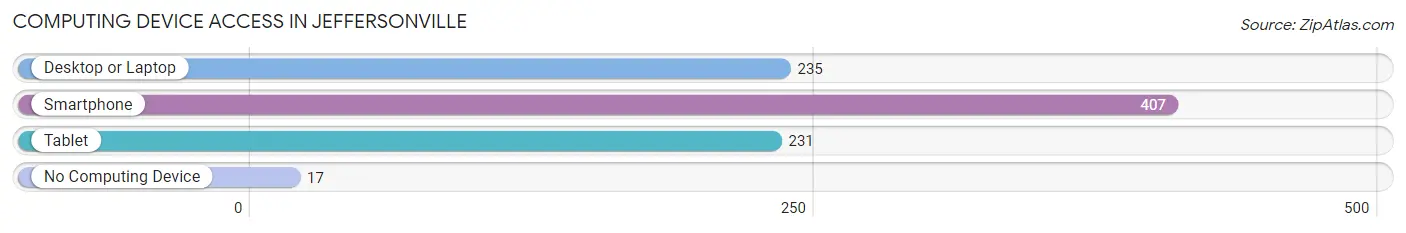
| Device Type | # Households | % Households |
| Desktop or Laptop | 235 | 51.4% |
| Smartphone | 407 | 89.1% |
| Tablet | 231 | 50.5% |
| No Computing Device | 17 | 3.7% |
| Total | 457 | 100.0% |
Internet Access in Jeffersonville
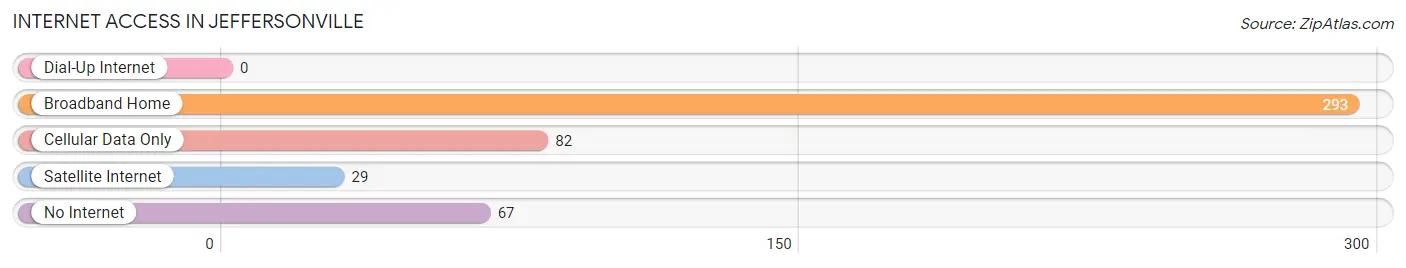
| Internet Type | # Households | % Households |
| Dial-Up Internet | 0 | 0.0% |
| Broadband Home | 293 | 64.1% |
| Cellular Data Only | 82 | 17.9% |
| Satellite Internet | 29 | 6.4% |
| No Internet | 67 | 14.7% |
| Total | 457 | 100.0% |
Jeffersonville Summary
Jeffersonville, Ohio is a small village located in Fayette County, Ohio. It is situated on the banks of the Little Miami River, approximately 25 miles east of Cincinnati. The village was founded in 1805 and is named after Thomas Jefferson, the third President of the United States. The population of Jeffersonville was 1,845 at the 2010 census.
History
Jeffersonville was founded in 1805 by a group of settlers from Pennsylvania. The village was named after Thomas Jefferson, the third President of the United States. The first post office was established in 1808 and the village was incorporated in 1817.
In the early 19th century, Jeffersonville was a thriving agricultural community. The village was home to several mills, including a grist mill, a saw mill, and a woolen mill. The village also had a blacksmith shop, a tannery, and a distillery.
In the late 19th century, Jeffersonville began to experience a period of industrialization. The village was home to several factories, including a brickyard, a furniture factory, and a canning factory. The village also had a railroad station, which connected it to the larger cities of Cincinnati and Dayton.
Geography
Jeffersonville is located in Fayette County, Ohio. It is situated on the banks of the Little Miami River, approximately 25 miles east of Cincinnati. The village has a total area of 0.9 square miles, all of which is land.
The village is located in the Miami Valley region of Ohio. The climate is humid continental, with hot summers and cold winters. The average annual temperature is 52°F. The average annual precipitation is 40 inches.
Economy
The economy of Jeffersonville is largely based on agriculture and manufacturing. The village is home to several farms, which produce corn, soybeans, wheat, and hay. The village also has several factories, which produce furniture, canned goods, and other products.
The village is also home to several small businesses, including restaurants, shops, and service providers. The village also has a post office, a bank, and a library.
Demographics
As of the 2010 census, the population of Jeffersonville was 1,845. The racial makeup of the village was 97.3% White, 0.7% African American, 0.2% Native American, 0.2% Asian, 0.2% from other races, and 1.6% from two or more races. Hispanic or Latino of any race were 0.7% of the population.
The median income for a household in the village was $41,250, and the median income for a family was $50,000. The per capita income for the village was $20,845. About 8.3% of families and 10.2% of the population were below the poverty line, including 14.3% of those under age 18 and 6.2% of those age 65 or over.
Common Questions
What is Per Capita Income in Jeffersonville?
Per Capita income in Jeffersonville is $21,392.
What is the Median Family Income in Jeffersonville?
Median Family Income in Jeffersonville is $39,688.
What is the Median Household income in Jeffersonville?
Median Household Income in Jeffersonville is $38,438.
What is Income or Wage Gap in Jeffersonville?
Income or Wage Gap in Jeffersonville is 59.6%.
Women in Jeffersonville earn 40.4 cents for every dollar earned by a man.
What is Inequality or Gini Index in Jeffersonville?
Inequality or Gini Index in Jeffersonville is 0.48.
What is the Total Population of Jeffersonville?
Total Population of Jeffersonville is 1,085.
What is the Total Male Population of Jeffersonville?
Total Male Population of Jeffersonville is 516.
What is the Total Female Population of Jeffersonville?
Total Female Population of Jeffersonville is 569.
What is the Ratio of Males per 100 Females in Jeffersonville?
There are 90.69 Males per 100 Females in Jeffersonville.
What is the Ratio of Females per 100 Males in Jeffersonville?
There are 110.27 Females per 100 Males in Jeffersonville.
What is the Median Population Age in Jeffersonville?
Median Population Age in Jeffersonville is 35.3 Years.
What is the Average Family Size in Jeffersonville
Average Family Size in Jeffersonville is 3.0 People.
What is the Average Household Size in Jeffersonville
Average Household Size in Jeffersonville is 2.4 People.
How Large is the Labor Force in Jeffersonville?
There are 452 People in the Labor Forcein in Jeffersonville.
What is the Percentage of People in the Labor Force in Jeffersonville?
57.7% of People are in the Labor Force in Jeffersonville.
What is the Unemployment Rate in Jeffersonville?
Unemployment Rate in Jeffersonville is 8.9%.