Cities with the Highest Percentage of Immigrants from Japan in Ohio
RELATED REPORTS & OPTIONS
Japan
Ohio
Compare Cities
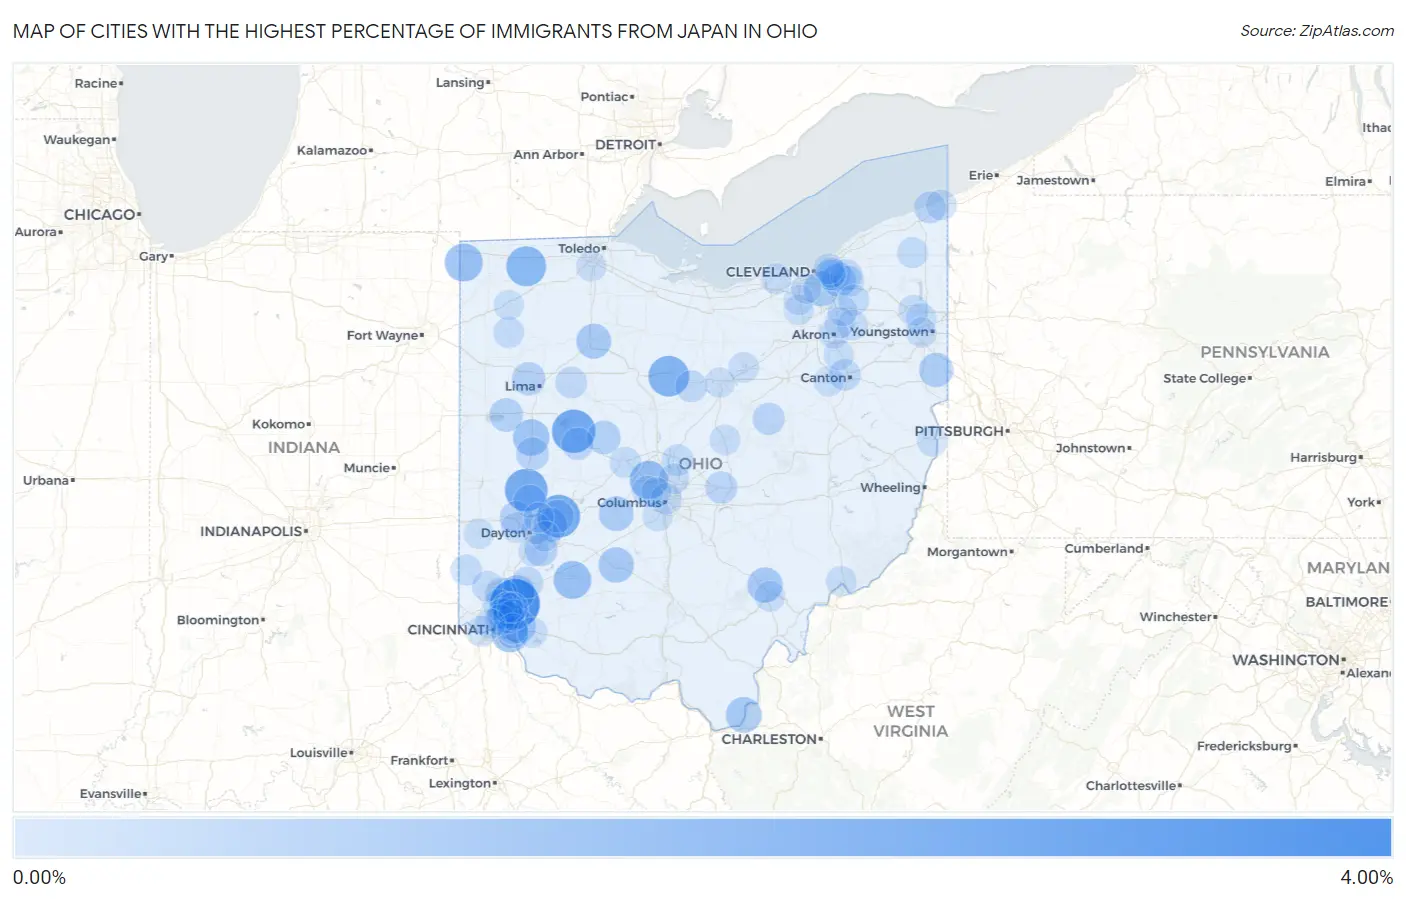
Map of Cities with the Highest Percentage of Immigrants from Japan in Ohio
0.00%
4.00%
Cities with the Highest Percentage of Immigrants from Japan in Ohio
| City | Japan | vs State | vs National | |
| 1. | Sixteen Mile Stand | 3.07% | 0.069%(+3.00)#1 | 0.10%(+2.97)#50 |
| 2. | Huntsville | 2.10% | 0.069%(+2.03)#2 | 0.10%(+2.00)#89 |
| 3. | Enon | 1.99% | 0.069%(+1.92)#3 | 0.10%(+1.89)#98 |
| 4. | Troy | 1.97% | 0.069%(+1.91)#4 | 0.10%(+1.87)#99 |
| 5. | Bucyrus | 1.67% | 0.069%(+1.60)#5 | 0.10%(+1.56)#131 |
| 6. | Pettisville | 1.52% | 0.069%(+1.45)#6 | 0.10%(+1.41)#150 |
| 7. | Dublin | 1.26% | 0.069%(+1.19)#7 | 0.10%(+1.15)#209 |
| 8. | Ridgewood | 1.24% | 0.069%(+1.17)#8 | 0.10%(+1.14)#215 |
| 9. | Edon | 1.22% | 0.069%(+1.15)#9 | 0.10%(+1.12)#221 |
| 10. | Wilmington | 1.20% | 0.069%(+1.13)#10 | 0.10%(+1.10)#226 |
| 11. | Fruit Hill | 1.08% | 0.069%(+1.01)#11 | 0.10%(+0.979)#252 |
| 12. | Anna | 0.98% | 0.069%(+0.916)#12 | 0.10%(+0.881)#288 |
| 13. | Athalia | 0.88% | 0.069%(+0.811)#13 | 0.10%(+0.776)#333 |
| 14. | Washington Court House | 0.83% | 0.069%(+0.765)#14 | 0.10%(+0.731)#356 |
| 15. | Chauncey | 0.80% | 0.069%(+0.732)#15 | 0.10%(+0.698)#387 |
| 16. | Independence | 0.77% | 0.069%(+0.701)#16 | 0.10%(+0.666)#406 |
| 17. | Findlay | 0.76% | 0.069%(+0.691)#17 | 0.10%(+0.656)#413 |
| 18. | London | 0.74% | 0.069%(+0.668)#18 | 0.10%(+0.633)#426 |
| 19. | Mason | 0.73% | 0.069%(+0.659)#19 | 0.10%(+0.624)#432 |
| 20. | Fairborn | 0.67% | 0.069%(+0.601)#20 | 0.10%(+0.566)#456 |
| 21. | New Waterford | 0.67% | 0.069%(+0.600)#21 | 0.10%(+0.565)#457 |
| 22. | Silverton | 0.66% | 0.069%(+0.587)#22 | 0.10%(+0.552)#467 |
| 23. | Summerside | 0.62% | 0.069%(+0.551)#23 | 0.10%(+0.517)#508 |
| 24. | Orange | 0.61% | 0.069%(+0.543)#24 | 0.10%(+0.508)#519 |
| 25. | West Mansfield | 0.57% | 0.069%(+0.498)#25 | 0.10%(+0.463)#566 |
| 26. | St Marys | 0.55% | 0.069%(+0.484)#26 | 0.10%(+0.449)#594 |
| 27. | Elida | 0.51% | 0.069%(+0.437)#27 | 0.10%(+0.403)#655 |
| 28. | Kenwood | 0.46% | 0.069%(+0.390)#28 | 0.10%(+0.355)#733 |
| 29. | Englewood | 0.45% | 0.069%(+0.378)#29 | 0.10%(+0.343)#758 |
| 30. | Tipp City | 0.44% | 0.069%(+0.370)#30 | 0.10%(+0.335)#770 |
| 31. | Sidney | 0.43% | 0.069%(+0.359)#31 | 0.10%(+0.324)#792 |
| 32. | Green Meadows | 0.41% | 0.069%(+0.342)#32 | 0.10%(+0.307)#825 |
| 33. | Bellbrook | 0.40% | 0.069%(+0.327)#33 | 0.10%(+0.293)#848 |
| 34. | Bellefontaine | 0.36% | 0.069%(+0.287)#34 | 0.10%(+0.252)#924 |
| 35. | Granville | 0.35% | 0.069%(+0.277)#35 | 0.10%(+0.243)#944 |
| 36. | Glenmont | 0.34% | 0.069%(+0.270)#36 | 0.10%(+0.236)#962 |
| 37. | Beckett Ridge | 0.30% | 0.069%(+0.235)#37 | 0.10%(+0.200)#1,056 |
| 38. | North Kingsville | 0.29% | 0.069%(+0.222)#38 | 0.10%(+0.188)#1,093 |
| 39. | Galion | 0.27% | 0.069%(+0.201)#39 | 0.10%(+0.166)#1,168 |
| 40. | Beachwood | 0.27% | 0.069%(+0.198)#40 | 0.10%(+0.164)#1,179 |
| 41. | Forestville | 0.26% | 0.069%(+0.192)#41 | 0.10%(+0.158)#1,211 |
| 42. | Ada | 0.26% | 0.069%(+0.187)#42 | 0.10%(+0.152)#1,235 |
| 43. | Hunting Valley | 0.25% | 0.069%(+0.181)#43 | 0.10%(+0.147)#1,254 |
| 44. | Meyers Lake | 0.24% | 0.069%(+0.170)#44 | 0.10%(+0.136)#1,312 |
| 45. | Lebanon | 0.24% | 0.069%(+0.169)#45 | 0.10%(+0.135)#1,315 |
| 46. | Madeira | 0.22% | 0.069%(+0.154)#46 | 0.10%(+0.119)#1,385 |
| 47. | Sunbury | 0.22% | 0.069%(+0.148)#47 | 0.10%(+0.113)#1,416 |
| 48. | Glendale | 0.19% | 0.069%(+0.117)#48 | 0.10%(+0.082)#1,578 |
| 49. | Amberley | 0.18% | 0.069%(+0.114)#49 | 0.10%(+0.080)#1,592 |
| 50. | Marysville | 0.18% | 0.069%(+0.109)#50 | 0.10%(+0.075)#1,619 |
| 51. | Delhi Hills | 0.18% | 0.069%(+0.108)#51 | 0.10%(+0.073)#1,629 |
| 52. | Oxford | 0.17% | 0.069%(+0.104)#52 | 0.10%(+0.069)#1,652 |
| 53. | Hilliard | 0.17% | 0.069%(+0.103)#53 | 0.10%(+0.068)#1,659 |
| 54. | Chagrin Falls | 0.17% | 0.069%(+0.101)#54 | 0.10%(+0.067)#1,665 |
| 55. | Aurora | 0.16% | 0.069%(+0.088)#55 | 0.10%(+0.053)#1,748 |
| 56. | Roaming Shores | 0.15% | 0.069%(+0.084)#56 | 0.10%(+0.050)#1,777 |
| 57. | Oakwood | 0.15% | 0.069%(+0.079)#57 | 0.10%(+0.044)#1,829 |
| 58. | Columbus | 0.14% | 0.069%(+0.071)#58 | 0.10%(+0.036)#1,898 |
| 59. | Niles | 0.14% | 0.069%(+0.069)#59 | 0.10%(+0.035)#1,909 |
| 60. | Hamilton | 0.13% | 0.069%(+0.063)#60 | 0.10%(+0.028)#1,958 |
| 61. | Steubenville | 0.13% | 0.069%(+0.058)#61 | 0.10%(+0.023)#1,995 |
| 62. | Mount Vernon | 0.12% | 0.069%(+0.056)#62 | 0.10%(+0.021)#2,014 |
| 63. | Norwood | 0.12% | 0.069%(+0.052)#63 | 0.10%(+0.018)#2,046 |
| 64. | Centerville | 0.12% | 0.069%(+0.050)#64 | 0.10%(+0.015)#2,070 |
| 65. | Avon | 0.12% | 0.069%(+0.048)#65 | 0.10%(+0.013)#2,089 |
| 66. | Shaker Heights | 0.12% | 0.069%(+0.048)#66 | 0.10%(+0.013)#2,094 |
| 67. | The Village Of Indian Hill | 0.12% | 0.069%(+0.047)#67 | 0.10%(+0.012)#2,102 |
| 68. | Conneaut | 0.11% | 0.069%(+0.044)#68 | 0.10%(+0.010)#2,128 |
| 69. | Athens | 0.11% | 0.069%(+0.041)#69 | 0.10%(+0.007)#2,156 |
| 70. | Ashland | 0.11% | 0.069%(+0.040)#70 | 0.10%(+0.006)#2,166 |
| 71. | Trotwood | 0.11% | 0.069%(+0.039)#71 | 0.10%(+0.005)#2,176 |
| 72. | Riverside | 0.10% | 0.069%(+0.033)#72 | 0.10%(-0.001)#2,243 |
| 73. | Blue Ash | 0.098% | 0.069%(+0.029)#73 | 0.10%(-0.006)#2,297 |
| 74. | Dry Run | 0.094% | 0.069%(+0.026)#74 | 0.10%(-0.009)#2,325 |
| 75. | Cleveland Heights | 0.093% | 0.069%(+0.025)#75 | 0.10%(-0.010)#2,336 |
| 76. | Westerville | 0.090% | 0.069%(+0.021)#76 | 0.10%(-0.013)#2,370 |
| 77. | Marietta | 0.090% | 0.069%(+0.021)#77 | 0.10%(-0.014)#2,374 |
| 78. | Kent | 0.080% | 0.069%(+0.012)#78 | 0.10%(-0.023)#2,472 |
| 79. | Warren | 0.079% | 0.069%(+0.010)#79 | 0.10%(-0.024)#2,493 |
| 80. | Perrysburg | 0.076% | 0.069%(+0.008)#80 | 0.10%(-0.027)#2,531 |
| 81. | Silver Lake | 0.076% | 0.069%(+0.008)#81 | 0.10%(-0.027)#2,533 |
| 82. | Eaton | 0.072% | 0.069%(+0.003)#82 | 0.10%(-0.032)#2,597 |
| 83. | Beavercreek | 0.071% | 0.069%(+0.002)#83 | 0.10%(-0.033)#2,609 |
| 84. | Montgomery | 0.065% | 0.069%(-0.004)#84 | 0.10%(-0.039)#2,674 |
| 85. | Massillon | 0.062% | 0.069%(-0.007)#85 | 0.10%(-0.041)#2,703 |
| 86. | Green | 0.059% | 0.069%(-0.010)#86 | 0.10%(-0.045)#2,769 |
| 87. | Defiance | 0.053% | 0.069%(-0.015)#87 | 0.10%(-0.050)#2,849 |
| 88. | Austintown | 0.053% | 0.069%(-0.016)#88 | 0.10%(-0.051)#2,866 |
| 89. | Mansfield | 0.052% | 0.069%(-0.016)#89 | 0.10%(-0.051)#2,869 |
| 90. | University Heights | 0.051% | 0.069%(-0.018)#90 | 0.10%(-0.052)#2,884 |
| 91. | Akron | 0.050% | 0.069%(-0.019)#91 | 0.10%(-0.053)#2,901 |
| 92. | Cincinnati | 0.041% | 0.069%(-0.027)#92 | 0.10%(-0.062)#3,029 |
| 93. | Grove City | 0.039% | 0.069%(-0.030)#93 | 0.10%(-0.065)#3,061 |
| 94. | Batavia | 0.038% | 0.069%(-0.030)#94 | 0.10%(-0.065)#3,064 |
| 95. | Brunswick | 0.037% | 0.069%(-0.032)#95 | 0.10%(-0.067)#3,088 |
| 96. | Hudson | 0.035% | 0.069%(-0.034)#96 | 0.10%(-0.069)#3,121 |
| 97. | Strongsville | 0.035% | 0.069%(-0.034)#97 | 0.10%(-0.069)#3,124 |
| 98. | Parma Heights | 0.034% | 0.069%(-0.035)#98 | 0.10%(-0.070)#3,133 |
| 99. | Upper Arlington | 0.033% | 0.069%(-0.036)#99 | 0.10%(-0.071)#3,148 |
| 100. | Huber Heights | 0.032% | 0.069%(-0.036)#100 | 0.10%(-0.071)#3,152 |
Common Questions
What are the Top 10 Cities with the Highest Percentage of Immigrants from Japan in Ohio?
Top 10 Cities with the Highest Percentage of Immigrants from Japan in Ohio are:
#1
3.07%
#2
2.10%
#3
1.99%
#4
1.97%
#5
1.67%
#6
1.52%
#7
1.26%
#8
1.22%
#9
1.20%
#10
1.08%
What city has the Highest Percentage of Immigrants from Japan in Ohio?
Sixteen Mile Stand has the Highest Percentage of Immigrants from Japan in Ohio with 3.07%.
What is the Percentage of Immigrants from Japan in the State of Ohio?
Percentage of Immigrants from Japan in Ohio is 0.069%.
What is the Percentage of Immigrants from Japan in the United States?
Percentage of Immigrants from Japan in the United States is 0.10%.