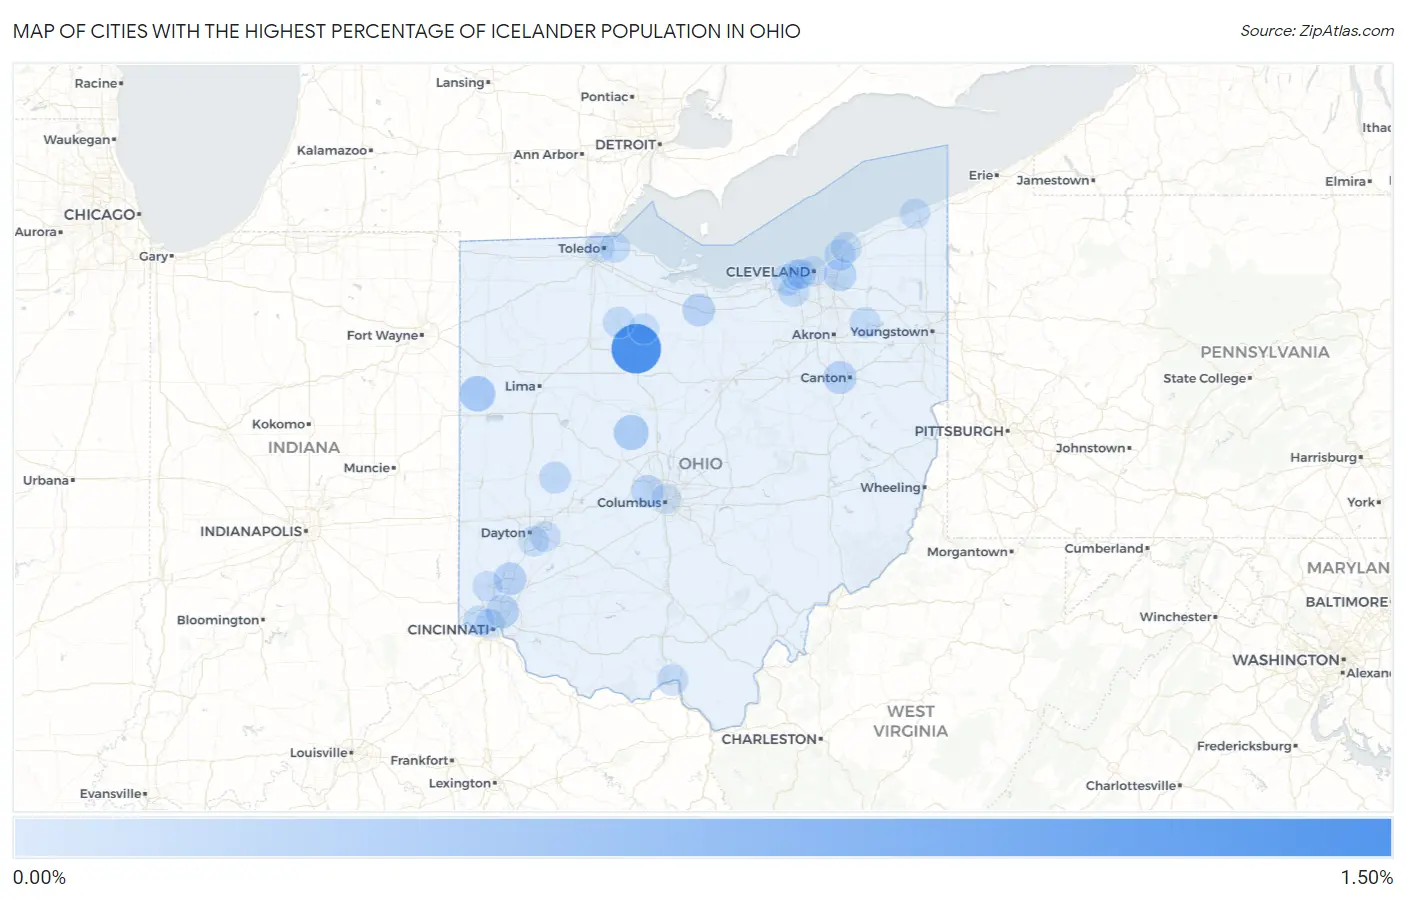
Cities with the Highest Percentage of Icelander Population in Ohio
RELATED REPORTS & OPTIONS
Icelander
Ohio
Compare Cities
Map of Cities with the Highest Percentage of Icelander Population in Ohio
0.00%
1.50%
Cities with the Highest Percentage of Icelander Population in Ohio
| City | Icelander | vs State | vs National | |
| 1. | Mccutchenville | 1.12% | 0.0081%(+1.11)#1 | 0.016%(+1.10)#100 |
| 2. | Rockford | 0.30% | 0.0081%(+0.296)#2 | 0.016%(+0.289)#341 |
| 3. | Richwood | 0.27% | 0.0081%(+0.262)#3 | 0.016%(+0.254)#372 |
| 4. | Reading | 0.16% | 0.0081%(+0.153)#4 | 0.016%(+0.146)#537 |
| 5. | Perry Heights | 0.16% | 0.0081%(+0.152)#5 | 0.016%(+0.144)#542 |
| 6. | Monroe | 0.15% | 0.0081%(+0.143)#6 | 0.016%(+0.136)#552 |
| 7. | Monroeville | 0.14% | 0.0081%(+0.136)#7 | 0.016%(+0.128)#566 |
| 8. | Hilliard | 0.14% | 0.0081%(+0.128)#8 | 0.016%(+0.120)#593 |
| 9. | Pepper Pike | 0.13% | 0.0081%(+0.125)#9 | 0.016%(+0.117)#600 |
| 10. | St Paris | 0.094% | 0.0081%(+0.085)#10 | 0.016%(+0.078)#691 |
| 11. | Westlake | 0.082% | 0.0081%(+0.074)#11 | 0.016%(+0.067)#731 |
| 12. | Fostoria | 0.077% | 0.0081%(+0.069)#12 | 0.016%(+0.062)#751 |
| 13. | Portsmouth | 0.072% | 0.0081%(+0.064)#13 | 0.016%(+0.056)#771 |
| 14. | Wickliffe | 0.071% | 0.0081%(+0.063)#14 | 0.016%(+0.055)#778 |
| 15. | Bridgetown | 0.067% | 0.0081%(+0.058)#15 | 0.016%(+0.051)#801 |
| 16. | Berea | 0.059% | 0.0081%(+0.051)#16 | 0.016%(+0.044)#845 |
| 17. | Rocky River | 0.056% | 0.0081%(+0.048)#17 | 0.016%(+0.040)#863 |
| 18. | Ravenna | 0.053% | 0.0081%(+0.045)#18 | 0.016%(+0.037)#879 |
| 19. | Willoughby | 0.042% | 0.0081%(+0.034)#19 | 0.016%(+0.026)#952 |
| 20. | Oregon | 0.035% | 0.0081%(+0.027)#20 | 0.016%(+0.020)#1,003 |
| 21. | Beavercreek | 0.034% | 0.0081%(+0.026)#21 | 0.016%(+0.019)#1,010 |
| 22. | Tiffin | 0.034% | 0.0081%(+0.025)#22 | 0.016%(+0.018)#1,016 |
| 23. | Ashtabula | 0.028% | 0.0081%(+0.020)#23 | 0.016%(+0.012)#1,064 |
| 24. | Kettering | 0.026% | 0.0081%(+0.018)#24 | 0.016%(+0.010)#1,080 |
| 25. | Hamilton | 0.019% | 0.0081%(+0.011)#25 | 0.016%(+0.003)#1,154 |
| 26. | Cleveland | 0.018% | 0.0081%(+0.010)#26 | 0.016%(+0.002)#1,173 |
| 27. | Lakewood | 0.012% | 0.0081%(+0.004)#27 | 0.016%(-0.004)#1,237 |
| 28. | Cincinnati | 0.0084% | 0.0081%(+0.000)#28 | 0.016%(-0.007)#1,291 |
| 29. | Columbus | 0.0052% | 0.0081%(-0.003)#29 | 0.016%(-0.010)#1,325 |
| 30. | Toledo | 0.0019% | 0.0081%(-0.006)#30 | 0.016%(-0.014)#1,354 |
Common Questions
What are the Top 10 Cities with the Highest Percentage of Icelander Population in Ohio?
Top 10 Cities with the Highest Percentage of Icelander Population in Ohio are:
#1
1.12%
#2
0.30%
#3
0.27%
#4
0.16%
#5
0.16%
#6
0.15%
#7
0.14%
#8
0.14%
#9
0.13%
#10
0.094%
What city has the Highest Percentage of Icelander Population in Ohio?
McCutchenville has the Highest Percentage of Icelander Population in Ohio with 1.12%.
What is the Percentage of Icelander Population in the State of Ohio?
Percentage of Icelander Population in Ohio is 0.0081%.
What is the Percentage of Icelander Population in the United States?
Percentage of Icelander Population in the United States is 0.016%.