Cities with the Highest Percentage of Population with a Degree in Literature and Languages in Delaware
RELATED REPORTS & OPTIONS
Literature and Languages
Delaware
Compare Cities
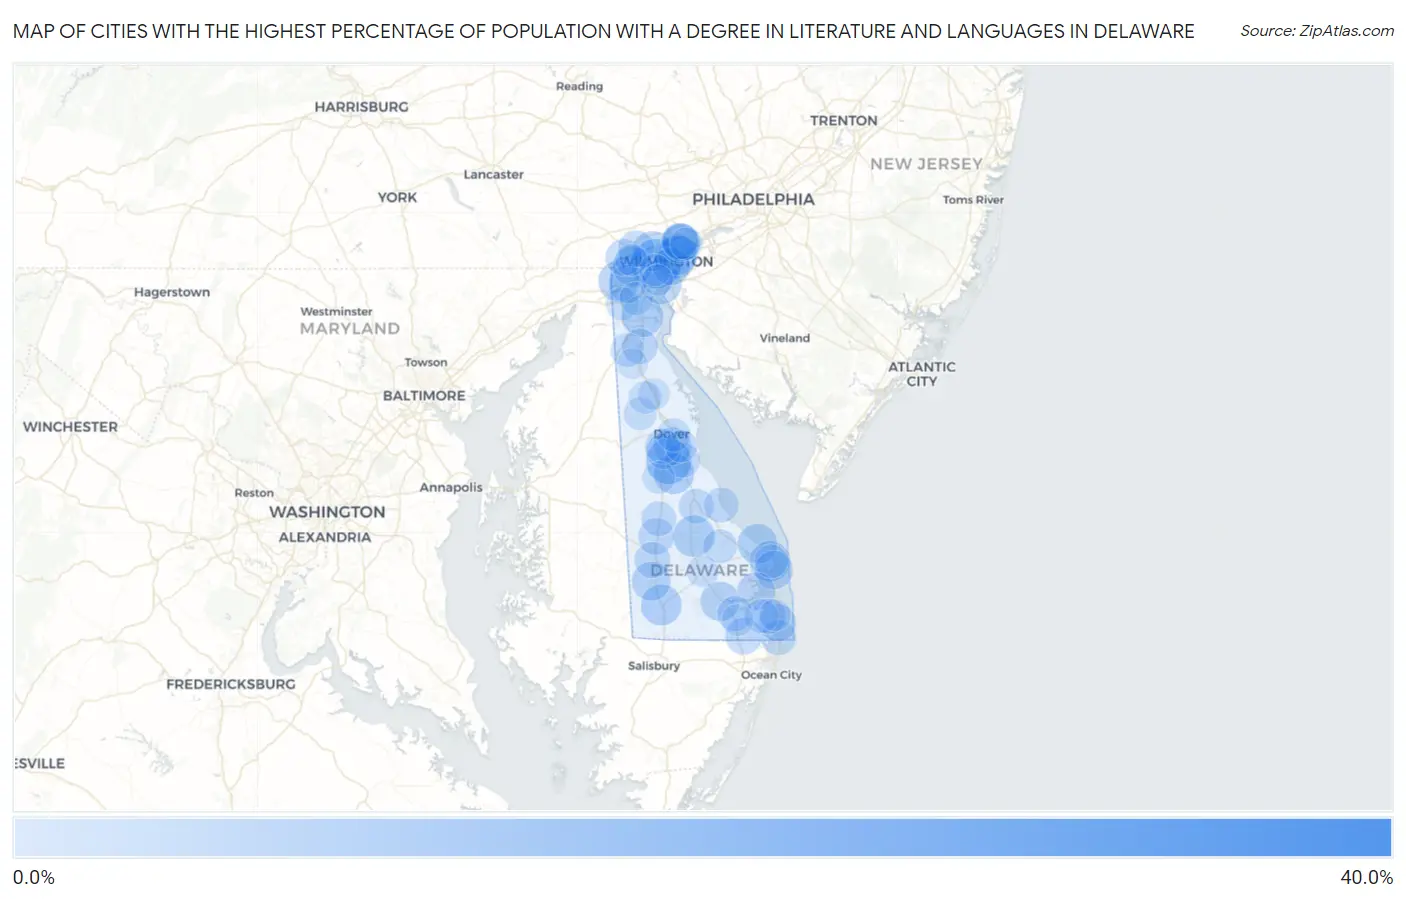
Map of Cities with the Highest Percentage of Population with a Degree in Literature and Languages in Delaware
0.0%
40.0%
Cities with the Highest Percentage of Population with a Degree in Literature and Languages in Delaware
| City | % Graduates | vs State | vs National | |
| 1. | Lincoln | 37.0% | 4.1%(+32.9)#1 | 4.4%(+32.6)#184 |
| 2. | Elsmere | 14.0% | 4.1%(+9.91)#2 | 4.4%(+9.60)#1,218 |
| 3. | Woodside East | 10.9% | 4.1%(+6.78)#3 | 4.4%(+6.47)#1,854 |
| 4. | Edgemoor | 8.6% | 4.1%(+4.55)#4 | 4.4%(+4.24)#2,780 |
| 5. | Ellendale | 8.3% | 4.1%(+4.23)#5 | 4.4%(+3.92)#2,965 |
| 6. | St Georges | 8.2% | 4.1%(+4.06)#6 | 4.4%(+3.75)#3,074 |
| 7. | New Castle | 7.9% | 4.1%(+3.75)#7 | 4.4%(+3.45)#3,255 |
| 8. | Laurel | 7.7% | 4.1%(+3.59)#8 | 4.4%(+3.28)#3,347 |
| 9. | Newark | 7.6% | 4.1%(+3.49)#9 | 4.4%(+3.19)#3,444 |
| 10. | Riverview | 7.5% | 4.1%(+3.39)#10 | 4.4%(+3.08)#3,516 |
| 11. | Rehoboth Beach | 7.4% | 4.1%(+3.33)#11 | 4.4%(+3.02)#3,551 |
| 12. | Greenville | 7.3% | 4.1%(+3.22)#12 | 4.4%(+2.91)#3,641 |
| 13. | Bellefonte | 7.1% | 4.1%(+2.98)#13 | 4.4%(+2.68)#3,859 |
| 14. | Lewes | 6.9% | 4.1%(+2.80)#14 | 4.4%(+2.50)#4,037 |
| 15. | Pike Creek Valley | 6.8% | 4.1%(+2.73)#15 | 4.4%(+2.43)#4,108 |
| 16. | Millsboro | 6.6% | 4.1%(+2.48)#16 | 4.4%(+2.17)#4,350 |
| 17. | Ardencroft | 6.4% | 4.1%(+2.32)#17 | 4.4%(+2.01)#4,526 |
| 18. | Seaford | 6.2% | 4.1%(+2.14)#18 | 4.4%(+1.83)#4,739 |
| 19. | Dewey Beach | 6.0% | 4.1%(+1.88)#19 | 4.4%(+1.57)#5,062 |
| 20. | Brookside | 5.6% | 4.1%(+1.55)#20 | 4.4%(+1.24)#5,483 |
| 21. | Wilmington | 5.5% | 4.1%(+1.44)#21 | 4.4%(+1.13)#5,645 |
| 22. | Long Neck | 5.5% | 4.1%(+1.40)#22 | 4.4%(+1.10)#5,689 |
| 23. | Highland Acres | 5.4% | 4.1%(+1.28)#23 | 4.4%(+0.978)#5,868 |
| 24. | Ardentown | 5.3% | 4.1%(+1.20)#24 | 4.4%(+0.888)#5,999 |
| 25. | South Bethany | 5.2% | 4.1%(+1.08)#25 | 4.4%(+0.772)#6,221 |
| 26. | Selbyville | 4.7% | 4.1%(+0.556)#26 | 4.4%(+0.248)#7,170 |
| 27. | North Star | 4.7% | 4.1%(+0.549)#27 | 4.4%(+0.242)#7,177 |
| 28. | Hockessin | 4.6% | 4.1%(+0.497)#28 | 4.4%(+0.190)#7,269 |
| 29. | Arden | 4.5% | 4.1%(+0.375)#29 | 4.4%(+0.068)#7,510 |
| 30. | Greenwood | 4.3% | 4.1%(+0.219)#30 | 4.4%(-0.089)#7,824 |
| 31. | Bridgeville | 4.2% | 4.1%(+0.110)#31 | 4.4%(-0.198)#8,081 |
| 32. | Odessa | 3.8% | 4.1%(-0.286)#32 | 4.4%(-0.593)#9,000 |
| 33. | Camden | 3.8% | 4.1%(-0.298)#33 | 4.4%(-0.605)#9,015 |
| 34. | Dagsboro | 3.7% | 4.1%(-0.364)#34 | 4.4%(-0.671)#9,162 |
| 35. | Fenwick Island | 3.7% | 4.1%(-0.364)#35 | 4.4%(-0.671)#9,164 |
| 36. | Ocean View | 3.5% | 4.1%(-0.577)#36 | 4.4%(-0.884)#9,686 |
| 37. | Milford | 3.5% | 4.1%(-0.605)#37 | 4.4%(-0.912)#9,751 |
| 38. | Magnolia | 3.4% | 4.1%(-0.654)#38 | 4.4%(-0.961)#9,858 |
| 39. | Wyoming | 3.4% | 4.1%(-0.678)#39 | 4.4%(-0.985)#9,897 |
| 40. | Slaughter Beach | 3.4% | 4.1%(-0.713)#40 | 4.4%(-1.02)#9,994 |
| 41. | Farmington | 3.3% | 4.1%(-0.824)#41 | 4.4%(-1.13)#10,265 |
| 42. | Middletown | 2.7% | 4.1%(-1.40)#42 | 4.4%(-1.71)#11,616 |
| 43. | Milton | 2.7% | 4.1%(-1.41)#43 | 4.4%(-1.72)#11,645 |
| 44. | Millville | 2.7% | 4.1%(-1.42)#44 | 4.4%(-1.73)#11,660 |
| 45. | Henlopen Acres | 2.5% | 4.1%(-1.60)#45 | 4.4%(-1.91)#12,085 |
| 46. | Dover | 2.4% | 4.1%(-1.70)#46 | 4.4%(-2.01)#12,309 |
| 47. | Glasgow | 2.3% | 4.1%(-1.76)#47 | 4.4%(-2.07)#12,441 |
| 48. | Bear | 2.3% | 4.1%(-1.76)#48 | 4.4%(-2.07)#12,449 |
| 49. | Kenton | 2.0% | 4.1%(-2.10)#49 | 4.4%(-2.41)#13,282 |
| 50. | Clayton | 1.7% | 4.1%(-2.35)#50 | 4.4%(-2.66)#13,886 |
| 51. | Felton | 1.7% | 4.1%(-2.36)#51 | 4.4%(-2.67)#13,914 |
| 52. | Dover Base Housing | 1.6% | 4.1%(-2.55)#52 | 4.4%(-2.86)#14,330 |
| 53. | Claymont | 1.5% | 4.1%(-2.65)#53 | 4.4%(-2.95)#14,519 |
| 54. | Smyrna | 1.3% | 4.1%(-2.79)#54 | 4.4%(-3.10)#14,819 |
| 55. | Newport | 1.2% | 4.1%(-2.88)#55 | 4.4%(-3.19)#14,988 |
| 56. | Bethany Beach | 1.2% | 4.1%(-2.94)#56 | 4.4%(-3.25)#15,080 |
| 57. | Pike Creek | 1.1% | 4.1%(-2.99)#57 | 4.4%(-3.30)#15,176 |
| 58. | Georgetown | 1.1% | 4.1%(-3.01)#58 | 4.4%(-3.32)#15,222 |
| 59. | Frankford | 1.0% | 4.1%(-3.06)#59 | 4.4%(-3.37)#15,311 |
| 60. | Wilmington Manor | 0.60% | 4.1%(-3.50)#60 | 4.4%(-3.81)#15,891 |
| 61. | Townsend | 0.39% | 4.1%(-3.71)#61 | 4.4%(-4.02)#16,051 |
1
Common Questions
What are the Top 10 Cities with the Highest Percentage of Population with a Degree in Literature and Languages in Delaware?
Top 10 Cities with the Highest Percentage of Population with a Degree in Literature and Languages in Delaware are:
#1
14.0%
#2
10.9%
#3
8.6%
#4
8.3%
#5
8.2%
#6
7.9%
#7
7.7%
#8
7.6%
#9
7.5%
#10
7.4%
What city has the Highest Percentage of Population with a Degree in Literature and Languages in Delaware?
Elsmere has the Highest Percentage of Population with a Degree in Literature and Languages in Delaware with 14.0%.
What is the Percentage of Population with a Degree in Literature and Languages in the State of Delaware?
Percentage of Population with a Degree in Literature and Languages in Delaware is 4.1%.
What is the Percentage of Population with a Degree in Literature and Languages in the United States?
Percentage of Population with a Degree in Literature and Languages in the United States is 4.4%.