Marion, OH Map & Demographics
Marion Map
Marion Overview
$20,974
PER CAPITA INCOME
$53,855
AVG FAMILY INCOME
$44,879
AVG HOUSEHOLD INCOME
26.9%
WAGE / INCOME GAP [ % ]
73.1¢/ $1
WAGE / INCOME GAP [ $ ]
$12,655
FAMILY INCOME DEFICIT
0.42
INEQUALITY / GINI INDEX
35,927
TOTAL POPULATION
20,302
MALE POPULATION
15,625
FEMALE POPULATION
129.93
MALES / 100 FEMALES
76.96
FEMALES / 100 MALES
37.7
MEDIAN AGE
3.2
AVG FAMILY SIZE
2.5
AVG HOUSEHOLD SIZE
14,705
LABOR FORCE [ PEOPLE ]
50.4%
PERCENT IN LABOR FORCE
8.7%
UNEMPLOYMENT RATE
Marion Zip Codes
Marion Area Codes
Income in Marion
Income Overview in Marion
Per Capita Income in Marion is $20,974, while median incomes of families and households are $53,855 and $44,879 respectively.
| Characteristic | Number | Measure |
| Per Capita Income | 35,927 | $20,974 |
| Median Family Income | 7,200 | $53,855 |
| Mean Family Income | 7,200 | $66,568 |
| Median Household Income | 12,266 | $44,879 |
| Mean Household Income | 12,266 | $56,751 |
| Income Deficit | 7,200 | $12,655 |
| Wage / Income Gap (%) | 35,927 | 26.86% |
| Wage / Income Gap ($) | 35,927 | 73.14¢ per $1 |
| Gini / Inequality Index | 35,927 | 0.42 |
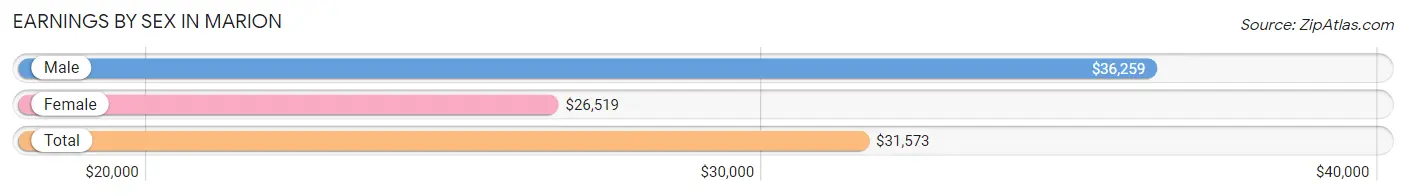
Earnings by Sex in Marion
Average Earnings in Marion are $31,573, $36,259 for men and $26,519 for women, a difference of 26.9%.
| Sex | Number | Average Earnings |
| Male | 8,686 (57.0%) | $36,259 |
| Female | 6,562 (43.0%) | $26,519 |
| Total | 15,248 (100.0%) | $31,573 |
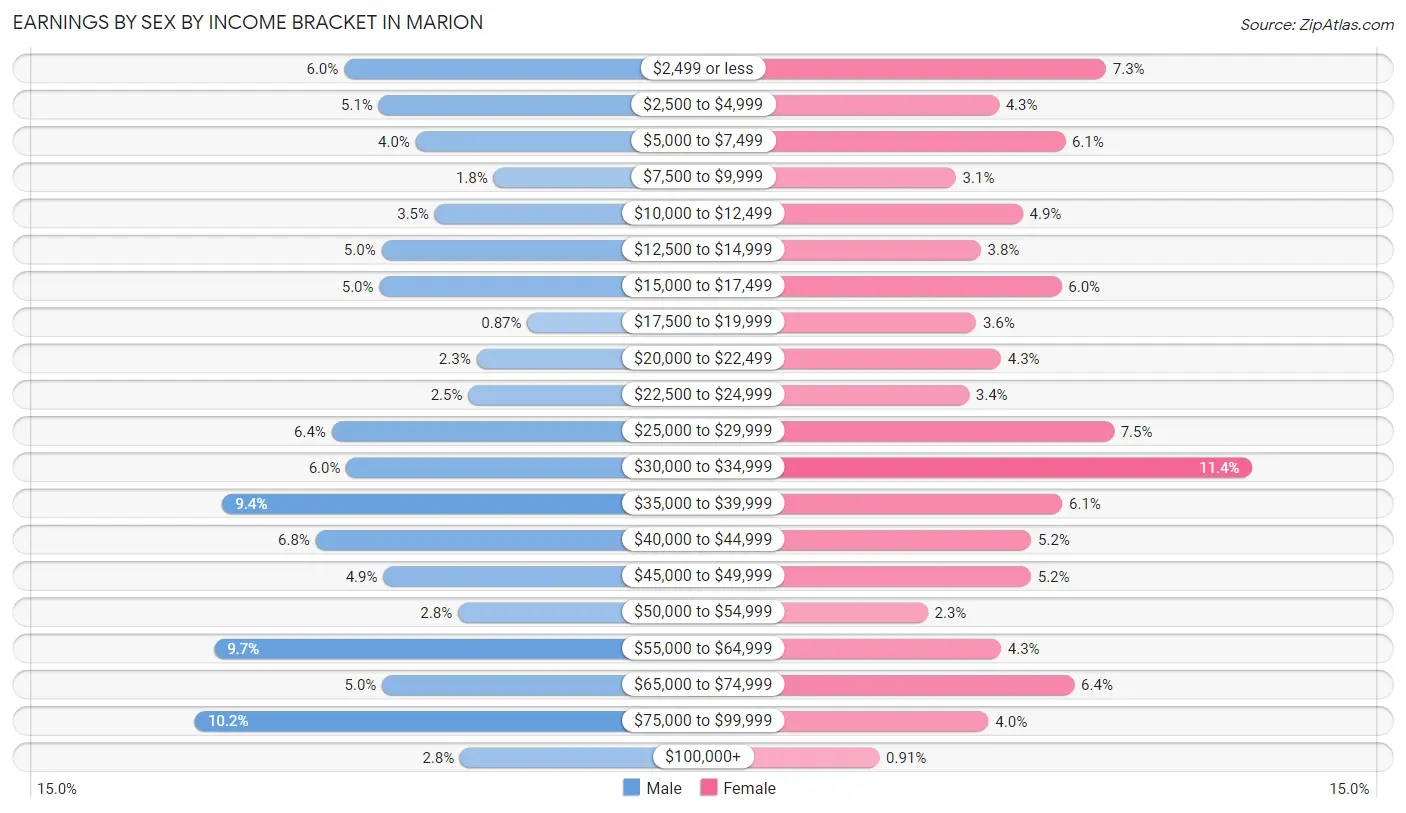
Earnings by Sex by Income Bracket in Marion
The most common earnings brackets in Marion are $75,000 to $99,999 for men (887 | 10.2%) and $30,000 to $34,999 for women (746 | 11.4%).
| Income | Male | Female |
| $2,499 or less | 523 (6.0%) | 478 (7.3%) |
| $2,500 to $4,999 | 439 (5.1%) | 280 (4.3%) |
| $5,000 to $7,499 | 348 (4.0%) | 402 (6.1%) |
| $7,500 to $9,999 | 158 (1.8%) | 201 (3.1%) |
| $10,000 to $12,499 | 301 (3.5%) | 324 (4.9%) |
| $12,500 to $14,999 | 432 (5.0%) | 247 (3.8%) |
| $15,000 to $17,499 | 437 (5.0%) | 396 (6.0%) |
| $17,500 to $19,999 | 76 (0.9%) | 238 (3.6%) |
| $20,000 to $22,499 | 200 (2.3%) | 284 (4.3%) |
| $22,500 to $24,999 | 220 (2.5%) | 225 (3.4%) |
| $25,000 to $29,999 | 553 (6.4%) | 492 (7.5%) |
| $30,000 to $34,999 | 518 (6.0%) | 746 (11.4%) |
| $35,000 to $39,999 | 820 (9.4%) | 397 (6.0%) |
| $40,000 to $44,999 | 592 (6.8%) | 340 (5.2%) |
| $45,000 to $49,999 | 427 (4.9%) | 339 (5.2%) |
| $50,000 to $54,999 | 245 (2.8%) | 149 (2.3%) |
| $55,000 to $64,999 | 840 (9.7%) | 284 (4.3%) |
| $65,000 to $74,999 | 430 (5.0%) | 419 (6.4%) |
| $75,000 to $99,999 | 887 (10.2%) | 261 (4.0%) |
| $100,000+ | 240 (2.8%) | 60 (0.9%) |
| Total | 8,686 (100.0%) | 6,562 (100.0%) |
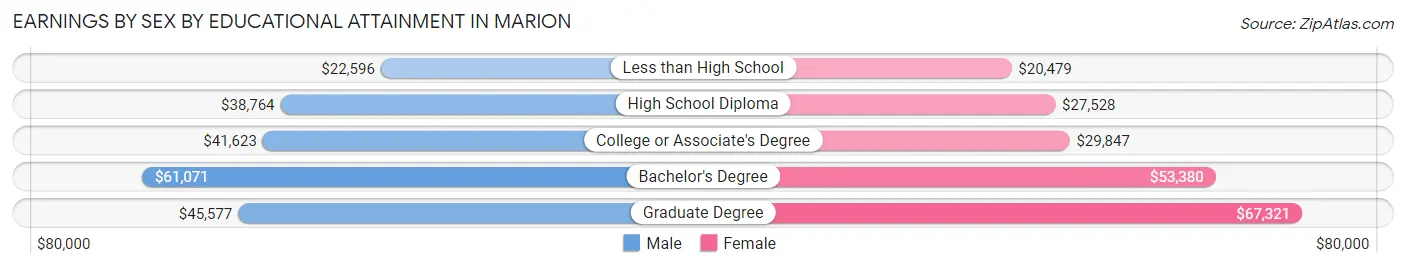
Earnings by Sex by Educational Attainment in Marion
Average earnings in Marion are $39,557 for men and $31,046 for women, a difference of 21.5%. Men with an educational attainment of bachelor's degree enjoy the highest average annual earnings of $61,071, while those with less than high school education earn the least with $22,596. Women with an educational attainment of graduate degree earn the most with the average annual earnings of $67,321, while those with less than high school education have the smallest earnings of $20,479.
| Educational Attainment | Male Income | Female Income |
| Less than High School | $22,596 | $20,479 |
| High School Diploma | $38,764 | $27,528 |
| College or Associate's Degree | $41,623 | $29,847 |
| Bachelor's Degree | $61,071 | $53,380 |
| Graduate Degree | $45,577 | $67,321 |
| Total | $39,557 | $31,046 |
Family Income in Marion
Family Income Brackets in Marion
According to the Marion family income data, there are 1,361 families falling into the $50,000 to $74,999 income range, which is the most common income bracket and makes up 18.9% of all families. Conversely, the $200,000+ income bracket is the least frequent group with only 79 families (1.1%) belonging to this category.
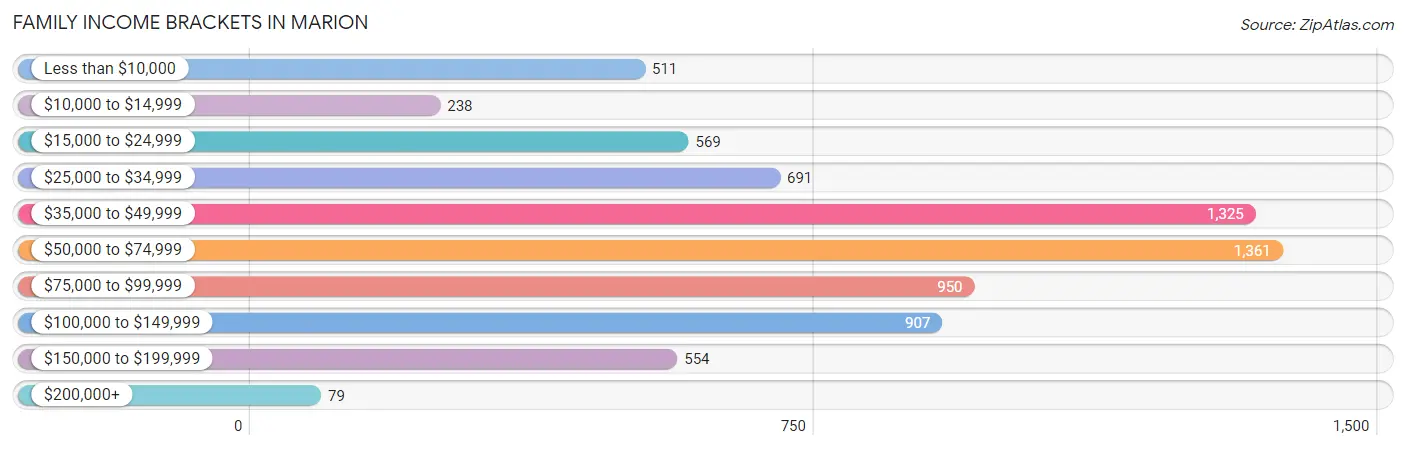
| Income Bracket | # Families | % Families |
| Less than $10,000 | 511 | 7.1% |
| $10,000 to $14,999 | 238 | 3.3% |
| $15,000 to $24,999 | 569 | 7.9% |
| $25,000 to $34,999 | 691 | 9.6% |
| $35,000 to $49,999 | 1,325 | 18.4% |
| $50,000 to $74,999 | 1,361 | 18.9% |
| $75,000 to $99,999 | 950 | 13.2% |
| $100,000 to $149,999 | 907 | 12.6% |
| $150,000 to $199,999 | 554 | 7.7% |
| $200,000+ | 79 | 1.1% |
Family Income by Famaliy Size in Marion
4-person families (1,315 | 18.3%) account for the highest median family income in Marion with $67,750 per family, while 2-person families (3,625 | 50.3%) have the highest median income of $25,672 per family member.
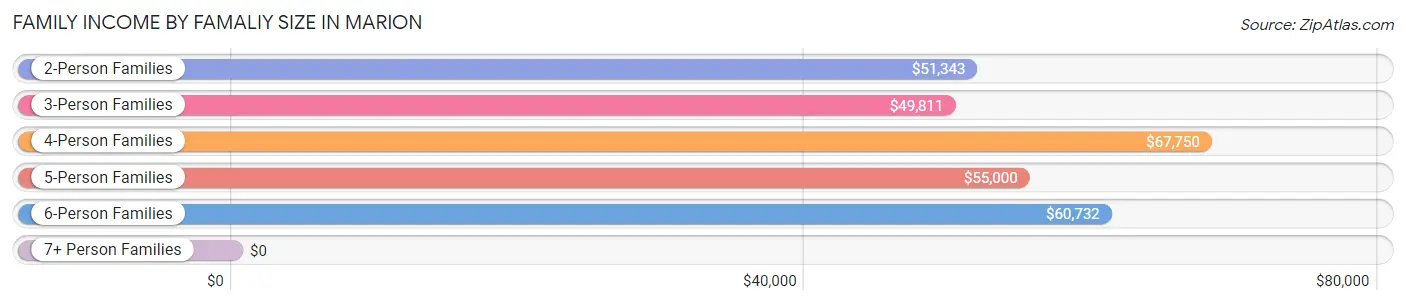
| Income Bracket | # Families | Median Income |
| 2-Person Families | 3,625 (50.3%) | $51,343 |
| 3-Person Families | 1,244 (17.3%) | $49,811 |
| 4-Person Families | 1,315 (18.3%) | $67,750 |
| 5-Person Families | 674 (9.4%) | $55,000 |
| 6-Person Families | 266 (3.7%) | $60,732 |
| 7+ Person Families | 76 (1.1%) | $0 |
| Total | 7,200 (100.0%) | $53,855 |
Family Income by Number of Earners in Marion
The median family income in Marion is $53,855, with families comprising 3+ earners (569) having the highest median family income of $115,980, while families with no earners (1,191) have the lowest median family income of $32,193, accounting for 7.9% and 16.5% of families, respectively.
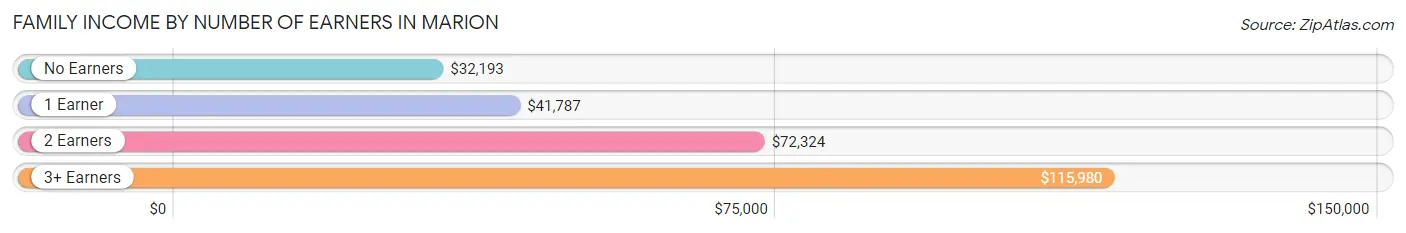
| Number of Earners | # Families | Median Income |
| No Earners | 1,191 (16.5%) | $32,193 |
| 1 Earner | 3,082 (42.8%) | $41,787 |
| 2 Earners | 2,358 (32.8%) | $72,324 |
| 3+ Earners | 569 (7.9%) | $115,980 |
| Total | 7,200 (100.0%) | $53,855 |
Household Income in Marion
Household Income Brackets in Marion
With 2,171 households falling in the category, the $35,000 to $49,999 income range is the most frequent in Marion, accounting for 17.7% of all households. In contrast, only 86 households (0.7%) fall into the $200,000+ income bracket, making it the least populous group.
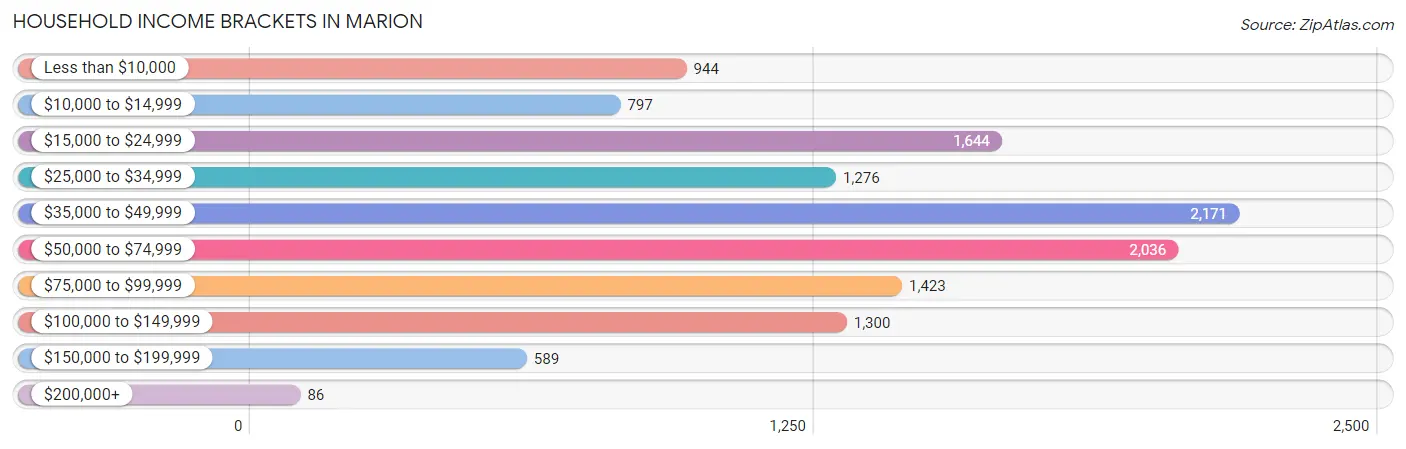
| Income Bracket | # Households | % Households |
| Less than $10,000 | 944 | 7.7% |
| $10,000 to $14,999 | 797 | 6.5% |
| $15,000 to $24,999 | 1,644 | 13.4% |
| $25,000 to $34,999 | 1,276 | 10.4% |
| $35,000 to $49,999 | 2,171 | 17.7% |
| $50,000 to $74,999 | 2,036 | 16.6% |
| $75,000 to $99,999 | 1,423 | 11.6% |
| $100,000 to $149,999 | 1,300 | 10.6% |
| $150,000 to $199,999 | 589 | 4.8% |
| $200,000+ | 86 | 0.7% |
Household Income by Householder Age in Marion
The median household income in Marion is $44,879, with the highest median household income of $49,421 found in the 25 to 44 years age bracket for the primary householder. A total of 3,782 households (30.8%) fall into this category. Meanwhile, the 65+ years age bracket for the primary householder has the lowest median household income of $33,601, with 3,154 households (25.7%) in this group.
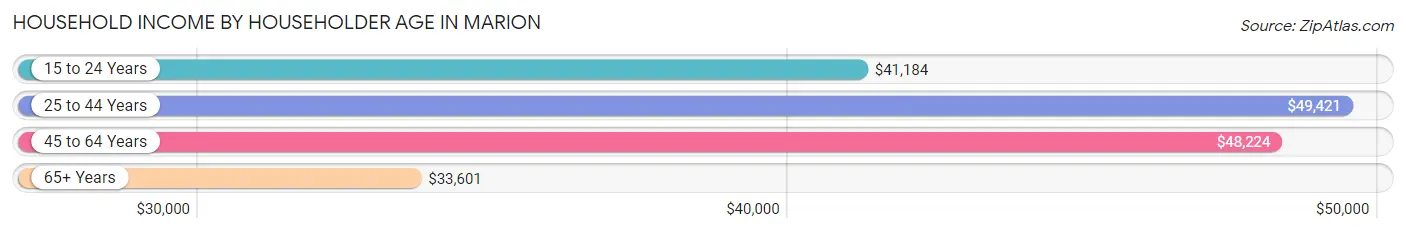
| Income Bracket | # Households | Median Income |
| 15 to 24 Years | 694 (5.7%) | $41,184 |
| 25 to 44 Years | 3,782 (30.8%) | $49,421 |
| 45 to 64 Years | 4,636 (37.8%) | $48,224 |
| 65+ Years | 3,154 (25.7%) | $33,601 |
| Total | 12,266 (100.0%) | $44,879 |
Poverty in Marion
Income Below Poverty by Sex and Age in Marion
With 20.4% poverty level for males and 23.2% for females among the residents of Marion, 12 to 14 year old males and 15 year old females are the most vulnerable to poverty, with 453 males (52.2%) and 115 females (71.0%) in their respective age groups living below the poverty level.
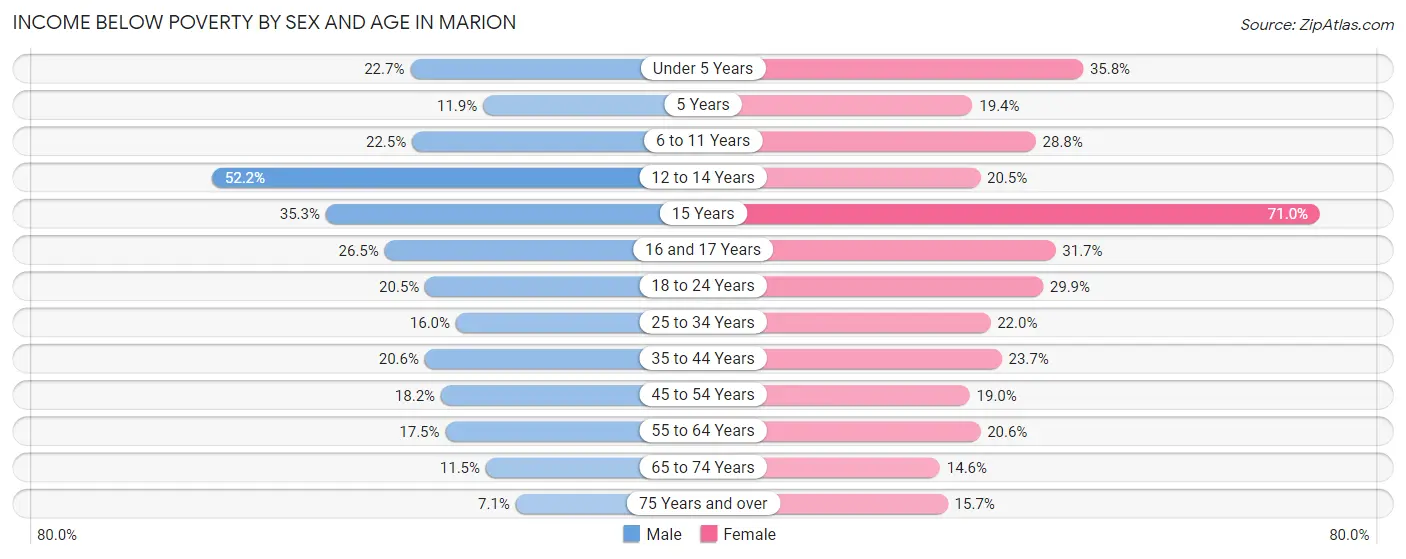
| Age Bracket | Male | Female |
| Under 5 Years | 249 (22.7%) | 371 (35.8%) |
| 5 Years | 13 (11.9%) | 38 (19.4%) |
| 6 to 11 Years | 262 (22.5%) | 339 (28.8%) |
| 12 to 14 Years | 453 (52.2%) | 93 (20.5%) |
| 15 Years | 121 (35.3%) | 115 (71.0%) |
| 16 and 17 Years | 86 (26.5%) | 91 (31.7%) |
| 18 to 24 Years | 314 (20.5%) | 421 (29.9%) |
| 25 to 34 Years | 426 (16.0%) | 494 (22.0%) |
| 35 to 44 Years | 365 (20.6%) | 432 (23.7%) |
| 45 to 54 Years | 311 (18.2%) | 313 (19.0%) |
| 55 to 64 Years | 356 (17.5%) | 446 (20.5%) |
| 65 to 74 Years | 148 (11.5%) | 211 (14.6%) |
| 75 Years and over | 33 (7.1%) | 205 (15.7%) |
| Total | 3,137 (20.4%) | 3,569 (23.2%) |
Income Above Poverty by Sex and Age in Marion
According to the poverty statistics in Marion, males aged 75 years and over and females aged 65 to 74 years are the age groups that are most secure financially, with 92.9% of males and 85.4% of females in these age groups living above the poverty line.
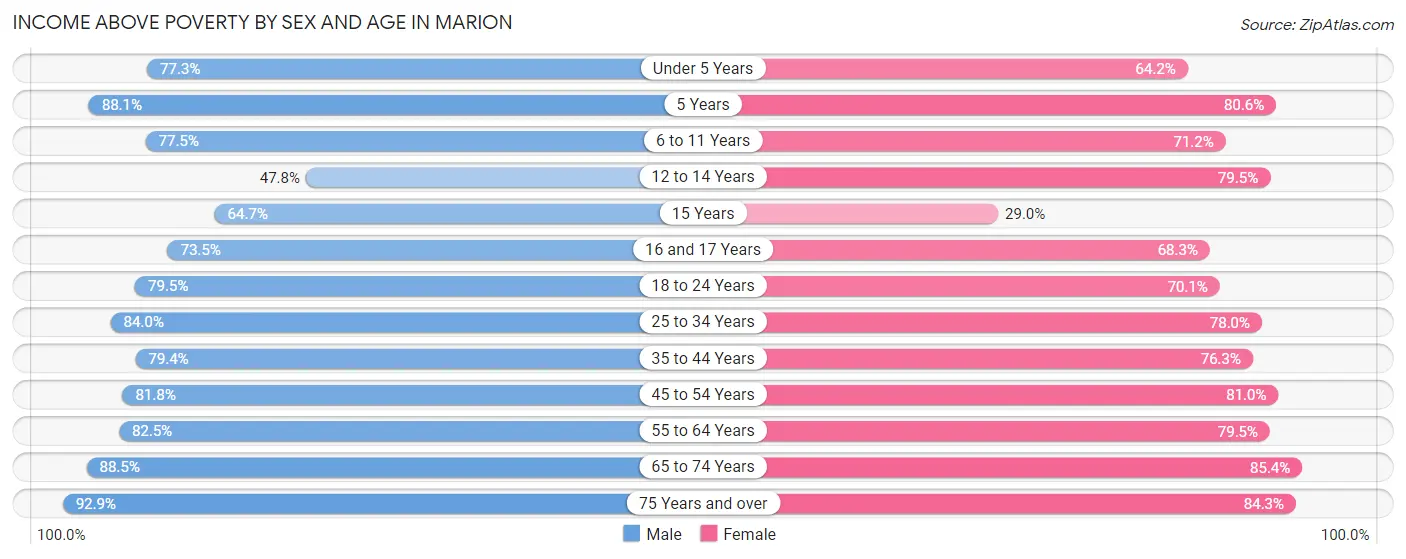
| Age Bracket | Male | Female |
| Under 5 Years | 846 (77.3%) | 665 (64.2%) |
| 5 Years | 96 (88.1%) | 158 (80.6%) |
| 6 to 11 Years | 904 (77.5%) | 839 (71.2%) |
| 12 to 14 Years | 415 (47.8%) | 360 (79.5%) |
| 15 Years | 222 (64.7%) | 47 (29.0%) |
| 16 and 17 Years | 238 (73.5%) | 196 (68.3%) |
| 18 to 24 Years | 1,216 (79.5%) | 989 (70.1%) |
| 25 to 34 Years | 2,243 (84.0%) | 1,747 (78.0%) |
| 35 to 44 Years | 1,409 (79.4%) | 1,389 (76.3%) |
| 45 to 54 Years | 1,400 (81.8%) | 1,336 (81.0%) |
| 55 to 64 Years | 1,676 (82.5%) | 1,724 (79.4%) |
| 65 to 74 Years | 1,138 (88.5%) | 1,238 (85.4%) |
| 75 Years and over | 433 (92.9%) | 1,099 (84.3%) |
| Total | 12,236 (79.6%) | 11,787 (76.8%) |
Income Below Poverty Among Married-Couple Families in Marion
The poverty statistics for married-couple families in Marion show that 9.8% or 436 of the total 4,429 families live below the poverty line. Families with 5 or more children have the highest poverty rate of 100.0%, comprising of 11 families. On the other hand, families with no children have the lowest poverty rate of 6.9%, which includes 193 families.
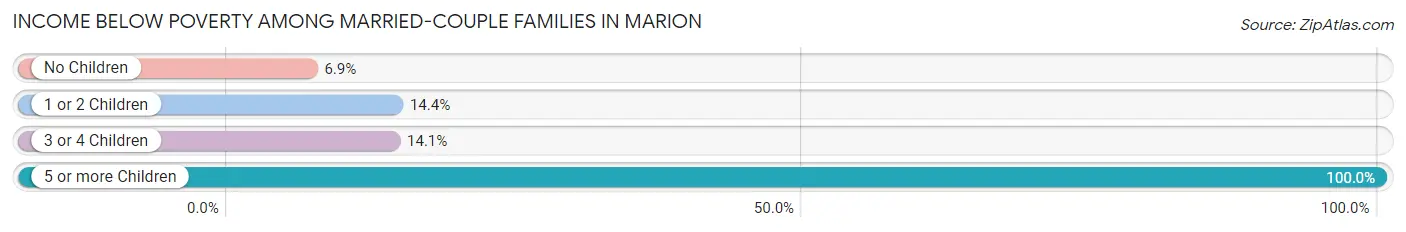
| Children | Above Poverty | Below Poverty |
| No Children | 2,601 (93.1%) | 193 (6.9%) |
| 1 or 2 Children | 966 (85.6%) | 162 (14.4%) |
| 3 or 4 Children | 426 (85.9%) | 70 (14.1%) |
| 5 or more Children | 0 (0.0%) | 11 (100.0%) |
| Total | 3,993 (90.2%) | 436 (9.8%) |
Income Below Poverty Among Single-Parent Households in Marion
According to the poverty data in Marion, 17.7% or 141 single-father households and 33.9% or 669 single-mother households are living below the poverty line. Among single-father households, those with 1 or 2 children have the highest poverty rate, with 83 households (23.1%) experiencing poverty. Likewise, among single-mother households, those with 5 or more children have the highest poverty rate, with 17 households (100.0%) falling below the poverty line.
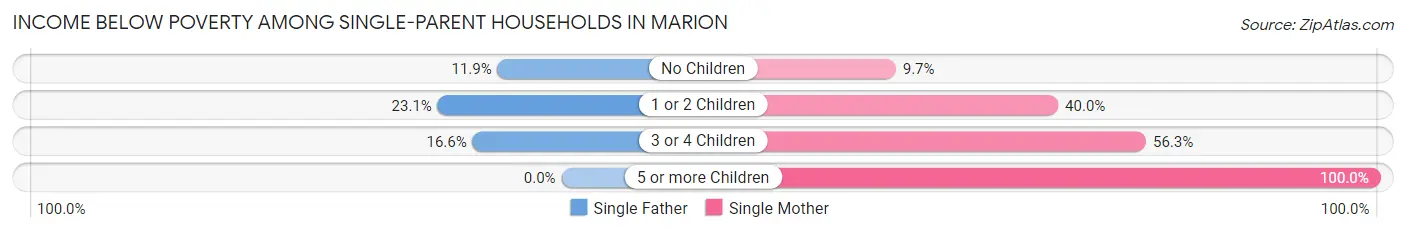
| Children | Single Father | Single Mother |
| No Children | 32 (11.9%) | 64 (9.7%) |
| 1 or 2 Children | 83 (23.1%) | 352 (40.0%) |
| 3 or 4 Children | 26 (16.6%) | 236 (56.3%) |
| 5 or more Children | 0 (0.0%) | 17 (100.0%) |
| Total | 141 (17.7%) | 669 (33.9%) |
Income Below Poverty Among Married-Couple vs Single-Parent Households in Marion
The poverty data for Marion shows that 436 of the married-couple family households (9.8%) and 810 of the single-parent households (29.2%) are living below the poverty level. Within the married-couple family households, those with 5 or more children have the highest poverty rate, with 11 households (100.0%) falling below the poverty line. Among the single-parent households, those with 5 or more children have the highest poverty rate, with 17 household (65.4%) living below poverty.
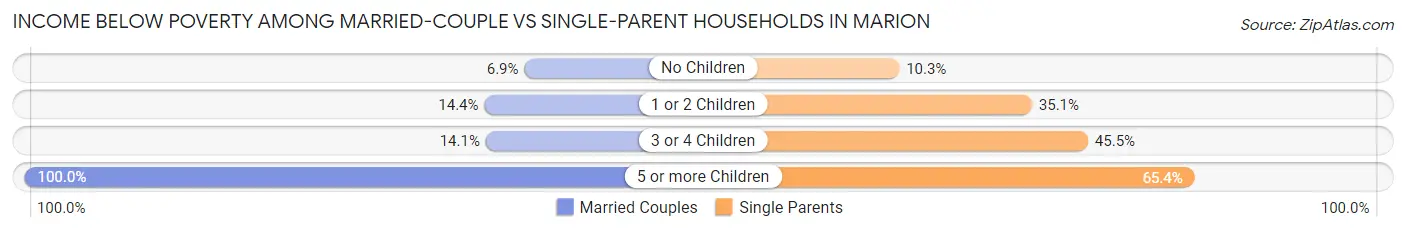
| Children | Married-Couple Families | Single-Parent Households |
| No Children | 193 (6.9%) | 96 (10.3%) |
| 1 or 2 Children | 162 (14.4%) | 435 (35.0%) |
| 3 or 4 Children | 70 (14.1%) | 262 (45.5%) |
| 5 or more Children | 11 (100.0%) | 17 (65.4%) |
| Total | 436 (9.8%) | 810 (29.2%) |
Race in Marion
The most populous races in Marion are White / Caucasian (29,341 | 81.7%), Black / African American (3,320 | 9.2%), and Two or more Races (2,462 | 6.9%).
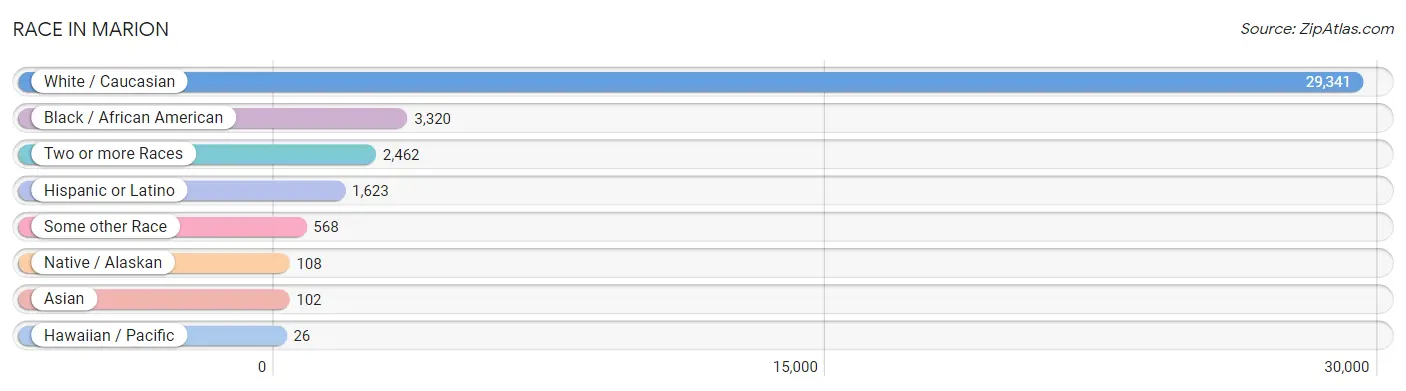
| Race | # Population | % Population |
| Asian | 102 | 0.3% |
| Black / African American | 3,320 | 9.2% |
| Hawaiian / Pacific | 26 | 0.1% |
| Hispanic or Latino | 1,623 | 4.5% |
| Native / Alaskan | 108 | 0.3% |
| White / Caucasian | 29,341 | 81.7% |
| Two or more Races | 2,462 | 6.9% |
| Some other Race | 568 | 1.6% |
| Total | 35,927 | 100.0% |
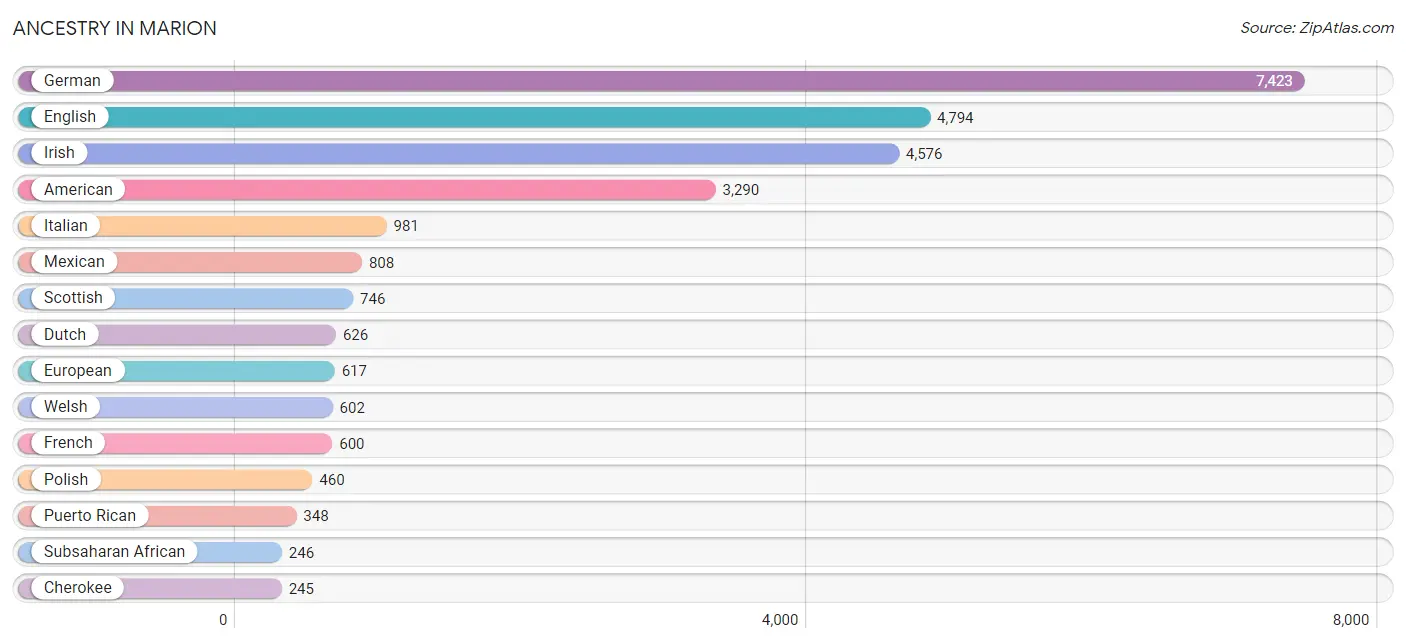
Ancestry in Marion
The most populous ancestries reported in Marion are German (7,423 | 20.7%), English (4,794 | 13.3%), Irish (4,576 | 12.7%), American (3,290 | 9.2%), and Italian (981 | 2.7%), together accounting for 58.6% of all Marion residents.
| Ancestry | # Population | % Population |
| African | 172 | 0.5% |
| American | 3,290 | 9.2% |
| Apache | 39 | 0.1% |
| Arab | 181 | 0.5% |
| Australian | 7 | 0.0% |
| Austrian | 29 | 0.1% |
| Belgian | 31 | 0.1% |
| Bhutanese | 25 | 0.1% |
| Blackfeet | 38 | 0.1% |
| British | 131 | 0.4% |
| Burmese | 30 | 0.1% |
| Cambodian | 9 | 0.0% |
| Canadian | 10 | 0.0% |
| Central American | 40 | 0.1% |
| Central American Indian | 19 | 0.1% |
| Cherokee | 245 | 0.7% |
| Chickasaw | 11 | 0.0% |
| Chippewa | 1 | 0.0% |
| Choctaw | 9 | 0.0% |
| Creek | 9 | 0.0% |
| Croatian | 28 | 0.1% |
| Cuban | 137 | 0.4% |
| Czech | 11 | 0.0% |
| Czechoslovakian | 66 | 0.2% |
| Danish | 37 | 0.1% |
| Dominican | 23 | 0.1% |
| Dutch | 626 | 1.7% |
| Eastern European | 31 | 0.1% |
| English | 4,794 | 13.3% |
| Ethiopian | 8 | 0.0% |
| European | 617 | 1.7% |
| Finnish | 80 | 0.2% |
| French | 600 | 1.7% |
| French Canadian | 9 | 0.0% |
| German | 7,423 | 20.7% |
| German Russian | 8 | 0.0% |
| Greek | 73 | 0.2% |
| Guamanian / Chamorro | 10 | 0.0% |
| Haitian | 68 | 0.2% |
| Honduran | 32 | 0.1% |
| Hopi | 4 | 0.0% |
| Hungarian | 172 | 0.5% |
| Indian (Asian) | 5 | 0.0% |
| Iraqi | 129 | 0.4% |
| Irish | 4,576 | 12.7% |
| Iroquois | 7 | 0.0% |
| Israeli | 17 | 0.1% |
| Italian | 981 | 2.7% |
| Jamaican | 53 | 0.2% |
| Jordanian | 15 | 0.0% |
| Korean | 42 | 0.1% |
| Laotian | 9 | 0.0% |
| Latvian | 7 | 0.0% |
| Lebanese | 5 | 0.0% |
| Lithuanian | 54 | 0.2% |
| Mexican | 808 | 2.2% |
| Mexican American Indian | 13 | 0.0% |
| Native Hawaiian | 21 | 0.1% |
| Navajo | 29 | 0.1% |
| Nigerian | 18 | 0.1% |
| Northern European | 19 | 0.1% |
| Norwegian | 10 | 0.0% |
| Ottawa | 1 | 0.0% |
| Pakistani | 13 | 0.0% |
| Panamanian | 8 | 0.0% |
| Pennsylvania German | 6 | 0.0% |
| Polish | 460 | 1.3% |
| Portuguese | 61 | 0.2% |
| Puerto Rican | 348 | 1.0% |
| Russian | 65 | 0.2% |
| Scandinavian | 107 | 0.3% |
| Scotch-Irish | 237 | 0.7% |
| Scottish | 746 | 2.1% |
| Serbian | 18 | 0.1% |
| Shoshone | 8 | 0.0% |
| Sioux | 13 | 0.0% |
| Slovak | 32 | 0.1% |
| Spaniard | 18 | 0.1% |
| Spanish | 13 | 0.0% |
| Subsaharan African | 246 | 0.7% |
| Sudanese | 14 | 0.0% |
| Swedish | 141 | 0.4% |
| Swiss | 44 | 0.1% |
| Thai | 4 | 0.0% |
| Ukrainian | 54 | 0.2% |
| Welsh | 602 | 1.7% |
| West Indian | 6 | 0.0% | View All 87 Rows |
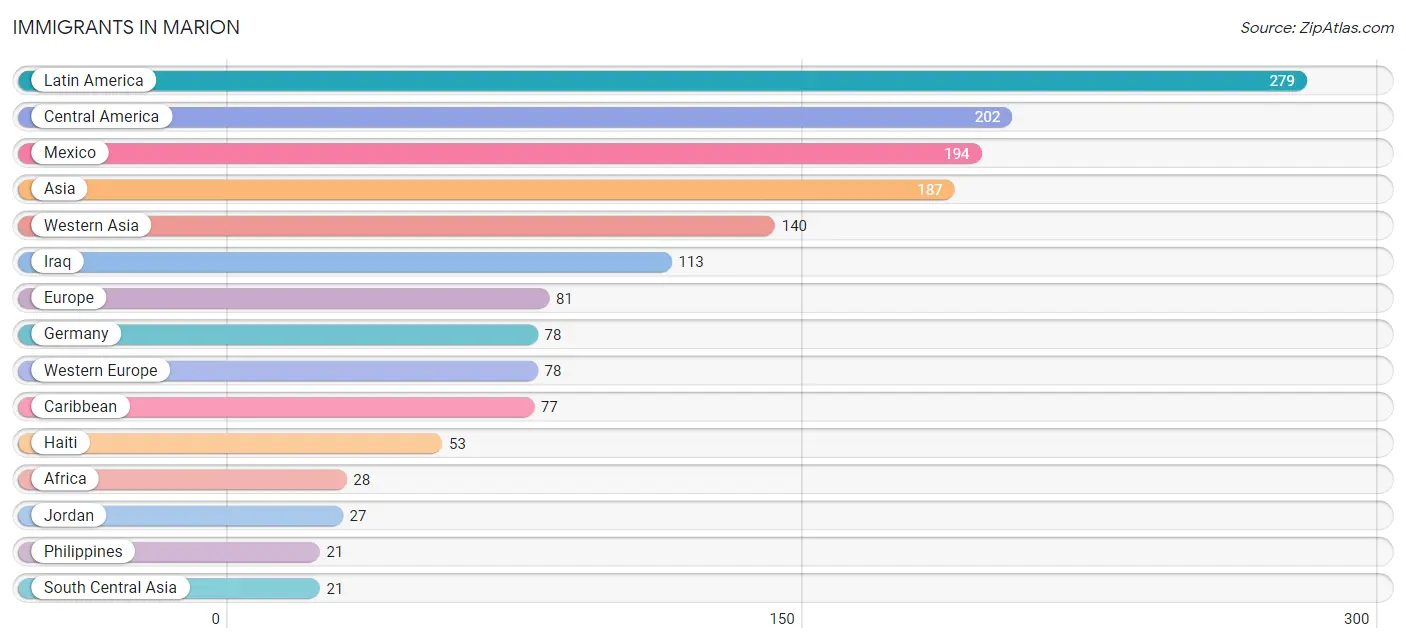
Immigrants in Marion
The most numerous immigrant groups reported in Marion came from Latin America (279 | 0.8%), Central America (202 | 0.6%), Mexico (194 | 0.5%), Asia (187 | 0.5%), and Western Asia (140 | 0.4%), together accounting for 2.8% of all Marion residents.
| Immigration Origin | # Population | % Population |
| Africa | 28 | 0.1% |
| Asia | 187 | 0.5% |
| Australia | 7 | 0.0% |
| Caribbean | 77 | 0.2% |
| Central America | 202 | 0.6% |
| China | 5 | 0.0% |
| Cuba | 8 | 0.0% |
| Eastern Asia | 5 | 0.0% |
| Europe | 81 | 0.2% |
| Germany | 78 | 0.2% |
| Ghana | 11 | 0.0% |
| Haiti | 53 | 0.2% |
| India | 4 | 0.0% |
| Iraq | 113 | 0.3% |
| Jamaica | 16 | 0.0% |
| Jordan | 27 | 0.1% |
| Latin America | 279 | 0.8% |
| Mexico | 194 | 0.5% |
| Nepal | 17 | 0.1% |
| Northern Europe | 3 | 0.0% |
| Oceania | 7 | 0.0% |
| Panama | 8 | 0.0% |
| Philippines | 21 | 0.1% |
| South Central Asia | 21 | 0.1% |
| South Eastern Asia | 21 | 0.1% |
| Western Africa | 20 | 0.1% |
| Western Asia | 140 | 0.4% |
| Western Europe | 78 | 0.2% | View All 28 Rows |
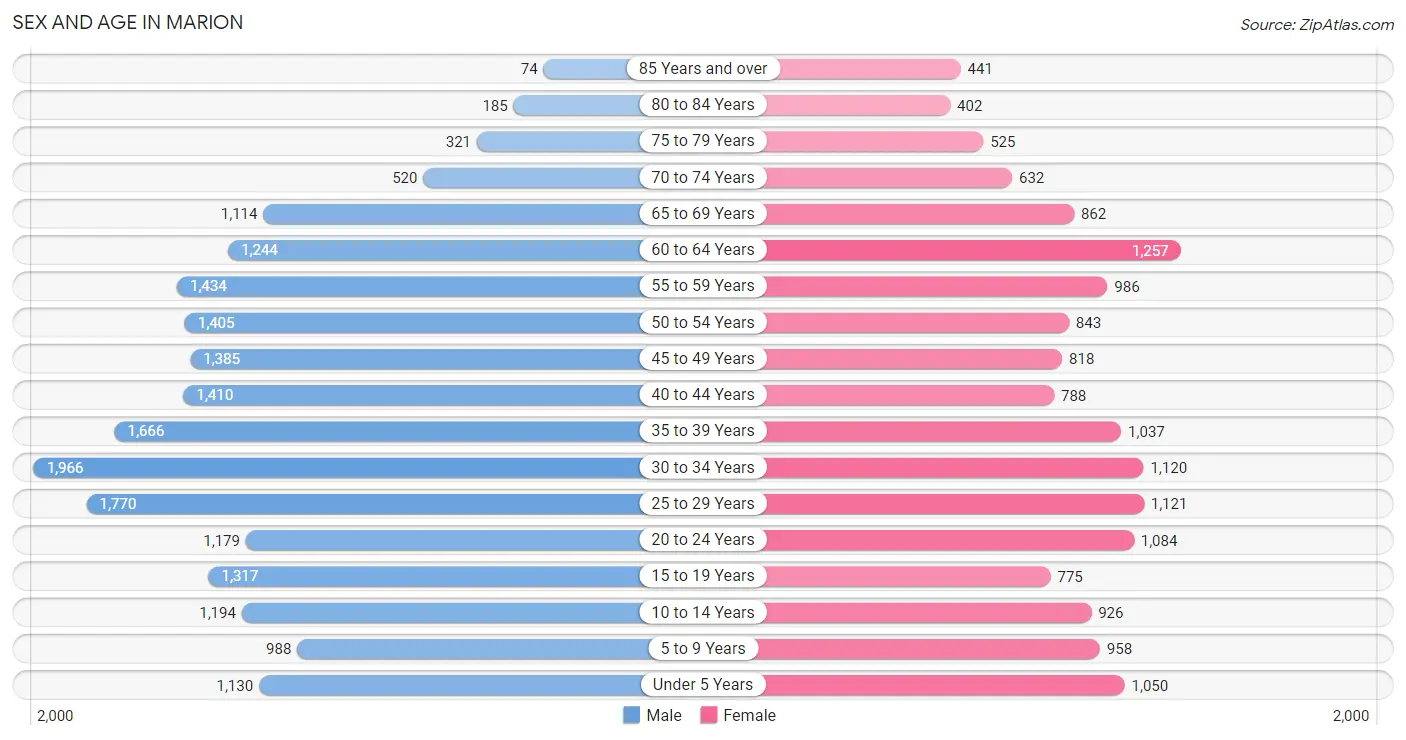
Sex and Age in Marion
Sex and Age in Marion
The most populous age groups in Marion are 30 to 34 Years (1,966 | 9.7%) for men and 60 to 64 Years (1,257 | 8.0%) for women.
| Age Bracket | Male | Female |
| Under 5 Years | 1,130 (5.6%) | 1,050 (6.7%) |
| 5 to 9 Years | 988 (4.9%) | 958 (6.1%) |
| 10 to 14 Years | 1,194 (5.9%) | 926 (5.9%) |
| 15 to 19 Years | 1,317 (6.5%) | 775 (5.0%) |
| 20 to 24 Years | 1,179 (5.8%) | 1,084 (6.9%) |
| 25 to 29 Years | 1,770 (8.7%) | 1,121 (7.2%) |
| 30 to 34 Years | 1,966 (9.7%) | 1,120 (7.2%) |
| 35 to 39 Years | 1,666 (8.2%) | 1,037 (6.6%) |
| 40 to 44 Years | 1,410 (7.0%) | 788 (5.0%) |
| 45 to 49 Years | 1,385 (6.8%) | 818 (5.2%) |
| 50 to 54 Years | 1,405 (6.9%) | 843 (5.4%) |
| 55 to 59 Years | 1,434 (7.1%) | 986 (6.3%) |
| 60 to 64 Years | 1,244 (6.1%) | 1,257 (8.0%) |
| 65 to 69 Years | 1,114 (5.5%) | 862 (5.5%) |
| 70 to 74 Years | 520 (2.6%) | 632 (4.0%) |
| 75 to 79 Years | 321 (1.6%) | 525 (3.4%) |
| 80 to 84 Years | 185 (0.9%) | 402 (2.6%) |
| 85 Years and over | 74 (0.4%) | 441 (2.8%) |
| Total | 20,302 (100.0%) | 15,625 (100.0%) |
Families and Households in Marion
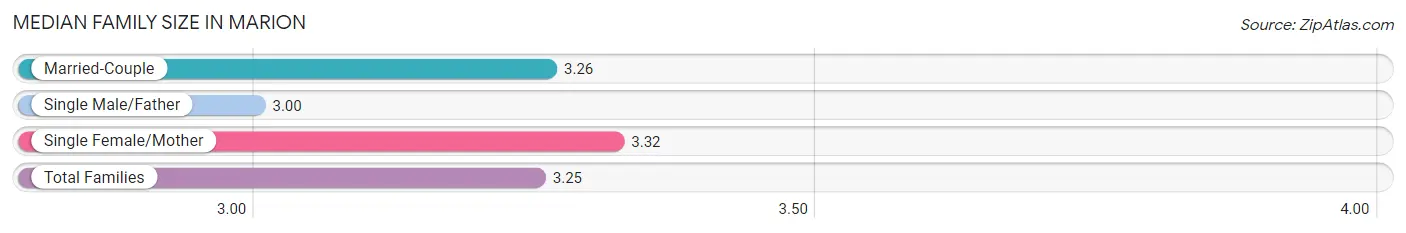
Median Family Size in Marion
The median family size in Marion is 3.25 persons per family, with single female/mother families (1,976 | 27.4%) accounting for the largest median family size of 3.32 persons per family. On the other hand, single male/father families (795 | 11.0%) represent the smallest median family size with 3.00 persons per family.
| Family Type | # Families | Family Size |
| Married-Couple | 4,429 (61.5%) | 3.26 |
| Single Male/Father | 795 (11.0%) | 3.00 |
| Single Female/Mother | 1,976 (27.4%) | 3.32 |
| Total Families | 7,200 (100.0%) | 3.25 |
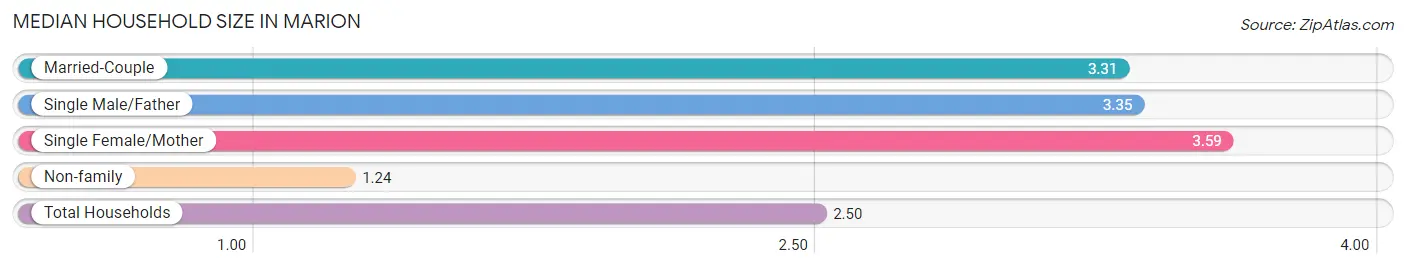
Median Household Size in Marion
The median household size in Marion is 2.50 persons per household, with single female/mother households (1,976 | 16.1%) accounting for the largest median household size of 3.59 persons per household. non-family households (5,066 | 41.3%) represent the smallest median household size with 1.24 persons per household.
| Household Type | # Households | Household Size |
| Married-Couple | 4,429 (36.1%) | 3.31 |
| Single Male/Father | 795 (6.5%) | 3.35 |
| Single Female/Mother | 1,976 (16.1%) | 3.59 |
| Non-family | 5,066 (41.3%) | 1.24 |
| Total Households | 12,266 (100.0%) | 2.50 |
Household Size by Marriage Status in Marion
Out of a total of 12,266 households in Marion, 7,200 (58.7%) are family households, while 5,066 (41.3%) are nonfamily households. The most numerous type of family households are 2-person households, comprising 3,172, and the most common type of nonfamily households are 1-person households, comprising 4,210.
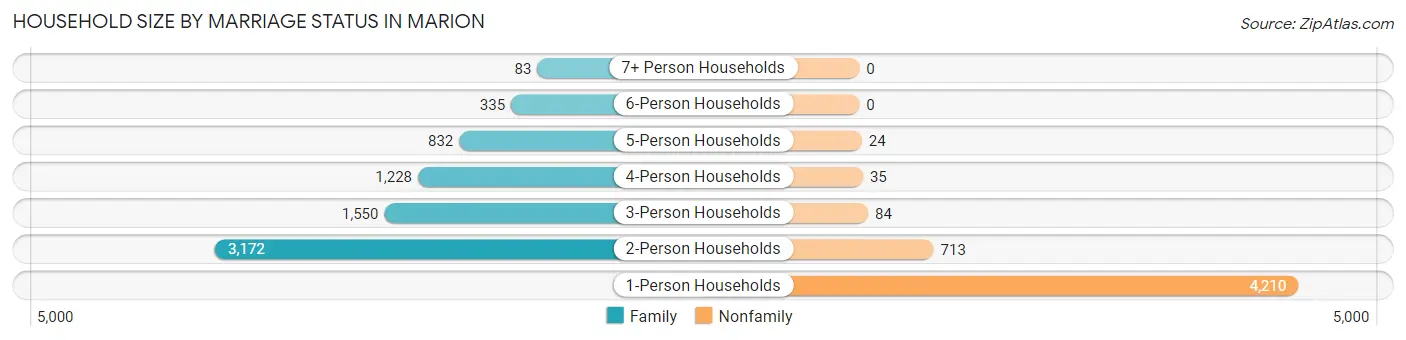
| Household Size | Family Households | Nonfamily Households |
| 1-Person Households | - | 4,210 (34.3%) |
| 2-Person Households | 3,172 (25.9%) | 713 (5.8%) |
| 3-Person Households | 1,550 (12.6%) | 84 (0.7%) |
| 4-Person Households | 1,228 (10.0%) | 35 (0.3%) |
| 5-Person Households | 832 (6.8%) | 24 (0.2%) |
| 6-Person Households | 335 (2.7%) | 0 (0.0%) |
| 7+ Person Households | 83 (0.7%) | 0 (0.0%) |
| Total | 7,200 (58.7%) | 5,066 (41.3%) |
Female Fertility in Marion
Fertility by Age in Marion
Average fertility rate in Marion is 73.0 births per 1,000 women. Women in the age bracket of 20 to 34 years have the highest fertility rate with 123.0 births per 1,000 women. Women in the age bracket of 20 to 34 years acount for 81.3% of all women with births.
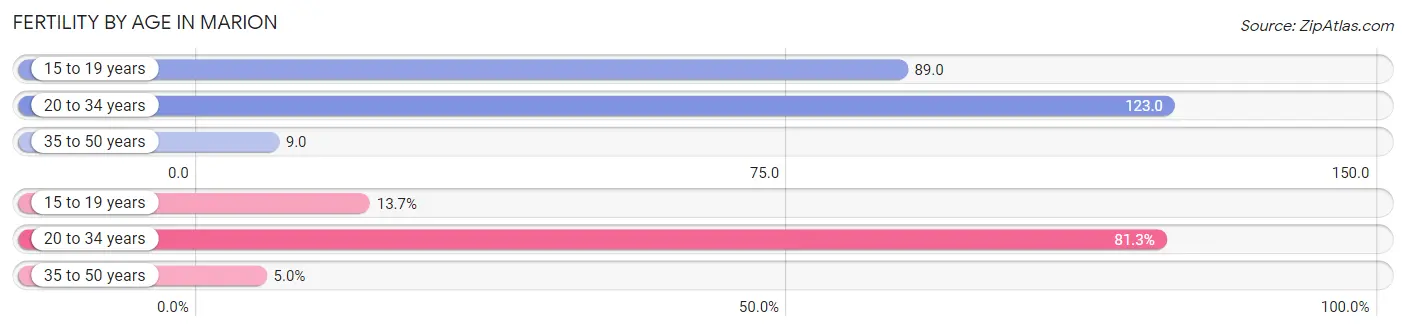
| Age Bracket | Women with Births | Births / 1,000 Women |
| 15 to 19 years | 69 (13.7%) | 89.0 |
| 20 to 34 years | 409 (81.3%) | 123.0 |
| 35 to 50 years | 25 (5.0%) | 9.0 |
| Total | 503 (100.0%) | 73.0 |
Fertility by Age by Marriage Status in Marion
52.1% of women with births (503) in Marion are married. The highest percentage of unmarried women with births falls into 15 to 19 years age bracket with 100.0% of them unmarried at the time of birth, while the lowest percentage of unmarried women with births belong to 35 to 50 years age bracket with 0.0% of them unmarried.
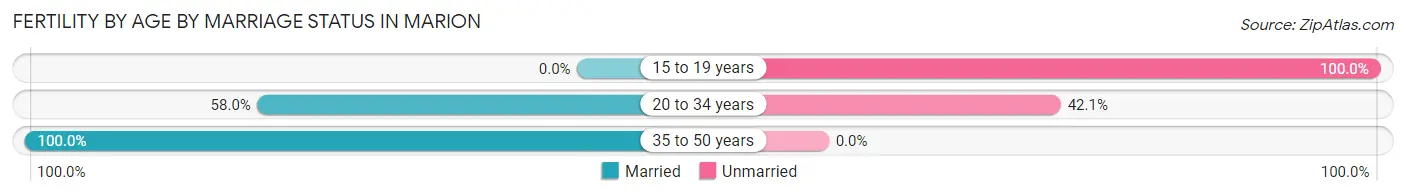
| Age Bracket | Married | Unmarried |
| 15 to 19 years | 0 (0.0%) | 69 (100.0%) |
| 20 to 34 years | 237 (58.0%) | 172 (42.0%) |
| 35 to 50 years | 25 (100.0%) | 0 (0.0%) |
| Total | 262 (52.1%) | 241 (47.9%) |
Fertility by Education in Marion
Average fertility rate in Marion is 73.0 births per 1,000 women. Women with the education attainment of high school diploma have the highest fertility rate of 113.0 births per 1,000 women, while women with the education attainment of bachelor's degree have the lowest fertility at 35.0 births per 1,000 women. Women with the education attainment of high school diploma represent 60.4% of all women with births.
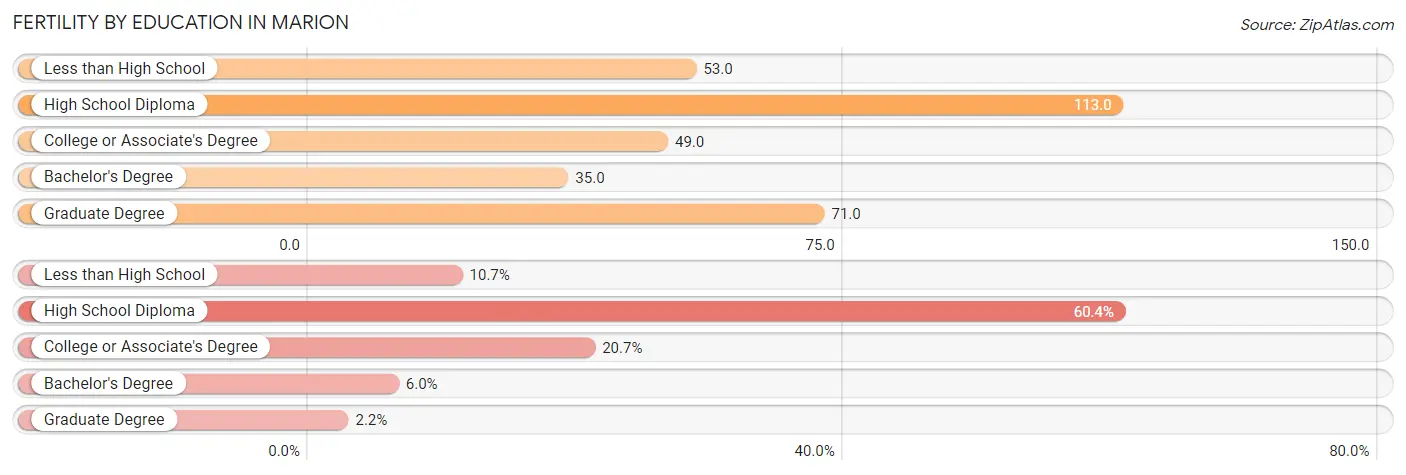
| Educational Attainment | Women with Births | Births / 1,000 Women |
| Less than High School | 54 (10.7%) | 53.0 |
| High School Diploma | 304 (60.4%) | 113.0 |
| College or Associate's Degree | 104 (20.7%) | 49.0 |
| Bachelor's Degree | 30 (6.0%) | 35.0 |
| Graduate Degree | 11 (2.2%) | 71.0 |
| Total | 503 (100.0%) | 73.0 |
Fertility by Education by Marriage Status in Marion
47.9% of women with births in Marion are unmarried. Women with the educational attainment of bachelor's degree are most likely to be married with 100.0% of them married at childbirth, while women with the educational attainment of less than high school are least likely to be married with 74.1% of them unmarried at childbirth.
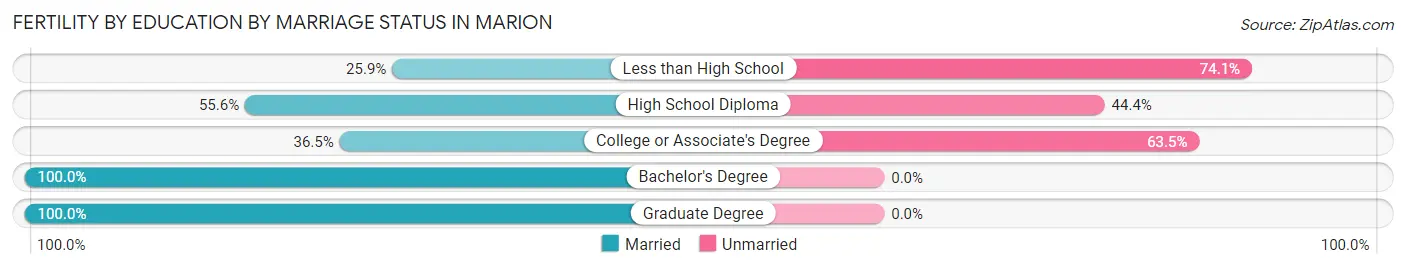
| Educational Attainment | Married | Unmarried |
| Less than High School | 14 (25.9%) | 40 (74.1%) |
| High School Diploma | 169 (55.6%) | 135 (44.4%) |
| College or Associate's Degree | 38 (36.5%) | 66 (63.5%) |
| Bachelor's Degree | 30 (100.0%) | 0 (0.0%) |
| Graduate Degree | 11 (100.0%) | 0 (0.0%) |
| Total | 262 (52.1%) | 241 (47.9%) |
Employment Characteristics in Marion
Employment by Class of Employer in Marion
Among the 13,216 employed individuals in Marion, private company employees (10,276 | 77.7%), not-for-profit organizations (1,091 | 8.3%), and local government employees (645 | 4.9%) make up the most common classes of employment.
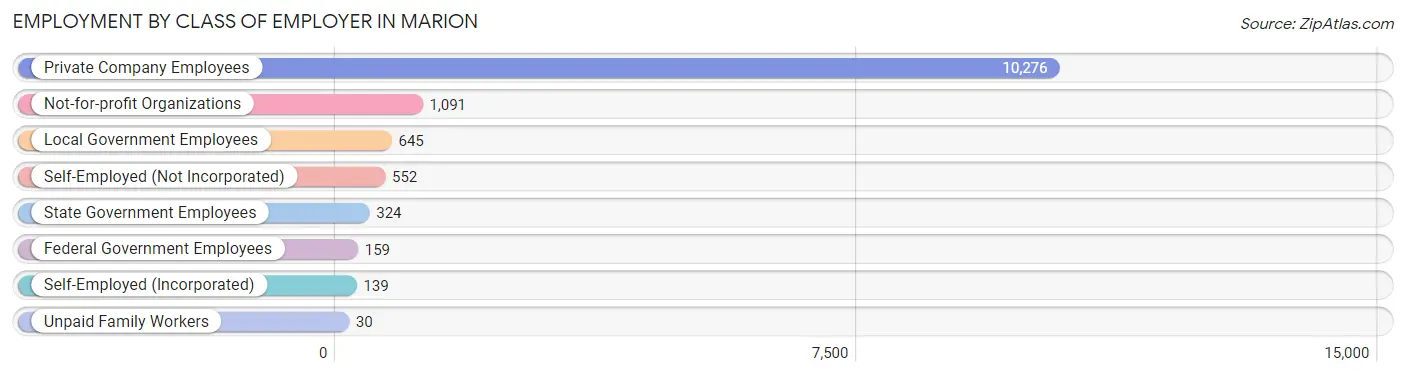
| Employer Class | # Employees | % Employees |
| Private Company Employees | 10,276 | 77.7% |
| Self-Employed (Incorporated) | 139 | 1.1% |
| Self-Employed (Not Incorporated) | 552 | 4.2% |
| Not-for-profit Organizations | 1,091 | 8.3% |
| Local Government Employees | 645 | 4.9% |
| State Government Employees | 324 | 2.5% |
| Federal Government Employees | 159 | 1.2% |
| Unpaid Family Workers | 30 | 0.2% |
| Total | 13,216 | 100.0% |
Employment Status by Age in Marion
According to the labor force statistics for Marion, out of the total population over 16 years of age (29,176), 50.4% or 14,705 individuals are in the labor force, with 8.7% or 1,279 of them unemployed. The age group with the highest labor force participation rate is 20 to 24 years, with 72.8% or 1,647 individuals in the labor force. Within the labor force, the 25 to 29 years age range has the highest percentage of unemployed individuals, with 20.6% or 413 of them being unemployed.
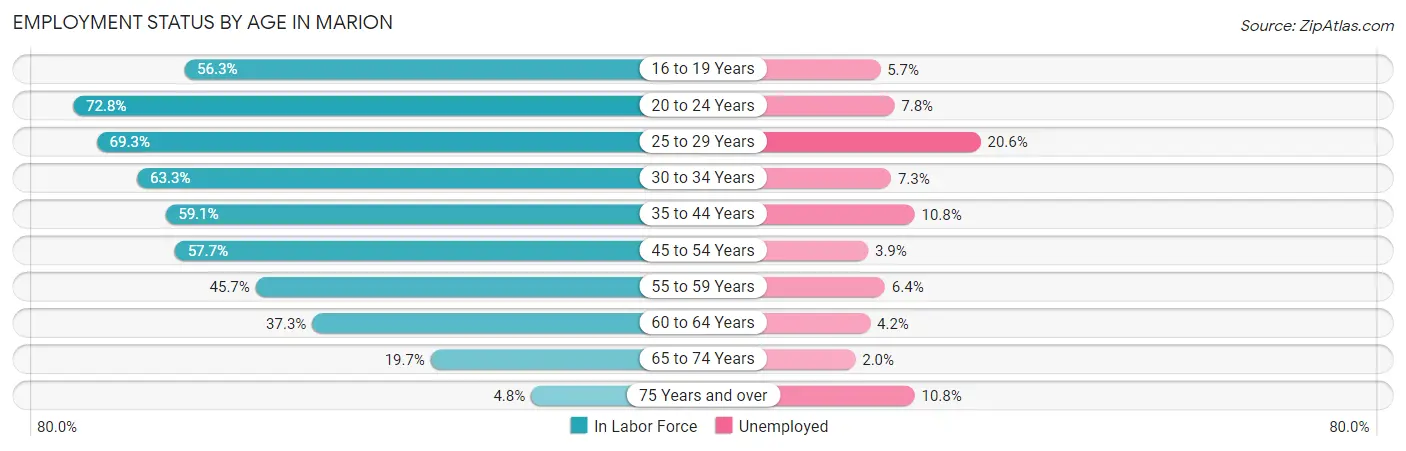
| Age Bracket | In Labor Force | Unemployed |
| 16 to 19 Years | 893 (56.3%) | 51 (5.7%) |
| 20 to 24 Years | 1,647 (72.8%) | 128 (7.8%) |
| 25 to 29 Years | 2,003 (69.3%) | 413 (20.6%) |
| 30 to 34 Years | 1,953 (63.3%) | 143 (7.3%) |
| 35 to 44 Years | 2,896 (59.1%) | 313 (10.8%) |
| 45 to 54 Years | 2,568 (57.7%) | 100 (3.9%) |
| 55 to 59 Years | 1,106 (45.7%) | 71 (6.4%) |
| 60 to 64 Years | 933 (37.3%) | 39 (4.2%) |
| 65 to 74 Years | 616 (19.7%) | 12 (2.0%) |
| 75 Years and over | 94 (4.8%) | 10 (10.8%) |
| Total | 14,705 (50.4%) | 1,279 (8.7%) |
Employment Status by Educational Attainment in Marion
According to labor force statistics for Marion, 56.6% of individuals (11,461) out of the total population between 25 and 64 years of age (20,250) are in the labor force, with 9.4% or 1,077 of them being unemployed. The group with the highest labor force participation rate are those with the educational attainment of bachelor's degree or higher, with 71.7% or 1,423 individuals in the labor force. Within the labor force, individuals with less than high school education have the highest percentage of unemployment, with 26.6% or 187 of them being unemployed.
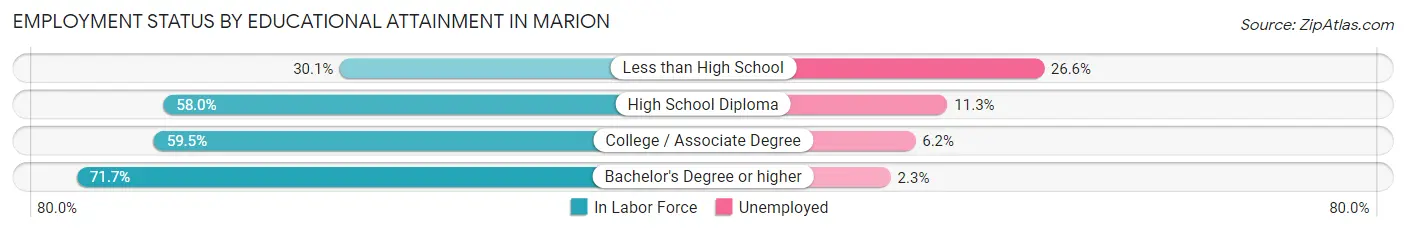
| Educational Attainment | In Labor Force | Unemployed |
| Less than High School | 704 (30.1%) | 622 (26.6%) |
| High School Diploma | 5,436 (58.0%) | 1,059 (11.3%) |
| College / Associate Degree | 3,899 (59.5%) | 406 (6.2%) |
| Bachelor's Degree or higher | 1,423 (71.7%) | 46 (2.3%) |
| Total | 11,462 (56.6%) | 1,904 (9.4%) |
Employment Occupations by Sex in Marion
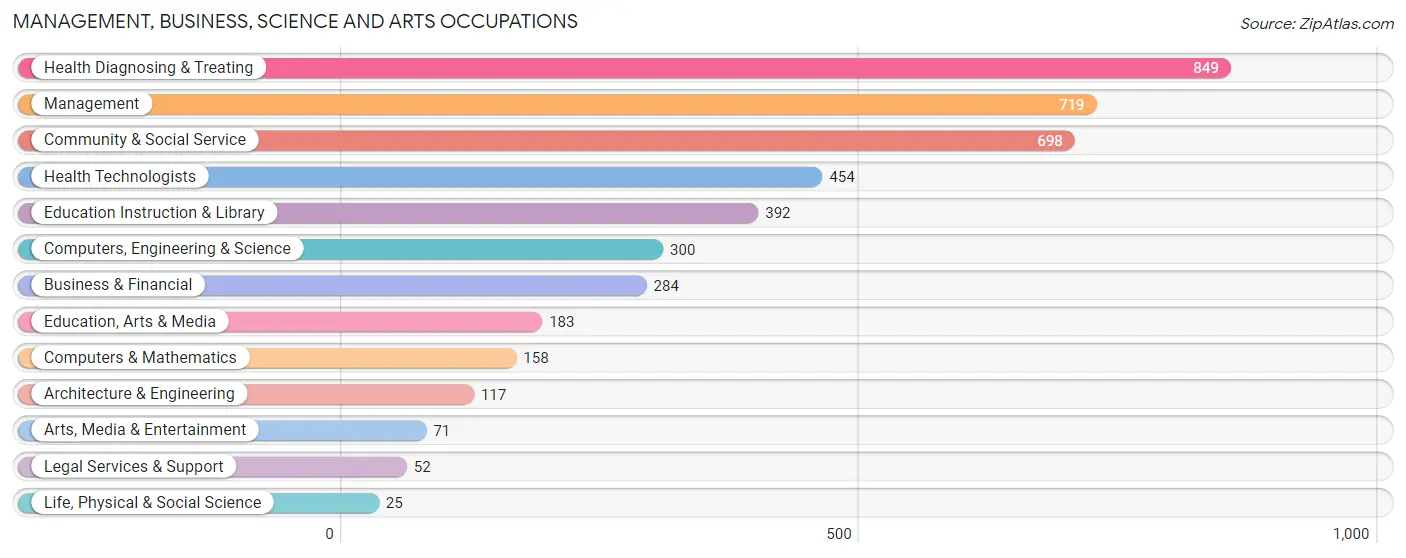
Management, Business, Science and Arts Occupations
The most common Management, Business, Science and Arts occupations in Marion are Health Diagnosing & Treating (849 | 6.3%), Management (719 | 5.3%), Community & Social Service (698 | 5.2%), Health Technologists (454 | 3.4%), and Education Instruction & Library (392 | 2.9%).
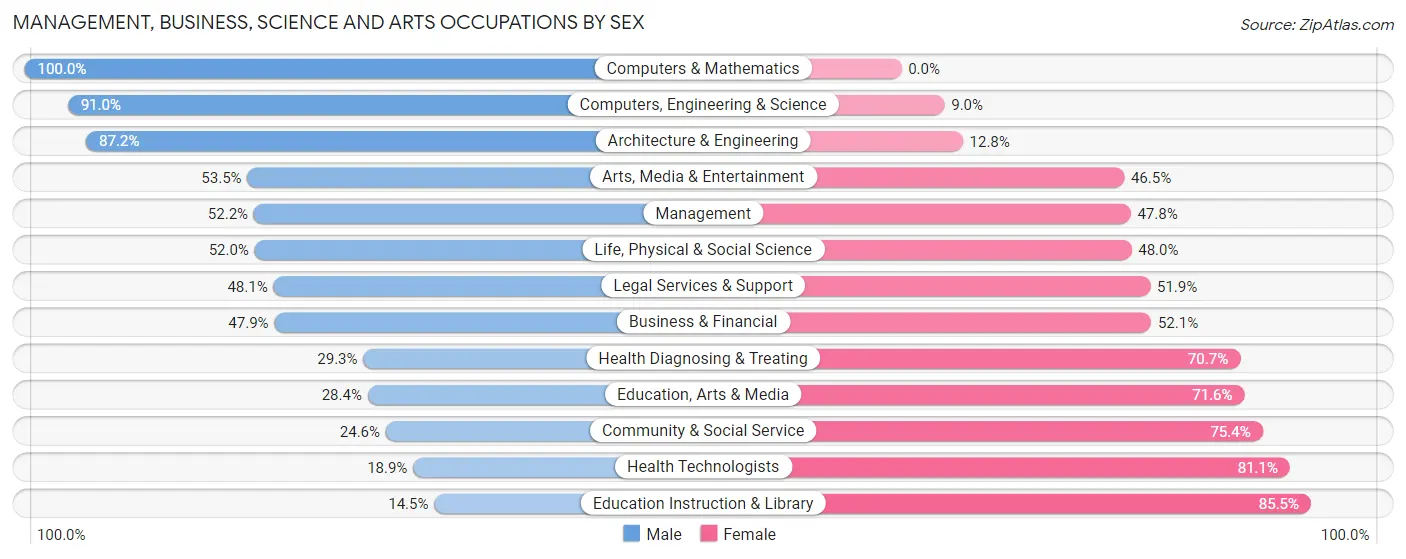
Management, Business, Science and Arts Occupations by Sex
Within the Management, Business, Science and Arts occupations in Marion, the most male-oriented occupations are Computers & Mathematics (100.0%), Computers, Engineering & Science (91.0%), and Architecture & Engineering (87.2%), while the most female-oriented occupations are Education Instruction & Library (85.5%), Health Technologists (81.1%), and Community & Social Service (75.4%).
| Occupation | Male | Female |
| Management | 375 (52.2%) | 344 (47.8%) |
| Business & Financial | 136 (47.9%) | 148 (52.1%) |
| Computers, Engineering & Science | 273 (91.0%) | 27 (9.0%) |
| Computers & Mathematics | 158 (100.0%) | 0 (0.0%) |
| Architecture & Engineering | 102 (87.2%) | 15 (12.8%) |
| Life, Physical & Social Science | 13 (52.0%) | 12 (48.0%) |
| Community & Social Service | 172 (24.6%) | 526 (75.4%) |
| Education, Arts & Media | 52 (28.4%) | 131 (71.6%) |
| Legal Services & Support | 25 (48.1%) | 27 (51.9%) |
| Education Instruction & Library | 57 (14.5%) | 335 (85.5%) |
| Arts, Media & Entertainment | 38 (53.5%) | 33 (46.5%) |
| Health Diagnosing & Treating | 249 (29.3%) | 600 (70.7%) |
| Health Technologists | 86 (18.9%) | 368 (81.1%) |
| Total (Category) | 1,205 (42.3%) | 1,645 (57.7%) |
| Total (Overall) | 7,452 (55.5%) | 5,981 (44.5%) |
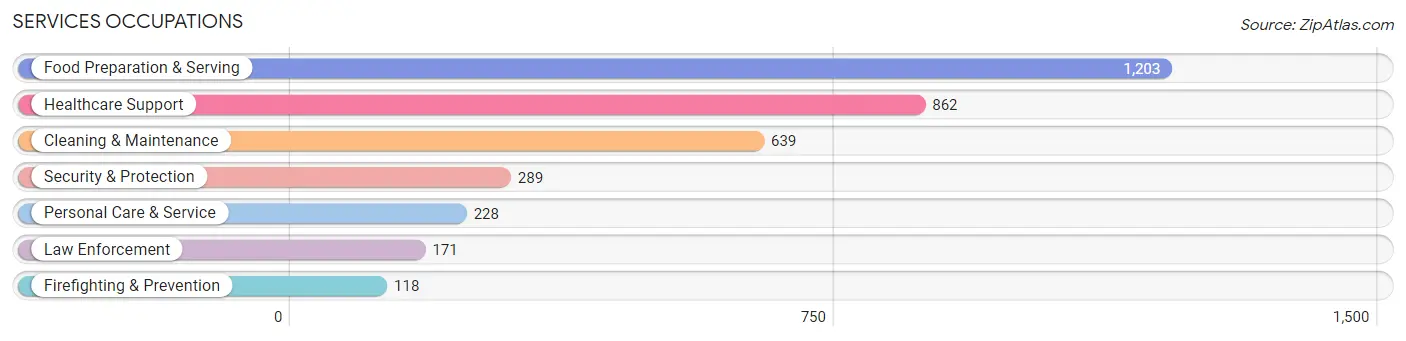
Services Occupations
The most common Services occupations in Marion are Food Preparation & Serving (1,203 | 9.0%), Healthcare Support (862 | 6.4%), Cleaning & Maintenance (639 | 4.8%), Security & Protection (289 | 2.1%), and Personal Care & Service (228 | 1.7%).
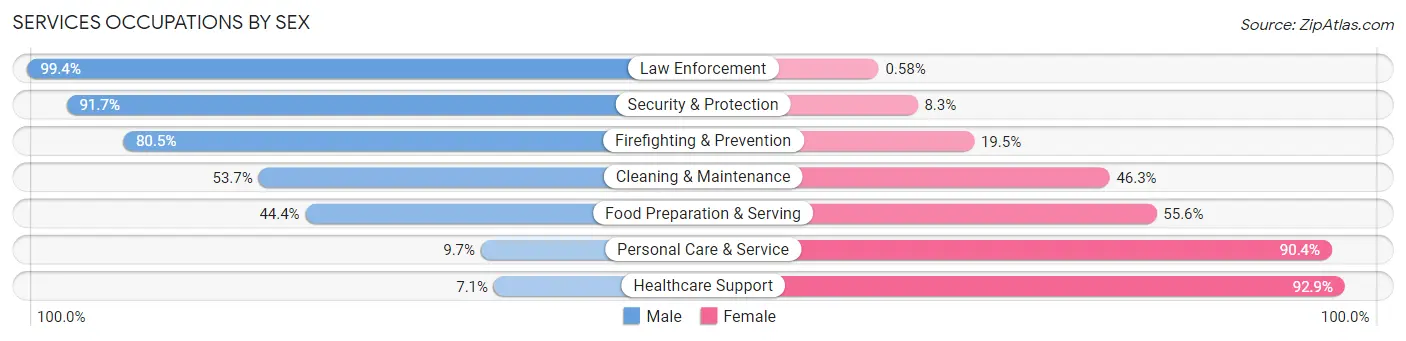
Services Occupations by Sex
Within the Services occupations in Marion, the most male-oriented occupations are Law Enforcement (99.4%), Security & Protection (91.7%), and Firefighting & Prevention (80.5%), while the most female-oriented occupations are Healthcare Support (92.9%), Personal Care & Service (90.3%), and Food Preparation & Serving (55.6%).
| Occupation | Male | Female |
| Healthcare Support | 61 (7.1%) | 801 (92.9%) |
| Security & Protection | 265 (91.7%) | 24 (8.3%) |
| Firefighting & Prevention | 95 (80.5%) | 23 (19.5%) |
| Law Enforcement | 170 (99.4%) | 1 (0.6%) |
| Food Preparation & Serving | 534 (44.4%) | 669 (55.6%) |
| Cleaning & Maintenance | 343 (53.7%) | 296 (46.3%) |
| Personal Care & Service | 22 (9.7%) | 206 (90.3%) |
| Total (Category) | 1,225 (38.0%) | 1,996 (62.0%) |
| Total (Overall) | 7,452 (55.5%) | 5,981 (44.5%) |
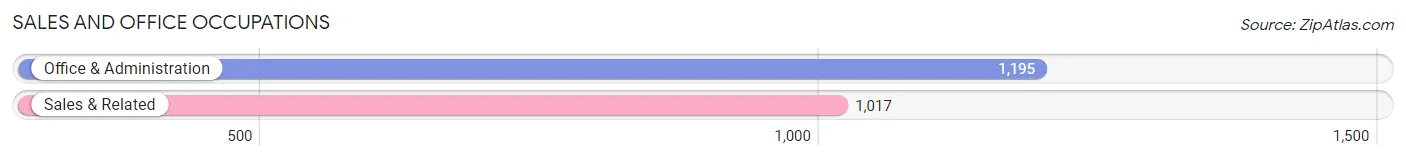
Sales and Office Occupations
The most common Sales and Office occupations in Marion are Office & Administration (1,195 | 8.9%), and Sales & Related (1,017 | 7.6%).
Sales and Office Occupations by Sex
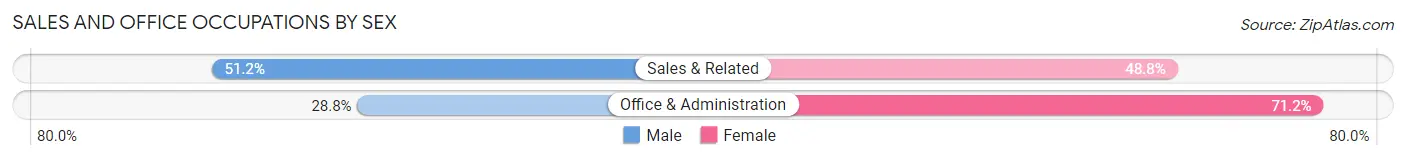
| Occupation | Male | Female |
| Sales & Related | 521 (51.2%) | 496 (48.8%) |
| Office & Administration | 344 (28.8%) | 851 (71.2%) |
| Total (Category) | 865 (39.1%) | 1,347 (60.9%) |
| Total (Overall) | 7,452 (55.5%) | 5,981 (44.5%) |
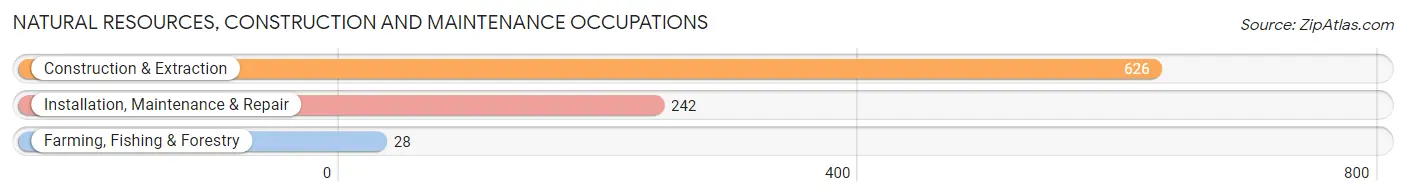
Natural Resources, Construction and Maintenance Occupations
The most common Natural Resources, Construction and Maintenance occupations in Marion are Construction & Extraction (626 | 4.7%), Installation, Maintenance & Repair (242 | 1.8%), and Farming, Fishing & Forestry (28 | 0.2%).
Natural Resources, Construction and Maintenance Occupations by Sex
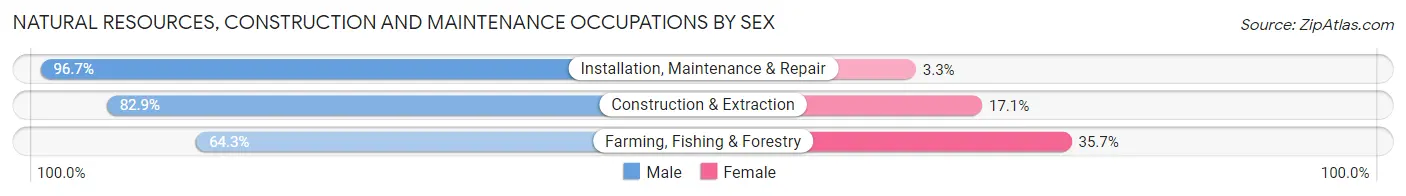
| Occupation | Male | Female |
| Farming, Fishing & Forestry | 18 (64.3%) | 10 (35.7%) |
| Construction & Extraction | 519 (82.9%) | 107 (17.1%) |
| Installation, Maintenance & Repair | 234 (96.7%) | 8 (3.3%) |
| Total (Category) | 771 (86.1%) | 125 (14.0%) |
| Total (Overall) | 7,452 (55.5%) | 5,981 (44.5%) |
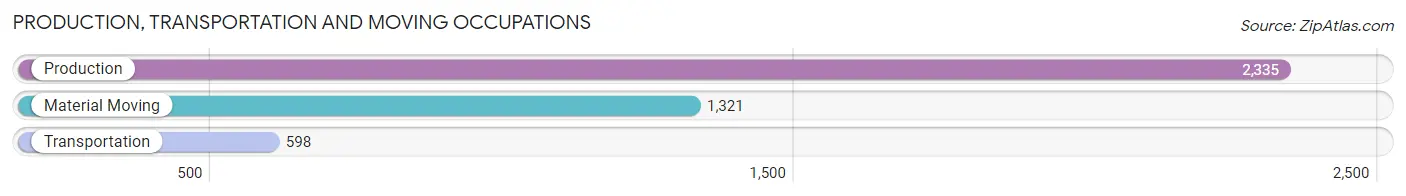
Production, Transportation and Moving Occupations
The most common Production, Transportation and Moving occupations in Marion are Production (2,335 | 17.4%), Material Moving (1,321 | 9.8%), and Transportation (598 | 4.4%).
Production, Transportation and Moving Occupations by Sex
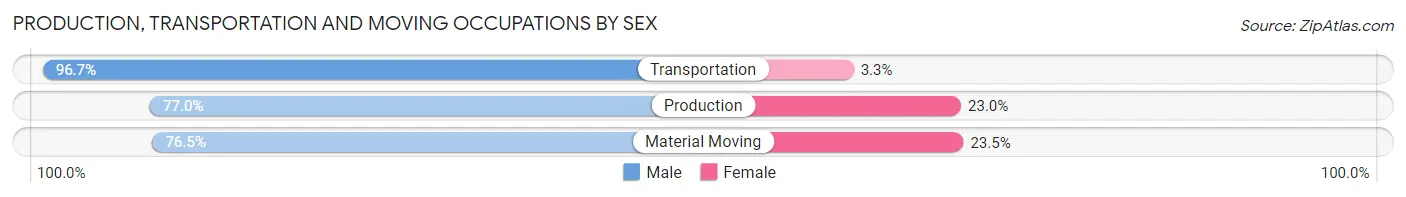
| Occupation | Male | Female |
| Production | 1,797 (77.0%) | 538 (23.0%) |
| Transportation | 578 (96.7%) | 20 (3.3%) |
| Material Moving | 1,011 (76.5%) | 310 (23.5%) |
| Total (Category) | 3,386 (79.6%) | 868 (20.4%) |
| Total (Overall) | 7,452 (55.5%) | 5,981 (44.5%) |
Employment Industries by Sex in Marion
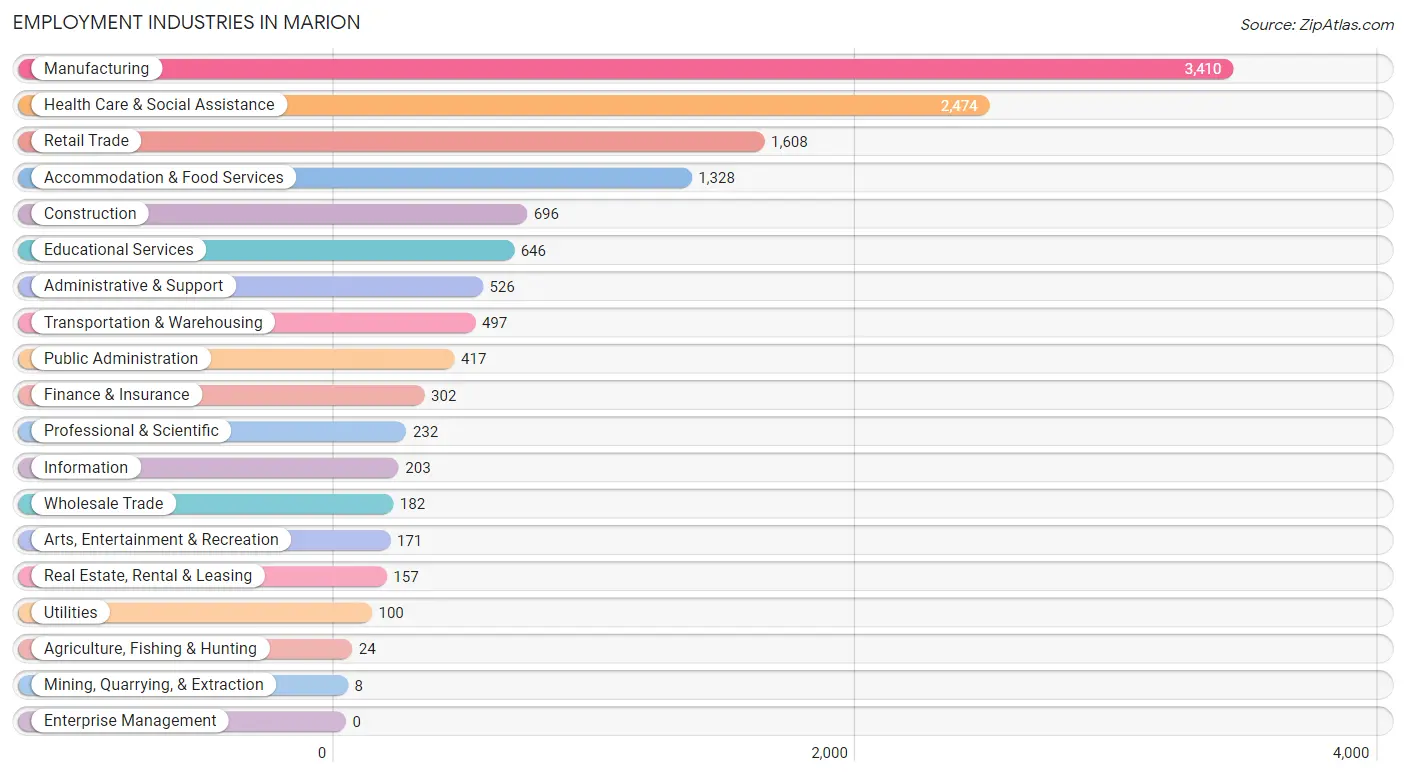
Employment Industries in Marion
The major employment industries in Marion include Manufacturing (3,410 | 25.4%), Health Care & Social Assistance (2,474 | 18.4%), Retail Trade (1,608 | 12.0%), Accommodation & Food Services (1,328 | 9.9%), and Construction (696 | 5.2%).
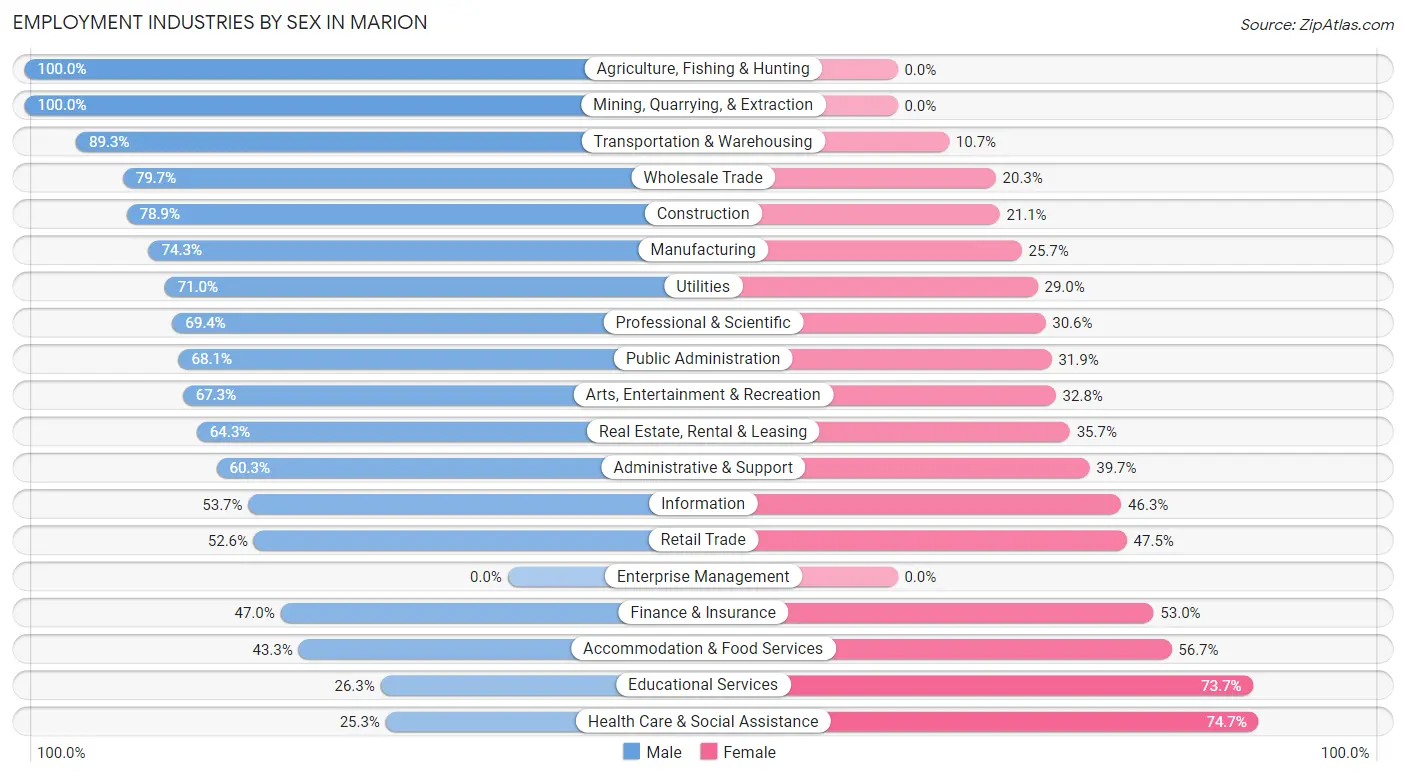
Employment Industries by Sex in Marion
The Marion industries that see more men than women are Agriculture, Fishing & Hunting (100.0%), Mining, Quarrying, & Extraction (100.0%), and Transportation & Warehousing (89.3%), whereas the industries that tend to have a higher number of women are Health Care & Social Assistance (74.7%), Educational Services (73.7%), and Accommodation & Food Services (56.7%).
| Industry | Male | Female |
| Agriculture, Fishing & Hunting | 24 (100.0%) | 0 (0.0%) |
| Mining, Quarrying, & Extraction | 8 (100.0%) | 0 (0.0%) |
| Construction | 549 (78.9%) | 147 (21.1%) |
| Manufacturing | 2,534 (74.3%) | 876 (25.7%) |
| Wholesale Trade | 145 (79.7%) | 37 (20.3%) |
| Retail Trade | 845 (52.5%) | 763 (47.4%) |
| Transportation & Warehousing | 444 (89.3%) | 53 (10.7%) |
| Utilities | 71 (71.0%) | 29 (29.0%) |
| Information | 109 (53.7%) | 94 (46.3%) |
| Finance & Insurance | 142 (47.0%) | 160 (53.0%) |
| Real Estate, Rental & Leasing | 101 (64.3%) | 56 (35.7%) |
| Professional & Scientific | 161 (69.4%) | 71 (30.6%) |
| Enterprise Management | 0 (0.0%) | 0 (0.0%) |
| Administrative & Support | 317 (60.3%) | 209 (39.7%) |
| Educational Services | 170 (26.3%) | 476 (73.7%) |
| Health Care & Social Assistance | 625 (25.3%) | 1,849 (74.7%) |
| Arts, Entertainment & Recreation | 115 (67.2%) | 56 (32.8%) |
| Accommodation & Food Services | 575 (43.3%) | 753 (56.7%) |
| Public Administration | 284 (68.1%) | 133 (31.9%) |
| Total | 7,452 (55.5%) | 5,981 (44.5%) |
Education in Marion
School Enrollment in Marion
The most common levels of schooling among the 7,616 students in Marion are high school (2,109 | 27.7%), middle school (1,562 | 20.5%), and elementary school (1,514 | 19.9%).
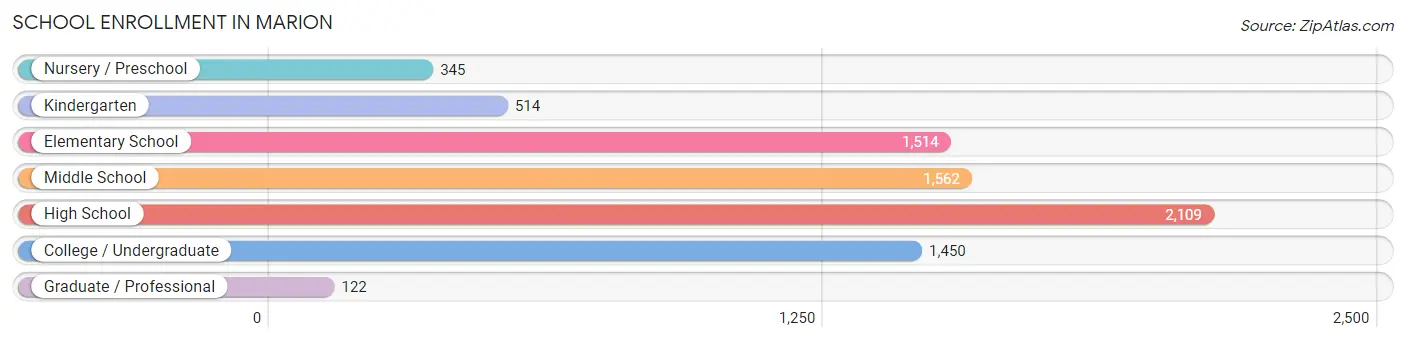
| School Level | # Students | % Students |
| Nursery / Preschool | 345 | 4.5% |
| Kindergarten | 514 | 6.8% |
| Elementary School | 1,514 | 19.9% |
| Middle School | 1,562 | 20.5% |
| High School | 2,109 | 27.7% |
| College / Undergraduate | 1,450 | 19.0% |
| Graduate / Professional | 122 | 1.6% |
| Total | 7,616 | 100.0% |
School Enrollment by Age by Funding Source in Marion
Out of a total of 7,616 students who are enrolled in schools in Marion, 762 (10.0%) attend a private institution, while the remaining 6,854 (90.0%) are enrolled in public schools. The age group of 35 years and over has the highest likelihood of being enrolled in private schools, with 132 (17.1% in the age bracket) enrolled. Conversely, the age group of 10 to 14 year olds has the lowest likelihood of being enrolled in a private school, with 1,925 (92.9% in the age bracket) attending a public institution.
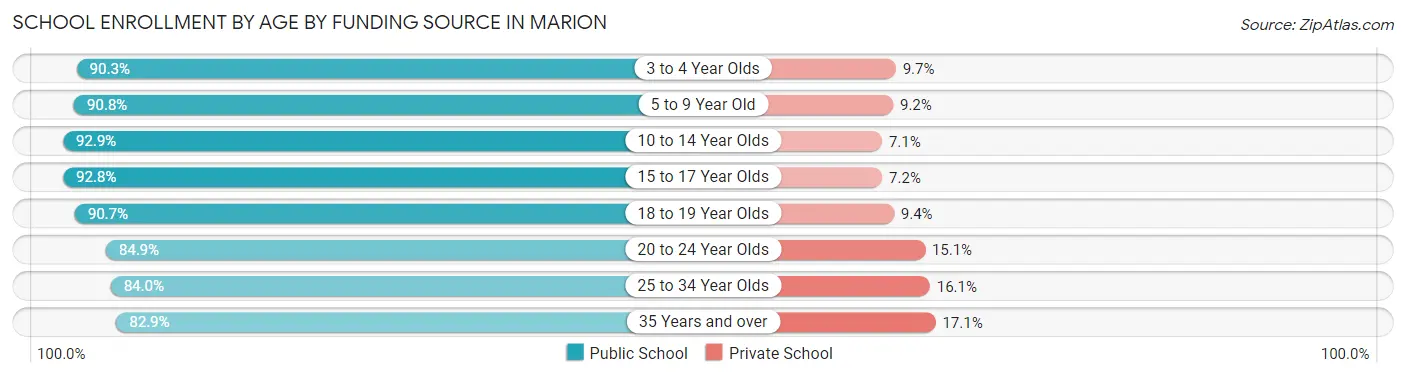
| Age Bracket | Public School | Private School |
| 3 to 4 Year Olds | 242 (90.3%) | 26 (9.7%) |
| 5 to 9 Year Old | 1,690 (90.8%) | 171 (9.2%) |
| 10 to 14 Year Olds | 1,925 (92.9%) | 148 (7.1%) |
| 15 to 17 Year Olds | 1,036 (92.8%) | 80 (7.2%) |
| 18 to 19 Year Olds | 485 (90.6%) | 50 (9.3%) |
| 20 to 24 Year Olds | 381 (84.9%) | 68 (15.1%) |
| 25 to 34 Year Olds | 455 (84.0%) | 87 (16.1%) |
| 35 Years and over | 640 (82.9%) | 132 (17.1%) |
| Total | 6,854 (90.0%) | 762 (10.0%) |
Educational Attainment by Field of Study in Marion
Business (527 | 19.7%), education (519 | 19.4%), science & technology (375 | 14.0%), literature & languages (297 | 11.1%), and arts & humanities (261 | 9.8%) are the most common fields of study among 2,675 individuals in Marion who have obtained a bachelor's degree or higher.
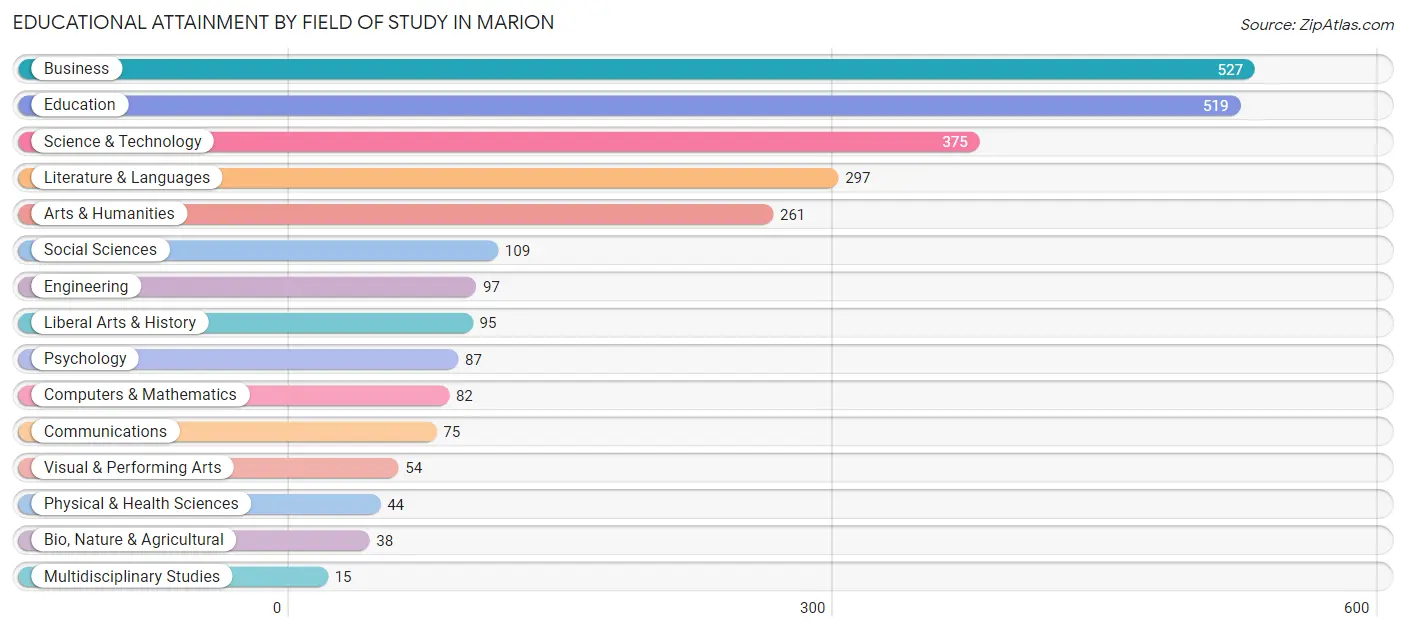
| Field of Study | # Graduates | % Graduates |
| Computers & Mathematics | 82 | 3.1% |
| Bio, Nature & Agricultural | 38 | 1.4% |
| Physical & Health Sciences | 44 | 1.6% |
| Psychology | 87 | 3.3% |
| Social Sciences | 109 | 4.1% |
| Engineering | 97 | 3.6% |
| Multidisciplinary Studies | 15 | 0.6% |
| Science & Technology | 375 | 14.0% |
| Business | 527 | 19.7% |
| Education | 519 | 19.4% |
| Literature & Languages | 297 | 11.1% |
| Liberal Arts & History | 95 | 3.5% |
| Visual & Performing Arts | 54 | 2.0% |
| Communications | 75 | 2.8% |
| Arts & Humanities | 261 | 9.8% |
| Total | 2,675 | 100.0% |
Transportation & Commute in Marion
Vehicle Availability by Sex in Marion
The most prevalent vehicle ownership categories in Marion are males with 2 vehicles (3,134, accounting for 42.6%) and females with 2 vehicles (2,306, making up 53.8%).
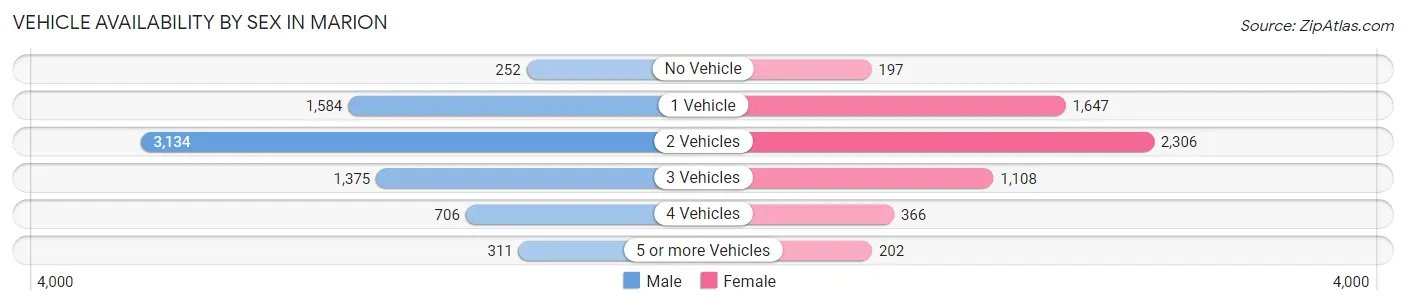
| Vehicles Available | Male | Female |
| No Vehicle | 252 (3.4%) | 197 (3.4%) |
| 1 Vehicle | 1,584 (21.5%) | 1,647 (28.3%) |
| 2 Vehicles | 3,134 (42.6%) | 2,306 (39.6%) |
| 3 Vehicles | 1,375 (18.7%) | 1,108 (19.0%) |
| 4 Vehicles | 706 (9.6%) | 366 (6.3%) |
| 5 or more Vehicles | 311 (4.2%) | 202 (3.5%) |
| Total | 7,362 (100.0%) | 5,826 (100.0%) |
Commute Time in Marion
The most frequently occuring commute durations in Marion are 10 to 14 minutes (3,374 commuters, 26.5%), 5 to 9 minutes (2,932 commuters, 23.0%), and 15 to 19 minutes (1,773 commuters, 13.9%).
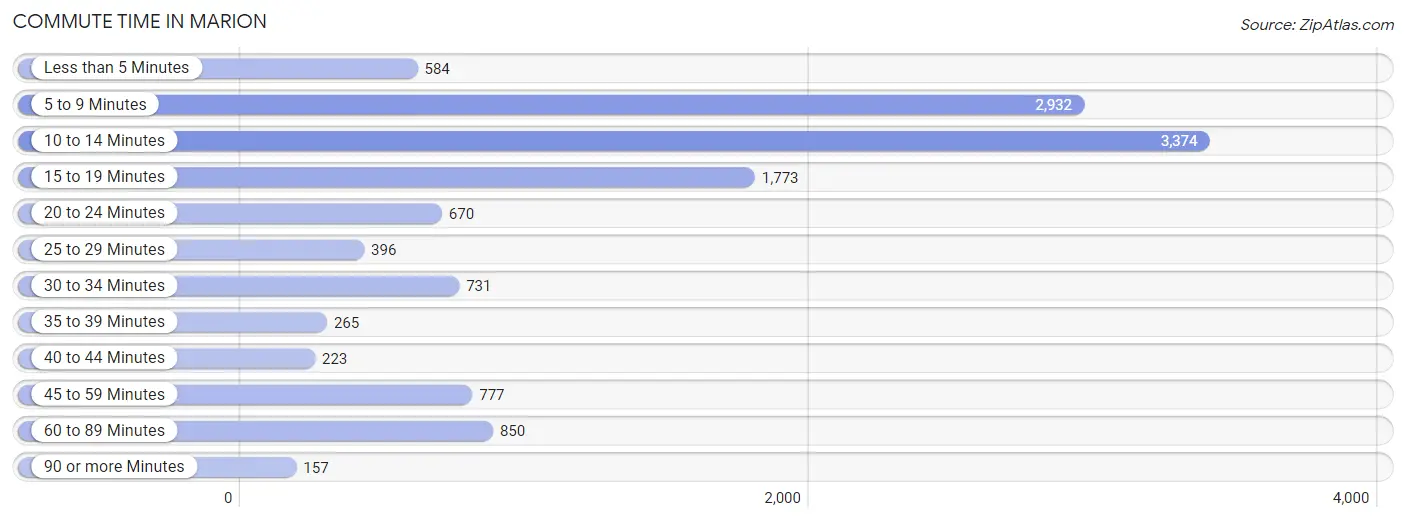
| Commute Time | # Commuters | % Commuters |
| Less than 5 Minutes | 584 | 4.6% |
| 5 to 9 Minutes | 2,932 | 23.0% |
| 10 to 14 Minutes | 3,374 | 26.5% |
| 15 to 19 Minutes | 1,773 | 13.9% |
| 20 to 24 Minutes | 670 | 5.3% |
| 25 to 29 Minutes | 396 | 3.1% |
| 30 to 34 Minutes | 731 | 5.7% |
| 35 to 39 Minutes | 265 | 2.1% |
| 40 to 44 Minutes | 223 | 1.8% |
| 45 to 59 Minutes | 777 | 6.1% |
| 60 to 89 Minutes | 850 | 6.7% |
| 90 or more Minutes | 157 | 1.2% |
Commute Time by Sex in Marion
The most common commute times in Marion are 10 to 14 minutes (1,850 commuters, 26.0%) for males and 10 to 14 minutes (1,524 commuters, 27.1%) for females.
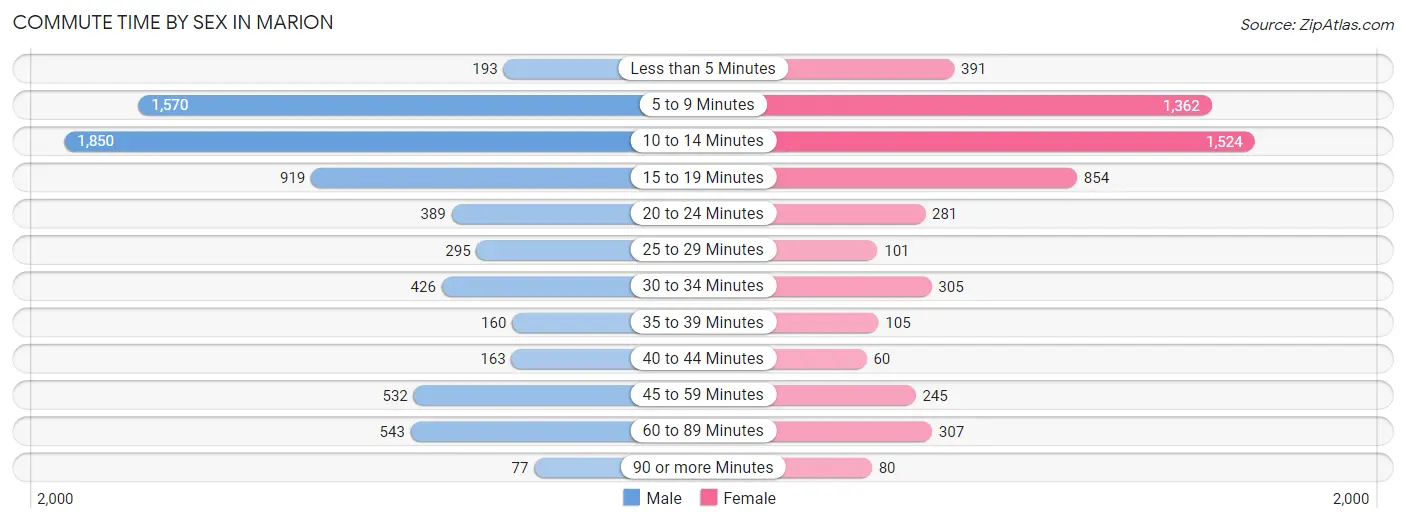
| Commute Time | Male | Female |
| Less than 5 Minutes | 193 (2.7%) | 391 (7.0%) |
| 5 to 9 Minutes | 1,570 (22.1%) | 1,362 (24.3%) |
| 10 to 14 Minutes | 1,850 (26.0%) | 1,524 (27.1%) |
| 15 to 19 Minutes | 919 (12.9%) | 854 (15.2%) |
| 20 to 24 Minutes | 389 (5.5%) | 281 (5.0%) |
| 25 to 29 Minutes | 295 (4.2%) | 101 (1.8%) |
| 30 to 34 Minutes | 426 (6.0%) | 305 (5.4%) |
| 35 to 39 Minutes | 160 (2.2%) | 105 (1.9%) |
| 40 to 44 Minutes | 163 (2.3%) | 60 (1.1%) |
| 45 to 59 Minutes | 532 (7.5%) | 245 (4.4%) |
| 60 to 89 Minutes | 543 (7.6%) | 307 (5.5%) |
| 90 or more Minutes | 77 (1.1%) | 80 (1.4%) |
Time of Departure to Work by Sex in Marion
The most frequent times of departure to work in Marion are 12:00 PM to 3:59 PM (1,151, 16.2%) for males and 12:00 PM to 3:59 PM (719, 12.8%) for females.
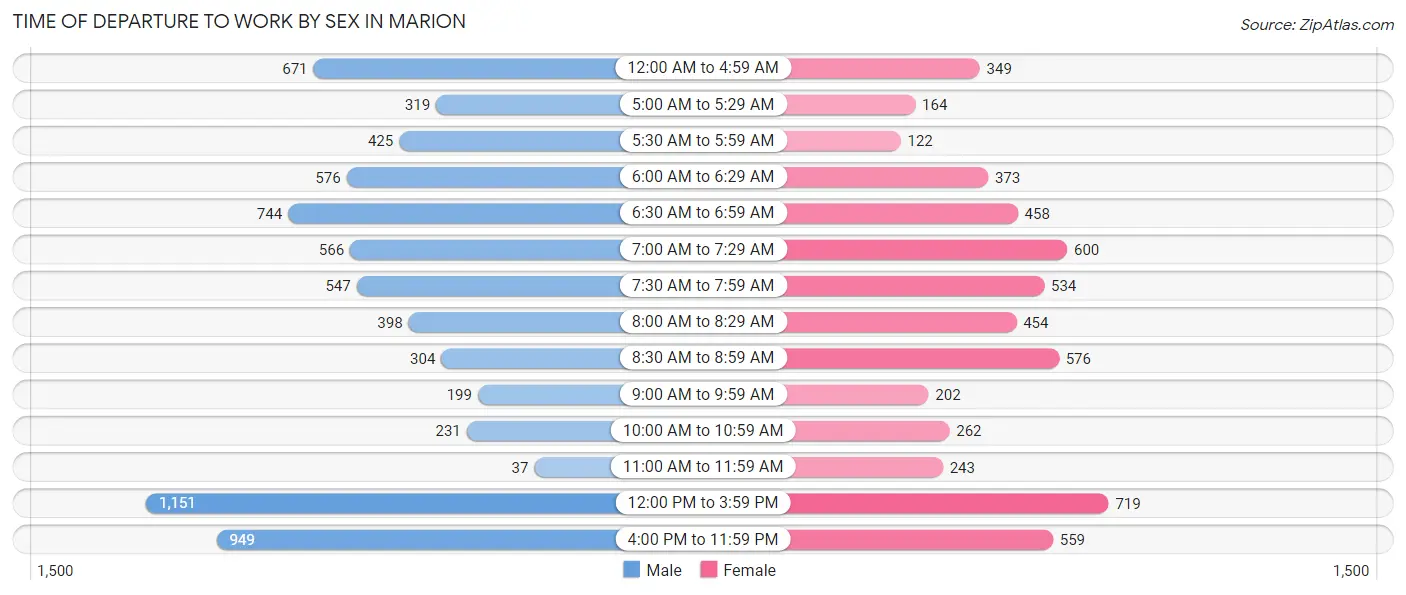
| Time of Departure | Male | Female |
| 12:00 AM to 4:59 AM | 671 (9.4%) | 349 (6.2%) |
| 5:00 AM to 5:29 AM | 319 (4.5%) | 164 (2.9%) |
| 5:30 AM to 5:59 AM | 425 (6.0%) | 122 (2.2%) |
| 6:00 AM to 6:29 AM | 576 (8.1%) | 373 (6.6%) |
| 6:30 AM to 6:59 AM | 744 (10.4%) | 458 (8.2%) |
| 7:00 AM to 7:29 AM | 566 (8.0%) | 600 (10.7%) |
| 7:30 AM to 7:59 AM | 547 (7.7%) | 534 (9.5%) |
| 8:00 AM to 8:29 AM | 398 (5.6%) | 454 (8.1%) |
| 8:30 AM to 8:59 AM | 304 (4.3%) | 576 (10.3%) |
| 9:00 AM to 9:59 AM | 199 (2.8%) | 202 (3.6%) |
| 10:00 AM to 10:59 AM | 231 (3.3%) | 262 (4.7%) |
| 11:00 AM to 11:59 AM | 37 (0.5%) | 243 (4.3%) |
| 12:00 PM to 3:59 PM | 1,151 (16.2%) | 719 (12.8%) |
| 4:00 PM to 11:59 PM | 949 (13.3%) | 559 (10.0%) |
| Total | 7,117 (100.0%) | 5,615 (100.0%) |
Housing Occupancy in Marion
Occupancy by Ownership in Marion
Of the total 12,266 dwellings in Marion, owner-occupied units account for 6,754 (55.1%), while renter-occupied units make up 5,512 (44.9%).
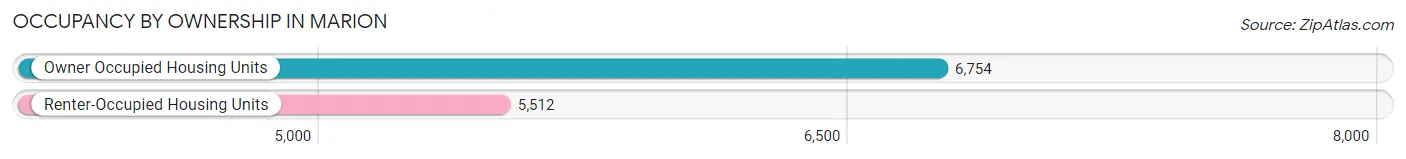
| Occupancy | # Housing Units | % Housing Units |
| Owner Occupied Housing Units | 6,754 | 55.1% |
| Renter-Occupied Housing Units | 5,512 | 44.9% |
| Total Occupied Housing Units | 12,266 | 100.0% |
Occupancy by Household Size in Marion
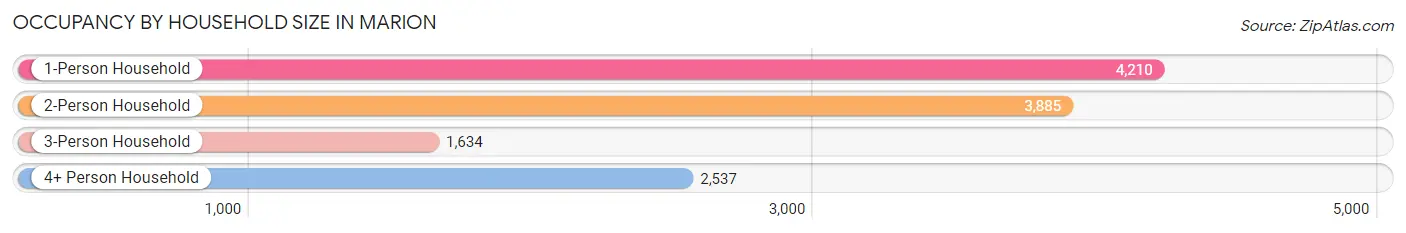
| Household Size | # Housing Units | % Housing Units |
| 1-Person Household | 4,210 | 34.3% |
| 2-Person Household | 3,885 | 31.7% |
| 3-Person Household | 1,634 | 13.3% |
| 4+ Person Household | 2,537 | 20.7% |
| Total Housing Units | 12,266 | 100.0% |
Occupancy by Ownership by Household Size in Marion
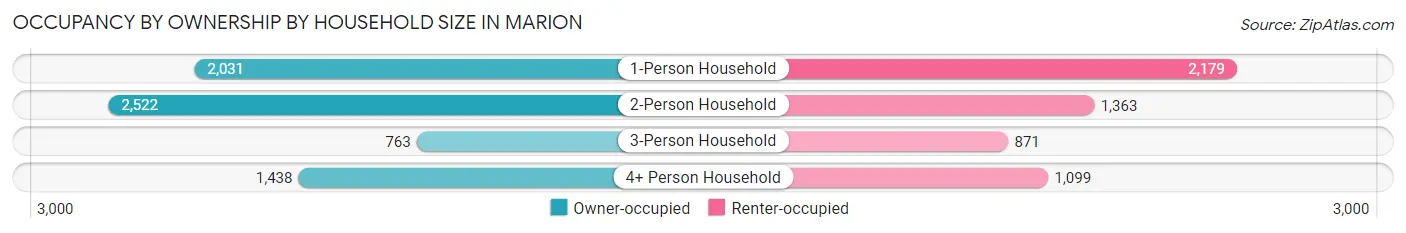
| Household Size | Owner-occupied | Renter-occupied |
| 1-Person Household | 2,031 (48.2%) | 2,179 (51.8%) |
| 2-Person Household | 2,522 (64.9%) | 1,363 (35.1%) |
| 3-Person Household | 763 (46.7%) | 871 (53.3%) |
| 4+ Person Household | 1,438 (56.7%) | 1,099 (43.3%) |
| Total Housing Units | 6,754 (55.1%) | 5,512 (44.9%) |
Occupancy by Educational Attainment in Marion
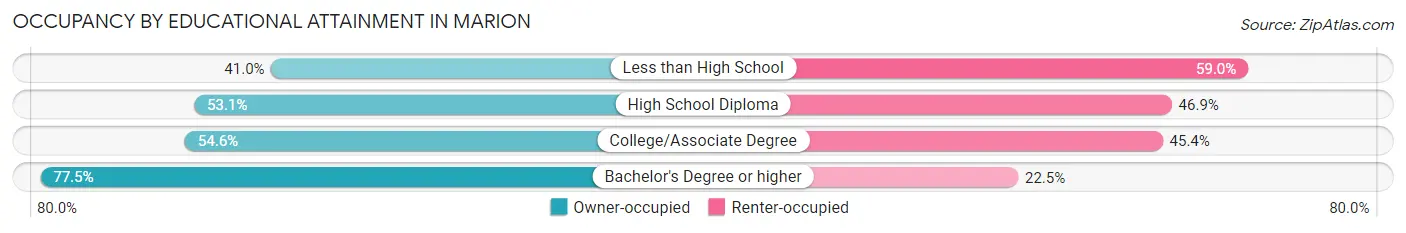
| Household Size | Owner-occupied | Renter-occupied |
| Less than High School | 575 (41.0%) | 827 (59.0%) |
| High School Diploma | 2,855 (53.1%) | 2,519 (46.9%) |
| College/Associate Degree | 2,215 (54.6%) | 1,844 (45.4%) |
| Bachelor's Degree or higher | 1,109 (77.5%) | 322 (22.5%) |
Occupancy by Age of Householder in Marion
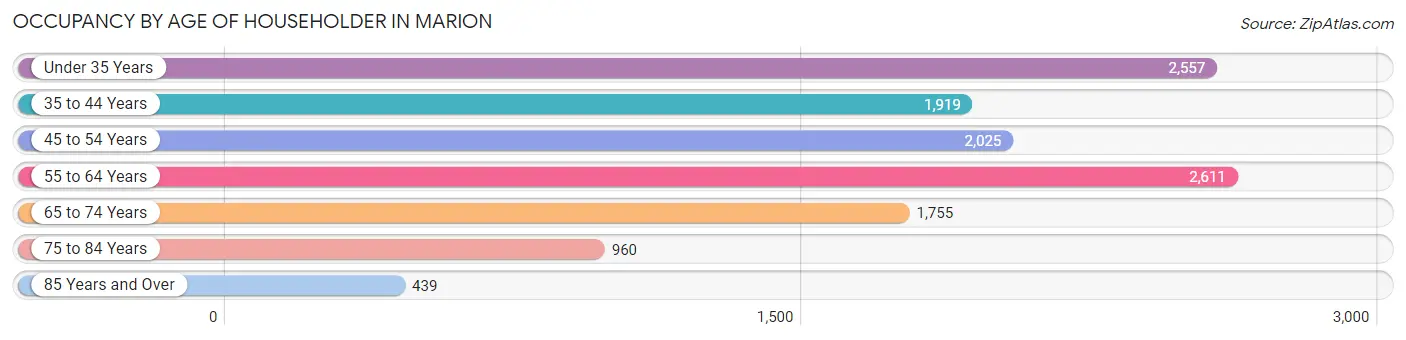
| Age Bracket | # Households | % Households |
| Under 35 Years | 2,557 | 20.8% |
| 35 to 44 Years | 1,919 | 15.6% |
| 45 to 54 Years | 2,025 | 16.5% |
| 55 to 64 Years | 2,611 | 21.3% |
| 65 to 74 Years | 1,755 | 14.3% |
| 75 to 84 Years | 960 | 7.8% |
| 85 Years and Over | 439 | 3.6% |
| Total | 12,266 | 100.0% |
Housing Finances in Marion
Median Income by Occupancy in Marion
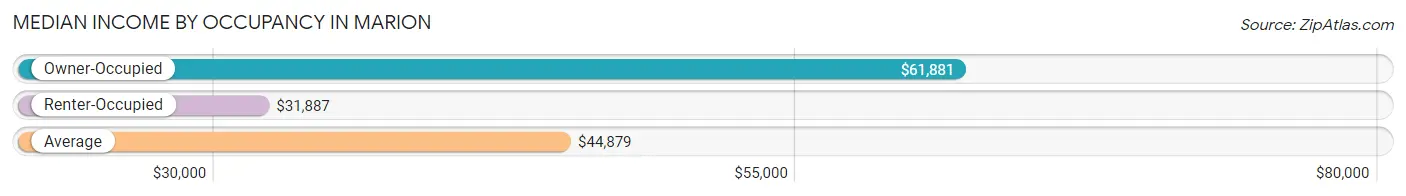
| Occupancy Type | # Households | Median Income |
| Owner-Occupied | 6,754 (55.1%) | $61,881 |
| Renter-Occupied | 5,512 (44.9%) | $31,887 |
| Average | 12,266 (100.0%) | $44,879 |
Occupancy by Householder Income Bracket in Marion
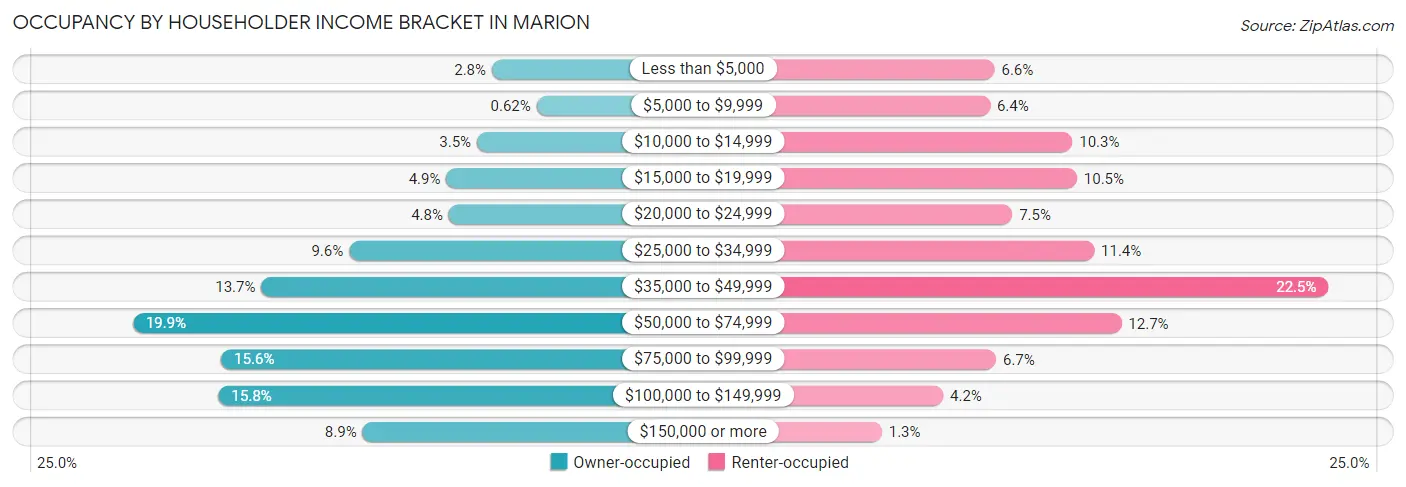
| Income Bracket | Owner-occupied | Renter-occupied |
| Less than $5,000 | 186 (2.8%) | 365 (6.6%) |
| $5,000 to $9,999 | 42 (0.6%) | 353 (6.4%) |
| $10,000 to $14,999 | 234 (3.5%) | 569 (10.3%) |
| $15,000 to $19,999 | 332 (4.9%) | 581 (10.5%) |
| $20,000 to $24,999 | 324 (4.8%) | 411 (7.5%) |
| $25,000 to $34,999 | 645 (9.6%) | 626 (11.4%) |
| $35,000 to $49,999 | 927 (13.7%) | 1,241 (22.5%) |
| $50,000 to $74,999 | 1,341 (19.9%) | 698 (12.7%) |
| $75,000 to $99,999 | 1,056 (15.6%) | 369 (6.7%) |
| $100,000 to $149,999 | 1,065 (15.8%) | 230 (4.2%) |
| $150,000 or more | 602 (8.9%) | 69 (1.3%) |
| Total | 6,754 (100.0%) | 5,512 (100.0%) |
Monthly Housing Cost Tiers in Marion
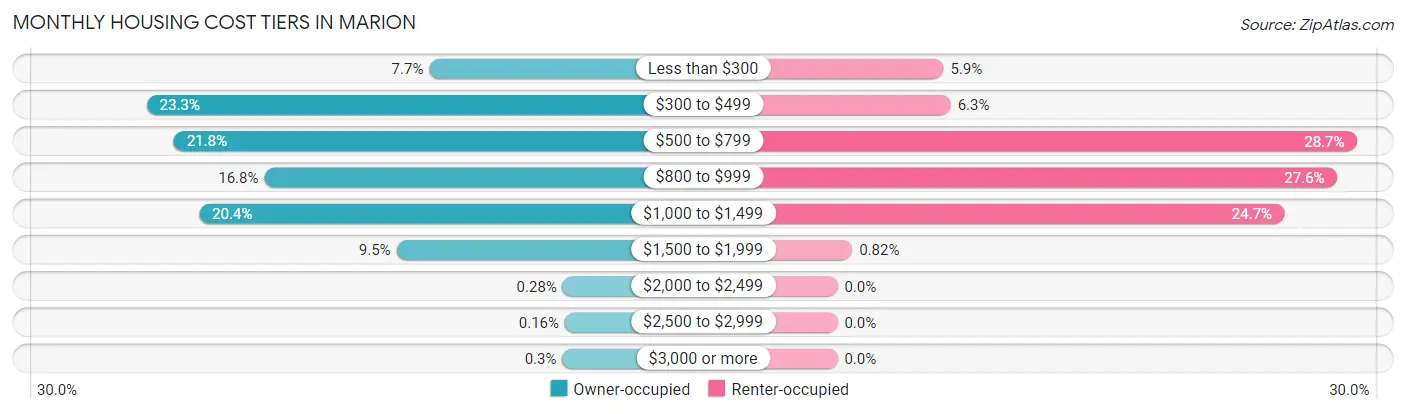
| Monthly Cost | Owner-occupied | Renter-occupied |
| Less than $300 | 517 (7.6%) | 323 (5.9%) |
| $300 to $499 | 1,571 (23.3%) | 345 (6.3%) |
| $500 to $799 | 1,470 (21.8%) | 1,580 (28.7%) |
| $800 to $999 | 1,132 (16.8%) | 1,519 (27.6%) |
| $1,000 to $1,499 | 1,375 (20.4%) | 1,359 (24.7%) |
| $1,500 to $1,999 | 639 (9.5%) | 45 (0.8%) |
| $2,000 to $2,499 | 19 (0.3%) | 0 (0.0%) |
| $2,500 to $2,999 | 11 (0.2%) | 0 (0.0%) |
| $3,000 or more | 20 (0.3%) | 0 (0.0%) |
| Total | 6,754 (100.0%) | 5,512 (100.0%) |
Physical Housing Characteristics in Marion
Housing Structures in Marion
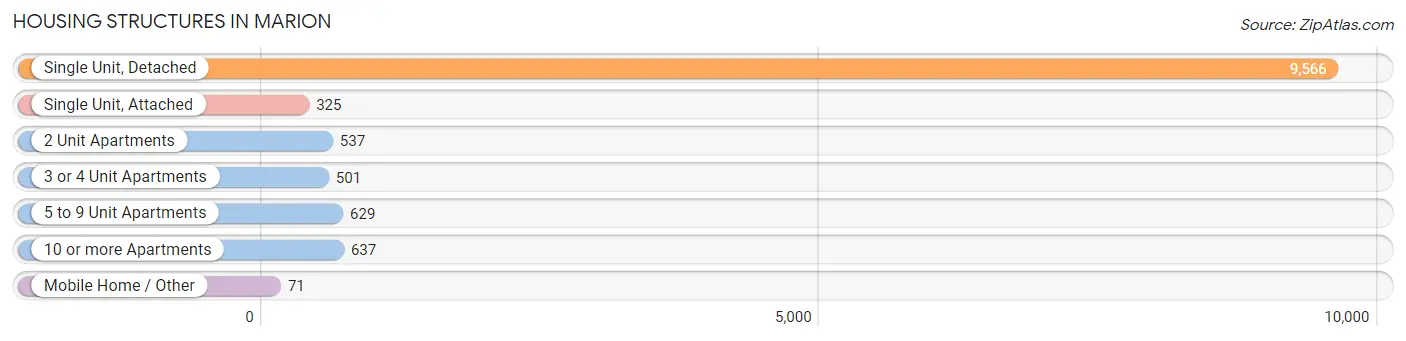
| Structure Type | # Housing Units | % Housing Units |
| Single Unit, Detached | 9,566 | 78.0% |
| Single Unit, Attached | 325 | 2.6% |
| 2 Unit Apartments | 537 | 4.4% |
| 3 or 4 Unit Apartments | 501 | 4.1% |
| 5 to 9 Unit Apartments | 629 | 5.1% |
| 10 or more Apartments | 637 | 5.2% |
| Mobile Home / Other | 71 | 0.6% |
| Total | 12,266 | 100.0% |
Housing Structures by Occupancy in Marion
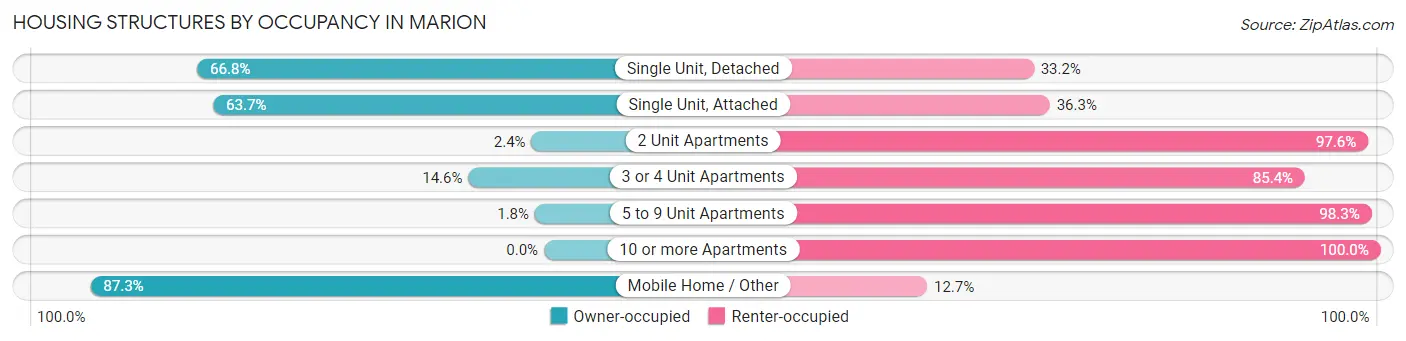
| Structure Type | Owner-occupied | Renter-occupied |
| Single Unit, Detached | 6,388 (66.8%) | 3,178 (33.2%) |
| Single Unit, Attached | 207 (63.7%) | 118 (36.3%) |
| 2 Unit Apartments | 13 (2.4%) | 524 (97.6%) |
| 3 or 4 Unit Apartments | 73 (14.6%) | 428 (85.4%) |
| 5 to 9 Unit Apartments | 11 (1.8%) | 618 (98.3%) |
| 10 or more Apartments | 0 (0.0%) | 637 (100.0%) |
| Mobile Home / Other | 62 (87.3%) | 9 (12.7%) |
| Total | 6,754 (55.1%) | 5,512 (44.9%) |
Housing Structures by Number of Rooms in Marion
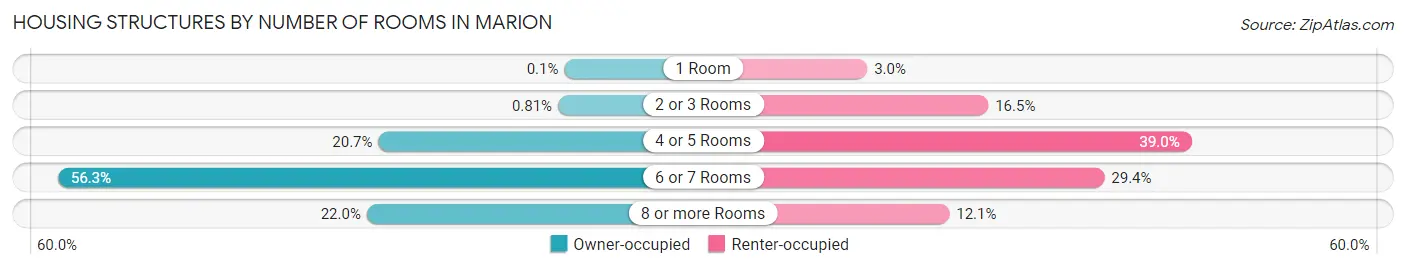
| Number of Rooms | Owner-occupied | Renter-occupied |
| 1 Room | 7 (0.1%) | 167 (3.0%) |
| 2 or 3 Rooms | 55 (0.8%) | 907 (16.5%) |
| 4 or 5 Rooms | 1,401 (20.7%) | 2,151 (39.0%) |
| 6 or 7 Rooms | 3,803 (56.3%) | 1,618 (29.3%) |
| 8 or more Rooms | 1,488 (22.0%) | 669 (12.1%) |
| Total | 6,754 (100.0%) | 5,512 (100.0%) |
Housing Structure by Heating Type in Marion
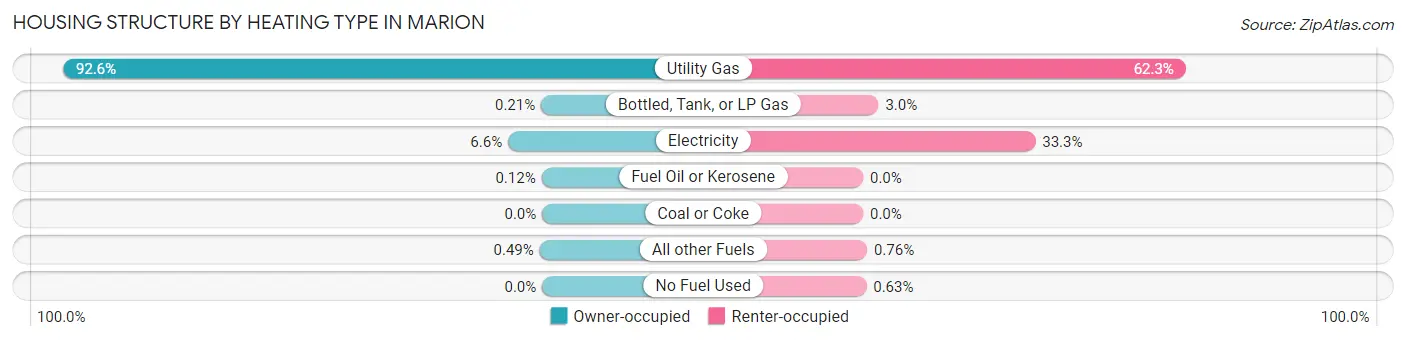
| Heating Type | Owner-occupied | Renter-occupied |
| Utility Gas | 6,254 (92.6%) | 3,436 (62.3%) |
| Bottled, Tank, or LP Gas | 14 (0.2%) | 164 (3.0%) |
| Electricity | 445 (6.6%) | 1,835 (33.3%) |
| Fuel Oil or Kerosene | 8 (0.1%) | 0 (0.0%) |
| Coal or Coke | 0 (0.0%) | 0 (0.0%) |
| All other Fuels | 33 (0.5%) | 42 (0.8%) |
| No Fuel Used | 0 (0.0%) | 35 (0.6%) |
| Total | 6,754 (100.0%) | 5,512 (100.0%) |
Household Vehicle Usage in Marion
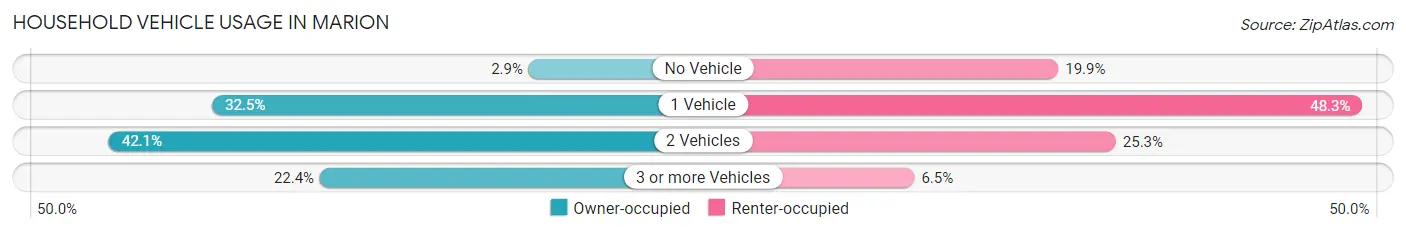
| Vehicles per Household | Owner-occupied | Renter-occupied |
| No Vehicle | 198 (2.9%) | 1,098 (19.9%) |
| 1 Vehicle | 2,195 (32.5%) | 2,662 (48.3%) |
| 2 Vehicles | 2,846 (42.1%) | 1,394 (25.3%) |
| 3 or more Vehicles | 1,515 (22.4%) | 358 (6.5%) |
| Total | 6,754 (100.0%) | 5,512 (100.0%) |
Real Estate & Mortgages in Marion
Real Estate and Mortgage Overview in Marion
| Characteristic | Without Mortgage | With Mortgage |
| Housing Units | 2,710 | 4,044 |
| Median Property Value | $90,400 | $103,800 |
| Median Household Income | $46,349 | $449 |
| Monthly Housing Costs | $407 | $20 |
| Real Estate Taxes | $983 | $106 |
Property Value by Mortgage Status in Marion
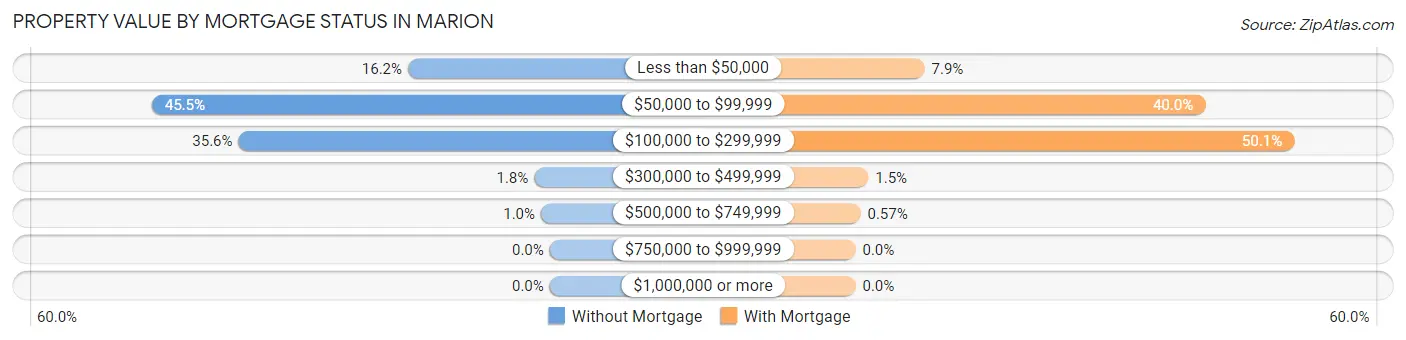
| Property Value | Without Mortgage | With Mortgage |
| Less than $50,000 | 439 (16.2%) | 319 (7.9%) |
| $50,000 to $99,999 | 1,232 (45.5%) | 1,616 (40.0%) |
| $100,000 to $299,999 | 964 (35.6%) | 2,027 (50.1%) |
| $300,000 to $499,999 | 48 (1.8%) | 59 (1.5%) |
| $500,000 to $749,999 | 27 (1.0%) | 23 (0.6%) |
| $750,000 to $999,999 | 0 (0.0%) | 0 (0.0%) |
| $1,000,000 or more | 0 (0.0%) | 0 (0.0%) |
| Total | 2,710 (100.0%) | 4,044 (100.0%) |
Household Income by Mortgage Status in Marion
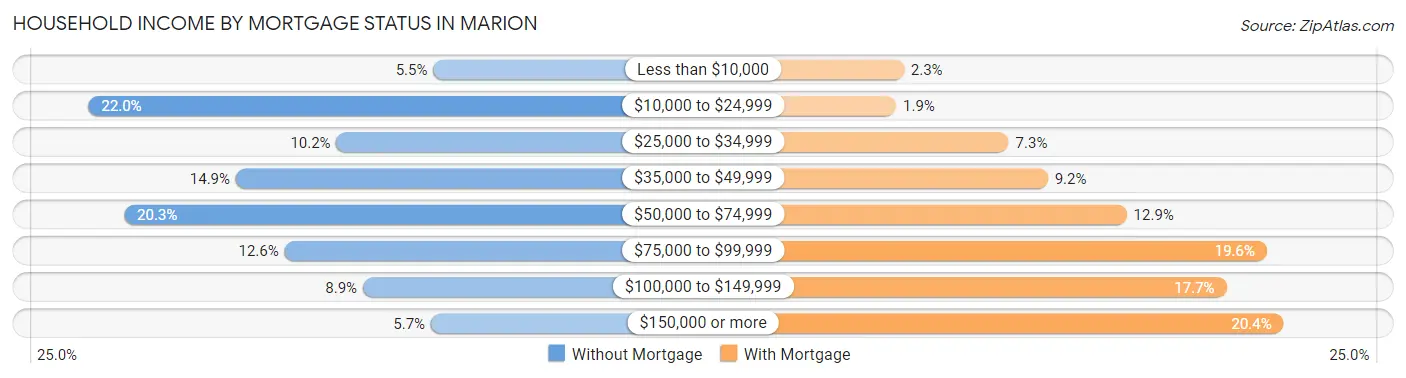
| Household Income | Without Mortgage | With Mortgage |
| Less than $10,000 | 150 (5.5%) | 93 (2.3%) |
| $10,000 to $24,999 | 595 (22.0%) | 78 (1.9%) |
| $25,000 to $34,999 | 275 (10.2%) | 295 (7.3%) |
| $35,000 to $49,999 | 405 (14.9%) | 370 (9.1%) |
| $50,000 to $74,999 | 549 (20.3%) | 522 (12.9%) |
| $75,000 to $99,999 | 342 (12.6%) | 792 (19.6%) |
| $100,000 to $149,999 | 241 (8.9%) | 714 (17.7%) |
| $150,000 or more | 153 (5.7%) | 824 (20.4%) |
| Total | 2,710 (100.0%) | 4,044 (100.0%) |
Property Value to Household Income Ratio in Marion
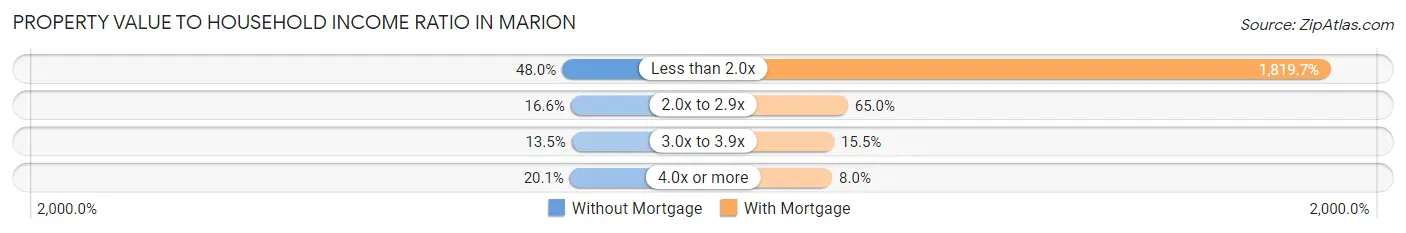
| Value-to-Income Ratio | Without Mortgage | With Mortgage |
| Less than 2.0x | 1,300 (48.0%) | 73,589 (1,819.7%) |
| 2.0x to 2.9x | 450 (16.6%) | 2,629 (65.0%) |
| 3.0x to 3.9x | 367 (13.5%) | 625 (15.4%) |
| 4.0x or more | 544 (20.1%) | 325 (8.0%) |
| Total | 2,710 (100.0%) | 4,044 (100.0%) |
Real Estate Taxes by Mortgage Status in Marion
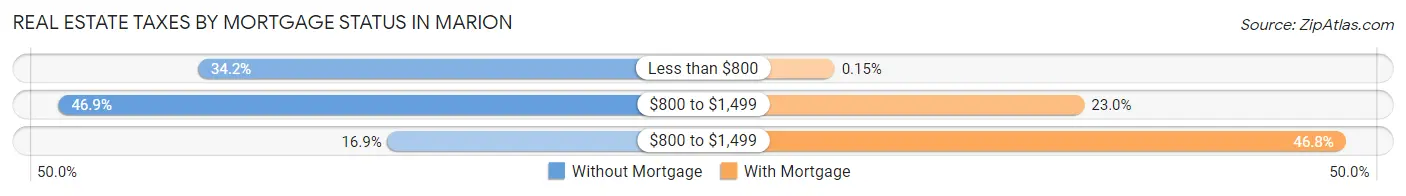
| Property Taxes | Without Mortgage | With Mortgage |
| Less than $800 | 926 (34.2%) | 6 (0.2%) |
| $800 to $1,499 | 1,271 (46.9%) | 928 (23.0%) |
| $800 to $1,499 | 457 (16.9%) | 1,893 (46.8%) |
| Total | 2,710 (100.0%) | 4,044 (100.0%) |
Health & Disability in Marion
Health Insurance Coverage by Age in Marion
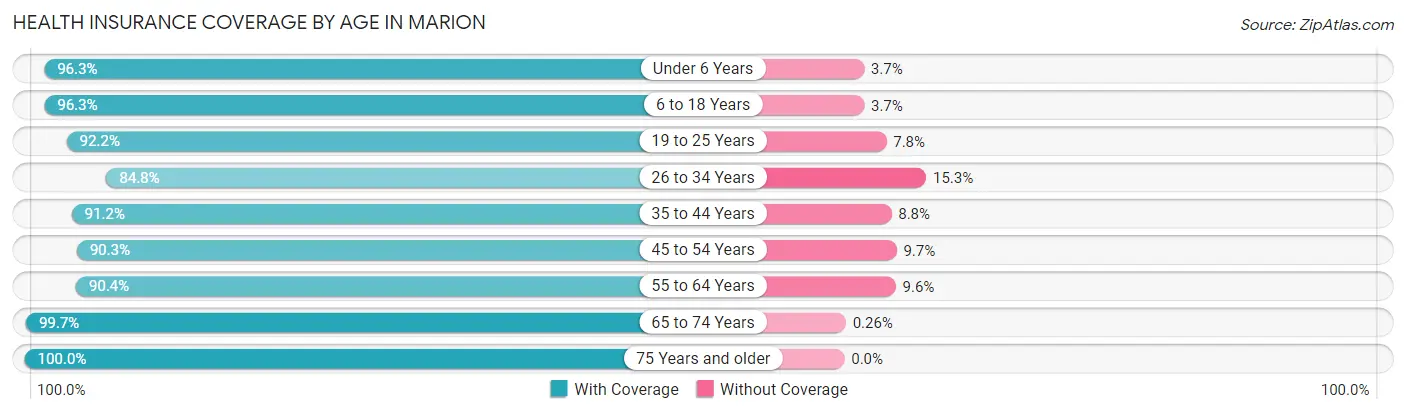
| Age Bracket | With Coverage | Without Coverage |
| Under 6 Years | 2,394 (96.3%) | 91 (3.7%) |
| 6 to 18 Years | 5,209 (96.3%) | 199 (3.7%) |
| 19 to 25 Years | 2,613 (92.2%) | 222 (7.8%) |
| 26 to 34 Years | 3,800 (84.8%) | 684 (15.2%) |
| 35 to 44 Years | 3,280 (91.2%) | 315 (8.8%) |
| 45 to 54 Years | 3,033 (90.3%) | 327 (9.7%) |
| 55 to 64 Years | 3,800 (90.4%) | 402 (9.6%) |
| 65 to 74 Years | 2,728 (99.7%) | 7 (0.3%) |
| 75 Years and older | 1,770 (100.0%) | 0 (0.0%) |
| Total | 28,627 (92.7%) | 2,247 (7.3%) |
Health Insurance Coverage by Citizenship Status in Marion
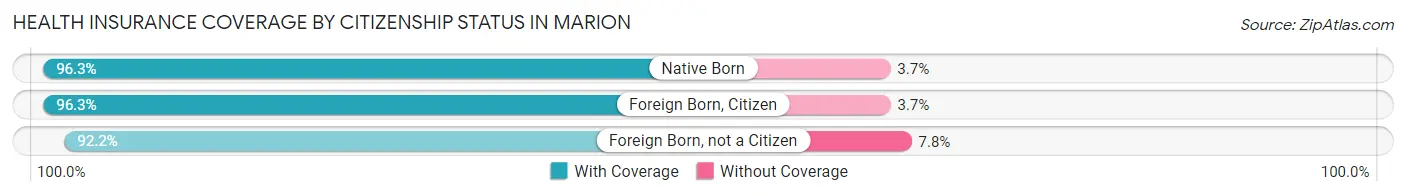
| Citizenship Status | With Coverage | Without Coverage |
| Native Born | 2,394 (96.3%) | 91 (3.7%) |
| Foreign Born, Citizen | 5,209 (96.3%) | 199 (3.7%) |
| Foreign Born, not a Citizen | 2,613 (92.2%) | 222 (7.8%) |
Health Insurance Coverage by Household Income in Marion
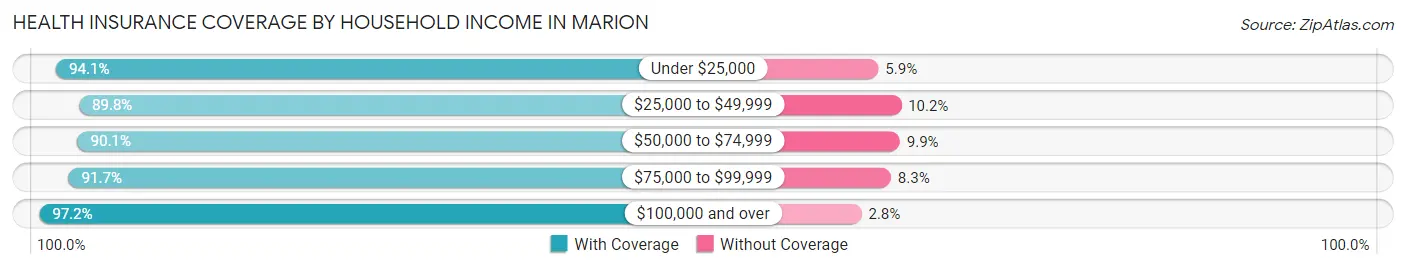
| Household Income | With Coverage | Without Coverage |
| Under $25,000 | 5,991 (94.1%) | 377 (5.9%) |
| $25,000 to $49,999 | 7,247 (89.8%) | 822 (10.2%) |
| $50,000 to $74,999 | 4,682 (90.1%) | 517 (9.9%) |
| $75,000 to $99,999 | 3,665 (91.7%) | 330 (8.3%) |
| $100,000 and over | 6,898 (97.2%) | 196 (2.8%) |
Public vs Private Health Insurance Coverage by Age in Marion
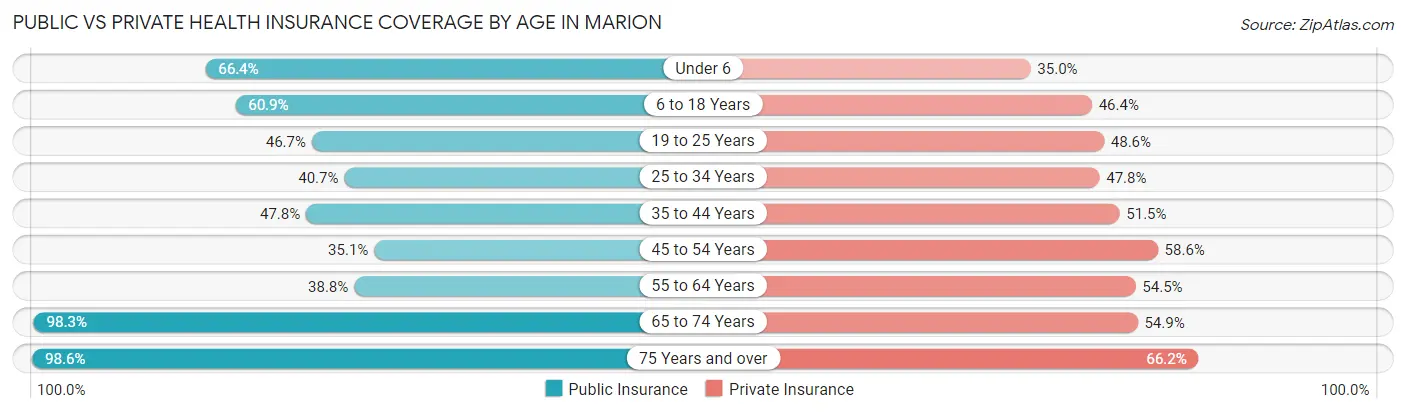
| Age Bracket | Public Insurance | Private Insurance |
| Under 6 | 1,651 (66.4%) | 870 (35.0%) |
| 6 to 18 Years | 3,293 (60.9%) | 2,509 (46.4%) |
| 19 to 25 Years | 1,324 (46.7%) | 1,379 (48.6%) |
| 25 to 34 Years | 1,823 (40.7%) | 2,143 (47.8%) |
| 35 to 44 Years | 1,717 (47.8%) | 1,852 (51.5%) |
| 45 to 54 Years | 1,180 (35.1%) | 1,970 (58.6%) |
| 55 to 64 Years | 1,632 (38.8%) | 2,290 (54.5%) |
| 65 to 74 Years | 2,689 (98.3%) | 1,501 (54.9%) |
| 75 Years and over | 1,745 (98.6%) | 1,172 (66.2%) |
| Total | 17,054 (55.2%) | 15,686 (50.8%) |
Disability Status by Sex by Age in Marion
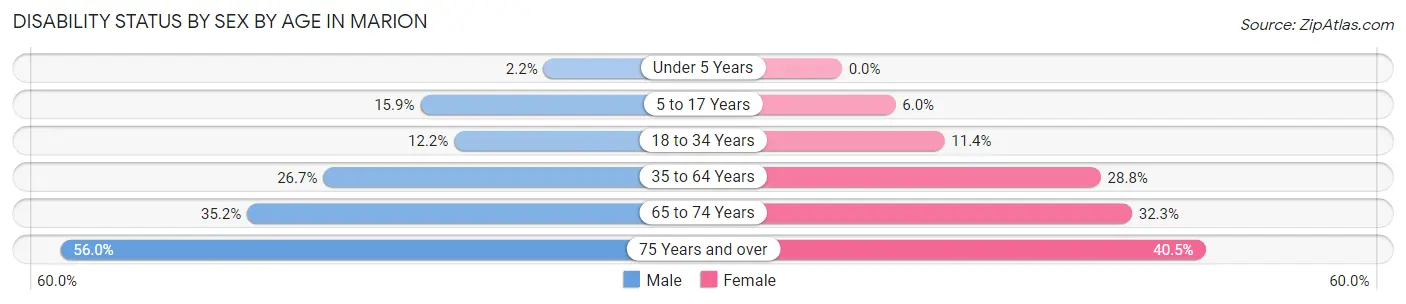
| Age Bracket | Male | Female |
| Under 5 Years | 25 (2.2%) | 0 (0.0%) |
| 5 to 17 Years | 454 (15.9%) | 139 (6.0%) |
| 18 to 34 Years | 511 (12.2%) | 417 (11.4%) |
| 35 to 64 Years | 1,475 (26.7%) | 1,626 (28.8%) |
| 65 to 74 Years | 453 (35.2%) | 468 (32.3%) |
| 75 Years and over | 261 (56.0%) | 528 (40.5%) |
Disability Class by Sex by Age in Marion
Disability Class: Hearing Difficulty
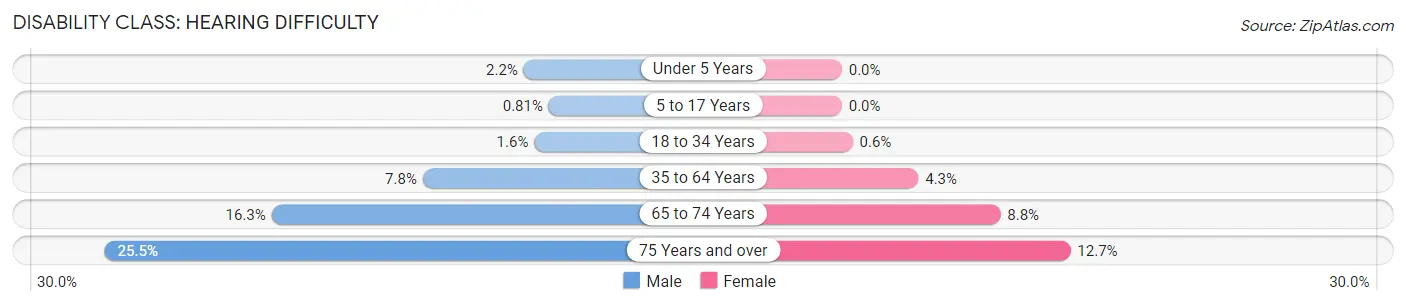
| Age Bracket | Male | Female |
| Under 5 Years | 25 (2.2%) | 0 (0.0%) |
| 5 to 17 Years | 23 (0.8%) | 0 (0.0%) |
| 18 to 34 Years | 68 (1.6%) | 22 (0.6%) |
| 35 to 64 Years | 432 (7.8%) | 240 (4.3%) |
| 65 to 74 Years | 209 (16.3%) | 128 (8.8%) |
| 75 Years and over | 119 (25.5%) | 166 (12.7%) |
Disability Class: Vision Difficulty
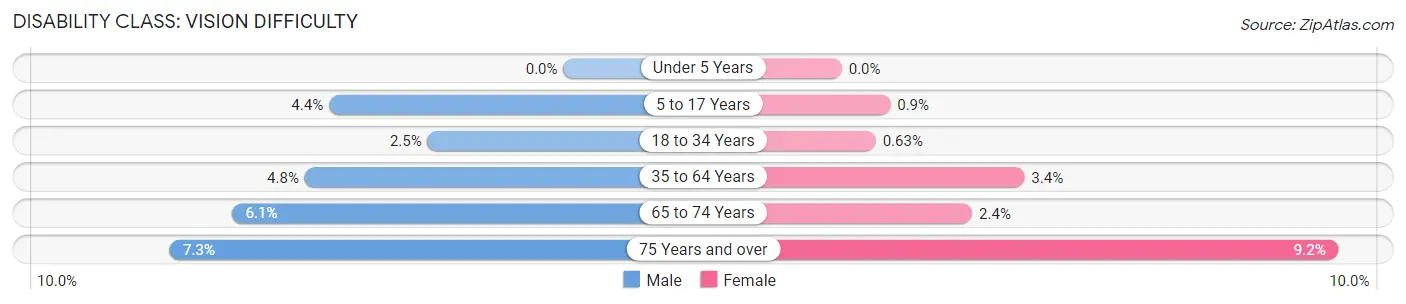
| Age Bracket | Male | Female |
| Under 5 Years | 0 (0.0%) | 0 (0.0%) |
| 5 to 17 Years | 124 (4.3%) | 21 (0.9%) |
| 18 to 34 Years | 106 (2.5%) | 23 (0.6%) |
| 35 to 64 Years | 265 (4.8%) | 191 (3.4%) |
| 65 to 74 Years | 79 (6.1%) | 35 (2.4%) |
| 75 Years and over | 34 (7.3%) | 120 (9.2%) |
Disability Class: Cognitive Difficulty
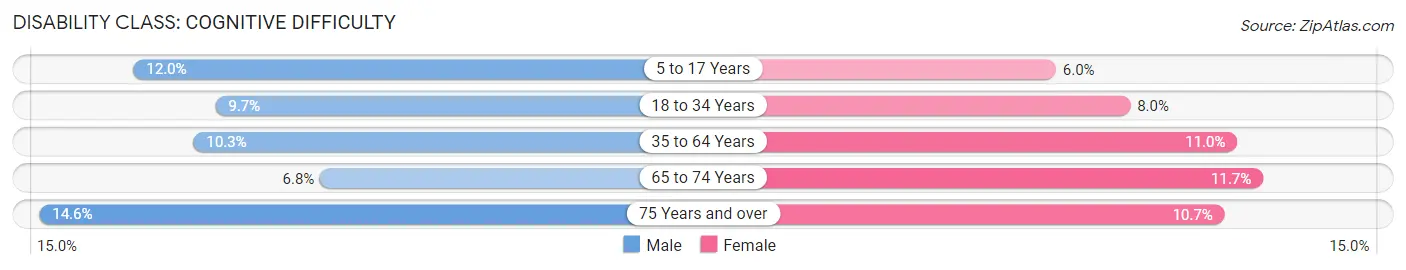
| Age Bracket | Male | Female |
| 5 to 17 Years | 341 (12.0%) | 139 (6.0%) |
| 18 to 34 Years | 407 (9.7%) | 293 (8.0%) |
| 35 to 64 Years | 568 (10.3%) | 621 (11.0%) |
| 65 to 74 Years | 87 (6.8%) | 170 (11.7%) |
| 75 Years and over | 68 (14.6%) | 139 (10.7%) |
Disability Class: Ambulatory Difficulty
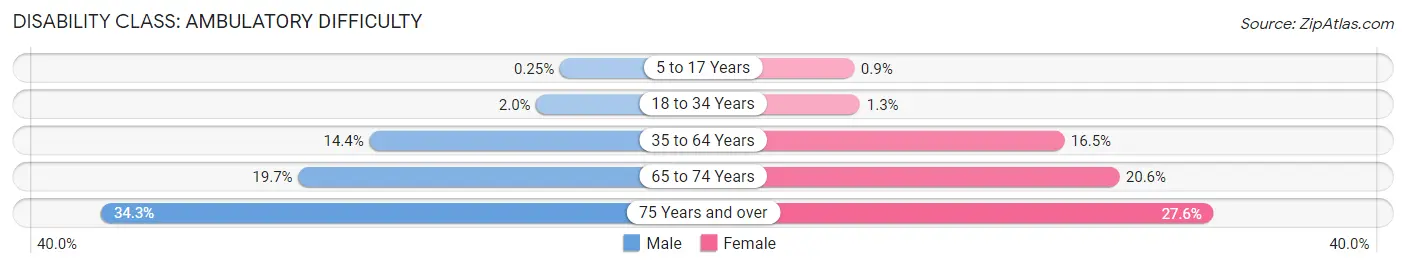
| Age Bracket | Male | Female |
| 5 to 17 Years | 7 (0.3%) | 21 (0.9%) |
| 18 to 34 Years | 84 (2.0%) | 49 (1.3%) |
| 35 to 64 Years | 794 (14.4%) | 930 (16.5%) |
| 65 to 74 Years | 253 (19.7%) | 298 (20.6%) |
| 75 Years and over | 160 (34.3%) | 360 (27.6%) |
Disability Class: Self-Care Difficulty
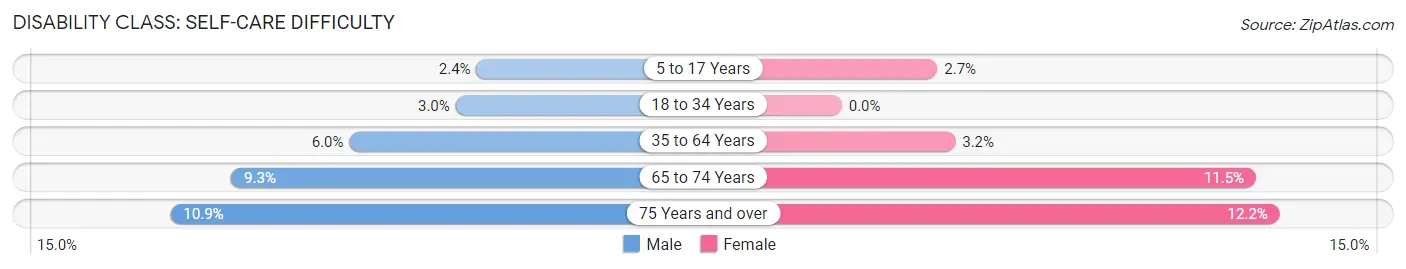
| Age Bracket | Male | Female |
| 5 to 17 Years | 69 (2.4%) | 62 (2.7%) |
| 18 to 34 Years | 126 (3.0%) | 0 (0.0%) |
| 35 to 64 Years | 329 (6.0%) | 178 (3.2%) |
| 65 to 74 Years | 119 (9.2%) | 167 (11.5%) |
| 75 Years and over | 51 (10.9%) | 159 (12.2%) |
Technology Access in Marion
Computing Device Access in Marion
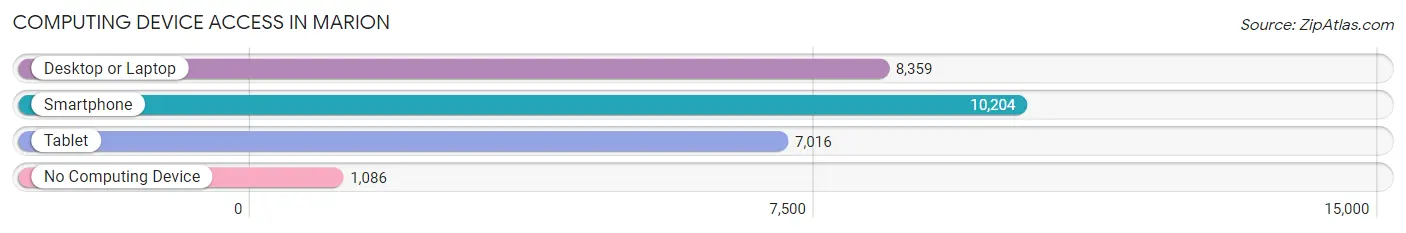
| Device Type | # Households | % Households |
| Desktop or Laptop | 8,359 | 68.1% |
| Smartphone | 10,204 | 83.2% |
| Tablet | 7,016 | 57.2% |
| No Computing Device | 1,086 | 8.8% |
| Total | 12,266 | 100.0% |
Internet Access in Marion
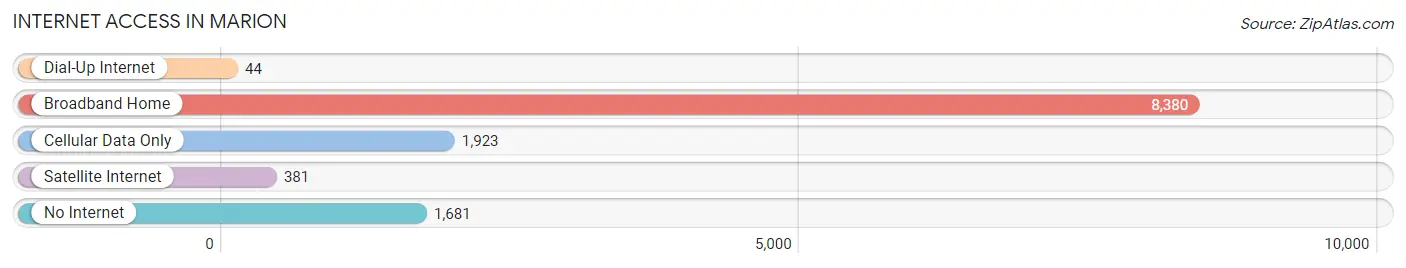
| Internet Type | # Households | % Households |
| Dial-Up Internet | 44 | 0.4% |
| Broadband Home | 8,380 | 68.3% |
| Cellular Data Only | 1,923 | 15.7% |
| Satellite Internet | 381 | 3.1% |
| No Internet | 1,681 | 13.7% |
| Total | 12,266 | 100.0% |
Marion Summary
Marion, Ohio is a city located in Marion County, Ohio, United States. It is the county seat of Marion County and is located in the north-central part of the state. The city is situated on the Marion-Delaware County line, and is the largest city in Marion County. As of the 2010 census, the city had a population of 36,837.
History
Marion was founded in 1822 by settlers from New England. The city was named after General Francis Marion, a Revolutionary War hero. The city was incorporated in 1823 and became the county seat of Marion County in 1824.
In the early 19th century, Marion was a major center for the production of iron and steel. The city was home to several large iron and steel mills, including the Marion Iron Works, which was the largest in the state. The city was also home to several large manufacturing companies, including the Marion Steam Shovel Company, which produced the first steam shovels in the United States.
In the late 19th century, Marion was a major center for the production of agricultural equipment. The city was home to several large companies, including the Marion Harvester Company, which produced the first combine harvesters in the United States.
In the early 20th century, Marion was a major center for the production of automobiles. The city was home to several large automobile companies, including the Marion Motor Car Company, which produced the first automobiles in the United States.
Geography
Marion is located at 40°35'N 83°7'W (40.58, -83.12). The city is situated on the Marion-Delaware County line, and is the largest city in Marion County. The city is located in the north-central part of the state, approximately 50 miles north of Columbus.
The city has a total area of 11.2 square miles, of which 11.1 square miles is land and 0.1 square miles is water. The city is located in the watershed of the Scioto River.
Economy
Marion's economy is largely based on manufacturing and agriculture. The city is home to several large manufacturing companies, including the Marion Steam Shovel Company, the Marion Harvester Company, and the Marion Motor Car Company. The city is also home to several large agricultural companies, including the Marion Grain Company and the Marion Dairy Company.
The city is also home to several large retail stores, including Walmart, Lowe's, and Target. The city is also home to several large medical facilities, including Marion General Hospital and OhioHealth Marion Medical Center.
Demographics
As of the 2010 census, the city had a population of 36,837. The racial makeup of the city was 87.2% White, 8.3% African American, 0.3% Native American, 0.7% Asian, 0.1% Pacific Islander, 1.2% from other races, and 2.3% from two or more races. Hispanic or Latino of any race were 3.2% of the population.
The median income for a household in the city was $37,945, and the median income for a family was $45,945. The per capita income for the city was $19,945. About 14.2% of families and 17.3% of the population were below the poverty line, including 25.3% of those under age 18 and 8.7% of those age 65 or over.
Common Questions
What is Per Capita Income in Marion?
Per Capita income in Marion is $20,974.
What is the Median Family Income in Marion?
Median Family Income in Marion is $53,855.
What is the Median Household income in Marion?
Median Household Income in Marion is $44,879.
What is Income or Wage Gap in Marion?
Income or Wage Gap in Marion is 26.9%.
Women in Marion earn 73.1 cents for every dollar earned by a man.
What is Family Income Deficit in Marion?
Family Income Deficit in Marion is $12,655.
Families that are below poverty line in Marion earn $12,655 less on average than the poverty threshold level.
What is Inequality or Gini Index in Marion?
Inequality or Gini Index in Marion is 0.42.
What is the Total Population of Marion?
Total Population of Marion is 35,927.
What is the Total Male Population of Marion?
Total Male Population of Marion is 20,302.
What is the Total Female Population of Marion?
Total Female Population of Marion is 15,625.
What is the Ratio of Males per 100 Females in Marion?
There are 129.93 Males per 100 Females in Marion.
What is the Ratio of Females per 100 Males in Marion?
There are 76.96 Females per 100 Males in Marion.
What is the Median Population Age in Marion?
Median Population Age in Marion is 37.7 Years.
What is the Average Family Size in Marion
Average Family Size in Marion is 3.2 People.
What is the Average Household Size in Marion
Average Household Size in Marion is 2.5 People.
How Large is the Labor Force in Marion?
There are 14,705 People in the Labor Forcein in Marion.
What is the Percentage of People in the Labor Force in Marion?
50.4% of People are in the Labor Force in Marion.
What is the Unemployment Rate in Marion?
Unemployment Rate in Marion is 8.7%.