Zip Codes with the Highest Percentage of Population with a Degree in Literature and Languages in Cleveland, OH

RELATED REPORTS & OPTIONS

Literature and Languages
Population
Families and Households
Female Fertility
Female Fertility (Unmarried)
Race (Community Size)
Race (Percentage)
Ancestry (Community Size)
AfghanAfricanAlbanianAlsatianAmericanApacheArabArgentineanArmenianAustralianAustrianBahamianBangladeshiBarbadianBelgianBelizeanBhutaneseBlackfeetBrazilianBritishBritish West IndianBulgarianBurmeseCajunCambodianCanadianCape VerdeanCarpatho RusynCelticCentral AmericanCentral American IndianCherokeeChickasawChileanChippewaChoctawColombianComancheCosta RicanCreekCroatianCubanCzechCzechoslovakianDanishDelawareDominicanDutchDutch West IndianEastern EuropeanEcuadorianEgyptianEnglishEstonianEthiopianEuropeanFilipinoFinnishFrenchFrench American IndianFrench CanadianGermanGhanaianGreekGuamanian / ChamorroGuatemalanGuyaneseHaitianHonduranHungarianIcelanderIndian (Asian)IndonesianIranianIraqiIrishIroquoisIsraeliItalianJamaicanJapaneseJordanianKoreanLaotianLatvianLebaneseLiberianLithuanianLumbeeLuxembourgerMacedonianMalaysianMexicanMexican American IndianMongolianMoroccanNative HawaiianNavajoNicaraguanNigerianNorthern EuropeanNorwegianPakistaniPalestinianPanamanianParaguayanPennsylvania GermanPeruvianPolishPortuguesePuebloPuerto RicanRomanianRussianSalvadoranSamoanScandinavianScotch-IrishScottishSeminoleSerbianSierra LeoneanSiouxSlavicSlovakSloveneSomaliSouth AfricanSouth AmericanSouth American IndianSpaniardSpanishSri LankanSubsaharan AfricanSudaneseSwedishSwissSyrianThaiTrinidadian and TobagonianTurkishU.S. Virgin IslanderUgandanUkrainianUruguayanVenezuelanVietnameseWelshWest IndianYaquiYugoslavianZimbabwean
Ancestry (Percentage)
AfghanAfricanAlbanianAlsatianAmericanApacheArabArgentineanArmenianAustralianAustrianBahamianBangladeshiBarbadianBelgianBelizeanBhutaneseBlackfeetBrazilianBritishBritish West IndianBulgarianBurmeseCajunCambodianCanadianCape VerdeanCarpatho RusynCelticCentral AmericanCentral American IndianCherokeeChickasawChileanChippewaChoctawColombianComancheCosta RicanCreekCroatianCubanCzechCzechoslovakianDanishDelawareDominicanDutchDutch West IndianEastern EuropeanEcuadorianEgyptianEnglishEstonianEthiopianEuropeanFilipinoFinnishFrenchFrench American IndianFrench CanadianGermanGhanaianGreekGuamanian / ChamorroGuatemalanGuyaneseHaitianHonduranHungarianIcelanderIndian (Asian)IndonesianIranianIraqiIrishIroquoisIsraeliItalianJamaicanJapaneseJordanianKoreanLaotianLatvianLebaneseLiberianLithuanianLumbeeLuxembourgerMacedonianMalaysianMexicanMexican American IndianMongolianMoroccanNative HawaiianNavajoNicaraguanNigerianNorthern EuropeanNorwegianPakistaniPalestinianPanamanianParaguayanPennsylvania GermanPeruvianPolishPortuguesePuebloPuerto RicanRomanianRussianSalvadoranSamoanScandinavianScotch-IrishScottishSeminoleSerbianSierra LeoneanSiouxSlavicSlovakSloveneSomaliSouth AfricanSouth AmericanSouth American IndianSpaniardSpanishSri LankanSubsaharan AfricanSudaneseSwedishSwissSyrianThaiTrinidadian and TobagonianTurkishU.S. Virgin IslanderUgandanUkrainianUruguayanVenezuelanVietnameseWelshWest IndianYaquiYugoslavianZimbabwean
Immigrant Origin (Total)
AfghanistanAfricaAlbaniaArgentinaAsiaAustraliaAustriaBangladeshBarbadosBelarusBelgiumBelizeBosnia and HerzegovinaBrazilBulgariaBurma / MyanmarCambodiaCanadaCaribbeanCentral AmericaChileChinaColombiaCongoCosta RicaCroatiaCubaCzechoslovakiaDominican RepublicEastern AfricaEastern AsiaEastern EuropeEcuadorEgyptEl SalvadorEnglandEthiopiaEuropeFranceGermanyGhanaGreeceGuatemalaGuyanaHaitiHondurasHong KongHungaryIndiaIndonesiaIranIraqIrelandIsraelItalyJamaicaJapanJordanKazakhstanKenyaKoreaKuwaitLaosLatin AmericaLatviaLebanonLiberiaLithuaniaMalaysiaMexicoMiddle AfricaMoldovaMoroccoNepalNetherlandsNicaraguaNigeriaNorthern AfricaNorthern EuropeOceaniaPakistanPanamaPeruPhilippinesPolandRomaniaRussiaSaudi ArabiaScotlandSerbiaSierra LeoneSingaporeSomaliaSouth AfricaSouth AmericaSouth Central AsiaSouth Eastern AsiaSouthern EuropeSpainSri LankaSudanSwedenSyriaTaiwanThailandTrinidad and TobagoTurkeyUgandaUkraineUruguayUzbekistanVenezuelaVietnamWest IndiesWestern AfricaWestern AsiaWestern EuropeZaireZimbabwe
Immigrant Origin (Percentage)
AfghanistanAfricaAlbaniaArgentinaAsiaAustraliaAustriaBangladeshBarbadosBelarusBelgiumBelizeBosnia and HerzegovinaBrazilBulgariaBurma / MyanmarCambodiaCanadaCaribbeanCentral AmericaChileChinaColombiaCongoCosta RicaCroatiaCubaCzechoslovakiaDominican RepublicEastern AfricaEastern AsiaEastern EuropeEcuadorEgyptEl SalvadorEnglandEthiopiaEuropeFranceGermanyGhanaGreeceGuatemalaGuyanaHaitiHondurasHong KongHungaryIndiaIndonesiaIranIraqIrelandIsraelItalyJamaicaJapanJordanKazakhstanKenyaKoreaKuwaitLaosLatin AmericaLatviaLebanonLiberiaLithuaniaMalaysiaMexicoMiddle AfricaMoldovaMoroccoNepalNetherlandsNicaraguaNigeriaNorthern AfricaNorthern EuropeOceaniaPakistanPanamaPeruPhilippinesPolandRomaniaRussiaSaudi ArabiaScotlandSerbiaSierra LeoneSingaporeSomaliaSouth AfricaSouth AmericaSouth Central AsiaSouth Eastern AsiaSouthern EuropeSpainSri LankaSudanSwedenSyriaTaiwanThailandTrinidad and TobagoTurkeyUgandaUkraineUruguayUzbekistanVenezuelaVietnamWest IndiesWestern AfricaWestern AsiaWestern EuropeZaireZimbabwe
Income
Income (Families)
Income (Households)
Poverty
Poverty (Families)
Unemployment
Employment Occupations
Employment Industries
Employer Class
Commute Time
Commute Means
School Enrollment
Education by Degree Field
Occupancy
Finances
Physical Characteristics
Cleveland
Compare Zip Codes
Comparison Subject

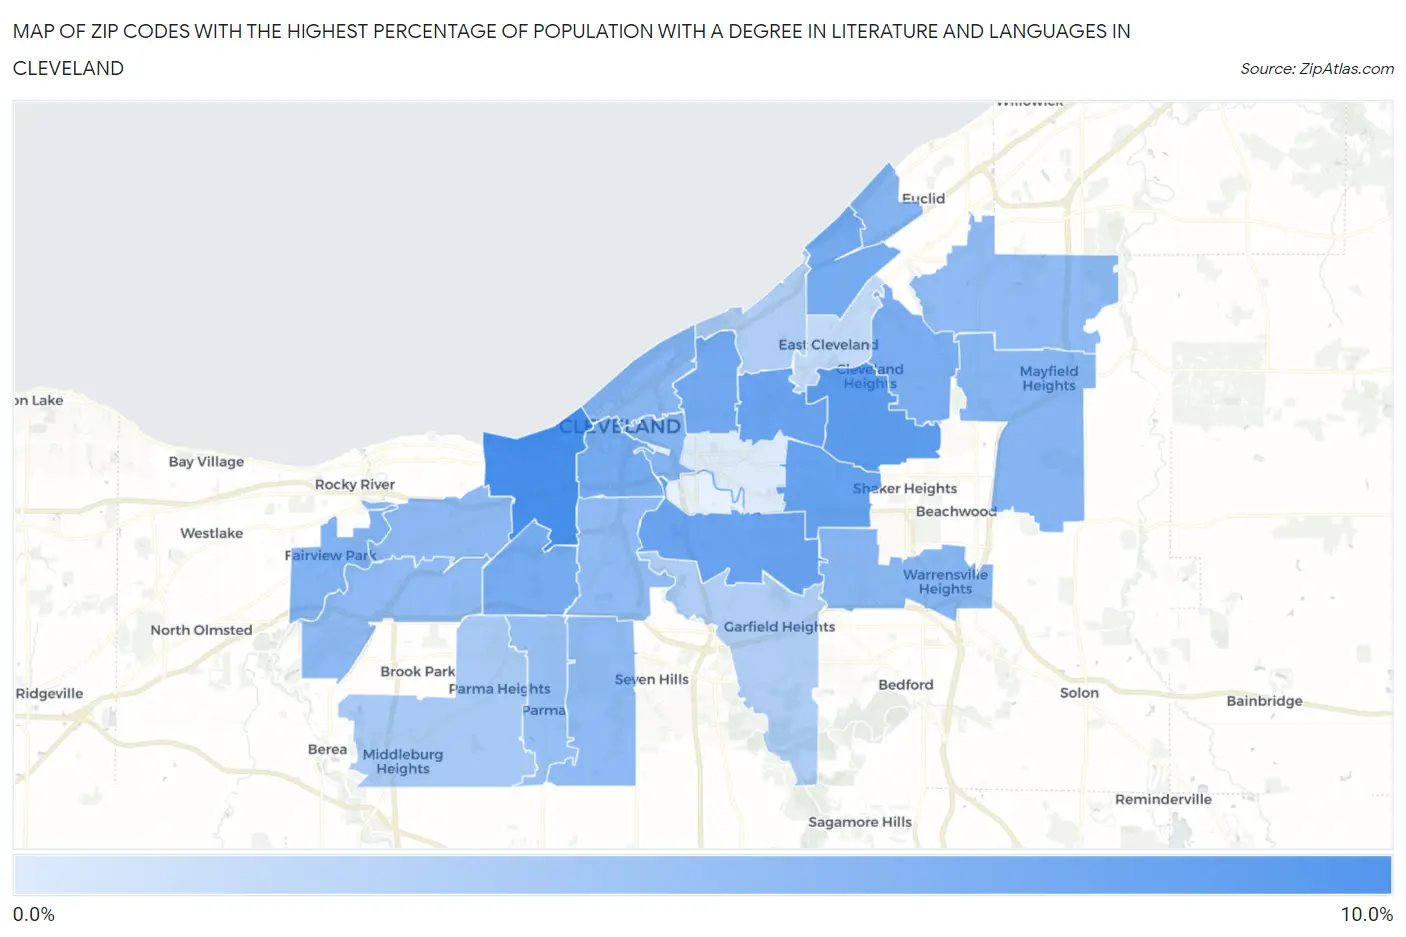
Map of Zip Codes with the Highest Percentage of Population with a Degree in Literature and Languages in Cleveland

0.0%
10.0%
Zip Codes with the Highest Percentage of Population with a Degree in Literature and Languages in Cleveland Map

Zip Codes with the Highest Percentage of Population with a Degree in Literature and Languages in Cleveland, OH

Zip Code % Graduates vs State vs National
1.441028.3%3.7%(+4.62)#654.4%(+3.88)#2,754
2.441187.2%3.7%(+3.55)#884.4%(+2.81)#3,731
3.441206.6%3.7%(+2.95)#1104.4%(+2.22)#4,465
4.441056.5%3.7%(+2.84)#1184.4%(+2.10)#4,623
5.441066.5%3.7%(+2.83)#1194.4%(+2.09)#4,632
6.441036.0%3.7%(+2.36)#1414.4%(+1.63)#5,364
7.441445.7%3.7%(+2.05)#1554.4%(+1.32)#5,890
8.441105.7%3.7%(+2.04)#1564.4%(+1.31)#5,899
9.441135.7%3.7%(+2.04)#1584.4%(+1.30)#5,923
10.441215.5%3.7%(+1.83)#1764.4%(+1.09)#6,311
11.441265.2%3.7%(+1.48)#2014.4%(+0.744)#7,039
12.441195.0%3.7%(+1.35)#2084.4%(+0.619)#7,286
13.441155.0%3.7%(+1.32)#2114.4%(+0.585)#7,370
14.441244.9%3.7%(+1.21)#2174.4%(+0.476)#7,660
15.441284.8%3.7%(+1.15)#2224.4%(+0.412)#7,832
16.441144.7%3.7%(+1.05)#2314.4%(+0.318)#8,092
17.441114.6%3.7%(+0.904)#2454.4%(+0.171)#8,488
18.441354.4%3.7%(+0.710)#2594.4%(-0.024)#9,035
19.441344.4%3.7%(+0.681)#2654.4%(-0.053)#9,126
20.441434.3%3.7%(+0.668)#2674.4%(-0.065)#9,174
21.441094.3%3.7%(+0.664)#2684.4%(-0.069)#9,177
22.441293.9%3.7%(+0.194)#3074.4%(-0.539)#10,594
23.441303.0%3.7%(-0.654)#4224.4%(-1.39)#13,506
24.441082.7%3.7%(-0.972)#4714.4%(-1.71)#14,594
25.441252.6%3.7%(-1.04)#4824.4%(-1.78)#14,820
26.441121.8%3.7%(-1.91)#6094.4%(-2.64)#17,810
27.441040.29%3.7%(-3.38)#7594.4%(-4.12)#21,541

Common Questions

What are the Top 10 Zip Codes with the Highest Percentage of Population with a Degree in Literature and Languages in Cleveland, OH?
Top 10 Zip Codes with the Highest Percentage of Population with a Degree in Literature and Languages in Cleveland, OH are:
#1
8.3%
#2
7.2%
#3
6.6%
#4
6.5%
#5
6.5%
#6
6.0%
#7
5.7%
#8
5.7%
#9
5.7%
#10
5.5%
What zip code has the Highest Percentage of Population with a Degree in Literature and Languages in Cleveland, OH?
44102 has the Highest Percentage of Population with a Degree in Literature and Languages in Cleveland, OH with 8.3%.
What is the Percentage of Population with a Degree in Literature and Languages in Cleveland, OH?
Percentage of Population with a Degree in Literature and Languages in Cleveland is 5.3%.
What is the Percentage of Population with a Degree in Literature and Languages in Ohio?
Percentage of Population with a Degree in Literature and Languages in Ohio is 3.7%.
What is the Percentage of Population with a Degree in Literature and Languages in the United States?
Percentage of Population with a Degree in Literature and Languages in the United States is 4.4%.