Cities with the Most Immigrants from Western Africa in Ohio
RELATED REPORTS & OPTIONS
Western Africa
Ohio
Compare Cities
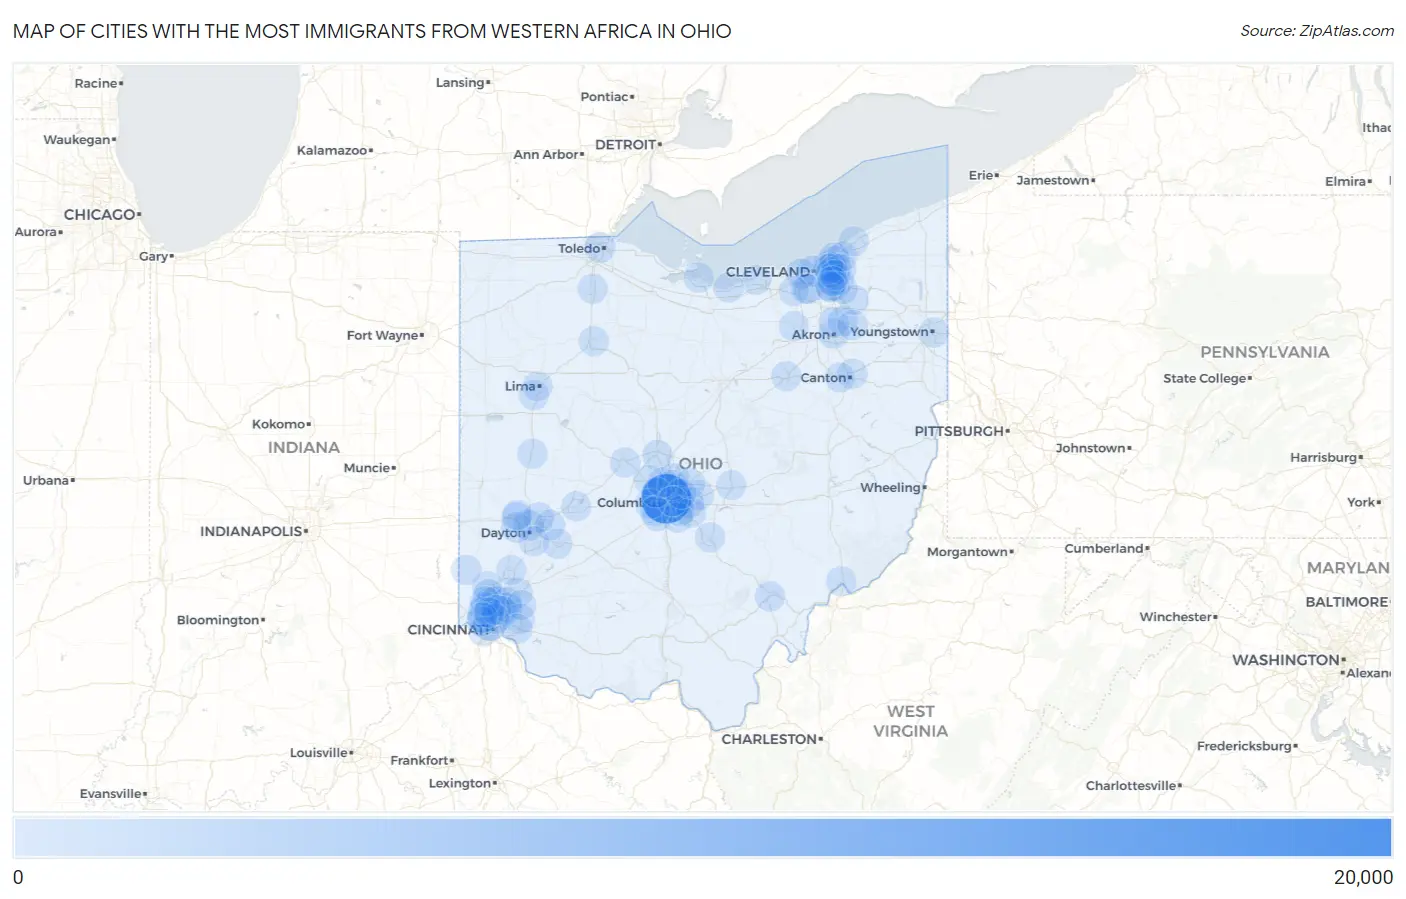
Map of Cities with the Most Immigrants from Western Africa in Ohio
0
20,000
Cities with the Most Immigrants from Western Africa in Ohio
| City | Western Africa | vs State | vs National | |
| 1. | Columbus | 15,109 | 33,560(45.02%)#1 | 985,560(1.53%)#4 |
| 2. | Cincinnati | 2,717 | 33,560(8.10%)#2 | 985,560(0.28%)#34 |
| 3. | Cleveland | 981 | 33,560(2.92%)#3 | 985,560(0.10%)#138 |
| 4. | Westerville | 755 | 33,560(2.25%)#4 | 985,560(0.08%)#171 |
| 5. | Fairfield | 744 | 33,560(2.22%)#5 | 985,560(0.08%)#176 |
| 6. | Forest Park | 634 | 33,560(1.89%)#6 | 985,560(0.06%)#224 |
| 7. | Dayton | 495 | 33,560(1.47%)#7 | 985,560(0.05%)#289 |
| 8. | Springdale | 482 | 33,560(1.44%)#8 | 985,560(0.05%)#298 |
| 9. | Toledo | 480 | 33,560(1.43%)#9 | 985,560(0.05%)#300 |
| 10. | Reynoldsburg | 418 | 33,560(1.25%)#10 | 985,560(0.04%)#335 |
| 11. | Whitehall | 392 | 33,560(1.17%)#11 | 985,560(0.04%)#362 |
| 12. | Huber Heights | 293 | 33,560(0.87%)#12 | 985,560(0.03%)#471 |
| 13. | Trotwood | 286 | 33,560(0.85%)#13 | 985,560(0.03%)#485 |
| 14. | Akron | 266 | 33,560(0.79%)#14 | 985,560(0.03%)#521 |
| 15. | Lakewood | 250 | 33,560(0.74%)#15 | 985,560(0.03%)#553 |
| 16. | Solon | 240 | 33,560(0.72%)#16 | 985,560(0.02%)#573 |
| 17. | East Cleveland | 237 | 33,560(0.71%)#17 | 985,560(0.02%)#579 |
| 18. | Cuyahoga Falls | 223 | 33,560(0.66%)#18 | 985,560(0.02%)#599 |
| 19. | Richmond Heights | 207 | 33,560(0.62%)#19 | 985,560(0.02%)#631 |
| 20. | Delaware | 177 | 33,560(0.53%)#20 | 985,560(0.02%)#721 |
| 21. | Euclid | 169 | 33,560(0.50%)#21 | 985,560(0.02%)#746 |
| 22. | White Oak | 155 | 33,560(0.46%)#22 | 985,560(0.02%)#811 |
| 23. | Pataskala | 155 | 33,560(0.46%)#23 | 985,560(0.02%)#812 |
| 24. | Sharonville | 150 | 33,560(0.45%)#24 | 985,560(0.02%)#832 |
| 25. | Warrensville Heights | 148 | 33,560(0.44%)#25 | 985,560(0.02%)#837 |
| 26. | Lockland | 148 | 33,560(0.44%)#26 | 985,560(0.02%)#840 |
| 27. | Groveport | 144 | 33,560(0.43%)#27 | 985,560(0.01%)#855 |
| 28. | Athens | 139 | 33,560(0.41%)#28 | 985,560(0.01%)#877 |
| 29. | Fairborn | 133 | 33,560(0.40%)#29 | 985,560(0.01%)#909 |
| 30. | Mason | 120 | 33,560(0.36%)#30 | 985,560(0.01%)#970 |
| 31. | Findlay | 117 | 33,560(0.35%)#31 | 985,560(0.01%)#986 |
| 32. | Northbrook | 112 | 33,560(0.33%)#32 | 985,560(0.01%)#1,022 |
| 33. | Shaker Heights | 111 | 33,560(0.33%)#33 | 985,560(0.01%)#1,025 |
| 34. | Dublin | 108 | 33,560(0.32%)#34 | 985,560(0.01%)#1,038 |
| 35. | Fort Shawnee | 100 | 33,560(0.30%)#35 | 985,560(0.01%)#1,087 |
| 36. | Orange | 100 | 33,560(0.30%)#36 | 985,560(0.01%)#1,088 |
| 37. | Delshire | 99 | 33,560(0.29%)#37 | 985,560(0.01%)#1,095 |
| 38. | Blue Ash | 88 | 33,560(0.26%)#38 | 985,560(0.01%)#1,183 |
| 39. | Reading | 88 | 33,560(0.26%)#39 | 985,560(0.01%)#1,184 |
| 40. | Lyndhurst | 87 | 33,560(0.26%)#40 | 985,560(0.01%)#1,197 |
| 41. | Hamilton | 85 | 33,560(0.25%)#41 | 985,560(0.01%)#1,211 |
| 42. | Parma | 78 | 33,560(0.23%)#42 | 985,560(0.01%)#1,274 |
| 43. | Minerva Park | 78 | 33,560(0.23%)#43 | 985,560(0.01%)#1,286 |
| 44. | Canton | 77 | 33,560(0.23%)#44 | 985,560(0.01%)#1,289 |
| 45. | Mayfield Heights | 76 | 33,560(0.23%)#45 | 985,560(0.01%)#1,300 |
| 46. | Parma Heights | 72 | 33,560(0.21%)#46 | 985,560(0.01%)#1,337 |
| 47. | Oxford | 69 | 33,560(0.21%)#47 | 985,560(0.01%)#1,376 |
| 48. | Springfield | 67 | 33,560(0.20%)#48 | 985,560(0.01%)#1,397 |
| 49. | Pickerington | 63 | 33,560(0.19%)#49 | 985,560(0.01%)#1,452 |
| 50. | South Euclid | 62 | 33,560(0.18%)#50 | 985,560(0.01%)#1,469 |
| 51. | Grove City | 61 | 33,560(0.18%)#51 | 985,560(0.01%)#1,481 |
| 52. | St Bernard | 60 | 33,560(0.18%)#52 | 985,560(0.01%)#1,504 |
| 53. | Kettering | 58 | 33,560(0.17%)#53 | 985,560(0.01%)#1,520 |
| 54. | Middletown | 57 | 33,560(0.17%)#54 | 985,560(0.01%)#1,535 |
| 55. | Xenia | 57 | 33,560(0.17%)#55 | 985,560(0.01%)#1,539 |
| 56. | Lima | 56 | 33,560(0.17%)#56 | 985,560(0.01%)#1,546 |
| 57. | Sidney | 55 | 33,560(0.16%)#57 | 985,560(0.01%)#1,566 |
| 58. | Englewood | 55 | 33,560(0.16%)#58 | 985,560(0.01%)#1,571 |
| 59. | Newark | 54 | 33,560(0.16%)#59 | 985,560(0.01%)#1,578 |
| 60. | Bowling Green | 52 | 33,560(0.15%)#60 | 985,560(0.01%)#1,607 |
| 61. | Lincoln Village | 49 | 33,560(0.15%)#61 | 985,560(0.00%)#1,665 |
| 62. | Upper Arlington | 47 | 33,560(0.14%)#62 | 985,560(0.00%)#1,693 |
| 63. | Blacklick Estates | 46 | 33,560(0.14%)#63 | 985,560(0.00%)#1,712 |
| 64. | Youngstown | 45 | 33,560(0.13%)#64 | 985,560(0.00%)#1,723 |
| 65. | Lancaster | 45 | 33,560(0.13%)#65 | 985,560(0.00%)#1,725 |
| 66. | Sandusky | 45 | 33,560(0.13%)#66 | 985,560(0.00%)#1,727 |
| 67. | Milford | 45 | 33,560(0.13%)#67 | 985,560(0.00%)#1,736 |
| 68. | Marysville | 44 | 33,560(0.13%)#68 | 985,560(0.00%)#1,745 |
| 69. | Bedford Heights | 44 | 33,560(0.13%)#69 | 985,560(0.00%)#1,754 |
| 70. | Bedford | 43 | 33,560(0.13%)#70 | 985,560(0.00%)#1,771 |
| 71. | Stow | 42 | 33,560(0.13%)#71 | 985,560(0.00%)#1,785 |
| 72. | University Heights | 41 | 33,560(0.12%)#72 | 985,560(0.00%)#1,823 |
| 73. | Cheviot | 40 | 33,560(0.12%)#73 | 985,560(0.00%)#1,852 |
| 74. | Kent | 39 | 33,560(0.12%)#74 | 985,560(0.00%)#1,866 |
| 75. | Marietta | 39 | 33,560(0.12%)#75 | 985,560(0.00%)#1,869 |
| 76. | Medina | 37 | 33,560(0.11%)#76 | 985,560(0.00%)#1,906 |
| 77. | Wyoming | 37 | 33,560(0.11%)#77 | 985,560(0.00%)#1,916 |
| 78. | Cleveland Heights | 36 | 33,560(0.11%)#78 | 985,560(0.00%)#1,930 |
| 79. | Gahanna | 34 | 33,560(0.10%)#79 | 985,560(0.00%)#1,964 |
| 80. | Pleasant Run | 34 | 33,560(0.10%)#80 | 985,560(0.00%)#1,978 |
| 81. | Urbancrest | 34 | 33,560(0.10%)#81 | 985,560(0.00%)#1,982 |
| 82. | Perry Heights | 33 | 33,560(0.10%)#82 | 985,560(0.00%)#1,995 |
| 83. | Berea | 32 | 33,560(0.10%)#83 | 985,560(0.00%)#2,018 |
| 84. | Beachwood | 32 | 33,560(0.10%)#84 | 985,560(0.00%)#2,022 |
| 85. | Willoughby Hills | 32 | 33,560(0.10%)#85 | 985,560(0.00%)#2,027 |
| 86. | Maple Heights | 30 | 33,560(0.09%)#86 | 985,560(0.00%)#2,072 |
| 87. | Aurora | 30 | 33,560(0.09%)#87 | 985,560(0.00%)#2,074 |
| 88. | New Albany | 29 | 33,560(0.09%)#88 | 985,560(0.00%)#2,106 |
| 89. | Wooster | 28 | 33,560(0.08%)#89 | 985,560(0.00%)#2,123 |
| 90. | Worthington | 28 | 33,560(0.08%)#90 | 985,560(0.00%)#2,126 |
| 91. | Monfort Heights | 28 | 33,560(0.08%)#91 | 985,560(0.00%)#2,130 |
| 92. | Lorain | 27 | 33,560(0.08%)#92 | 985,560(0.00%)#2,138 |
| 93. | Loveland | 27 | 33,560(0.08%)#93 | 985,560(0.00%)#2,150 |
| 94. | Mentor | 26 | 33,560(0.08%)#94 | 985,560(0.00%)#2,166 |
| 95. | North Randall | 25 | 33,560(0.07%)#95 | 985,560(0.00%)#2,224 |
| 96. | North College Hill | 24 | 33,560(0.07%)#96 | 985,560(0.00%)#2,239 |
| 97. | Mount Carmel | 24 | 33,560(0.07%)#97 | 985,560(0.00%)#2,248 |
| 98. | Beulah Beach | 24 | 33,560(0.07%)#98 | 985,560(0.00%)#2,254 |
| 99. | Bexley | 23 | 33,560(0.07%)#99 | 985,560(0.00%)#2,268 |
| 100. | Clayton | 23 | 33,560(0.07%)#100 | 985,560(0.00%)#2,269 |
Common Questions
What are the Top 10 Cities with the Most Immigrants from Western Africa in Ohio?
Top 10 Cities with the Most Immigrants from Western Africa in Ohio are:
#1
15,109
#2
2,717
#3
981
#4
755
#5
744
#6
634
#7
495
#8
482
#9
480
#10
418
What city has the Most Immigrants from Western Africa in Ohio?
Columbus has the Most Immigrants from Western Africa in Ohio with 15,109.
What is the Total Immigrants from Western Africa in the State of Ohio?
Total Immigrants from Western Africa in Ohio is 33,560.
What is the Total Immigrants from Western Africa in the United States?
Total Immigrants from Western Africa in the United States is 985,560.