Etna, OH Map & Demographics
Etna Map
Etna Overview
$40,790
PER CAPITA INCOME
$115,976
AVG FAMILY INCOME
$115,579
AVG HOUSEHOLD INCOME
25.1%
WAGE / INCOME GAP [ % ]
74.9¢/ $1
WAGE / INCOME GAP [ $ ]
0.26
INEQUALITY / GINI INDEX
958
TOTAL POPULATION
457
MALE POPULATION
501
FEMALE POPULATION
91.22
MALES / 100 FEMALES
109.63
FEMALES / 100 MALES
39.5
MEDIAN AGE
3.7
AVG FAMILY SIZE
3.2
AVG HOUSEHOLD SIZE
537
LABOR FORCE [ PEOPLE ]
84.4%
PERCENT IN LABOR FORCE
2.6%
UNEMPLOYMENT RATE
Etna Zip Codes
Income in Etna
Income Overview in Etna
Per Capita Income in Etna is $40,790, while median incomes of families and households are $115,976 and $115,579 respectively.
| Characteristic | Number | Measure |
| Per Capita Income | 958 | $40,790 |
| Median Family Income | 236 | $115,976 |
| Mean Family Income | 236 | $129,330 |
| Median Household Income | 298 | $115,579 |
| Mean Household Income | 298 | $123,498 |
| Income Deficit | 236 | $0 |
| Wage / Income Gap (%) | 958 | 25.06% |
| Wage / Income Gap ($) | 958 | 74.94¢ per $1 |
| Gini / Inequality Index | 958 | 0.26 |
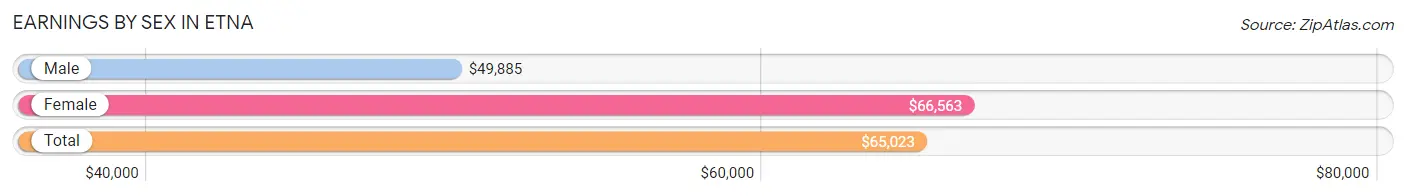
Earnings by Sex in Etna
Average Earnings in Etna are $65,023, $49,885 for men and $66,563 for women, a difference of 25.1%.
| Sex | Number | Average Earnings |
| Male | 310 (57.7%) | $49,885 |
| Female | 227 (42.3%) | $66,563 |
| Total | 537 (100.0%) | $65,023 |
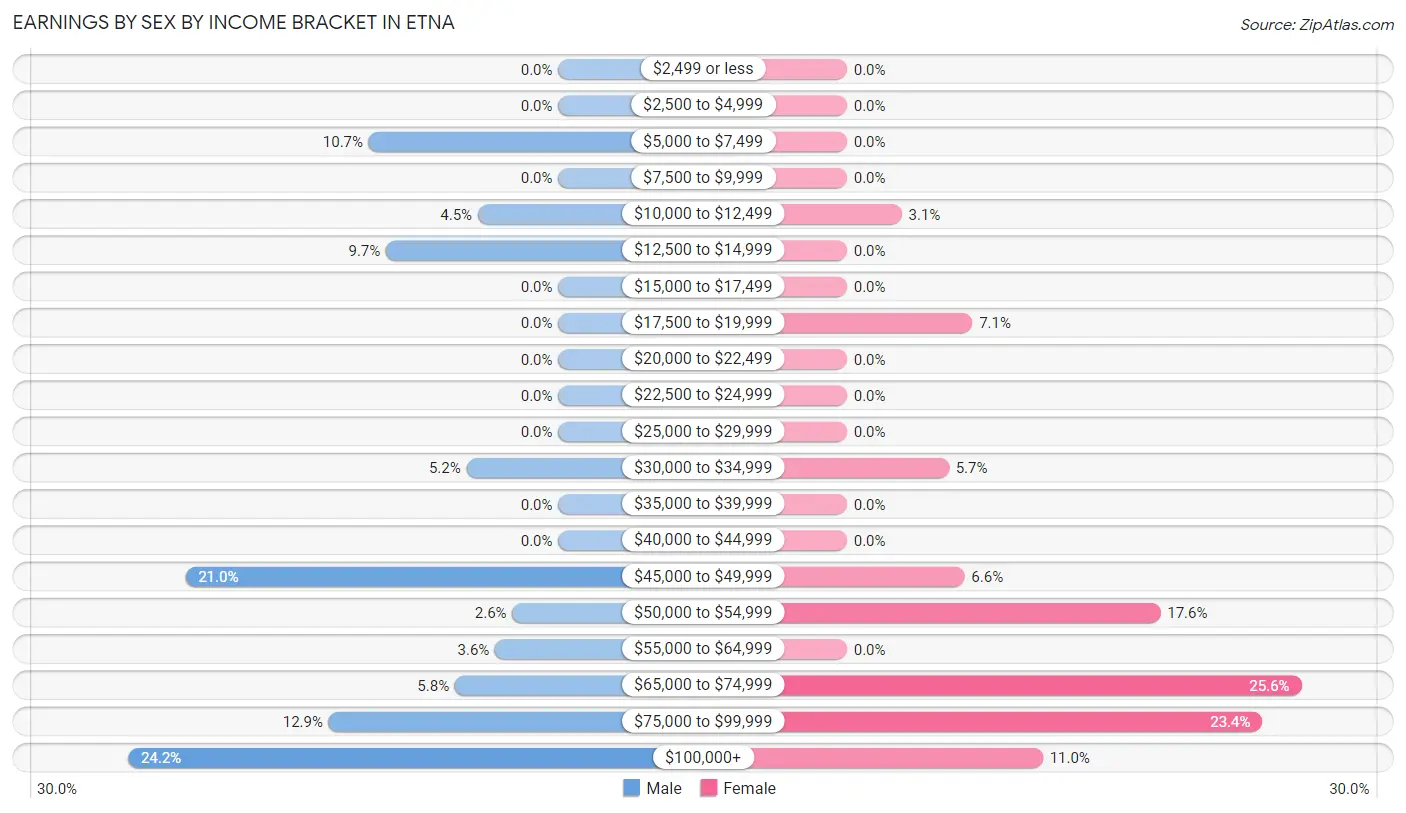
Earnings by Sex by Income Bracket in Etna
The most common earnings brackets in Etna are $100,000+ for men (75 | 24.2%) and $65,000 to $74,999 for women (58 | 25.6%).
| Income | Male | Female |
| $2,499 or less | 0 (0.0%) | 0 (0.0%) |
| $2,500 to $4,999 | 0 (0.0%) | 0 (0.0%) |
| $5,000 to $7,499 | 33 (10.6%) | 0 (0.0%) |
| $7,500 to $9,999 | 0 (0.0%) | 0 (0.0%) |
| $10,000 to $12,499 | 14 (4.5%) | 7 (3.1%) |
| $12,500 to $14,999 | 30 (9.7%) | 0 (0.0%) |
| $15,000 to $17,499 | 0 (0.0%) | 0 (0.0%) |
| $17,500 to $19,999 | 0 (0.0%) | 16 (7.0%) |
| $20,000 to $22,499 | 0 (0.0%) | 0 (0.0%) |
| $22,500 to $24,999 | 0 (0.0%) | 0 (0.0%) |
| $25,000 to $29,999 | 0 (0.0%) | 0 (0.0%) |
| $30,000 to $34,999 | 16 (5.2%) | 13 (5.7%) |
| $35,000 to $39,999 | 0 (0.0%) | 0 (0.0%) |
| $40,000 to $44,999 | 0 (0.0%) | 0 (0.0%) |
| $45,000 to $49,999 | 65 (21.0%) | 15 (6.6%) |
| $50,000 to $54,999 | 8 (2.6%) | 40 (17.6%) |
| $55,000 to $64,999 | 11 (3.5%) | 0 (0.0%) |
| $65,000 to $74,999 | 18 (5.8%) | 58 (25.6%) |
| $75,000 to $99,999 | 40 (12.9%) | 53 (23.4%) |
| $100,000+ | 75 (24.2%) | 25 (11.0%) |
| Total | 310 (100.0%) | 227 (100.0%) |
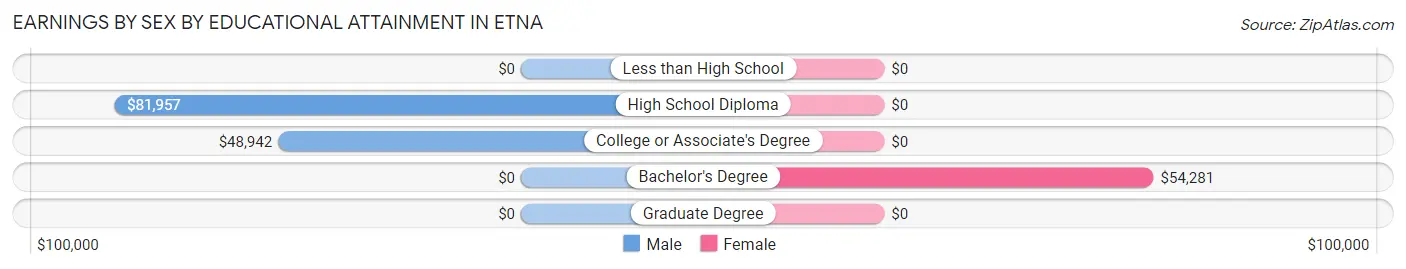
Earnings by Sex by Educational Attainment in Etna
Average earnings in Etna are $61,250 for men and $66,806 for women, a difference of 8.3%. Men with an educational attainment of high school diploma enjoy the highest average annual earnings of $81,957, while those with college or associate's degree education earn the least with $48,942. Women with an educational attainment of bachelor's degree earn the most with the average annual earnings of $54,281, while those with bachelor's degree education have the smallest earnings of $54,281.
| Educational Attainment | Male Income | Female Income |
| Less than High School | - | - |
| High School Diploma | $81,957 | $0 |
| College or Associate's Degree | $48,942 | $0 |
| Bachelor's Degree | - | - |
| Graduate Degree | - | - |
| Total | $61,250 | $66,806 |
Family Income in Etna
Family Income Brackets in Etna
According to the Etna family income data, there are 119 families falling into the $100,000 to $149,999 income range, which is the most common income bracket and makes up 50.4% of all families.
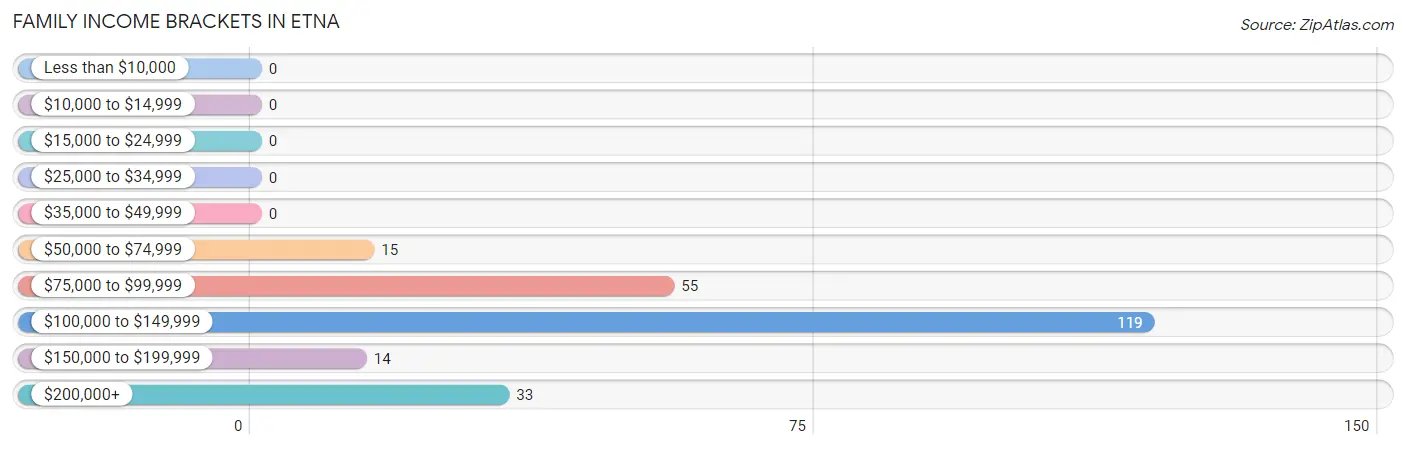
| Income Bracket | # Families | % Families |
| Less than $10,000 | 0 | 0.0% |
| $10,000 to $14,999 | 0 | 0.0% |
| $15,000 to $24,999 | 0 | 0.0% |
| $25,000 to $34,999 | 0 | 0.0% |
| $35,000 to $49,999 | 0 | 0.0% |
| $50,000 to $74,999 | 15 | 6.4% |
| $75,000 to $99,999 | 55 | 23.3% |
| $100,000 to $149,999 | 119 | 50.4% |
| $150,000 to $199,999 | 14 | 5.9% |
| $200,000+ | 33 | 14.0% |
Family Income by Famaliy Size in Etna
3-person families (132 | 55.9%) account for the highest median family income in Etna with $116,902 per family, while 3-person families (132 | 55.9%) have the highest median income of $38,967 per family member.
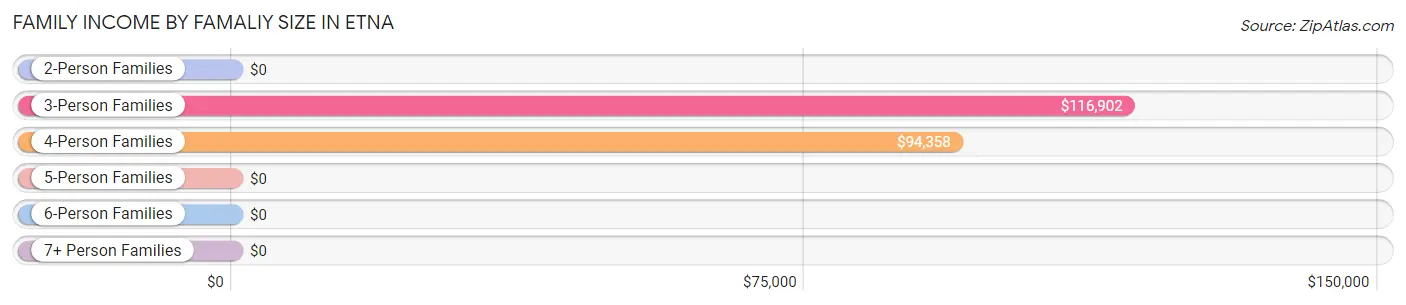
| Income Bracket | # Families | Median Income |
| 2-Person Families | 0 (0.0%) | $0 |
| 3-Person Families | 132 (55.9%) | $116,902 |
| 4-Person Families | 91 (38.6%) | $94,358 |
| 5-Person Families | 13 (5.5%) | $0 |
| 6-Person Families | 0 (0.0%) | $0 |
| 7+ Person Families | 0 (0.0%) | $0 |
| Total | 236 (100.0%) | $115,976 |
Family Income by Number of Earners in Etna
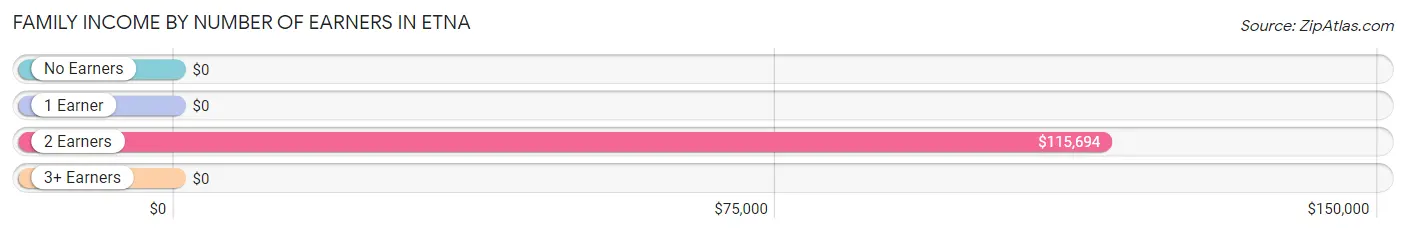
| Number of Earners | # Families | Median Income |
| No Earners | 0 (0.0%) | $0 |
| 1 Earner | 83 (35.2%) | $0 |
| 2 Earners | 118 (50.0%) | $115,694 |
| 3+ Earners | 35 (14.8%) | $0 |
| Total | 236 (100.0%) | $115,976 |
Household Income in Etna
Household Income Brackets in Etna
With 119 households falling in the category, the $100,000 to $149,999 income range is the most frequent in Etna, accounting for 39.9% of all households.
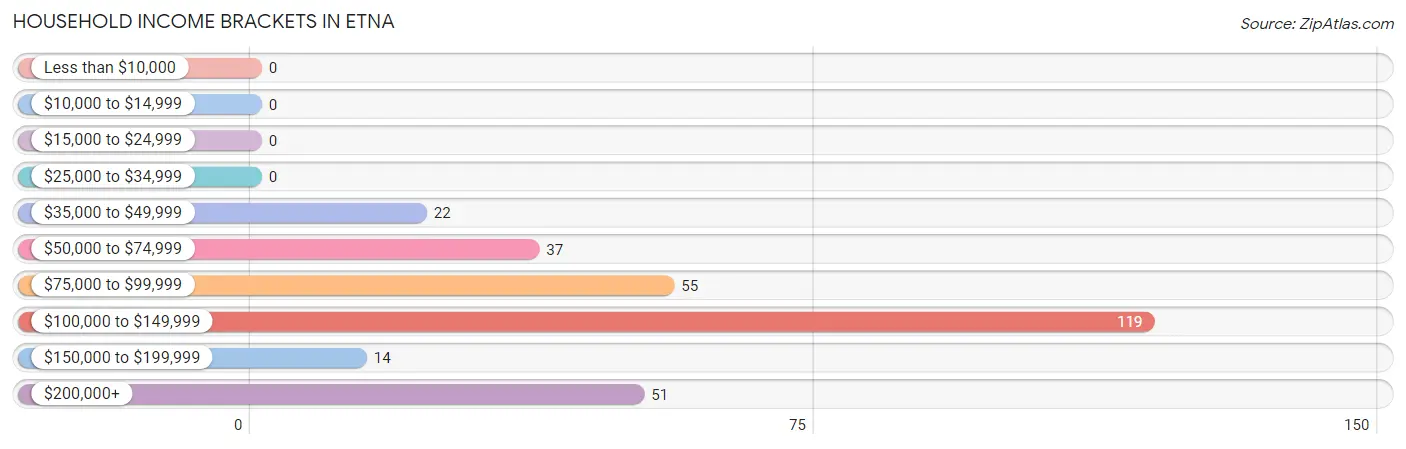
| Income Bracket | # Households | % Households |
| Less than $10,000 | 0 | 0.0% |
| $10,000 to $14,999 | 0 | 0.0% |
| $15,000 to $24,999 | 0 | 0.0% |
| $25,000 to $34,999 | 0 | 0.0% |
| $35,000 to $49,999 | 22 | 7.4% |
| $50,000 to $74,999 | 37 | 12.4% |
| $75,000 to $99,999 | 55 | 18.5% |
| $100,000 to $149,999 | 119 | 39.9% |
| $150,000 to $199,999 | 14 | 4.7% |
| $200,000+ | 51 | 17.1% |
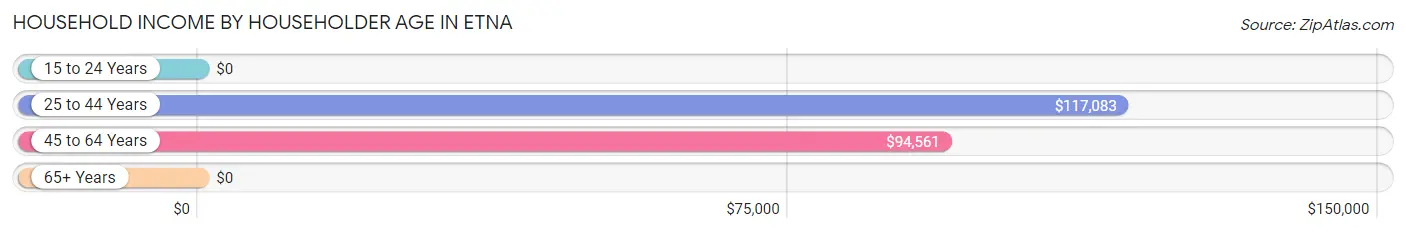
Household Income by Householder Age in Etna
The median household income in Etna is $115,579, with the highest median household income of $117,083 found in the 25 to 44 years age bracket for the primary householder. A total of 92 households (30.9%) fall into this category.
| Income Bracket | # Households | Median Income |
| 15 to 24 Years | 0 (0.0%) | $0 |
| 25 to 44 Years | 92 (30.9%) | $117,083 |
| 45 to 64 Years | 197 (66.1%) | $94,561 |
| 65+ Years | 9 (3.0%) | $0 |
| Total | 298 (100.0%) | $115,579 |
Poverty in Etna
Income Below Poverty by Sex and Age in Etna
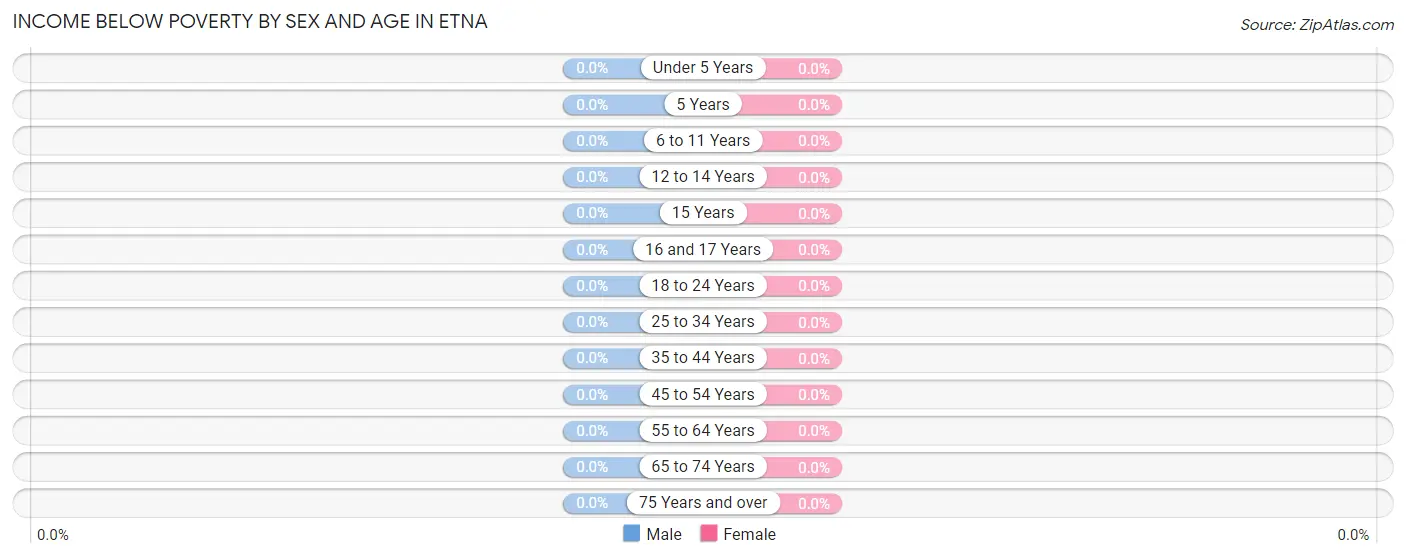
| Age Bracket | Male | Female |
| Under 5 Years | 0 (0.0%) | 0 (0.0%) |
| 5 Years | 0 (0.0%) | 0 (0.0%) |
| 6 to 11 Years | 0 (0.0%) | 0 (0.0%) |
| 12 to 14 Years | 0 (0.0%) | 0 (0.0%) |
| 15 Years | 0 (0.0%) | 0 (0.0%) |
| 16 and 17 Years | 0 (0.0%) | 0 (0.0%) |
| 18 to 24 Years | 0 (0.0%) | 0 (0.0%) |
| 25 to 34 Years | 0 (0.0%) | 0 (0.0%) |
| 35 to 44 Years | 0 (0.0%) | 0 (0.0%) |
| 45 to 54 Years | 0 (0.0%) | 0 (0.0%) |
| 55 to 64 Years | 0 (0.0%) | 0 (0.0%) |
| 65 to 74 Years | 0 (0.0%) | 0 (0.0%) |
| 75 Years and over | 0 (0.0%) | 0 (0.0%) |
| Total | 0 (0.0%) | 0 (0.0%) |
Income Above Poverty by Sex and Age in Etna
According to the poverty statistics in Etna, males aged under 5 years and females aged under 5 years are the age groups that are most secure financially, with 100.0% of males and 100.0% of females in these age groups living above the poverty line.
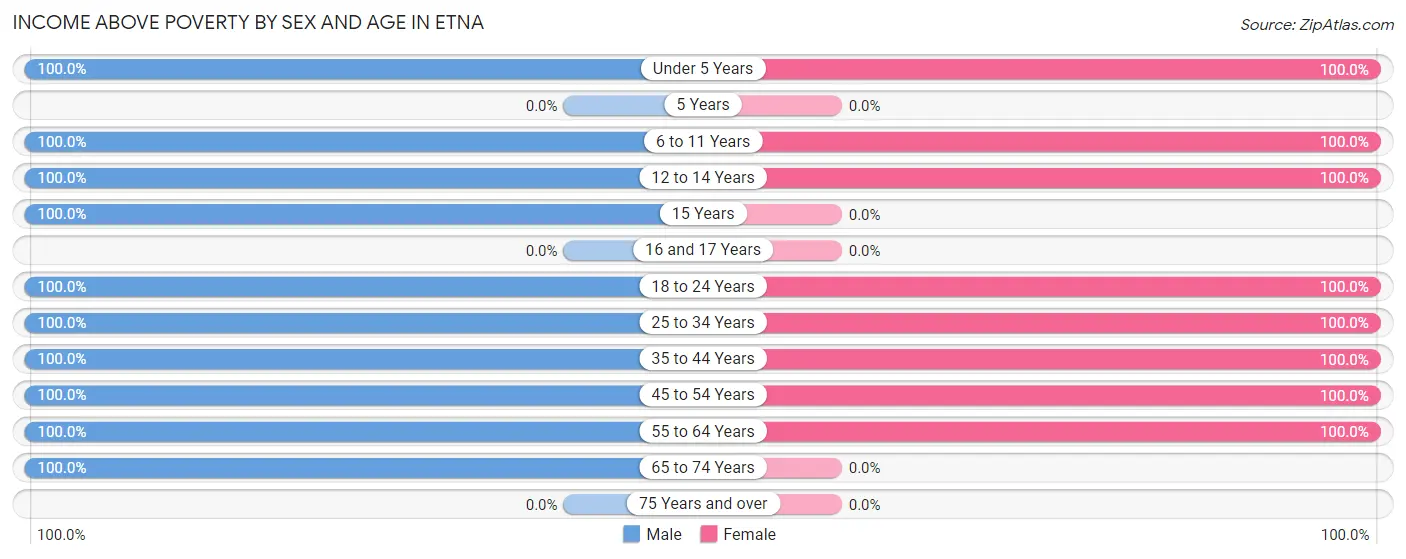
| Age Bracket | Male | Female |
| Under 5 Years | 58 (100.0%) | 140 (100.0%) |
| 5 Years | 0 (0.0%) | 0 (0.0%) |
| 6 to 11 Years | 19 (100.0%) | 16 (100.0%) |
| 12 to 14 Years | 9 (100.0%) | 65 (100.0%) |
| 15 Years | 15 (100.0%) | 0 (0.0%) |
| 16 and 17 Years | 0 (0.0%) | 0 (0.0%) |
| 18 to 24 Years | 44 (100.0%) | 7 (100.0%) |
| 25 to 34 Years | 69 (100.0%) | 18 (100.0%) |
| 35 to 44 Years | 61 (100.0%) | 81 (100.0%) |
| 45 to 54 Years | 149 (100.0%) | 161 (100.0%) |
| 55 to 64 Years | 24 (100.0%) | 13 (100.0%) |
| 65 to 74 Years | 9 (100.0%) | 0 (0.0%) |
| 75 Years and over | 0 (0.0%) | 0 (0.0%) |
| Total | 457 (100.0%) | 501 (100.0%) |
Income Below Poverty Among Married-Couple Families in Etna
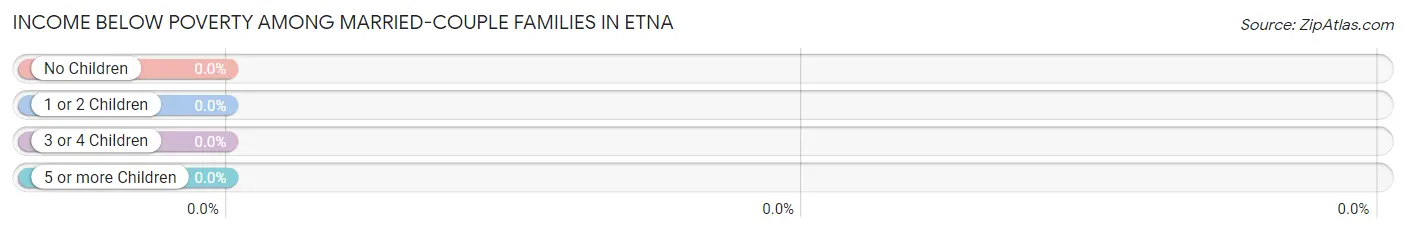
| Children | Above Poverty | Below Poverty |
| No Children | 33 (100.0%) | 0 (0.0%) |
| 1 or 2 Children | 188 (100.0%) | 0 (0.0%) |
| 3 or 4 Children | 0 (0.0%) | 0 (0.0%) |
| 5 or more Children | 0 (0.0%) | 0 (0.0%) |
| Total | 221 (100.0%) | 0 (0.0%) |
Income Below Poverty Among Single-Parent Households in Etna
| Children | Single Father | Single Mother |
| No Children | 0 (0.0%) | 0 (0.0%) |
| 1 or 2 Children | 0 (0.0%) | 0 (0.0%) |
| 3 or 4 Children | 0 (0.0%) | 0 (0.0%) |
| 5 or more Children | 0 (0.0%) | 0 (0.0%) |
| Total | 0 (0.0%) | 0 (0.0%) |
Income Below Poverty Among Married-Couple vs Single-Parent Households in Etna
| Children | Married-Couple Families | Single-Parent Households |
| No Children | 0 (0.0%) | 0 (0.0%) |
| 1 or 2 Children | 0 (0.0%) | 0 (0.0%) |
| 3 or 4 Children | 0 (0.0%) | 0 (0.0%) |
| 5 or more Children | 0 (0.0%) | 0 (0.0%) |
| Total | 0 (0.0%) | 0 (0.0%) |
Race in Etna
The most populous races in Etna are White / Caucasian (571 | 59.6%), Two or more Races (272 | 28.4%), and Hispanic or Latino (134 | 14.0%).
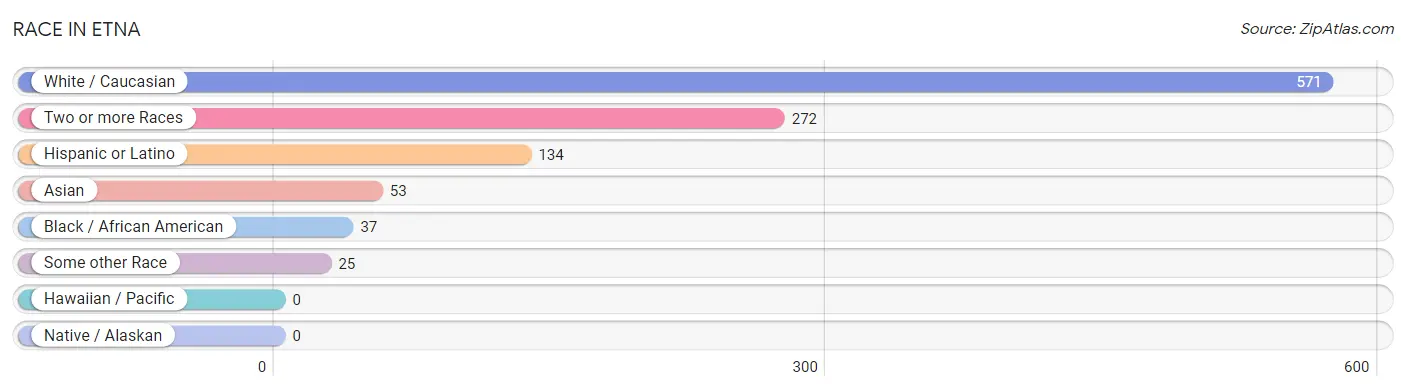
| Race | # Population | % Population |
| Asian | 53 | 5.5% |
| Black / African American | 37 | 3.9% |
| Hawaiian / Pacific | 0 | 0.0% |
| Hispanic or Latino | 134 | 14.0% |
| Native / Alaskan | 0 | 0.0% |
| White / Caucasian | 571 | 59.6% |
| Two or more Races | 272 | 28.4% |
| Some other Race | 25 | 2.6% |
| Total | 958 | 100.0% |
Ancestry in Etna
The most populous ancestries reported in Etna are German (232 | 24.2%), Irish (213 | 22.2%), English (210 | 21.9%), Mexican (134 | 14.0%), and Seminole (123 | 12.8%), together accounting for 95.2% of all Etna residents.
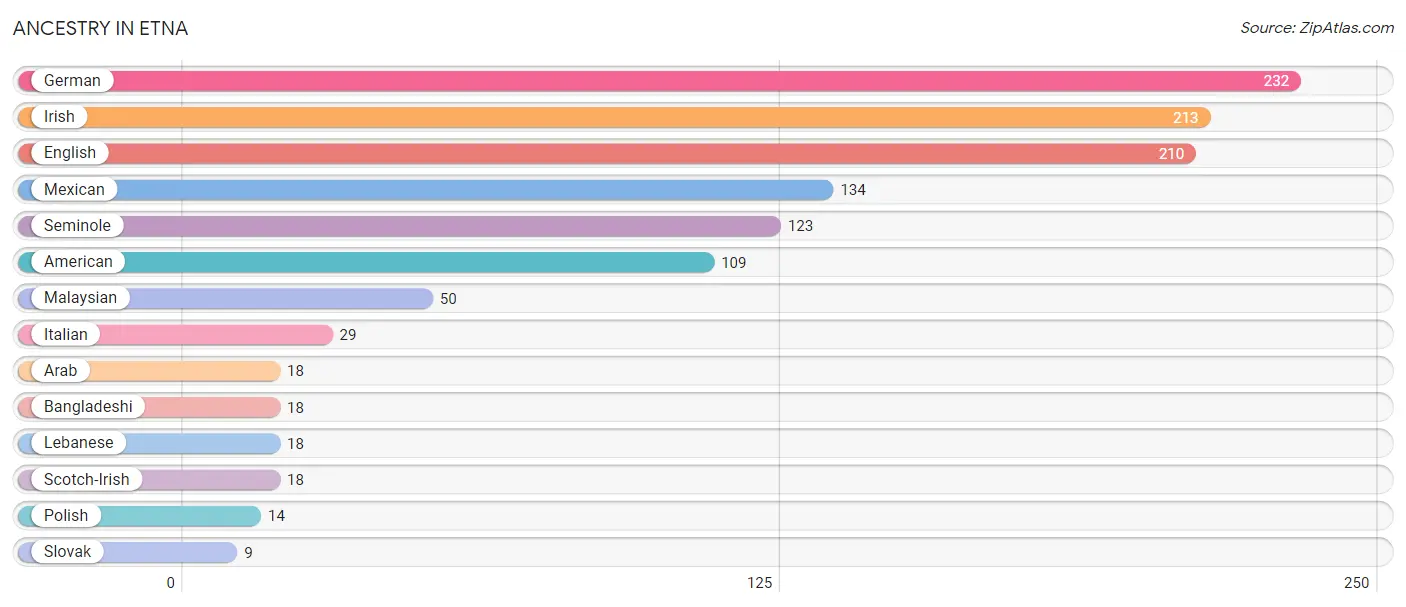
| Ancestry | # Population | % Population |
| American | 109 | 11.4% |
| Arab | 18 | 1.9% |
| Bangladeshi | 18 | 1.9% |
| English | 210 | 21.9% |
| German | 232 | 24.2% |
| Irish | 213 | 22.2% |
| Italian | 29 | 3.0% |
| Lebanese | 18 | 1.9% |
| Malaysian | 50 | 5.2% |
| Mexican | 134 | 14.0% |
| Polish | 14 | 1.5% |
| Scotch-Irish | 18 | 1.9% |
| Seminole | 123 | 12.8% |
| Slovak | 9 | 0.9% | View All 14 Rows |
Immigrants in Etna
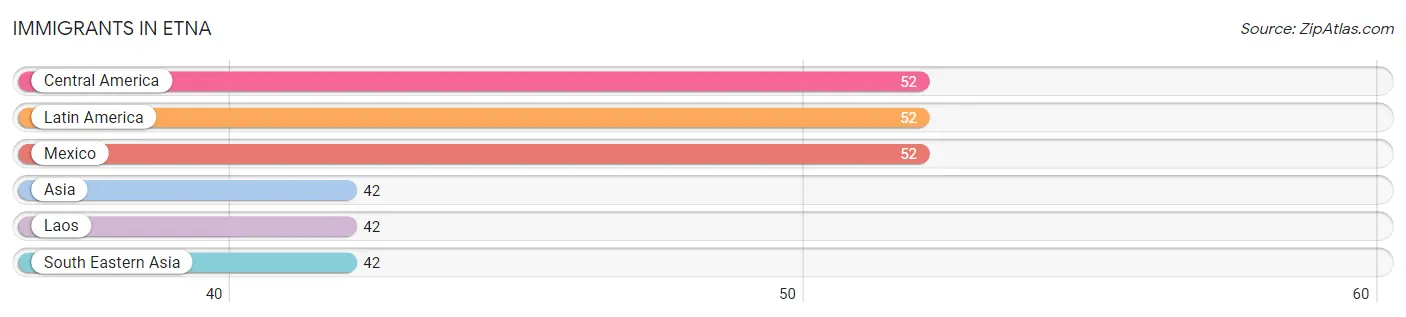
The most numerous immigrant groups reported in Etna came from Central America (52 | 5.4%), Latin America (52 | 5.4%), Mexico (52 | 5.4%), Asia (42 | 4.4%), and Laos (42 | 4.4%), together accounting for 25.1% of all Etna residents.
| Immigration Origin | # Population | % Population |
| Asia | 42 | 4.4% |
| Central America | 52 | 5.4% |
| Laos | 42 | 4.4% |
| Latin America | 52 | 5.4% |
| Mexico | 52 | 5.4% |
| South Eastern Asia | 42 | 4.4% | View All 6 Rows |
Sex and Age in Etna
Sex and Age in Etna
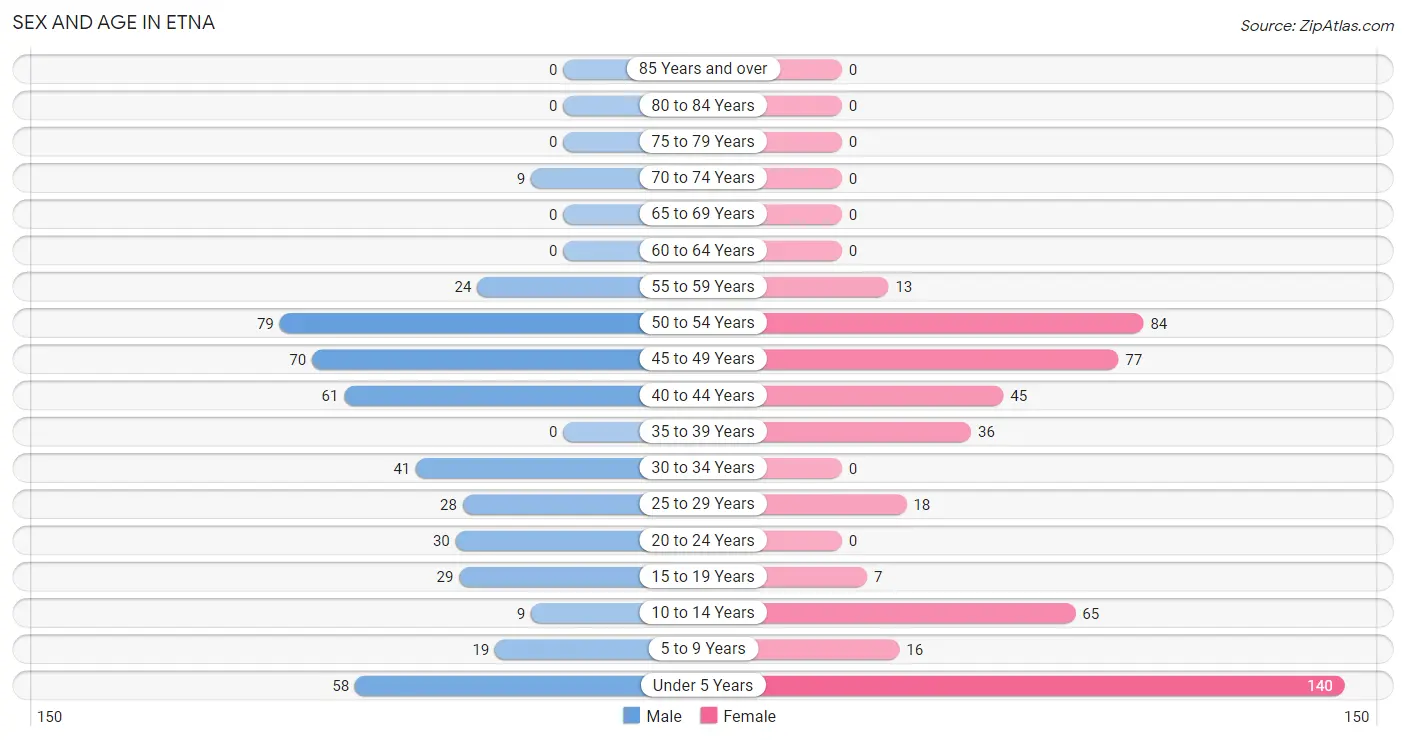
The most populous age groups in Etna are 50 to 54 Years (79 | 17.3%) for men and Under 5 Years (140 | 27.9%) for women.
| Age Bracket | Male | Female |
| Under 5 Years | 58 (12.7%) | 140 (27.9%) |
| 5 to 9 Years | 19 (4.2%) | 16 (3.2%) |
| 10 to 14 Years | 9 (2.0%) | 65 (13.0%) |
| 15 to 19 Years | 29 (6.4%) | 7 (1.4%) |
| 20 to 24 Years | 30 (6.6%) | 0 (0.0%) |
| 25 to 29 Years | 28 (6.1%) | 18 (3.6%) |
| 30 to 34 Years | 41 (9.0%) | 0 (0.0%) |
| 35 to 39 Years | 0 (0.0%) | 36 (7.2%) |
| 40 to 44 Years | 61 (13.4%) | 45 (9.0%) |
| 45 to 49 Years | 70 (15.3%) | 77 (15.4%) |
| 50 to 54 Years | 79 (17.3%) | 84 (16.8%) |
| 55 to 59 Years | 24 (5.2%) | 13 (2.6%) |
| 60 to 64 Years | 0 (0.0%) | 0 (0.0%) |
| 65 to 69 Years | 0 (0.0%) | 0 (0.0%) |
| 70 to 74 Years | 9 (2.0%) | 0 (0.0%) |
| 75 to 79 Years | 0 (0.0%) | 0 (0.0%) |
| 80 to 84 Years | 0 (0.0%) | 0 (0.0%) |
| 85 Years and over | 0 (0.0%) | 0 (0.0%) |
| Total | 457 (100.0%) | 501 (100.0%) |
Families and Households in Etna
Median Family Size in Etna
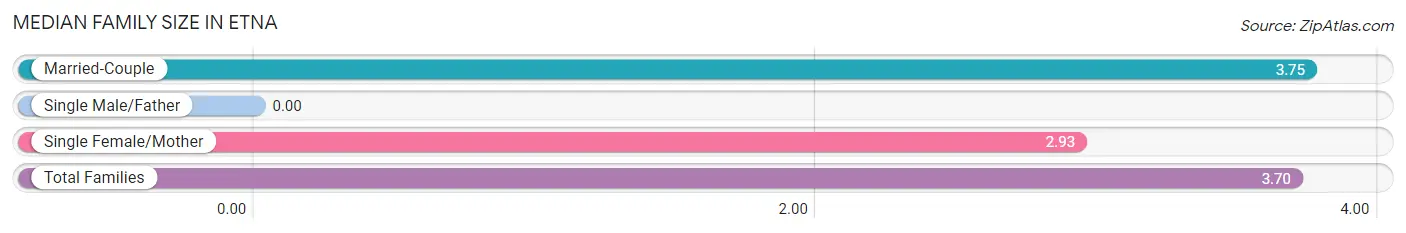
| Family Type | # Families | Family Size |
| Married-Couple | 221 (93.6%) | 3.75 |
| Single Male/Father | 0 (0.0%) | - |
| Single Female/Mother | 15 (6.4%) | 2.93 |
| Total Families | 236 (100.0%) | 3.70 |
Median Household Size in Etna
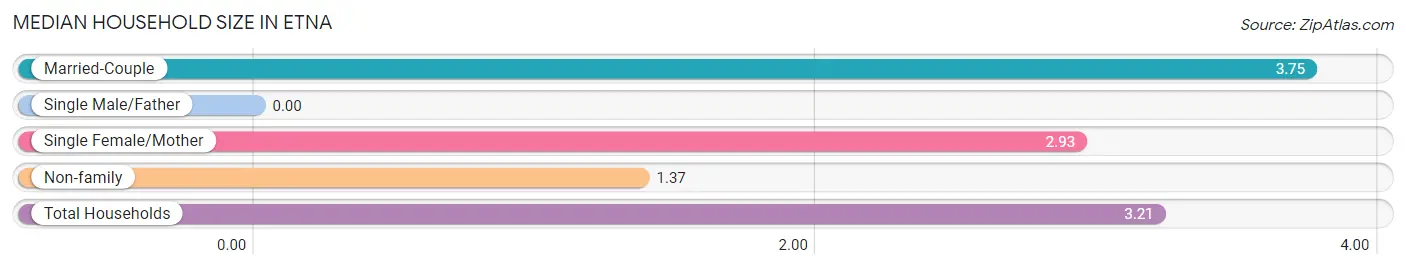
| Household Type | # Households | Household Size |
| Married-Couple | 221 (74.2%) | 3.75 |
| Single Male/Father | 0 (0.0%) | - |
| Single Female/Mother | 15 (5.0%) | 2.93 |
| Non-family | 62 (20.8%) | 1.37 |
| Total Households | 298 (100.0%) | 3.21 |
Household Size by Marriage Status in Etna
Out of a total of 298 households in Etna, 236 (79.2%) are family households, while 62 (20.8%) are nonfamily households. The most numerous type of family households are 3-person households, comprising 132, and the most common type of nonfamily households are 1-person households, comprising 44.
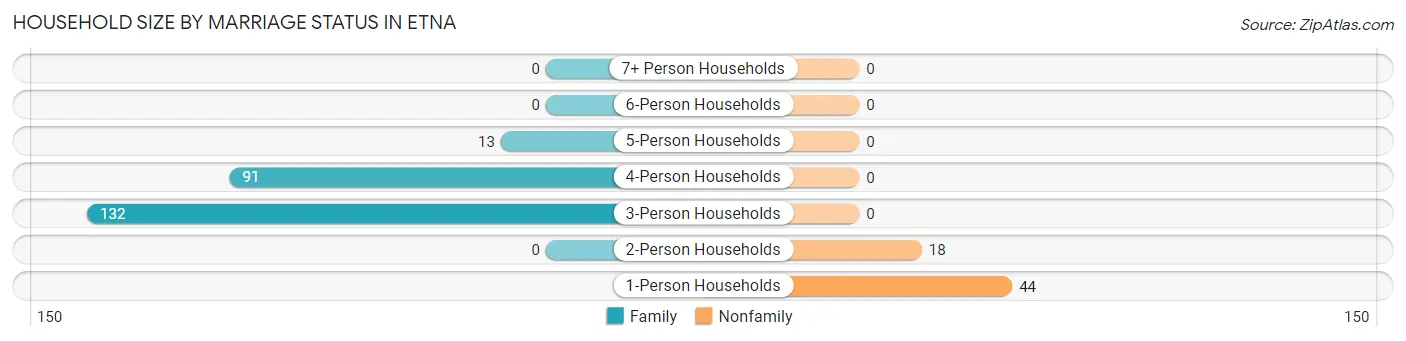
| Household Size | Family Households | Nonfamily Households |
| 1-Person Households | - | 44 (14.8%) |
| 2-Person Households | 0 (0.0%) | 18 (6.0%) |
| 3-Person Households | 132 (44.3%) | 0 (0.0%) |
| 4-Person Households | 91 (30.5%) | 0 (0.0%) |
| 5-Person Households | 13 (4.4%) | 0 (0.0%) |
| 6-Person Households | 0 (0.0%) | 0 (0.0%) |
| 7+ Person Households | 0 (0.0%) | 0 (0.0%) |
| Total | 236 (79.2%) | 62 (20.8%) |
Female Fertility in Etna
Fertility by Age in Etna
| Age Bracket | Women with Births | Births / 1,000 Women |
| 15 to 19 years | 0 (0.0%) | 0.0 |
| 20 to 34 years | 0 (0.0%) | 0.0 |
| 35 to 50 years | 0 (0.0%) | 0.0 |
| Total | 0 (0.0%) | 0.0 |
Fertility by Age by Marriage Status in Etna
| Age Bracket | Married | Unmarried |
| 15 to 19 years | 0 (0.0%) | 0 (0.0%) |
| 20 to 34 years | 0 (0.0%) | 0 (0.0%) |
| 35 to 50 years | 0 (0.0%) | 0 (0.0%) |
| Total | 0 (0.0%) | 0 (0.0%) |
Fertility by Education in Etna
| Educational Attainment | Women with Births | Births / 1,000 Women |
| Less than High School | 0 (0.0%) | 0.0 |
| High School Diploma | 0 (0.0%) | 0.0 |
| College or Associate's Degree | 0 (0.0%) | 0.0 |
| Bachelor's Degree | 0 (0.0%) | 0.0 |
| Graduate Degree | 0 (0.0%) | 0.0 |
| Total | 0 (0.0%) | 0.0 |
Fertility by Education by Marriage Status in Etna
| Educational Attainment | Married | Unmarried |
| Less than High School | 0 (0.0%) | 0 (0.0%) |
| High School Diploma | 0 (0.0%) | 0 (0.0%) |
| College or Associate's Degree | 0 (0.0%) | 0 (0.0%) |
| Bachelor's Degree | 0 (0.0%) | 0 (0.0%) |
| Graduate Degree | 0 (0.0%) | 0 (0.0%) |
| Total | 0 (0.0%) | 0 (0.0%) |
Employment Characteristics in Etna
Employment by Class of Employer in Etna
Among the 512 employed individuals in Etna, private company employees (309 | 60.4%), federal government employees (69 | 13.5%), and local government employees (54 | 10.5%) make up the most common classes of employment.
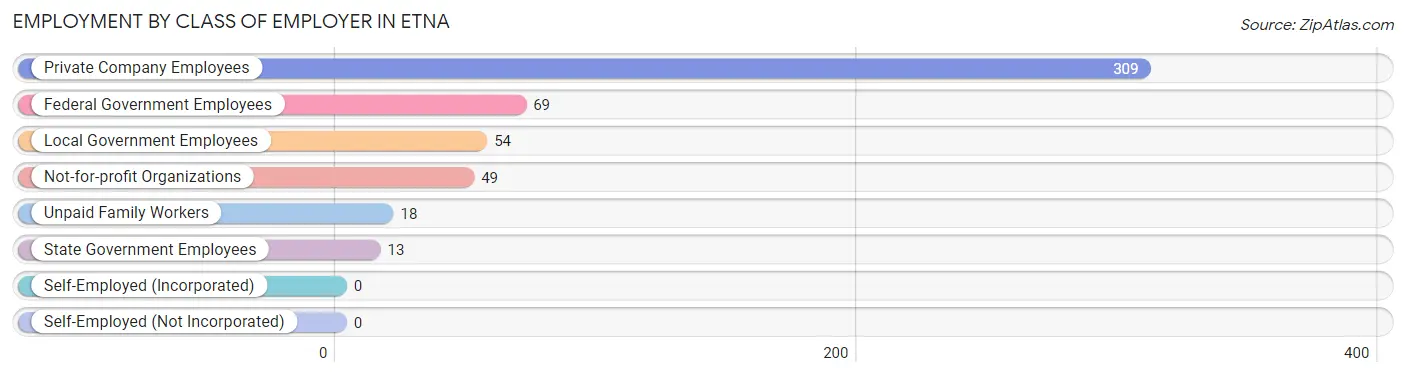
| Employer Class | # Employees | % Employees |
| Private Company Employees | 309 | 60.4% |
| Self-Employed (Incorporated) | 0 | 0.0% |
| Self-Employed (Not Incorporated) | 0 | 0.0% |
| Not-for-profit Organizations | 49 | 9.6% |
| Local Government Employees | 54 | 10.5% |
| State Government Employees | 13 | 2.5% |
| Federal Government Employees | 69 | 13.5% |
| Unpaid Family Workers | 18 | 3.5% |
| Total | 512 | 100.0% |
Employment Status by Age in Etna
According to the labor force statistics for Etna, out of the total population over 16 years of age (636), 84.4% or 537 individuals are in the labor force, with 2.6% or 14 of them unemployed. The age group with the highest labor force participation rate is 16 to 19 years, with 100.0% or 21 individuals in the labor force. Within the labor force, the 16 to 19 years age range has the highest percentage of unemployed individuals, with 66.7% or 14 of them being unemployed.
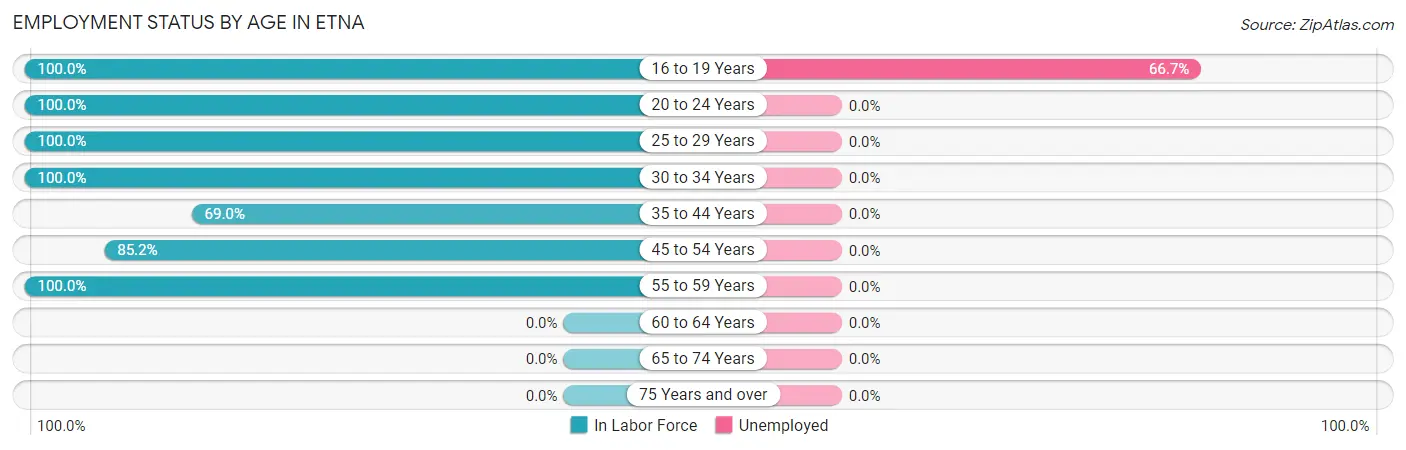
| Age Bracket | In Labor Force | Unemployed |
| 16 to 19 Years | 21 (100.0%) | 14 (66.7%) |
| 20 to 24 Years | 30 (100.0%) | 0 (0.0%) |
| 25 to 29 Years | 46 (100.0%) | 0 (0.0%) |
| 30 to 34 Years | 41 (100.0%) | 0 (0.0%) |
| 35 to 44 Years | 98 (69.0%) | 0 (0.0%) |
| 45 to 54 Years | 264 (85.2%) | 0 (0.0%) |
| 55 to 59 Years | 37 (100.0%) | 0 (0.0%) |
| 60 to 64 Years | 0 (0.0%) | 0 (0.0%) |
| 65 to 74 Years | 0 (0.0%) | 0 (0.0%) |
| 75 Years and over | 0 (0.0%) | 0 (0.0%) |
| Total | 537 (84.4%) | 14 (2.6%) |
Employment Status by Educational Attainment in Etna
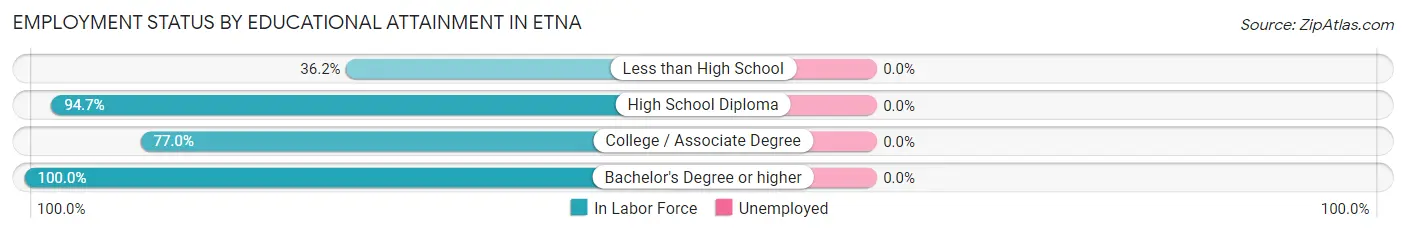
| Educational Attainment | In Labor Force | Unemployed |
| Less than High School | 21 (36.2%) | 0 (0.0%) |
| High School Diploma | 126 (94.7%) | 0 (0.0%) |
| College / Associate Degree | 154 (77.0%) | 0 (0.0%) |
| Bachelor's Degree or higher | 185 (100.0%) | 0 (0.0%) |
| Total | 486 (84.4%) | 0 (0.0%) |
Employment Occupations by Sex in Etna
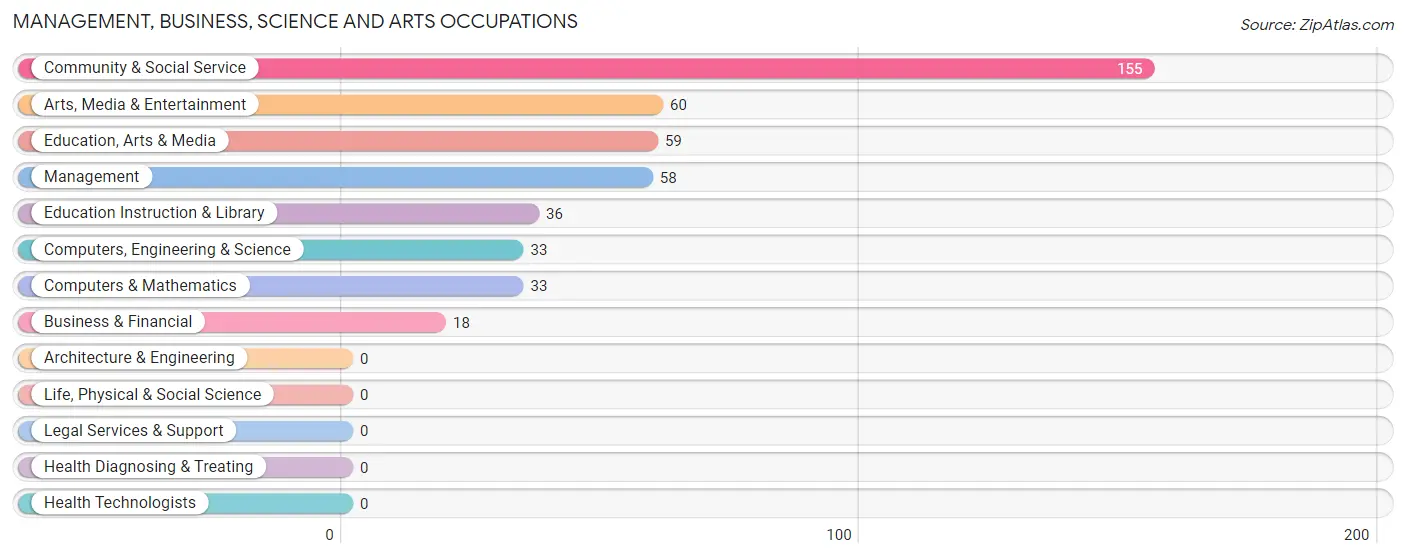
Management, Business, Science and Arts Occupations
The most common Management, Business, Science and Arts occupations in Etna are Community & Social Service (155 | 29.6%), Arts, Media & Entertainment (60 | 11.5%), Education, Arts & Media (59 | 11.3%), Management (58 | 11.1%), and Education Instruction & Library (36 | 6.9%).
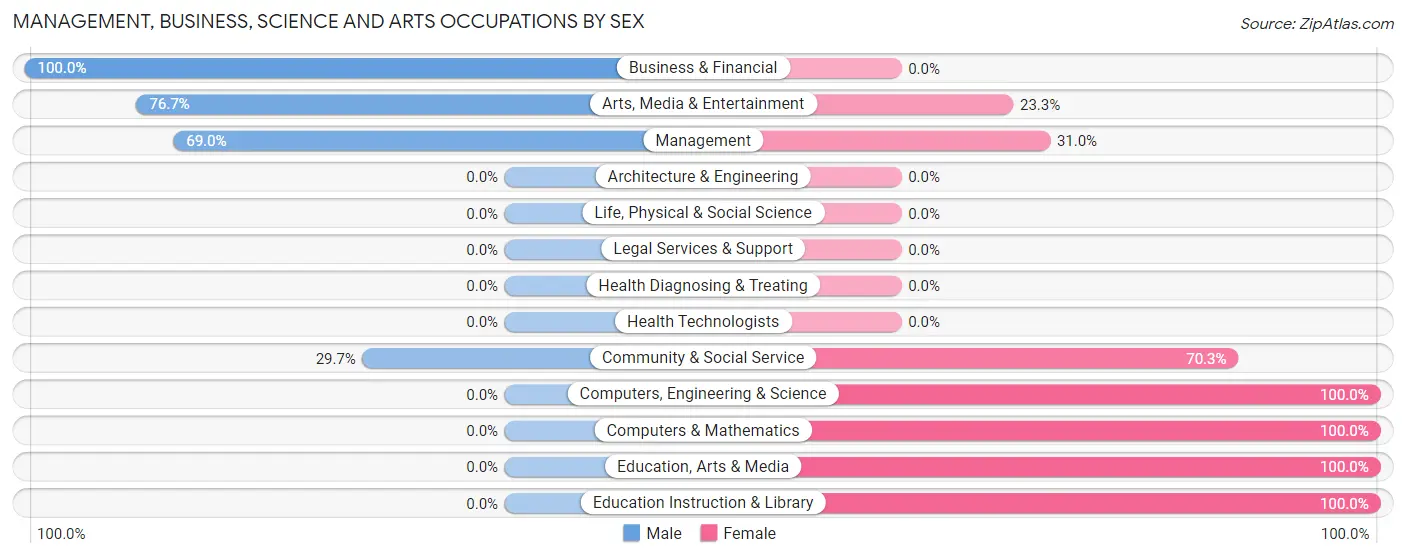
Management, Business, Science and Arts Occupations by Sex
Within the Management, Business, Science and Arts occupations in Etna, the most male-oriented occupations are Business & Financial (100.0%), Arts, Media & Entertainment (76.7%), and Management (69.0%), while the most female-oriented occupations are Computers, Engineering & Science (100.0%), Computers & Mathematics (100.0%), and Education, Arts & Media (100.0%).
| Occupation | Male | Female |
| Management | 40 (69.0%) | 18 (31.0%) |
| Business & Financial | 18 (100.0%) | 0 (0.0%) |
| Computers, Engineering & Science | 0 (0.0%) | 33 (100.0%) |
| Computers & Mathematics | 0 (0.0%) | 33 (100.0%) |
| Architecture & Engineering | 0 (0.0%) | 0 (0.0%) |
| Life, Physical & Social Science | 0 (0.0%) | 0 (0.0%) |
| Community & Social Service | 46 (29.7%) | 109 (70.3%) |
| Education, Arts & Media | 0 (0.0%) | 59 (100.0%) |
| Legal Services & Support | 0 (0.0%) | 0 (0.0%) |
| Education Instruction & Library | 0 (0.0%) | 36 (100.0%) |
| Arts, Media & Entertainment | 46 (76.7%) | 14 (23.3%) |
| Health Diagnosing & Treating | 0 (0.0%) | 0 (0.0%) |
| Health Technologists | 0 (0.0%) | 0 (0.0%) |
| Total (Category) | 104 (39.4%) | 160 (60.6%) |
| Total (Overall) | 296 (56.6%) | 227 (43.4%) |
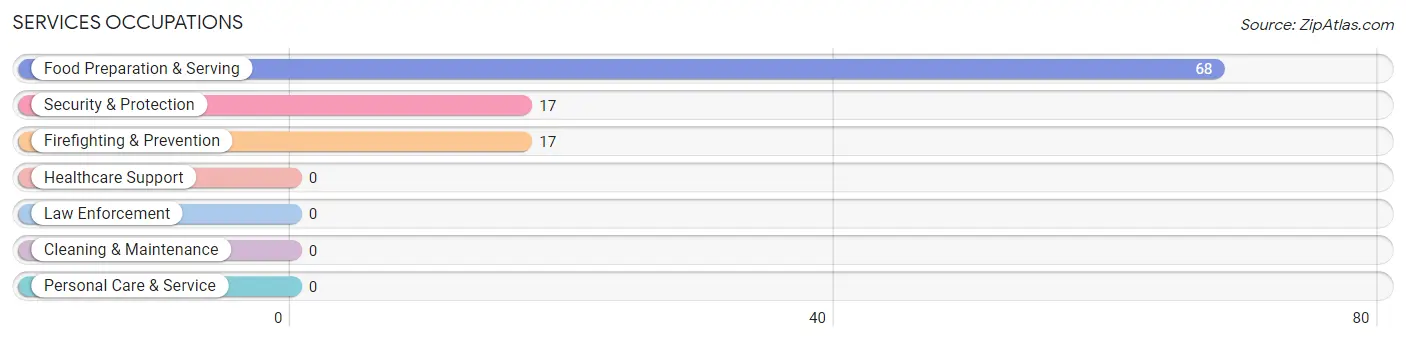
Services Occupations
The most common Services occupations in Etna are Food Preparation & Serving (68 | 13.0%), Security & Protection (17 | 3.3%), and Firefighting & Prevention (17 | 3.3%).
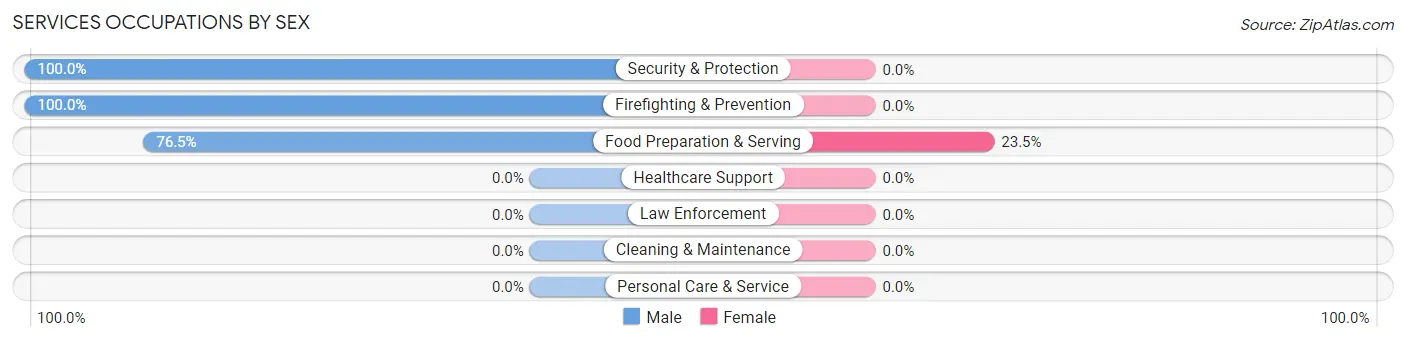
Services Occupations by Sex
| Occupation | Male | Female |
| Healthcare Support | 0 (0.0%) | 0 (0.0%) |
| Security & Protection | 17 (100.0%) | 0 (0.0%) |
| Firefighting & Prevention | 17 (100.0%) | 0 (0.0%) |
| Law Enforcement | 0 (0.0%) | 0 (0.0%) |
| Food Preparation & Serving | 52 (76.5%) | 16 (23.5%) |
| Cleaning & Maintenance | 0 (0.0%) | 0 (0.0%) |
| Personal Care & Service | 0 (0.0%) | 0 (0.0%) |
| Total (Category) | 69 (81.2%) | 16 (18.8%) |
| Total (Overall) | 296 (56.6%) | 227 (43.4%) |
Sales and Office Occupations
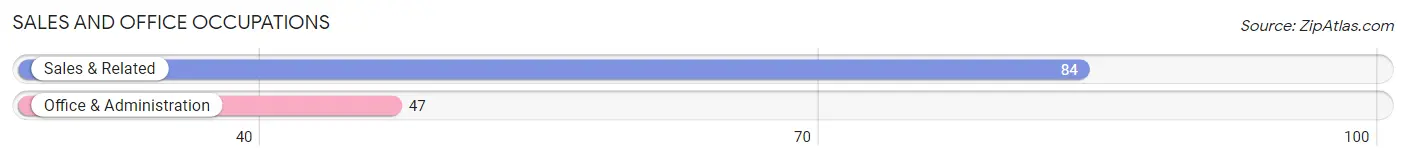
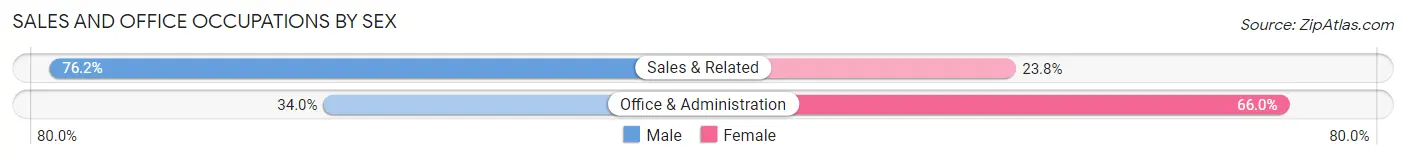
The most common Sales and Office occupations in Etna are Sales & Related (84 | 16.1%), and Office & Administration (47 | 9.0%).
Sales and Office Occupations by Sex
| Occupation | Male | Female |
| Sales & Related | 64 (76.2%) | 20 (23.8%) |
| Office & Administration | 16 (34.0%) | 31 (66.0%) |
| Total (Category) | 80 (61.1%) | 51 (38.9%) |
| Total (Overall) | 296 (56.6%) | 227 (43.4%) |
Natural Resources, Construction and Maintenance Occupations
Natural Resources, Construction and Maintenance Occupations by Sex
| Occupation | Male | Female |
| Farming, Fishing & Forestry | 0 (0.0%) | 0 (0.0%) |
| Construction & Extraction | 0 (0.0%) | 0 (0.0%) |
| Installation, Maintenance & Repair | 0 (0.0%) | 0 (0.0%) |
| Total (Category) | 0 (0.0%) | 0 (0.0%) |
| Total (Overall) | 296 (56.6%) | 227 (43.4%) |
Production, Transportation and Moving Occupations
The most common Production, Transportation and Moving occupations in Etna are Transportation (22 | 4.2%), Material Moving (13 | 2.5%), and Production (8 | 1.5%).
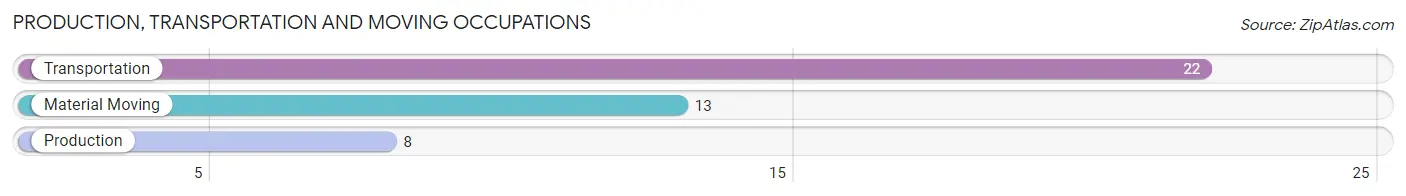
Production, Transportation and Moving Occupations by Sex
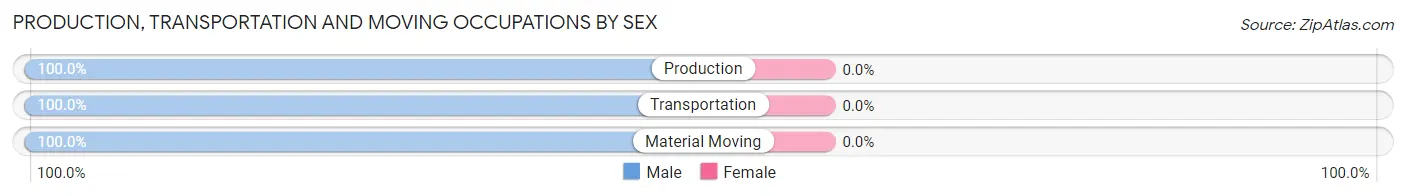
| Occupation | Male | Female |
| Production | 8 (100.0%) | 0 (0.0%) |
| Transportation | 22 (100.0%) | 0 (0.0%) |
| Material Moving | 13 (100.0%) | 0 (0.0%) |
| Total (Category) | 43 (100.0%) | 0 (0.0%) |
| Total (Overall) | 296 (56.6%) | 227 (43.4%) |
Employment Industries by Sex in Etna
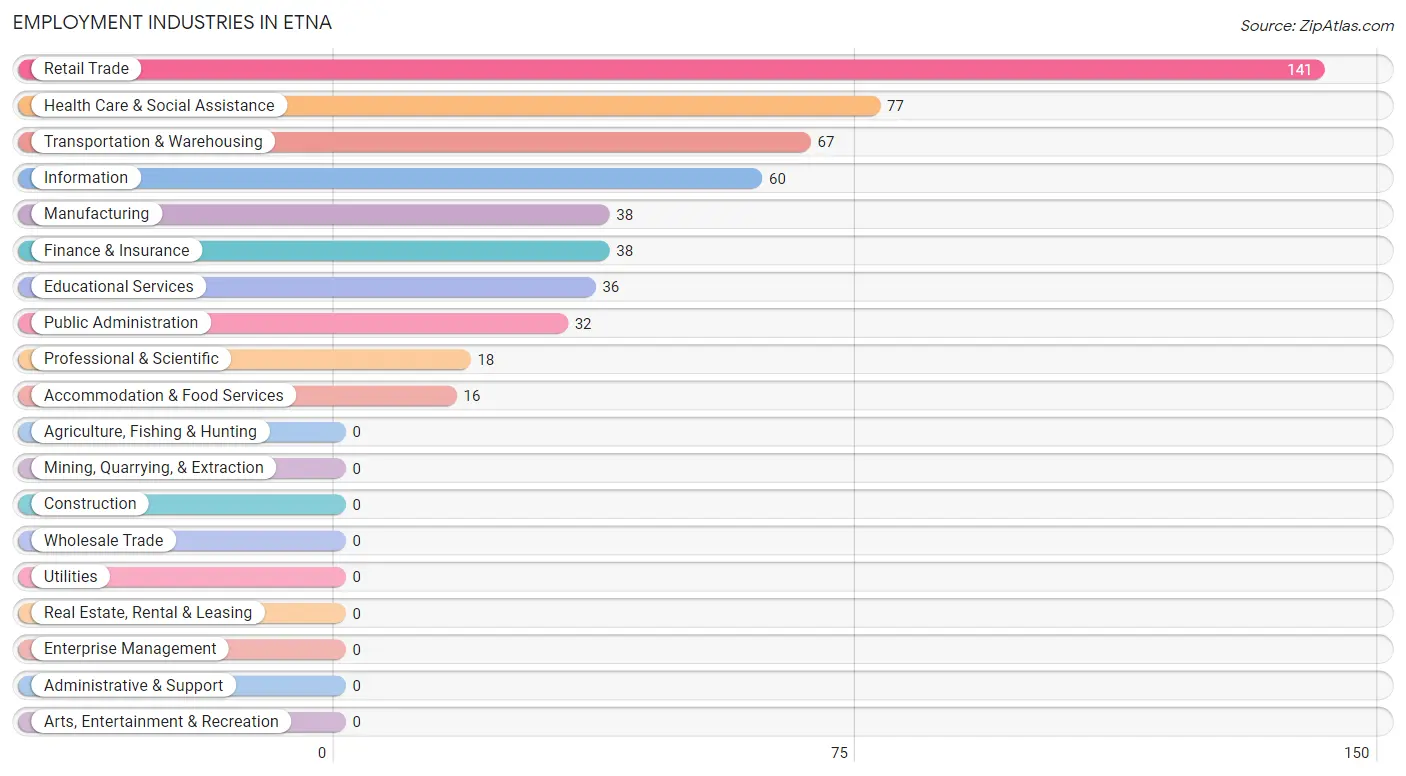
Employment Industries in Etna
The major employment industries in Etna include Retail Trade (141 | 27.0%), Health Care & Social Assistance (77 | 14.7%), Transportation & Warehousing (67 | 12.8%), Information (60 | 11.5%), and Manufacturing (38 | 7.3%).
Employment Industries by Sex in Etna
The Etna industries that see more men than women are Professional & Scientific (100.0%), Retail Trade (95.0%), and Manufacturing (78.9%), whereas the industries that tend to have a higher number of women are Finance & Insurance (100.0%), Educational Services (100.0%), and Health Care & Social Assistance (100.0%).
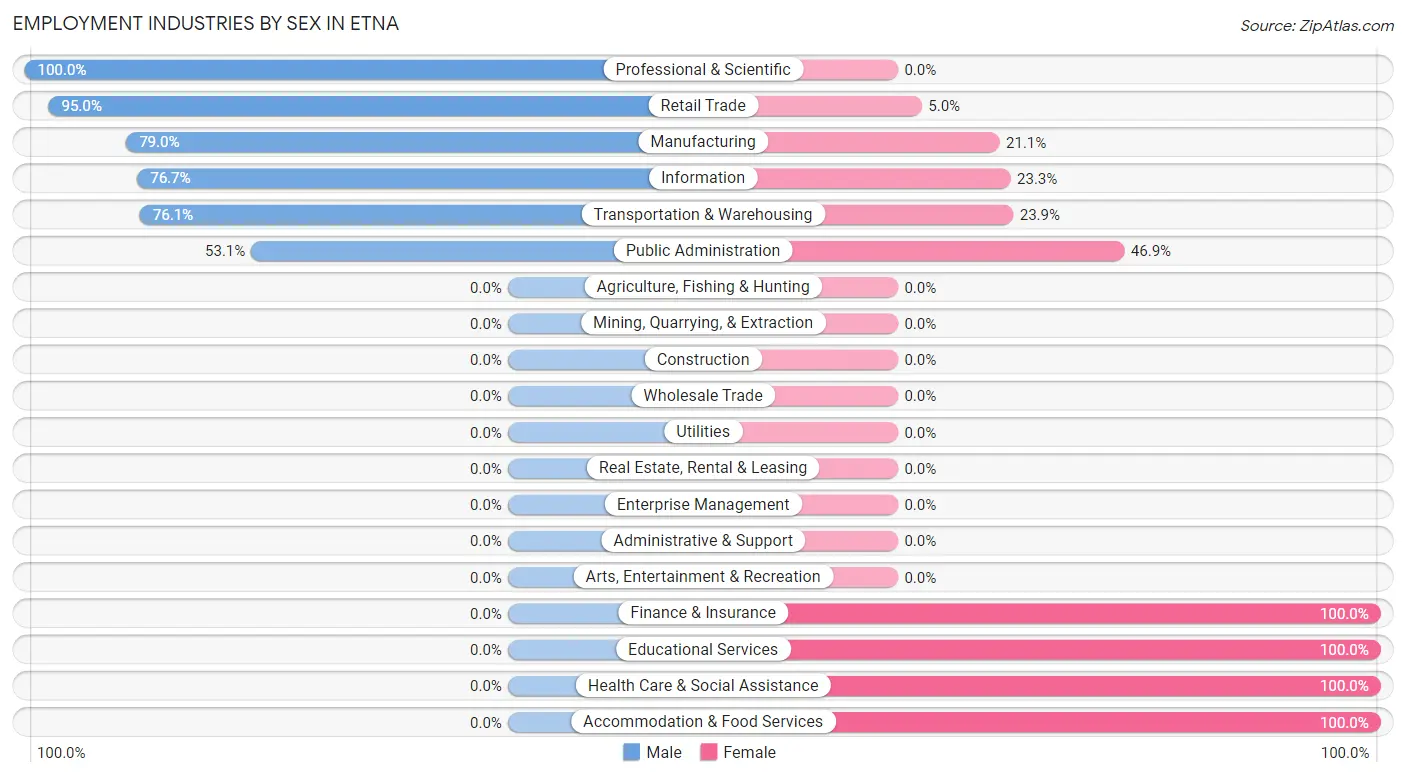
| Industry | Male | Female |
| Agriculture, Fishing & Hunting | 0 (0.0%) | 0 (0.0%) |
| Mining, Quarrying, & Extraction | 0 (0.0%) | 0 (0.0%) |
| Construction | 0 (0.0%) | 0 (0.0%) |
| Manufacturing | 30 (78.9%) | 8 (21.0%) |
| Wholesale Trade | 0 (0.0%) | 0 (0.0%) |
| Retail Trade | 134 (95.0%) | 7 (5.0%) |
| Transportation & Warehousing | 51 (76.1%) | 16 (23.9%) |
| Utilities | 0 (0.0%) | 0 (0.0%) |
| Information | 46 (76.7%) | 14 (23.3%) |
| Finance & Insurance | 0 (0.0%) | 38 (100.0%) |
| Real Estate, Rental & Leasing | 0 (0.0%) | 0 (0.0%) |
| Professional & Scientific | 18 (100.0%) | 0 (0.0%) |
| Enterprise Management | 0 (0.0%) | 0 (0.0%) |
| Administrative & Support | 0 (0.0%) | 0 (0.0%) |
| Educational Services | 0 (0.0%) | 36 (100.0%) |
| Health Care & Social Assistance | 0 (0.0%) | 77 (100.0%) |
| Arts, Entertainment & Recreation | 0 (0.0%) | 0 (0.0%) |
| Accommodation & Food Services | 0 (0.0%) | 16 (100.0%) |
| Public Administration | 17 (53.1%) | 15 (46.9%) |
| Total | 296 (56.6%) | 227 (43.4%) |
Education in Etna
School Enrollment in Etna
The most common levels of schooling among the 204 students in Etna are middle school (58 | 28.4%), nursery / preschool (43 | 21.1%), and high school (38 | 18.6%).

| School Level | # Students | % Students |
| Nursery / Preschool | 43 | 21.1% |
| Kindergarten | 0 | 0.0% |
| Elementary School | 35 | 17.2% |
| Middle School | 58 | 28.4% |
| High School | 38 | 18.6% |
| College / Undergraduate | 30 | 14.7% |
| Graduate / Professional | 0 | 0.0% |
| Total | 204 | 100.0% |
School Enrollment by Age by Funding Source in Etna
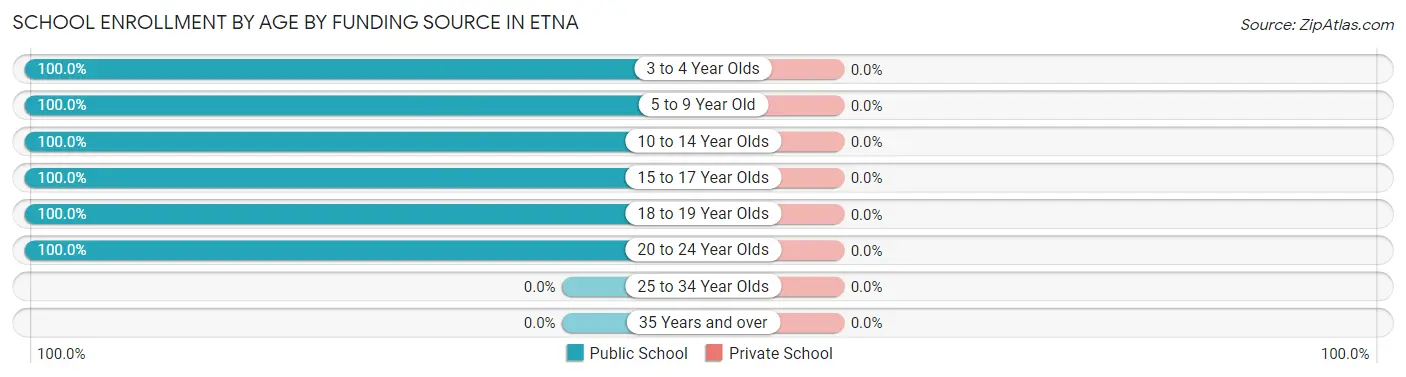
| Age Bracket | Public School | Private School |
| 3 to 4 Year Olds | 43 (100.0%) | 0 (0.0%) |
| 5 to 9 Year Old | 35 (100.0%) | 0 (0.0%) |
| 10 to 14 Year Olds | 74 (100.0%) | 0 (0.0%) |
| 15 to 17 Year Olds | 15 (100.0%) | 0 (0.0%) |
| 18 to 19 Year Olds | 7 (100.0%) | 0 (0.0%) |
| 20 to 24 Year Olds | 30 (100.0%) | 0 (0.0%) |
| 25 to 34 Year Olds | 0 (0.0%) | 0 (0.0%) |
| 35 Years and over | 0 (0.0%) | 0 (0.0%) |
| Total | 204 (100.0%) | 0 (0.0%) |
Educational Attainment by Field of Study in Etna
Arts & humanities (59 | 26.2%), social sciences (38 | 16.9%), literature & languages (36 | 16.0%), business (24 | 10.7%), and bio, nature & agricultural (18 | 8.0%) are the most common fields of study among 225 individuals in Etna who have obtained a bachelor's degree or higher.
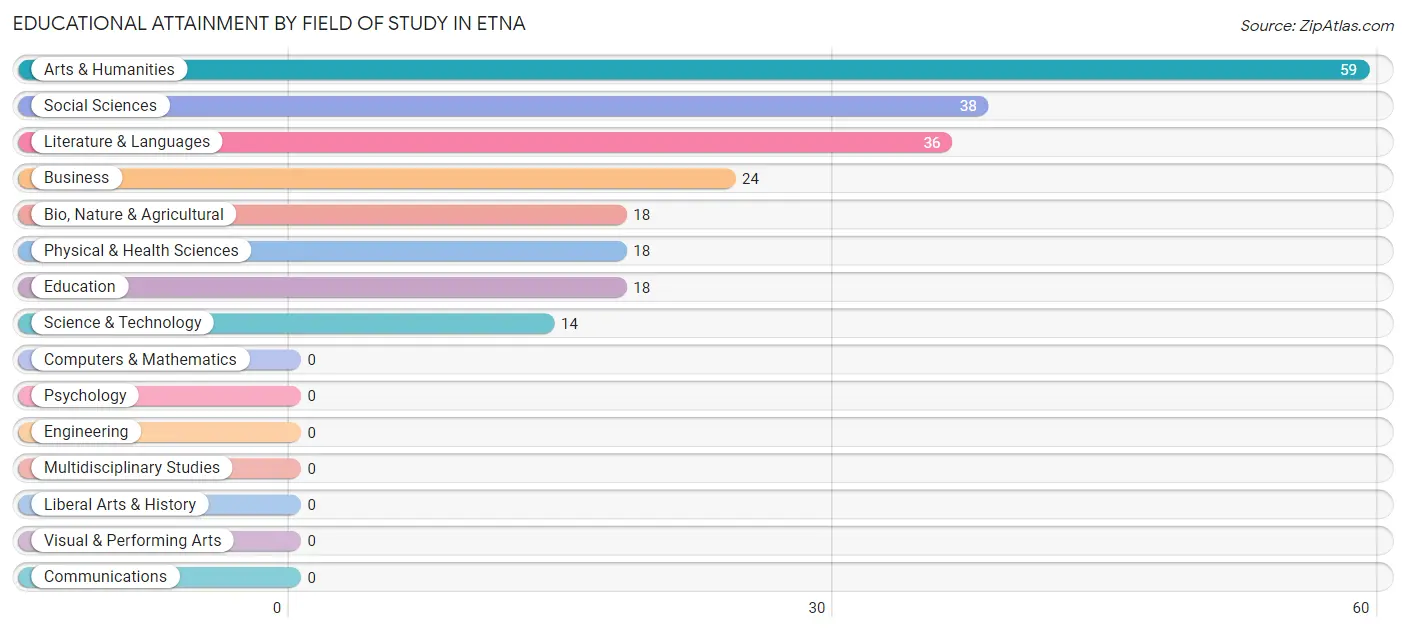
| Field of Study | # Graduates | % Graduates |
| Computers & Mathematics | 0 | 0.0% |
| Bio, Nature & Agricultural | 18 | 8.0% |
| Physical & Health Sciences | 18 | 8.0% |
| Psychology | 0 | 0.0% |
| Social Sciences | 38 | 16.9% |
| Engineering | 0 | 0.0% |
| Multidisciplinary Studies | 0 | 0.0% |
| Science & Technology | 14 | 6.2% |
| Business | 24 | 10.7% |
| Education | 18 | 8.0% |
| Literature & Languages | 36 | 16.0% |
| Liberal Arts & History | 0 | 0.0% |
| Visual & Performing Arts | 0 | 0.0% |
| Communications | 0 | 0.0% |
| Arts & Humanities | 59 | 26.2% |
| Total | 225 | 100.0% |
Transportation & Commute in Etna
Vehicle Availability by Sex in Etna
The most prevalent vehicle ownership categories in Etna are males with 2 vehicles (124, accounting for 43.5%) and females with 2 vehicles (105, making up 54.6%).
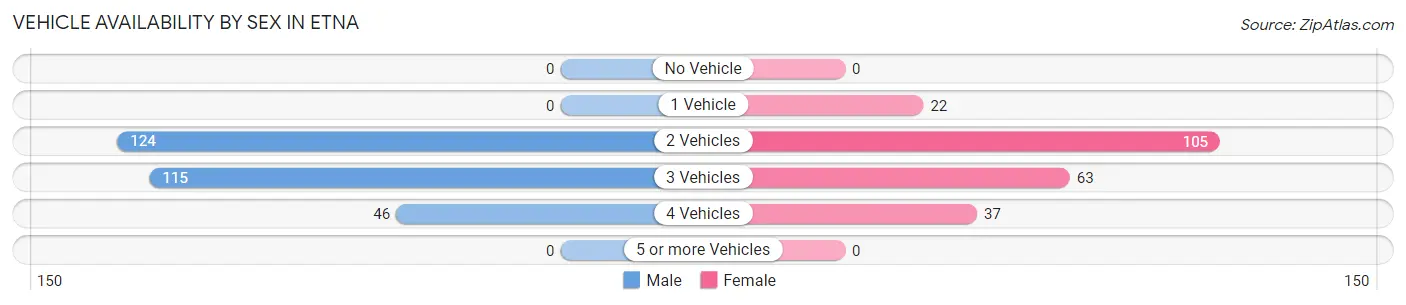
| Vehicles Available | Male | Female |
| No Vehicle | 0 (0.0%) | 0 (0.0%) |
| 1 Vehicle | 0 (0.0%) | 22 (9.7%) |
| 2 Vehicles | 124 (43.5%) | 105 (46.3%) |
| 3 Vehicles | 115 (40.4%) | 63 (27.8%) |
| 4 Vehicles | 46 (16.1%) | 37 (16.3%) |
| 5 or more Vehicles | 0 (0.0%) | 0 (0.0%) |
| Total | 285 (100.0%) | 227 (100.0%) |
Commute Time in Etna
The most frequently occuring commute durations in Etna are 15 to 19 minutes (75 commuters, 19.2%), 25 to 29 minutes (66 commuters, 16.9%), and 5 to 9 minutes (63 commuters, 16.1%).
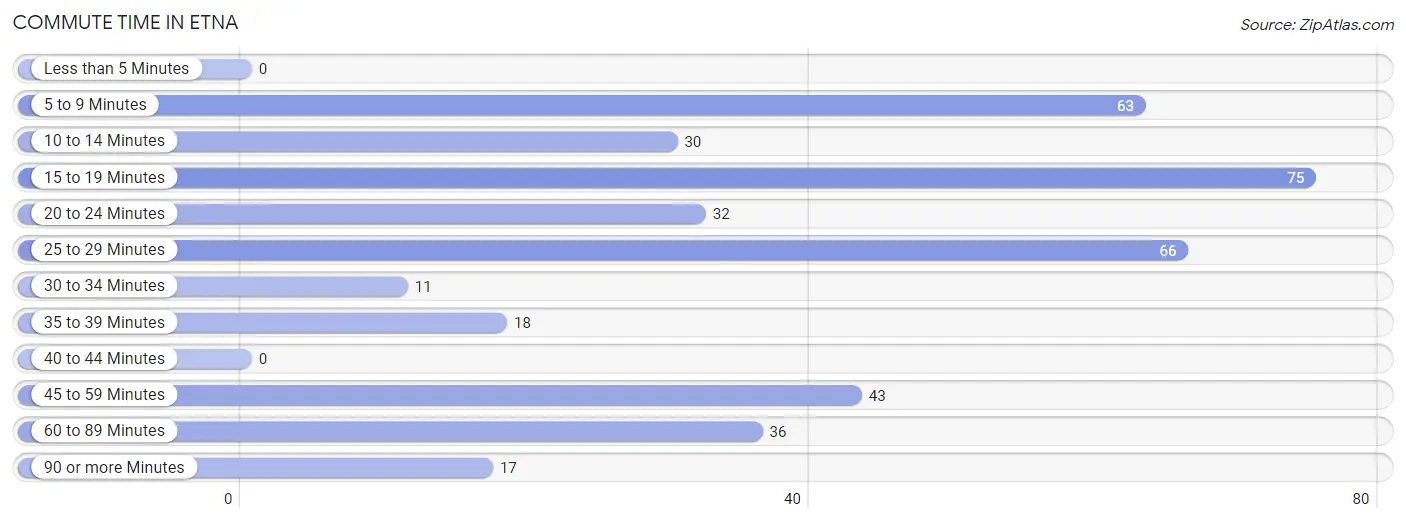
| Commute Time | # Commuters | % Commuters |
| Less than 5 Minutes | 0 | 0.0% |
| 5 to 9 Minutes | 63 | 16.1% |
| 10 to 14 Minutes | 30 | 7.7% |
| 15 to 19 Minutes | 75 | 19.2% |
| 20 to 24 Minutes | 32 | 8.2% |
| 25 to 29 Minutes | 66 | 16.9% |
| 30 to 34 Minutes | 11 | 2.8% |
| 35 to 39 Minutes | 18 | 4.6% |
| 40 to 44 Minutes | 0 | 0.0% |
| 45 to 59 Minutes | 43 | 11.0% |
| 60 to 89 Minutes | 36 | 9.2% |
| 90 or more Minutes | 17 | 4.3% |
Commute Time by Sex in Etna
The most common commute times in Etna are 15 to 19 minutes (75 commuters, 32.9%) for males and 25 to 29 minutes (53 commuters, 32.5%) for females.
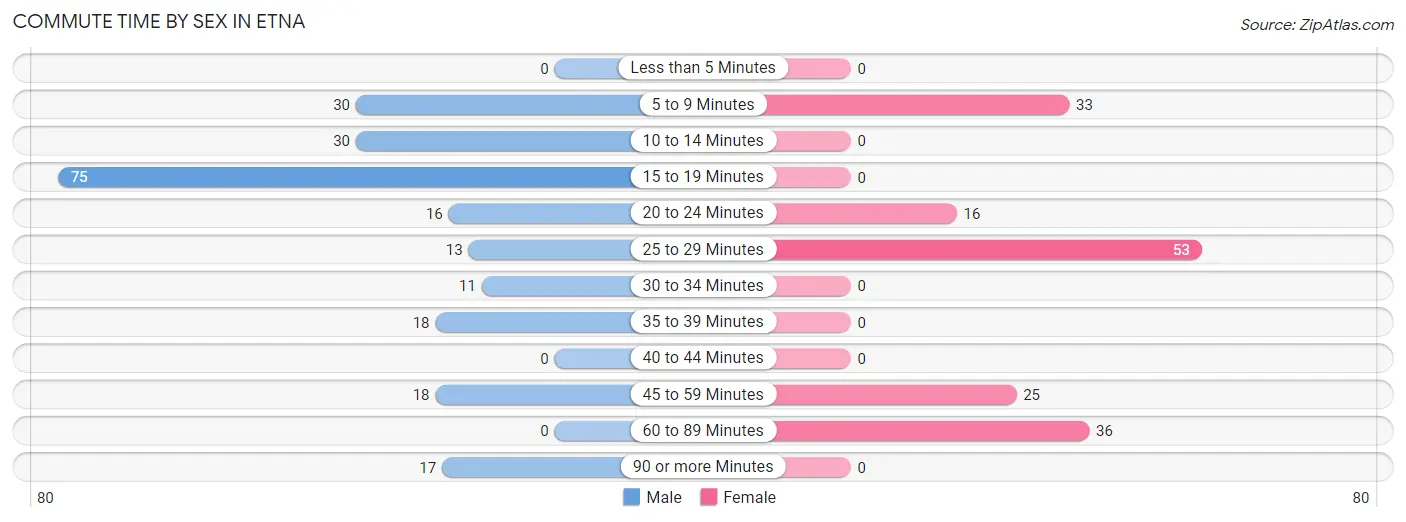
| Commute Time | Male | Female |
| Less than 5 Minutes | 0 (0.0%) | 0 (0.0%) |
| 5 to 9 Minutes | 30 (13.2%) | 33 (20.3%) |
| 10 to 14 Minutes | 30 (13.2%) | 0 (0.0%) |
| 15 to 19 Minutes | 75 (32.9%) | 0 (0.0%) |
| 20 to 24 Minutes | 16 (7.0%) | 16 (9.8%) |
| 25 to 29 Minutes | 13 (5.7%) | 53 (32.5%) |
| 30 to 34 Minutes | 11 (4.8%) | 0 (0.0%) |
| 35 to 39 Minutes | 18 (7.9%) | 0 (0.0%) |
| 40 to 44 Minutes | 0 (0.0%) | 0 (0.0%) |
| 45 to 59 Minutes | 18 (7.9%) | 25 (15.3%) |
| 60 to 89 Minutes | 0 (0.0%) | 36 (22.1%) |
| 90 or more Minutes | 17 (7.5%) | 0 (0.0%) |
Time of Departure to Work by Sex in Etna
The most frequent times of departure to work in Etna are 8:00 AM to 8:29 AM (70, 30.7%) for males and 12:00 AM to 4:59 AM (42, 25.8%) for females.
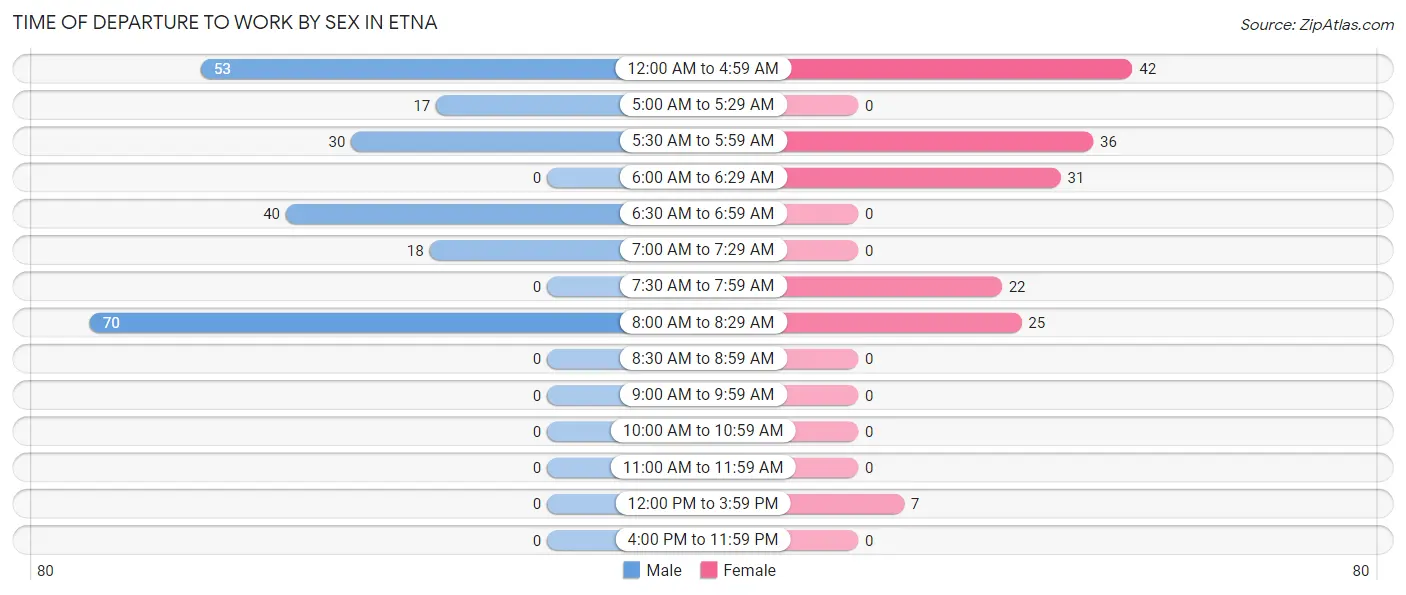
| Time of Departure | Male | Female |
| 12:00 AM to 4:59 AM | 53 (23.3%) | 42 (25.8%) |
| 5:00 AM to 5:29 AM | 17 (7.5%) | 0 (0.0%) |
| 5:30 AM to 5:59 AM | 30 (13.2%) | 36 (22.1%) |
| 6:00 AM to 6:29 AM | 0 (0.0%) | 31 (19.0%) |
| 6:30 AM to 6:59 AM | 40 (17.5%) | 0 (0.0%) |
| 7:00 AM to 7:29 AM | 18 (7.9%) | 0 (0.0%) |
| 7:30 AM to 7:59 AM | 0 (0.0%) | 22 (13.5%) |
| 8:00 AM to 8:29 AM | 70 (30.7%) | 25 (15.3%) |
| 8:30 AM to 8:59 AM | 0 (0.0%) | 0 (0.0%) |
| 9:00 AM to 9:59 AM | 0 (0.0%) | 0 (0.0%) |
| 10:00 AM to 10:59 AM | 0 (0.0%) | 0 (0.0%) |
| 11:00 AM to 11:59 AM | 0 (0.0%) | 0 (0.0%) |
| 12:00 PM to 3:59 PM | 0 (0.0%) | 7 (4.3%) |
| 4:00 PM to 11:59 PM | 0 (0.0%) | 0 (0.0%) |
| Total | 228 (100.0%) | 163 (100.0%) |
Housing Occupancy in Etna
Occupancy by Ownership in Etna
Of the total 298 dwellings in Etna, owner-occupied units account for 281 (94.3%), while renter-occupied units make up 17 (5.7%).
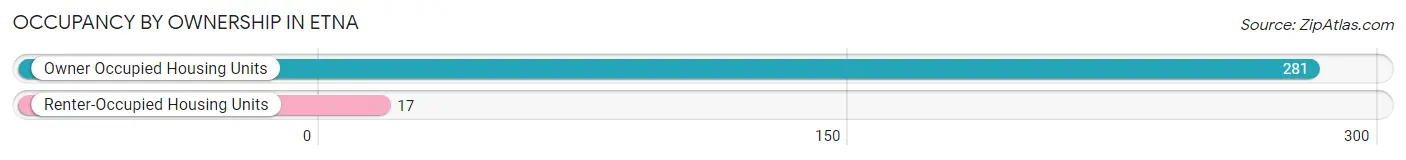
| Occupancy | # Housing Units | % Housing Units |
| Owner Occupied Housing Units | 281 | 94.3% |
| Renter-Occupied Housing Units | 17 | 5.7% |
| Total Occupied Housing Units | 298 | 100.0% |
Occupancy by Household Size in Etna
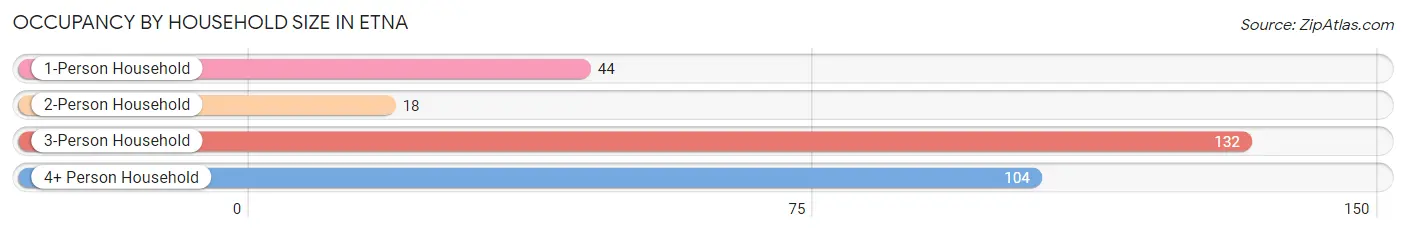
| Household Size | # Housing Units | % Housing Units |
| 1-Person Household | 44 | 14.8% |
| 2-Person Household | 18 | 6.0% |
| 3-Person Household | 132 | 44.3% |
| 4+ Person Household | 104 | 34.9% |
| Total Housing Units | 298 | 100.0% |
Occupancy by Ownership by Household Size in Etna
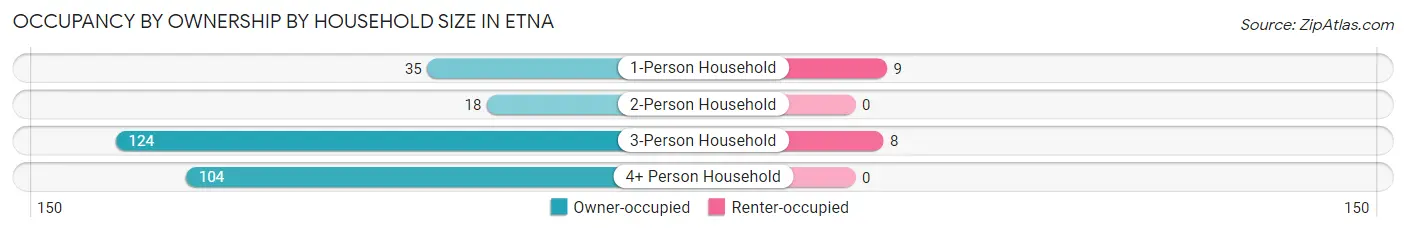
| Household Size | Owner-occupied | Renter-occupied |
| 1-Person Household | 35 (79.5%) | 9 (20.4%) |
| 2-Person Household | 18 (100.0%) | 0 (0.0%) |
| 3-Person Household | 124 (93.9%) | 8 (6.1%) |
| 4+ Person Household | 104 (100.0%) | 0 (0.0%) |
| Total Housing Units | 281 (94.3%) | 17 (5.7%) |
Occupancy by Educational Attainment in Etna
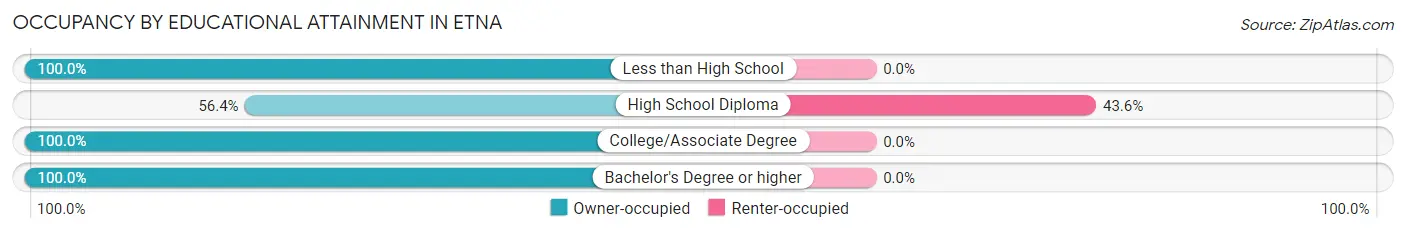
| Household Size | Owner-occupied | Renter-occupied |
| Less than High School | 13 (100.0%) | 0 (0.0%) |
| High School Diploma | 22 (56.4%) | 17 (43.6%) |
| College/Associate Degree | 79 (100.0%) | 0 (0.0%) |
| Bachelor's Degree or higher | 167 (100.0%) | 0 (0.0%) |
Occupancy by Age of Householder in Etna
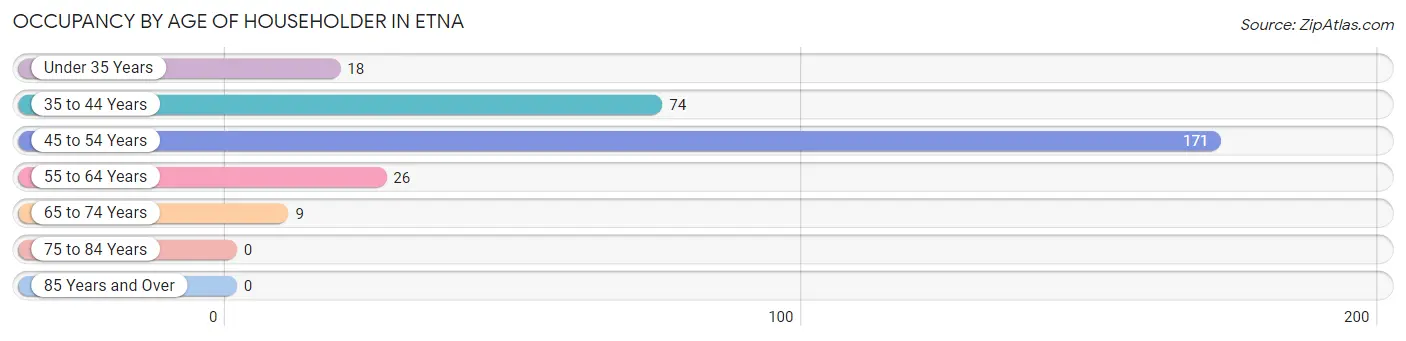
| Age Bracket | # Households | % Households |
| Under 35 Years | 18 | 6.0% |
| 35 to 44 Years | 74 | 24.8% |
| 45 to 54 Years | 171 | 57.4% |
| 55 to 64 Years | 26 | 8.7% |
| 65 to 74 Years | 9 | 3.0% |
| 75 to 84 Years | 0 | 0.0% |
| 85 Years and Over | 0 | 0.0% |
| Total | 298 | 100.0% |
Housing Finances in Etna
Median Income by Occupancy in Etna
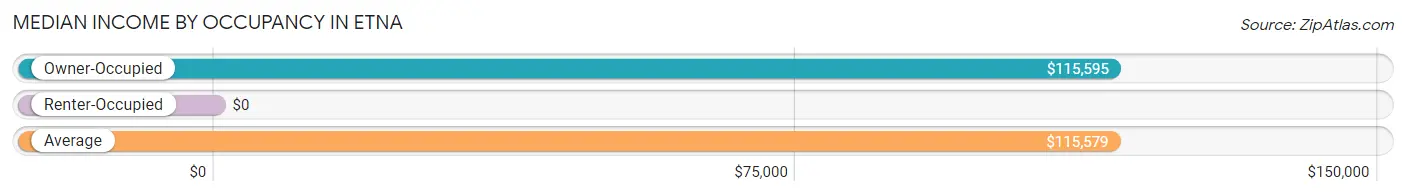
| Occupancy Type | # Households | Median Income |
| Owner-Occupied | 281 (94.3%) | $115,595 |
| Renter-Occupied | 17 (5.7%) | $0 |
| Average | 298 (100.0%) | $115,579 |
Occupancy by Householder Income Bracket in Etna
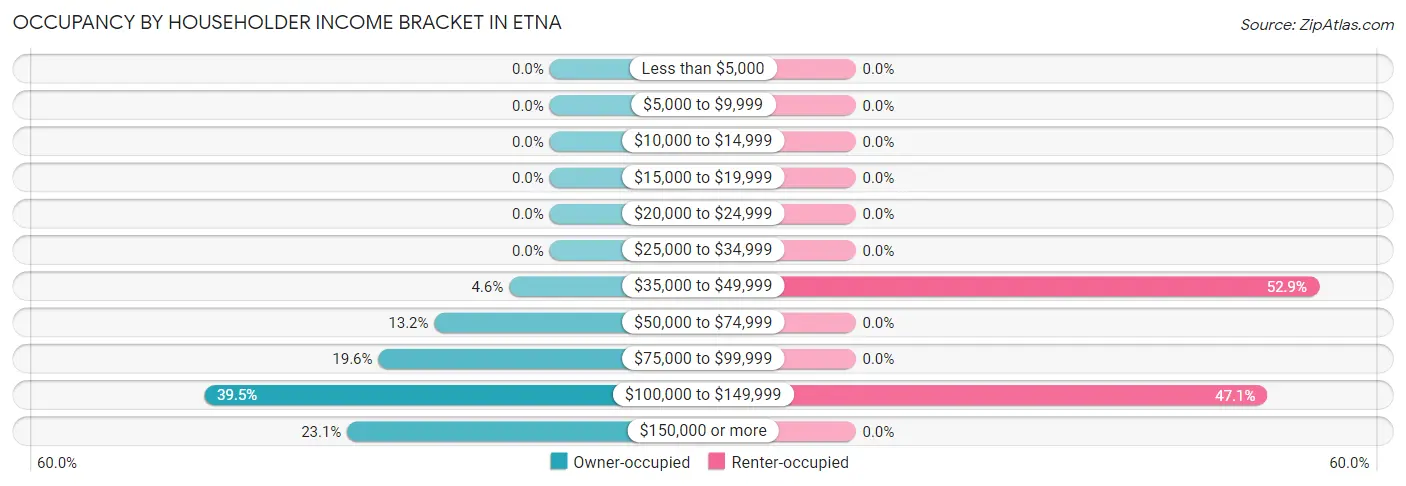
| Income Bracket | Owner-occupied | Renter-occupied |
| Less than $5,000 | 0 (0.0%) | 0 (0.0%) |
| $5,000 to $9,999 | 0 (0.0%) | 0 (0.0%) |
| $10,000 to $14,999 | 0 (0.0%) | 0 (0.0%) |
| $15,000 to $19,999 | 0 (0.0%) | 0 (0.0%) |
| $20,000 to $24,999 | 0 (0.0%) | 0 (0.0%) |
| $25,000 to $34,999 | 0 (0.0%) | 0 (0.0%) |
| $35,000 to $49,999 | 13 (4.6%) | 9 (52.9%) |
| $50,000 to $74,999 | 37 (13.2%) | 0 (0.0%) |
| $75,000 to $99,999 | 55 (19.6%) | 0 (0.0%) |
| $100,000 to $149,999 | 111 (39.5%) | 8 (47.1%) |
| $150,000 or more | 65 (23.1%) | 0 (0.0%) |
| Total | 281 (100.0%) | 17 (100.0%) |
Monthly Housing Cost Tiers in Etna
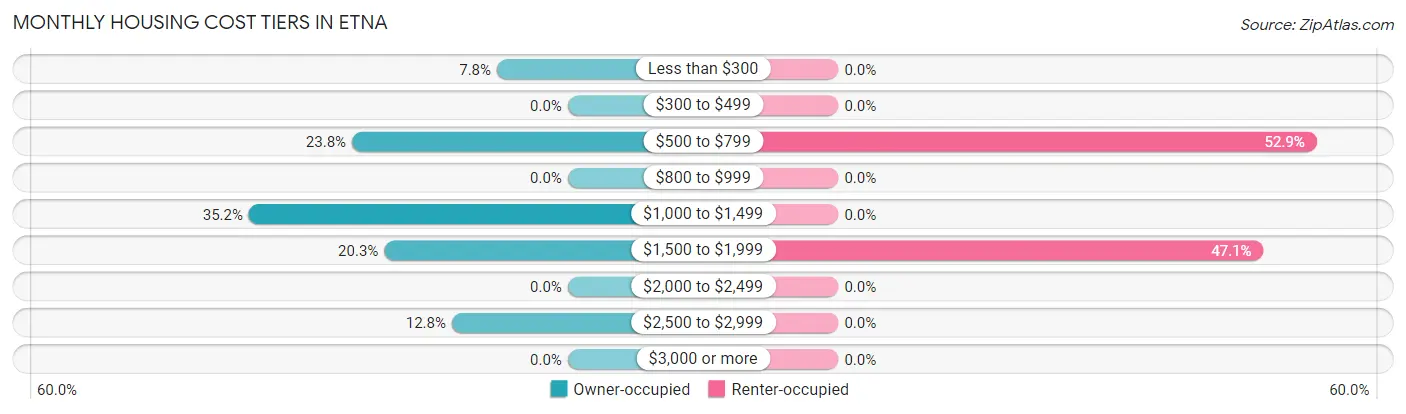
| Monthly Cost | Owner-occupied | Renter-occupied |
| Less than $300 | 22 (7.8%) | 0 (0.0%) |
| $300 to $499 | 0 (0.0%) | 0 (0.0%) |
| $500 to $799 | 67 (23.8%) | 9 (52.9%) |
| $800 to $999 | 0 (0.0%) | 0 (0.0%) |
| $1,000 to $1,499 | 99 (35.2%) | 0 (0.0%) |
| $1,500 to $1,999 | 57 (20.3%) | 8 (47.1%) |
| $2,000 to $2,499 | 0 (0.0%) | 0 (0.0%) |
| $2,500 to $2,999 | 36 (12.8%) | 0 (0.0%) |
| $3,000 or more | 0 (0.0%) | 0 (0.0%) |
| Total | 281 (100.0%) | 17 (100.0%) |
Physical Housing Characteristics in Etna
Housing Structures in Etna
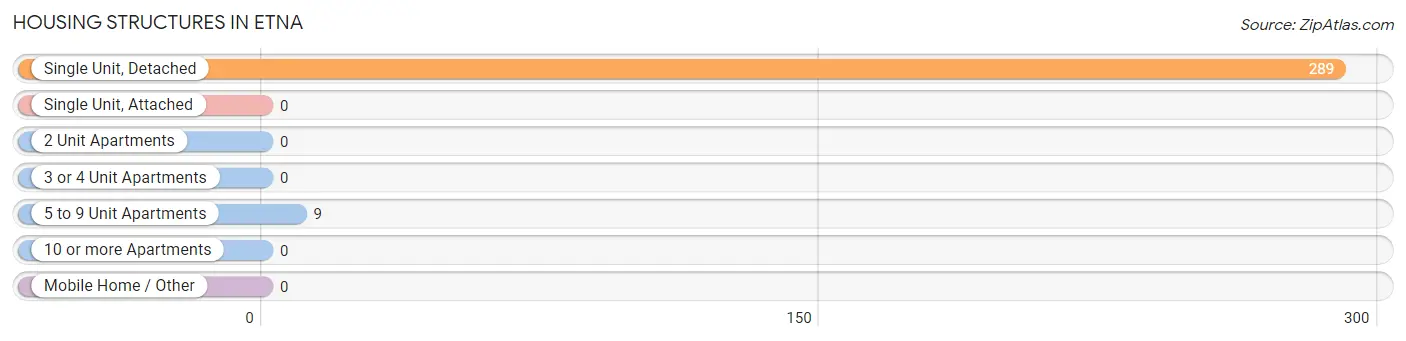
| Structure Type | # Housing Units | % Housing Units |
| Single Unit, Detached | 289 | 97.0% |
| Single Unit, Attached | 0 | 0.0% |
| 2 Unit Apartments | 0 | 0.0% |
| 3 or 4 Unit Apartments | 0 | 0.0% |
| 5 to 9 Unit Apartments | 9 | 3.0% |
| 10 or more Apartments | 0 | 0.0% |
| Mobile Home / Other | 0 | 0.0% |
| Total | 298 | 100.0% |
Housing Structures by Occupancy in Etna
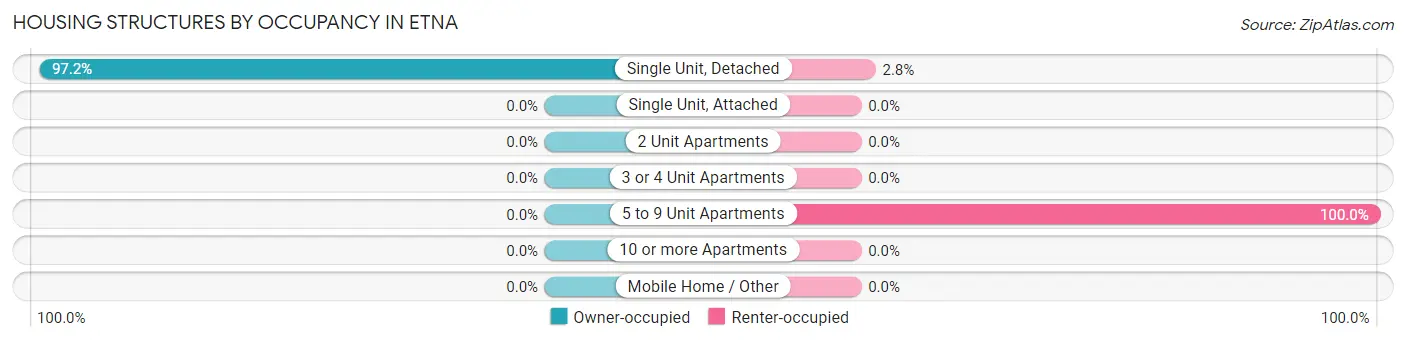
| Structure Type | Owner-occupied | Renter-occupied |
| Single Unit, Detached | 281 (97.2%) | 8 (2.8%) |
| Single Unit, Attached | 0 (0.0%) | 0 (0.0%) |
| 2 Unit Apartments | 0 (0.0%) | 0 (0.0%) |
| 3 or 4 Unit Apartments | 0 (0.0%) | 0 (0.0%) |
| 5 to 9 Unit Apartments | 0 (0.0%) | 9 (100.0%) |
| 10 or more Apartments | 0 (0.0%) | 0 (0.0%) |
| Mobile Home / Other | 0 (0.0%) | 0 (0.0%) |
| Total | 281 (94.3%) | 17 (5.7%) |
Housing Structures by Number of Rooms in Etna
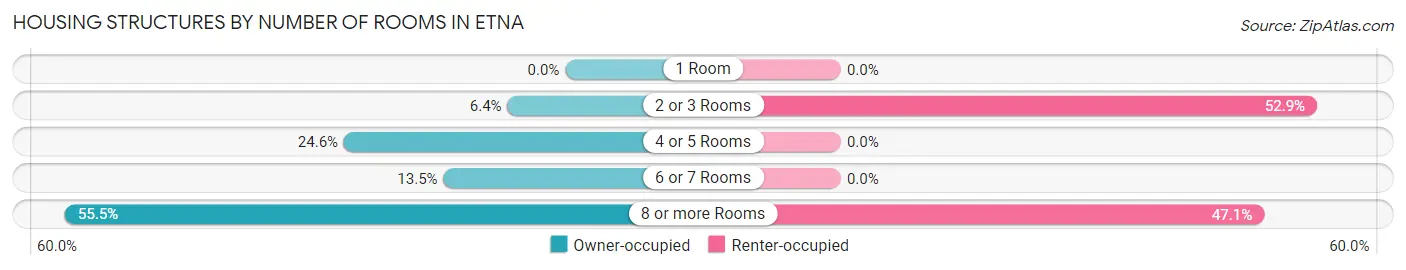
| Number of Rooms | Owner-occupied | Renter-occupied |
| 1 Room | 0 (0.0%) | 0 (0.0%) |
| 2 or 3 Rooms | 18 (6.4%) | 9 (52.9%) |
| 4 or 5 Rooms | 69 (24.6%) | 0 (0.0%) |
| 6 or 7 Rooms | 38 (13.5%) | 0 (0.0%) |
| 8 or more Rooms | 156 (55.5%) | 8 (47.1%) |
| Total | 281 (100.0%) | 17 (100.0%) |
Housing Structure by Heating Type in Etna
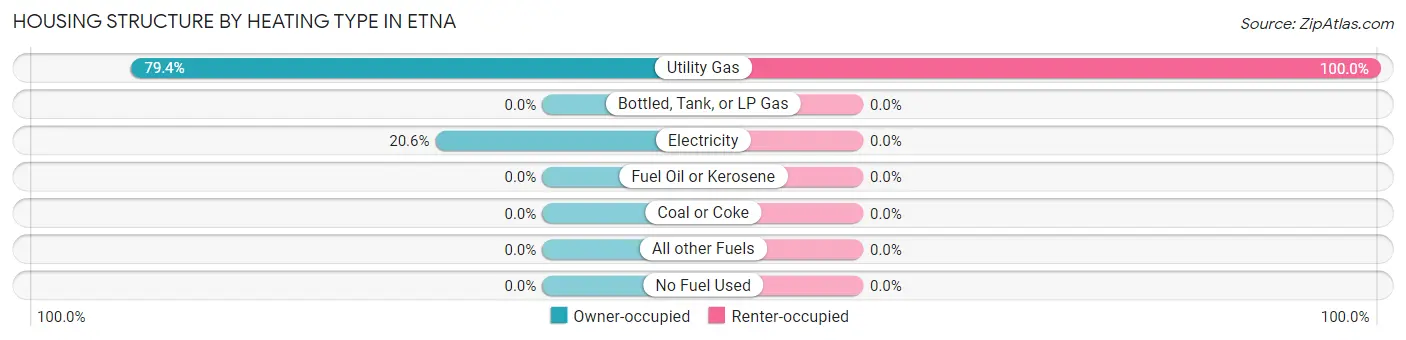
| Heating Type | Owner-occupied | Renter-occupied |
| Utility Gas | 223 (79.4%) | 17 (100.0%) |
| Bottled, Tank, or LP Gas | 0 (0.0%) | 0 (0.0%) |
| Electricity | 58 (20.6%) | 0 (0.0%) |
| Fuel Oil or Kerosene | 0 (0.0%) | 0 (0.0%) |
| Coal or Coke | 0 (0.0%) | 0 (0.0%) |
| All other Fuels | 0 (0.0%) | 0 (0.0%) |
| No Fuel Used | 0 (0.0%) | 0 (0.0%) |
| Total | 281 (100.0%) | 17 (100.0%) |
Household Vehicle Usage in Etna
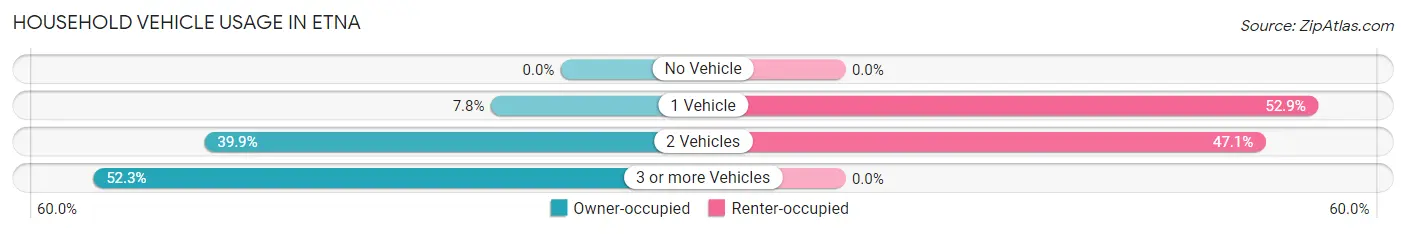
| Vehicles per Household | Owner-occupied | Renter-occupied |
| No Vehicle | 0 (0.0%) | 0 (0.0%) |
| 1 Vehicle | 22 (7.8%) | 9 (52.9%) |
| 2 Vehicles | 112 (39.9%) | 8 (47.1%) |
| 3 or more Vehicles | 147 (52.3%) | 0 (0.0%) |
| Total | 281 (100.0%) | 17 (100.0%) |
Real Estate & Mortgages in Etna
Real Estate and Mortgage Overview in Etna
| Characteristic | Without Mortgage | With Mortgage |
| Housing Units | 52 | 229 |
| Median Property Value | $234,200 | $248,500 |
| Median Household Income | - | - |
| Monthly Housing Costs | $525 | $0 |
| Real Estate Taxes | - | - |
Property Value by Mortgage Status in Etna
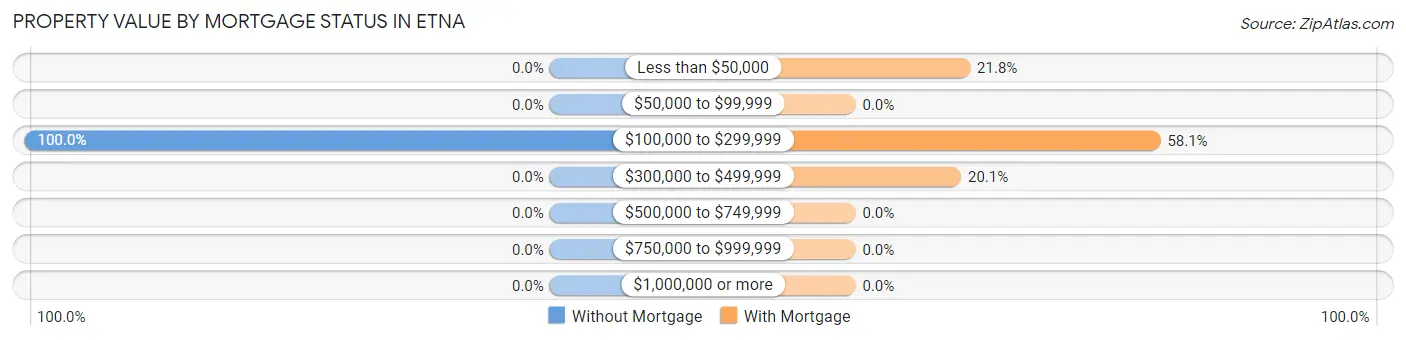
| Property Value | Without Mortgage | With Mortgage |
| Less than $50,000 | 0 (0.0%) | 50 (21.8%) |
| $50,000 to $99,999 | 0 (0.0%) | 0 (0.0%) |
| $100,000 to $299,999 | 52 (100.0%) | 133 (58.1%) |
| $300,000 to $499,999 | 0 (0.0%) | 46 (20.1%) |
| $500,000 to $749,999 | 0 (0.0%) | 0 (0.0%) |
| $750,000 to $999,999 | 0 (0.0%) | 0 (0.0%) |
| $1,000,000 or more | 0 (0.0%) | 0 (0.0%) |
| Total | 52 (100.0%) | 229 (100.0%) |
Household Income by Mortgage Status in Etna
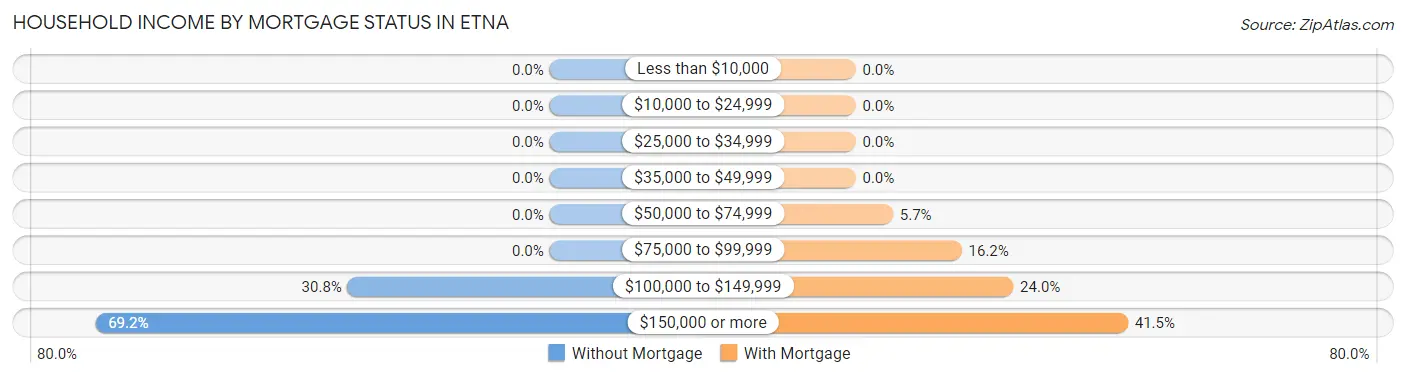
| Household Income | Without Mortgage | With Mortgage |
| Less than $10,000 | 0 (0.0%) | 0 (0.0%) |
| $10,000 to $24,999 | 0 (0.0%) | 0 (0.0%) |
| $25,000 to $34,999 | 0 (0.0%) | 0 (0.0%) |
| $35,000 to $49,999 | 0 (0.0%) | 0 (0.0%) |
| $50,000 to $74,999 | 0 (0.0%) | 13 (5.7%) |
| $75,000 to $99,999 | 0 (0.0%) | 37 (16.2%) |
| $100,000 to $149,999 | 16 (30.8%) | 55 (24.0%) |
| $150,000 or more | 36 (69.2%) | 95 (41.5%) |
| Total | 52 (100.0%) | 229 (100.0%) |
Property Value to Household Income Ratio in Etna
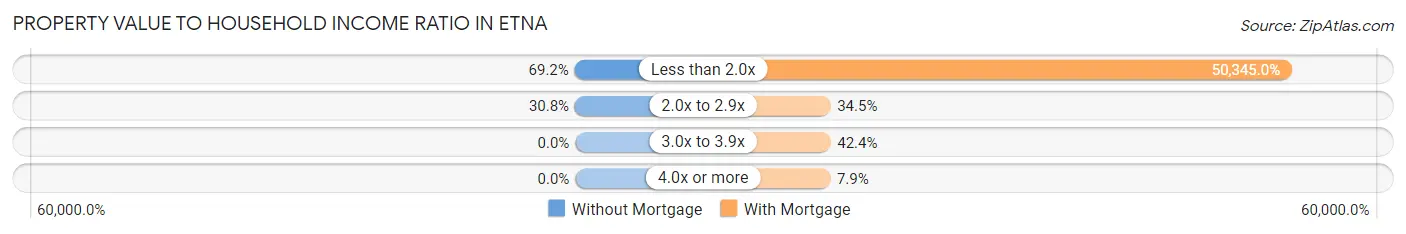
| Value-to-Income Ratio | Without Mortgage | With Mortgage |
| Less than 2.0x | 36 (69.2%) | 115,290 (50,345.0%) |
| 2.0x to 2.9x | 16 (30.8%) | 79 (34.5%) |
| 3.0x to 3.9x | 0 (0.0%) | 97 (42.4%) |
| 4.0x or more | 0 (0.0%) | 18 (7.9%) |
| Total | 52 (100.0%) | 229 (100.0%) |
Real Estate Taxes by Mortgage Status in Etna
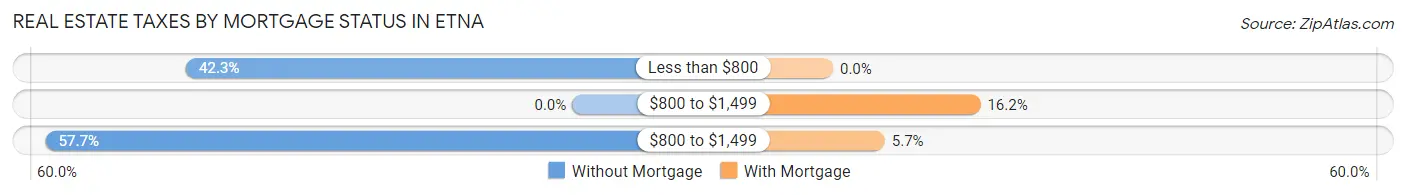
| Property Taxes | Without Mortgage | With Mortgage |
| Less than $800 | 22 (42.3%) | 0 (0.0%) |
| $800 to $1,499 | 0 (0.0%) | 37 (16.2%) |
| $800 to $1,499 | 30 (57.7%) | 13 (5.7%) |
| Total | 52 (100.0%) | 229 (100.0%) |
Health & Disability in Etna
Health Insurance Coverage by Age in Etna
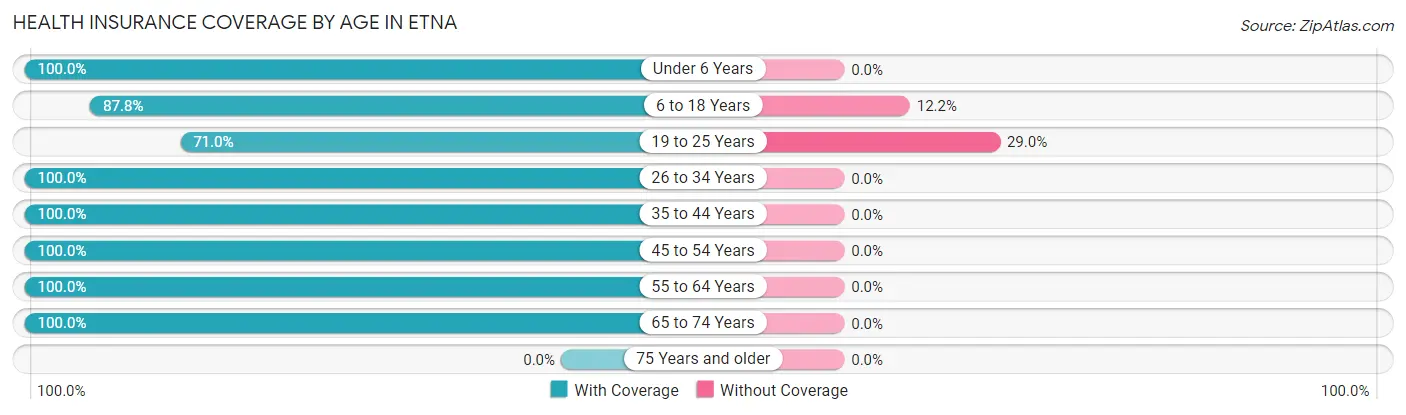
| Age Bracket | With Coverage | Without Coverage |
| Under 6 Years | 198 (100.0%) | 0 (0.0%) |
| 6 to 18 Years | 115 (87.8%) | 16 (12.2%) |
| 19 to 25 Years | 44 (71.0%) | 18 (29.0%) |
| 26 to 34 Years | 69 (100.0%) | 0 (0.0%) |
| 35 to 44 Years | 142 (100.0%) | 0 (0.0%) |
| 45 to 54 Years | 310 (100.0%) | 0 (0.0%) |
| 55 to 64 Years | 37 (100.0%) | 0 (0.0%) |
| 65 to 74 Years | 9 (100.0%) | 0 (0.0%) |
| 75 Years and older | 0 (0.0%) | 0 (0.0%) |
| Total | 924 (96.5%) | 34 (3.5%) |
Health Insurance Coverage by Citizenship Status in Etna
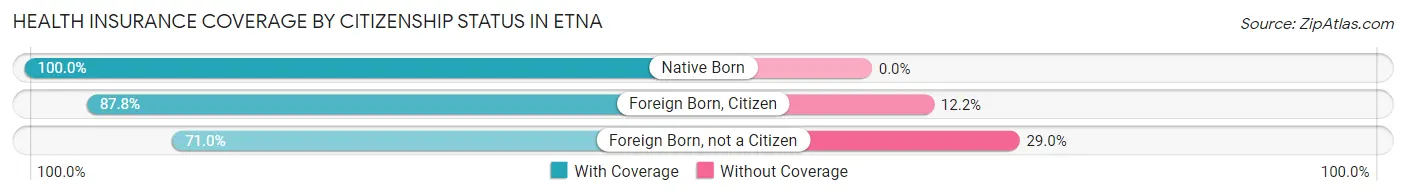
| Citizenship Status | With Coverage | Without Coverage |
| Native Born | 198 (100.0%) | 0 (0.0%) |
| Foreign Born, Citizen | 115 (87.8%) | 16 (12.2%) |
| Foreign Born, not a Citizen | 44 (71.0%) | 18 (29.0%) |
Health Insurance Coverage by Household Income in Etna
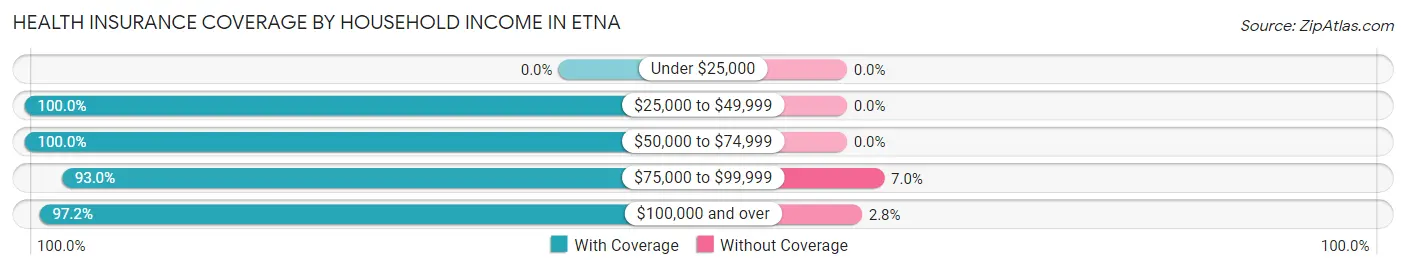
| Household Income | With Coverage | Without Coverage |
| Under $25,000 | 0 (0.0%) | 0 (0.0%) |
| $25,000 to $49,999 | 22 (100.0%) | 0 (0.0%) |
| $50,000 to $74,999 | 66 (100.0%) | 0 (0.0%) |
| $75,000 to $99,999 | 213 (93.0%) | 16 (7.0%) |
| $100,000 and over | 623 (97.2%) | 18 (2.8%) |
Public vs Private Health Insurance Coverage by Age in Etna
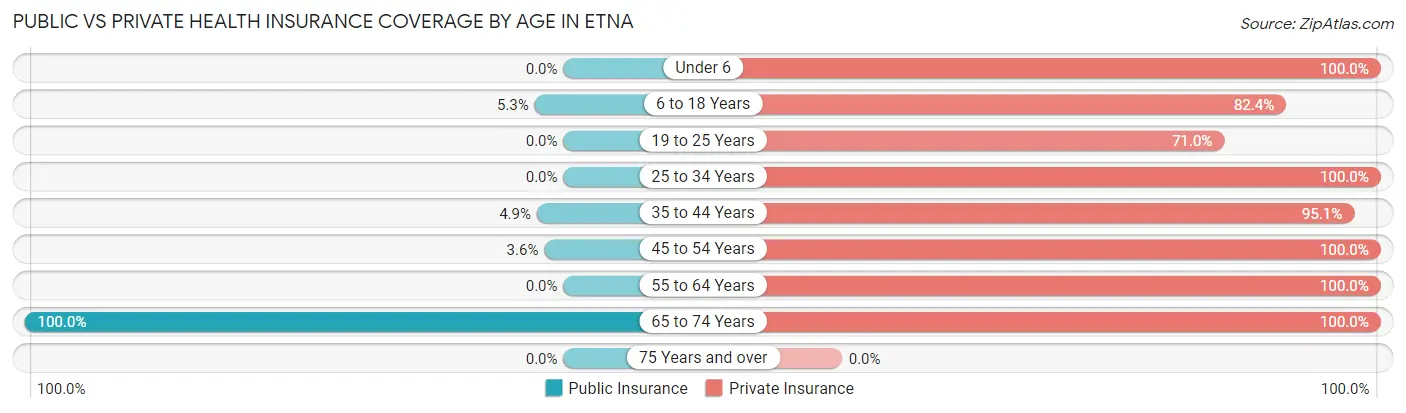
| Age Bracket | Public Insurance | Private Insurance |
| Under 6 | 0 (0.0%) | 198 (100.0%) |
| 6 to 18 Years | 7 (5.3%) | 108 (82.4%) |
| 19 to 25 Years | 0 (0.0%) | 44 (71.0%) |
| 25 to 34 Years | 0 (0.0%) | 69 (100.0%) |
| 35 to 44 Years | 7 (4.9%) | 135 (95.1%) |
| 45 to 54 Years | 11 (3.5%) | 310 (100.0%) |
| 55 to 64 Years | 0 (0.0%) | 37 (100.0%) |
| 65 to 74 Years | 9 (100.0%) | 9 (100.0%) |
| 75 Years and over | 0 (0.0%) | 0 (0.0%) |
| Total | 34 (3.5%) | 910 (95.0%) |
Disability Status by Sex by Age in Etna
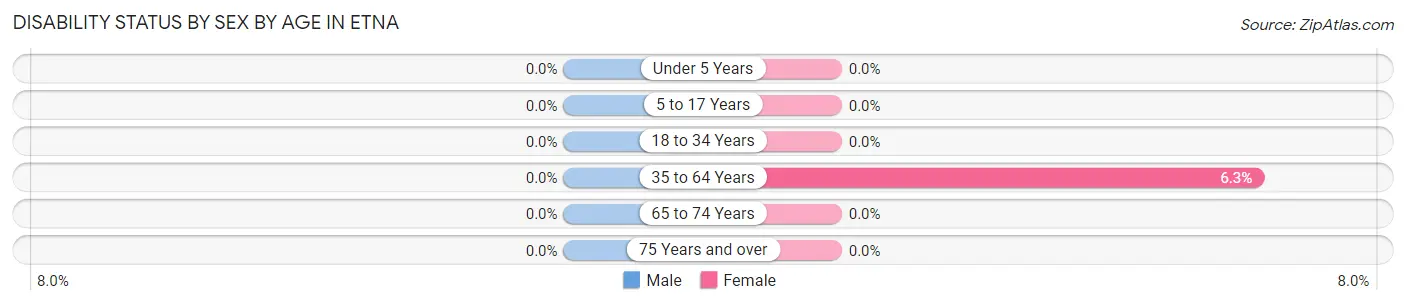
| Age Bracket | Male | Female |
| Under 5 Years | 0 (0.0%) | 0 (0.0%) |
| 5 to 17 Years | 0 (0.0%) | 0 (0.0%) |
| 18 to 34 Years | 0 (0.0%) | 0 (0.0%) |
| 35 to 64 Years | 0 (0.0%) | 16 (6.3%) |
| 65 to 74 Years | 0 (0.0%) | 0 (0.0%) |
| 75 Years and over | 0 (0.0%) | 0 (0.0%) |
Disability Class by Sex by Age in Etna
Disability Class: Hearing Difficulty
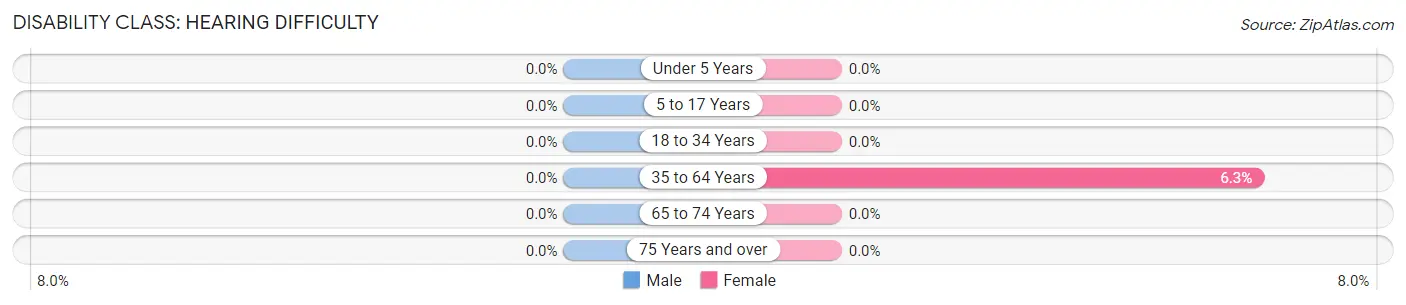
| Age Bracket | Male | Female |
| Under 5 Years | 0 (0.0%) | 0 (0.0%) |
| 5 to 17 Years | 0 (0.0%) | 0 (0.0%) |
| 18 to 34 Years | 0 (0.0%) | 0 (0.0%) |
| 35 to 64 Years | 0 (0.0%) | 16 (6.3%) |
| 65 to 74 Years | 0 (0.0%) | 0 (0.0%) |
| 75 Years and over | 0 (0.0%) | 0 (0.0%) |
Disability Class: Vision Difficulty
| Age Bracket | Male | Female |
| Under 5 Years | 0 (0.0%) | 0 (0.0%) |
| 5 to 17 Years | 0 (0.0%) | 0 (0.0%) |
| 18 to 34 Years | 0 (0.0%) | 0 (0.0%) |
| 35 to 64 Years | 0 (0.0%) | 0 (0.0%) |
| 65 to 74 Years | 0 (0.0%) | 0 (0.0%) |
| 75 Years and over | 0 (0.0%) | 0 (0.0%) |
Disability Class: Cognitive Difficulty
| Age Bracket | Male | Female |
| 5 to 17 Years | 0 (0.0%) | 0 (0.0%) |
| 18 to 34 Years | 0 (0.0%) | 0 (0.0%) |
| 35 to 64 Years | 0 (0.0%) | 0 (0.0%) |
| 65 to 74 Years | 0 (0.0%) | 0 (0.0%) |
| 75 Years and over | 0 (0.0%) | 0 (0.0%) |
Disability Class: Ambulatory Difficulty
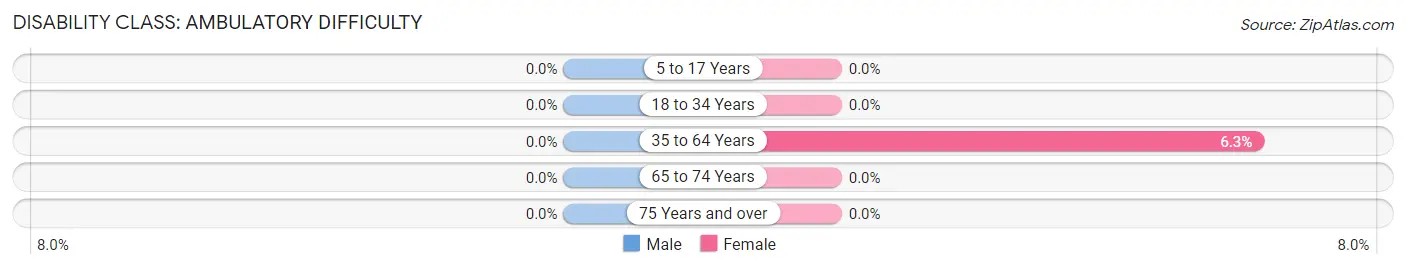
| Age Bracket | Male | Female |
| 5 to 17 Years | 0 (0.0%) | 0 (0.0%) |
| 18 to 34 Years | 0 (0.0%) | 0 (0.0%) |
| 35 to 64 Years | 0 (0.0%) | 16 (6.3%) |
| 65 to 74 Years | 0 (0.0%) | 0 (0.0%) |
| 75 Years and over | 0 (0.0%) | 0 (0.0%) |
Disability Class: Self-Care Difficulty
| Age Bracket | Male | Female |
| 5 to 17 Years | 0 (0.0%) | 0 (0.0%) |
| 18 to 34 Years | 0 (0.0%) | 0 (0.0%) |
| 35 to 64 Years | 0 (0.0%) | 0 (0.0%) |
| 65 to 74 Years | 0 (0.0%) | 0 (0.0%) |
| 75 Years and over | 0 (0.0%) | 0 (0.0%) |
Technology Access in Etna
Computing Device Access in Etna
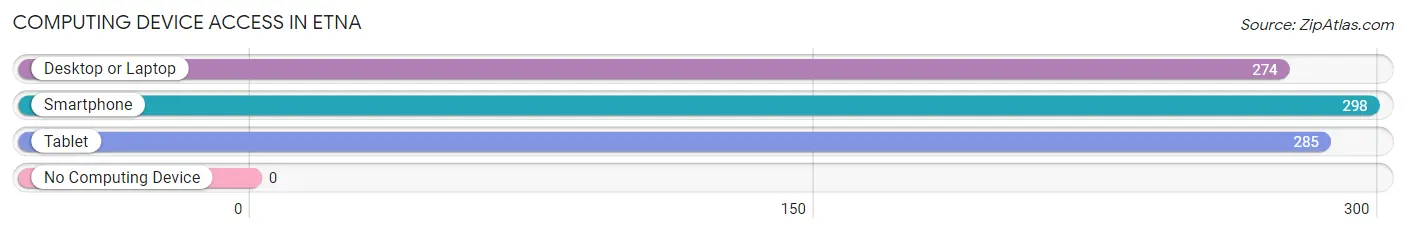
| Device Type | # Households | % Households |
| Desktop or Laptop | 274 | 91.9% |
| Smartphone | 298 | 100.0% |
| Tablet | 285 | 95.6% |
| No Computing Device | 0 | 0.0% |
| Total | 298 | 100.0% |
Internet Access in Etna
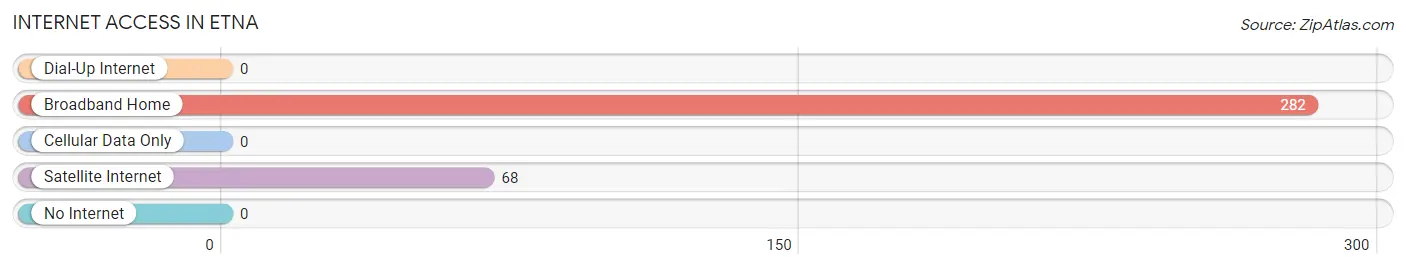
| Internet Type | # Households | % Households |
| Dial-Up Internet | 0 | 0.0% |
| Broadband Home | 282 | 94.6% |
| Cellular Data Only | 0 | 0.0% |
| Satellite Internet | 68 | 22.8% |
| No Internet | 0 | 0.0% |
| Total | 298 | 100.0% |
Etna Summary
Etna is a small village located in Licking County, Ohio, United States. The village is situated along the Licking River, approximately 10 miles east of Newark. The population of Etna was 1,845 at the 2010 census.
Geography
Etna is located at 40°3′17″N 82°25′17″W (40.054722, -82.421389). According to the United States Census Bureau, the village has a total area of 0.9 square miles (2.3 km2), all land.
History
Etna was founded in 1815 by a group of settlers from Pennsylvania. The village was named after the nearby Etna Furnace, which was named after Mount Etna in Sicily. The furnace was built in 1814 and was used to produce iron. The village grew rapidly in the 19th century, and by the early 20th century, it had become a thriving industrial center.
The village was home to several factories, including the Etna Iron and Steel Company, the Etna Glass Company, and the Etna Machine Works. The Etna Iron and Steel Company was the largest employer in the village, and it produced a variety of products, including nails, wire, and steel rods. The Etna Glass Company produced glass bottles and jars, while the Etna Machine Works produced a variety of machine parts.
The village also had several stores, including a general store, a drug store, and a hardware store. The village also had a post office, a bank, and a hotel.
Economy
Etna’s economy is largely based on manufacturing and agriculture. The village is home to several factories, including the Etna Iron and Steel Company, the Etna Glass Company, and the Etna Machine Works. The Etna Iron and Steel Company is the largest employer in the village, and it produces a variety of products, including nails, wire, and steel rods. The Etna Glass Company produces glass bottles and jars, while the Etna Machine Works produces a variety of machine parts.
The village also has several stores, including a general store, a drug store, and a hardware store. The village also has a post office, a bank, and a hotel.
Agriculture is also an important part of the local economy. The village is home to several farms, which produce a variety of crops, including corn, soybeans, and wheat.
Demographics
As of the 2010 census, the population of Etna was 1,845. The racial makeup of the village was 97.3% White, 0.7% African American, 0.2% Native American, 0.2% Asian, 0.2% from other races, and 1.6% from two or more races. Hispanic or Latino of any race were 0.7% of the population.
The median income for a household in the village was $41,250, and the median income for a family was $50,000. The per capita income for the village was $20,845. About 8.3% of families and 10.2% of the population were below the poverty line, including 14.3% of those under age 18 and 5.2% of those age 65 or over.
Common Questions
What is Per Capita Income in Etna?
Per Capita income in Etna is $40,790.
What is the Median Family Income in Etna?
Median Family Income in Etna is $115,976.
What is the Median Household income in Etna?
Median Household Income in Etna is $115,579.
What is Income or Wage Gap in Etna?
Income or Wage Gap in Etna is 25.1%.
Women in Etna earn 74.9 cents for every dollar earned by a man.
What is Inequality or Gini Index in Etna?
Inequality or Gini Index in Etna is 0.26.
What is the Total Population of Etna?
Total Population of Etna is 958.
What is the Total Male Population of Etna?
Total Male Population of Etna is 457.
What is the Total Female Population of Etna?
Total Female Population of Etna is 501.
What is the Ratio of Males per 100 Females in Etna?
There are 91.22 Males per 100 Females in Etna.
What is the Ratio of Females per 100 Males in Etna?
There are 109.63 Females per 100 Males in Etna.
What is the Median Population Age in Etna?
Median Population Age in Etna is 39.5 Years.
What is the Average Family Size in Etna
Average Family Size in Etna is 3.7 People.
What is the Average Household Size in Etna
Average Household Size in Etna is 3.2 People.
How Large is the Labor Force in Etna?
There are 537 People in the Labor Forcein in Etna.
What is the Percentage of People in the Labor Force in Etna?
84.4% of People are in the Labor Force in Etna.
What is the Unemployment Rate in Etna?
Unemployment Rate in Etna is 2.6%.