Hillsboro, OH Map & Demographics
Hillsboro Map
Hillsboro Overview
$24,490
PER CAPITA INCOME
$65,341
AVG FAMILY INCOME
$44,731
AVG HOUSEHOLD INCOME
33.8%
WAGE / INCOME GAP [ % ]
66.2¢/ $1
WAGE / INCOME GAP [ $ ]
$8,527
FAMILY INCOME DEFICIT
0.45
INEQUALITY / GINI INDEX
6,492
TOTAL POPULATION
2,911
MALE POPULATION
3,581
FEMALE POPULATION
81.29
MALES / 100 FEMALES
123.02
FEMALES / 100 MALES
41.2
MEDIAN AGE
2.9
AVG FAMILY SIZE
2.2
AVG HOUSEHOLD SIZE
2,742
LABOR FORCE [ PEOPLE ]
51.6%
PERCENT IN LABOR FORCE
5.0%
UNEMPLOYMENT RATE
Hillsboro Zip Codes
Hillsboro Area Codes
Income in Hillsboro
Income Overview in Hillsboro
Per Capita Income in Hillsboro is $24,490, while median incomes of families and households are $65,341 and $44,731 respectively.
| Characteristic | Number | Measure |
| Per Capita Income | 6,492 | $24,490 |
| Median Family Income | 1,541 | $65,341 |
| Mean Family Income | 1,541 | $74,323 |
| Median Household Income | 2,793 | $44,731 |
| Mean Household Income | 2,793 | $55,906 |
| Income Deficit | 1,541 | $8,527 |
| Wage / Income Gap (%) | 6,492 | 33.82% |
| Wage / Income Gap ($) | 6,492 | 66.18¢ per $1 |
| Gini / Inequality Index | 6,492 | 0.45 |
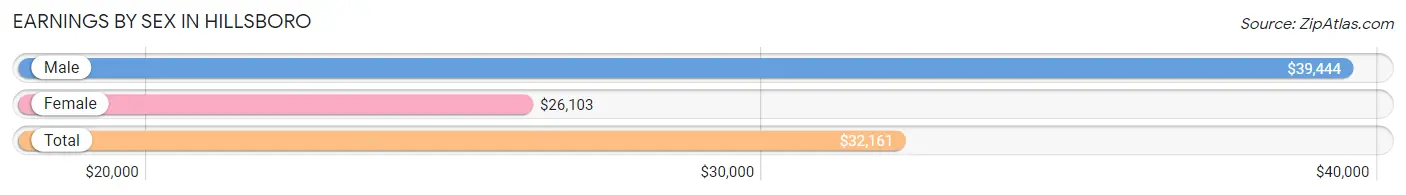
Earnings by Sex in Hillsboro
Average Earnings in Hillsboro are $32,161, $39,444 for men and $26,103 for women, a difference of 33.8%.
| Sex | Number | Average Earnings |
| Male | 1,408 (47.6%) | $39,444 |
| Female | 1,552 (52.4%) | $26,103 |
| Total | 2,960 (100.0%) | $32,161 |
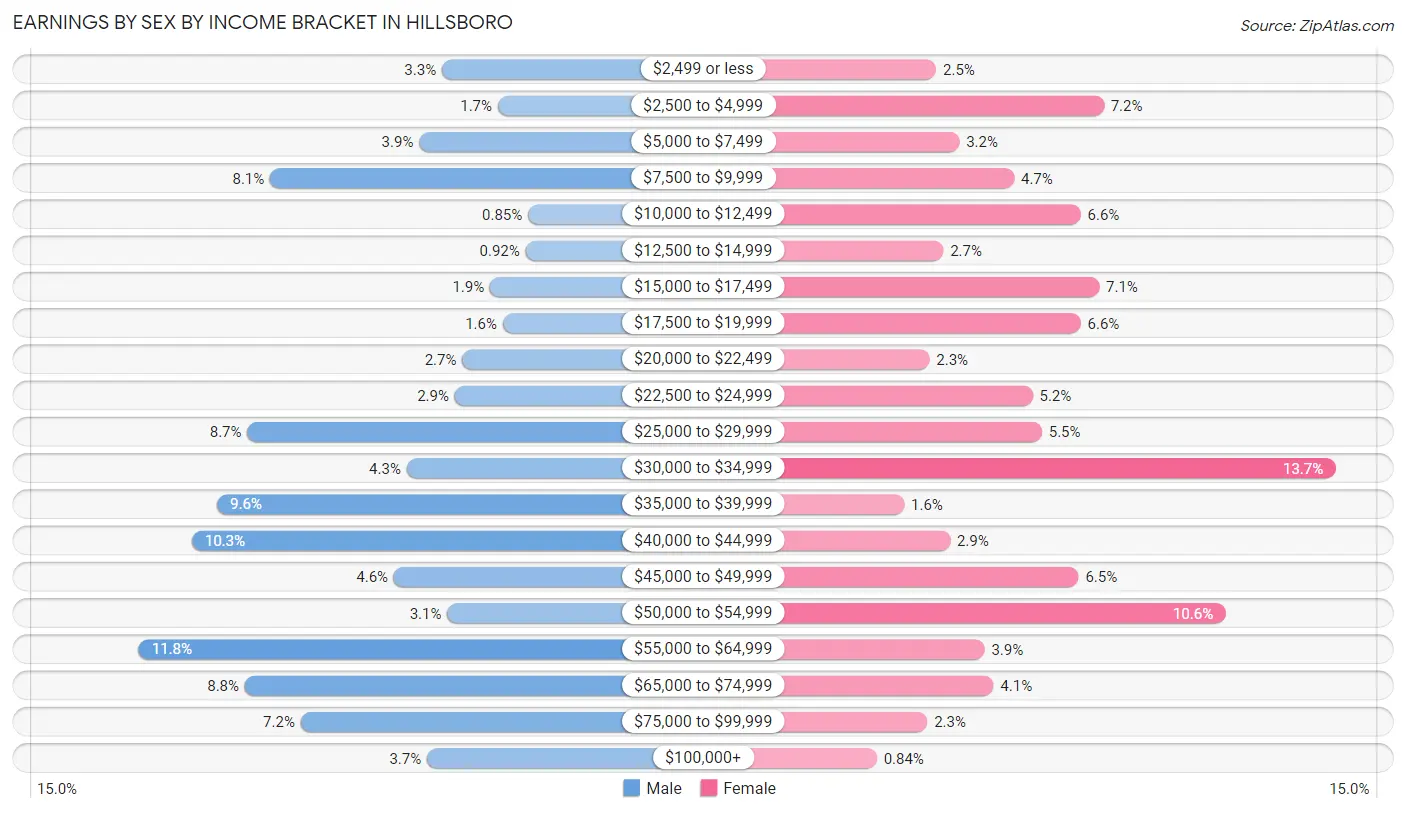
Earnings by Sex by Income Bracket in Hillsboro
The most common earnings brackets in Hillsboro are $55,000 to $64,999 for men (166 | 11.8%) and $30,000 to $34,999 for women (213 | 13.7%).
| Income | Male | Female |
| $2,499 or less | 46 (3.3%) | 39 (2.5%) |
| $2,500 to $4,999 | 24 (1.7%) | 112 (7.2%) |
| $5,000 to $7,499 | 55 (3.9%) | 49 (3.2%) |
| $7,500 to $9,999 | 114 (8.1%) | 73 (4.7%) |
| $10,000 to $12,499 | 12 (0.9%) | 102 (6.6%) |
| $12,500 to $14,999 | 13 (0.9%) | 42 (2.7%) |
| $15,000 to $17,499 | 27 (1.9%) | 110 (7.1%) |
| $17,500 to $19,999 | 22 (1.6%) | 102 (6.6%) |
| $20,000 to $22,499 | 38 (2.7%) | 36 (2.3%) |
| $22,500 to $24,999 | 41 (2.9%) | 81 (5.2%) |
| $25,000 to $29,999 | 123 (8.7%) | 85 (5.5%) |
| $30,000 to $34,999 | 60 (4.3%) | 213 (13.7%) |
| $35,000 to $39,999 | 135 (9.6%) | 25 (1.6%) |
| $40,000 to $44,999 | 145 (10.3%) | 45 (2.9%) |
| $45,000 to $49,999 | 65 (4.6%) | 101 (6.5%) |
| $50,000 to $54,999 | 44 (3.1%) | 165 (10.6%) |
| $55,000 to $64,999 | 166 (11.8%) | 60 (3.9%) |
| $65,000 to $74,999 | 124 (8.8%) | 64 (4.1%) |
| $75,000 to $99,999 | 102 (7.2%) | 35 (2.3%) |
| $100,000+ | 52 (3.7%) | 13 (0.8%) |
| Total | 1,408 (100.0%) | 1,552 (100.0%) |
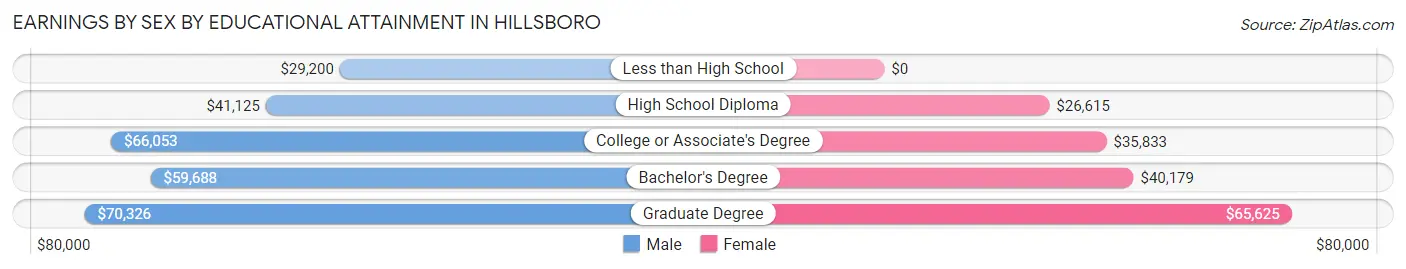
Earnings by Sex by Educational Attainment in Hillsboro
Average earnings in Hillsboro are $44,722 for men and $31,002 for women, a difference of 30.7%. Men with an educational attainment of graduate degree enjoy the highest average annual earnings of $70,326, while those with less than high school education earn the least with $29,200. Women with an educational attainment of graduate degree earn the most with the average annual earnings of $65,625, while those with high school diploma education have the smallest earnings of $26,615.
| Educational Attainment | Male Income | Female Income |
| Less than High School | $29,200 | $0 |
| High School Diploma | $41,125 | $26,615 |
| College or Associate's Degree | $66,053 | $35,833 |
| Bachelor's Degree | $59,688 | $40,179 |
| Graduate Degree | $70,326 | $65,625 |
| Total | $44,722 | $31,002 |
Family Income in Hillsboro
Family Income Brackets in Hillsboro
According to the Hillsboro family income data, there are 331 families falling into the $50,000 to $74,999 income range, which is the most common income bracket and makes up 21.5% of all families. Conversely, the $200,000+ income bracket is the least frequent group with only 46 families (3.0%) belonging to this category.
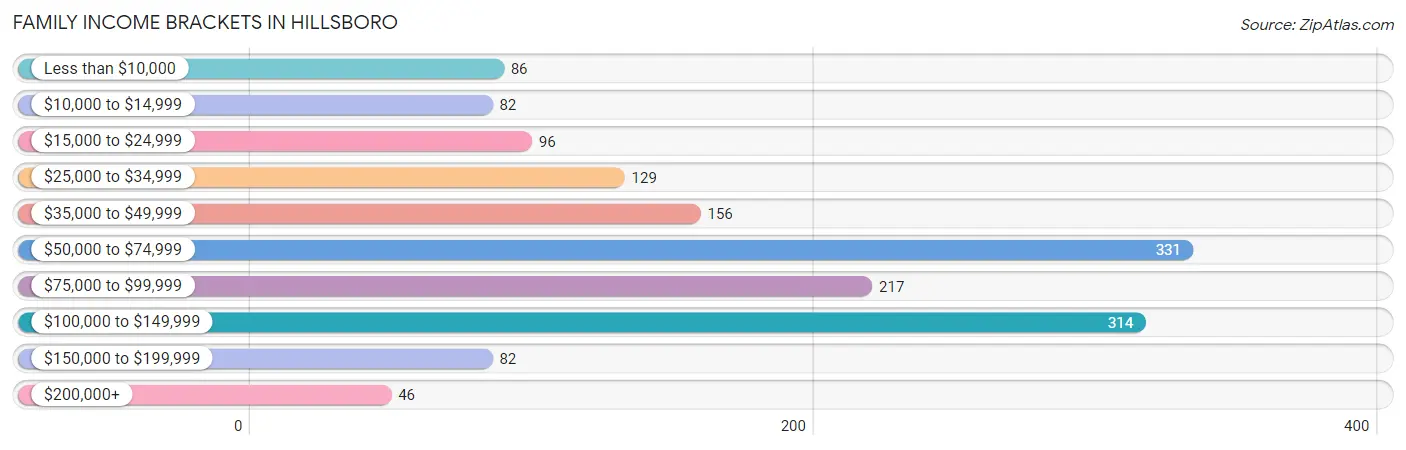
| Income Bracket | # Families | % Families |
| Less than $10,000 | 86 | 5.6% |
| $10,000 to $14,999 | 82 | 5.3% |
| $15,000 to $24,999 | 96 | 6.2% |
| $25,000 to $34,999 | 129 | 8.4% |
| $35,000 to $49,999 | 156 | 10.1% |
| $50,000 to $74,999 | 331 | 21.5% |
| $75,000 to $99,999 | 217 | 14.1% |
| $100,000 to $149,999 | 314 | 20.4% |
| $150,000 to $199,999 | 82 | 5.3% |
| $200,000+ | 46 | 3.0% |
Family Income by Famaliy Size in Hillsboro
7+ person families (33 | 2.1%) account for the highest median family income in Hillsboro with $164,276 per family, while 2-person families (777 | 50.4%) have the highest median income of $35,312 per family member.
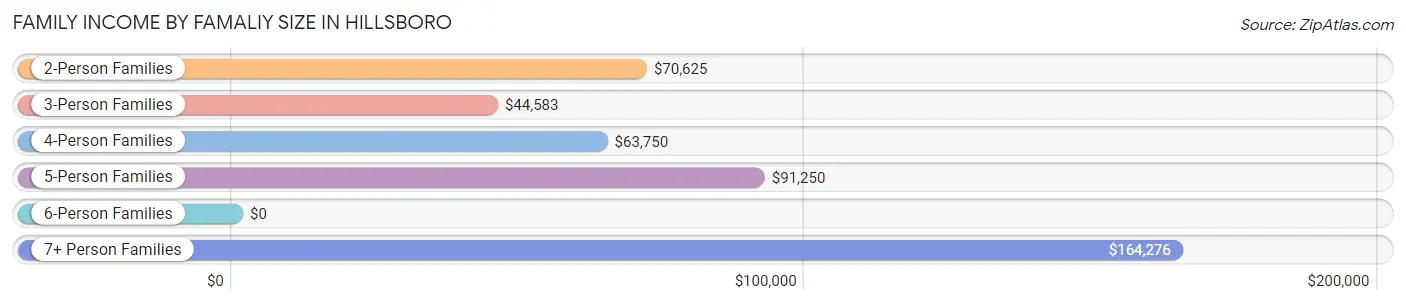
| Income Bracket | # Families | Median Income |
| 2-Person Families | 777 (50.4%) | $70,625 |
| 3-Person Families | 376 (24.4%) | $44,583 |
| 4-Person Families | 213 (13.8%) | $63,750 |
| 5-Person Families | 131 (8.5%) | $91,250 |
| 6-Person Families | 11 (0.7%) | $0 |
| 7+ Person Families | 33 (2.1%) | $164,276 |
| Total | 1,541 (100.0%) | $65,341 |
Family Income by Number of Earners in Hillsboro
The median family income in Hillsboro is $65,341, with families comprising 3+ earners (106) having the highest median family income of $163,289, while families with 1 earner (504) have the lowest median family income of $50,125, accounting for 6.9% and 32.7% of families, respectively.
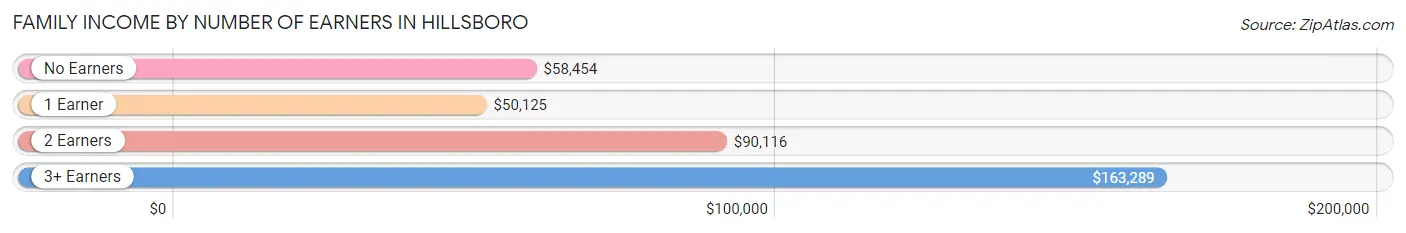
| Number of Earners | # Families | Median Income |
| No Earners | 373 (24.2%) | $58,454 |
| 1 Earner | 504 (32.7%) | $50,125 |
| 2 Earners | 558 (36.2%) | $90,116 |
| 3+ Earners | 106 (6.9%) | $163,289 |
| Total | 1,541 (100.0%) | $65,341 |
Household Income in Hillsboro
Household Income Brackets in Hillsboro
With 503 households falling in the category, the $50,000 to $74,999 income range is the most frequent in Hillsboro, accounting for 18.0% of all households. In contrast, only 45 households (1.6%) fall into the $200,000+ income bracket, making it the least populous group.
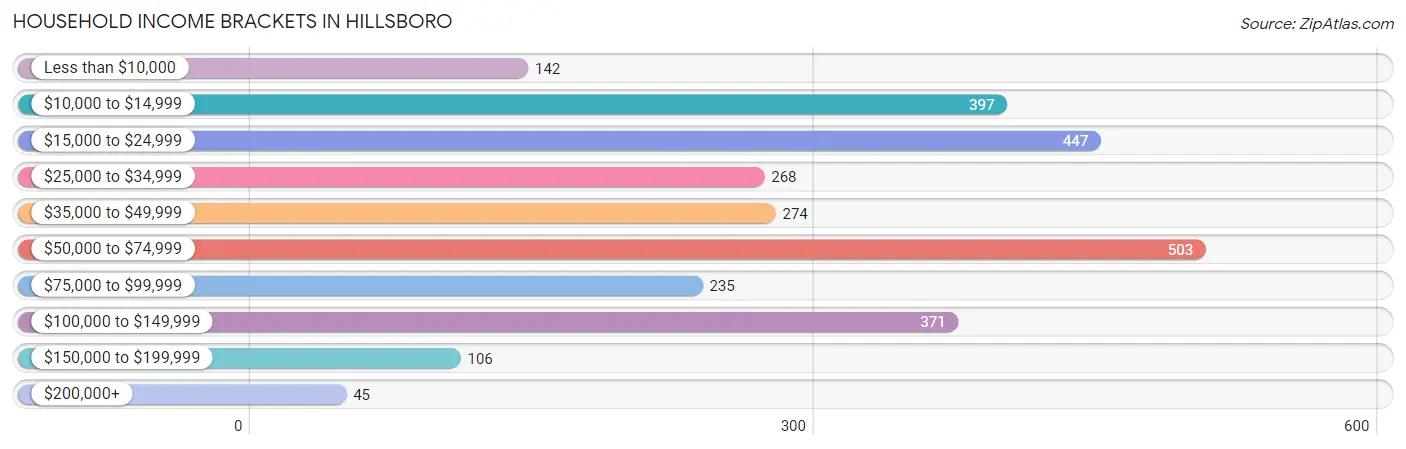
| Income Bracket | # Households | % Households |
| Less than $10,000 | 142 | 5.1% |
| $10,000 to $14,999 | 397 | 14.2% |
| $15,000 to $24,999 | 447 | 16.0% |
| $25,000 to $34,999 | 268 | 9.6% |
| $35,000 to $49,999 | 274 | 9.8% |
| $50,000 to $74,999 | 503 | 18.0% |
| $75,000 to $99,999 | 235 | 8.4% |
| $100,000 to $149,999 | 371 | 13.3% |
| $150,000 to $199,999 | 106 | 3.8% |
| $200,000+ | 45 | 1.6% |
Household Income by Householder Age in Hillsboro
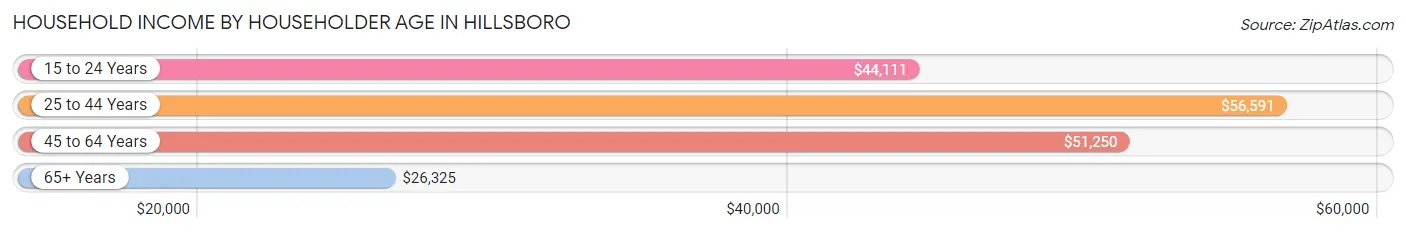
The median household income in Hillsboro is $44,731, with the highest median household income of $56,591 found in the 25 to 44 years age bracket for the primary householder. A total of 666 households (23.8%) fall into this category. Meanwhile, the 65+ years age bracket for the primary householder has the lowest median household income of $26,325, with 998 households (35.7%) in this group.
| Income Bracket | # Households | Median Income |
| 15 to 24 Years | 204 (7.3%) | $44,111 |
| 25 to 44 Years | 666 (23.8%) | $56,591 |
| 45 to 64 Years | 925 (33.1%) | $51,250 |
| 65+ Years | 998 (35.7%) | $26,325 |
| Total | 2,793 (100.0%) | $44,731 |
Poverty in Hillsboro
Income Below Poverty by Sex and Age in Hillsboro
With 18.3% poverty level for males and 27.0% for females among the residents of Hillsboro, 16 and 17 year old males and 16 and 17 year old females are the most vulnerable to poverty, with 57 males (63.3%) and 48 females (60.8%) in their respective age groups living below the poverty level.
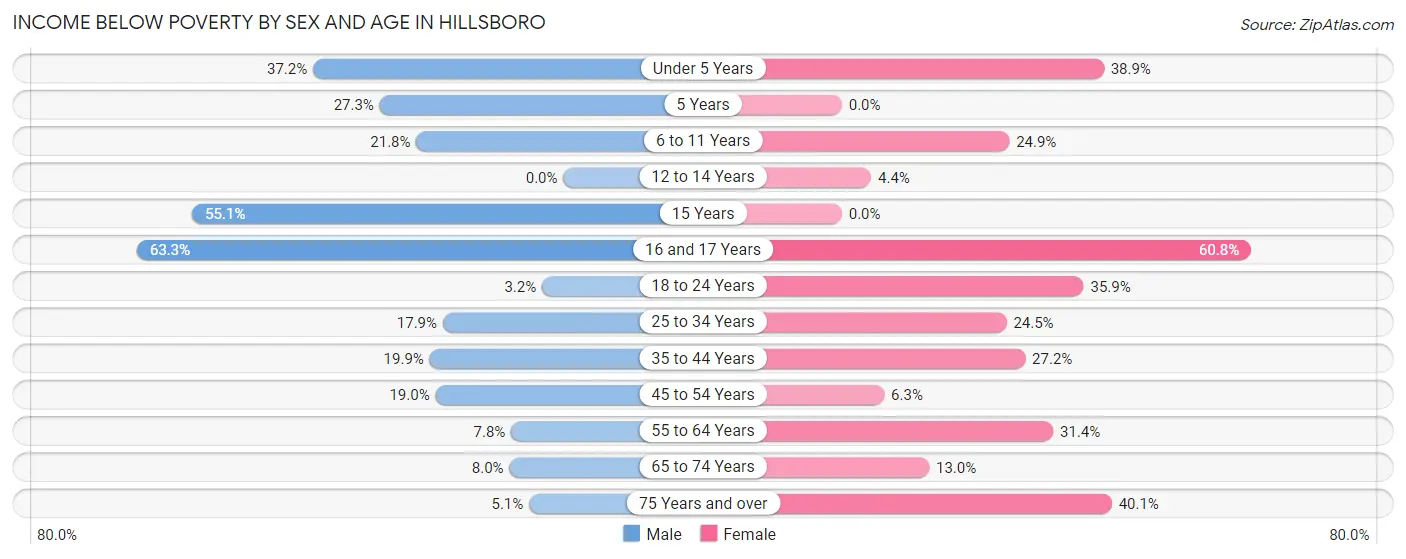
| Age Bracket | Male | Female |
| Under 5 Years | 100 (37.2%) | 56 (38.9%) |
| 5 Years | 3 (27.3%) | 0 (0.0%) |
| 6 to 11 Years | 43 (21.8%) | 46 (24.9%) |
| 12 to 14 Years | 0 (0.0%) | 4 (4.3%) |
| 15 Years | 59 (55.1%) | 0 (0.0%) |
| 16 and 17 Years | 57 (63.3%) | 48 (60.8%) |
| 18 to 24 Years | 10 (3.2%) | 149 (35.9%) |
| 25 to 34 Years | 61 (17.9%) | 78 (24.4%) |
| 35 to 44 Years | 52 (19.9%) | 107 (27.2%) |
| 45 to 54 Years | 60 (19.0%) | 21 (6.3%) |
| 55 to 64 Years | 21 (7.7%) | 150 (31.4%) |
| 65 to 74 Years | 31 (8.0%) | 39 (13.0%) |
| 75 Years and over | 6 (5.1%) | 210 (40.1%) |
| Total | 503 (18.3%) | 908 (27.0%) |
Income Above Poverty by Sex and Age in Hillsboro
According to the poverty statistics in Hillsboro, males aged 12 to 14 years and females aged 5 years are the age groups that are most secure financially, with 100.0% of males and 100.0% of females in these age groups living above the poverty line.
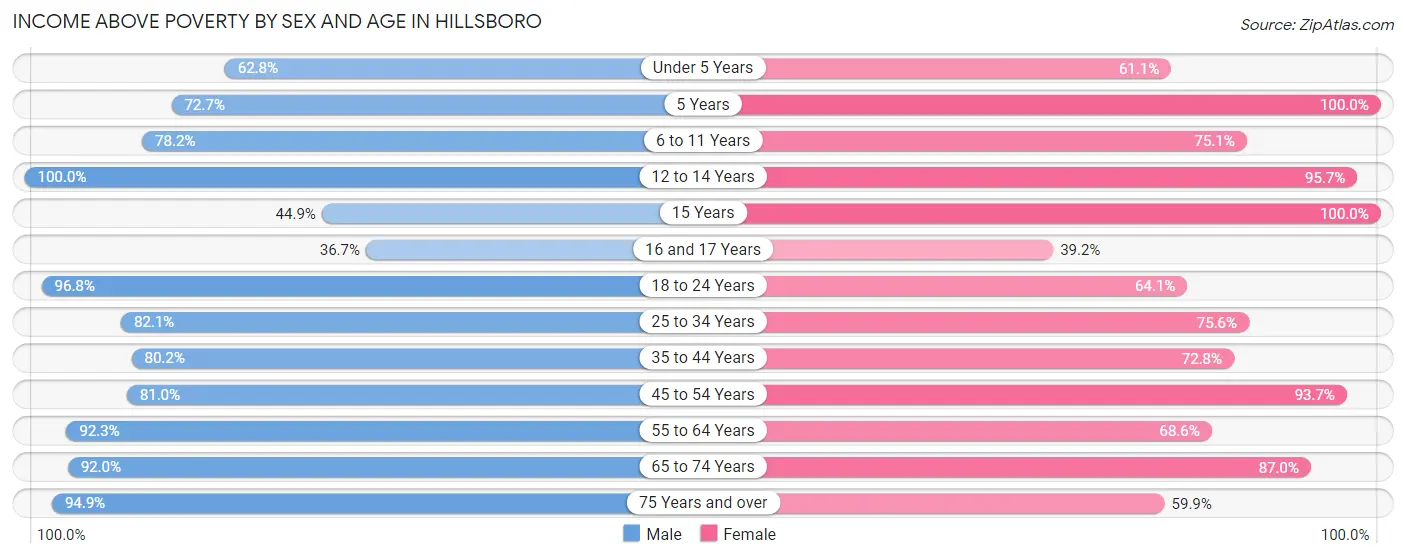
| Age Bracket | Male | Female |
| Under 5 Years | 169 (62.8%) | 88 (61.1%) |
| 5 Years | 8 (72.7%) | 63 (100.0%) |
| 6 to 11 Years | 154 (78.2%) | 139 (75.1%) |
| 12 to 14 Years | 59 (100.0%) | 88 (95.7%) |
| 15 Years | 48 (44.9%) | 36 (100.0%) |
| 16 and 17 Years | 33 (36.7%) | 31 (39.2%) |
| 18 to 24 Years | 306 (96.8%) | 266 (64.1%) |
| 25 to 34 Years | 280 (82.1%) | 241 (75.5%) |
| 35 to 44 Years | 210 (80.1%) | 286 (72.8%) |
| 45 to 54 Years | 256 (81.0%) | 313 (93.7%) |
| 55 to 64 Years | 250 (92.2%) | 328 (68.6%) |
| 65 to 74 Years | 356 (92.0%) | 262 (87.0%) |
| 75 Years and over | 112 (94.9%) | 314 (59.9%) |
| Total | 2,241 (81.7%) | 2,455 (73.0%) |
Income Below Poverty Among Married-Couple Families in Hillsboro
The poverty statistics for married-couple families in Hillsboro show that 3.7% or 36 of the total 976 families live below the poverty line. Families with 3 or 4 children have the highest poverty rate of 15.9%, comprising of 7 families. On the other hand, families with no children have the lowest poverty rate of 0.7%, which includes 5 families.
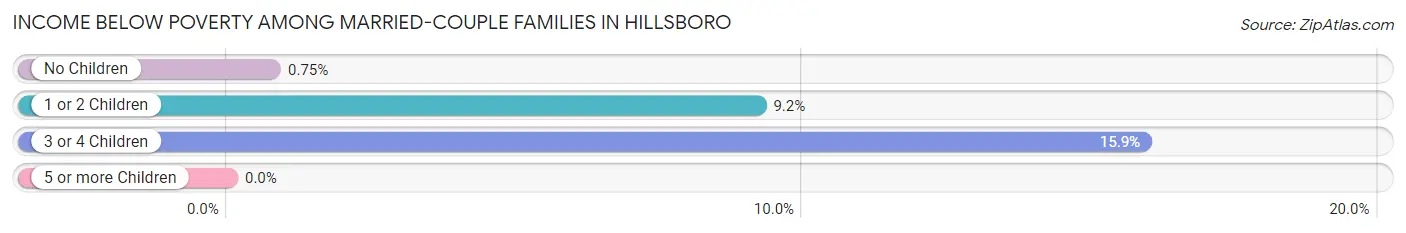
| Children | Above Poverty | Below Poverty |
| No Children | 666 (99.3%) | 5 (0.7%) |
| 1 or 2 Children | 237 (90.8%) | 24 (9.2%) |
| 3 or 4 Children | 37 (84.1%) | 7 (15.9%) |
| 5 or more Children | 0 (0.0%) | 0 (0.0%) |
| Total | 940 (96.3%) | 36 (3.7%) |
Income Below Poverty Among Single-Parent Households in Hillsboro
According to the poverty data in Hillsboro, 19.9% or 36 single-father households and 54.9% or 211 single-mother households are living below the poverty line. Among single-father households, those with 3 or 4 children have the highest poverty rate, with 29 households (74.4%) experiencing poverty. Likewise, among single-mother households, those with 1 or 2 children have the highest poverty rate, with 152 households (74.9%) falling below the poverty line.
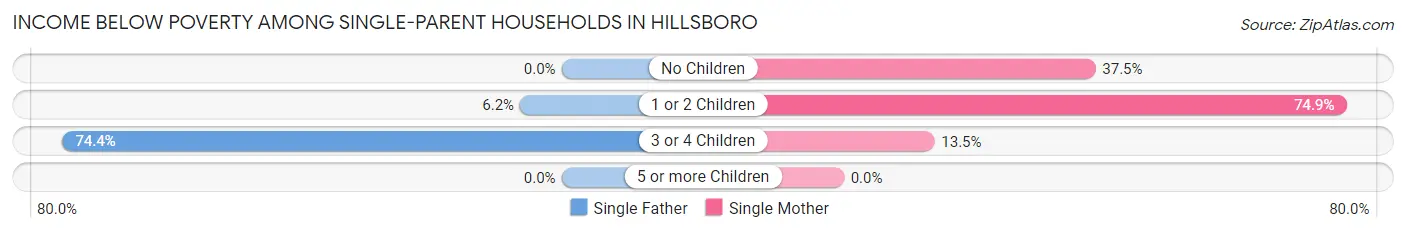
| Children | Single Father | Single Mother |
| No Children | 0 (0.0%) | 54 (37.5%) |
| 1 or 2 Children | 7 (6.2%) | 152 (74.9%) |
| 3 or 4 Children | 29 (74.4%) | 5 (13.5%) |
| 5 or more Children | 0 (0.0%) | 0 (0.0%) |
| Total | 36 (19.9%) | 211 (54.9%) |
Income Below Poverty Among Married-Couple vs Single-Parent Households in Hillsboro
The poverty data for Hillsboro shows that 36 of the married-couple family households (3.7%) and 247 of the single-parent households (43.7%) are living below the poverty level. Within the married-couple family households, those with 3 or 4 children have the highest poverty rate, with 7 households (15.9%) falling below the poverty line. Among the single-parent households, those with 1 or 2 children have the highest poverty rate, with 159 household (50.3%) living below poverty.
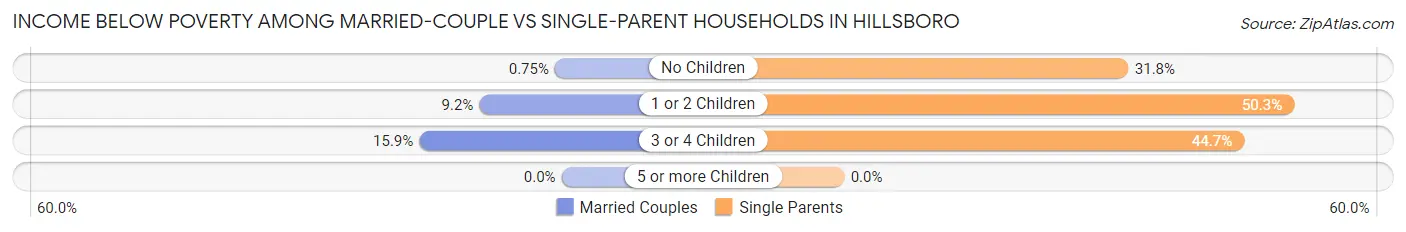
| Children | Married-Couple Families | Single-Parent Households |
| No Children | 5 (0.7%) | 54 (31.8%) |
| 1 or 2 Children | 24 (9.2%) | 159 (50.3%) |
| 3 or 4 Children | 7 (15.9%) | 34 (44.7%) |
| 5 or more Children | 0 (0.0%) | 0 (0.0%) |
| Total | 36 (3.7%) | 247 (43.7%) |
Race in Hillsboro
The most populous races in Hillsboro are White / Caucasian (5,865 | 90.3%), Black / African American (329 | 5.1%), and Two or more Races (209 | 3.2%).
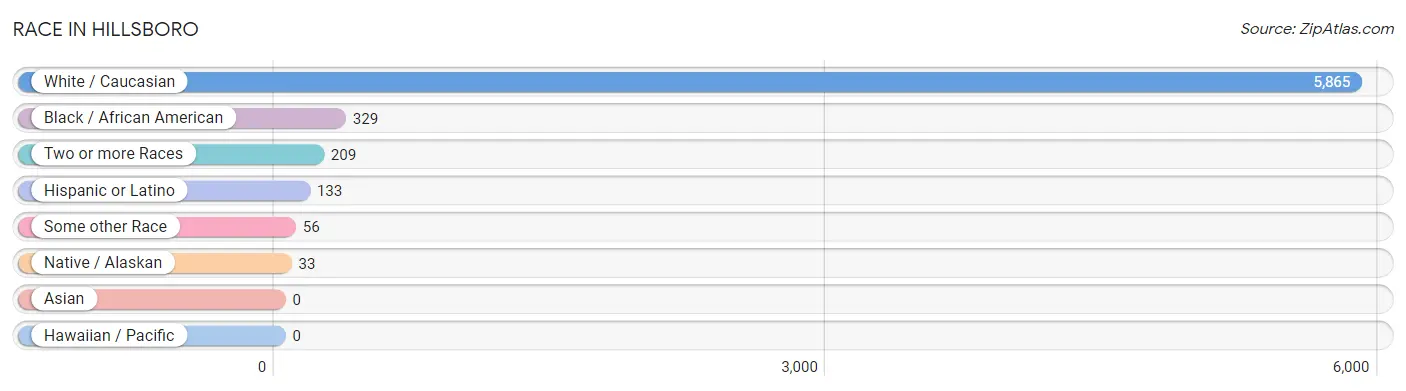
| Race | # Population | % Population |
| Asian | 0 | 0.0% |
| Black / African American | 329 | 5.1% |
| Hawaiian / Pacific | 0 | 0.0% |
| Hispanic or Latino | 133 | 2.1% |
| Native / Alaskan | 33 | 0.5% |
| White / Caucasian | 5,865 | 90.3% |
| Two or more Races | 209 | 3.2% |
| Some other Race | 56 | 0.9% |
| Total | 6,492 | 100.0% |
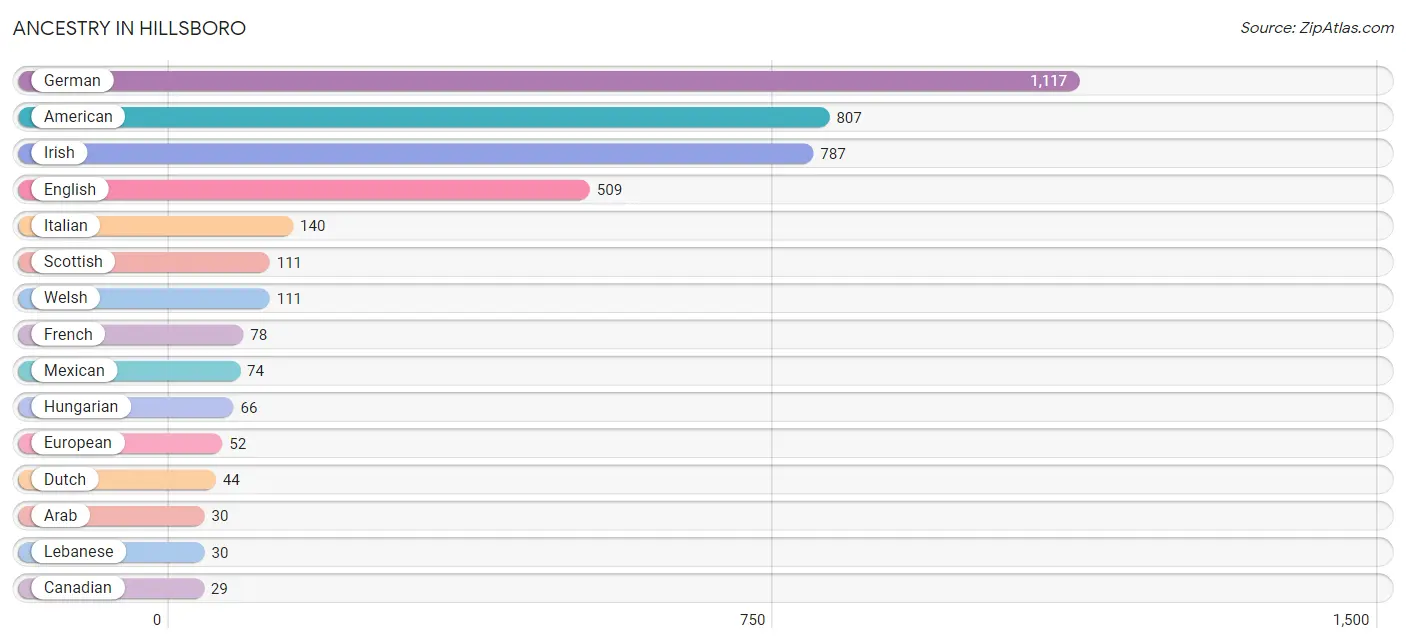
Ancestry in Hillsboro
The most populous ancestries reported in Hillsboro are German (1,117 | 17.2%), American (807 | 12.4%), Irish (787 | 12.1%), English (509 | 7.8%), and Italian (140 | 2.2%), together accounting for 51.8% of all Hillsboro residents.
| Ancestry | # Population | % Population |
| American | 807 | 12.4% |
| Arab | 30 | 0.5% |
| Blackfeet | 19 | 0.3% |
| British | 23 | 0.4% |
| Canadian | 29 | 0.4% |
| Cherokee | 29 | 0.4% |
| Crow | 24 | 0.4% |
| Dutch | 44 | 0.7% |
| English | 509 | 7.8% |
| European | 52 | 0.8% |
| French | 78 | 1.2% |
| French Canadian | 7 | 0.1% |
| German | 1,117 | 17.2% |
| Hungarian | 66 | 1.0% |
| Irish | 787 | 12.1% |
| Iroquois | 3 | 0.1% |
| Italian | 140 | 2.2% |
| Lebanese | 30 | 0.5% |
| Mexican | 74 | 1.1% |
| Navajo | 3 | 0.1% |
| Norwegian | 6 | 0.1% |
| Pakistani | 3 | 0.1% |
| Peruvian | 11 | 0.2% |
| Polish | 10 | 0.2% |
| Puerto Rican | 18 | 0.3% |
| Romanian | 5 | 0.1% |
| Russian | 2 | 0.0% |
| Scotch-Irish | 5 | 0.1% |
| Scottish | 111 | 1.7% |
| Sioux | 3 | 0.1% |
| South American | 11 | 0.2% |
| Spanish | 6 | 0.1% |
| Welsh | 111 | 1.7% | View All 33 Rows |
Immigrants in Hillsboro
The most numerous immigrant groups reported in Hillsboro came from Canada (29 | 0.4%), Europe (17 | 0.3%), Latin America (11 | 0.2%), Peru (11 | 0.2%), and South America (11 | 0.2%), together accounting for 1.2% of all Hillsboro residents.
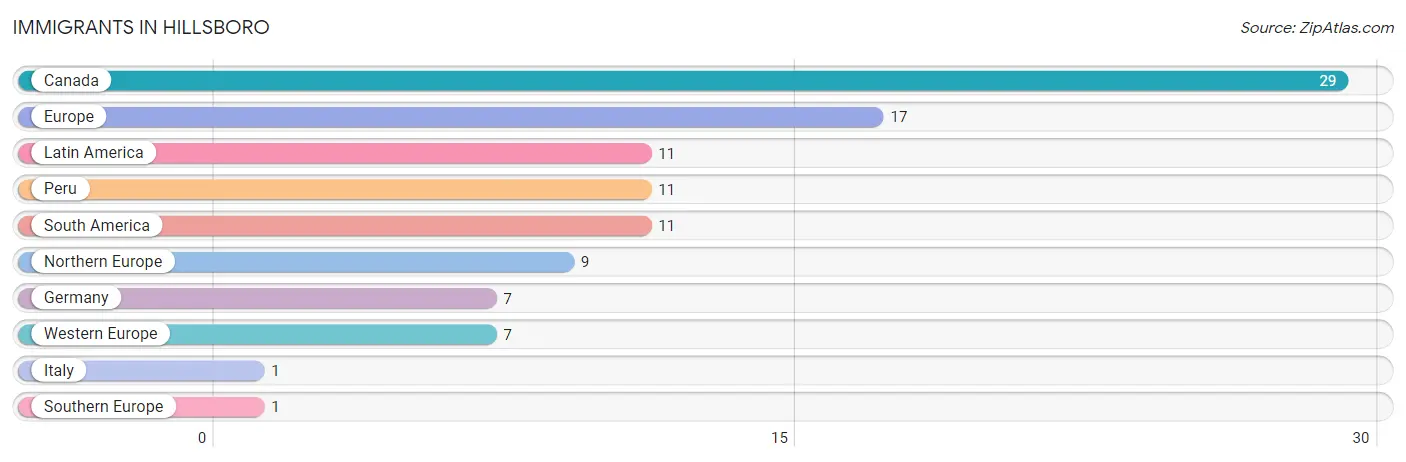
| Immigration Origin | # Population | % Population |
| Canada | 29 | 0.4% |
| Europe | 17 | 0.3% |
| Germany | 7 | 0.1% |
| Italy | 1 | 0.0% |
| Latin America | 11 | 0.2% |
| Northern Europe | 9 | 0.1% |
| Peru | 11 | 0.2% |
| South America | 11 | 0.2% |
| Southern Europe | 1 | 0.0% |
| Western Europe | 7 | 0.1% | View All 10 Rows |
Sex and Age in Hillsboro
Sex and Age in Hillsboro
The most populous age groups in Hillsboro are 15 to 19 Years (275 | 9.5%) for men and 60 to 64 Years (390 | 10.9%) for women.
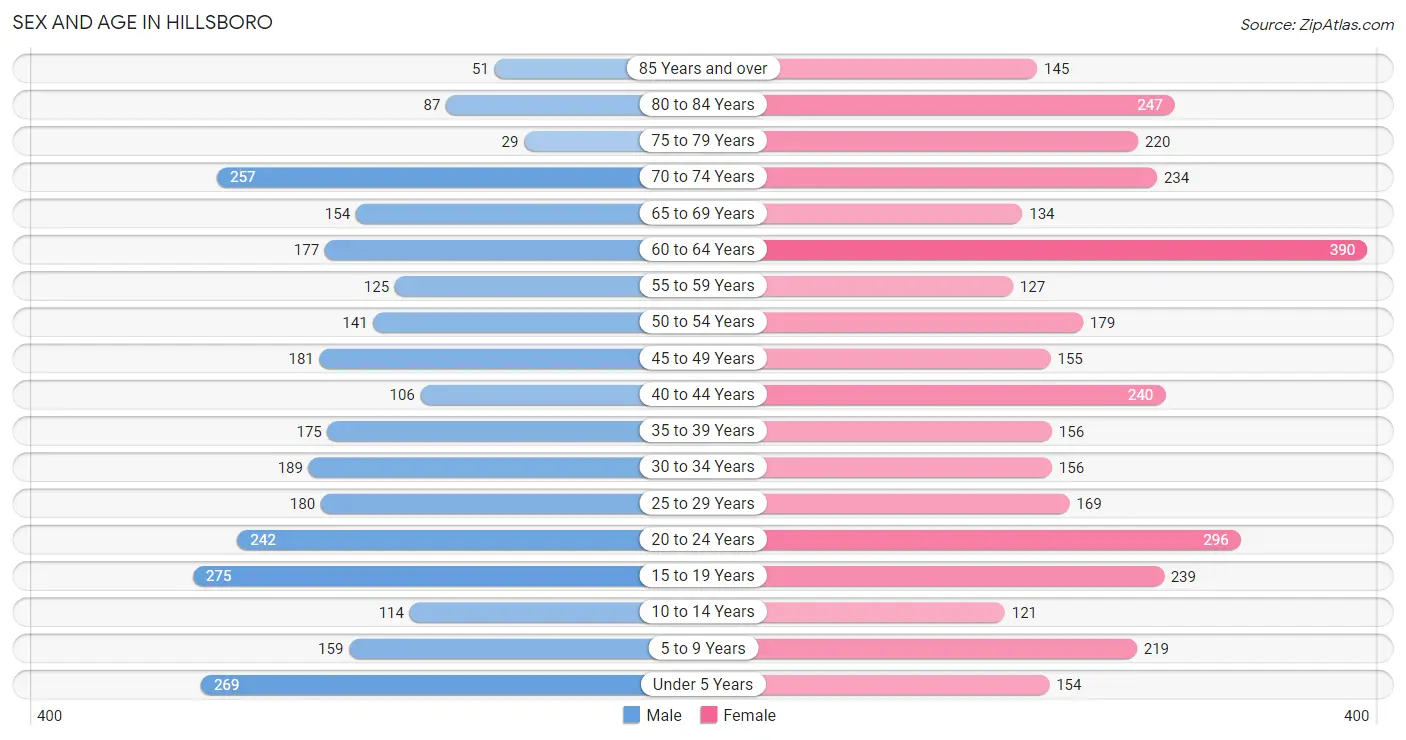
| Age Bracket | Male | Female |
| Under 5 Years | 269 (9.2%) | 154 (4.3%) |
| 5 to 9 Years | 159 (5.5%) | 219 (6.1%) |
| 10 to 14 Years | 114 (3.9%) | 121 (3.4%) |
| 15 to 19 Years | 275 (9.5%) | 239 (6.7%) |
| 20 to 24 Years | 242 (8.3%) | 296 (8.3%) |
| 25 to 29 Years | 180 (6.2%) | 169 (4.7%) |
| 30 to 34 Years | 189 (6.5%) | 156 (4.4%) |
| 35 to 39 Years | 175 (6.0%) | 156 (4.4%) |
| 40 to 44 Years | 106 (3.6%) | 240 (6.7%) |
| 45 to 49 Years | 181 (6.2%) | 155 (4.3%) |
| 50 to 54 Years | 141 (4.8%) | 179 (5.0%) |
| 55 to 59 Years | 125 (4.3%) | 127 (3.5%) |
| 60 to 64 Years | 177 (6.1%) | 390 (10.9%) |
| 65 to 69 Years | 154 (5.3%) | 134 (3.7%) |
| 70 to 74 Years | 257 (8.8%) | 234 (6.5%) |
| 75 to 79 Years | 29 (1.0%) | 220 (6.1%) |
| 80 to 84 Years | 87 (3.0%) | 247 (6.9%) |
| 85 Years and over | 51 (1.8%) | 145 (4.1%) |
| Total | 2,911 (100.0%) | 3,581 (100.0%) |
Families and Households in Hillsboro
Median Family Size in Hillsboro
The median family size in Hillsboro is 2.87 persons per family, with married-couple families (976 | 63.3%) accounting for the largest median family size of 2.95 persons per family. On the other hand, single female/mother families (384 | 24.9%) represent the smallest median family size with 2.68 persons per family.
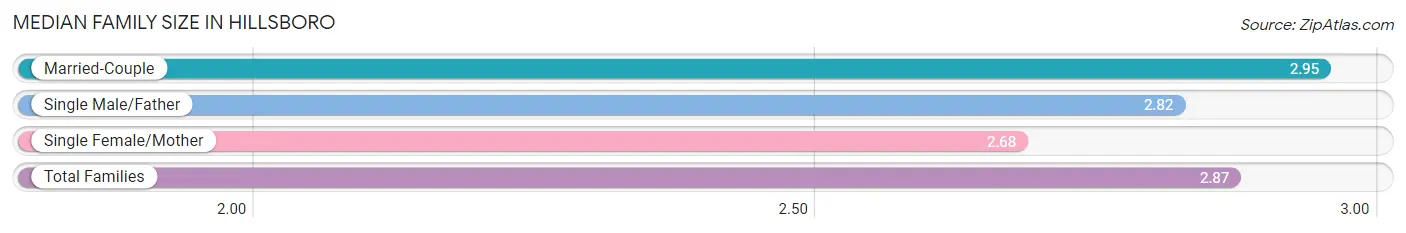
| Family Type | # Families | Family Size |
| Married-Couple | 976 (63.3%) | 2.95 |
| Single Male/Father | 181 (11.7%) | 2.82 |
| Single Female/Mother | 384 (24.9%) | 2.68 |
| Total Families | 1,541 (100.0%) | 2.87 |
Median Household Size in Hillsboro
The median household size in Hillsboro is 2.18 persons per household, with single male/father households (181 | 6.5%) accounting for the largest median household size of 3.66 persons per household. non-family households (1,252 | 44.8%) represent the smallest median household size with 1.13 persons per household.
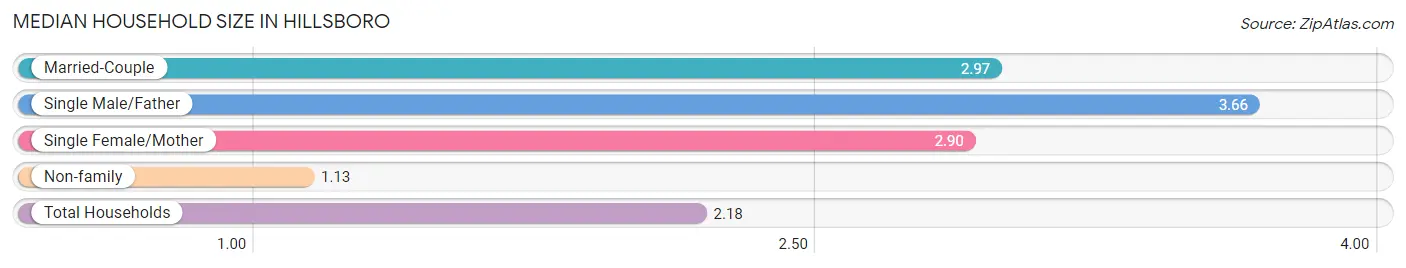
| Household Type | # Households | Household Size |
| Married-Couple | 976 (34.9%) | 2.97 |
| Single Male/Father | 181 (6.5%) | 3.66 |
| Single Female/Mother | 384 (13.8%) | 2.90 |
| Non-family | 1,252 (44.8%) | 1.13 |
| Total Households | 2,793 (100.0%) | 2.18 |
Household Size by Marriage Status in Hillsboro
Out of a total of 2,793 households in Hillsboro, 1,541 (55.2%) are family households, while 1,252 (44.8%) are nonfamily households. The most numerous type of family households are 2-person households, comprising 718, and the most common type of nonfamily households are 1-person households, comprising 1,110.
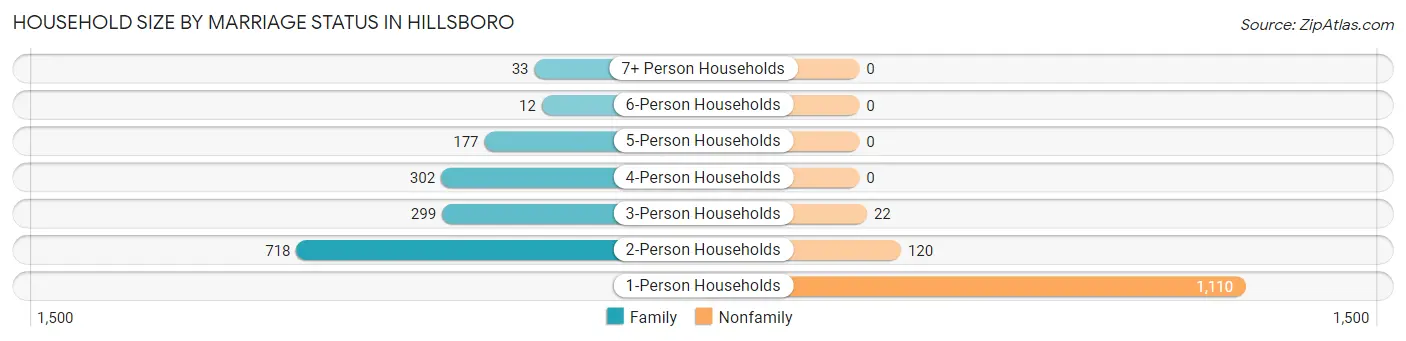
| Household Size | Family Households | Nonfamily Households |
| 1-Person Households | - | 1,110 (39.7%) |
| 2-Person Households | 718 (25.7%) | 120 (4.3%) |
| 3-Person Households | 299 (10.7%) | 22 (0.8%) |
| 4-Person Households | 302 (10.8%) | 0 (0.0%) |
| 5-Person Households | 177 (6.3%) | 0 (0.0%) |
| 6-Person Households | 12 (0.4%) | 0 (0.0%) |
| 7+ Person Households | 33 (1.2%) | 0 (0.0%) |
| Total | 1,541 (55.2%) | 1,252 (44.8%) |
Female Fertility in Hillsboro
Fertility by Age in Hillsboro
Average fertility rate in Hillsboro is 118.0 births per 1,000 women. Women in the age bracket of 15 to 19 years have the highest fertility rate with 255.0 births per 1,000 women. Women in the age bracket of 20 to 34 years acount for 65.7% of all women with births.
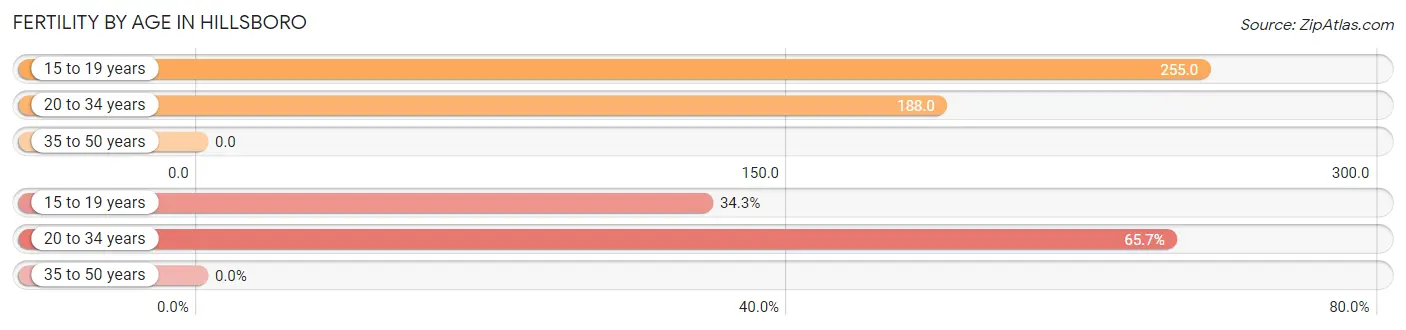
| Age Bracket | Women with Births | Births / 1,000 Women |
| 15 to 19 years | 61 (34.3%) | 255.0 |
| 20 to 34 years | 117 (65.7%) | 188.0 |
| 35 to 50 years | 0 (0.0%) | 0.0 |
| Total | 178 (100.0%) | 118.0 |
Fertility by Age by Marriage Status in Hillsboro
23.0% of women with births (178) in Hillsboro are married. The highest percentage of unmarried women with births falls into 15 to 19 years age bracket with 100.0% of them unmarried at the time of birth, while the lowest percentage of unmarried women with births belong to 20 to 34 years age bracket with 65.0% of them unmarried.
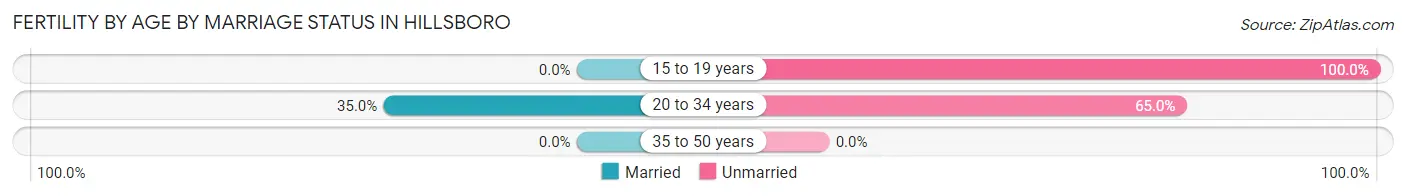
| Age Bracket | Married | Unmarried |
| 15 to 19 years | 0 (0.0%) | 61 (100.0%) |
| 20 to 34 years | 41 (35.0%) | 76 (65.0%) |
| 35 to 50 years | 0 (0.0%) | 0 (0.0%) |
| Total | 41 (23.0%) | 137 (77.0%) |
Fertility by Education in Hillsboro
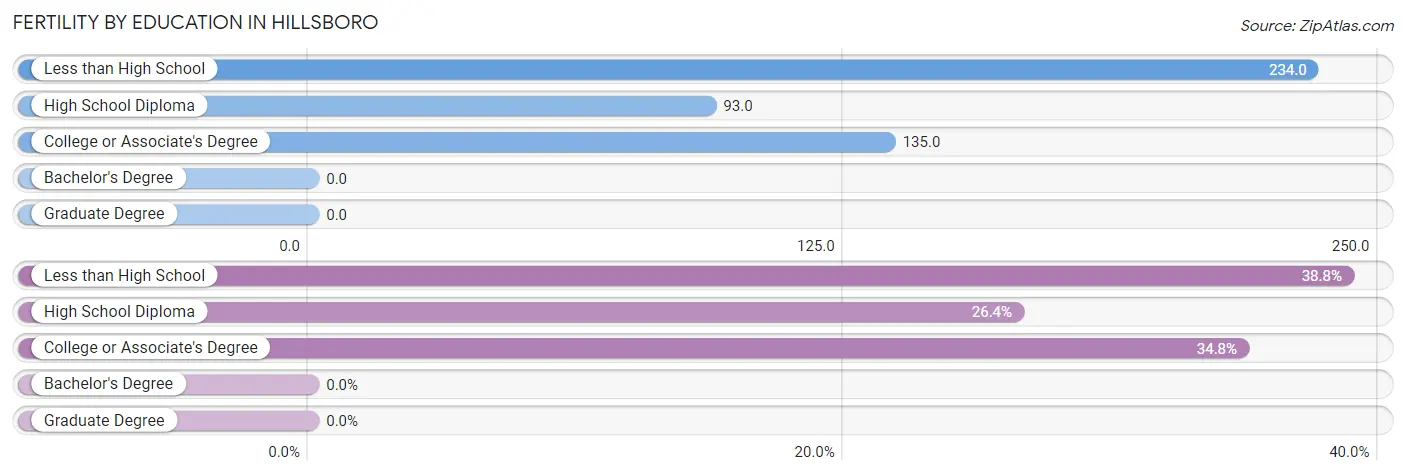
| Educational Attainment | Women with Births | Births / 1,000 Women |
| Less than High School | 69 (38.8%) | 234.0 |
| High School Diploma | 47 (26.4%) | 93.0 |
| College or Associate's Degree | 62 (34.8%) | 135.0 |
| Bachelor's Degree | 0 (0.0%) | 0.0 |
| Graduate Degree | 0 (0.0%) | 0.0 |
| Total | 178 (100.0%) | 118.0 |
Fertility by Education by Marriage Status in Hillsboro
77.0% of women with births in Hillsboro are unmarried. Women with the educational attainment of high school diploma are most likely to be married with 40.4% of them married at childbirth, while women with the educational attainment of less than high school are least likely to be married with 100.0% of them unmarried at childbirth.
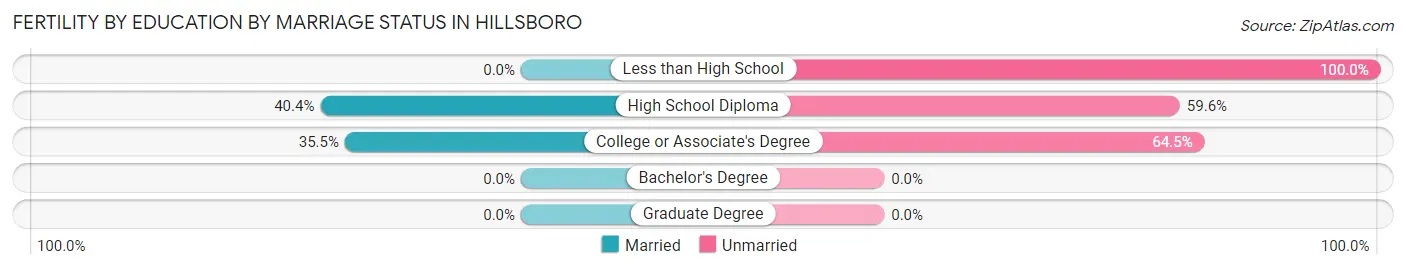
| Educational Attainment | Married | Unmarried |
| Less than High School | 0 (0.0%) | 69 (100.0%) |
| High School Diploma | 19 (40.4%) | 28 (59.6%) |
| College or Associate's Degree | 22 (35.5%) | 40 (64.5%) |
| Bachelor's Degree | 0 (0.0%) | 0 (0.0%) |
| Graduate Degree | 0 (0.0%) | 0 (0.0%) |
| Total | 41 (23.0%) | 137 (77.0%) |
Employment Characteristics in Hillsboro
Employment by Class of Employer in Hillsboro
Among the 2,556 employed individuals in Hillsboro, private company employees (1,674 | 65.5%), not-for-profit organizations (390 | 15.3%), and local government employees (259 | 10.1%) make up the most common classes of employment.
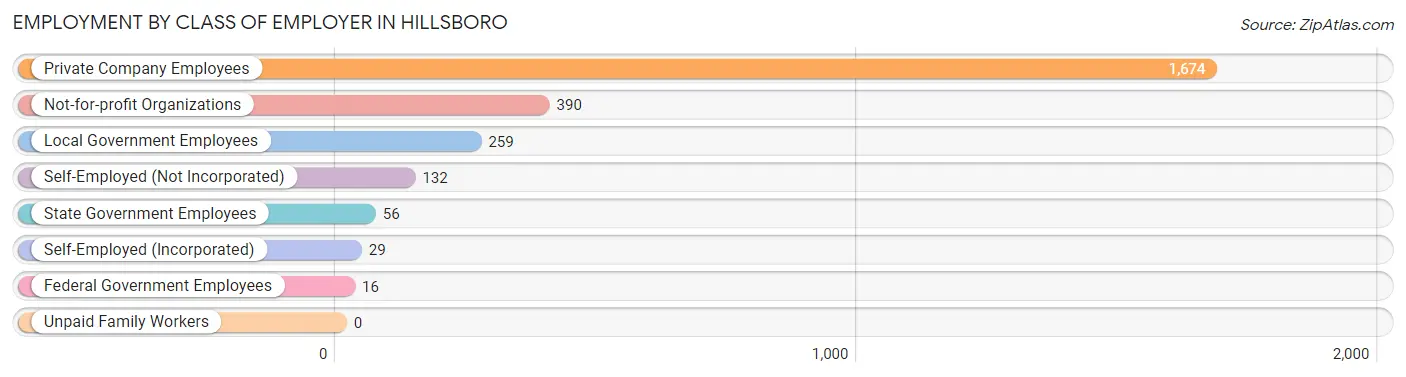
| Employer Class | # Employees | % Employees |
| Private Company Employees | 1,674 | 65.5% |
| Self-Employed (Incorporated) | 29 | 1.1% |
| Self-Employed (Not Incorporated) | 132 | 5.2% |
| Not-for-profit Organizations | 390 | 15.3% |
| Local Government Employees | 259 | 10.1% |
| State Government Employees | 56 | 2.2% |
| Federal Government Employees | 16 | 0.6% |
| Unpaid Family Workers | 0 | 0.0% |
| Total | 2,556 | 100.0% |
Employment Status by Age in Hillsboro
According to the labor force statistics for Hillsboro, out of the total population over 16 years of age (5,313), 51.6% or 2,742 individuals are in the labor force, with 5.0% or 137 of them unemployed. The age group with the highest labor force participation rate is 20 to 24 years, with 88.1% or 474 individuals in the labor force. Within the labor force, the 65 to 74 years age range has the highest percentage of unemployed individuals, with 13.6% or 24 of them being unemployed.
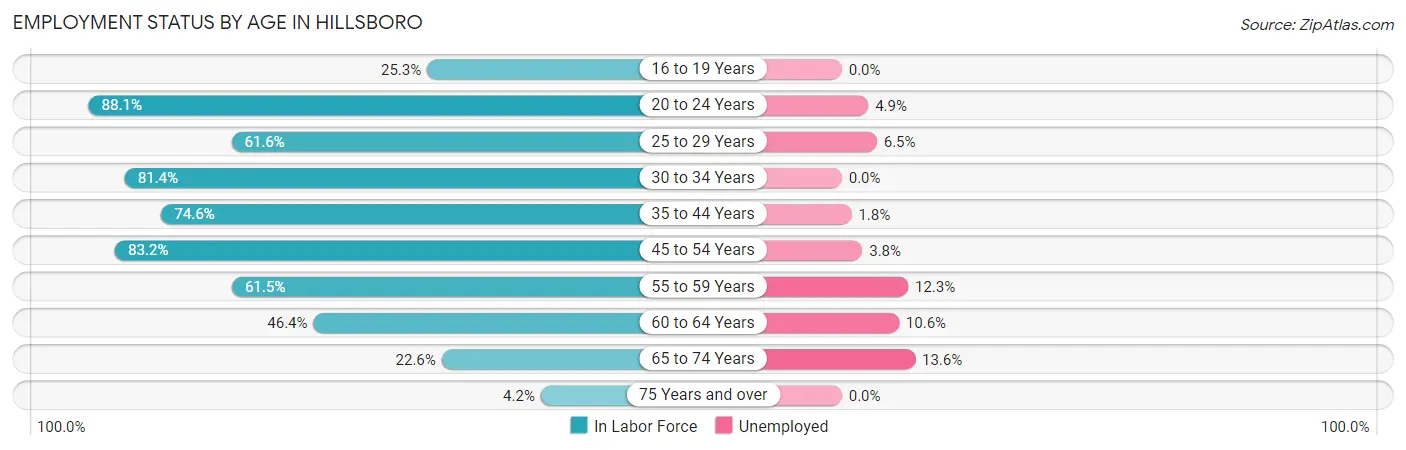
| Age Bracket | In Labor Force | Unemployed |
| 16 to 19 Years | 94 (25.3%) | 0 (0.0%) |
| 20 to 24 Years | 474 (88.1%) | 23 (4.9%) |
| 25 to 29 Years | 215 (61.6%) | 14 (6.5%) |
| 30 to 34 Years | 281 (81.4%) | 0 (0.0%) |
| 35 to 44 Years | 505 (74.6%) | 9 (1.8%) |
| 45 to 54 Years | 546 (83.2%) | 21 (3.8%) |
| 55 to 59 Years | 155 (61.5%) | 19 (12.3%) |
| 60 to 64 Years | 263 (46.4%) | 28 (10.6%) |
| 65 to 74 Years | 176 (22.6%) | 24 (13.6%) |
| 75 Years and over | 33 (4.2%) | 0 (0.0%) |
| Total | 2,742 (51.6%) | 137 (5.0%) |
Employment Status by Educational Attainment in Hillsboro
According to labor force statistics for Hillsboro, 69.0% of individuals (1,964) out of the total population between 25 and 64 years of age (2,846) are in the labor force, with 4.6% or 90 of them being unemployed. The group with the highest labor force participation rate are those with the educational attainment of bachelor's degree or higher, with 82.8% or 299 individuals in the labor force. Within the labor force, individuals with college / associate degree education have the highest percentage of unemployment, with 5.5% or 35 of them being unemployed.
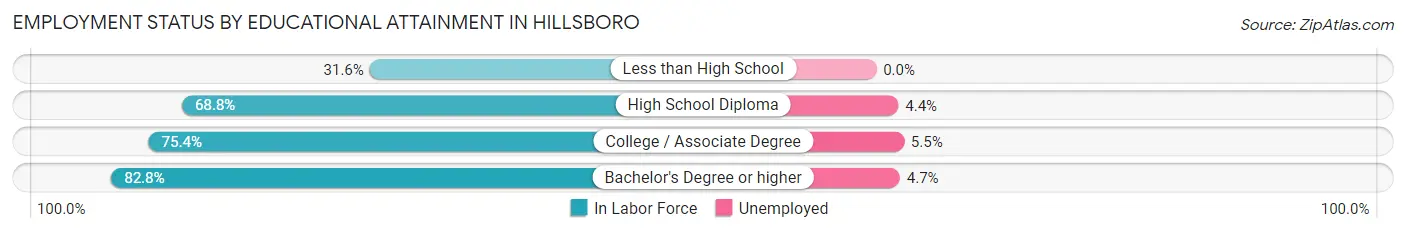
| Educational Attainment | In Labor Force | Unemployed |
| Less than High School | 84 (31.6%) | 0 (0.0%) |
| High School Diploma | 945 (68.8%) | 60 (4.4%) |
| College / Associate Degree | 637 (75.4%) | 46 (5.5%) |
| Bachelor's Degree or higher | 299 (82.8%) | 17 (4.7%) |
| Total | 1,964 (69.0%) | 131 (4.6%) |
Employment Occupations by Sex in Hillsboro
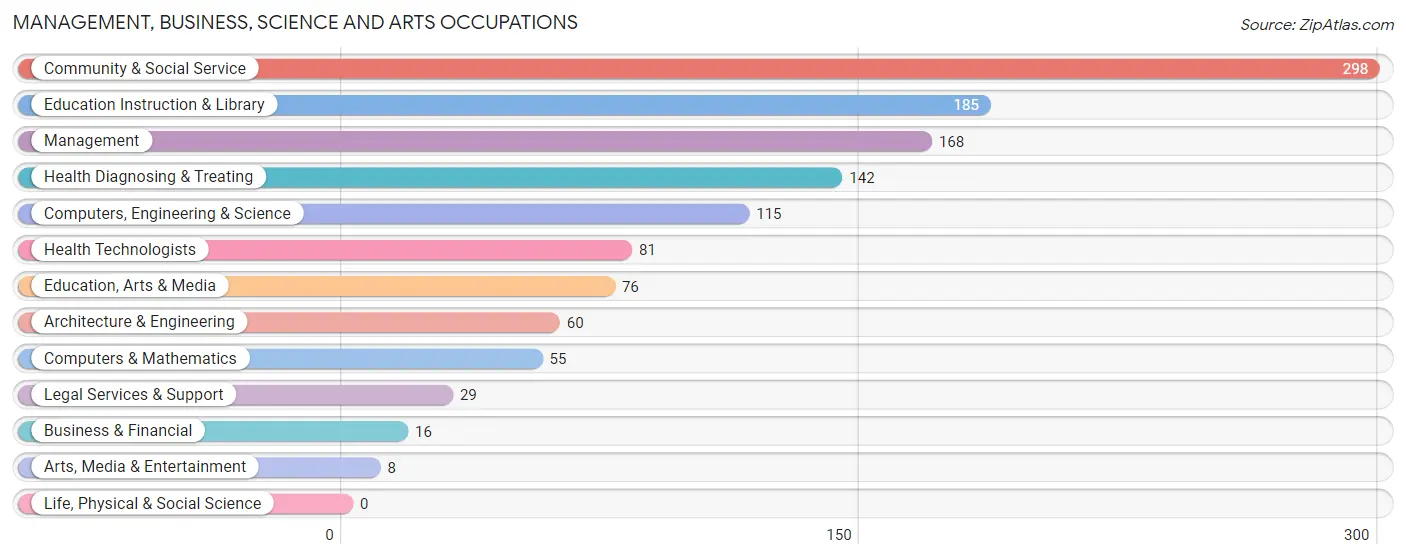
Management, Business, Science and Arts Occupations
The most common Management, Business, Science and Arts occupations in Hillsboro are Community & Social Service (298 | 11.4%), Education Instruction & Library (185 | 7.1%), Management (168 | 6.5%), Health Diagnosing & Treating (142 | 5.4%), and Computers, Engineering & Science (115 | 4.4%).
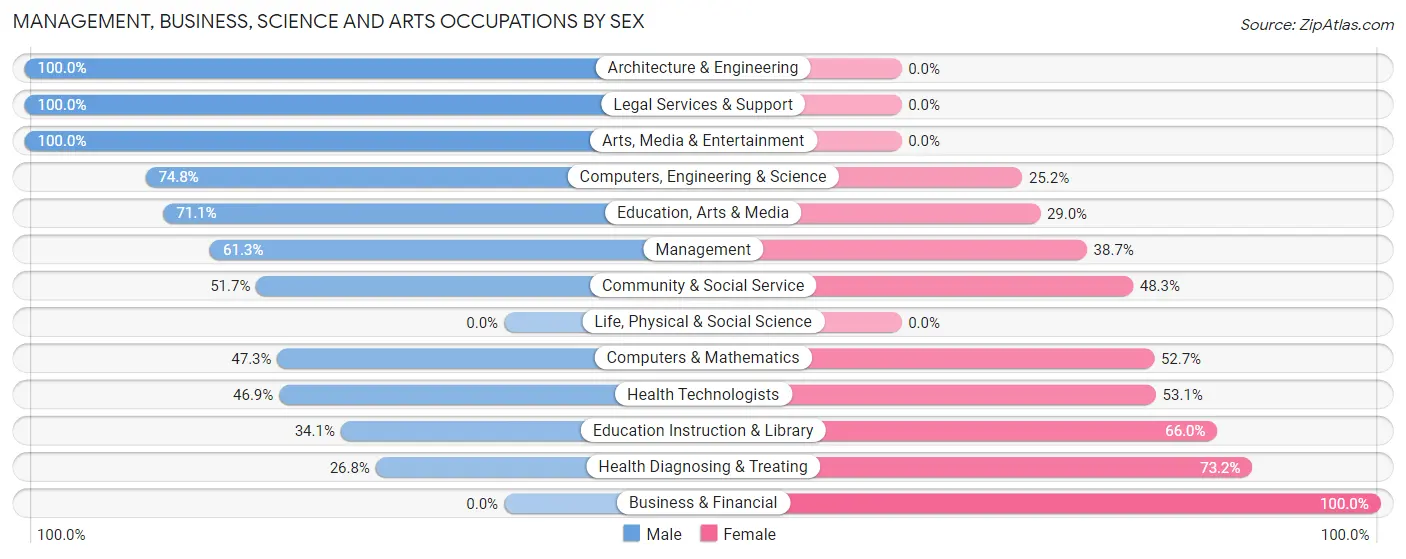
Management, Business, Science and Arts Occupations by Sex
Within the Management, Business, Science and Arts occupations in Hillsboro, the most male-oriented occupations are Architecture & Engineering (100.0%), Legal Services & Support (100.0%), and Arts, Media & Entertainment (100.0%), while the most female-oriented occupations are Business & Financial (100.0%), Health Diagnosing & Treating (73.2%), and Education Instruction & Library (65.9%).
| Occupation | Male | Female |
| Management | 103 (61.3%) | 65 (38.7%) |
| Business & Financial | 0 (0.0%) | 16 (100.0%) |
| Computers, Engineering & Science | 86 (74.8%) | 29 (25.2%) |
| Computers & Mathematics | 26 (47.3%) | 29 (52.7%) |
| Architecture & Engineering | 60 (100.0%) | 0 (0.0%) |
| Life, Physical & Social Science | 0 (0.0%) | 0 (0.0%) |
| Community & Social Service | 154 (51.7%) | 144 (48.3%) |
| Education, Arts & Media | 54 (71.1%) | 22 (28.9%) |
| Legal Services & Support | 29 (100.0%) | 0 (0.0%) |
| Education Instruction & Library | 63 (34.1%) | 122 (65.9%) |
| Arts, Media & Entertainment | 8 (100.0%) | 0 (0.0%) |
| Health Diagnosing & Treating | 38 (26.8%) | 104 (73.2%) |
| Health Technologists | 38 (46.9%) | 43 (53.1%) |
| Total (Category) | 381 (51.6%) | 358 (48.4%) |
| Total (Overall) | 1,188 (45.6%) | 1,416 (54.4%) |
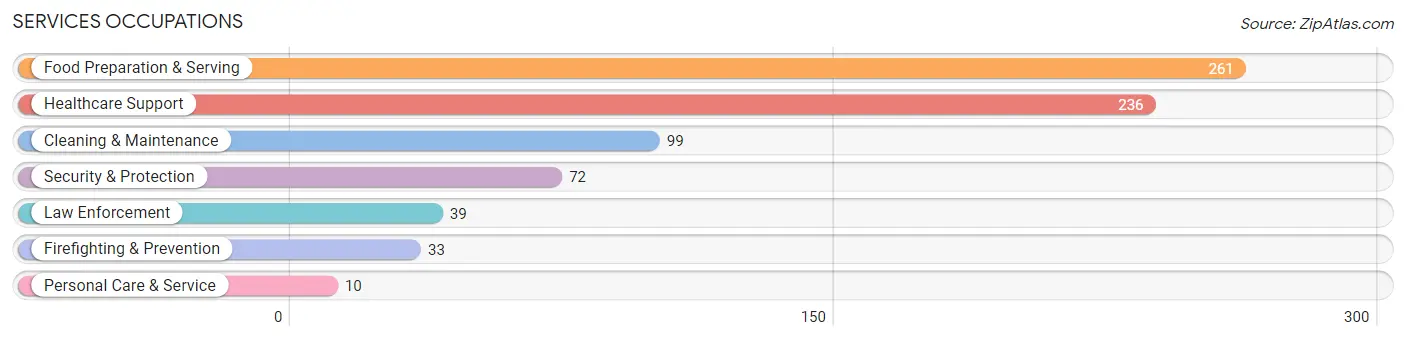
Services Occupations
The most common Services occupations in Hillsboro are Food Preparation & Serving (261 | 10.0%), Healthcare Support (236 | 9.1%), Cleaning & Maintenance (99 | 3.8%), Security & Protection (72 | 2.8%), and Law Enforcement (39 | 1.5%).
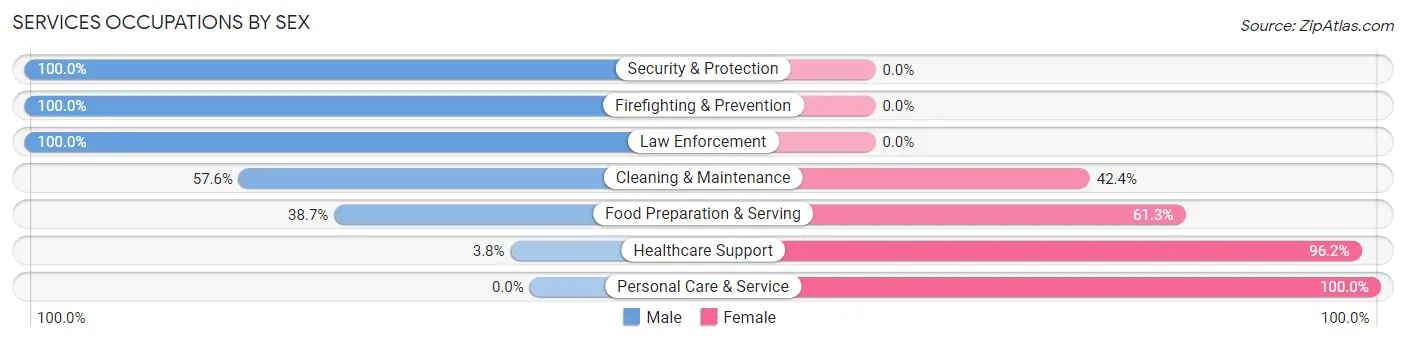
Services Occupations by Sex
Within the Services occupations in Hillsboro, the most male-oriented occupations are Security & Protection (100.0%), Firefighting & Prevention (100.0%), and Law Enforcement (100.0%), while the most female-oriented occupations are Personal Care & Service (100.0%), Healthcare Support (96.2%), and Food Preparation & Serving (61.3%).
| Occupation | Male | Female |
| Healthcare Support | 9 (3.8%) | 227 (96.2%) |
| Security & Protection | 72 (100.0%) | 0 (0.0%) |
| Firefighting & Prevention | 33 (100.0%) | 0 (0.0%) |
| Law Enforcement | 39 (100.0%) | 0 (0.0%) |
| Food Preparation & Serving | 101 (38.7%) | 160 (61.3%) |
| Cleaning & Maintenance | 57 (57.6%) | 42 (42.4%) |
| Personal Care & Service | 0 (0.0%) | 10 (100.0%) |
| Total (Category) | 239 (35.2%) | 439 (64.7%) |
| Total (Overall) | 1,188 (45.6%) | 1,416 (54.4%) |
Sales and Office Occupations
The most common Sales and Office occupations in Hillsboro are Office & Administration (355 | 13.6%), and Sales & Related (179 | 6.9%).
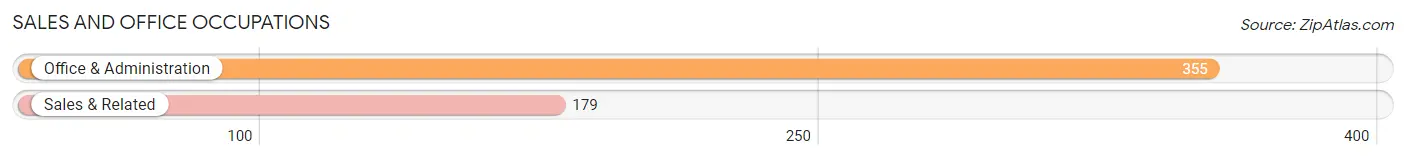
Sales and Office Occupations by Sex
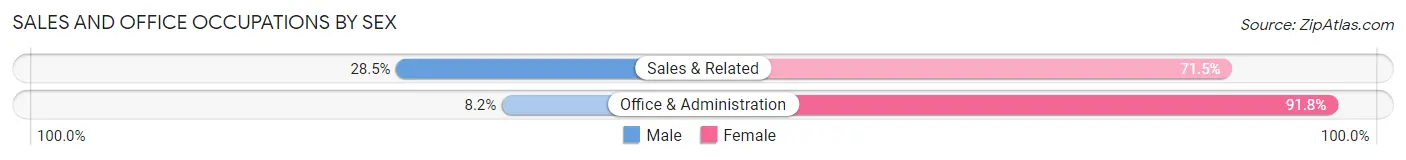
| Occupation | Male | Female |
| Sales & Related | 51 (28.5%) | 128 (71.5%) |
| Office & Administration | 29 (8.2%) | 326 (91.8%) |
| Total (Category) | 80 (15.0%) | 454 (85.0%) |
| Total (Overall) | 1,188 (45.6%) | 1,416 (54.4%) |
Natural Resources, Construction and Maintenance Occupations
The most common Natural Resources, Construction and Maintenance occupations in Hillsboro are Construction & Extraction (101 | 3.9%), and Installation, Maintenance & Repair (30 | 1.1%).
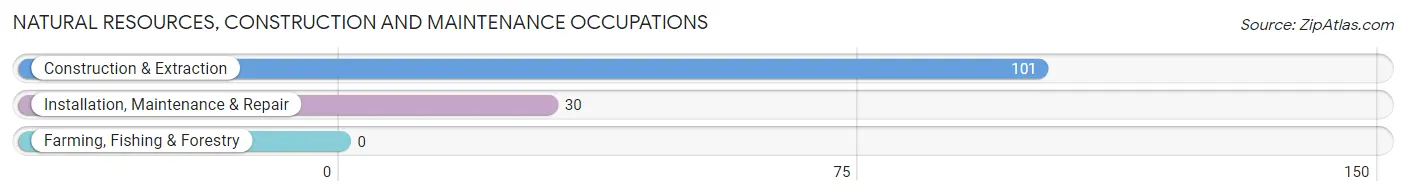
Natural Resources, Construction and Maintenance Occupations by Sex
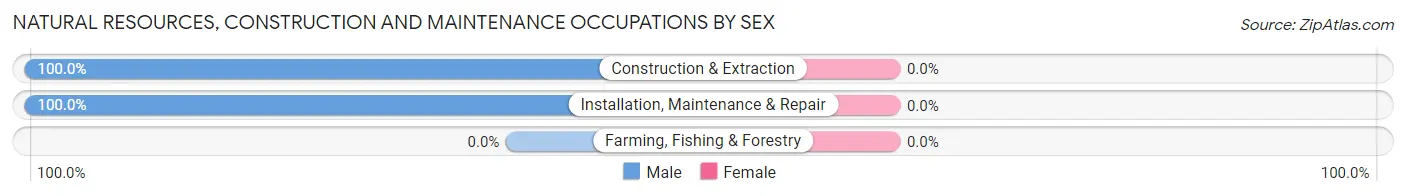
| Occupation | Male | Female |
| Farming, Fishing & Forestry | 0 (0.0%) | 0 (0.0%) |
| Construction & Extraction | 101 (100.0%) | 0 (0.0%) |
| Installation, Maintenance & Repair | 30 (100.0%) | 0 (0.0%) |
| Total (Category) | 131 (100.0%) | 0 (0.0%) |
| Total (Overall) | 1,188 (45.6%) | 1,416 (54.4%) |
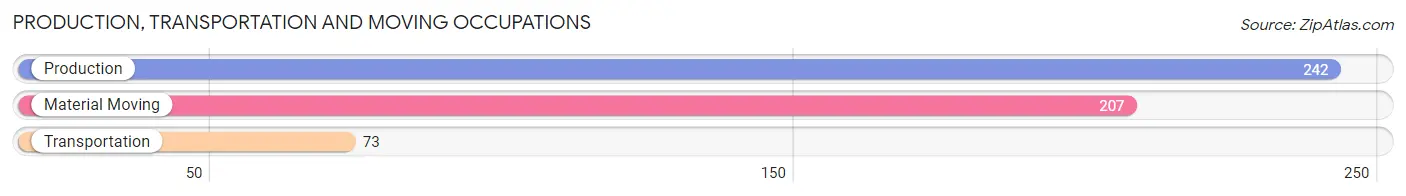
Production, Transportation and Moving Occupations
The most common Production, Transportation and Moving occupations in Hillsboro are Production (242 | 9.3%), Material Moving (207 | 8.0%), and Transportation (73 | 2.8%).
Production, Transportation and Moving Occupations by Sex
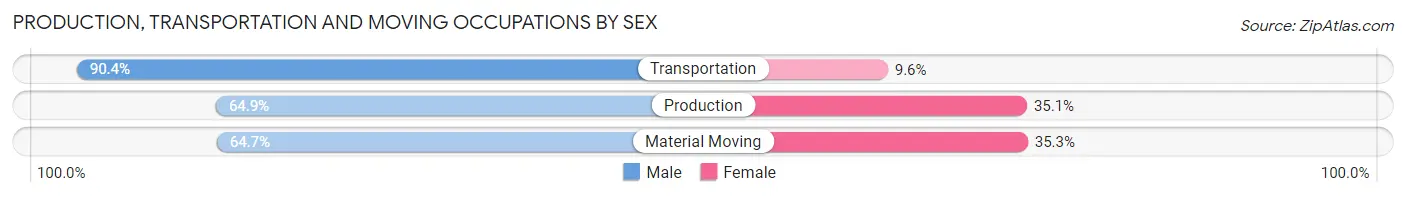
| Occupation | Male | Female |
| Production | 157 (64.9%) | 85 (35.1%) |
| Transportation | 66 (90.4%) | 7 (9.6%) |
| Material Moving | 134 (64.7%) | 73 (35.3%) |
| Total (Category) | 357 (68.4%) | 165 (31.6%) |
| Total (Overall) | 1,188 (45.6%) | 1,416 (54.4%) |
Employment Industries by Sex in Hillsboro
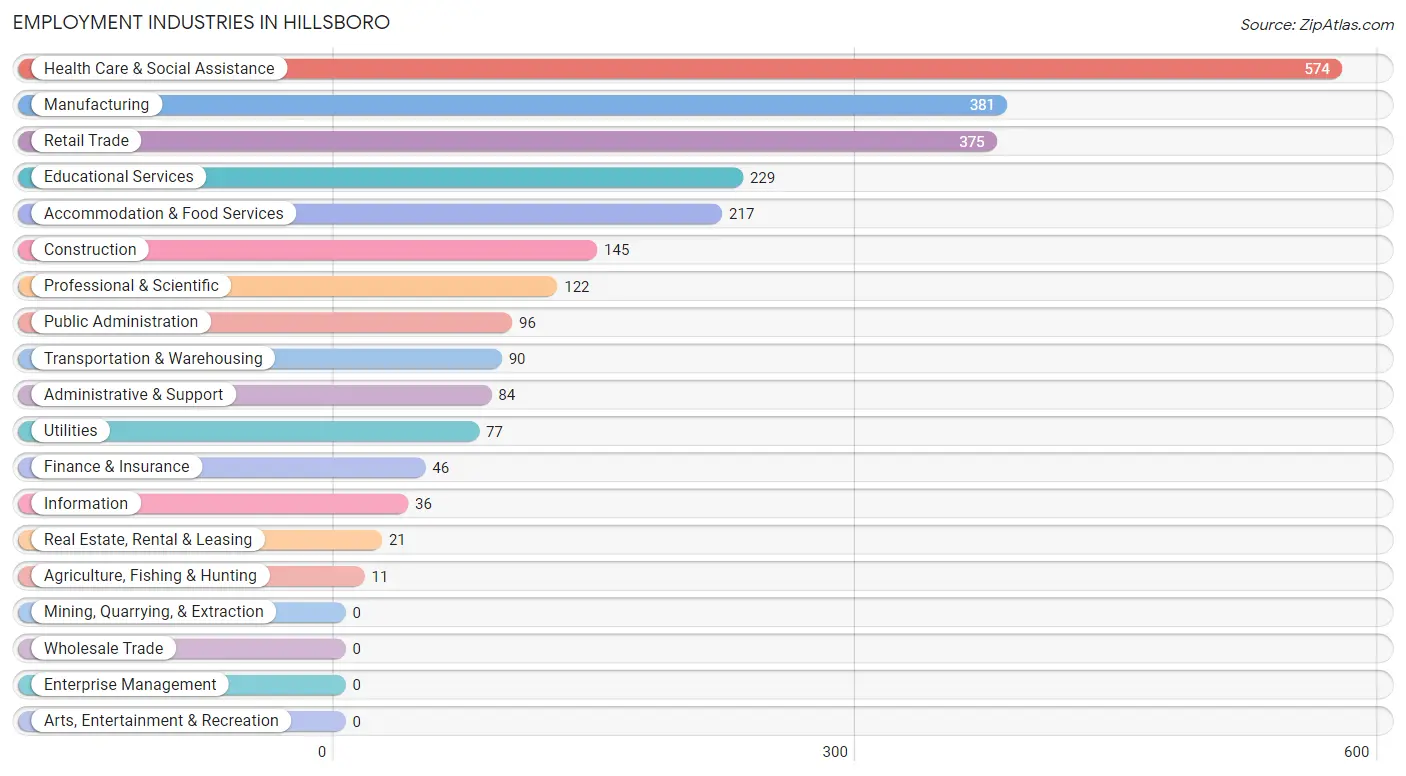
Employment Industries in Hillsboro
The major employment industries in Hillsboro include Health Care & Social Assistance (574 | 22.0%), Manufacturing (381 | 14.6%), Retail Trade (375 | 14.4%), Educational Services (229 | 8.8%), and Accommodation & Food Services (217 | 8.3%).
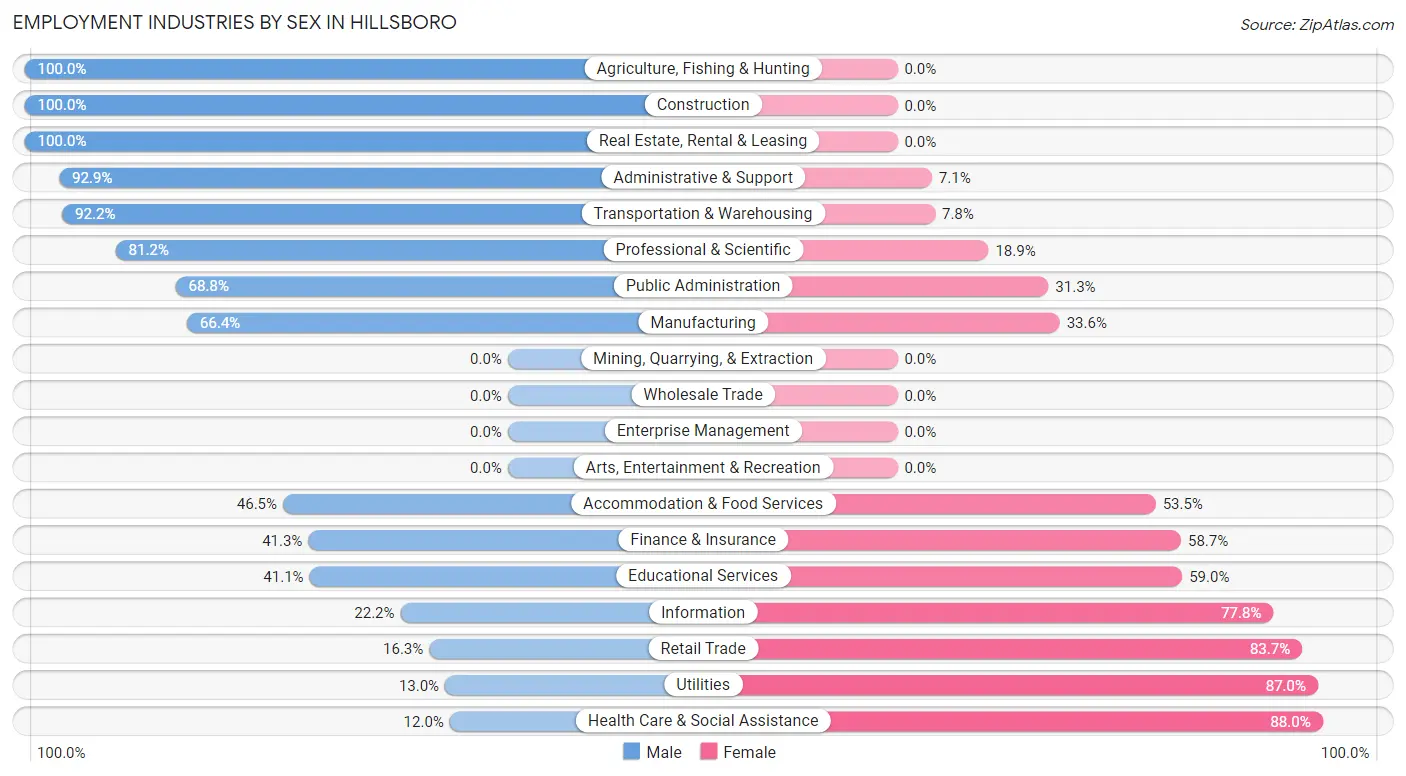
Employment Industries by Sex in Hillsboro
The Hillsboro industries that see more men than women are Agriculture, Fishing & Hunting (100.0%), Construction (100.0%), and Real Estate, Rental & Leasing (100.0%), whereas the industries that tend to have a higher number of women are Health Care & Social Assistance (88.0%), Utilities (87.0%), and Retail Trade (83.7%).
| Industry | Male | Female |
| Agriculture, Fishing & Hunting | 11 (100.0%) | 0 (0.0%) |
| Mining, Quarrying, & Extraction | 0 (0.0%) | 0 (0.0%) |
| Construction | 145 (100.0%) | 0 (0.0%) |
| Manufacturing | 253 (66.4%) | 128 (33.6%) |
| Wholesale Trade | 0 (0.0%) | 0 (0.0%) |
| Retail Trade | 61 (16.3%) | 314 (83.7%) |
| Transportation & Warehousing | 83 (92.2%) | 7 (7.8%) |
| Utilities | 10 (13.0%) | 67 (87.0%) |
| Information | 8 (22.2%) | 28 (77.8%) |
| Finance & Insurance | 19 (41.3%) | 27 (58.7%) |
| Real Estate, Rental & Leasing | 21 (100.0%) | 0 (0.0%) |
| Professional & Scientific | 99 (81.1%) | 23 (18.9%) |
| Enterprise Management | 0 (0.0%) | 0 (0.0%) |
| Administrative & Support | 78 (92.9%) | 6 (7.1%) |
| Educational Services | 94 (41.0%) | 135 (59.0%) |
| Health Care & Social Assistance | 69 (12.0%) | 505 (88.0%) |
| Arts, Entertainment & Recreation | 0 (0.0%) | 0 (0.0%) |
| Accommodation & Food Services | 101 (46.5%) | 116 (53.5%) |
| Public Administration | 66 (68.8%) | 30 (31.2%) |
| Total | 1,188 (45.6%) | 1,416 (54.4%) |
Education in Hillsboro
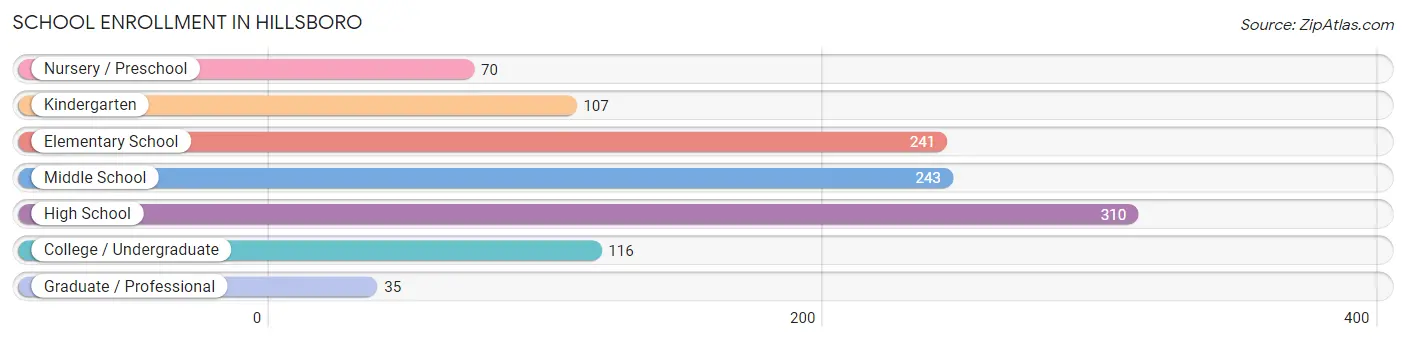
School Enrollment in Hillsboro
The most common levels of schooling among the 1,122 students in Hillsboro are high school (310 | 27.6%), middle school (243 | 21.7%), and elementary school (241 | 21.5%).
| School Level | # Students | % Students |
| Nursery / Preschool | 70 | 6.2% |
| Kindergarten | 107 | 9.5% |
| Elementary School | 241 | 21.5% |
| Middle School | 243 | 21.7% |
| High School | 310 | 27.6% |
| College / Undergraduate | 116 | 10.3% |
| Graduate / Professional | 35 | 3.1% |
| Total | 1,122 | 100.0% |
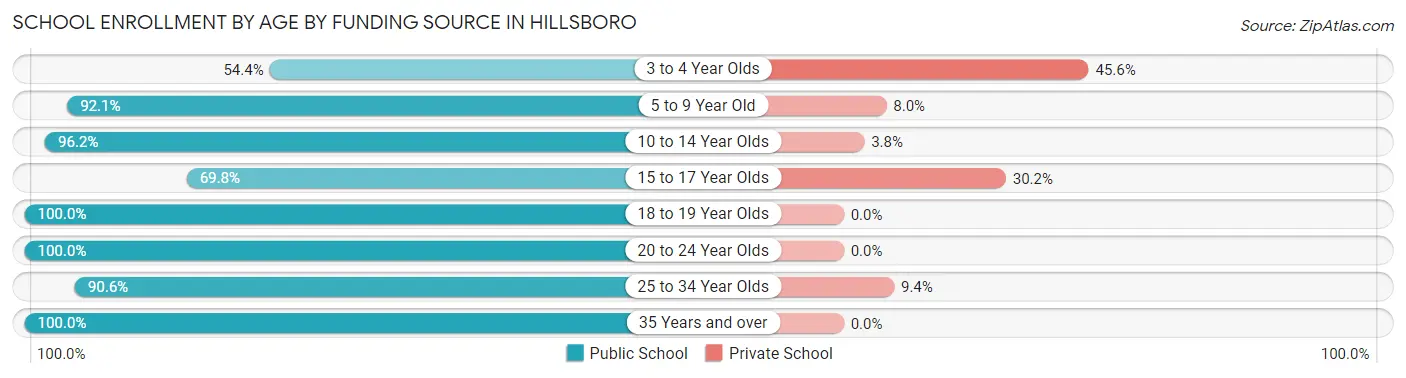
School Enrollment by Age by Funding Source in Hillsboro
Out of a total of 1,122 students who are enrolled in schools in Hillsboro, 142 (12.7%) attend a private institution, while the remaining 980 (87.3%) are enrolled in public schools. The age group of 3 to 4 year olds has the highest likelihood of being enrolled in private schools, with 26 (45.6% in the age bracket) enrolled. Conversely, the age group of 18 to 19 year olds has the lowest likelihood of being enrolled in a private school, with 61 (100.0% in the age bracket) attending a public institution.
| Age Bracket | Public School | Private School |
| 3 to 4 Year Olds | 31 (54.4%) | 26 (45.6%) |
| 5 to 9 Year Old | 324 (92.0%) | 28 (8.0%) |
| 10 to 14 Year Olds | 226 (96.2%) | 9 (3.8%) |
| 15 to 17 Year Olds | 178 (69.8%) | 77 (30.2%) |
| 18 to 19 Year Olds | 61 (100.0%) | 0 (0.0%) |
| 20 to 24 Year Olds | 70 (100.0%) | 0 (0.0%) |
| 25 to 34 Year Olds | 29 (90.6%) | 3 (9.4%) |
| 35 Years and over | 60 (100.0%) | 0 (0.0%) |
| Total | 980 (87.3%) | 142 (12.7%) |
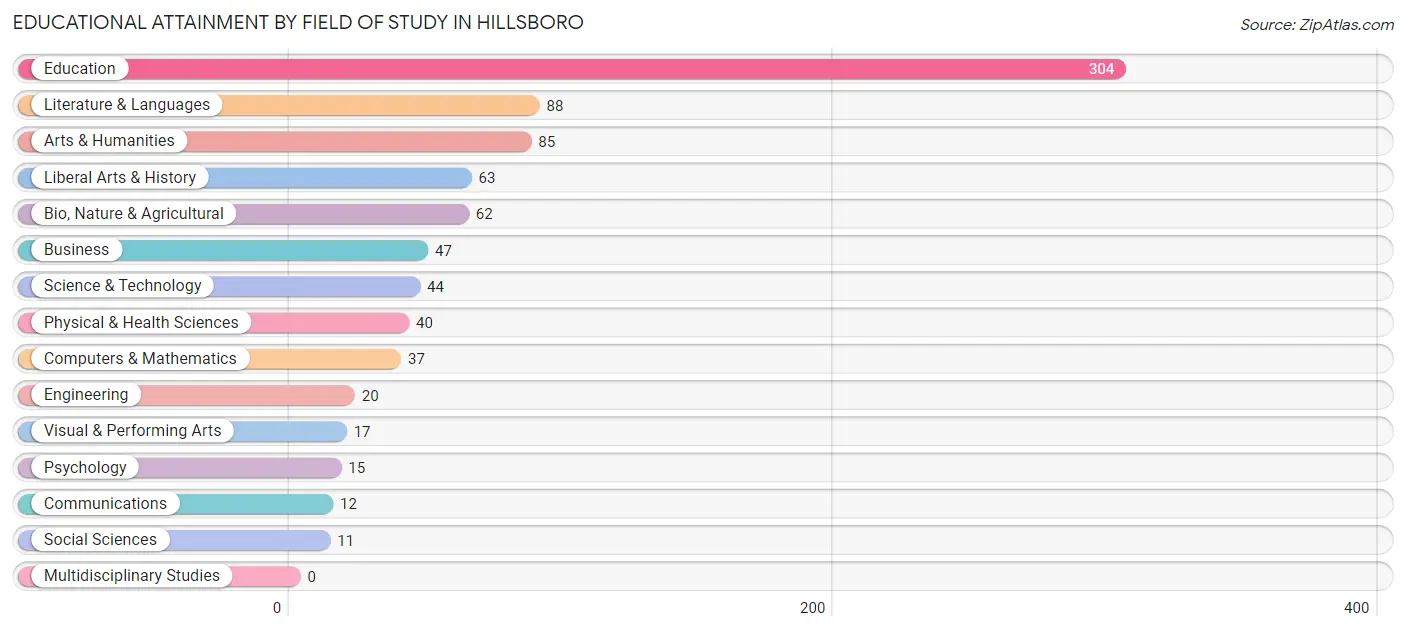
Educational Attainment by Field of Study in Hillsboro
Education (304 | 36.0%), literature & languages (88 | 10.4%), arts & humanities (85 | 10.1%), liberal arts & history (63 | 7.5%), and bio, nature & agricultural (62 | 7.3%) are the most common fields of study among 845 individuals in Hillsboro who have obtained a bachelor's degree or higher.
| Field of Study | # Graduates | % Graduates |
| Computers & Mathematics | 37 | 4.4% |
| Bio, Nature & Agricultural | 62 | 7.3% |
| Physical & Health Sciences | 40 | 4.7% |
| Psychology | 15 | 1.8% |
| Social Sciences | 11 | 1.3% |
| Engineering | 20 | 2.4% |
| Multidisciplinary Studies | 0 | 0.0% |
| Science & Technology | 44 | 5.2% |
| Business | 47 | 5.6% |
| Education | 304 | 36.0% |
| Literature & Languages | 88 | 10.4% |
| Liberal Arts & History | 63 | 7.5% |
| Visual & Performing Arts | 17 | 2.0% |
| Communications | 12 | 1.4% |
| Arts & Humanities | 85 | 10.1% |
| Total | 845 | 100.0% |
Transportation & Commute in Hillsboro
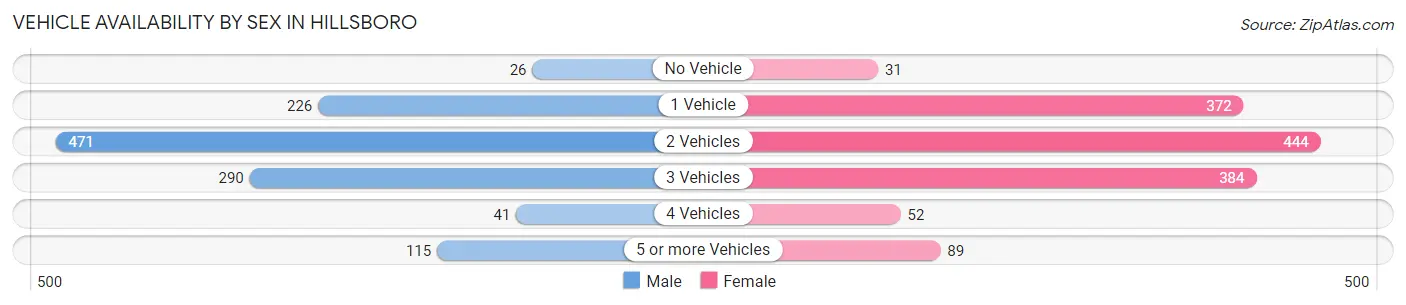
Vehicle Availability by Sex in Hillsboro
The most prevalent vehicle ownership categories in Hillsboro are males with 2 vehicles (471, accounting for 40.3%) and females with 2 vehicles (444, making up 34.3%).
| Vehicles Available | Male | Female |
| No Vehicle | 26 (2.2%) | 31 (2.3%) |
| 1 Vehicle | 226 (19.3%) | 372 (27.1%) |
| 2 Vehicles | 471 (40.3%) | 444 (32.4%) |
| 3 Vehicles | 290 (24.8%) | 384 (28.0%) |
| 4 Vehicles | 41 (3.5%) | 52 (3.8%) |
| 5 or more Vehicles | 115 (9.8%) | 89 (6.5%) |
| Total | 1,169 (100.0%) | 1,372 (100.0%) |
Commute Time in Hillsboro
The most frequently occuring commute durations in Hillsboro are 5 to 9 minutes (488 commuters, 20.1%), 30 to 34 minutes (345 commuters, 14.2%), and less than 5 minutes (277 commuters, 11.4%).
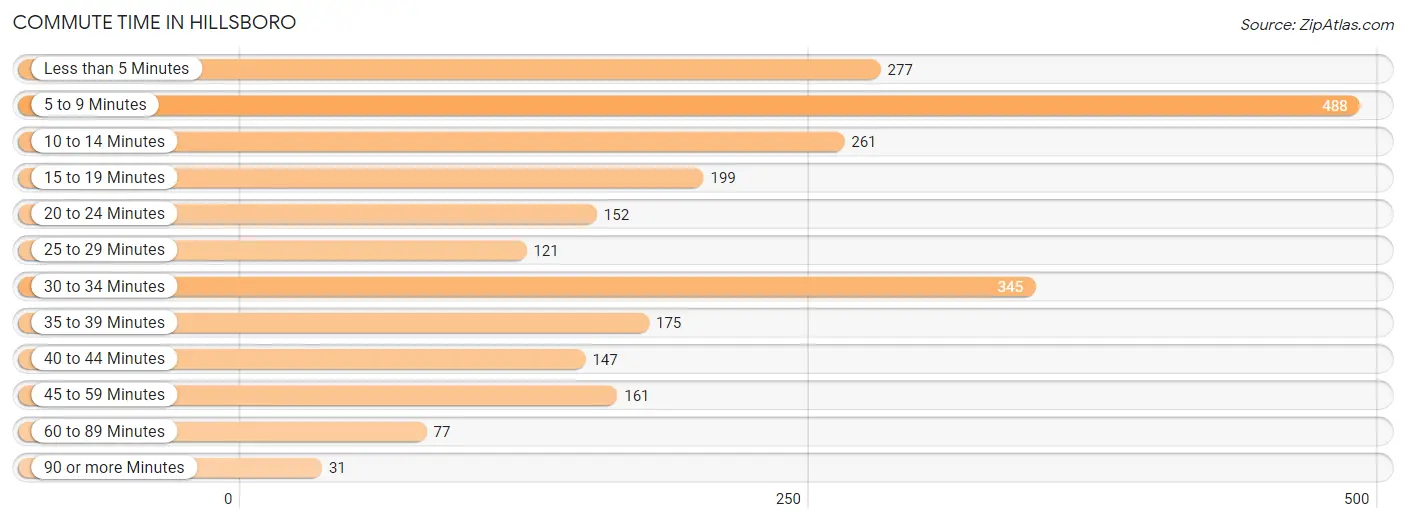
| Commute Time | # Commuters | % Commuters |
| Less than 5 Minutes | 277 | 11.4% |
| 5 to 9 Minutes | 488 | 20.1% |
| 10 to 14 Minutes | 261 | 10.7% |
| 15 to 19 Minutes | 199 | 8.2% |
| 20 to 24 Minutes | 152 | 6.2% |
| 25 to 29 Minutes | 121 | 5.0% |
| 30 to 34 Minutes | 345 | 14.2% |
| 35 to 39 Minutes | 175 | 7.2% |
| 40 to 44 Minutes | 147 | 6.0% |
| 45 to 59 Minutes | 161 | 6.6% |
| 60 to 89 Minutes | 77 | 3.2% |
| 90 or more Minutes | 31 | 1.3% |
Commute Time by Sex in Hillsboro
The most common commute times in Hillsboro are 5 to 9 minutes (211 commuters, 18.8%) for males and 5 to 9 minutes (277 commuters, 21.1%) for females.
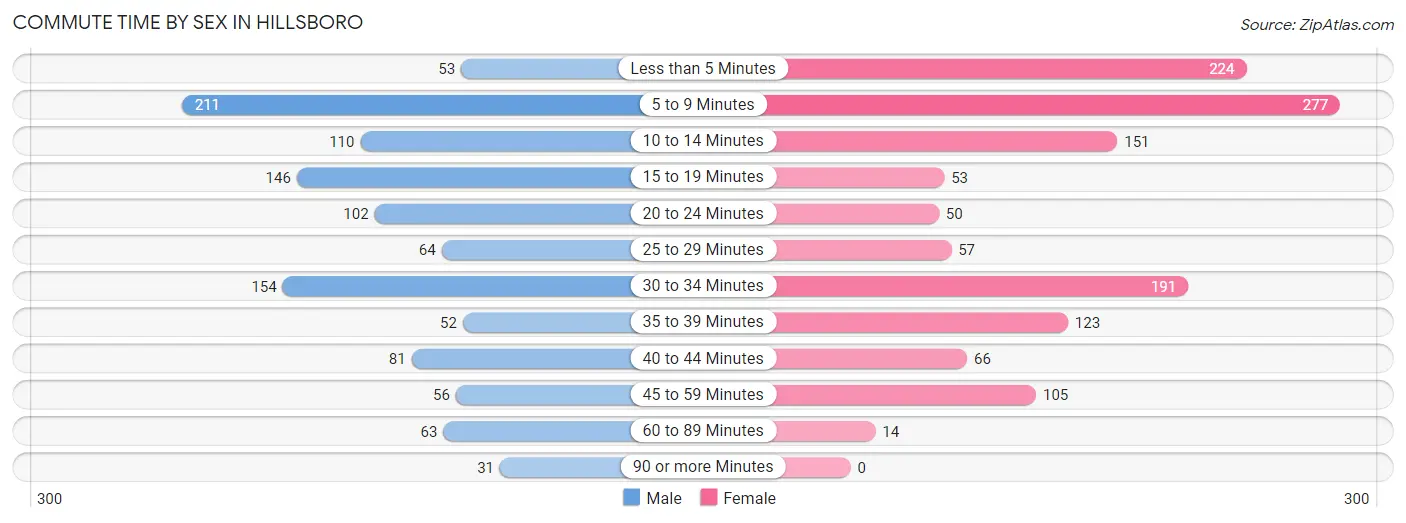
| Commute Time | Male | Female |
| Less than 5 Minutes | 53 (4.7%) | 224 (17.1%) |
| 5 to 9 Minutes | 211 (18.8%) | 277 (21.1%) |
| 10 to 14 Minutes | 110 (9.8%) | 151 (11.5%) |
| 15 to 19 Minutes | 146 (13.0%) | 53 (4.0%) |
| 20 to 24 Minutes | 102 (9.1%) | 50 (3.8%) |
| 25 to 29 Minutes | 64 (5.7%) | 57 (4.3%) |
| 30 to 34 Minutes | 154 (13.7%) | 191 (14.6%) |
| 35 to 39 Minutes | 52 (4.6%) | 123 (9.4%) |
| 40 to 44 Minutes | 81 (7.2%) | 66 (5.0%) |
| 45 to 59 Minutes | 56 (5.0%) | 105 (8.0%) |
| 60 to 89 Minutes | 63 (5.6%) | 14 (1.1%) |
| 90 or more Minutes | 31 (2.8%) | 0 (0.0%) |
Time of Departure to Work by Sex in Hillsboro
The most frequent times of departure to work in Hillsboro are 12:00 PM to 3:59 PM (157, 14.0%) for males and 7:30 AM to 7:59 AM (272, 20.7%) for females.
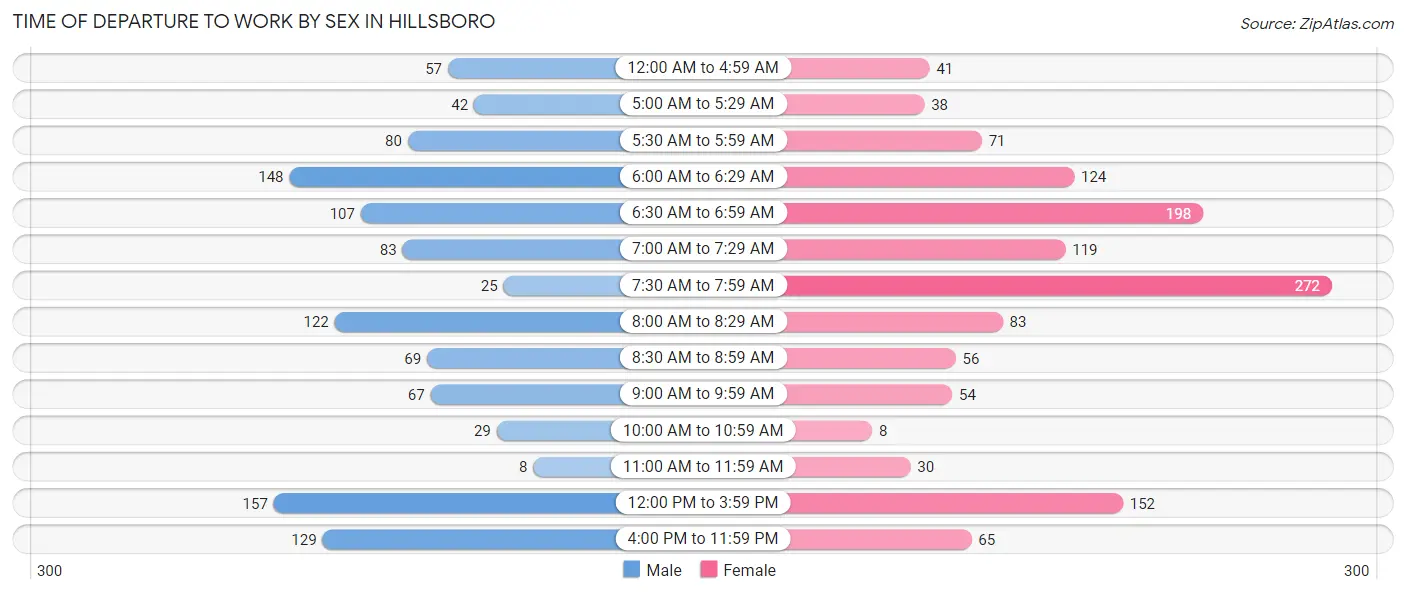
| Time of Departure | Male | Female |
| 12:00 AM to 4:59 AM | 57 (5.1%) | 41 (3.1%) |
| 5:00 AM to 5:29 AM | 42 (3.7%) | 38 (2.9%) |
| 5:30 AM to 5:59 AM | 80 (7.1%) | 71 (5.4%) |
| 6:00 AM to 6:29 AM | 148 (13.2%) | 124 (9.5%) |
| 6:30 AM to 6:59 AM | 107 (9.5%) | 198 (15.1%) |
| 7:00 AM to 7:29 AM | 83 (7.4%) | 119 (9.1%) |
| 7:30 AM to 7:59 AM | 25 (2.2%) | 272 (20.7%) |
| 8:00 AM to 8:29 AM | 122 (10.9%) | 83 (6.3%) |
| 8:30 AM to 8:59 AM | 69 (6.1%) | 56 (4.3%) |
| 9:00 AM to 9:59 AM | 67 (6.0%) | 54 (4.1%) |
| 10:00 AM to 10:59 AM | 29 (2.6%) | 8 (0.6%) |
| 11:00 AM to 11:59 AM | 8 (0.7%) | 30 (2.3%) |
| 12:00 PM to 3:59 PM | 157 (14.0%) | 152 (11.6%) |
| 4:00 PM to 11:59 PM | 129 (11.5%) | 65 (5.0%) |
| Total | 1,123 (100.0%) | 1,311 (100.0%) |
Housing Occupancy in Hillsboro
Occupancy by Ownership in Hillsboro
Of the total 2,793 dwellings in Hillsboro, owner-occupied units account for 1,563 (56.0%), while renter-occupied units make up 1,230 (44.0%).
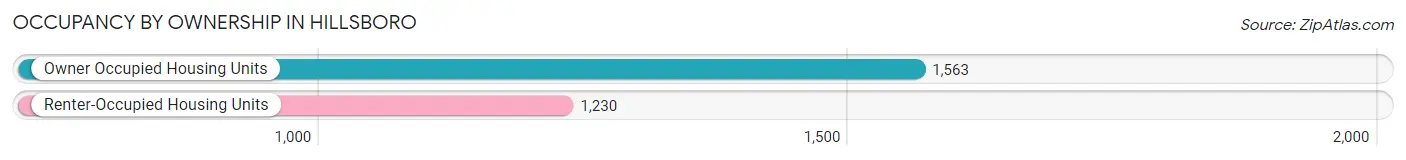
| Occupancy | # Housing Units | % Housing Units |
| Owner Occupied Housing Units | 1,563 | 56.0% |
| Renter-Occupied Housing Units | 1,230 | 44.0% |
| Total Occupied Housing Units | 2,793 | 100.0% |
Occupancy by Household Size in Hillsboro
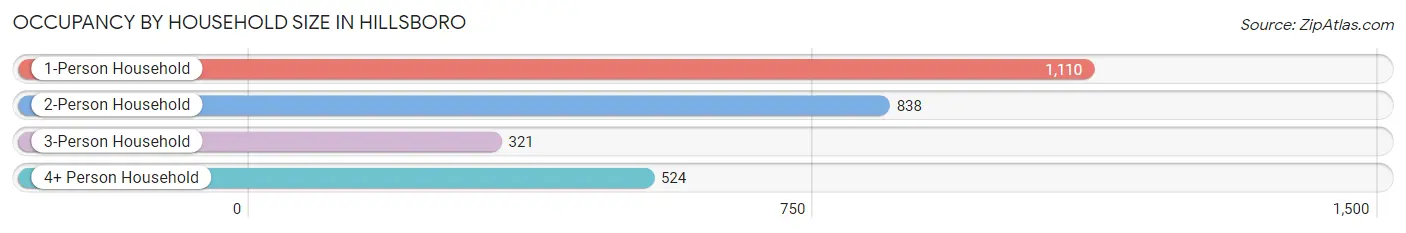
| Household Size | # Housing Units | % Housing Units |
| 1-Person Household | 1,110 | 39.7% |
| 2-Person Household | 838 | 30.0% |
| 3-Person Household | 321 | 11.5% |
| 4+ Person Household | 524 | 18.8% |
| Total Housing Units | 2,793 | 100.0% |
Occupancy by Ownership by Household Size in Hillsboro
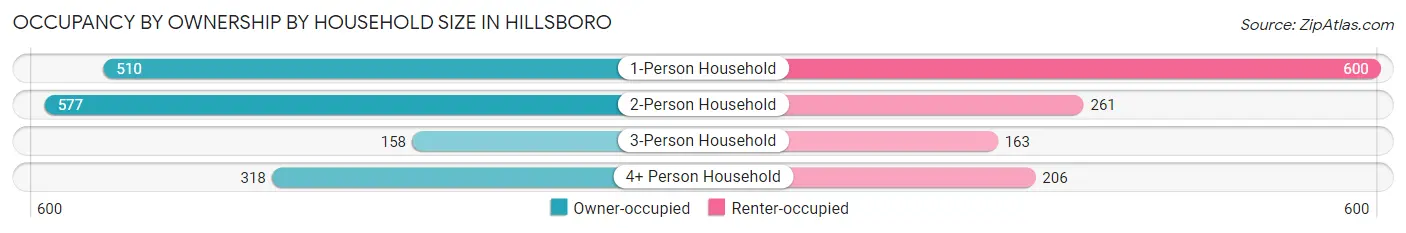
| Household Size | Owner-occupied | Renter-occupied |
| 1-Person Household | 510 (46.0%) | 600 (54.0%) |
| 2-Person Household | 577 (68.9%) | 261 (31.1%) |
| 3-Person Household | 158 (49.2%) | 163 (50.8%) |
| 4+ Person Household | 318 (60.7%) | 206 (39.3%) |
| Total Housing Units | 1,563 (56.0%) | 1,230 (44.0%) |
Occupancy by Educational Attainment in Hillsboro
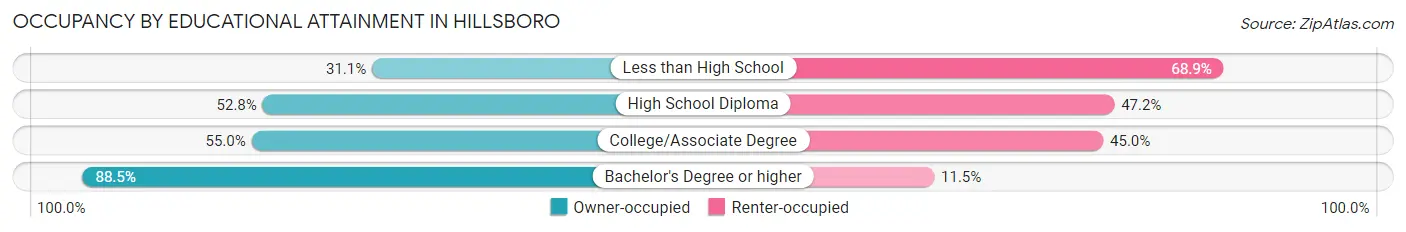
| Household Size | Owner-occupied | Renter-occupied |
| Less than High School | 121 (31.1%) | 268 (68.9%) |
| High School Diploma | 629 (52.8%) | 562 (47.2%) |
| College/Associate Degree | 428 (55.0%) | 350 (45.0%) |
| Bachelor's Degree or higher | 385 (88.5%) | 50 (11.5%) |
Occupancy by Age of Householder in Hillsboro
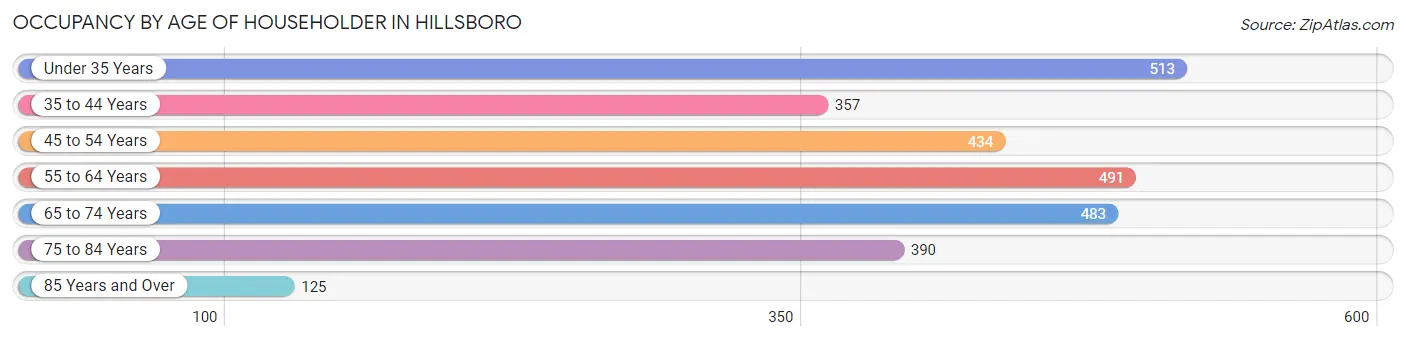
| Age Bracket | # Households | % Households |
| Under 35 Years | 513 | 18.4% |
| 35 to 44 Years | 357 | 12.8% |
| 45 to 54 Years | 434 | 15.5% |
| 55 to 64 Years | 491 | 17.6% |
| 65 to 74 Years | 483 | 17.3% |
| 75 to 84 Years | 390 | 14.0% |
| 85 Years and Over | 125 | 4.5% |
| Total | 2,793 | 100.0% |
Housing Finances in Hillsboro
Median Income by Occupancy in Hillsboro
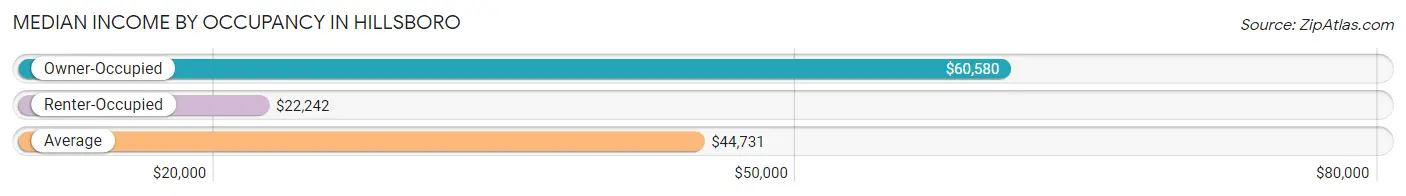
| Occupancy Type | # Households | Median Income |
| Owner-Occupied | 1,563 (56.0%) | $60,580 |
| Renter-Occupied | 1,230 (44.0%) | $22,242 |
| Average | 2,793 (100.0%) | $44,731 |
Occupancy by Householder Income Bracket in Hillsboro
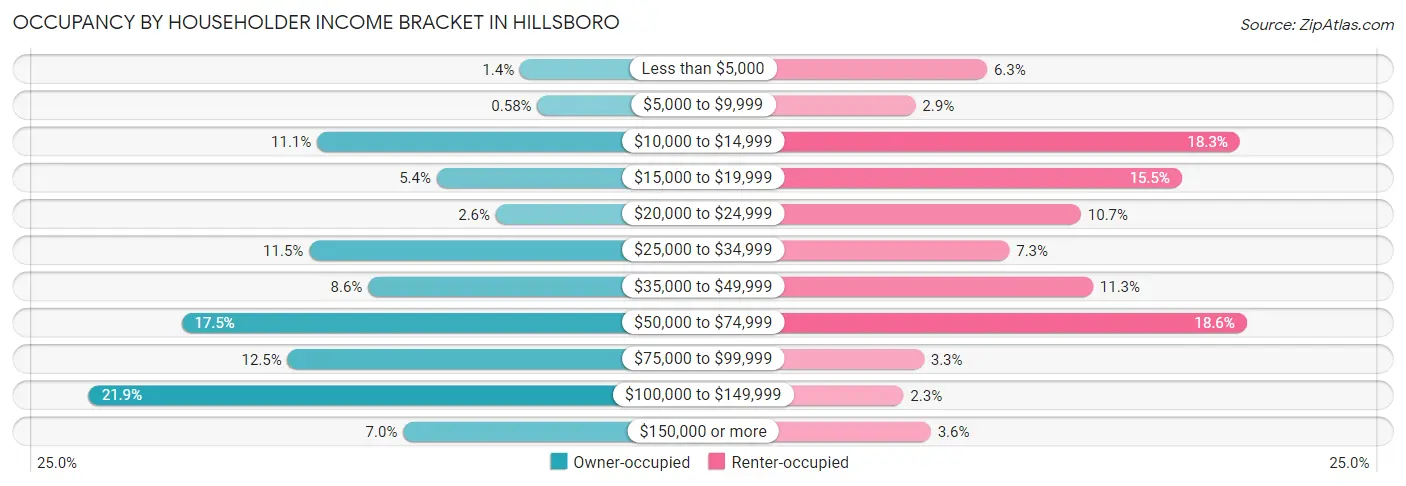
| Income Bracket | Owner-occupied | Renter-occupied |
| Less than $5,000 | 22 (1.4%) | 77 (6.3%) |
| $5,000 to $9,999 | 9 (0.6%) | 35 (2.9%) |
| $10,000 to $14,999 | 173 (11.1%) | 225 (18.3%) |
| $15,000 to $19,999 | 84 (5.4%) | 191 (15.5%) |
| $20,000 to $24,999 | 40 (2.6%) | 132 (10.7%) |
| $25,000 to $34,999 | 179 (11.5%) | 90 (7.3%) |
| $35,000 to $49,999 | 135 (8.6%) | 139 (11.3%) |
| $50,000 to $74,999 | 274 (17.5%) | 229 (18.6%) |
| $75,000 to $99,999 | 195 (12.5%) | 40 (3.3%) |
| $100,000 to $149,999 | 343 (21.9%) | 28 (2.3%) |
| $150,000 or more | 109 (7.0%) | 44 (3.6%) |
| Total | 1,563 (100.0%) | 1,230 (100.0%) |
Monthly Housing Cost Tiers in Hillsboro
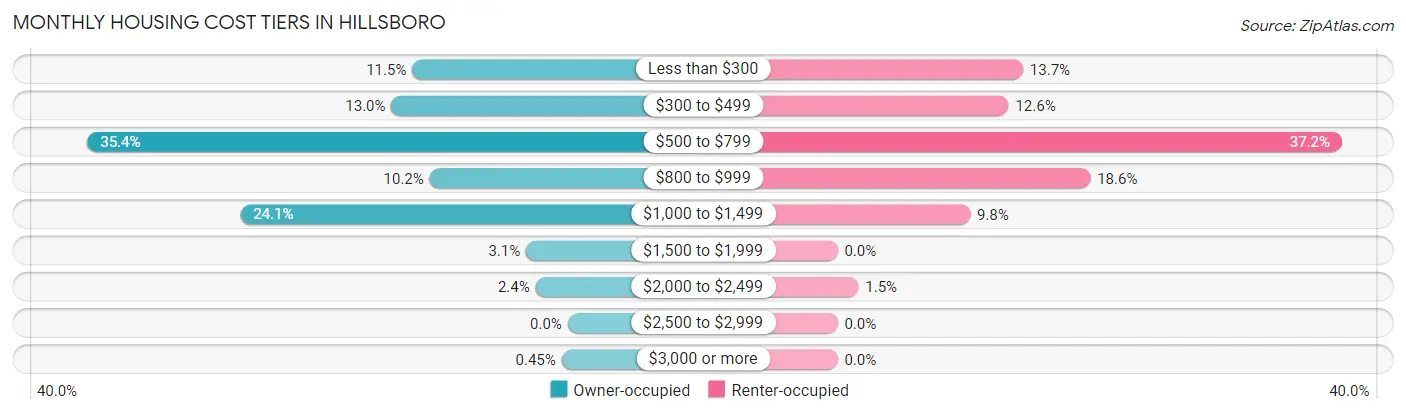
| Monthly Cost | Owner-occupied | Renter-occupied |
| Less than $300 | 179 (11.5%) | 168 (13.7%) |
| $300 to $499 | 203 (13.0%) | 155 (12.6%) |
| $500 to $799 | 553 (35.4%) | 457 (37.1%) |
| $800 to $999 | 159 (10.2%) | 229 (18.6%) |
| $1,000 to $1,499 | 377 (24.1%) | 120 (9.8%) |
| $1,500 to $1,999 | 48 (3.1%) | 0 (0.0%) |
| $2,000 to $2,499 | 37 (2.4%) | 19 (1.5%) |
| $2,500 to $2,999 | 0 (0.0%) | 0 (0.0%) |
| $3,000 or more | 7 (0.4%) | 0 (0.0%) |
| Total | 1,563 (100.0%) | 1,230 (100.0%) |
Physical Housing Characteristics in Hillsboro
Housing Structures in Hillsboro
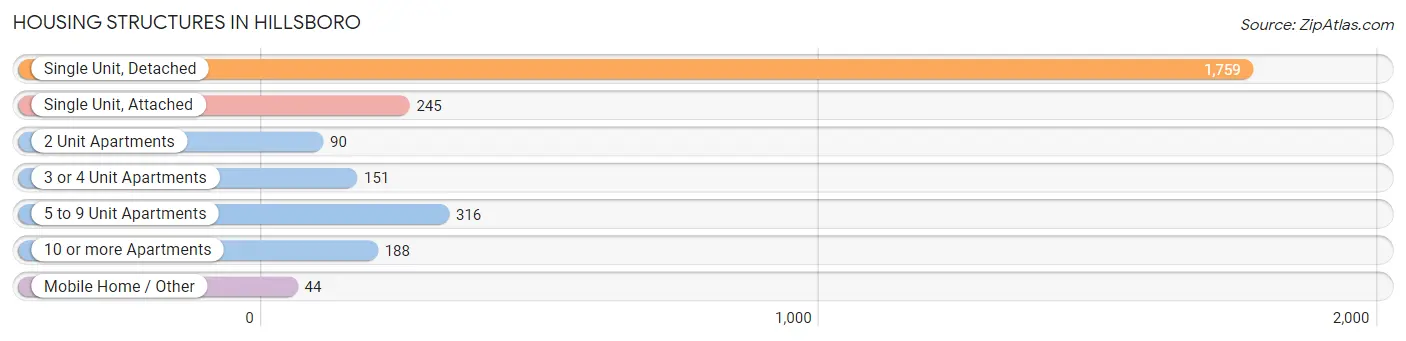
| Structure Type | # Housing Units | % Housing Units |
| Single Unit, Detached | 1,759 | 63.0% |
| Single Unit, Attached | 245 | 8.8% |
| 2 Unit Apartments | 90 | 3.2% |
| 3 or 4 Unit Apartments | 151 | 5.4% |
| 5 to 9 Unit Apartments | 316 | 11.3% |
| 10 or more Apartments | 188 | 6.7% |
| Mobile Home / Other | 44 | 1.6% |
| Total | 2,793 | 100.0% |
Housing Structures by Occupancy in Hillsboro
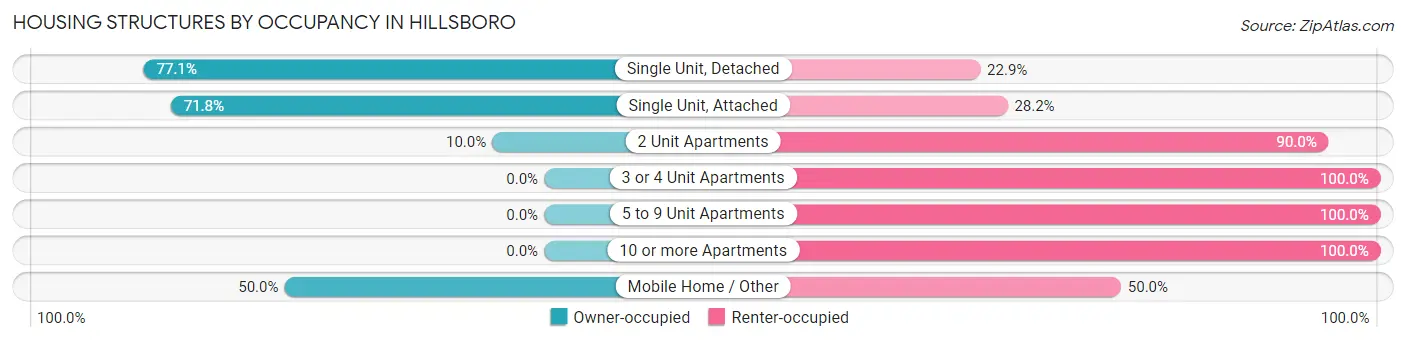
| Structure Type | Owner-occupied | Renter-occupied |
| Single Unit, Detached | 1,356 (77.1%) | 403 (22.9%) |
| Single Unit, Attached | 176 (71.8%) | 69 (28.2%) |
| 2 Unit Apartments | 9 (10.0%) | 81 (90.0%) |
| 3 or 4 Unit Apartments | 0 (0.0%) | 151 (100.0%) |
| 5 to 9 Unit Apartments | 0 (0.0%) | 316 (100.0%) |
| 10 or more Apartments | 0 (0.0%) | 188 (100.0%) |
| Mobile Home / Other | 22 (50.0%) | 22 (50.0%) |
| Total | 1,563 (56.0%) | 1,230 (44.0%) |
Housing Structures by Number of Rooms in Hillsboro
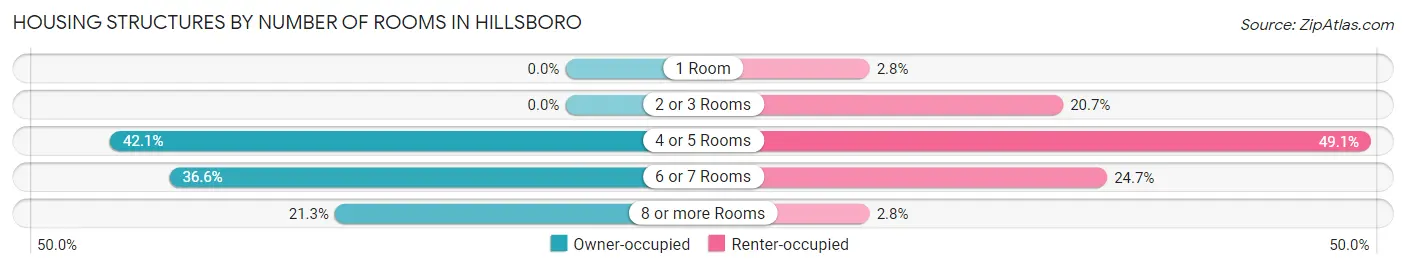
| Number of Rooms | Owner-occupied | Renter-occupied |
| 1 Room | 0 (0.0%) | 34 (2.8%) |
| 2 or 3 Rooms | 0 (0.0%) | 254 (20.6%) |
| 4 or 5 Rooms | 658 (42.1%) | 604 (49.1%) |
| 6 or 7 Rooms | 572 (36.6%) | 304 (24.7%) |
| 8 or more Rooms | 333 (21.3%) | 34 (2.8%) |
| Total | 1,563 (100.0%) | 1,230 (100.0%) |
Housing Structure by Heating Type in Hillsboro
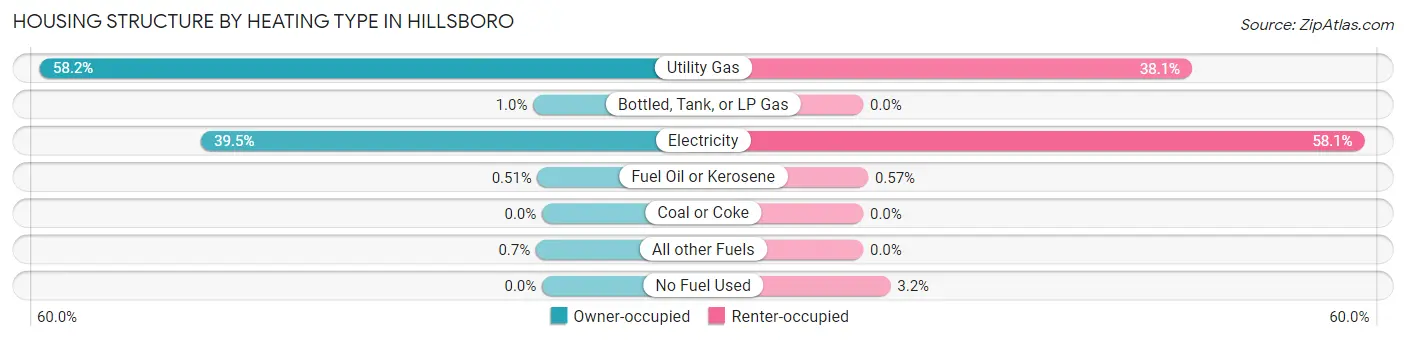
| Heating Type | Owner-occupied | Renter-occupied |
| Utility Gas | 910 (58.2%) | 469 (38.1%) |
| Bottled, Tank, or LP Gas | 16 (1.0%) | 0 (0.0%) |
| Electricity | 618 (39.5%) | 715 (58.1%) |
| Fuel Oil or Kerosene | 8 (0.5%) | 7 (0.6%) |
| Coal or Coke | 0 (0.0%) | 0 (0.0%) |
| All other Fuels | 11 (0.7%) | 0 (0.0%) |
| No Fuel Used | 0 (0.0%) | 39 (3.2%) |
| Total | 1,563 (100.0%) | 1,230 (100.0%) |
Household Vehicle Usage in Hillsboro
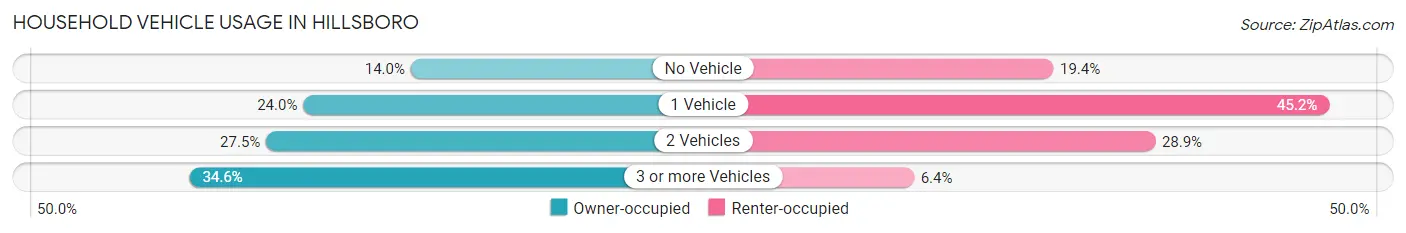
| Vehicles per Household | Owner-occupied | Renter-occupied |
| No Vehicle | 218 (14.0%) | 239 (19.4%) |
| 1 Vehicle | 375 (24.0%) | 556 (45.2%) |
| 2 Vehicles | 429 (27.5%) | 356 (28.9%) |
| 3 or more Vehicles | 541 (34.6%) | 79 (6.4%) |
| Total | 1,563 (100.0%) | 1,230 (100.0%) |
Real Estate & Mortgages in Hillsboro
Real Estate and Mortgage Overview in Hillsboro
| Characteristic | Without Mortgage | With Mortgage |
| Housing Units | 688 | 875 |
| Median Property Value | $123,900 | $115,500 |
| Median Household Income | $37,000 | $94 |
| Monthly Housing Costs | $473 | $7 |
| Real Estate Taxes | $1,386 | $10 |
Property Value by Mortgage Status in Hillsboro
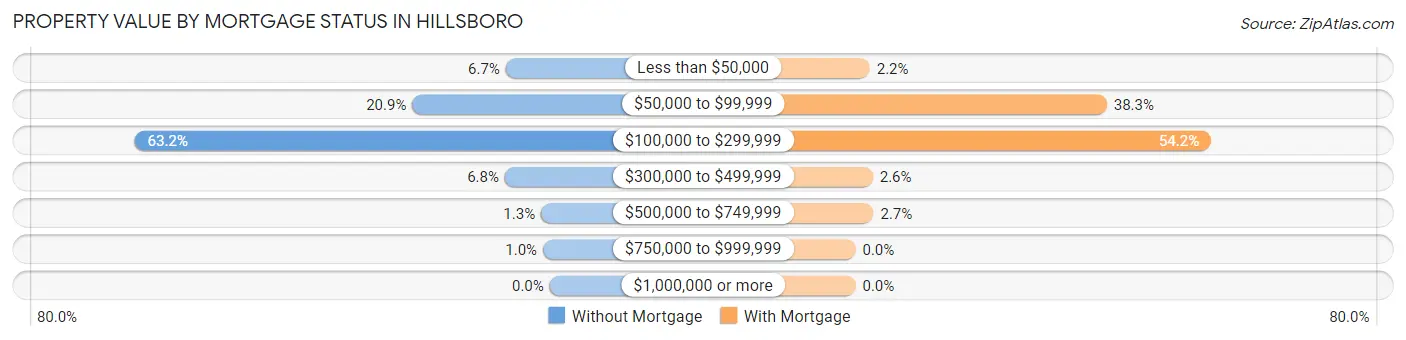
| Property Value | Without Mortgage | With Mortgage |
| Less than $50,000 | 46 (6.7%) | 19 (2.2%) |
| $50,000 to $99,999 | 144 (20.9%) | 335 (38.3%) |
| $100,000 to $299,999 | 435 (63.2%) | 474 (54.2%) |
| $300,000 to $499,999 | 47 (6.8%) | 23 (2.6%) |
| $500,000 to $749,999 | 9 (1.3%) | 24 (2.7%) |
| $750,000 to $999,999 | 7 (1.0%) | 0 (0.0%) |
| $1,000,000 or more | 0 (0.0%) | 0 (0.0%) |
| Total | 688 (100.0%) | 875 (100.0%) |
Household Income by Mortgage Status in Hillsboro
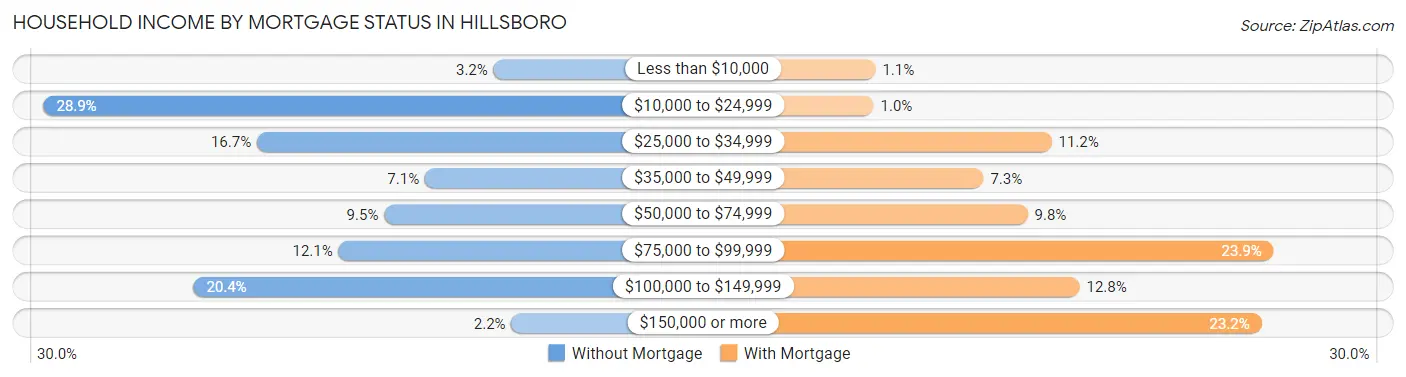
| Household Income | Without Mortgage | With Mortgage |
| Less than $10,000 | 22 (3.2%) | 10 (1.1%) |
| $10,000 to $24,999 | 199 (28.9%) | 9 (1.0%) |
| $25,000 to $34,999 | 115 (16.7%) | 98 (11.2%) |
| $35,000 to $49,999 | 49 (7.1%) | 64 (7.3%) |
| $50,000 to $74,999 | 65 (9.5%) | 86 (9.8%) |
| $75,000 to $99,999 | 83 (12.1%) | 209 (23.9%) |
| $100,000 to $149,999 | 140 (20.3%) | 112 (12.8%) |
| $150,000 or more | 15 (2.2%) | 203 (23.2%) |
| Total | 688 (100.0%) | 875 (100.0%) |
Property Value to Household Income Ratio in Hillsboro
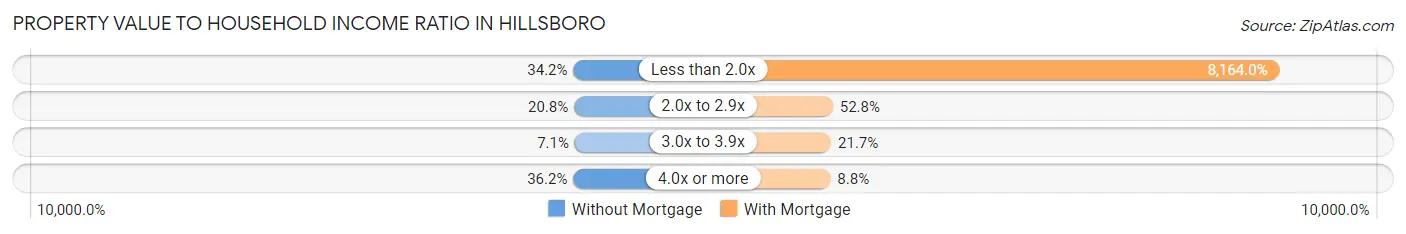
| Value-to-Income Ratio | Without Mortgage | With Mortgage |
| Less than 2.0x | 235 (34.2%) | 71,435 (8,164.0%) |
| 2.0x to 2.9x | 143 (20.8%) | 462 (52.8%) |
| 3.0x to 3.9x | 49 (7.1%) | 190 (21.7%) |
| 4.0x or more | 249 (36.2%) | 77 (8.8%) |
| Total | 688 (100.0%) | 875 (100.0%) |
Real Estate Taxes by Mortgage Status in Hillsboro
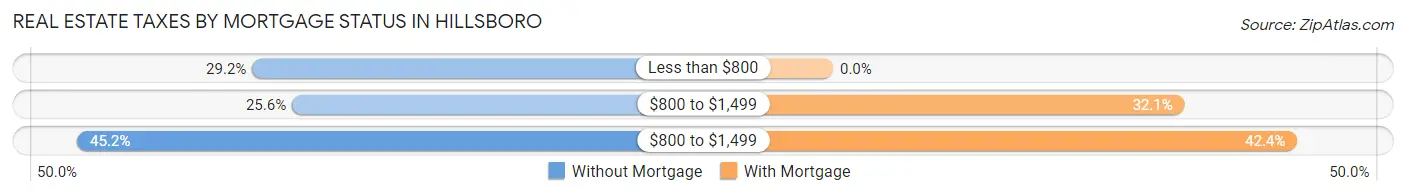
| Property Taxes | Without Mortgage | With Mortgage |
| Less than $800 | 201 (29.2%) | 0 (0.0%) |
| $800 to $1,499 | 176 (25.6%) | 281 (32.1%) |
| $800 to $1,499 | 311 (45.2%) | 371 (42.4%) |
| Total | 688 (100.0%) | 875 (100.0%) |
Health & Disability in Hillsboro
Health Insurance Coverage by Age in Hillsboro
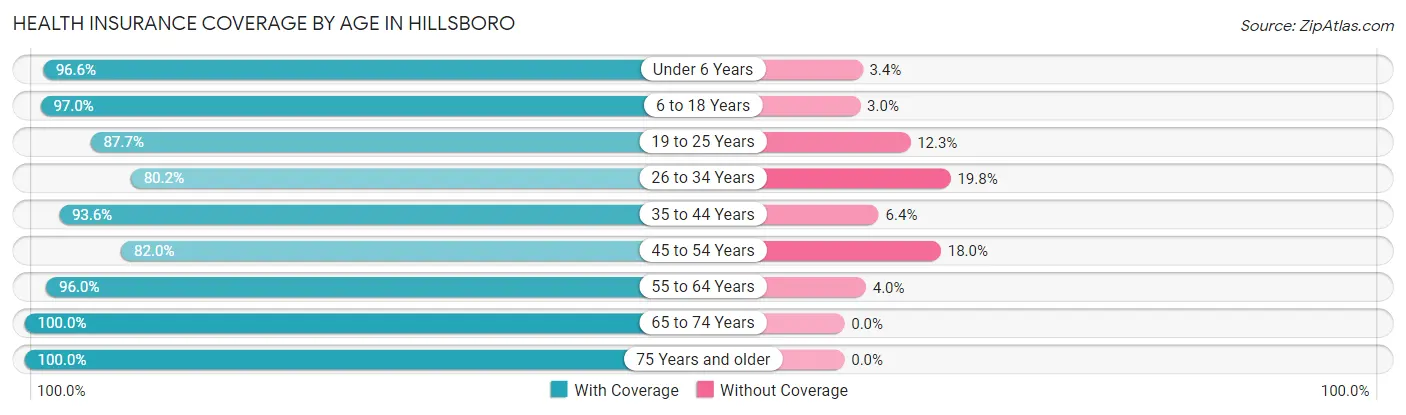
| Age Bracket | With Coverage | Without Coverage |
| Under 6 Years | 486 (96.6%) | 17 (3.4%) |
| 6 to 18 Years | 917 (97.0%) | 28 (3.0%) |
| 19 to 25 Years | 614 (87.7%) | 86 (12.3%) |
| 26 to 34 Years | 474 (80.2%) | 117 (19.8%) |
| 35 to 44 Years | 613 (93.6%) | 42 (6.4%) |
| 45 to 54 Years | 533 (82.0%) | 117 (18.0%) |
| 55 to 64 Years | 719 (96.0%) | 30 (4.0%) |
| 65 to 74 Years | 688 (100.0%) | 0 (0.0%) |
| 75 Years and older | 642 (100.0%) | 0 (0.0%) |
| Total | 5,686 (92.9%) | 437 (7.1%) |
Health Insurance Coverage by Citizenship Status in Hillsboro
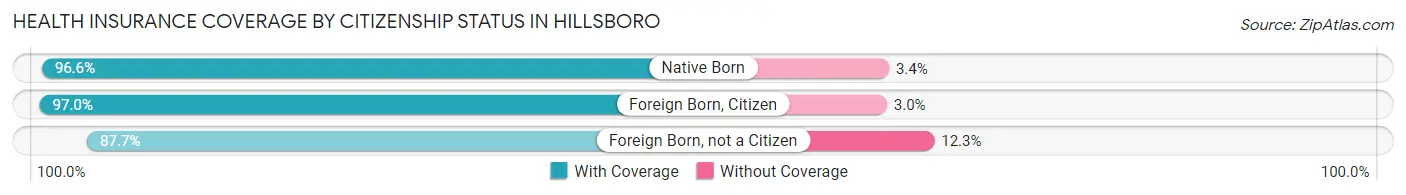
| Citizenship Status | With Coverage | Without Coverage |
| Native Born | 486 (96.6%) | 17 (3.4%) |
| Foreign Born, Citizen | 917 (97.0%) | 28 (3.0%) |
| Foreign Born, not a Citizen | 614 (87.7%) | 86 (12.3%) |
Health Insurance Coverage by Household Income in Hillsboro
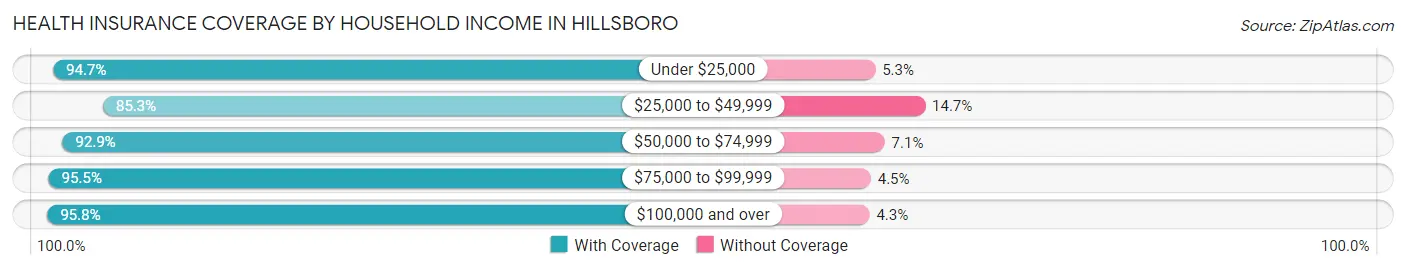
| Household Income | With Coverage | Without Coverage |
| Under $25,000 | 1,368 (94.7%) | 77 (5.3%) |
| $25,000 to $49,999 | 1,012 (85.3%) | 174 (14.7%) |
| $50,000 to $74,999 | 1,205 (92.9%) | 92 (7.1%) |
| $75,000 to $99,999 | 742 (95.5%) | 35 (4.5%) |
| $100,000 and over | 1,328 (95.8%) | 59 (4.3%) |
Public vs Private Health Insurance Coverage by Age in Hillsboro
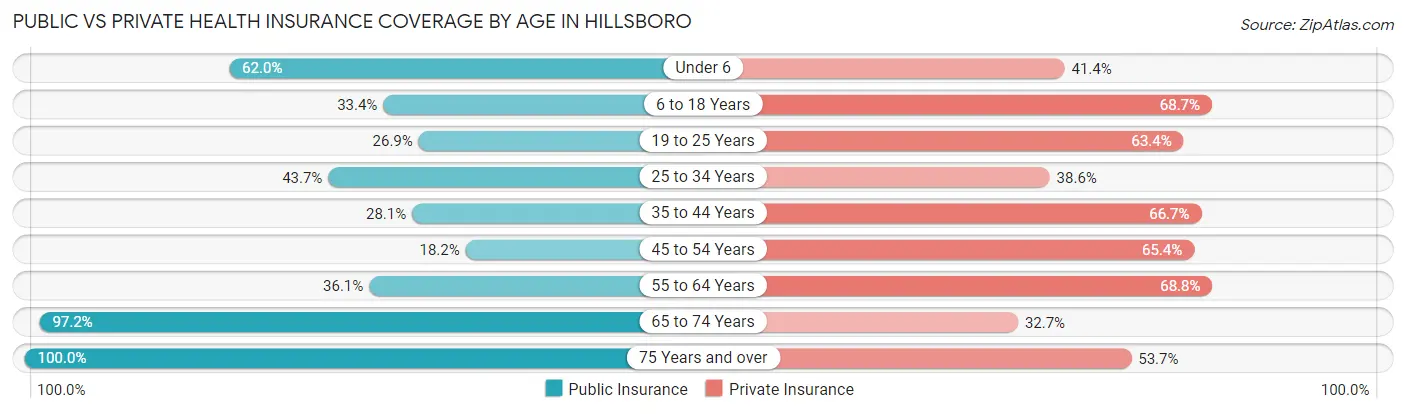
| Age Bracket | Public Insurance | Private Insurance |
| Under 6 | 312 (62.0%) | 208 (41.3%) |
| 6 to 18 Years | 316 (33.4%) | 649 (68.7%) |
| 19 to 25 Years | 188 (26.9%) | 444 (63.4%) |
| 25 to 34 Years | 258 (43.6%) | 228 (38.6%) |
| 35 to 44 Years | 184 (28.1%) | 437 (66.7%) |
| 45 to 54 Years | 118 (18.1%) | 425 (65.4%) |
| 55 to 64 Years | 270 (36.0%) | 515 (68.8%) |
| 65 to 74 Years | 669 (97.2%) | 225 (32.7%) |
| 75 Years and over | 642 (100.0%) | 345 (53.7%) |
| Total | 2,957 (48.3%) | 3,476 (56.8%) |
Disability Status by Sex by Age in Hillsboro
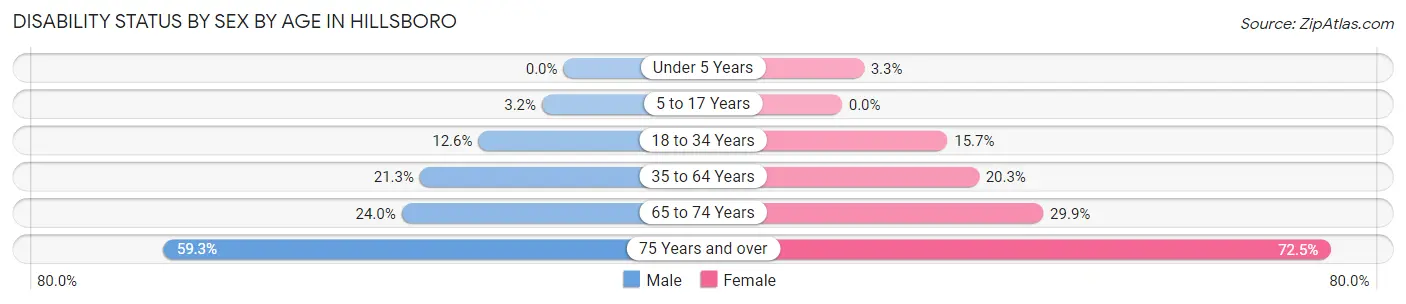
| Age Bracket | Male | Female |
| Under 5 Years | 0 (0.0%) | 5 (3.3%) |
| 5 to 17 Years | 15 (3.2%) | 0 (0.0%) |
| 18 to 34 Years | 83 (12.6%) | 115 (15.7%) |
| 35 to 64 Years | 181 (21.3%) | 245 (20.3%) |
| 65 to 74 Years | 93 (24.0%) | 90 (29.9%) |
| 75 Years and over | 70 (59.3%) | 380 (72.5%) |
Disability Class by Sex by Age in Hillsboro
Disability Class: Hearing Difficulty
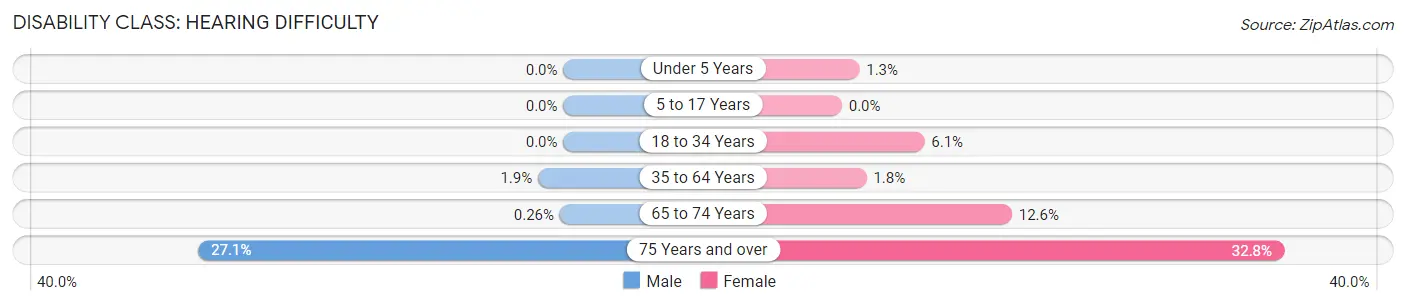
| Age Bracket | Male | Female |
| Under 5 Years | 0 (0.0%) | 2 (1.3%) |
| 5 to 17 Years | 0 (0.0%) | 0 (0.0%) |
| 18 to 34 Years | 0 (0.0%) | 45 (6.1%) |
| 35 to 64 Years | 16 (1.9%) | 22 (1.8%) |
| 65 to 74 Years | 1 (0.3%) | 38 (12.6%) |
| 75 Years and over | 32 (27.1%) | 172 (32.8%) |
Disability Class: Vision Difficulty
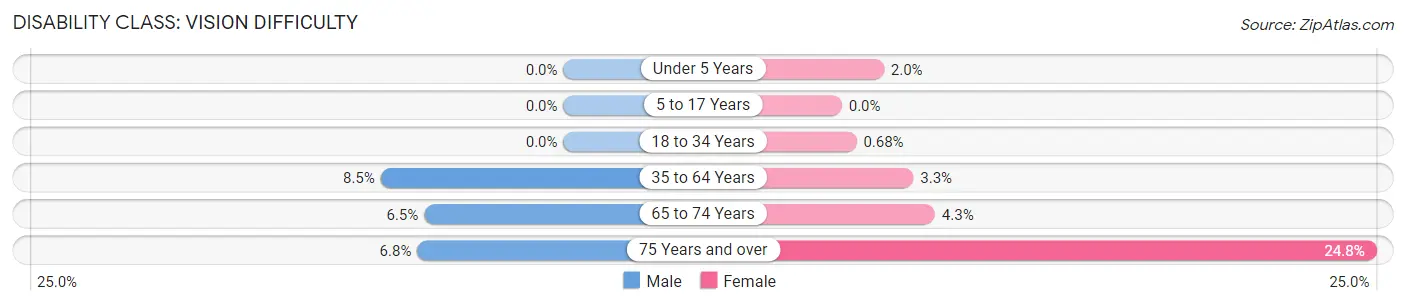
| Age Bracket | Male | Female |
| Under 5 Years | 0 (0.0%) | 3 (1.9%) |
| 5 to 17 Years | 0 (0.0%) | 0 (0.0%) |
| 18 to 34 Years | 0 (0.0%) | 5 (0.7%) |
| 35 to 64 Years | 72 (8.5%) | 40 (3.3%) |
| 65 to 74 Years | 25 (6.5%) | 13 (4.3%) |
| 75 Years and over | 8 (6.8%) | 130 (24.8%) |
Disability Class: Cognitive Difficulty
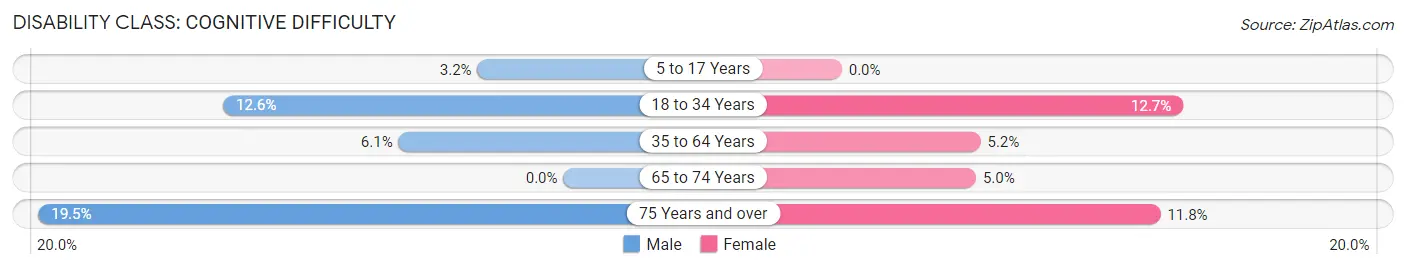
| Age Bracket | Male | Female |
| 5 to 17 Years | 15 (3.2%) | 0 (0.0%) |
| 18 to 34 Years | 83 (12.6%) | 93 (12.7%) |
| 35 to 64 Years | 52 (6.1%) | 62 (5.1%) |
| 65 to 74 Years | 0 (0.0%) | 15 (5.0%) |
| 75 Years and over | 23 (19.5%) | 62 (11.8%) |
Disability Class: Ambulatory Difficulty
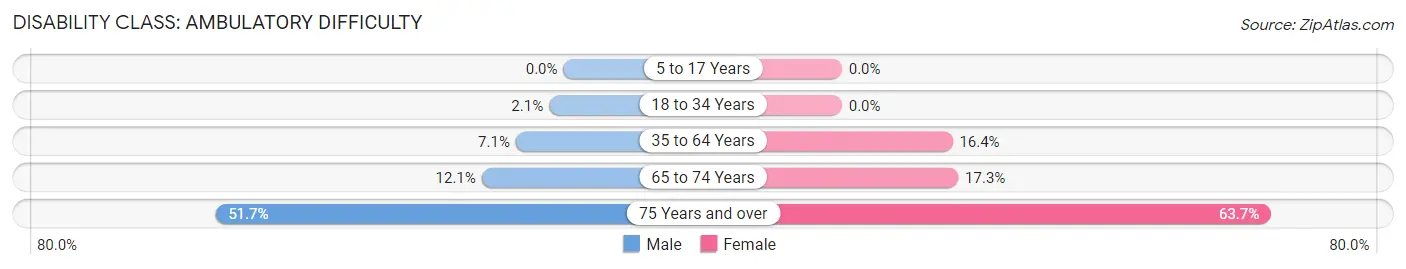
| Age Bracket | Male | Female |
| 5 to 17 Years | 0 (0.0%) | 0 (0.0%) |
| 18 to 34 Years | 14 (2.1%) | 0 (0.0%) |
| 35 to 64 Years | 60 (7.1%) | 198 (16.4%) |
| 65 to 74 Years | 47 (12.1%) | 52 (17.3%) |
| 75 Years and over | 61 (51.7%) | 334 (63.7%) |
Disability Class: Self-Care Difficulty
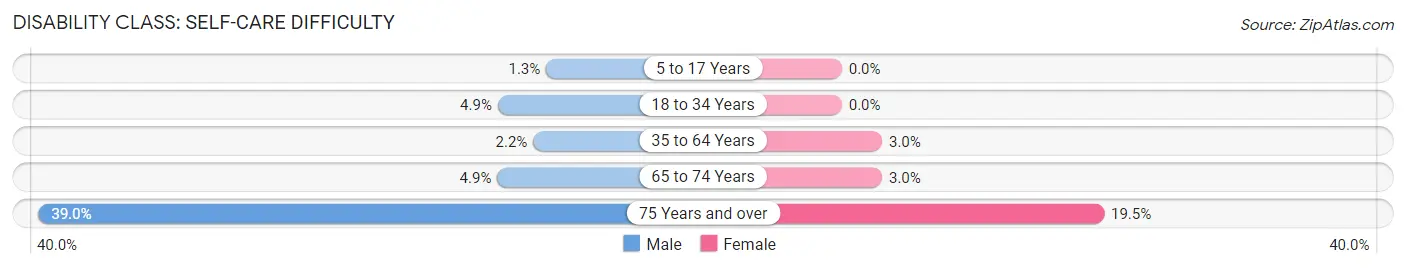
| Age Bracket | Male | Female |
| 5 to 17 Years | 6 (1.3%) | 0 (0.0%) |
| 18 to 34 Years | 32 (4.9%) | 0 (0.0%) |
| 35 to 64 Years | 19 (2.2%) | 36 (3.0%) |
| 65 to 74 Years | 19 (4.9%) | 9 (3.0%) |
| 75 Years and over | 46 (39.0%) | 102 (19.5%) |
Technology Access in Hillsboro
Computing Device Access in Hillsboro
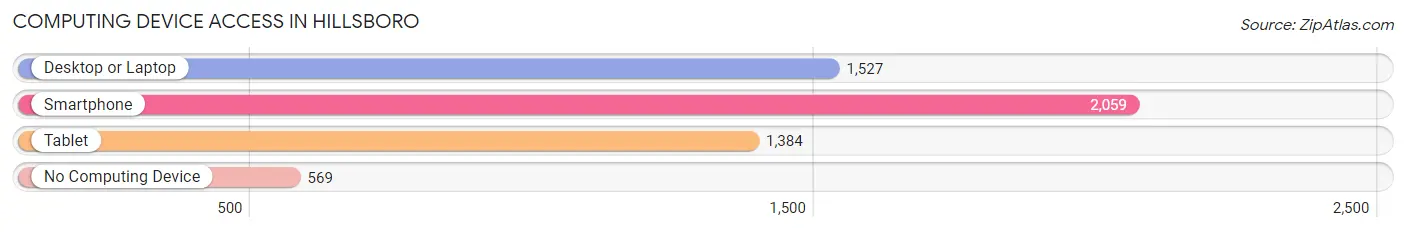
| Device Type | # Households | % Households |
| Desktop or Laptop | 1,527 | 54.7% |
| Smartphone | 2,059 | 73.7% |
| Tablet | 1,384 | 49.5% |
| No Computing Device | 569 | 20.4% |
| Total | 2,793 | 100.0% |
Internet Access in Hillsboro
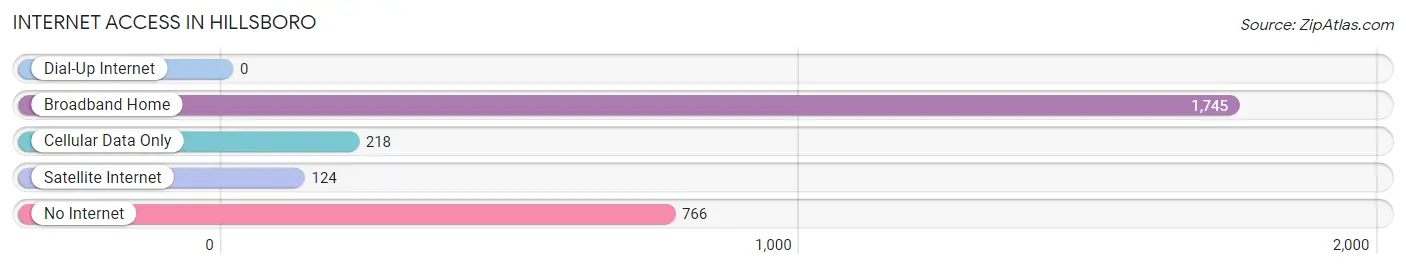
| Internet Type | # Households | % Households |
| Dial-Up Internet | 0 | 0.0% |
| Broadband Home | 1,745 | 62.5% |
| Cellular Data Only | 218 | 7.8% |
| Satellite Internet | 124 | 4.4% |
| No Internet | 766 | 27.4% |
| Total | 2,793 | 100.0% |
Hillsboro Summary
Hillsboro, Ohio is a small city located in Highland County, Ohio. It is the county seat of Highland County and is located in the southwestern part of the state. The city has a population of 6,605 as of the 2010 census.
History
Hillsboro was founded in 1807 by William Hill, a Revolutionary War veteran. Hill had purchased the land from the government and named the town after himself. The town was incorporated in 1817 and was the first county seat of Highland County.
The town was an important stop on the Underground Railroad, with many of the town's residents helping to hide and transport escaped slaves. The town was also a major stop on the Cincinnati-Hillsboro Railroad, which was built in 1851.
Geography
Hillsboro is located in southwestern Ohio, in the foothills of the Appalachian Mountains. The city is situated on the banks of the Little Miami River, which flows through the city. The city is located about 40 miles east of Cincinnati and about 50 miles west of Columbus.
The city has a total area of 4.2 square miles, all of which is land. The city is located at an elevation of 890 feet above sea level.
Economy
Hillsboro's economy is largely based on agriculture and manufacturing. The city is home to several large manufacturing companies, including Hillsboro Industries, which produces automotive parts, and Hillsboro Plastics, which produces plastic products.
The city is also home to several small businesses, including restaurants, retail stores, and service providers. The city is also home to several educational institutions, including Hillsboro High School, Hillsboro Community College, and the University of Cincinnati-Hillsboro.
Demographics
As of the 2010 census, the city had a population of 6,605. The racial makeup of the city was 95.2% White, 1.2% African American, 0.3% Native American, 0.5% Asian, 0.1% Pacific Islander, 0.7% from other races, and 1.9% from two or more races. Hispanic or Latino of any race were 2.2% of the population.
The median income for a household in the city was $35,938, and the median income for a family was $45,938. The per capita income for the city was $19,845. About 14.2% of families and 17.2% of the population were below the poverty line, including 25.2% of those under age 18 and 8.2% of those age 65 or over.
Hillsboro is a small city with a rich history and a diverse economy. The city is home to several large manufacturing companies, as well as small businesses and educational institutions. The city has a population of 6,605, with a median income of $35,938. The city is located in the foothills of the Appalachian Mountains and is an important stop on the Underground Railroad.
Common Questions
What is Per Capita Income in Hillsboro?
Per Capita income in Hillsboro is $24,490.
What is the Median Family Income in Hillsboro?
Median Family Income in Hillsboro is $65,341.
What is the Median Household income in Hillsboro?
Median Household Income in Hillsboro is $44,731.
What is Income or Wage Gap in Hillsboro?
Income or Wage Gap in Hillsboro is 33.8%.
Women in Hillsboro earn 66.2 cents for every dollar earned by a man.
What is Family Income Deficit in Hillsboro?
Family Income Deficit in Hillsboro is $8,527.
Families that are below poverty line in Hillsboro earn $8,527 less on average than the poverty threshold level.
What is Inequality or Gini Index in Hillsboro?
Inequality or Gini Index in Hillsboro is 0.45.
What is the Total Population of Hillsboro?
Total Population of Hillsboro is 6,492.
What is the Total Male Population of Hillsboro?
Total Male Population of Hillsboro is 2,911.
What is the Total Female Population of Hillsboro?
Total Female Population of Hillsboro is 3,581.
What is the Ratio of Males per 100 Females in Hillsboro?
There are 81.29 Males per 100 Females in Hillsboro.
What is the Ratio of Females per 100 Males in Hillsboro?
There are 123.02 Females per 100 Males in Hillsboro.
What is the Median Population Age in Hillsboro?
Median Population Age in Hillsboro is 41.2 Years.
What is the Average Family Size in Hillsboro
Average Family Size in Hillsboro is 2.9 People.
What is the Average Household Size in Hillsboro
Average Household Size in Hillsboro is 2.2 People.
How Large is the Labor Force in Hillsboro?
There are 2,742 People in the Labor Forcein in Hillsboro.
What is the Percentage of People in the Labor Force in Hillsboro?
51.6% of People are in the Labor Force in Hillsboro.
What is the Unemployment Rate in Hillsboro?
Unemployment Rate in Hillsboro is 5.0%.