Cities with the Highest Percentage of Population Employed in Community & Social Service in Ohio
RELATED REPORTS & OPTIONS
Community & Social Service
Ohio
Compare Cities
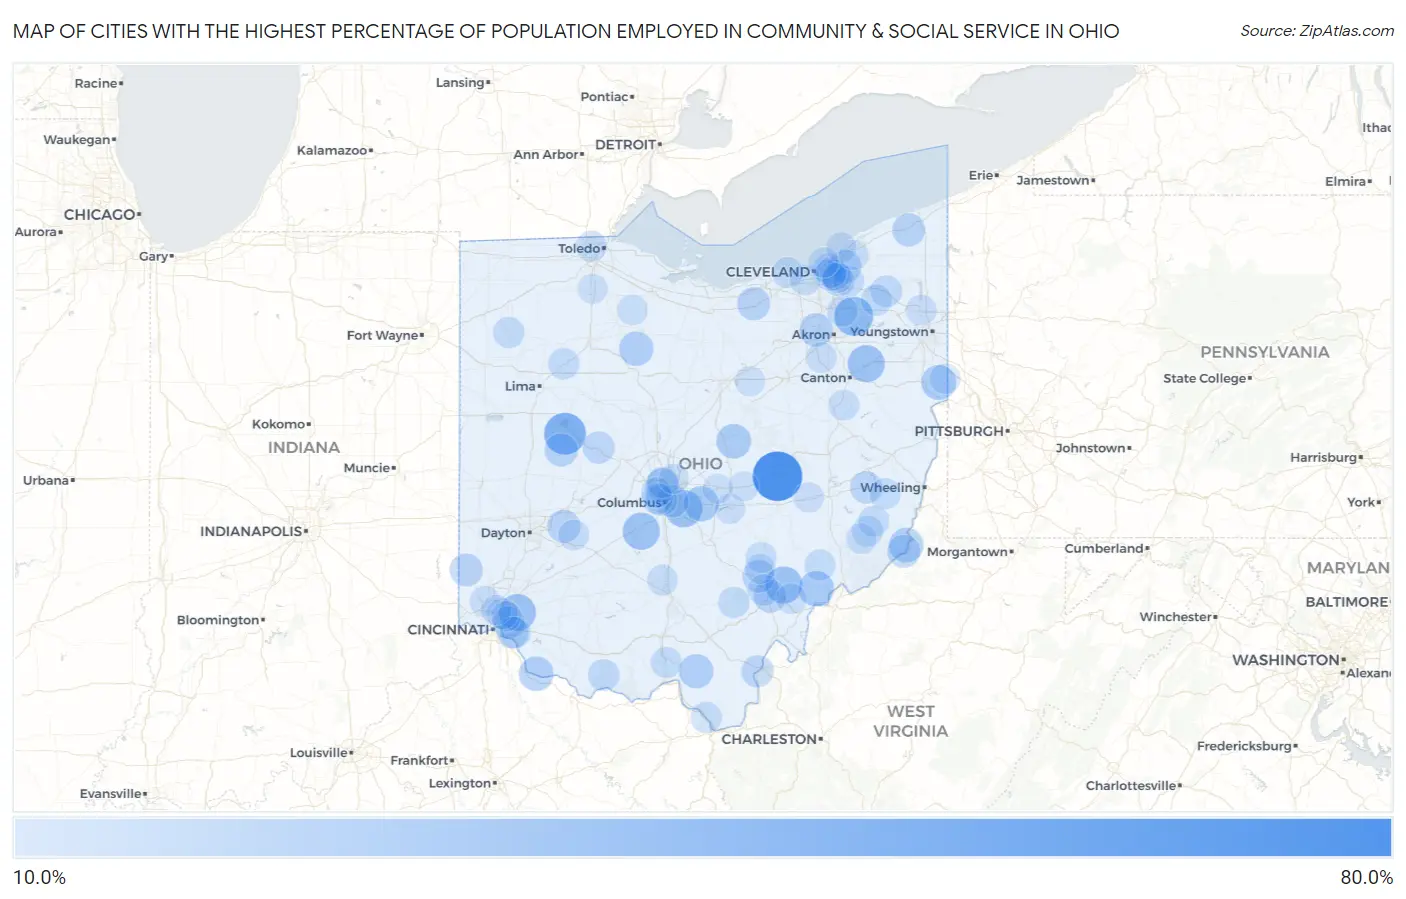
Map of Cities with the Highest Percentage of Population Employed in Community & Social Service in Ohio
0.0%
80.0%
Cities with the Highest Percentage of Population Employed in Community & Social Service in Ohio
| City | % Employed | vs State | vs National | |
| 1. | Trinway | 69.6% | 10.0%(+59.7)#1 | 11.2%(+58.4)#88 |
| 2. | Lewistown | 48.0% | 10.0%(+38.0)#2 | 11.2%(+36.8)#225 |
| 3. | Sugar Bush Knolls | 40.3% | 10.0%(+30.3)#3 | 11.2%(+29.0)#344 |
| 4. | Brice | 36.2% | 10.0%(+26.2)#4 | 11.2%(+25.0)#457 |
| 5. | Ridgewood | 36.2% | 10.0%(+26.2)#5 | 11.2%(+24.9)#459 |
| 6. | Derby | 35.4% | 10.0%(+25.4)#6 | 11.2%(+24.2)#485 |
| 7. | Amesville | 35.3% | 10.0%(+25.3)#7 | 11.2%(+24.1)#486 |
| 8. | Harrisburg | 35.2% | 10.0%(+25.3)#8 | 11.2%(+24.0)#490 |
| 9. | Miamiville | 34.9% | 10.0%(+25.0)#9 | 11.2%(+23.7)#502 |
| 10. | Vincent | 30.7% | 10.0%(+20.7)#10 | 11.2%(+19.5)#710 |
| 11. | Etna | 29.6% | 10.0%(+19.7)#11 | 11.2%(+18.4)#780 |
| 12. | Lake Tomahawk | 28.8% | 10.0%(+18.8)#12 | 11.2%(+17.6)#842 |
| 13. | Gambier | 28.7% | 10.0%(+18.7)#13 | 11.2%(+17.5)#850 |
| 14. | Chilo | 28.6% | 10.0%(+18.6)#14 | 11.2%(+17.4)#867 |
| 15. | Hannibal | 27.9% | 10.0%(+17.9)#15 | 11.2%(+16.7)#916 |
| 16. | Mccutchenville | 27.6% | 10.0%(+17.7)#16 | 11.2%(+16.4)#939 |
| 17. | South Webster | 27.4% | 10.0%(+17.4)#17 | 11.2%(+16.2)#962 |
| 18. | Madison Place | 26.9% | 10.0%(+16.9)#18 | 11.2%(+15.7)#1,021 |
| 19. | Pigeon Creek | 25.8% | 10.0%(+15.9)#19 | 11.2%(+14.6)#1,118 |
| 20. | Riverlea | 25.5% | 10.0%(+15.6)#20 | 11.2%(+14.3)#1,146 |
| 21. | De Graff | 24.9% | 10.0%(+15.0)#21 | 11.2%(+13.7)#1,248 |
| 22. | Oberlin | 24.6% | 10.0%(+14.6)#22 | 11.2%(+13.4)#1,291 |
| 23. | Austinburg | 24.6% | 10.0%(+14.6)#23 | 11.2%(+13.3)#1,295 |
| 24. | Gates Mills | 24.3% | 10.0%(+14.4)#24 | 11.2%(+13.1)#1,337 |
| 25. | Yellow Springs | 24.3% | 10.0%(+14.3)#25 | 11.2%(+13.1)#1,345 |
| 26. | Oxford | 24.1% | 10.0%(+14.2)#26 | 11.2%(+12.9)#1,367 |
| 27. | Athens | 23.8% | 10.0%(+13.9)#27 | 11.2%(+12.6)#1,420 |
| 28. | Sardis | 23.6% | 10.0%(+13.6)#28 | 11.2%(+12.4)#1,471 |
| 29. | Buchtel | 23.6% | 10.0%(+13.6)#29 | 11.2%(+12.4)#1,472 |
| 30. | Kingsville | 23.0% | 10.0%(+13.1)#30 | 11.2%(+11.8)#1,600 |
| 31. | Bexley | 22.9% | 10.0%(+13.0)#31 | 11.2%(+11.7)#1,616 |
| 32. | Mariemont | 22.6% | 10.0%(+12.6)#32 | 11.2%(+11.3)#1,695 |
| 33. | Saybrook-On-The-Lake | 22.5% | 10.0%(+12.5)#33 | 11.2%(+11.2)#1,720 |
| 34. | Orange | 22.3% | 10.0%(+12.3)#34 | 11.2%(+11.1)#1,756 |
| 35. | East Liberty | 22.2% | 10.0%(+12.3)#35 | 11.2%(+11.0)#1,768 |
| 36. | Fairview | 22.2% | 10.0%(+12.3)#36 | 11.2%(+11.0)#1,779 |
| 37. | Gallipolis | 22.0% | 10.0%(+12.1)#37 | 11.2%(+10.8)#1,817 |
| 38. | Bolton | 21.8% | 10.0%(+11.8)#38 | 11.2%(+10.5)#1,876 |
| 39. | New Haven Cdp Hamilton County | 21.3% | 10.0%(+11.3)#39 | 11.2%(+10.1)#1,989 |
| 40. | Parkman | 21.2% | 10.0%(+11.3)#40 | 11.2%(+10.0)#1,996 |
| 41. | Grandview Heights | 21.1% | 10.0%(+11.2)#41 | 11.2%(+9.92)#2,024 |
| 42. | West Union | 21.1% | 10.0%(+11.1)#42 | 11.2%(+9.84)#2,038 |
| 43. | North Lima | 20.8% | 10.0%(+10.9)#43 | 11.2%(+9.63)#2,099 |
| 44. | East Alliance | 20.8% | 10.0%(+10.9)#44 | 11.2%(+9.62)#2,104 |
| 45. | Shaker Heights | 20.8% | 10.0%(+10.9)#45 | 11.2%(+9.61)#2,112 |
| 46. | Reno Beach | 20.7% | 10.0%(+10.8)#46 | 11.2%(+9.52)#2,132 |
| 47. | Forestville | 20.7% | 10.0%(+10.7)#47 | 11.2%(+9.49)#2,142 |
| 48. | The Plains | 20.5% | 10.0%(+10.6)#48 | 11.2%(+9.31)#2,197 |
| 49. | Cherry Grove | 20.3% | 10.0%(+10.3)#49 | 11.2%(+9.04)#2,294 |
| 50. | Bluffton | 20.2% | 10.0%(+10.3)#50 | 11.2%(+9.03)#2,297 |
| 51. | Hiram | 20.2% | 10.0%(+10.3)#51 | 11.2%(+9.02)#2,307 |
| 52. | Coal Grove | 20.0% | 10.0%(+10.1)#52 | 11.2%(+8.81)#2,376 |
| 53. | Nankin | 20.0% | 10.0%(+10.0)#53 | 11.2%(+8.79)#2,386 |
| 54. | Oakwood | 19.9% | 10.0%(+9.99)#54 | 11.2%(+8.73)#2,436 |
| 55. | Worthington | 19.7% | 10.0%(+9.79)#55 | 11.2%(+8.53)#2,500 |
| 56. | Marble Cliff | 19.7% | 10.0%(+9.77)#56 | 11.2%(+8.52)#2,507 |
| 57. | Zaleski | 19.6% | 10.0%(+9.64)#57 | 11.2%(+8.39)#2,559 |
| 58. | Waterford | 19.5% | 10.0%(+9.51)#58 | 11.2%(+8.25)#2,620 |
| 59. | Bethesda | 19.3% | 10.0%(+9.35)#59 | 11.2%(+8.09)#2,679 |
| 60. | Cleveland Heights | 19.2% | 10.0%(+9.26)#60 | 11.2%(+8.00)#2,715 |
| 61. | Bay Village | 19.2% | 10.0%(+9.22)#61 | 11.2%(+7.96)#2,730 |
| 62. | Lucasville | 19.1% | 10.0%(+9.16)#62 | 11.2%(+7.90)#2,746 |
| 63. | Lewisville | 19.1% | 10.0%(+9.15)#63 | 11.2%(+7.89)#2,751 |
| 64. | Amberley | 19.1% | 10.0%(+9.13)#64 | 11.2%(+7.87)#2,760 |
| 65. | Miltonsburg | 19.0% | 10.0%(+9.09)#65 | 11.2%(+7.83)#2,775 |
| 66. | Chagrin Falls | 19.0% | 10.0%(+9.09)#66 | 11.2%(+7.83)#2,781 |
| 67. | Clinton | 18.9% | 10.0%(+8.96)#67 | 11.2%(+7.70)#2,828 |
| 68. | Guilford Lake | 18.9% | 10.0%(+8.93)#68 | 11.2%(+7.67)#2,841 |
| 69. | Hemlock | 18.8% | 10.0%(+8.89)#69 | 11.2%(+7.63)#2,867 |
| 70. | Zoar | 18.8% | 10.0%(+8.86)#70 | 11.2%(+7.60)#2,876 |
| 71. | Linndale | 18.7% | 10.0%(+8.70)#71 | 11.2%(+7.44)#2,936 |
| 72. | Andersonville | 18.6% | 10.0%(+8.68)#72 | 11.2%(+7.42)#2,950 |
| 73. | Beachwood | 18.5% | 10.0%(+8.56)#73 | 11.2%(+7.31)#2,993 |
| 74. | Ottawa Hills | 18.5% | 10.0%(+8.54)#74 | 11.2%(+7.28)#3,005 |
| 75. | University Heights | 18.5% | 10.0%(+8.53)#75 | 11.2%(+7.28)#3,010 |
| 76. | Hudson | 18.4% | 10.0%(+8.47)#76 | 11.2%(+7.21)#3,034 |
| 77. | Cedarville | 18.2% | 10.0%(+8.27)#77 | 11.2%(+7.02)#3,141 |
| 78. | Woodmere | 18.0% | 10.0%(+8.00)#78 | 11.2%(+6.74)#3,271 |
| 79. | Upper Arlington | 17.9% | 10.0%(+7.99)#79 | 11.2%(+6.74)#3,273 |
| 80. | Kansas | 17.9% | 10.0%(+7.95)#80 | 11.2%(+6.70)#3,293 |
| 81. | Howland Center | 17.9% | 10.0%(+7.91)#81 | 11.2%(+6.66)#3,313 |
| 82. | Stewart | 17.9% | 10.0%(+7.90)#82 | 11.2%(+6.64)#3,322 |
| 83. | Stafford | 17.9% | 10.0%(+7.90)#83 | 11.2%(+6.64)#3,325 |
| 84. | Ai | 17.8% | 10.0%(+7.81)#84 | 11.2%(+6.55)#3,371 |
| 85. | Pleasant Run | 17.7% | 10.0%(+7.71)#85 | 11.2%(+6.45)#3,417 |
| 86. | New Concord | 17.7% | 10.0%(+7.70)#86 | 11.2%(+6.44)#3,426 |
| 87. | Negley | 17.6% | 10.0%(+7.64)#87 | 11.2%(+6.38)#3,465 |
| 88. | Thornport | 17.4% | 10.0%(+7.48)#88 | 11.2%(+6.22)#3,566 |
| 89. | Bratenahl | 17.4% | 10.0%(+7.43)#89 | 11.2%(+6.17)#3,594 |
| 90. | Lakeline | 17.3% | 10.0%(+7.32)#90 | 11.2%(+6.06)#3,662 |
| 91. | Marne | 17.1% | 10.0%(+7.17)#91 | 11.2%(+5.92)#3,746 |
| 92. | Murray City | 17.1% | 10.0%(+7.13)#92 | 11.2%(+5.87)#3,768 |
| 93. | Wyoming | 17.1% | 10.0%(+7.11)#93 | 11.2%(+5.85)#3,782 |
| 94. | Granville South | 17.0% | 10.0%(+7.04)#94 | 11.2%(+5.78)#3,816 |
| 95. | Bowling Green | 17.0% | 10.0%(+7.03)#95 | 11.2%(+5.78)#3,817 |
| 96. | Kirtland | 16.9% | 10.0%(+6.98)#96 | 11.2%(+5.72)#3,836 |
| 97. | Silverton | 16.9% | 10.0%(+6.96)#97 | 11.2%(+5.70)#3,848 |
| 98. | Westerville | 16.9% | 10.0%(+6.95)#98 | 11.2%(+5.69)#3,853 |
| 99. | Hayesville | 16.9% | 10.0%(+6.95)#99 | 11.2%(+5.69)#3,859 |
| 100. | Medway | 16.7% | 10.0%(+6.77)#100 | 11.2%(+5.51)#3,950 |
Common Questions
What are the Top 10 Cities with the Highest Percentage of Population Employed in Community & Social Service in Ohio?
Top 10 Cities with the Highest Percentage of Population Employed in Community & Social Service in Ohio are:
#1
69.6%
#2
48.0%
#3
40.3%
#4
36.2%
#5
35.4%
#6
35.3%
#7
35.2%
#8
34.9%
#9
30.7%
#10
29.6%
What city has the Highest Percentage of Population Employed in Community & Social Service in Ohio?
Trinway has the Highest Percentage of Population Employed in Community & Social Service in Ohio with 69.6%.
What is the Percentage of Population Employed in Community & Social Service in the State of Ohio?
Percentage of Population Employed in Community & Social Service in Ohio is 10.0%.
What is the Percentage of Population Employed in Community & Social Service in the United States?
Percentage of Population Employed in Community & Social Service in the United States is 11.2%.