Cities with the Highest Percentage of Population Employed in Computer, Engineering & Science in Ohio
RELATED REPORTS & OPTIONS
Computer, Engineering & Science
Ohio
Compare Cities
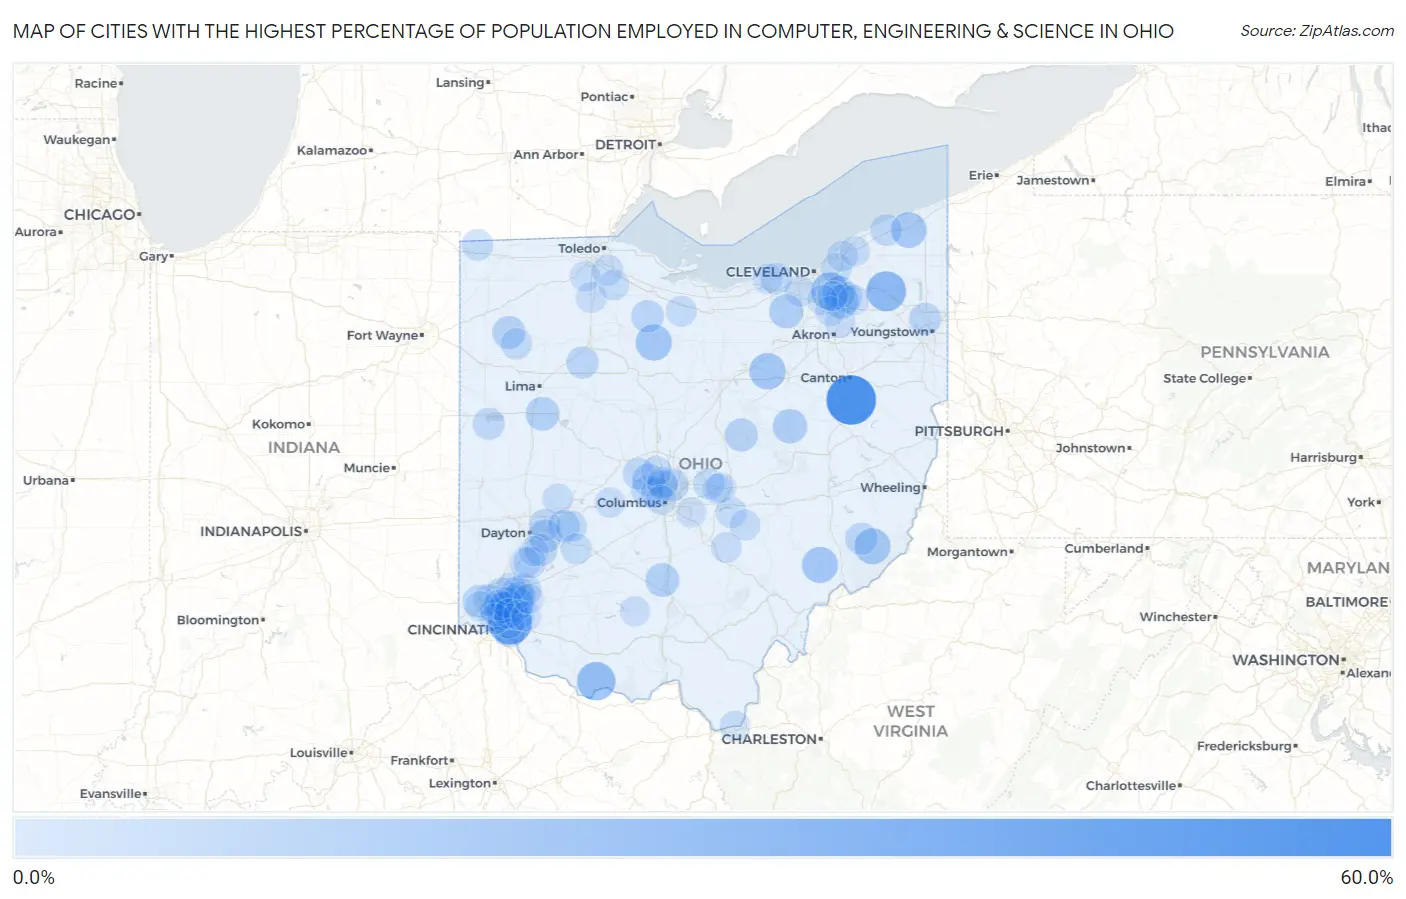
Map of Cities with the Highest Percentage of Population Employed in Computer, Engineering & Science in Ohio
0.0%
60.0%
Cities with the Highest Percentage of Population Employed in Computer, Engineering & Science in Ohio
| City | % Employed | vs State | vs National | |
| 1. | Sandyville | 51.3% | 6.1%(+45.2)#1 | 6.8%(+44.5)#65 |
| 2. | Plainville | 39.3% | 6.1%(+33.2)#2 | 6.8%(+32.5)#121 |
| 3. | Parkman | 30.0% | 6.1%(+23.9)#3 | 6.8%(+23.2)#221 |
| 4. | Bentonville | 27.4% | 6.1%(+21.3)#4 | 6.8%(+20.6)#277 |
| 5. | Walton Hills | 25.2% | 6.1%(+19.2)#5 | 6.8%(+18.5)#328 |
| 6. | Sixteen Mile Stand | 22.8% | 6.1%(+16.7)#6 | 6.8%(+16.0)#413 |
| 7. | Melmore | 22.6% | 6.1%(+16.5)#7 | 6.8%(+15.8)#420 |
| 8. | New Pittsburg | 22.5% | 6.1%(+16.4)#8 | 6.8%(+15.7)#424 |
| 9. | Waterford | 22.1% | 6.1%(+16.1)#9 | 6.8%(+15.4)#437 |
| 10. | Graysville | 21.7% | 6.1%(+15.7)#10 | 6.8%(+15.0)#463 |
| 11. | New Haven Cdp Hamilton County | 21.3% | 6.1%(+15.2)#11 | 6.8%(+14.5)#484 |
| 12. | Austinburg | 21.1% | 6.1%(+15.0)#12 | 6.8%(+14.3)#501 |
| 13. | Lake Buckhorn | 18.6% | 6.1%(+12.6)#13 | 6.8%(+11.9)#671 |
| 14. | Twinsburg Heights | 18.5% | 6.1%(+12.5)#14 | 6.8%(+11.8)#673 |
| 15. | Valley City | 18.0% | 6.1%(+11.9)#15 | 6.8%(+11.2)#734 |
| 16. | Andersonville | 17.4% | 6.1%(+11.3)#16 | 6.8%(+10.6)#785 |
| 17. | St Johns | 17.2% | 6.1%(+11.1)#17 | 6.8%(+10.4)#811 |
| 18. | Brandt | 16.7% | 6.1%(+10.6)#18 | 6.8%(+9.90)#873 |
| 19. | Howard | 16.2% | 6.1%(+10.1)#19 | 6.8%(+9.42)#937 |
| 20. | Oakwood | 16.0% | 6.1%(+9.95)#20 | 6.8%(+9.25)#958 |
| 21. | Blue Ash | 15.9% | 6.1%(+9.80)#21 | 6.8%(+9.10)#982 |
| 22. | Beavercreek | 15.8% | 6.1%(+9.71)#22 | 6.8%(+9.01)#993 |
| 23. | Glenwillow | 15.7% | 6.1%(+9.66)#23 | 6.8%(+8.96)#1,001 |
| 24. | Amberley | 15.5% | 6.1%(+9.47)#24 | 6.8%(+8.77)#1,028 |
| 25. | Dublin | 15.4% | 6.1%(+9.30)#25 | 6.8%(+8.60)#1,071 |
| 26. | Fort Seneca | 15.0% | 6.1%(+8.94)#26 | 6.8%(+8.24)#1,138 |
| 27. | Mason | 15.0% | 6.1%(+8.89)#27 | 6.8%(+8.19)#1,151 |
| 28. | Minerva Park | 14.9% | 6.1%(+8.83)#28 | 6.8%(+8.13)#1,159 |
| 29. | South Lebanon | 14.8% | 6.1%(+8.70)#29 | 6.8%(+8.00)#1,182 |
| 30. | Dunlap | 14.5% | 6.1%(+8.43)#30 | 6.8%(+7.73)#1,239 |
| 31. | Jenera | 14.4% | 6.1%(+8.30)#31 | 6.8%(+7.60)#1,251 |
| 32. | Mckinley Heights | 14.3% | 6.1%(+8.22)#32 | 6.8%(+7.52)#1,266 |
| 33. | Stafford | 14.3% | 6.1%(+8.22)#33 | 6.8%(+7.52)#1,273 |
| 34. | Bellbrook | 13.9% | 6.1%(+7.84)#34 | 6.8%(+7.14)#1,357 |
| 35. | Sherwood | 13.9% | 6.1%(+7.82)#35 | 6.8%(+7.12)#1,359 |
| 36. | Yellow Springs | 13.9% | 6.1%(+7.80)#36 | 6.8%(+7.10)#1,370 |
| 37. | Five Points | 13.6% | 6.1%(+7.58)#37 | 6.8%(+6.88)#1,436 |
| 38. | Montezuma | 13.6% | 6.1%(+7.57)#38 | 6.8%(+6.87)#1,443 |
| 39. | Hilliard | 13.6% | 6.1%(+7.56)#39 | 6.8%(+6.86)#1,447 |
| 40. | New California | 13.6% | 6.1%(+7.51)#40 | 6.8%(+6.81)#1,462 |
| 41. | Wyoming | 13.6% | 6.1%(+7.50)#41 | 6.8%(+6.80)#1,464 |
| 42. | Beckett Ridge | 13.4% | 6.1%(+7.37)#42 | 6.8%(+6.67)#1,505 |
| 43. | Wright Patterson Afb | 13.4% | 6.1%(+7.37)#43 | 6.8%(+6.67)#1,506 |
| 44. | Landen | 13.4% | 6.1%(+7.37)#44 | 6.8%(+6.67)#1,509 |
| 45. | Mariemont | 13.3% | 6.1%(+7.23)#45 | 6.8%(+6.53)#1,550 |
| 46. | Madison | 13.2% | 6.1%(+7.10)#46 | 6.8%(+6.40)#1,583 |
| 47. | Reminderville | 12.9% | 6.1%(+6.82)#47 | 6.8%(+6.12)#1,667 |
| 48. | Pleasant Run Farm | 12.8% | 6.1%(+6.76)#48 | 6.8%(+6.06)#1,686 |
| 49. | Lake Seneca | 12.7% | 6.1%(+6.68)#49 | 6.8%(+5.98)#1,711 |
| 50. | Avon | 12.6% | 6.1%(+6.57)#50 | 6.8%(+5.87)#1,742 |
| 51. | Clifton | 12.6% | 6.1%(+6.56)#51 | 6.8%(+5.86)#1,746 |
| 52. | Alexandria | 12.5% | 6.1%(+6.48)#52 | 6.8%(+5.78)#1,764 |
| 53. | Cloverdale | 12.5% | 6.1%(+6.44)#53 | 6.8%(+5.74)#1,769 |
| 54. | Evendale | 12.5% | 6.1%(+6.39)#54 | 6.8%(+5.69)#1,790 |
| 55. | Gomer | 12.4% | 6.1%(+6.32)#55 | 6.8%(+5.62)#1,814 |
| 56. | West Logan | 11.9% | 6.1%(+5.88)#56 | 6.8%(+5.18)#1,957 |
| 57. | Shawnee Hills | 11.9% | 6.1%(+5.83)#57 | 6.8%(+5.13)#1,980 |
| 58. | Flat Rock | 11.9% | 6.1%(+5.81)#58 | 6.8%(+5.11)#1,986 |
| 59. | Blaine | 11.8% | 6.1%(+5.70)#59 | 6.8%(+5.00)#2,020 |
| 60. | Thornville | 11.7% | 6.1%(+5.67)#60 | 6.8%(+4.97)#2,031 |
| 61. | Lyndhurst | 11.7% | 6.1%(+5.60)#61 | 6.8%(+4.90)#2,051 |
| 62. | Sharonville | 11.6% | 6.1%(+5.52)#62 | 6.8%(+4.82)#2,074 |
| 63. | Portage | 11.5% | 6.1%(+5.47)#63 | 6.8%(+4.77)#2,099 |
| 64. | Somerset | 11.5% | 6.1%(+5.44)#64 | 6.8%(+4.74)#2,111 |
| 65. | Willoughby Hills | 11.5% | 6.1%(+5.44)#65 | 6.8%(+4.74)#2,114 |
| 66. | Stony Ridge | 11.5% | 6.1%(+5.42)#66 | 6.8%(+4.72)#2,132 |
| 67. | Springboro | 11.4% | 6.1%(+5.38)#67 | 6.8%(+4.68)#2,145 |
| 68. | Upper Arlington | 11.4% | 6.1%(+5.32)#68 | 6.8%(+4.62)#2,173 |
| 69. | Middleburg Heights | 11.4% | 6.1%(+5.30)#69 | 6.8%(+4.60)#2,189 |
| 70. | Worthington | 11.4% | 6.1%(+5.29)#70 | 6.8%(+4.59)#2,203 |
| 71. | Pemberville | 11.2% | 6.1%(+5.17)#71 | 6.8%(+4.47)#2,253 |
| 72. | Riverlea | 11.2% | 6.1%(+5.12)#72 | 6.8%(+4.42)#2,273 |
| 73. | Hide A Way Hills | 11.2% | 6.1%(+5.11)#73 | 6.8%(+4.41)#2,284 |
| 74. | Glendale | 11.2% | 6.1%(+5.10)#74 | 6.8%(+4.40)#2,287 |
| 75. | Proctorville | 11.1% | 6.1%(+4.99)#75 | 6.8%(+4.29)#2,351 |
| 76. | St Bernard | 11.0% | 6.1%(+4.94)#76 | 6.8%(+4.24)#2,376 |
| 77. | North Hampton | 10.9% | 6.1%(+4.83)#77 | 6.8%(+4.13)#2,422 |
| 78. | Silver Lake | 10.8% | 6.1%(+4.72)#78 | 6.8%(+4.02)#2,476 |
| 79. | Four Bridges | 10.8% | 6.1%(+4.72)#79 | 6.8%(+4.02)#2,477 |
| 80. | Woodworth | 10.7% | 6.1%(+4.61)#80 | 6.8%(+3.91)#2,535 |
| 81. | Powell | 10.5% | 6.1%(+4.46)#81 | 6.8%(+3.76)#2,628 |
| 82. | Kirtland Hills | 10.4% | 6.1%(+4.36)#82 | 6.8%(+3.66)#2,672 |
| 83. | Sheffield | 10.4% | 6.1%(+4.36)#83 | 6.8%(+3.66)#2,677 |
| 84. | Brecksville | 10.4% | 6.1%(+4.36)#84 | 6.8%(+3.66)#2,680 |
| 85. | Haskins | 10.4% | 6.1%(+4.33)#85 | 6.8%(+3.63)#2,701 |
| 86. | Choctaw Lake | 10.4% | 6.1%(+4.32)#86 | 6.8%(+3.62)#2,704 |
| 87. | Aurora | 10.4% | 6.1%(+4.29)#87 | 6.8%(+3.59)#2,724 |
| 88. | Granville | 10.3% | 6.1%(+4.22)#88 | 6.8%(+3.52)#2,764 |
| 89. | Bainbridge | 10.2% | 6.1%(+4.15)#89 | 6.8%(+3.45)#2,805 |
| 90. | Dry Ridge | 10.1% | 6.1%(+4.05)#90 | 6.8%(+3.35)#2,870 |
| 91. | Pickerington | 10.1% | 6.1%(+4.04)#91 | 6.8%(+3.34)#2,879 |
| 92. | Granville South | 10.1% | 6.1%(+4.02)#92 | 6.8%(+3.32)#2,885 |
| 93. | Kenwood | 10.1% | 6.1%(+4.01)#93 | 6.8%(+3.31)#2,897 |
| 94. | Centerville | 10.0% | 6.1%(+3.98)#94 | 6.8%(+3.28)#2,915 |
| 95. | Camp Dennison | 9.9% | 6.1%(+3.88)#95 | 6.8%(+3.18)#2,979 |
| 96. | Mount Repose | 9.9% | 6.1%(+3.86)#96 | 6.8%(+3.16)#2,994 |
| 97. | Peninsula | 9.9% | 6.1%(+3.83)#97 | 6.8%(+3.13)#3,012 |
| 98. | Maineville | 9.9% | 6.1%(+3.81)#98 | 6.8%(+3.11)#3,023 |
| 99. | Northfield | 9.9% | 6.1%(+3.79)#99 | 6.8%(+3.09)#3,038 |
| 100. | Grandview Heights | 9.8% | 6.1%(+3.78)#100 | 6.8%(+3.08)#3,045 |
Common Questions
What are the Top 10 Cities with the Highest Percentage of Population Employed in Computer, Engineering & Science in Ohio?
Top 10 Cities with the Highest Percentage of Population Employed in Computer, Engineering & Science in Ohio are:
#1
51.3%
#2
39.3%
#3
30.0%
#4
27.4%
#5
25.2%
#6
22.8%
#7
22.6%
#8
22.5%
#9
22.1%
#10
21.7%
What city has the Highest Percentage of Population Employed in Computer, Engineering & Science in Ohio?
Sandyville has the Highest Percentage of Population Employed in Computer, Engineering & Science in Ohio with 51.3%.
What is the Percentage of Population Employed in Computer, Engineering & Science in the State of Ohio?
Percentage of Population Employed in Computer, Engineering & Science in Ohio is 6.1%.
What is the Percentage of Population Employed in Computer, Engineering & Science in the United States?
Percentage of Population Employed in Computer, Engineering & Science in the United States is 6.8%.