Cities with the Highest Poverty Level in North Carolina
RELATED REPORTS & OPTIONS
Highest Poverty
North Carolina
Compare Cities
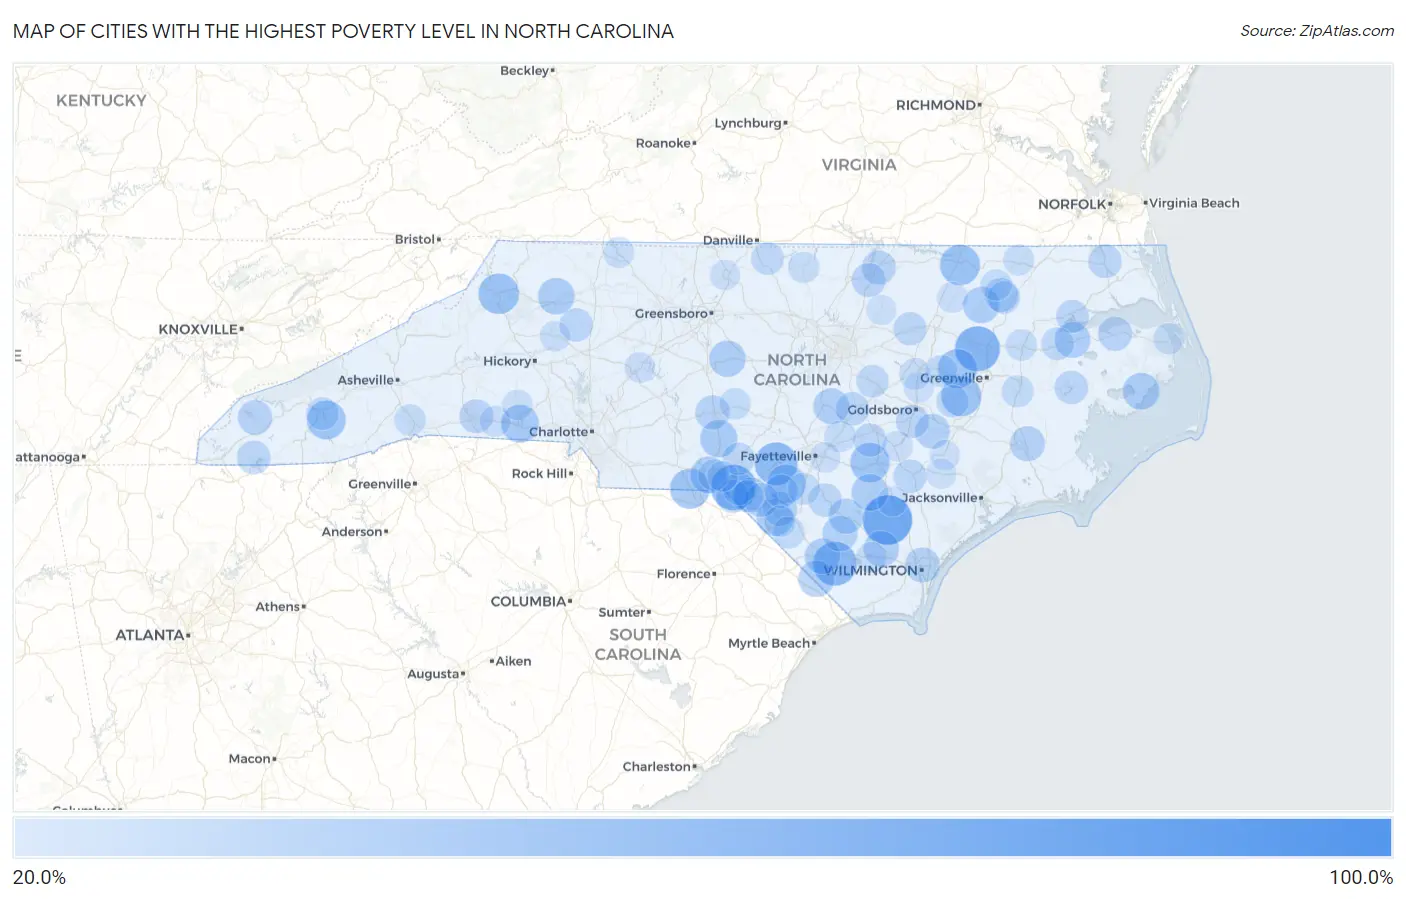
Map of Cities with the Highest Poverty Level in North Carolina
0.0%
100.0%
Cities with the Highest Poverty Level in North Carolina
| City | Poverty | vs State | vs National | |
| 1. | Chinquapin | 100.0% | 13.3%(+86.7)#1 | 12.5%(+87.5)#107 |
| 2. | Ivanhoe | 79.3% | 13.3%(+65.9)#2 | 12.5%(+66.7)#204 |
| 3. | Old Hundred | 69.0% | 13.3%(+55.7)#3 | 12.5%(+56.5)#332 |
| 4. | Long Creek | 67.5% | 13.3%(+54.2)#4 | 12.5%(+55.0)#352 |
| 5. | Conetoe | 67.5% | 13.3%(+54.2)#5 | 12.5%(+55.0)#353 |
| 6. | Brunswick | 64.2% | 13.3%(+50.9)#6 | 12.5%(+51.7)#408 |
| 7. | Silver City | 61.7% | 13.3%(+48.3)#7 | 12.5%(+49.1)#473 |
| 8. | Chowan Beach | 61.5% | 13.3%(+48.2)#8 | 12.5%(+49.0)#478 |
| 9. | Boone | 55.9% | 13.3%(+42.6)#9 | 12.5%(+43.4)#626 |
| 10. | South Weldon | 54.9% | 13.3%(+41.6)#10 | 12.5%(+42.4)#670 |
| 11. | Maury | 54.6% | 13.3%(+41.3)#11 | 12.5%(+42.1)#676 |
| 12. | Mcfarlan | 54.1% | 13.3%(+40.7)#12 | 12.5%(+41.5)#701 |
| 13. | Bonnetsville | 53.0% | 13.3%(+39.7)#13 | 12.5%(+40.5)#748 |
| 14. | Fountain | 52.8% | 13.3%(+39.5)#14 | 12.5%(+40.3)#759 |
| 15. | Cullowhee | 51.7% | 13.3%(+38.3)#15 | 12.5%(+39.1)#818 |
| 16. | Shannon | 51.0% | 13.3%(+37.7)#16 | 12.5%(+38.5)#853 |
| 17. | Light Oak | 49.0% | 13.3%(+35.7)#17 | 12.5%(+36.5)#968 |
| 18. | Norman | 47.4% | 13.3%(+34.1)#18 | 12.5%(+34.9)#1,063 |
| 19. | Cordova | 46.7% | 13.3%(+33.3)#19 | 12.5%(+34.1)#1,123 |
| 20. | Elrod | 46.6% | 13.3%(+33.3)#20 | 12.5%(+34.1)#1,134 |
| 21. | Garland | 46.5% | 13.3%(+33.2)#21 | 12.5%(+33.9)#1,143 |
| 22. | Engelhard | 46.1% | 13.3%(+32.7)#22 | 12.5%(+33.5)#1,176 |
| 23. | Fairplains | 45.7% | 13.3%(+32.4)#23 | 12.5%(+33.2)#1,198 |
| 24. | Scotland Neck | 45.4% | 13.3%(+32.1)#24 | 12.5%(+32.9)#1,222 |
| 25. | Ramseur | 45.3% | 13.3%(+32.0)#25 | 12.5%(+32.8)#1,231 |
| 26. | Tabor City | 44.8% | 13.3%(+31.5)#26 | 12.5%(+32.3)#1,260 |
| 27. | Buies Creek | 44.1% | 13.3%(+30.7)#27 | 12.5%(+31.5)#1,320 |
| 28. | Roper | 43.8% | 13.3%(+30.5)#28 | 12.5%(+31.3)#1,337 |
| 29. | Chadbourn | 43.5% | 13.3%(+30.1)#29 | 12.5%(+30.9)#1,370 |
| 30. | Sandyfield | 43.3% | 13.3%(+30.0)#30 | 12.5%(+30.8)#1,383 |
| 31. | Clarkton | 42.4% | 13.3%(+29.0)#31 | 12.5%(+29.8)#1,471 |
| 32. | Elizabethtown | 42.1% | 13.3%(+28.7)#32 | 12.5%(+29.5)#1,497 |
| 33. | Hightsville | 41.8% | 13.3%(+28.5)#33 | 12.5%(+29.3)#1,523 |
| 34. | Bridgeton | 41.7% | 13.3%(+28.4)#34 | 12.5%(+29.2)#1,539 |
| 35. | Seven Springs | 41.7% | 13.3%(+28.3)#35 | 12.5%(+29.1)#1,549 |
| 36. | East Laurinburg | 41.6% | 13.3%(+28.3)#36 | 12.5%(+29.1)#1,556 |
| 37. | Robbinsville | 40.8% | 13.3%(+27.4)#37 | 12.5%(+28.2)#1,608 |
| 38. | Pembroke | 40.7% | 13.3%(+27.3)#38 | 12.5%(+28.1)#1,615 |
| 39. | Biscoe | 40.6% | 13.3%(+27.3)#39 | 12.5%(+28.1)#1,618 |
| 40. | Columbia | 39.5% | 13.3%(+26.1)#40 | 12.5%(+26.9)#1,747 |
| 41. | Middleburg | 39.5% | 13.3%(+26.1)#41 | 12.5%(+26.9)#1,748 |
| 42. | South Henderson | 39.3% | 13.3%(+26.0)#42 | 12.5%(+26.7)#1,767 |
| 43. | Maxton | 39.2% | 13.3%(+25.9)#43 | 12.5%(+26.7)#1,772 |
| 44. | Forest City | 38.9% | 13.3%(+25.6)#44 | 12.5%(+26.4)#1,797 |
| 45. | Roxobel | 38.9% | 13.3%(+25.5)#45 | 12.5%(+26.3)#1,808 |
| 46. | South Mills | 38.3% | 13.3%(+25.0)#46 | 12.5%(+25.7)#1,870 |
| 47. | Hayesville | 38.2% | 13.3%(+24.9)#47 | 12.5%(+25.7)#1,880 |
| 48. | Magnolia | 38.1% | 13.3%(+24.8)#48 | 12.5%(+25.6)#1,888 |
| 49. | Belhaven | 37.8% | 13.3%(+24.5)#49 | 12.5%(+25.3)#1,940 |
| 50. | Red Springs | 37.8% | 13.3%(+24.5)#50 | 12.5%(+25.2)#1,942 |
| 51. | Benson | 37.7% | 13.3%(+24.4)#51 | 12.5%(+25.2)#1,946 |
| 52. | Love Valley | 37.7% | 13.3%(+24.4)#52 | 12.5%(+25.2)#1,952 |
| 53. | Vann Crossroads | 37.6% | 13.3%(+24.3)#53 | 12.5%(+25.1)#1,962 |
| 54. | Tar Heel | 37.5% | 13.3%(+24.2)#54 | 12.5%(+25.0)#1,980 |
| 55. | Brogden | 37.4% | 13.3%(+24.0)#55 | 12.5%(+24.8)#1,998 |
| 56. | Gibson | 37.2% | 13.3%(+23.9)#56 | 12.5%(+24.7)#2,021 |
| 57. | Momeyer | 37.1% | 13.3%(+23.8)#57 | 12.5%(+24.6)#2,038 |
| 58. | Edenton | 36.6% | 13.3%(+23.3)#58 | 12.5%(+24.1)#2,114 |
| 59. | Yanceyville | 36.1% | 13.3%(+22.8)#59 | 12.5%(+23.6)#2,179 |
| 60. | Webster | 36.0% | 13.3%(+22.7)#60 | 12.5%(+23.5)#2,188 |
| 61. | Plymouth | 36.0% | 13.3%(+22.7)#61 | 12.5%(+23.5)#2,202 |
| 62. | Kelford | 35.8% | 13.3%(+22.5)#62 | 12.5%(+23.3)#2,229 |
| 63. | Wilson S Mills | 35.7% | 13.3%(+22.4)#63 | 12.5%(+23.2)#2,245 |
| 64. | Laurel Hill | 35.7% | 13.3%(+22.3)#64 | 12.5%(+23.1)#2,255 |
| 65. | Snow Hill | 35.6% | 13.3%(+22.2)#65 | 12.5%(+23.0)#2,272 |
| 66. | Arrowhead Beach | 35.5% | 13.3%(+22.2)#66 | 12.5%(+22.9)#2,290 |
| 67. | Hoffman | 35.1% | 13.3%(+21.8)#67 | 12.5%(+22.6)#2,343 |
| 68. | Chocowinity | 34.5% | 13.3%(+21.1)#68 | 12.5%(+21.9)#2,441 |
| 69. | St Pauls | 34.5% | 13.3%(+21.1)#69 | 12.5%(+21.9)#2,448 |
| 70. | Saratoga | 34.2% | 13.3%(+20.9)#70 | 12.5%(+21.7)#2,493 |
| 71. | Fairmont | 33.9% | 13.3%(+20.6)#71 | 12.5%(+21.4)#2,545 |
| 72. | Laurinburg | 33.8% | 13.3%(+20.5)#72 | 12.5%(+21.3)#2,564 |
| 73. | Barker Heights | 32.9% | 13.3%(+19.6)#73 | 12.5%(+20.4)#2,750 |
| 74. | Rich Square | 32.9% | 13.3%(+19.5)#74 | 12.5%(+20.3)#2,763 |
| 75. | Williamston | 32.8% | 13.3%(+19.5)#75 | 12.5%(+20.3)#2,770 |
| 76. | Robbins | 32.8% | 13.3%(+19.5)#76 | 12.5%(+20.3)#2,771 |
| 77. | Lucama | 32.6% | 13.3%(+19.3)#77 | 12.5%(+20.1)#2,809 |
| 78. | Falcon | 32.6% | 13.3%(+19.3)#78 | 12.5%(+20.1)#2,812 |
| 79. | Raynham | 32.4% | 13.3%(+19.1)#79 | 12.5%(+19.9)#2,848 |
| 80. | East Rockingham | 32.2% | 13.3%(+18.9)#80 | 12.5%(+19.7)#2,906 |
| 81. | Roxboro | 32.2% | 13.3%(+18.9)#81 | 12.5%(+19.7)#2,912 |
| 82. | Mooresboro | 31.9% | 13.3%(+18.5)#82 | 12.5%(+19.3)#2,985 |
| 83. | Bolton | 31.8% | 13.3%(+18.5)#83 | 12.5%(+19.3)#2,993 |
| 84. | Murfreesboro | 31.8% | 13.3%(+18.5)#84 | 12.5%(+19.3)#3,003 |
| 85. | Mount Airy | 31.7% | 13.3%(+18.3)#85 | 12.5%(+19.1)#3,036 |
| 86. | Manns Harbor | 31.6% | 13.3%(+18.3)#86 | 12.5%(+19.1)#3,041 |
| 87. | Enfield | 31.3% | 13.3%(+17.9)#87 | 12.5%(+18.7)#3,126 |
| 88. | Dudley | 30.8% | 13.3%(+17.5)#88 | 12.5%(+18.3)#3,222 |
| 89. | Faison | 30.7% | 13.3%(+17.4)#89 | 12.5%(+18.2)#3,241 |
| 90. | Fallston | 30.6% | 13.3%(+17.3)#90 | 12.5%(+18.1)#3,277 |
| 91. | Vander | 30.6% | 13.3%(+17.3)#91 | 12.5%(+18.1)#3,278 |
| 92. | Taylorsville | 30.6% | 13.3%(+17.3)#92 | 12.5%(+18.0)#3,279 |
| 93. | Dobbins Heights | 30.5% | 13.3%(+17.2)#93 | 12.5%(+18.0)#3,291 |
| 94. | East Spencer | 30.5% | 13.3%(+17.2)#94 | 12.5%(+18.0)#3,294 |
| 95. | Fremont | 30.2% | 13.3%(+16.9)#95 | 12.5%(+17.7)#3,366 |
| 96. | Harrells | 30.1% | 13.3%(+16.8)#96 | 12.5%(+17.6)#3,375 |
| 97. | Pink Hill | 30.1% | 13.3%(+16.8)#97 | 12.5%(+17.6)#3,381 |
| 98. | Beulaville | 30.0% | 13.3%(+16.6)#98 | 12.5%(+17.4)#3,417 |
| 99. | Reidsville | 29.8% | 13.3%(+16.4)#99 | 12.5%(+17.2)#3,451 |
| 100. | Louisburg | 29.7% | 13.3%(+16.4)#100 | 12.5%(+17.2)#3,465 |
Common Questions
What are the Top 10 Cities with the Highest Poverty Level in North Carolina?
Top 10 Cities with the Highest Poverty Level in North Carolina are:
#1
79.3%
#2
69.0%
#3
67.5%
#4
64.2%
#5
61.7%
#6
55.9%
#7
54.9%
#8
54.6%
#9
54.1%
#10
53.0%
What city has the Highest Poverty Level in North Carolina?
Ivanhoe has the Highest Poverty Level in North Carolina with 79.3%.
What is the Poverty Level in the State of North Carolina?
Poverty Level in North Carolina is 13.3%.
What is the Poverty Level in the United States?
Poverty Level in the United States is 12.5%.