Cordova, NC Map & Demographics
Cordova Map
Cordova Overview
$22,779
PER CAPITA INCOME
$51,046
AVG HOUSEHOLD INCOME
0.38
INEQUALITY / GINI INDEX
1,320
TOTAL POPULATION
716
MALE POPULATION
604
FEMALE POPULATION
118.54
MALES / 100 FEMALES
84.36
FEMALES / 100 MALES
47.6
MEDIAN AGE
3.7
AVG FAMILY SIZE
2.5
AVG HOUSEHOLD SIZE
782
LABOR FORCE [ PEOPLE ]
62.9%
PERCENT IN LABOR FORCE
33.2%
UNEMPLOYMENT RATE
Cordova Zip Codes
Cordova Area Codes
Income in Cordova
Income Overview in Cordova
| Characteristic | Number | Measure |
| Per Capita Income | 1,320 | $22,779 |
| Median Family Income | 247 | $0 |
| Mean Family Income | 247 | $65,694 |
| Median Household Income | 527 | $51,046 |
| Mean Household Income | 527 | $55,721 |
| Income Deficit | 247 | $0 |
| Wage / Income Gap (%) | 1,320 | 0.00% |
| Wage / Income Gap ($) | 1,320 | 100.00¢ per $1 |
| Gini / Inequality Index | 1,320 | 0.38 |
Earnings by Sex in Cordova
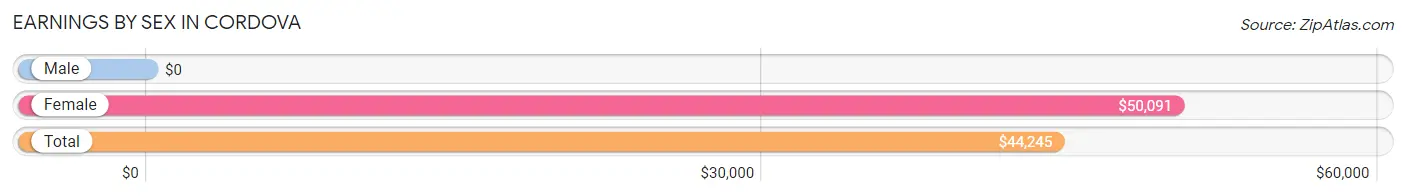
| Sex | Number | Average Earnings |
| Male | 293 (47.6%) | $0 |
| Female | 322 (52.4%) | $50,091 |
| Total | 615 (100.0%) | $44,245 |
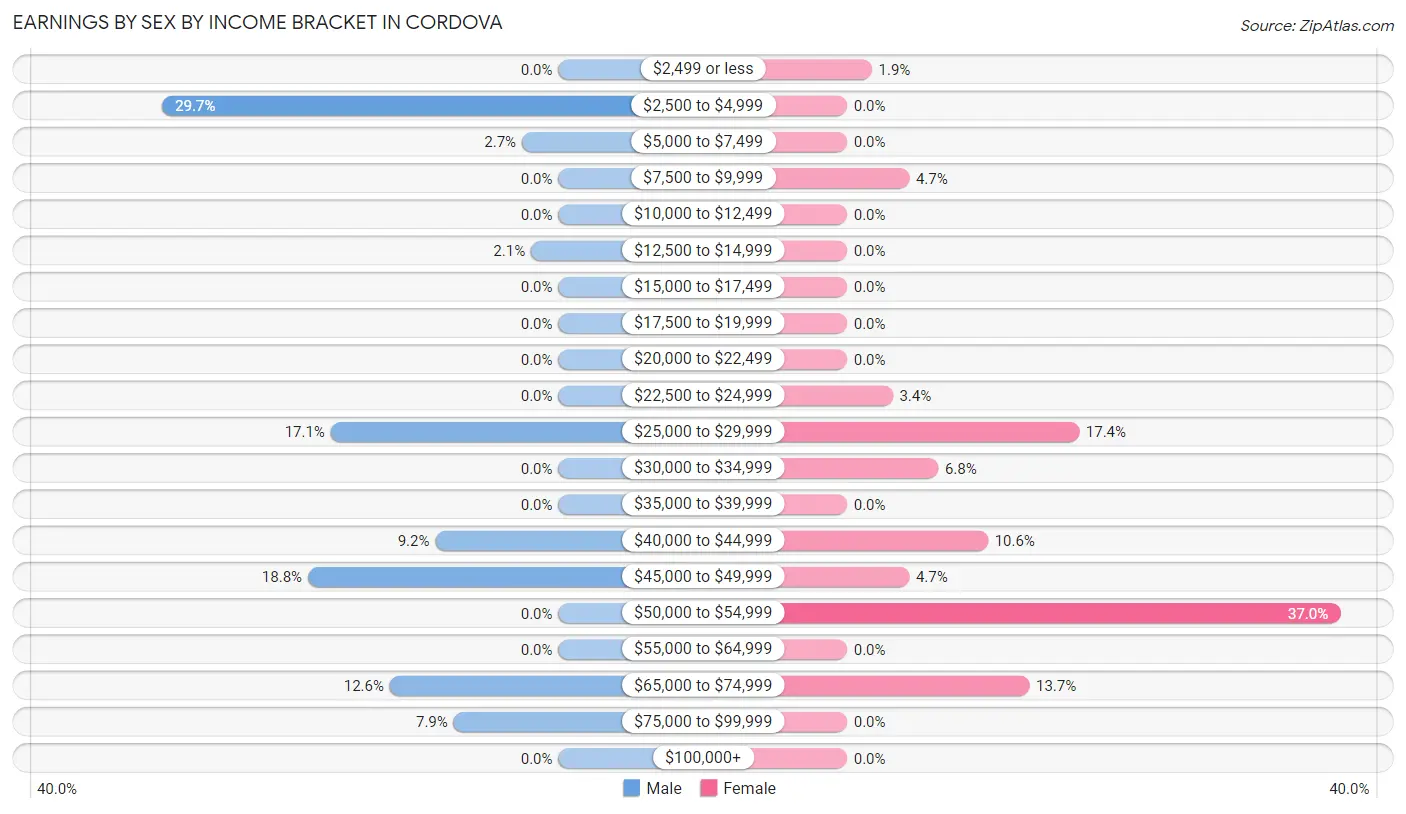
Earnings by Sex by Income Bracket in Cordova
The most common earnings brackets in Cordova are $2,500 to $4,999 for men (87 | 29.7%) and $50,000 to $54,999 for women (119 | 37.0%).
| Income | Male | Female |
| $2,499 or less | 0 (0.0%) | 6 (1.9%) |
| $2,500 to $4,999 | 87 (29.7%) | 0 (0.0%) |
| $5,000 to $7,499 | 8 (2.7%) | 0 (0.0%) |
| $7,500 to $9,999 | 0 (0.0%) | 15 (4.7%) |
| $10,000 to $12,499 | 0 (0.0%) | 0 (0.0%) |
| $12,500 to $14,999 | 6 (2.1%) | 0 (0.0%) |
| $15,000 to $17,499 | 0 (0.0%) | 0 (0.0%) |
| $17,500 to $19,999 | 0 (0.0%) | 0 (0.0%) |
| $20,000 to $22,499 | 0 (0.0%) | 0 (0.0%) |
| $22,500 to $24,999 | 0 (0.0%) | 11 (3.4%) |
| $25,000 to $29,999 | 50 (17.1%) | 56 (17.4%) |
| $30,000 to $34,999 | 0 (0.0%) | 22 (6.8%) |
| $35,000 to $39,999 | 0 (0.0%) | 0 (0.0%) |
| $40,000 to $44,999 | 27 (9.2%) | 34 (10.6%) |
| $45,000 to $49,999 | 55 (18.8%) | 15 (4.7%) |
| $50,000 to $54,999 | 0 (0.0%) | 119 (37.0%) |
| $55,000 to $64,999 | 0 (0.0%) | 0 (0.0%) |
| $65,000 to $74,999 | 37 (12.6%) | 44 (13.7%) |
| $75,000 to $99,999 | 23 (7.9%) | 0 (0.0%) |
| $100,000+ | 0 (0.0%) | 0 (0.0%) |
| Total | 293 (100.0%) | 322 (100.0%) |
Earnings by Sex by Educational Attainment in Cordova
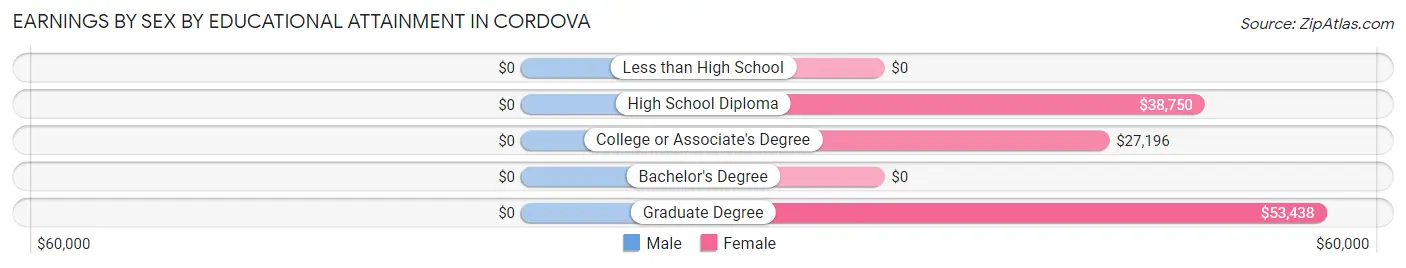
| Educational Attainment | Male Income | Female Income |
| Less than High School | - | - |
| High School Diploma | - | - |
| College or Associate's Degree | - | - |
| Bachelor's Degree | - | - |
| Graduate Degree | - | - |
| Total | $42,500 | $50,523 |
Family Income in Cordova
Family Income Brackets in Cordova
According to the Cordova family income data, there are 86 families falling into the $100,000 to $149,999 income range, which is the most common income bracket and makes up 34.8% of all families.
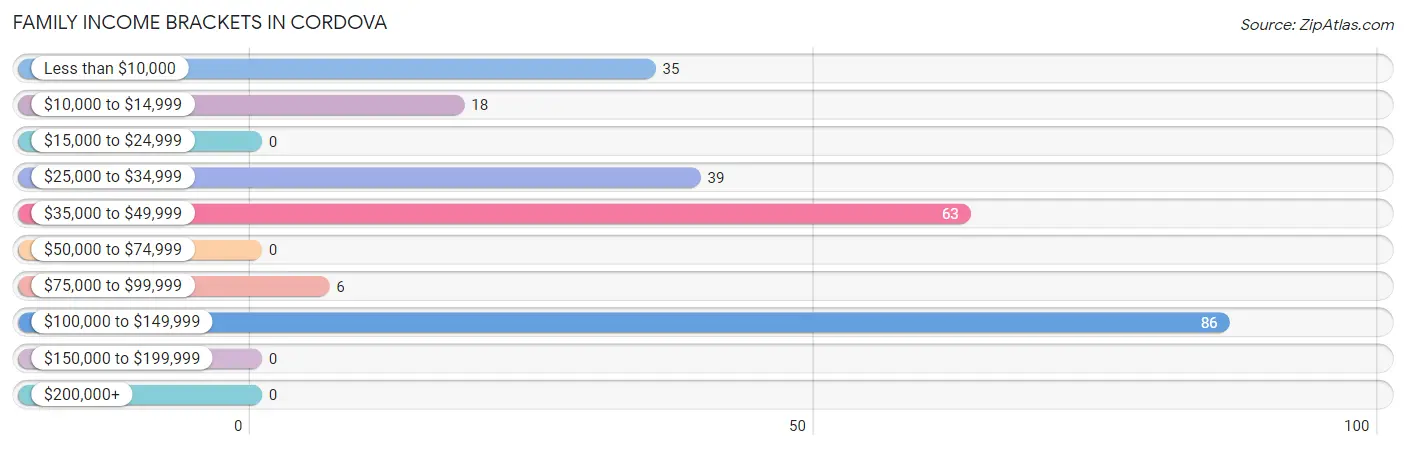
| Income Bracket | # Families | % Families |
| Less than $10,000 | 35 | 14.2% |
| $10,000 to $14,999 | 18 | 7.3% |
| $15,000 to $24,999 | 0 | 0.0% |
| $25,000 to $34,999 | 39 | 15.8% |
| $35,000 to $49,999 | 63 | 25.5% |
| $50,000 to $74,999 | 0 | 0.0% |
| $75,000 to $99,999 | 6 | 2.4% |
| $100,000 to $149,999 | 86 | 34.8% |
| $150,000 to $199,999 | 0 | 0.0% |
| $200,000+ | 0 | 0.0% |
Family Income by Famaliy Size in Cordova
| Income Bracket | # Families | Median Income |
| 2-Person Families | 148 (59.9%) | $0 |
| 3-Person Families | 68 (27.5%) | $0 |
| 4-Person Families | 0 (0.0%) | $0 |
| 5-Person Families | 31 (12.6%) | $0 |
| 6-Person Families | 0 (0.0%) | $0 |
| 7+ Person Families | 0 (0.0%) | $0 |
| Total | 247 (100.0%) | $0 |
Family Income by Number of Earners in Cordova
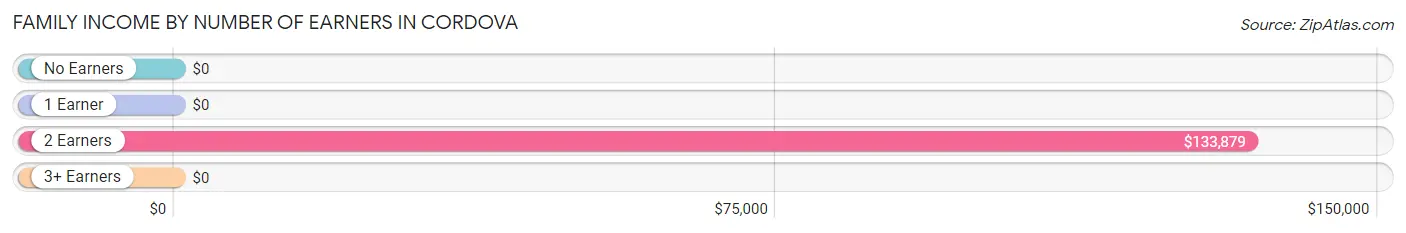
| Number of Earners | # Families | Median Income |
| No Earners | 84 (34.0%) | $0 |
| 1 Earner | 63 (25.5%) | $0 |
| 2 Earners | 100 (40.5%) | $133,879 |
| 3+ Earners | 0 (0.0%) | $0 |
| Total | 247 (100.0%) | $0 |
Household Income in Cordova
Household Income Brackets in Cordova
With 192 households falling in the category, the $50,000 to $74,999 income range is the most frequent in Cordova, accounting for 36.4% of all households.
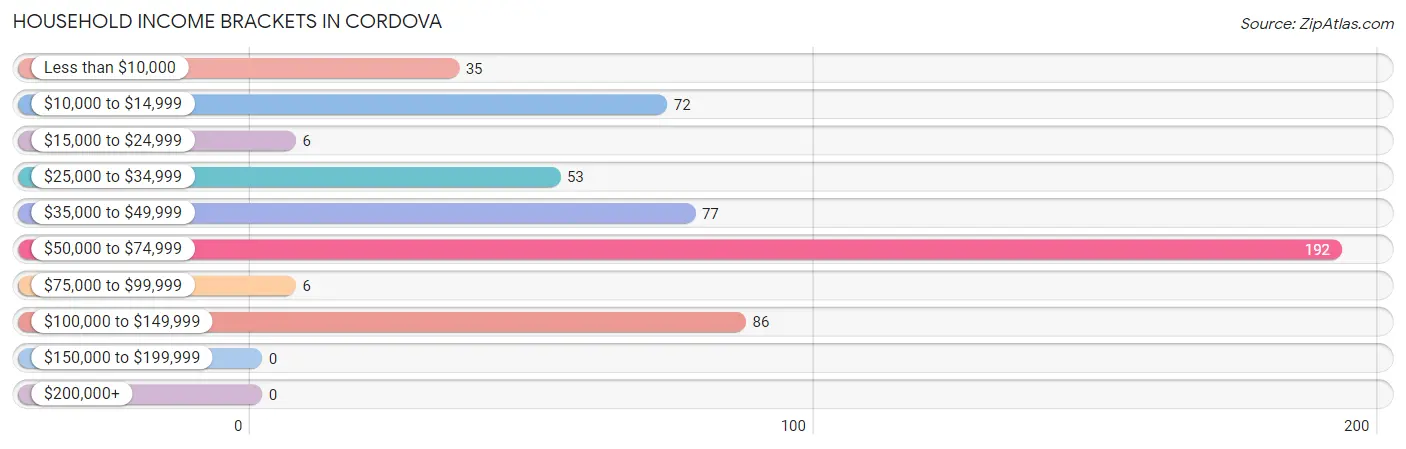
| Income Bracket | # Households | % Households |
| Less than $10,000 | 35 | 6.6% |
| $10,000 to $14,999 | 72 | 13.7% |
| $15,000 to $24,999 | 6 | 1.1% |
| $25,000 to $34,999 | 53 | 10.1% |
| $35,000 to $49,999 | 77 | 14.6% |
| $50,000 to $74,999 | 192 | 36.4% |
| $75,000 to $99,999 | 6 | 1.1% |
| $100,000 to $149,999 | 86 | 16.3% |
| $150,000 to $199,999 | 0 | 0.0% |
| $200,000+ | 0 | 0.0% |
Household Income by Householder Age in Cordova
The median household income in Cordova is $51,046, with the highest median household income of $52,194 found in the 45 to 64 years age bracket for the primary householder. A total of 256 households (48.6%) fall into this category. Meanwhile, the 15 to 24 years age bracket for the primary householder has the lowest median household income of $0, with 25 households (4.7%) in this group.
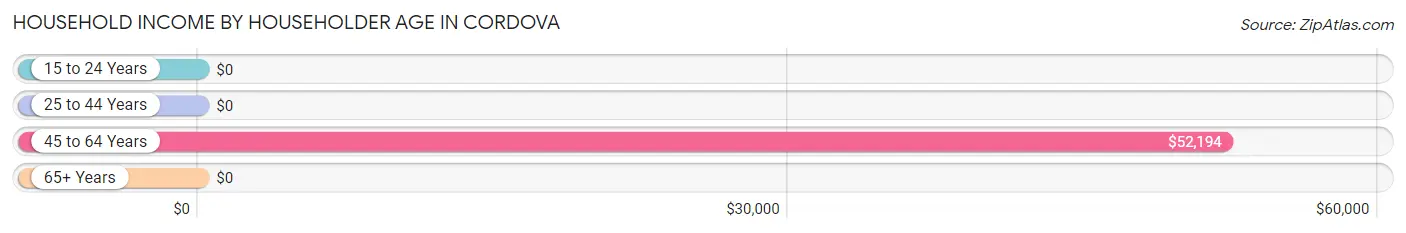
| Income Bracket | # Households | Median Income |
| 15 to 24 Years | 25 (4.7%) | $0 |
| 25 to 44 Years | 88 (16.7%) | $0 |
| 45 to 64 Years | 256 (48.6%) | $52,194 |
| 65+ Years | 158 (30.0%) | $0 |
| Total | 527 (100.0%) | $51,046 |
Poverty in Cordova
Income Below Poverty by Sex and Age in Cordova
With 64.8% poverty level for males and 25.2% for females among the residents of Cordova, 6 to 11 year old males and under 5 year old females are the most vulnerable to poverty, with 20 males (100.0%) and 57 females (100.0%) in their respective age groups living below the poverty level.
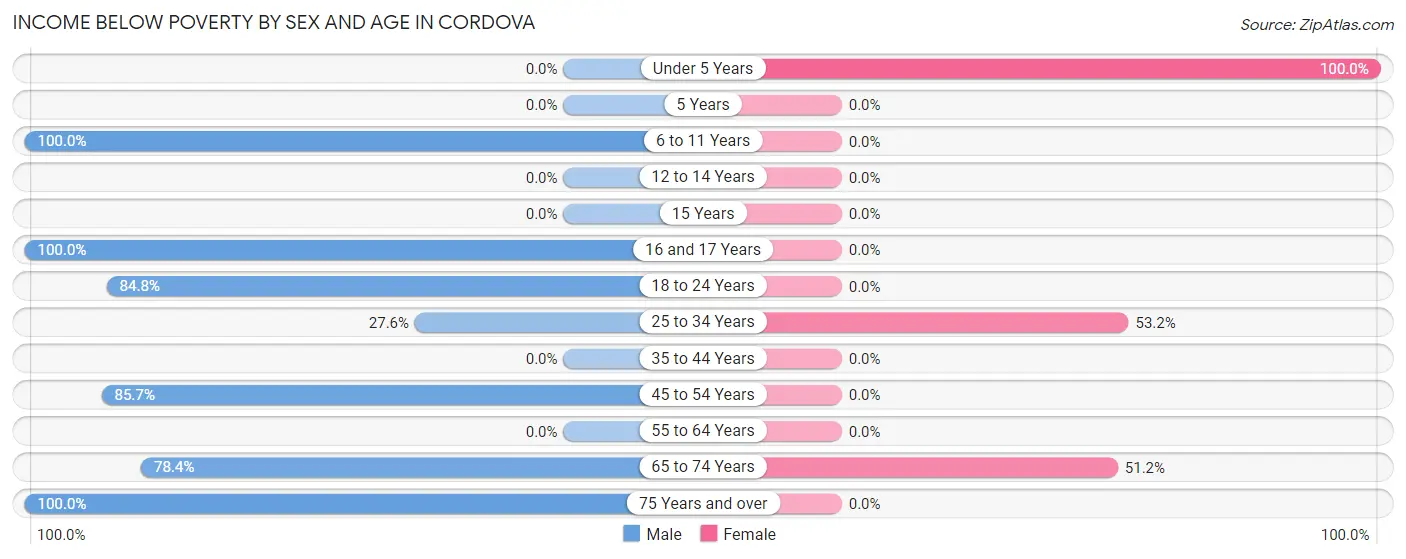
| Age Bracket | Male | Female |
| Under 5 Years | 0 (0.0%) | 57 (100.0%) |
| 5 Years | 0 (0.0%) | 0 (0.0%) |
| 6 to 11 Years | 20 (100.0%) | 0 (0.0%) |
| 12 to 14 Years | 0 (0.0%) | 0 (0.0%) |
| 15 Years | 0 (0.0%) | 0 (0.0%) |
| 16 and 17 Years | 56 (100.0%) | 0 (0.0%) |
| 18 to 24 Years | 139 (84.8%) | 0 (0.0%) |
| 25 to 34 Years | 35 (27.6%) | 33 (53.2%) |
| 35 to 44 Years | 0 (0.0%) | 0 (0.0%) |
| 45 to 54 Years | 162 (85.7%) | 0 (0.0%) |
| 55 to 64 Years | 0 (0.0%) | 0 (0.0%) |
| 65 to 74 Years | 29 (78.4%) | 62 (51.2%) |
| 75 Years and over | 23 (100.0%) | 0 (0.0%) |
| Total | 464 (64.8%) | 152 (25.2%) |
Income Above Poverty by Sex and Age in Cordova
According to the poverty statistics in Cordova, males aged 55 to 64 years and females aged 16 and 17 years are the age groups that are most secure financially, with 100.0% of males and 100.0% of females in these age groups living above the poverty line.
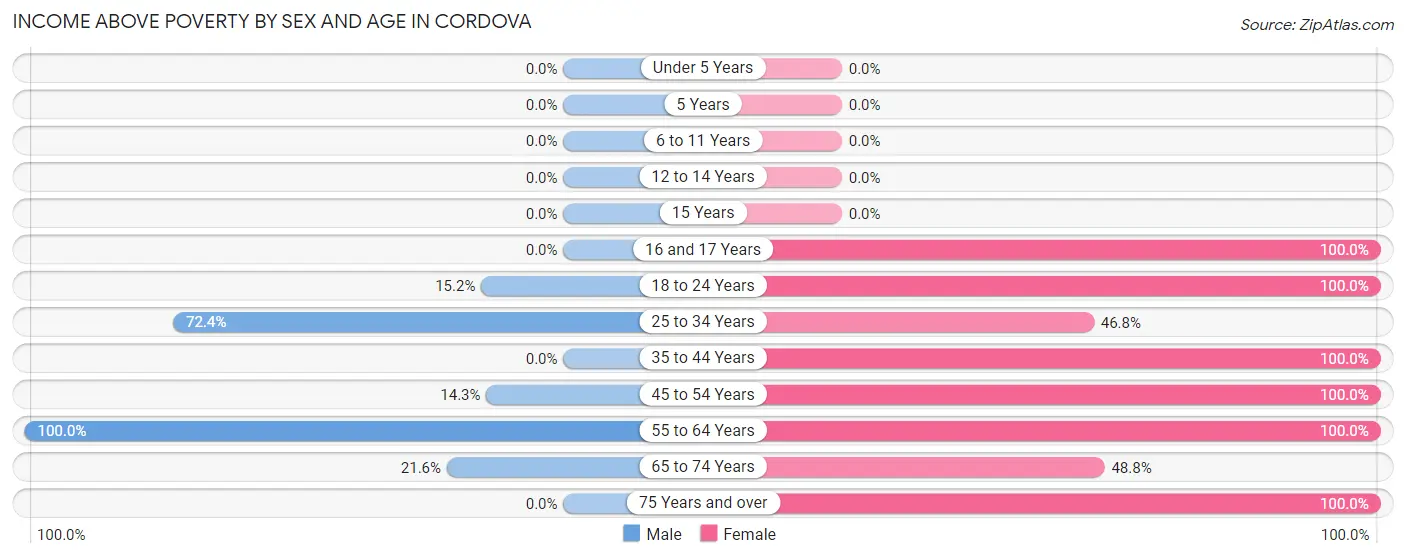
| Age Bracket | Male | Female |
| Under 5 Years | 0 (0.0%) | 0 (0.0%) |
| 5 Years | 0 (0.0%) | 0 (0.0%) |
| 6 to 11 Years | 0 (0.0%) | 0 (0.0%) |
| 12 to 14 Years | 0 (0.0%) | 0 (0.0%) |
| 15 Years | 0 (0.0%) | 0 (0.0%) |
| 16 and 17 Years | 0 (0.0%) | 75 (100.0%) |
| 18 to 24 Years | 25 (15.2%) | 19 (100.0%) |
| 25 to 34 Years | 92 (72.4%) | 29 (46.8%) |
| 35 to 44 Years | 0 (0.0%) | 33 (100.0%) |
| 45 to 54 Years | 27 (14.3%) | 136 (100.0%) |
| 55 to 64 Years | 100 (100.0%) | 87 (100.0%) |
| 65 to 74 Years | 8 (21.6%) | 59 (48.8%) |
| 75 Years and over | 0 (0.0%) | 14 (100.0%) |
| Total | 252 (35.2%) | 452 (74.8%) |
Income Below Poverty Among Married-Couple Families in Cordova
The poverty statistics for married-couple families in Cordova show that 16.7% or 31 of the total 186 families live below the poverty line. Families with 1 or 2 children have the highest poverty rate of 53.4%, comprising of 31 families. On the other hand, families with no children have the lowest poverty rate of 0.0%, which includes 0 families.
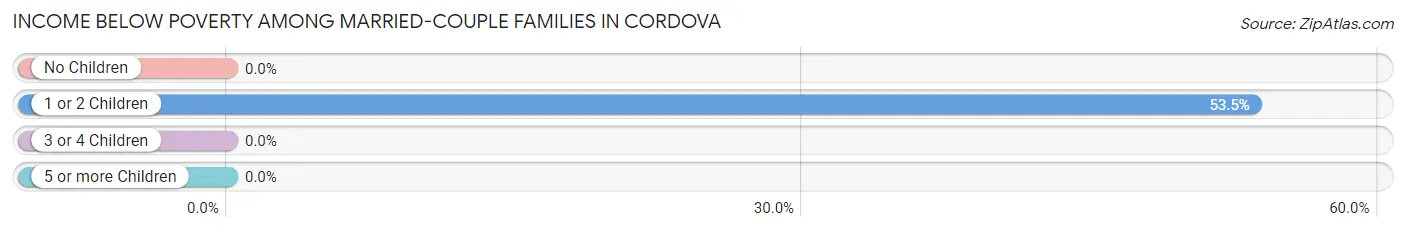
| Children | Above Poverty | Below Poverty |
| No Children | 128 (100.0%) | 0 (0.0%) |
| 1 or 2 Children | 27 (46.6%) | 31 (53.4%) |
| 3 or 4 Children | 0 (0.0%) | 0 (0.0%) |
| 5 or more Children | 0 (0.0%) | 0 (0.0%) |
| Total | 155 (83.3%) | 31 (16.7%) |
Income Below Poverty Among Single-Parent Households in Cordova
According to the poverty data in Cordova, 100.0% or 35 single-father households and 69.2% or 18 single-mother households are living below the poverty line. Among single-father households, those with 1 or 2 children have the highest poverty rate, with 35 households (100.0%) experiencing poverty. Likewise, among single-mother households, those with 1 or 2 children have the highest poverty rate, with 18 households (100.0%) falling below the poverty line.
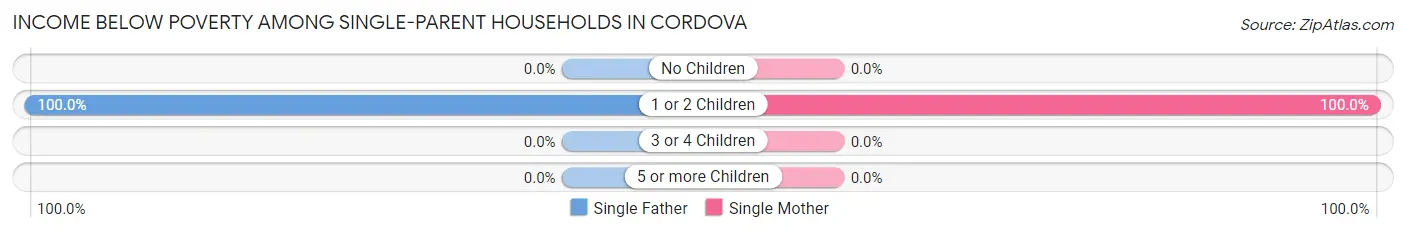
| Children | Single Father | Single Mother |
| No Children | 0 (0.0%) | 0 (0.0%) |
| 1 or 2 Children | 35 (100.0%) | 18 (100.0%) |
| 3 or 4 Children | 0 (0.0%) | 0 (0.0%) |
| 5 or more Children | 0 (0.0%) | 0 (0.0%) |
| Total | 35 (100.0%) | 18 (69.2%) |
Income Below Poverty Among Married-Couple vs Single-Parent Households in Cordova
The poverty data for Cordova shows that 31 of the married-couple family households (16.7%) and 53 of the single-parent households (86.9%) are living below the poverty level. Within the married-couple family households, those with 1 or 2 children have the highest poverty rate, with 31 households (53.4%) falling below the poverty line. Among the single-parent households, those with 1 or 2 children have the highest poverty rate, with 53 household (100.0%) living below poverty.
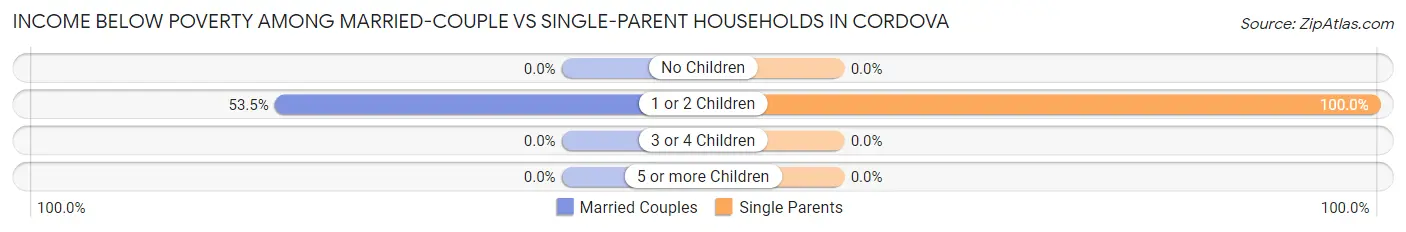
| Children | Married-Couple Families | Single-Parent Households |
| No Children | 0 (0.0%) | 0 (0.0%) |
| 1 or 2 Children | 31 (53.4%) | 53 (100.0%) |
| 3 or 4 Children | 0 (0.0%) | 0 (0.0%) |
| 5 or more Children | 0 (0.0%) | 0 (0.0%) |
| Total | 31 (16.7%) | 53 (86.9%) |
Race in Cordova
The most populous races in Cordova are White / Caucasian (812 | 61.5%), Two or more Races (256 | 19.4%), and Black / African American (136 | 10.3%).
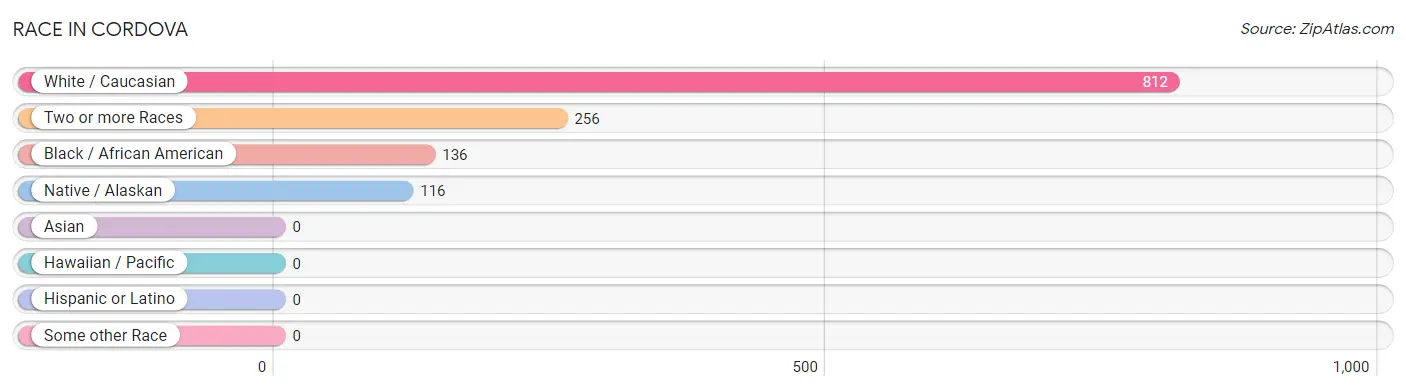
| Race | # Population | % Population |
| Asian | 0 | 0.0% |
| Black / African American | 136 | 10.3% |
| Hawaiian / Pacific | 0 | 0.0% |
| Hispanic or Latino | 0 | 0.0% |
| Native / Alaskan | 116 | 8.8% |
| White / Caucasian | 812 | 61.5% |
| Two or more Races | 256 | 19.4% |
| Some other Race | 0 | 0.0% |
| Total | 1,320 | 100.0% |
Ancestry in Cordova
The most populous ancestries reported in Cordova are American (145 | 11.0%), Lumbee (117 | 8.9%), Irish (75 | 5.7%), German (41 | 3.1%), and English (33 | 2.5%), together accounting for 31.1% of all Cordova residents.
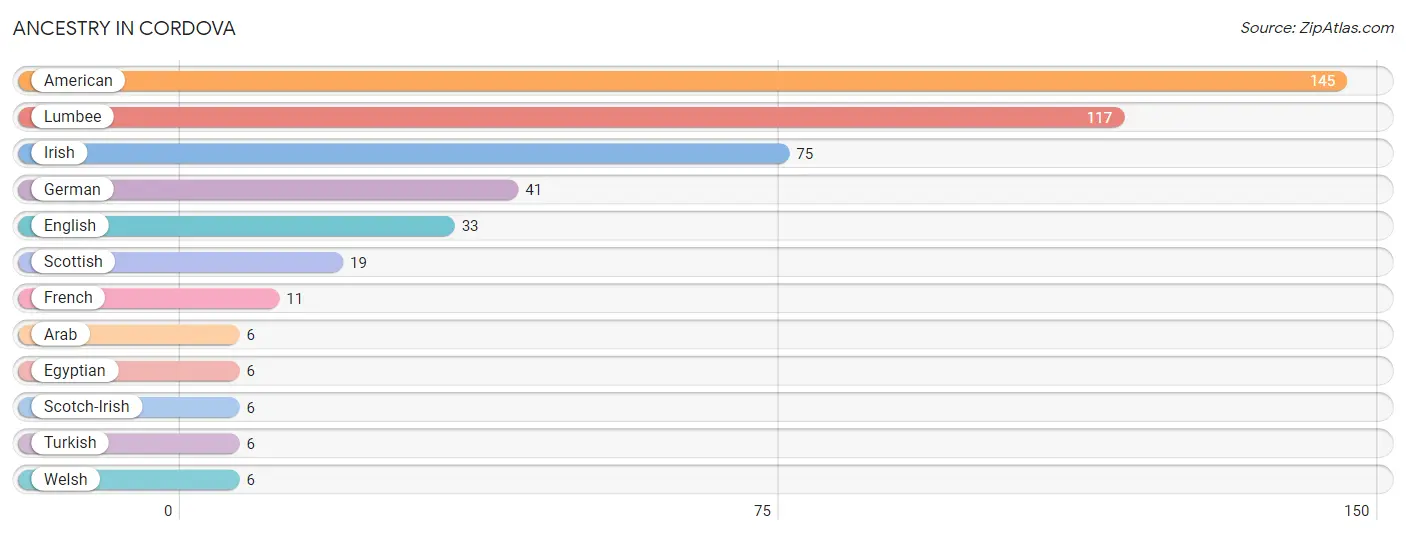
| Ancestry | # Population | % Population |
| American | 145 | 11.0% |
| Arab | 6 | 0.4% |
| Egyptian | 6 | 0.4% |
| English | 33 | 2.5% |
| French | 11 | 0.8% |
| German | 41 | 3.1% |
| Irish | 75 | 5.7% |
| Lumbee | 117 | 8.9% |
| Scotch-Irish | 6 | 0.4% |
| Scottish | 19 | 1.4% |
| Turkish | 6 | 0.4% |
| Welsh | 6 | 0.4% | View All 12 Rows |
Immigrants in Cordova

| Immigration Origin | # Population | % Population | View All 0 Rows |
Sex and Age in Cordova
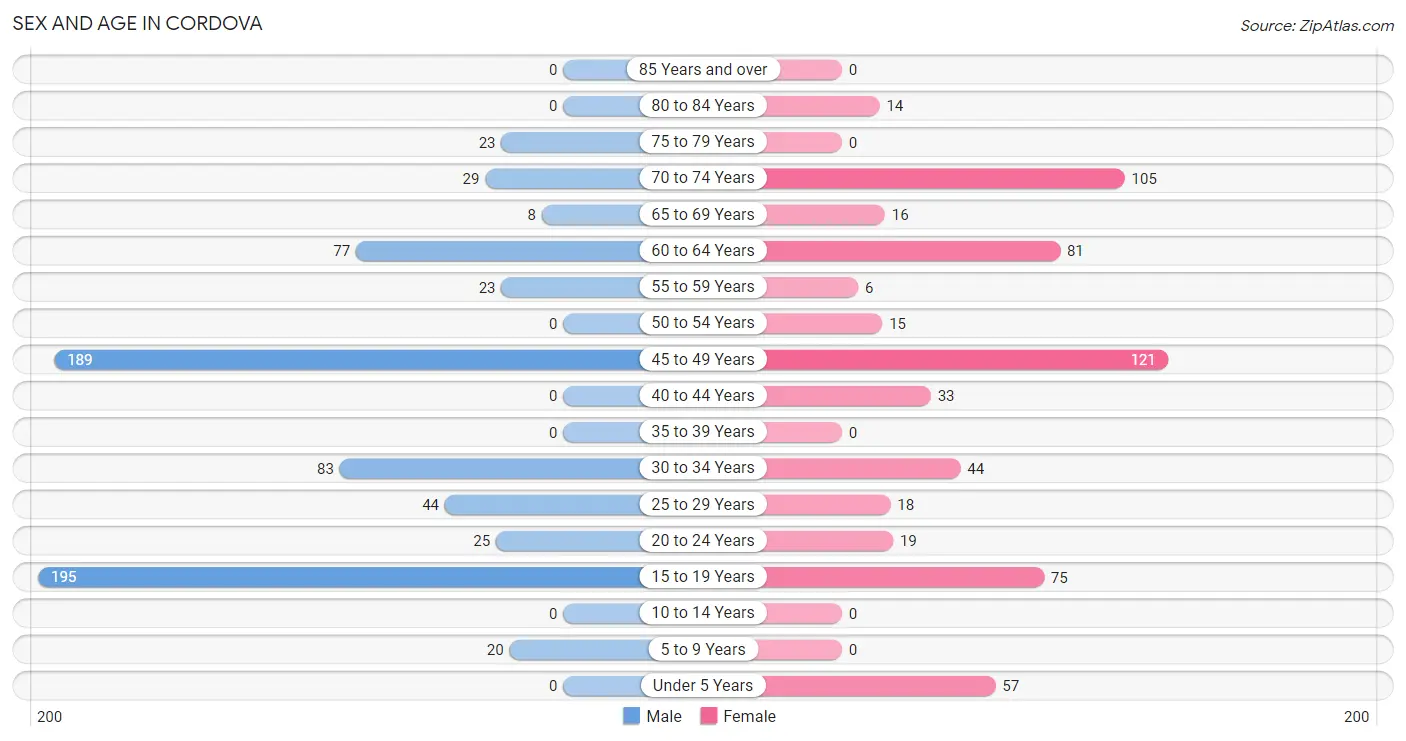
Sex and Age in Cordova
The most populous age groups in Cordova are 15 to 19 Years (195 | 27.2%) for men and 45 to 49 Years (121 | 20.0%) for women.
| Age Bracket | Male | Female |
| Under 5 Years | 0 (0.0%) | 57 (9.4%) |
| 5 to 9 Years | 20 (2.8%) | 0 (0.0%) |
| 10 to 14 Years | 0 (0.0%) | 0 (0.0%) |
| 15 to 19 Years | 195 (27.2%) | 75 (12.4%) |
| 20 to 24 Years | 25 (3.5%) | 19 (3.2%) |
| 25 to 29 Years | 44 (6.1%) | 18 (3.0%) |
| 30 to 34 Years | 83 (11.6%) | 44 (7.3%) |
| 35 to 39 Years | 0 (0.0%) | 0 (0.0%) |
| 40 to 44 Years | 0 (0.0%) | 33 (5.5%) |
| 45 to 49 Years | 189 (26.4%) | 121 (20.0%) |
| 50 to 54 Years | 0 (0.0%) | 15 (2.5%) |
| 55 to 59 Years | 23 (3.2%) | 6 (1.0%) |
| 60 to 64 Years | 77 (10.7%) | 81 (13.4%) |
| 65 to 69 Years | 8 (1.1%) | 16 (2.6%) |
| 70 to 74 Years | 29 (4.1%) | 105 (17.4%) |
| 75 to 79 Years | 23 (3.2%) | 0 (0.0%) |
| 80 to 84 Years | 0 (0.0%) | 14 (2.3%) |
| 85 Years and over | 0 (0.0%) | 0 (0.0%) |
| Total | 716 (100.0%) | 604 (100.0%) |
Families and Households in Cordova
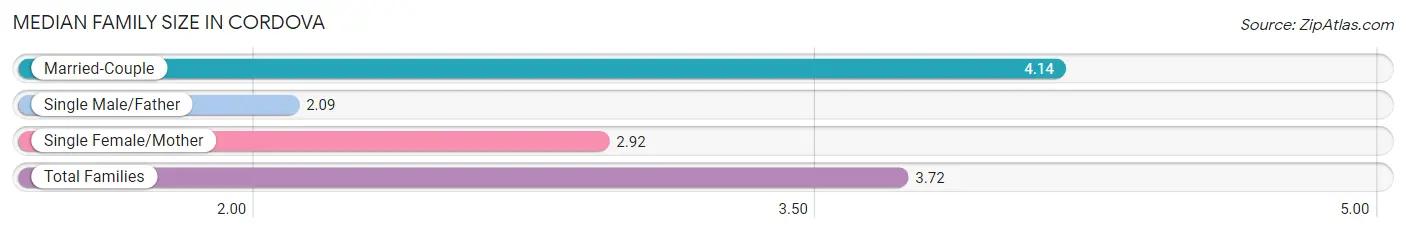
Median Family Size in Cordova
The median family size in Cordova is 3.72 persons per family, with married-couple families (186 | 75.3%) accounting for the largest median family size of 4.14 persons per family. On the other hand, single male/father families (35 | 14.2%) represent the smallest median family size with 2.09 persons per family.
| Family Type | # Families | Family Size |
| Married-Couple | 186 (75.3%) | 4.14 |
| Single Male/Father | 35 (14.2%) | 2.09 |
| Single Female/Mother | 26 (10.5%) | 2.92 |
| Total Families | 247 (100.0%) | 3.72 |
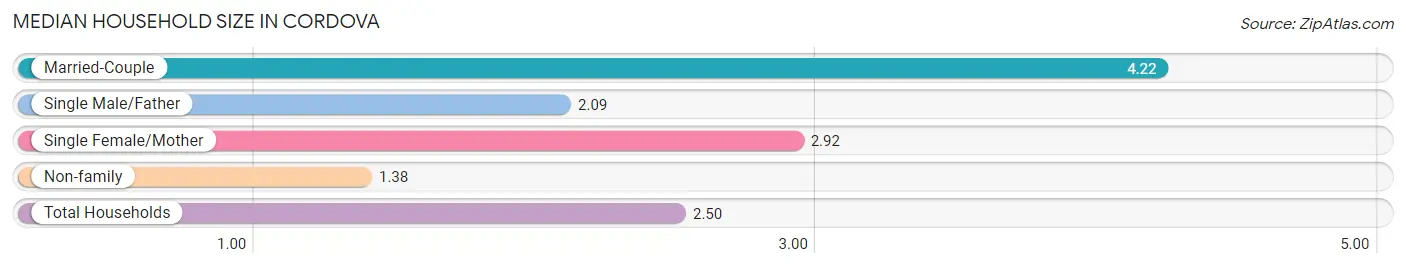
Median Household Size in Cordova
The median household size in Cordova is 2.50 persons per household, with married-couple households (186 | 35.3%) accounting for the largest median household size of 4.22 persons per household. non-family households (280 | 53.1%) represent the smallest median household size with 1.38 persons per household.
| Household Type | # Households | Household Size |
| Married-Couple | 186 (35.3%) | 4.22 |
| Single Male/Father | 35 (6.6%) | 2.09 |
| Single Female/Mother | 26 (4.9%) | 2.92 |
| Non-family | 280 (53.1%) | 1.38 |
| Total Households | 527 (100.0%) | 2.50 |
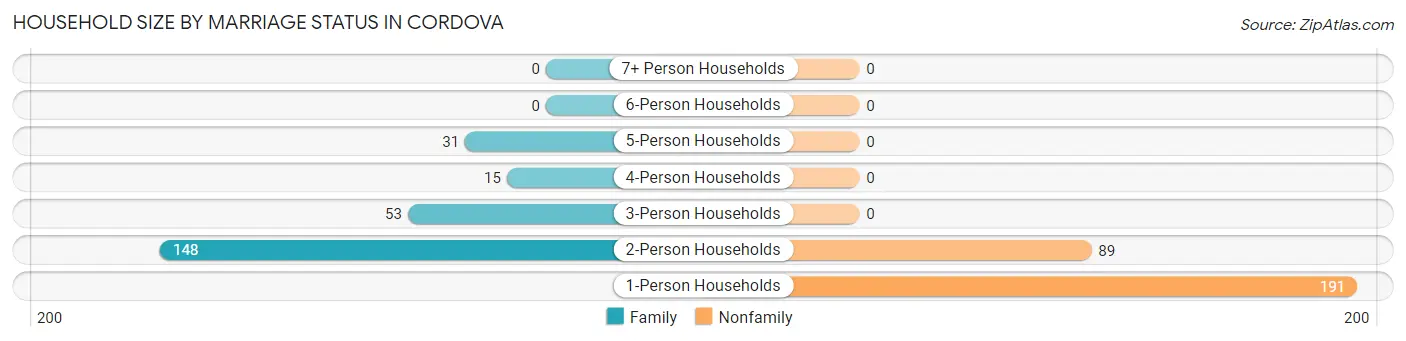
Household Size by Marriage Status in Cordova
Out of a total of 527 households in Cordova, 247 (46.9%) are family households, while 280 (53.1%) are nonfamily households. The most numerous type of family households are 2-person households, comprising 148, and the most common type of nonfamily households are 1-person households, comprising 191.
| Household Size | Family Households | Nonfamily Households |
| 1-Person Households | - | 191 (36.2%) |
| 2-Person Households | 148 (28.1%) | 89 (16.9%) |
| 3-Person Households | 53 (10.1%) | 0 (0.0%) |
| 4-Person Households | 15 (2.9%) | 0 (0.0%) |
| 5-Person Households | 31 (5.9%) | 0 (0.0%) |
| 6-Person Households | 0 (0.0%) | 0 (0.0%) |
| 7+ Person Households | 0 (0.0%) | 0 (0.0%) |
| Total | 247 (46.9%) | 280 (53.1%) |
Female Fertility in Cordova
Fertility by Age in Cordova
| Age Bracket | Women with Births | Births / 1,000 Women |
| 15 to 19 years | 0 (0.0%) | 0.0 |
| 20 to 34 years | 0 (0.0%) | 0.0 |
| 35 to 50 years | 0 (0.0%) | 0.0 |
| Total | 0 (0.0%) | 0.0 |
Fertility by Age by Marriage Status in Cordova
| Age Bracket | Married | Unmarried |
| 15 to 19 years | 0 (0.0%) | 0 (0.0%) |
| 20 to 34 years | 0 (0.0%) | 0 (0.0%) |
| 35 to 50 years | 0 (0.0%) | 0 (0.0%) |
| Total | 0 (0.0%) | 0 (0.0%) |
Fertility by Education in Cordova
| Educational Attainment | Women with Births | Births / 1,000 Women |
| Less than High School | 0 (0.0%) | 0.0 |
| High School Diploma | 0 (0.0%) | 0.0 |
| College or Associate's Degree | 0 (0.0%) | 0.0 |
| Bachelor's Degree | 0 (0.0%) | 0.0 |
| Graduate Degree | 0 (0.0%) | 0.0 |
| Total | 0 (0.0%) | 0.0 |
Fertility by Education by Marriage Status in Cordova
| Educational Attainment | Married | Unmarried |
| Less than High School | 0 (0.0%) | 0 (0.0%) |
| High School Diploma | 0 (0.0%) | 0 (0.0%) |
| College or Associate's Degree | 0 (0.0%) | 0 (0.0%) |
| Bachelor's Degree | 0 (0.0%) | 0 (0.0%) |
| Graduate Degree | 0 (0.0%) | 0 (0.0%) |
| Total | 0 (0.0%) | 0 (0.0%) |
Employment Characteristics in Cordova
Employment by Class of Employer in Cordova
Among the 522 employed individuals in Cordova, private company employees (286 | 54.8%), local government employees (177 | 33.9%), and not-for-profit organizations (59 | 11.3%) make up the most common classes of employment.
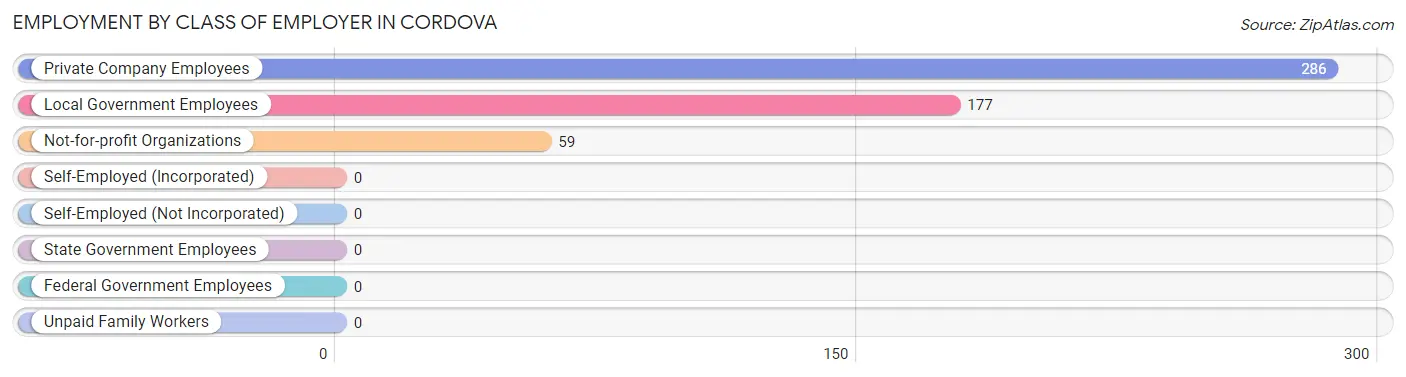
| Employer Class | # Employees | % Employees |
| Private Company Employees | 286 | 54.8% |
| Self-Employed (Incorporated) | 0 | 0.0% |
| Self-Employed (Not Incorporated) | 0 | 0.0% |
| Not-for-profit Organizations | 59 | 11.3% |
| Local Government Employees | 177 | 33.9% |
| State Government Employees | 0 | 0.0% |
| Federal Government Employees | 0 | 0.0% |
| Unpaid Family Workers | 0 | 0.0% |
| Total | 522 | 100.0% |
Employment Status by Age in Cordova
According to the labor force statistics for Cordova, out of the total population over 16 years of age (1,243), 62.9% or 782 individuals are in the labor force, with 33.2% or 260 of them unemployed. The age group with the highest labor force participation rate is 20 to 24 years, with 100.0% or 44 individuals in the labor force. Within the labor force, the 16 to 19 years age range has the highest percentage of unemployed individuals, with 100.0% or 139 of them being unemployed.
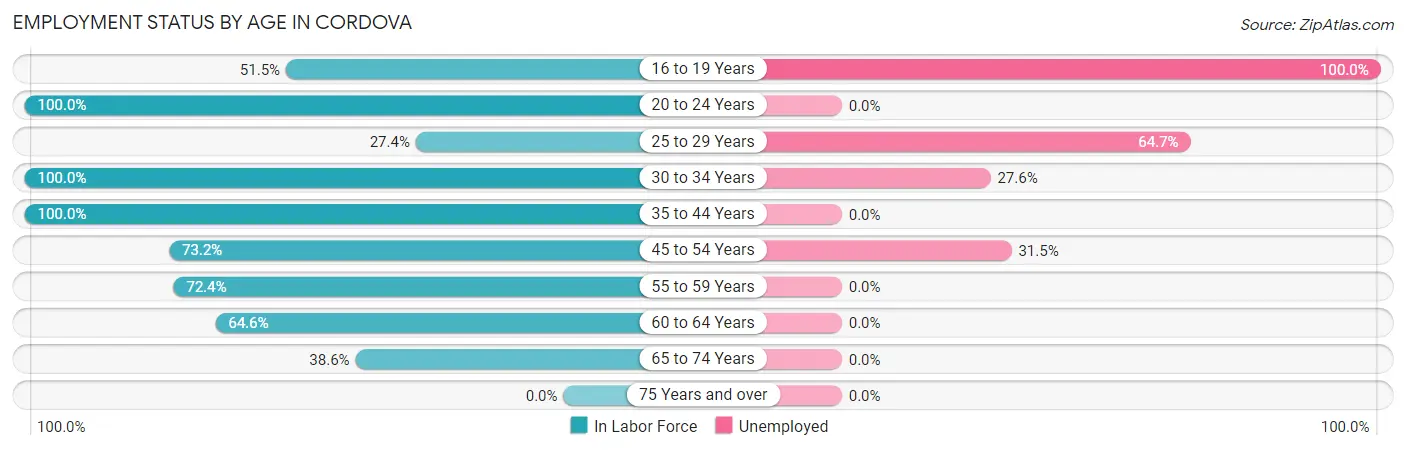
| Age Bracket | In Labor Force | Unemployed |
| 16 to 19 Years | 139 (51.5%) | 139 (100.0%) |
| 20 to 24 Years | 44 (100.0%) | 0 (0.0%) |
| 25 to 29 Years | 17 (27.4%) | 11 (64.7%) |
| 30 to 34 Years | 127 (100.0%) | 35 (27.6%) |
| 35 to 44 Years | 33 (100.0%) | 0 (0.0%) |
| 45 to 54 Years | 238 (73.2%) | 75 (31.5%) |
| 55 to 59 Years | 21 (72.4%) | 0 (0.0%) |
| 60 to 64 Years | 102 (64.6%) | 0 (0.0%) |
| 65 to 74 Years | 61 (38.6%) | 0 (0.0%) |
| 75 Years and over | 0 (0.0%) | 0 (0.0%) |
| Total | 782 (62.9%) | 260 (33.2%) |
Employment Status by Educational Attainment in Cordova
According to labor force statistics for Cordova, 73.3% of individuals (538) out of the total population between 25 and 64 years of age (734) are in the labor force, with 22.5% or 121 of them being unemployed. The group with the highest labor force participation rate are those with the educational attainment of less than high school, with 100.0% or 60 individuals in the labor force. Within the labor force, individuals with less than high school education have the highest percentage of unemployment, with 58.3% or 35 of them being unemployed.
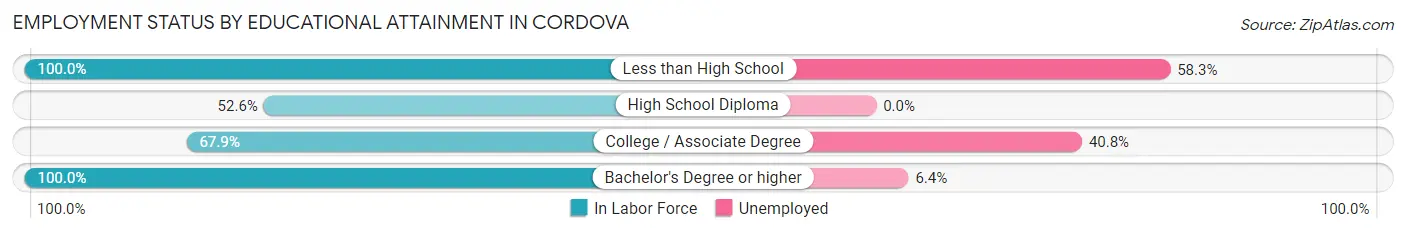
| Educational Attainment | In Labor Force | Unemployed |
| Less than High School | 60 (100.0%) | 35 (58.3%) |
| High School Diploma | 121 (52.6%) | 0 (0.0%) |
| College / Associate Degree | 184 (67.9%) | 111 (40.8%) |
| Bachelor's Degree or higher | 173 (100.0%) | 11 (6.4%) |
| Total | 538 (73.3%) | 165 (22.5%) |
Employment Occupations by Sex in Cordova
Management, Business, Science and Arts Occupations
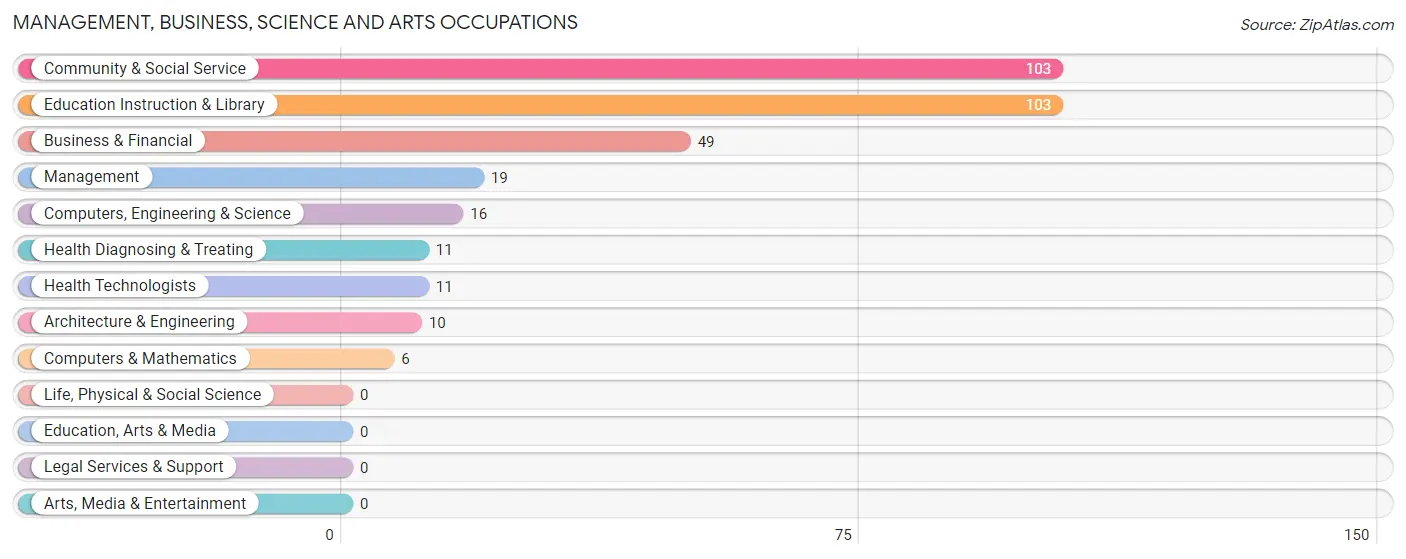
The most common Management, Business, Science and Arts occupations in Cordova are Community & Social Service (103 | 19.7%), Education Instruction & Library (103 | 19.7%), Business & Financial (49 | 9.4%), Management (19 | 3.6%), and Computers, Engineering & Science (16 | 3.1%).
Management, Business, Science and Arts Occupations by Sex
Within the Management, Business, Science and Arts occupations in Cordova, the most male-oriented occupations are Computers, Engineering & Science (100.0%), Computers & Mathematics (100.0%), and Architecture & Engineering (100.0%), while the most female-oriented occupations are Management (100.0%), Business & Financial (100.0%), and Community & Social Service (100.0%).
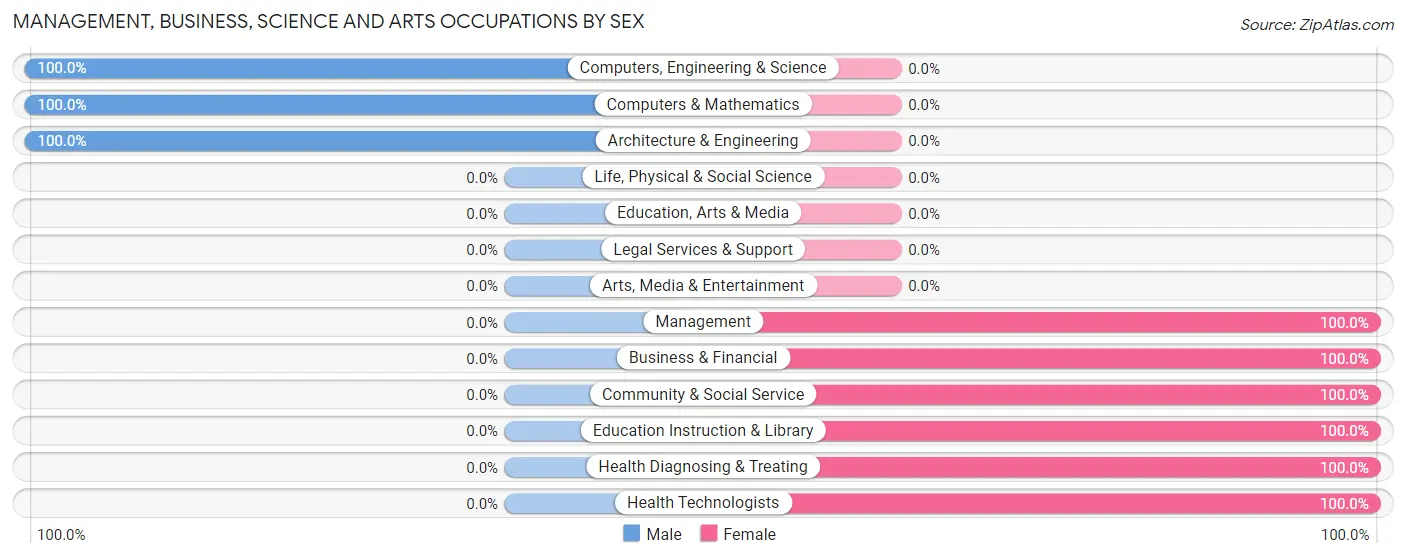
| Occupation | Male | Female |
| Management | 0 (0.0%) | 19 (100.0%) |
| Business & Financial | 0 (0.0%) | 49 (100.0%) |
| Computers, Engineering & Science | 16 (100.0%) | 0 (0.0%) |
| Computers & Mathematics | 6 (100.0%) | 0 (0.0%) |
| Architecture & Engineering | 10 (100.0%) | 0 (0.0%) |
| Life, Physical & Social Science | 0 (0.0%) | 0 (0.0%) |
| Community & Social Service | 0 (0.0%) | 103 (100.0%) |
| Education, Arts & Media | 0 (0.0%) | 0 (0.0%) |
| Legal Services & Support | 0 (0.0%) | 0 (0.0%) |
| Education Instruction & Library | 0 (0.0%) | 103 (100.0%) |
| Arts, Media & Entertainment | 0 (0.0%) | 0 (0.0%) |
| Health Diagnosing & Treating | 0 (0.0%) | 11 (100.0%) |
| Health Technologists | 0 (0.0%) | 11 (100.0%) |
| Total (Category) | 16 (8.1%) | 182 (91.9%) |
| Total (Overall) | 206 (39.5%) | 316 (60.5%) |
Services Occupations
The most common Services occupations in Cordova are , and Cleaning & Maintenance (8 | 1.5%).
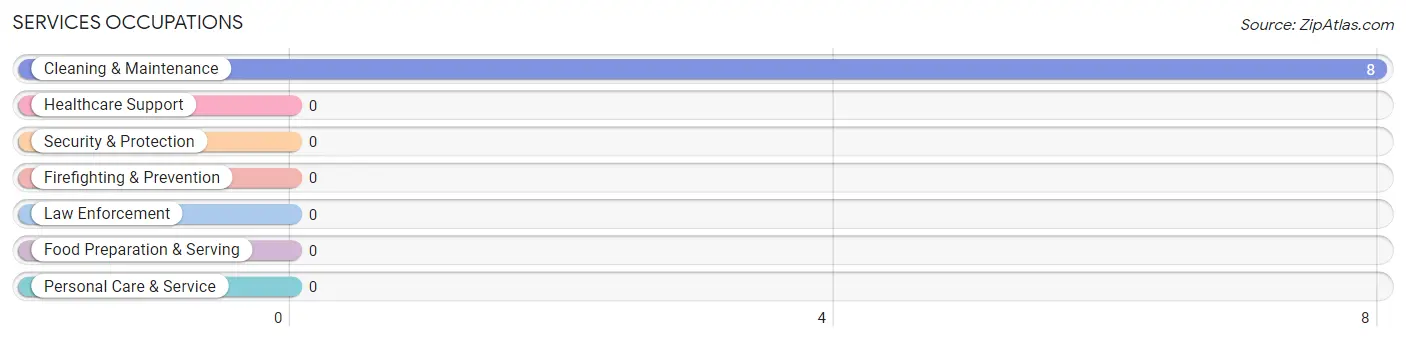
Services Occupations by Sex
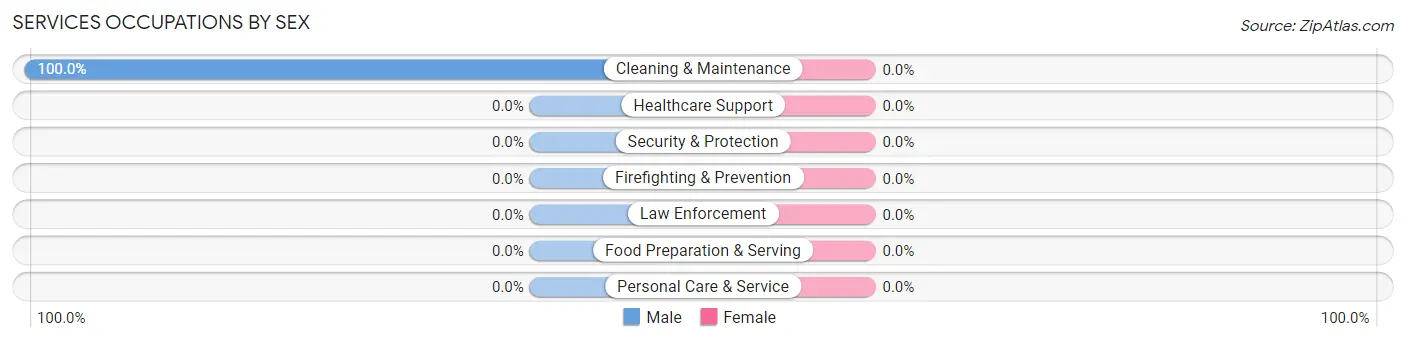
| Occupation | Male | Female |
| Healthcare Support | 0 (0.0%) | 0 (0.0%) |
| Security & Protection | 0 (0.0%) | 0 (0.0%) |
| Firefighting & Prevention | 0 (0.0%) | 0 (0.0%) |
| Law Enforcement | 0 (0.0%) | 0 (0.0%) |
| Food Preparation & Serving | 0 (0.0%) | 0 (0.0%) |
| Cleaning & Maintenance | 8 (100.0%) | 0 (0.0%) |
| Personal Care & Service | 0 (0.0%) | 0 (0.0%) |
| Total (Category) | 8 (100.0%) | 0 (0.0%) |
| Total (Overall) | 206 (39.5%) | 316 (60.5%) |
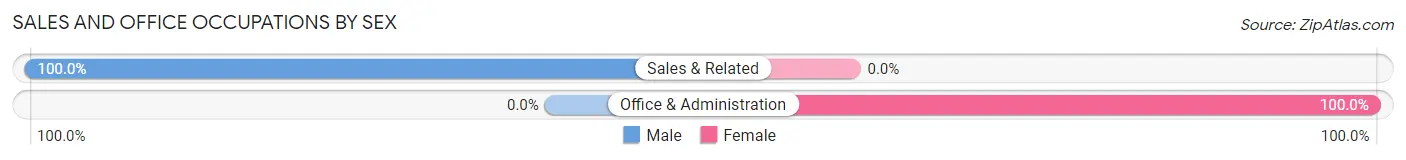
Sales and Office Occupations
The most common Sales and Office occupations in Cordova are Office & Administration (82 | 15.7%), and Sales & Related (8 | 1.5%).
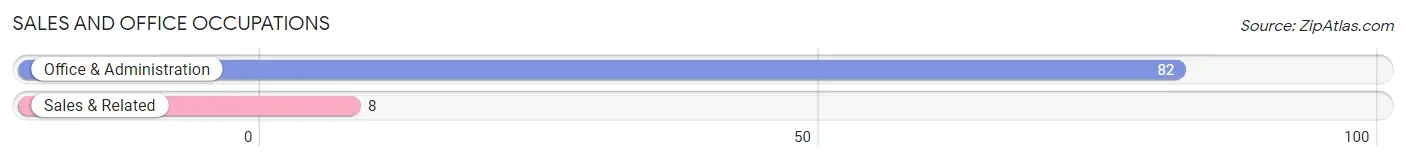
Sales and Office Occupations by Sex
| Occupation | Male | Female |
| Sales & Related | 8 (100.0%) | 0 (0.0%) |
| Office & Administration | 0 (0.0%) | 82 (100.0%) |
| Total (Category) | 8 (8.9%) | 82 (91.1%) |
| Total (Overall) | 206 (39.5%) | 316 (60.5%) |
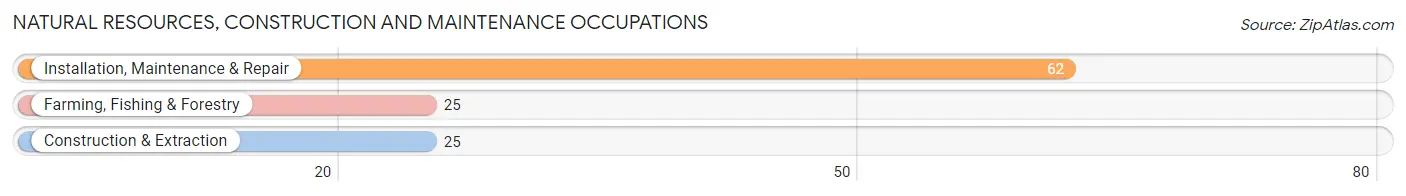
Natural Resources, Construction and Maintenance Occupations
The most common Natural Resources, Construction and Maintenance occupations in Cordova are Installation, Maintenance & Repair (62 | 11.9%), Farming, Fishing & Forestry (25 | 4.8%), and Construction & Extraction (25 | 4.8%).
Natural Resources, Construction and Maintenance Occupations by Sex
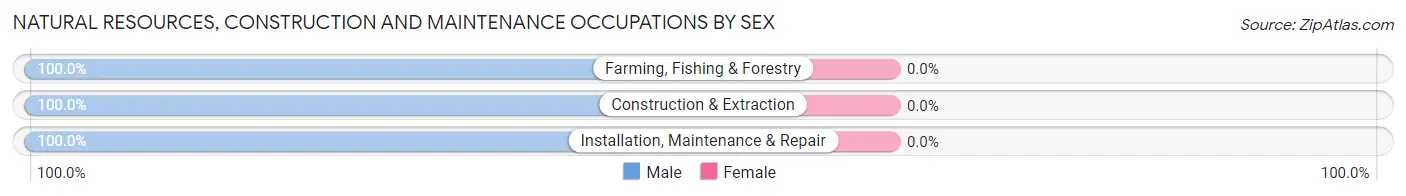
| Occupation | Male | Female |
| Farming, Fishing & Forestry | 25 (100.0%) | 0 (0.0%) |
| Construction & Extraction | 25 (100.0%) | 0 (0.0%) |
| Installation, Maintenance & Repair | 62 (100.0%) | 0 (0.0%) |
| Total (Category) | 112 (100.0%) | 0 (0.0%) |
| Total (Overall) | 206 (39.5%) | 316 (60.5%) |
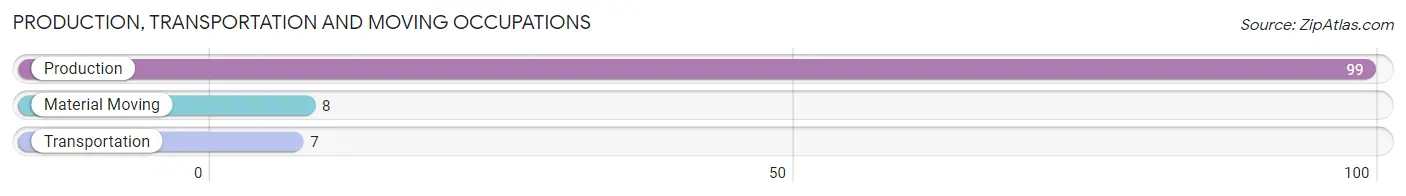
Production, Transportation and Moving Occupations
The most common Production, Transportation and Moving occupations in Cordova are Production (99 | 19.0%), Material Moving (8 | 1.5%), and Transportation (7 | 1.3%).
Production, Transportation and Moving Occupations by Sex
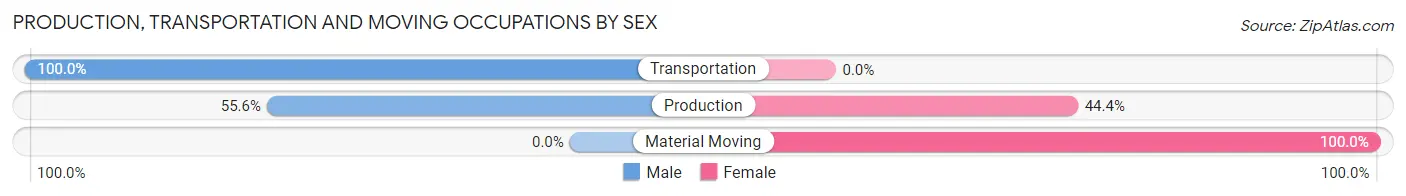
| Occupation | Male | Female |
| Production | 55 (55.6%) | 44 (44.4%) |
| Transportation | 7 (100.0%) | 0 (0.0%) |
| Material Moving | 0 (0.0%) | 8 (100.0%) |
| Total (Category) | 62 (54.4%) | 52 (45.6%) |
| Total (Overall) | 206 (39.5%) | 316 (60.5%) |
Employment Industries by Sex in Cordova
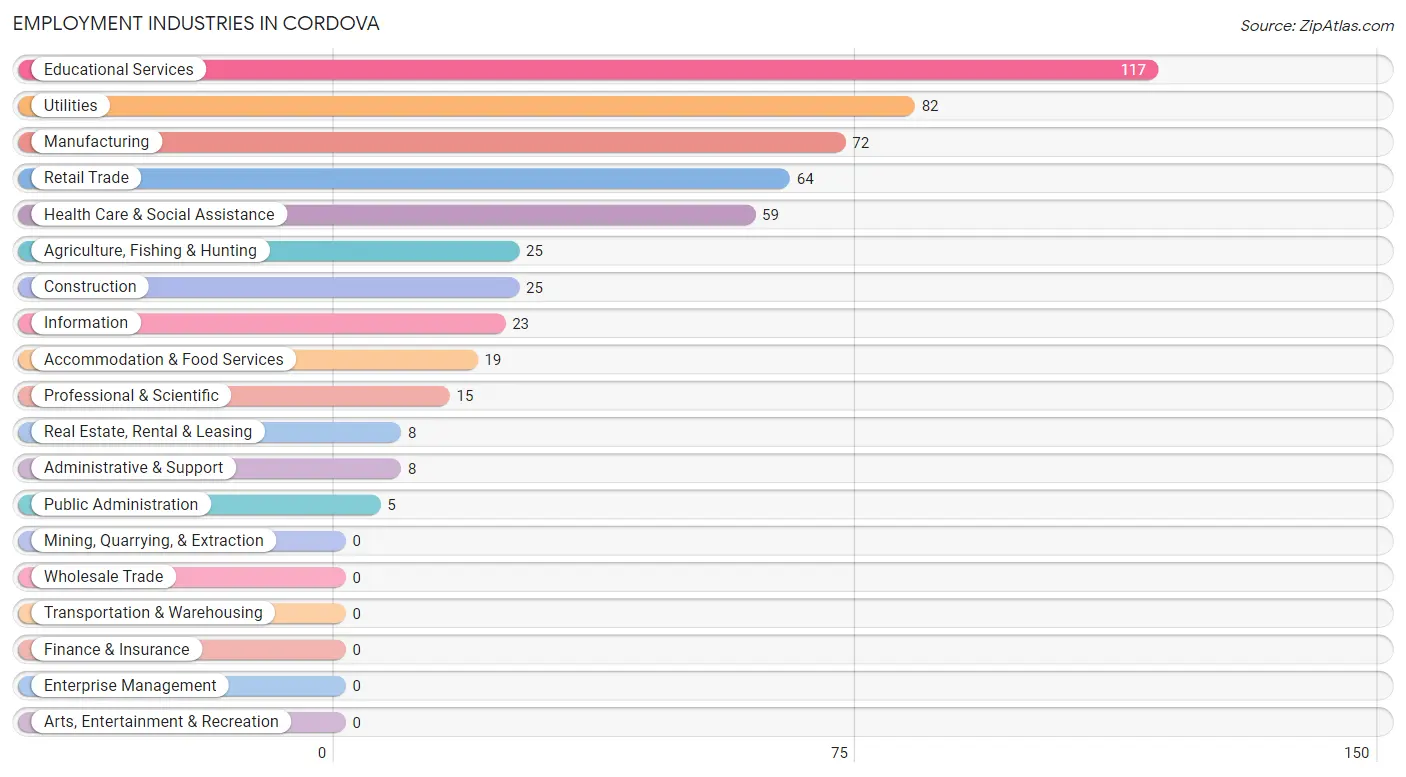
Employment Industries in Cordova
The major employment industries in Cordova include Educational Services (117 | 22.4%), Utilities (82 | 15.7%), Manufacturing (72 | 13.8%), Retail Trade (64 | 12.3%), and Health Care & Social Assistance (59 | 11.3%).
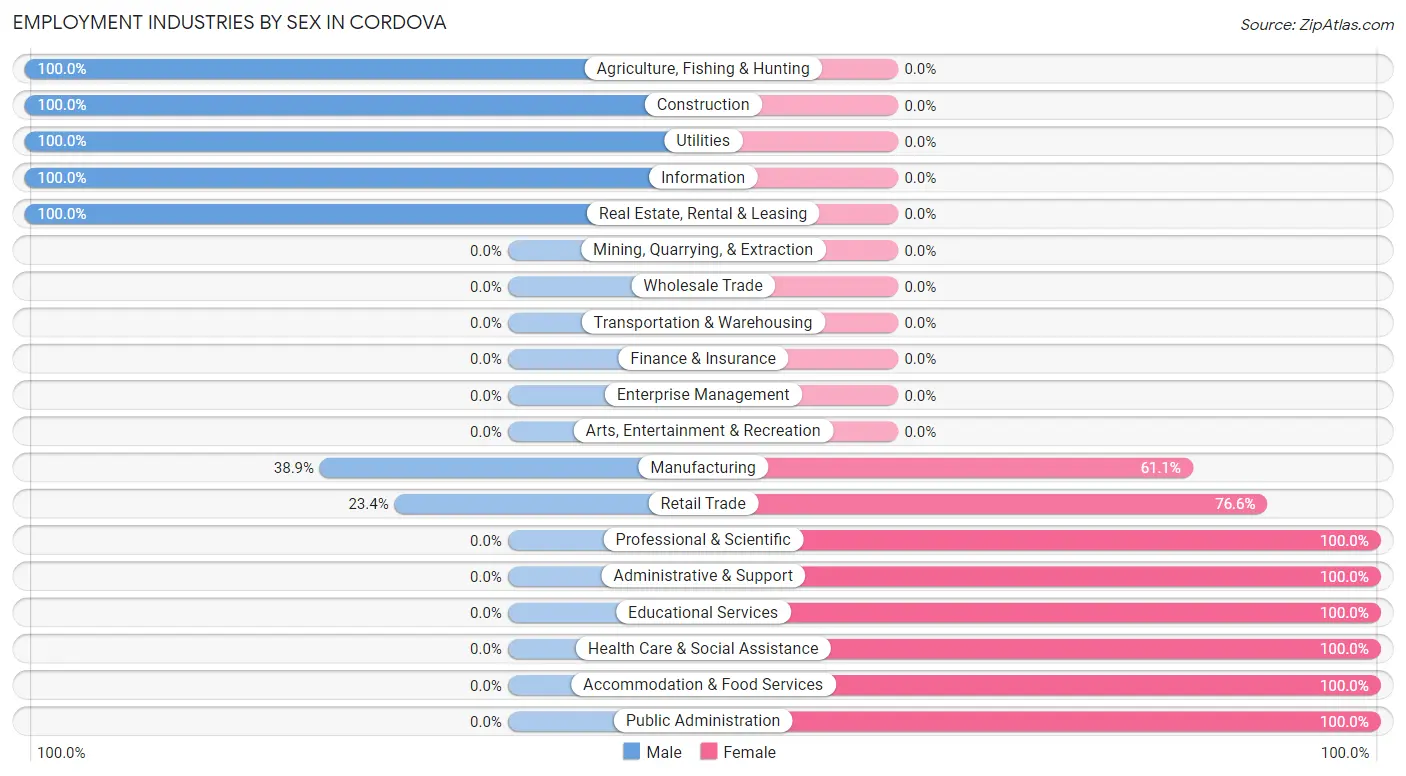
Employment Industries by Sex in Cordova
The Cordova industries that see more men than women are Agriculture, Fishing & Hunting (100.0%), Construction (100.0%), and Utilities (100.0%), whereas the industries that tend to have a higher number of women are Professional & Scientific (100.0%), Administrative & Support (100.0%), and Educational Services (100.0%).
| Industry | Male | Female |
| Agriculture, Fishing & Hunting | 25 (100.0%) | 0 (0.0%) |
| Mining, Quarrying, & Extraction | 0 (0.0%) | 0 (0.0%) |
| Construction | 25 (100.0%) | 0 (0.0%) |
| Manufacturing | 28 (38.9%) | 44 (61.1%) |
| Wholesale Trade | 0 (0.0%) | 0 (0.0%) |
| Retail Trade | 15 (23.4%) | 49 (76.6%) |
| Transportation & Warehousing | 0 (0.0%) | 0 (0.0%) |
| Utilities | 82 (100.0%) | 0 (0.0%) |
| Information | 23 (100.0%) | 0 (0.0%) |
| Finance & Insurance | 0 (0.0%) | 0 (0.0%) |
| Real Estate, Rental & Leasing | 8 (100.0%) | 0 (0.0%) |
| Professional & Scientific | 0 (0.0%) | 15 (100.0%) |
| Enterprise Management | 0 (0.0%) | 0 (0.0%) |
| Administrative & Support | 0 (0.0%) | 8 (100.0%) |
| Educational Services | 0 (0.0%) | 117 (100.0%) |
| Health Care & Social Assistance | 0 (0.0%) | 59 (100.0%) |
| Arts, Entertainment & Recreation | 0 (0.0%) | 0 (0.0%) |
| Accommodation & Food Services | 0 (0.0%) | 19 (100.0%) |
| Public Administration | 0 (0.0%) | 5 (100.0%) |
| Total | 206 (39.5%) | 316 (60.5%) |
Education in Cordova
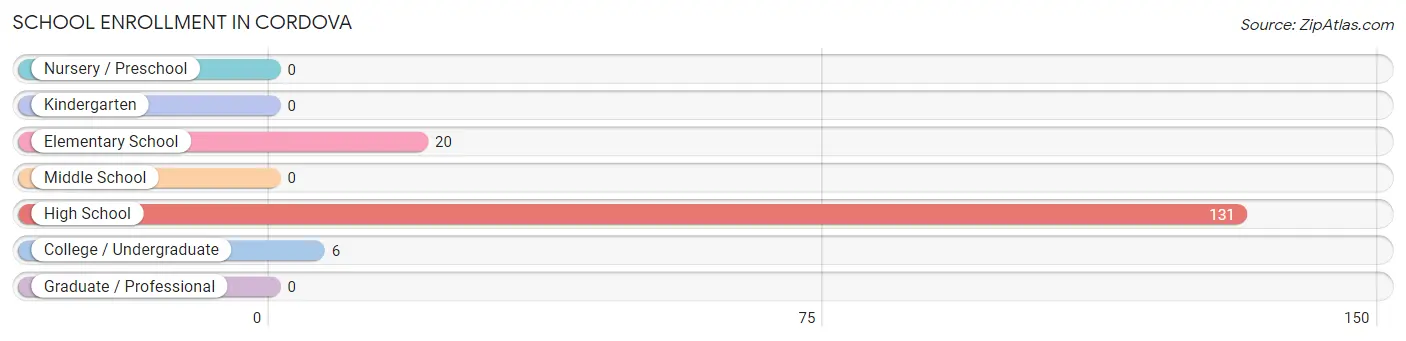
School Enrollment in Cordova
The most common levels of schooling among the 157 students in Cordova are high school (131 | 83.4%), elementary school (20 | 12.7%), and college / undergraduate (6 | 3.8%).
| School Level | # Students | % Students |
| Nursery / Preschool | 0 | 0.0% |
| Kindergarten | 0 | 0.0% |
| Elementary School | 20 | 12.7% |
| Middle School | 0 | 0.0% |
| High School | 131 | 83.4% |
| College / Undergraduate | 6 | 3.8% |
| Graduate / Professional | 0 | 0.0% |
| Total | 157 | 100.0% |
School Enrollment by Age by Funding Source in Cordova
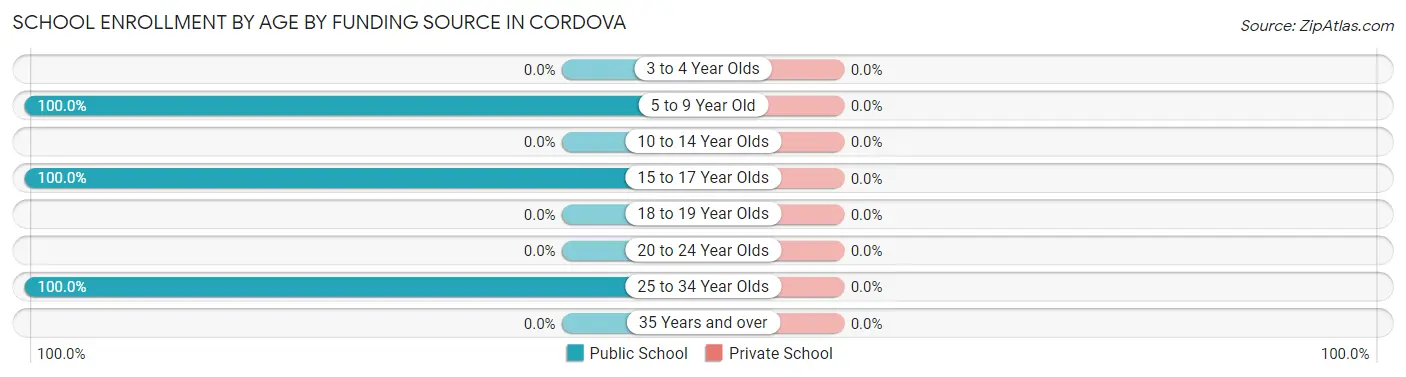
| Age Bracket | Public School | Private School |
| 3 to 4 Year Olds | 0 (0.0%) | 0 (0.0%) |
| 5 to 9 Year Old | 20 (100.0%) | 0 (0.0%) |
| 10 to 14 Year Olds | 0 (0.0%) | 0 (0.0%) |
| 15 to 17 Year Olds | 131 (100.0%) | 0 (0.0%) |
| 18 to 19 Year Olds | 0 (0.0%) | 0 (0.0%) |
| 20 to 24 Year Olds | 0 (0.0%) | 0 (0.0%) |
| 25 to 34 Year Olds | 6 (100.0%) | 0 (0.0%) |
| 35 Years and over | 0 (0.0%) | 0 (0.0%) |
| Total | 157 (100.0%) | 0 (0.0%) |
Educational Attainment by Field of Study in Cordova
Education (123 | 63.7%), visual & performing arts (49 | 25.4%), communications (11 | 5.7%), and business (10 | 5.2%) are the most common fields of study among 193 individuals in Cordova who have obtained a bachelor's degree or higher.
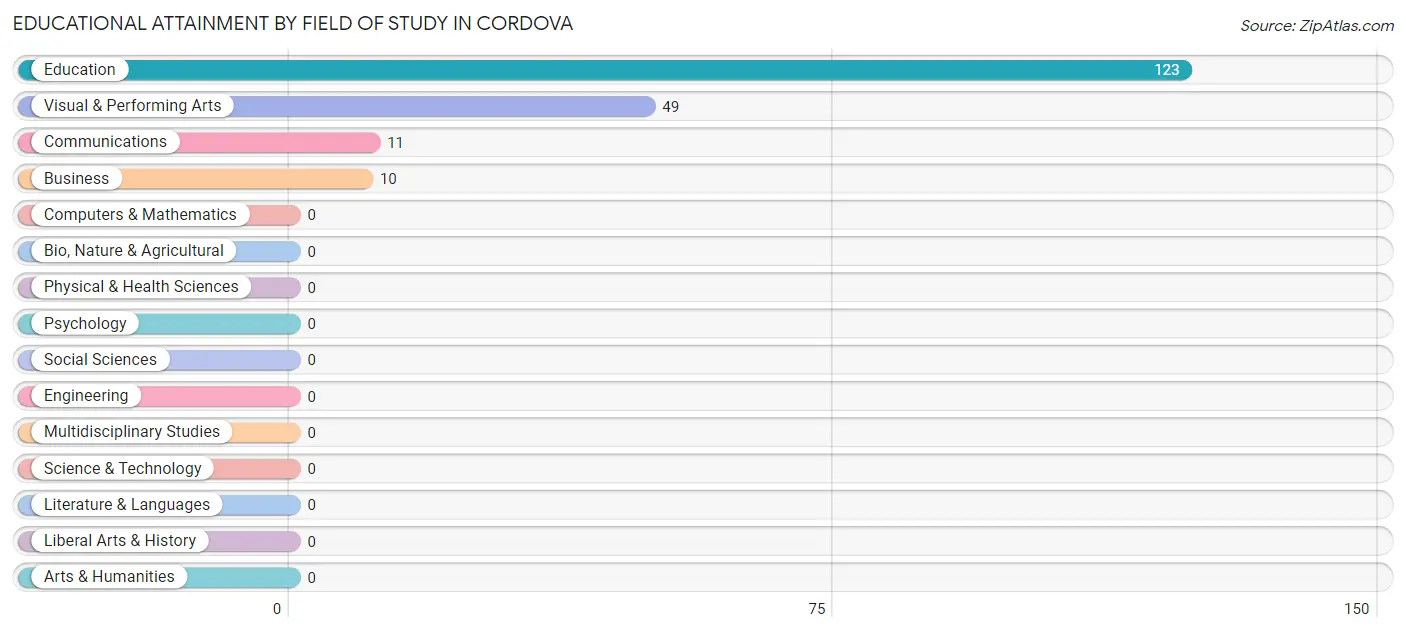
| Field of Study | # Graduates | % Graduates |
| Computers & Mathematics | 0 | 0.0% |
| Bio, Nature & Agricultural | 0 | 0.0% |
| Physical & Health Sciences | 0 | 0.0% |
| Psychology | 0 | 0.0% |
| Social Sciences | 0 | 0.0% |
| Engineering | 0 | 0.0% |
| Multidisciplinary Studies | 0 | 0.0% |
| Science & Technology | 0 | 0.0% |
| Business | 10 | 5.2% |
| Education | 123 | 63.7% |
| Literature & Languages | 0 | 0.0% |
| Liberal Arts & History | 0 | 0.0% |
| Visual & Performing Arts | 49 | 25.4% |
| Communications | 11 | 5.7% |
| Arts & Humanities | 0 | 0.0% |
| Total | 193 | 100.0% |
Transportation & Commute in Cordova
Vehicle Availability by Sex in Cordova
The most prevalent vehicle ownership categories in Cordova are males with 2 vehicles (69, accounting for 33.5%) and females with 2 vehicles (114, making up 21.8%).
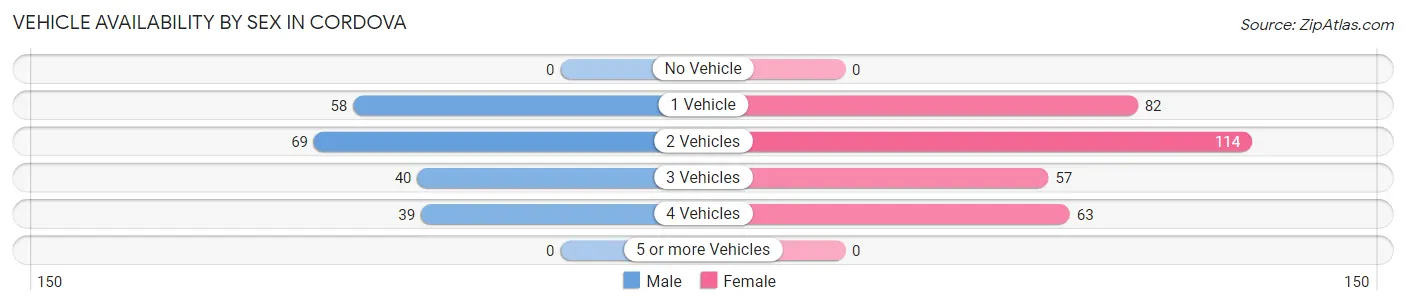
| Vehicles Available | Male | Female |
| No Vehicle | 0 (0.0%) | 0 (0.0%) |
| 1 Vehicle | 58 (28.2%) | 82 (26.0%) |
| 2 Vehicles | 69 (33.5%) | 114 (36.1%) |
| 3 Vehicles | 40 (19.4%) | 57 (18.0%) |
| 4 Vehicles | 39 (18.9%) | 63 (19.9%) |
| 5 or more Vehicles | 0 (0.0%) | 0 (0.0%) |
| Total | 206 (100.0%) | 316 (100.0%) |
Commute Time in Cordova
The most frequently occuring commute durations in Cordova are 10 to 14 minutes (117 commuters, 22.8%), 30 to 34 minutes (105 commuters, 20.4%), and 15 to 19 minutes (94 commuters, 18.3%).
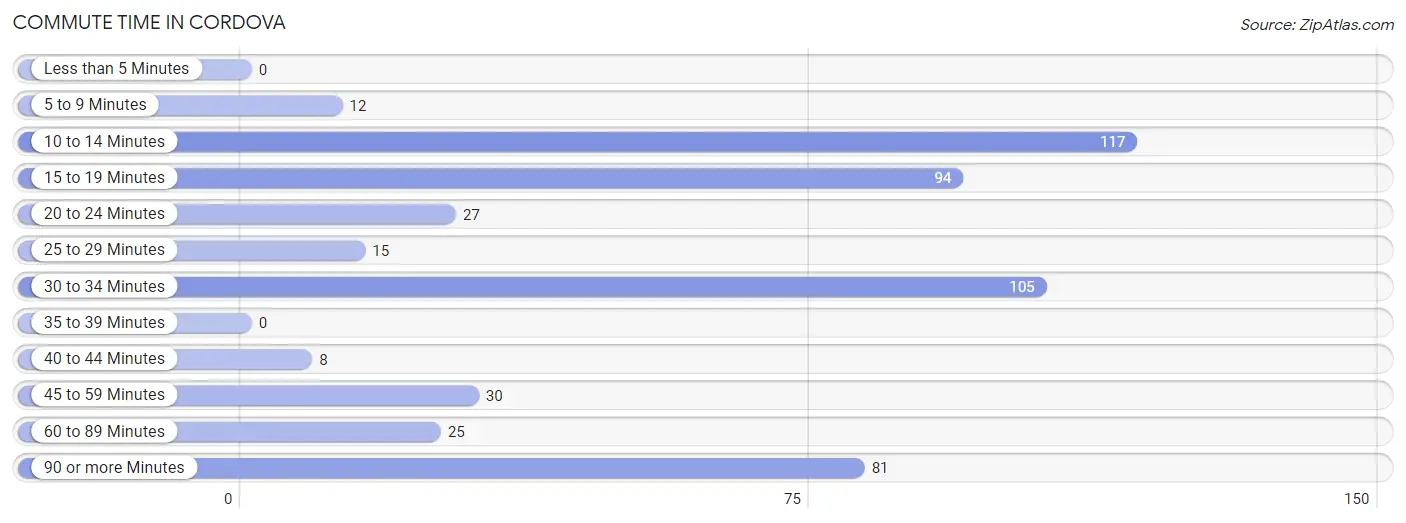
| Commute Time | # Commuters | % Commuters |
| Less than 5 Minutes | 0 | 0.0% |
| 5 to 9 Minutes | 12 | 2.3% |
| 10 to 14 Minutes | 117 | 22.8% |
| 15 to 19 Minutes | 94 | 18.3% |
| 20 to 24 Minutes | 27 | 5.2% |
| 25 to 29 Minutes | 15 | 2.9% |
| 30 to 34 Minutes | 105 | 20.4% |
| 35 to 39 Minutes | 0 | 0.0% |
| 40 to 44 Minutes | 8 | 1.6% |
| 45 to 59 Minutes | 30 | 5.8% |
| 60 to 89 Minutes | 25 | 4.9% |
| 90 or more Minutes | 81 | 15.8% |
Commute Time by Sex in Cordova
The most common commute times in Cordova are 30 to 34 minutes (63 commuters, 31.8%) for males and 10 to 14 minutes (111 commuters, 35.1%) for females.
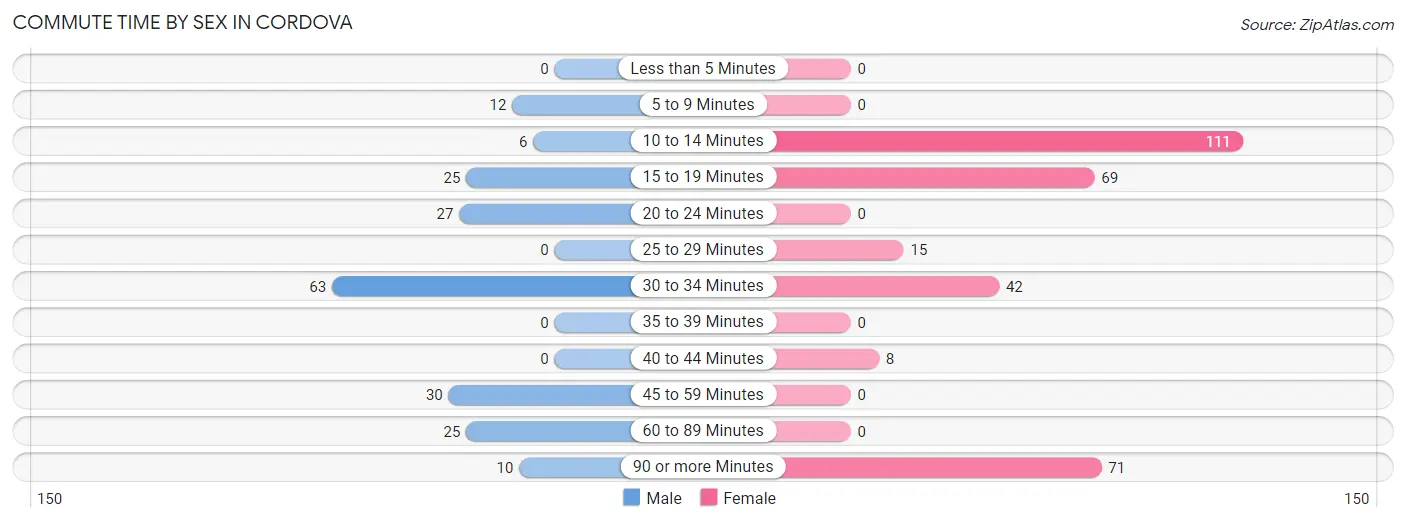
| Commute Time | Male | Female |
| Less than 5 Minutes | 0 (0.0%) | 0 (0.0%) |
| 5 to 9 Minutes | 12 (6.1%) | 0 (0.0%) |
| 10 to 14 Minutes | 6 (3.0%) | 111 (35.1%) |
| 15 to 19 Minutes | 25 (12.6%) | 69 (21.8%) |
| 20 to 24 Minutes | 27 (13.6%) | 0 (0.0%) |
| 25 to 29 Minutes | 0 (0.0%) | 15 (4.8%) |
| 30 to 34 Minutes | 63 (31.8%) | 42 (13.3%) |
| 35 to 39 Minutes | 0 (0.0%) | 0 (0.0%) |
| 40 to 44 Minutes | 0 (0.0%) | 8 (2.5%) |
| 45 to 59 Minutes | 30 (15.1%) | 0 (0.0%) |
| 60 to 89 Minutes | 25 (12.6%) | 0 (0.0%) |
| 90 or more Minutes | 10 (5.1%) | 71 (22.5%) |
Time of Departure to Work by Sex in Cordova
The most frequent times of departure to work in Cordova are 6:30 AM to 6:59 AM (64, 32.3%) for males and 7:00 AM to 7:29 AM (147, 46.5%) for females.
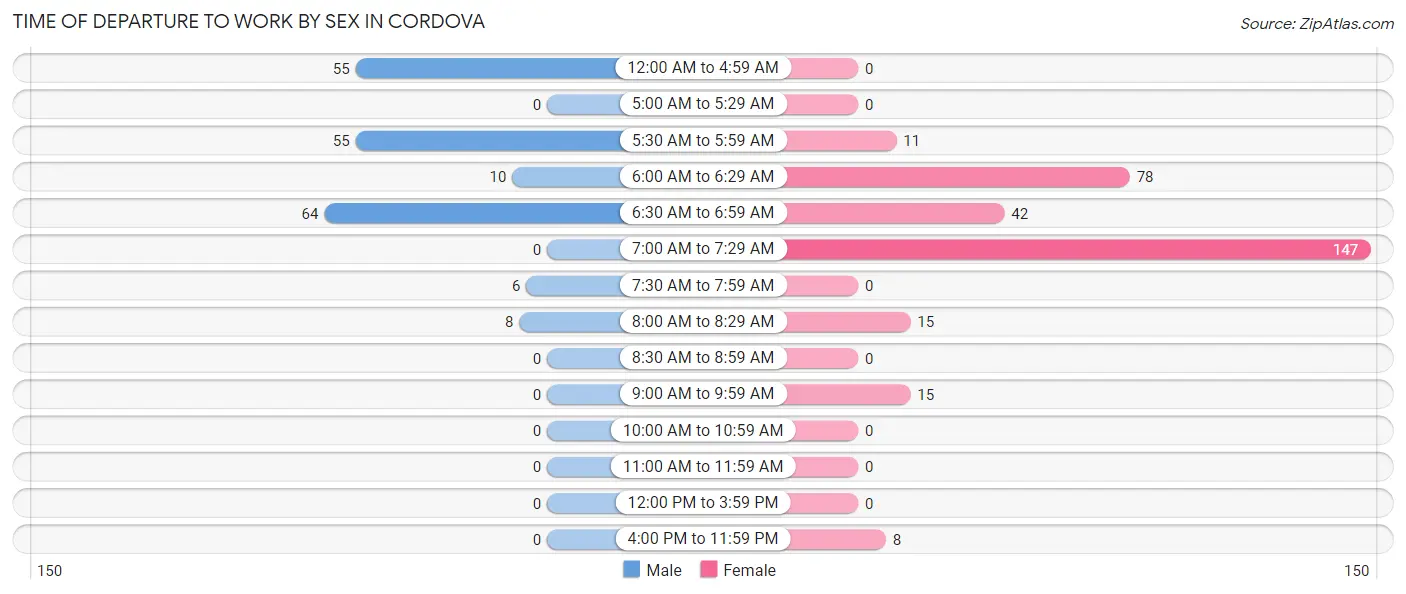
| Time of Departure | Male | Female |
| 12:00 AM to 4:59 AM | 55 (27.8%) | 0 (0.0%) |
| 5:00 AM to 5:29 AM | 0 (0.0%) | 0 (0.0%) |
| 5:30 AM to 5:59 AM | 55 (27.8%) | 11 (3.5%) |
| 6:00 AM to 6:29 AM | 10 (5.1%) | 78 (24.7%) |
| 6:30 AM to 6:59 AM | 64 (32.3%) | 42 (13.3%) |
| 7:00 AM to 7:29 AM | 0 (0.0%) | 147 (46.5%) |
| 7:30 AM to 7:59 AM | 6 (3.0%) | 0 (0.0%) |
| 8:00 AM to 8:29 AM | 8 (4.0%) | 15 (4.8%) |
| 8:30 AM to 8:59 AM | 0 (0.0%) | 0 (0.0%) |
| 9:00 AM to 9:59 AM | 0 (0.0%) | 15 (4.8%) |
| 10:00 AM to 10:59 AM | 0 (0.0%) | 0 (0.0%) |
| 11:00 AM to 11:59 AM | 0 (0.0%) | 0 (0.0%) |
| 12:00 PM to 3:59 PM | 0 (0.0%) | 0 (0.0%) |
| 4:00 PM to 11:59 PM | 0 (0.0%) | 8 (2.5%) |
| Total | 198 (100.0%) | 316 (100.0%) |
Housing Occupancy in Cordova
Occupancy by Ownership in Cordova
Of the total 527 dwellings in Cordova, owner-occupied units account for 418 (79.3%), while renter-occupied units make up 109 (20.7%).
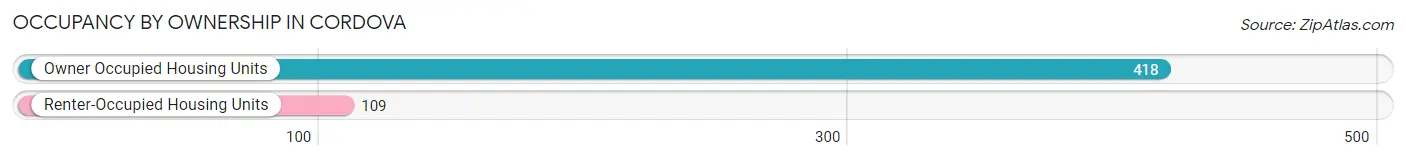
| Occupancy | # Housing Units | % Housing Units |
| Owner Occupied Housing Units | 418 | 79.3% |
| Renter-Occupied Housing Units | 109 | 20.7% |
| Total Occupied Housing Units | 527 | 100.0% |
Occupancy by Household Size in Cordova
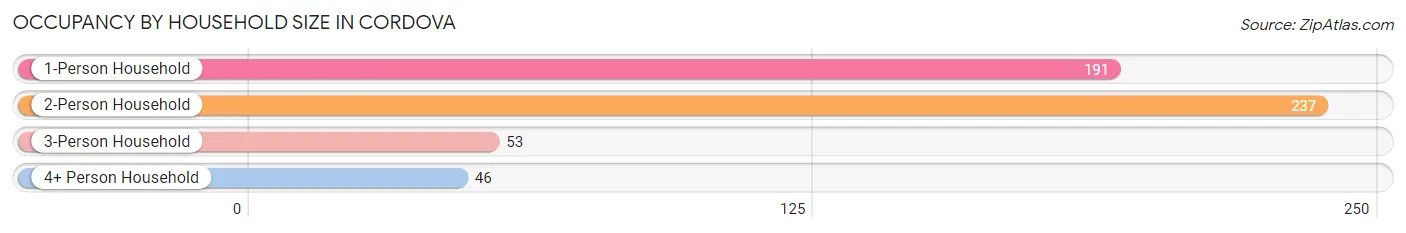
| Household Size | # Housing Units | % Housing Units |
| 1-Person Household | 191 | 36.2% |
| 2-Person Household | 237 | 45.0% |
| 3-Person Household | 53 | 10.1% |
| 4+ Person Household | 46 | 8.7% |
| Total Housing Units | 527 | 100.0% |
Occupancy by Ownership by Household Size in Cordova
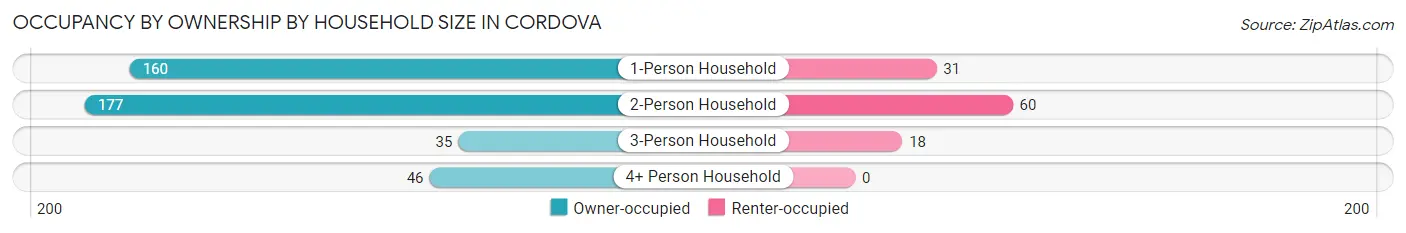
| Household Size | Owner-occupied | Renter-occupied |
| 1-Person Household | 160 (83.8%) | 31 (16.2%) |
| 2-Person Household | 177 (74.7%) | 60 (25.3%) |
| 3-Person Household | 35 (66.0%) | 18 (34.0%) |
| 4+ Person Household | 46 (100.0%) | 0 (0.0%) |
| Total Housing Units | 418 (79.3%) | 109 (20.7%) |
Occupancy by Educational Attainment in Cordova
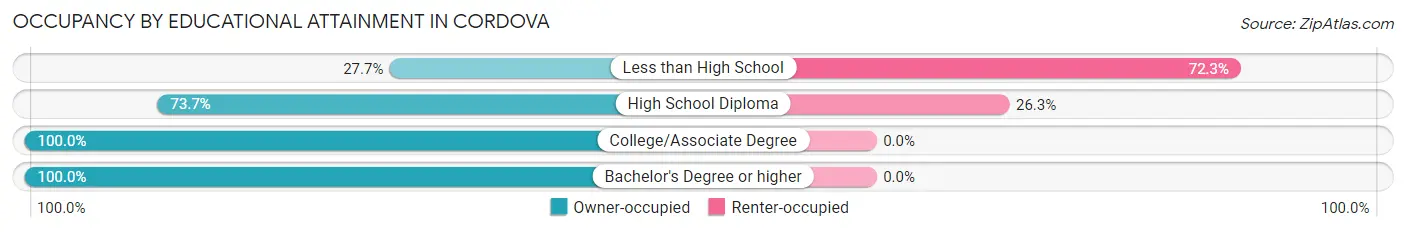
| Household Size | Owner-occupied | Renter-occupied |
| Less than High School | 23 (27.7%) | 60 (72.3%) |
| High School Diploma | 137 (73.7%) | 49 (26.3%) |
| College/Associate Degree | 109 (100.0%) | 0 (0.0%) |
| Bachelor's Degree or higher | 149 (100.0%) | 0 (0.0%) |
Occupancy by Age of Householder in Cordova
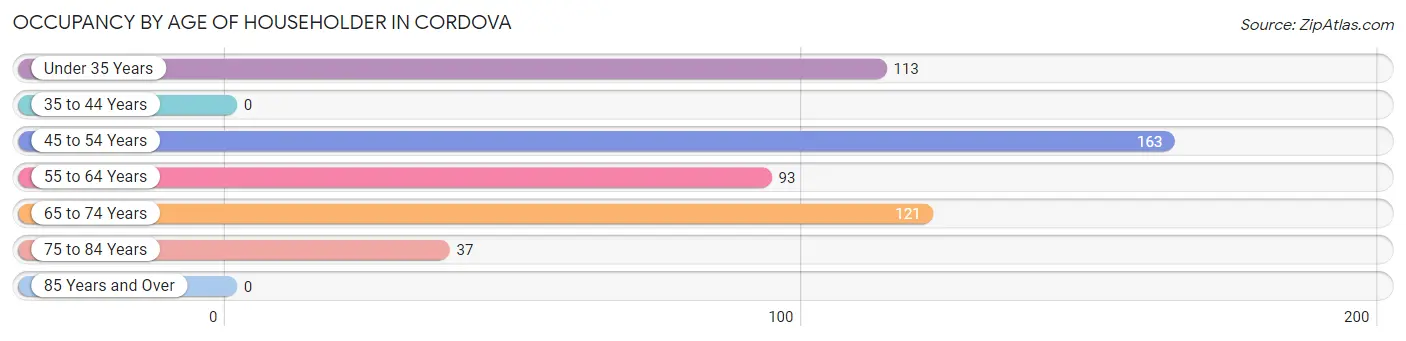
| Age Bracket | # Households | % Households |
| Under 35 Years | 113 | 21.4% |
| 35 to 44 Years | 0 | 0.0% |
| 45 to 54 Years | 163 | 30.9% |
| 55 to 64 Years | 93 | 17.6% |
| 65 to 74 Years | 121 | 23.0% |
| 75 to 84 Years | 37 | 7.0% |
| 85 Years and Over | 0 | 0.0% |
| Total | 527 | 100.0% |
Housing Finances in Cordova
Median Income by Occupancy in Cordova
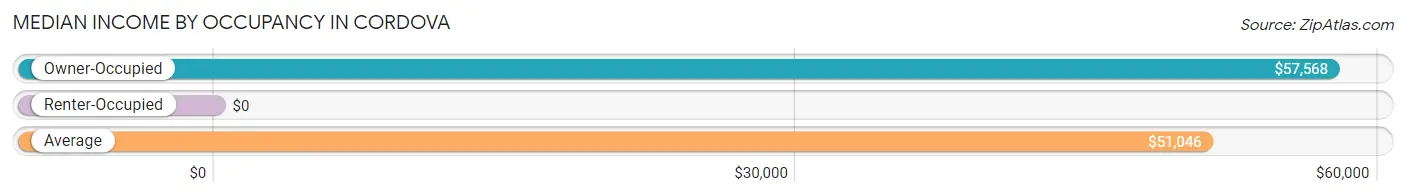
| Occupancy Type | # Households | Median Income |
| Owner-Occupied | 418 (79.3%) | $57,568 |
| Renter-Occupied | 109 (20.7%) | $0 |
| Average | 527 (100.0%) | $51,046 |
Occupancy by Householder Income Bracket in Cordova
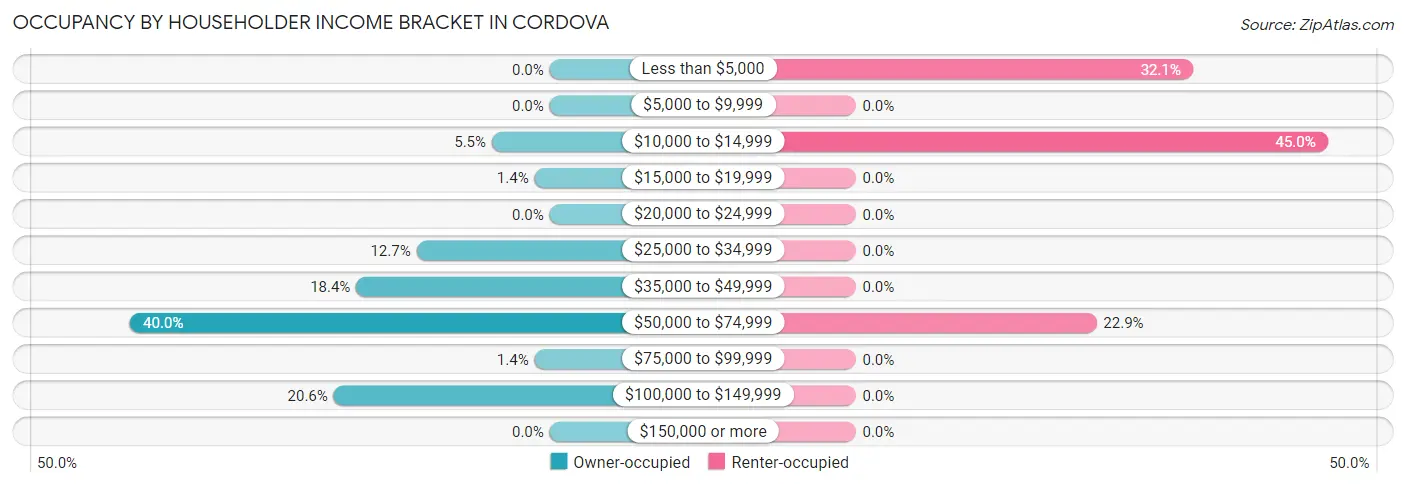
| Income Bracket | Owner-occupied | Renter-occupied |
| Less than $5,000 | 0 (0.0%) | 35 (32.1%) |
| $5,000 to $9,999 | 0 (0.0%) | 0 (0.0%) |
| $10,000 to $14,999 | 23 (5.5%) | 49 (45.0%) |
| $15,000 to $19,999 | 6 (1.4%) | 0 (0.0%) |
| $20,000 to $24,999 | 0 (0.0%) | 0 (0.0%) |
| $25,000 to $34,999 | 53 (12.7%) | 0 (0.0%) |
| $35,000 to $49,999 | 77 (18.4%) | 0 (0.0%) |
| $50,000 to $74,999 | 167 (40.0%) | 25 (22.9%) |
| $75,000 to $99,999 | 6 (1.4%) | 0 (0.0%) |
| $100,000 to $149,999 | 86 (20.6%) | 0 (0.0%) |
| $150,000 or more | 0 (0.0%) | 0 (0.0%) |
| Total | 418 (100.0%) | 109 (100.0%) |
Monthly Housing Cost Tiers in Cordova
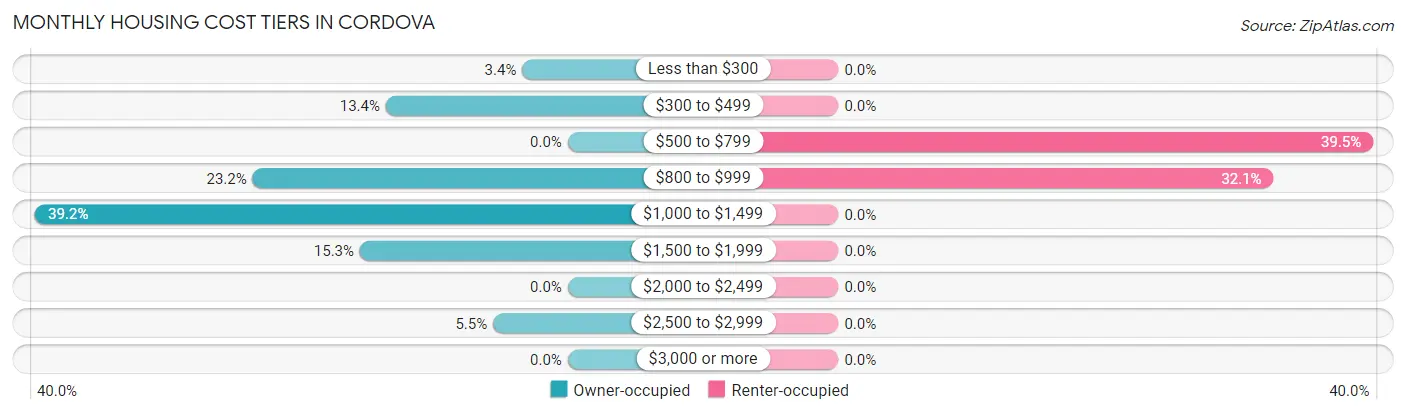
| Monthly Cost | Owner-occupied | Renter-occupied |
| Less than $300 | 14 (3.4%) | 0 (0.0%) |
| $300 to $499 | 56 (13.4%) | 0 (0.0%) |
| $500 to $799 | 0 (0.0%) | 43 (39.5%) |
| $800 to $999 | 97 (23.2%) | 35 (32.1%) |
| $1,000 to $1,499 | 164 (39.2%) | 0 (0.0%) |
| $1,500 to $1,999 | 64 (15.3%) | 0 (0.0%) |
| $2,000 to $2,499 | 0 (0.0%) | 0 (0.0%) |
| $2,500 to $2,999 | 23 (5.5%) | 0 (0.0%) |
| $3,000 or more | 0 (0.0%) | 0 (0.0%) |
| Total | 418 (100.0%) | 109 (100.0%) |
Physical Housing Characteristics in Cordova
Housing Structures in Cordova
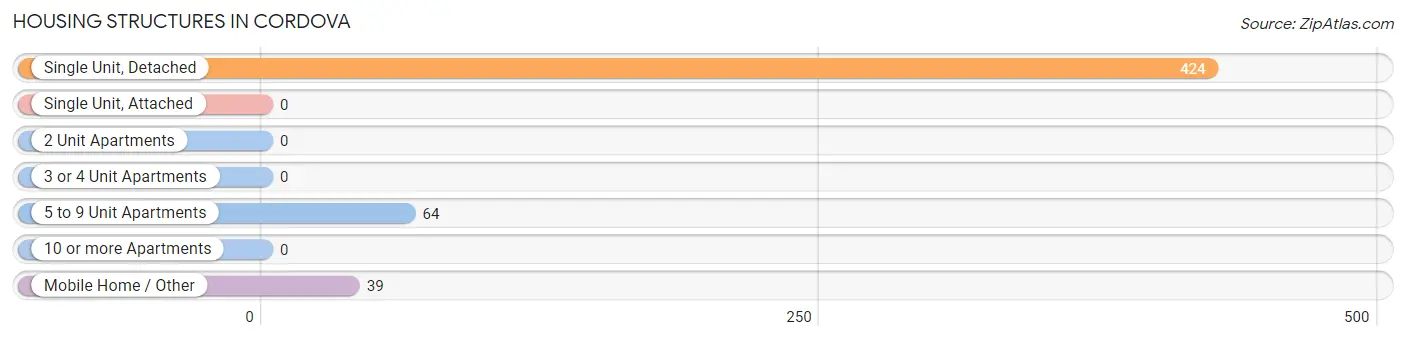
| Structure Type | # Housing Units | % Housing Units |
| Single Unit, Detached | 424 | 80.5% |
| Single Unit, Attached | 0 | 0.0% |
| 2 Unit Apartments | 0 | 0.0% |
| 3 or 4 Unit Apartments | 0 | 0.0% |
| 5 to 9 Unit Apartments | 64 | 12.1% |
| 10 or more Apartments | 0 | 0.0% |
| Mobile Home / Other | 39 | 7.4% |
| Total | 527 | 100.0% |
Housing Structures by Occupancy in Cordova
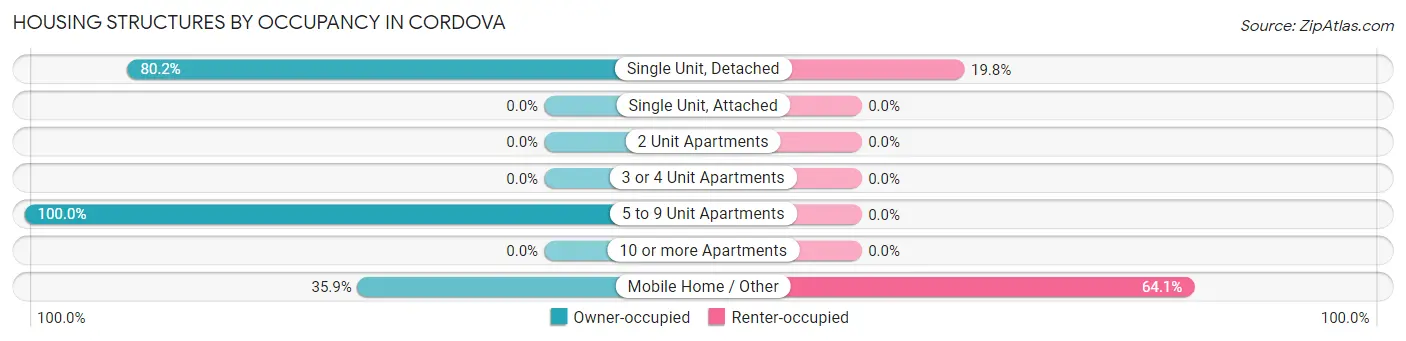
| Structure Type | Owner-occupied | Renter-occupied |
| Single Unit, Detached | 340 (80.2%) | 84 (19.8%) |
| Single Unit, Attached | 0 (0.0%) | 0 (0.0%) |
| 2 Unit Apartments | 0 (0.0%) | 0 (0.0%) |
| 3 or 4 Unit Apartments | 0 (0.0%) | 0 (0.0%) |
| 5 to 9 Unit Apartments | 64 (100.0%) | 0 (0.0%) |
| 10 or more Apartments | 0 (0.0%) | 0 (0.0%) |
| Mobile Home / Other | 14 (35.9%) | 25 (64.1%) |
| Total | 418 (79.3%) | 109 (20.7%) |
Housing Structures by Number of Rooms in Cordova
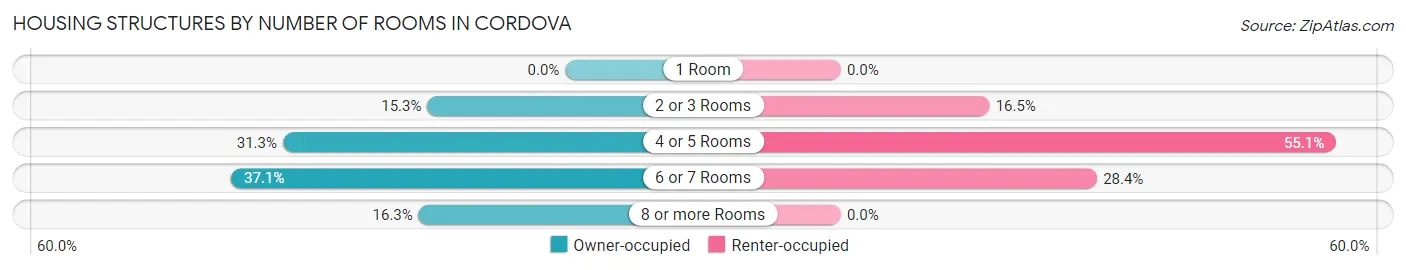
| Number of Rooms | Owner-occupied | Renter-occupied |
| 1 Room | 0 (0.0%) | 0 (0.0%) |
| 2 or 3 Rooms | 64 (15.3%) | 18 (16.5%) |
| 4 or 5 Rooms | 131 (31.3%) | 60 (55.0%) |
| 6 or 7 Rooms | 155 (37.1%) | 31 (28.4%) |
| 8 or more Rooms | 68 (16.3%) | 0 (0.0%) |
| Total | 418 (100.0%) | 109 (100.0%) |
Housing Structure by Heating Type in Cordova
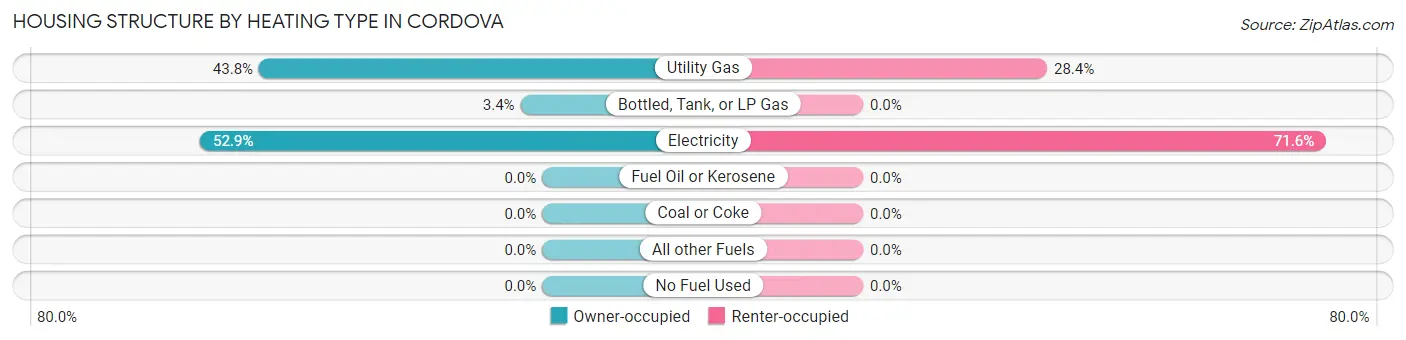
| Heating Type | Owner-occupied | Renter-occupied |
| Utility Gas | 183 (43.8%) | 31 (28.4%) |
| Bottled, Tank, or LP Gas | 14 (3.4%) | 0 (0.0%) |
| Electricity | 221 (52.9%) | 78 (71.6%) |
| Fuel Oil or Kerosene | 0 (0.0%) | 0 (0.0%) |
| Coal or Coke | 0 (0.0%) | 0 (0.0%) |
| All other Fuels | 0 (0.0%) | 0 (0.0%) |
| No Fuel Used | 0 (0.0%) | 0 (0.0%) |
| Total | 418 (100.0%) | 109 (100.0%) |
Household Vehicle Usage in Cordova
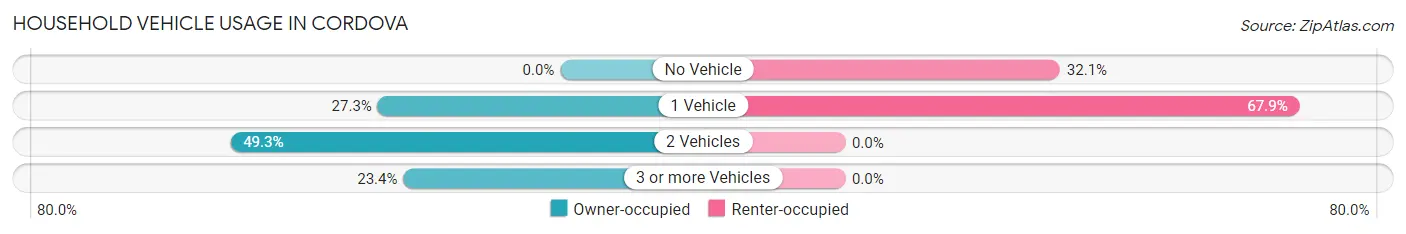
| Vehicles per Household | Owner-occupied | Renter-occupied |
| No Vehicle | 0 (0.0%) | 35 (32.1%) |
| 1 Vehicle | 114 (27.3%) | 74 (67.9%) |
| 2 Vehicles | 206 (49.3%) | 0 (0.0%) |
| 3 or more Vehicles | 98 (23.4%) | 0 (0.0%) |
| Total | 418 (100.0%) | 109 (100.0%) |
Real Estate & Mortgages in Cordova
Real Estate and Mortgage Overview in Cordova
| Characteristic | Without Mortgage | With Mortgage |
| Housing Units | 70 | 348 |
| Median Property Value | $114,200 | $136,100 |
| Median Household Income | $58,378 | $0 |
| Monthly Housing Costs | $328 | $0 |
| Real Estate Taxes | $1,176 | $0 |
Property Value by Mortgage Status in Cordova
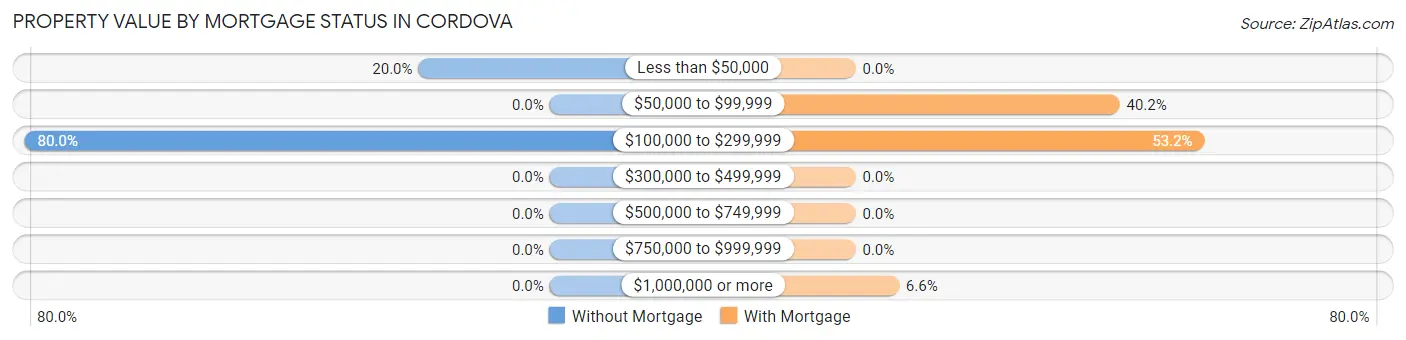
| Property Value | Without Mortgage | With Mortgage |
| Less than $50,000 | 14 (20.0%) | 0 (0.0%) |
| $50,000 to $99,999 | 0 (0.0%) | 140 (40.2%) |
| $100,000 to $299,999 | 56 (80.0%) | 185 (53.2%) |
| $300,000 to $499,999 | 0 (0.0%) | 0 (0.0%) |
| $500,000 to $749,999 | 0 (0.0%) | 0 (0.0%) |
| $750,000 to $999,999 | 0 (0.0%) | 0 (0.0%) |
| $1,000,000 or more | 0 (0.0%) | 23 (6.6%) |
| Total | 70 (100.0%) | 348 (100.0%) |
Household Income by Mortgage Status in Cordova
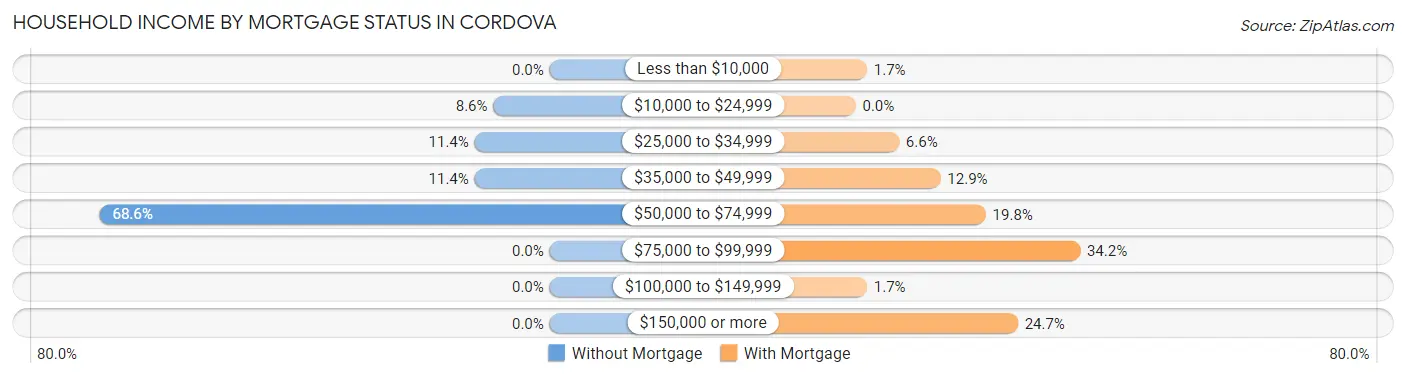
| Household Income | Without Mortgage | With Mortgage |
| Less than $10,000 | 0 (0.0%) | 6 (1.7%) |
| $10,000 to $24,999 | 6 (8.6%) | 0 (0.0%) |
| $25,000 to $34,999 | 8 (11.4%) | 23 (6.6%) |
| $35,000 to $49,999 | 8 (11.4%) | 45 (12.9%) |
| $50,000 to $74,999 | 48 (68.6%) | 69 (19.8%) |
| $75,000 to $99,999 | 0 (0.0%) | 119 (34.2%) |
| $100,000 to $149,999 | 0 (0.0%) | 6 (1.7%) |
| $150,000 or more | 0 (0.0%) | 86 (24.7%) |
| Total | 70 (100.0%) | 348 (100.0%) |
Property Value to Household Income Ratio in Cordova
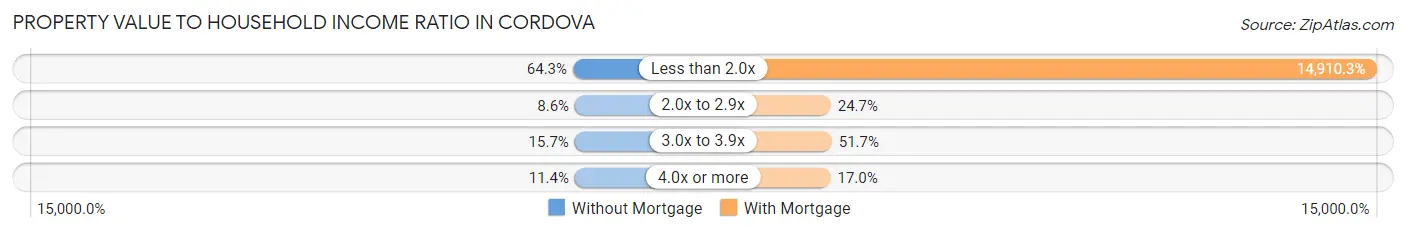
| Value-to-Income Ratio | Without Mortgage | With Mortgage |
| Less than 2.0x | 45 (64.3%) | 51,888 (14,910.3%) |
| 2.0x to 2.9x | 6 (8.6%) | 86 (24.7%) |
| 3.0x to 3.9x | 11 (15.7%) | 180 (51.7%) |
| 4.0x or more | 8 (11.4%) | 59 (17.0%) |
| Total | 70 (100.0%) | 348 (100.0%) |
Real Estate Taxes by Mortgage Status in Cordova
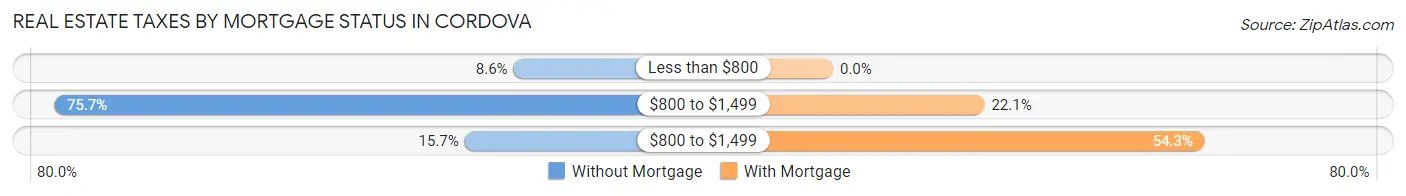
| Property Taxes | Without Mortgage | With Mortgage |
| Less than $800 | 6 (8.6%) | 0 (0.0%) |
| $800 to $1,499 | 53 (75.7%) | 77 (22.1%) |
| $800 to $1,499 | 11 (15.7%) | 189 (54.3%) |
| Total | 70 (100.0%) | 348 (100.0%) |
Health & Disability in Cordova
Health Insurance Coverage by Age in Cordova
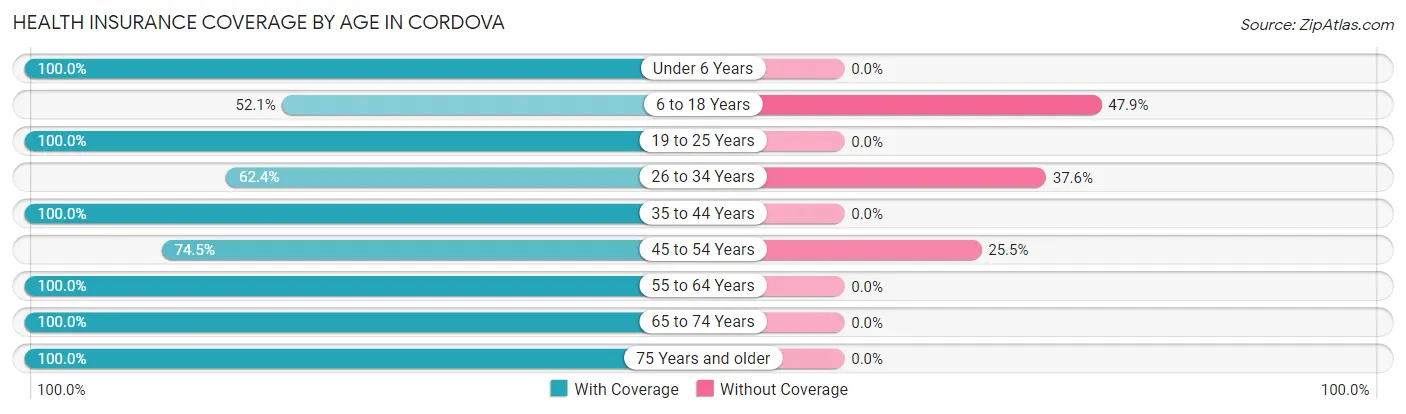
| Age Bracket | With Coverage | Without Coverage |
| Under 6 Years | 57 (100.0%) | 0 (0.0%) |
| 6 to 18 Years | 151 (52.1%) | 139 (47.9%) |
| 19 to 25 Years | 44 (100.0%) | 0 (0.0%) |
| 26 to 34 Years | 118 (62.4%) | 71 (37.6%) |
| 35 to 44 Years | 33 (100.0%) | 0 (0.0%) |
| 45 to 54 Years | 242 (74.5%) | 83 (25.5%) |
| 55 to 64 Years | 187 (100.0%) | 0 (0.0%) |
| 65 to 74 Years | 158 (100.0%) | 0 (0.0%) |
| 75 Years and older | 37 (100.0%) | 0 (0.0%) |
| Total | 1,027 (77.8%) | 293 (22.2%) |
Health Insurance Coverage by Citizenship Status in Cordova
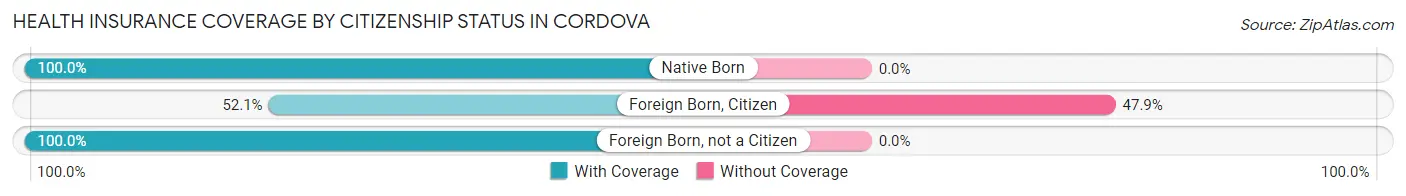
| Citizenship Status | With Coverage | Without Coverage |
| Native Born | 57 (100.0%) | 0 (0.0%) |
| Foreign Born, Citizen | 151 (52.1%) | 139 (47.9%) |
| Foreign Born, not a Citizen | 44 (100.0%) | 0 (0.0%) |
Health Insurance Coverage by Household Income in Cordova
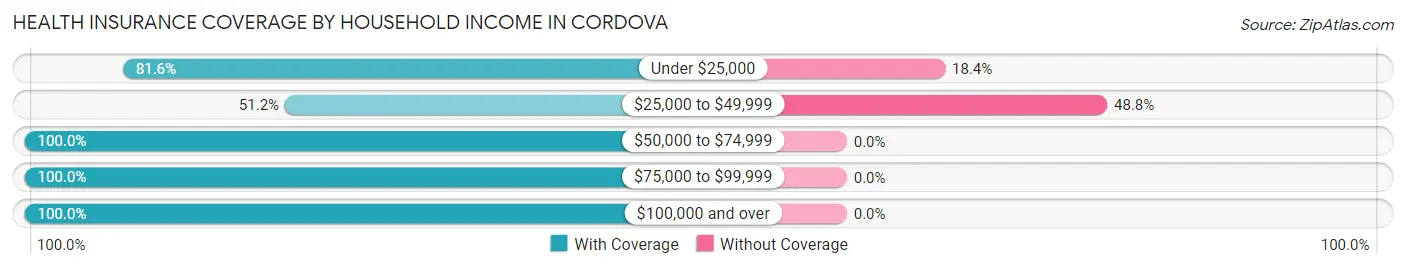
| Household Income | With Coverage | Without Coverage |
| Under $25,000 | 155 (81.6%) | 35 (18.4%) |
| $25,000 to $49,999 | 271 (51.2%) | 258 (48.8%) |
| $50,000 to $74,999 | 298 (100.0%) | 0 (0.0%) |
| $75,000 to $99,999 | 13 (100.0%) | 0 (0.0%) |
| $100,000 and over | 290 (100.0%) | 0 (0.0%) |
Public vs Private Health Insurance Coverage by Age in Cordova
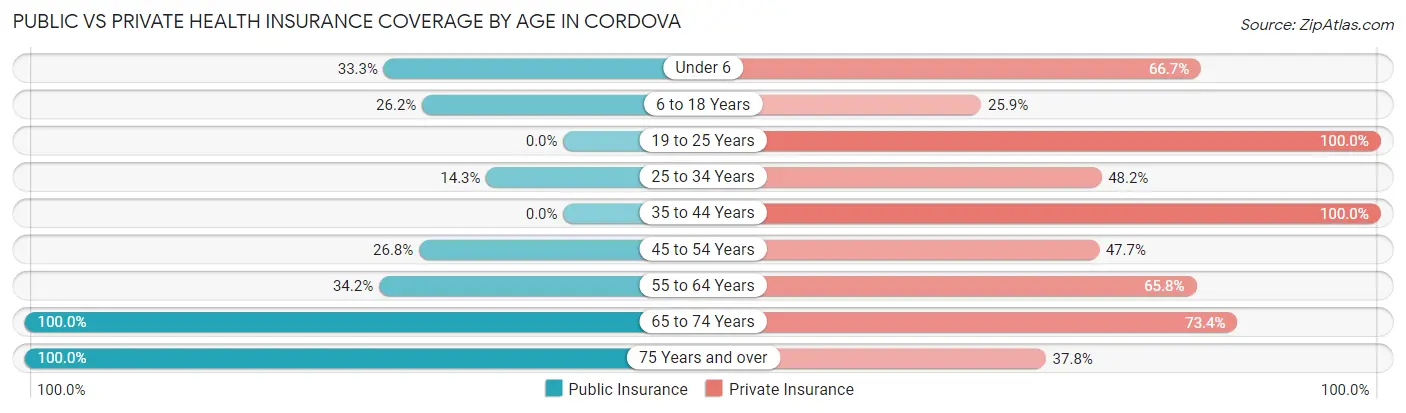
| Age Bracket | Public Insurance | Private Insurance |
| Under 6 | 19 (33.3%) | 38 (66.7%) |
| 6 to 18 Years | 76 (26.2%) | 75 (25.9%) |
| 19 to 25 Years | 0 (0.0%) | 44 (100.0%) |
| 25 to 34 Years | 27 (14.3%) | 91 (48.1%) |
| 35 to 44 Years | 0 (0.0%) | 33 (100.0%) |
| 45 to 54 Years | 87 (26.8%) | 155 (47.7%) |
| 55 to 64 Years | 64 (34.2%) | 123 (65.8%) |
| 65 to 74 Years | 158 (100.0%) | 116 (73.4%) |
| 75 Years and over | 37 (100.0%) | 14 (37.8%) |
| Total | 468 (35.4%) | 689 (52.2%) |
Disability Status by Sex by Age in Cordova
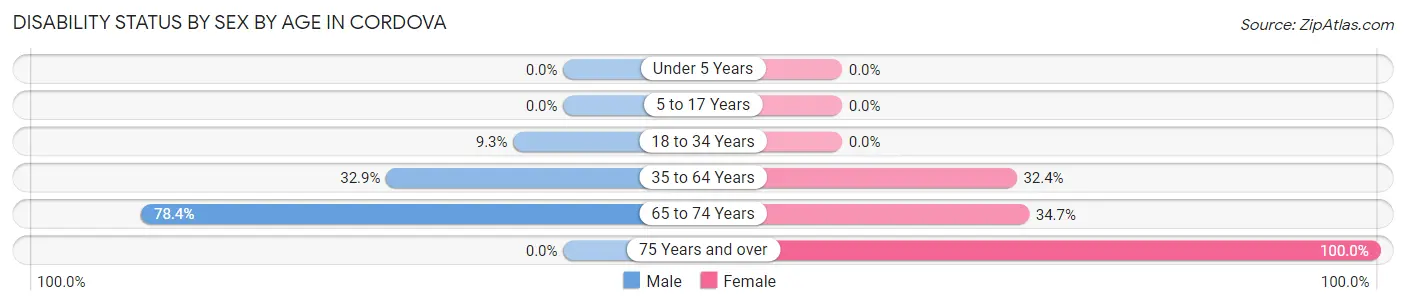
| Age Bracket | Male | Female |
| Under 5 Years | 0 (0.0%) | 0 (0.0%) |
| 5 to 17 Years | 0 (0.0%) | 0 (0.0%) |
| 18 to 34 Years | 27 (9.3%) | 0 (0.0%) |
| 35 to 64 Years | 95 (32.9%) | 83 (32.4%) |
| 65 to 74 Years | 29 (78.4%) | 42 (34.7%) |
| 75 Years and over | 0 (0.0%) | 14 (100.0%) |
Disability Class by Sex by Age in Cordova
Disability Class: Hearing Difficulty
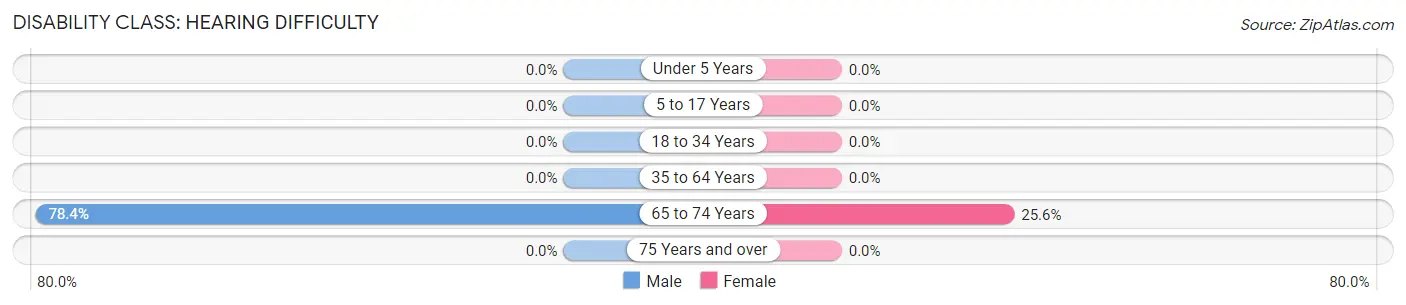
| Age Bracket | Male | Female |
| Under 5 Years | 0 (0.0%) | 0 (0.0%) |
| 5 to 17 Years | 0 (0.0%) | 0 (0.0%) |
| 18 to 34 Years | 0 (0.0%) | 0 (0.0%) |
| 35 to 64 Years | 0 (0.0%) | 0 (0.0%) |
| 65 to 74 Years | 29 (78.4%) | 31 (25.6%) |
| 75 Years and over | 0 (0.0%) | 0 (0.0%) |
Disability Class: Vision Difficulty
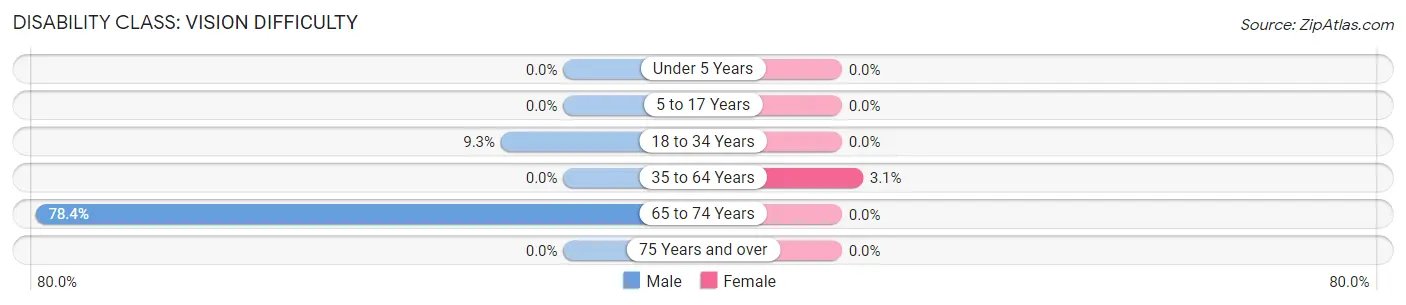
| Age Bracket | Male | Female |
| Under 5 Years | 0 (0.0%) | 0 (0.0%) |
| 5 to 17 Years | 0 (0.0%) | 0 (0.0%) |
| 18 to 34 Years | 27 (9.3%) | 0 (0.0%) |
| 35 to 64 Years | 0 (0.0%) | 8 (3.1%) |
| 65 to 74 Years | 29 (78.4%) | 0 (0.0%) |
| 75 Years and over | 0 (0.0%) | 0 (0.0%) |
Disability Class: Cognitive Difficulty
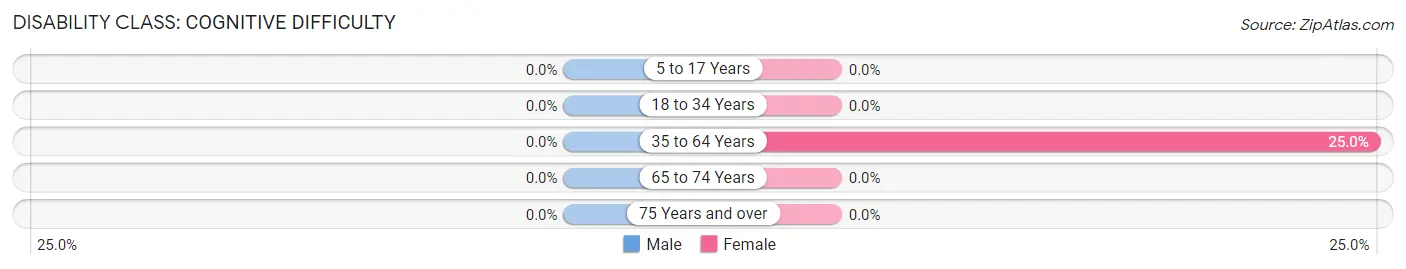
| Age Bracket | Male | Female |
| 5 to 17 Years | 0 (0.0%) | 0 (0.0%) |
| 18 to 34 Years | 0 (0.0%) | 0 (0.0%) |
| 35 to 64 Years | 0 (0.0%) | 64 (25.0%) |
| 65 to 74 Years | 0 (0.0%) | 0 (0.0%) |
| 75 Years and over | 0 (0.0%) | 0 (0.0%) |
Disability Class: Ambulatory Difficulty
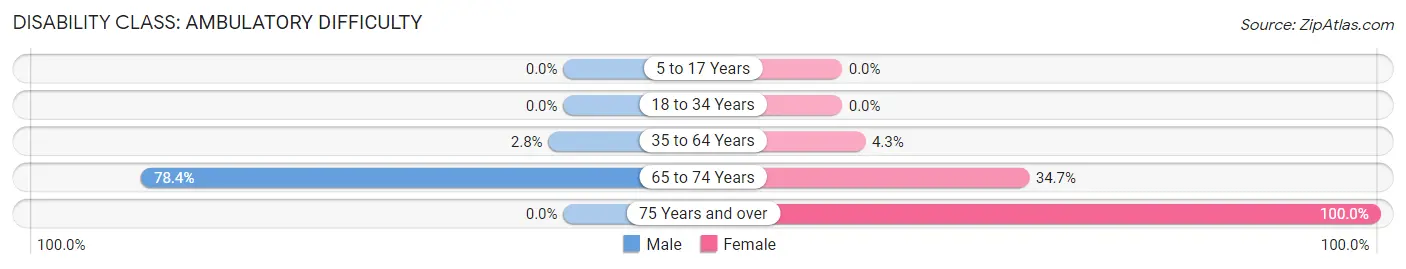
| Age Bracket | Male | Female |
| 5 to 17 Years | 0 (0.0%) | 0 (0.0%) |
| 18 to 34 Years | 0 (0.0%) | 0 (0.0%) |
| 35 to 64 Years | 8 (2.8%) | 11 (4.3%) |
| 65 to 74 Years | 29 (78.4%) | 42 (34.7%) |
| 75 Years and over | 0 (0.0%) | 14 (100.0%) |
Disability Class: Self-Care Difficulty
| Age Bracket | Male | Female |
| 5 to 17 Years | 0 (0.0%) | 0 (0.0%) |
| 18 to 34 Years | 0 (0.0%) | 0 (0.0%) |
| 35 to 64 Years | 0 (0.0%) | 0 (0.0%) |
| 65 to 74 Years | 0 (0.0%) | 0 (0.0%) |
| 75 Years and over | 0 (0.0%) | 0 (0.0%) |
Technology Access in Cordova
Computing Device Access in Cordova
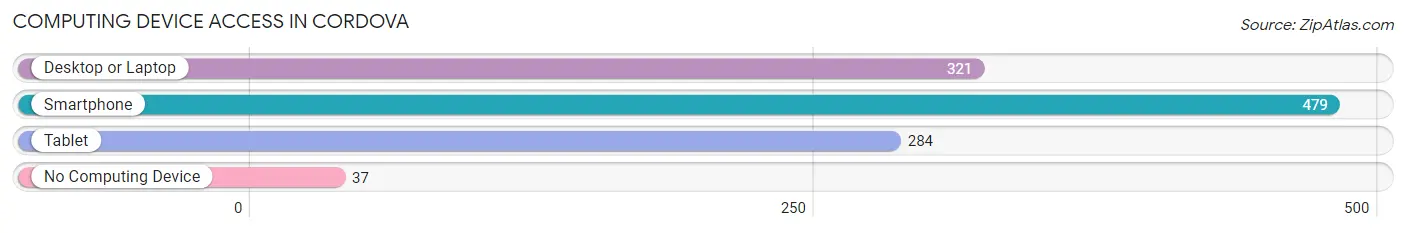
| Device Type | # Households | % Households |
| Desktop or Laptop | 321 | 60.9% |
| Smartphone | 479 | 90.9% |
| Tablet | 284 | 53.9% |
| No Computing Device | 37 | 7.0% |
| Total | 527 | 100.0% |
Internet Access in Cordova
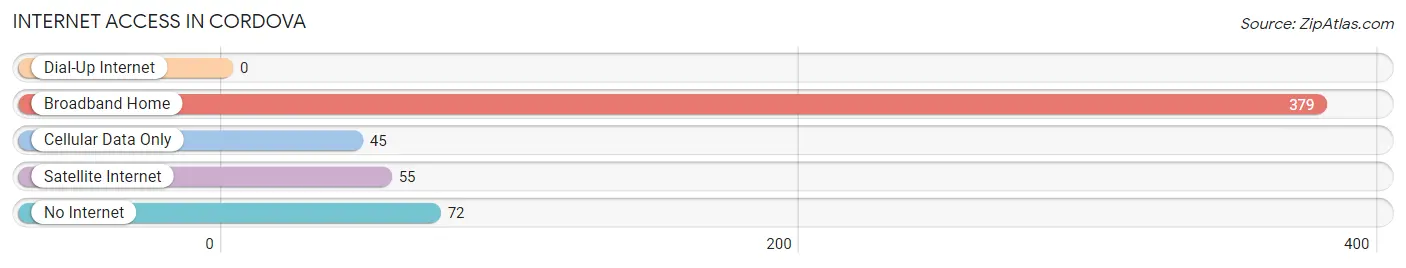
| Internet Type | # Households | % Households |
| Dial-Up Internet | 0 | 0.0% |
| Broadband Home | 379 | 71.9% |
| Cellular Data Only | 45 | 8.5% |
| Satellite Internet | 55 | 10.4% |
| No Internet | 72 | 13.7% |
| Total | 527 | 100.0% |
Cordova Summary
Cordova is a small town located in North Carolina, United States. It is situated in the eastern part of the state, in the county of Richmond. The town has a population of approximately 1,500 people, and is part of the Fayetteville metropolitan area.
Geography
Cordova is located in the eastern part of North Carolina, in the county of Richmond. It is situated on the banks of the Cape Fear River, and is surrounded by the towns of Lumberton, Fayetteville, and Laurinburg. The town is located at an elevation of approximately 200 feet above sea level. The climate in Cordova is humid subtropical, with hot summers and mild winters.
Economy
The economy of Cordova is largely based on agriculture and manufacturing. The town is home to several small businesses, including a lumber mill, a furniture factory, and a textile mill. The town also has a number of retail stores, restaurants, and other services.
Demographics
As of the 2010 census, the population of Cordova was 1,500. The racial makeup of the town was 79.3% White, 15.7% African American, 0.7% Native American, 0.3% Asian, and 4.0% from other races. The median household income was $30,000, and the median family income was $35,000.
History
Cordova was founded in 1820 by a group of settlers from Scotland. The town was named after the Spanish city of Cordoba, and was originally intended to be a trading post. The town grew slowly, and by the late 19th century, it had become a center for the production of lumber and furniture. In the early 20th century, the town was home to a number of textile mills, and the population began to grow.
In the 1950s, the town was incorporated, and the population continued to grow. In the late 20th century, the town began to experience a decline in population, as many of the factories and mills closed. Today, Cordova is a small town with a population of approximately 1,500 people. The town is home to a number of small businesses, and is a popular destination for tourists.
Common Questions
What is Per Capita Income in Cordova?
Per Capita income in Cordova is $22,779.
What is the Median Household income in Cordova?
Median Household Income in Cordova is $51,046.
What is Inequality or Gini Index in Cordova?
Inequality or Gini Index in Cordova is 0.38.
What is the Total Population of Cordova?
Total Population of Cordova is 1,320.
What is the Total Male Population of Cordova?
Total Male Population of Cordova is 716.
What is the Total Female Population of Cordova?
Total Female Population of Cordova is 604.
What is the Ratio of Males per 100 Females in Cordova?
There are 118.54 Males per 100 Females in Cordova.
What is the Ratio of Females per 100 Males in Cordova?
There are 84.36 Females per 100 Males in Cordova.
What is the Median Population Age in Cordova?
Median Population Age in Cordova is 47.6 Years.
What is the Average Family Size in Cordova
Average Family Size in Cordova is 3.7 People.
What is the Average Household Size in Cordova
Average Household Size in Cordova is 2.5 People.
How Large is the Labor Force in Cordova?
There are 782 People in the Labor Forcein in Cordova.
What is the Percentage of People in the Labor Force in Cordova?
62.9% of People are in the Labor Force in Cordova.
What is the Unemployment Rate in Cordova?
Unemployment Rate in Cordova is 33.2%.