Belhaven, NC Map & Demographics
Belhaven Map
Belhaven Overview
$24,058
PER CAPITA INCOME
$38,875
AVG FAMILY INCOME
$30,147
AVG HOUSEHOLD INCOME
49.1%
WAGE / INCOME GAP [ % ]
50.9¢/ $1
WAGE / INCOME GAP [ $ ]
0.56
INEQUALITY / GINI INDEX
1,378
TOTAL POPULATION
599
MALE POPULATION
779
FEMALE POPULATION
76.89
MALES / 100 FEMALES
130.05
FEMALES / 100 MALES
50.4
MEDIAN AGE
3.3
AVG FAMILY SIZE
2.4
AVG HOUSEHOLD SIZE
492
LABOR FORCE [ PEOPLE ]
44.9%
PERCENT IN LABOR FORCE
11.2%
UNEMPLOYMENT RATE
Belhaven Zip Codes
Belhaven Area Codes
Income in Belhaven
Income Overview in Belhaven
Per Capita Income in Belhaven is $24,058, while median incomes of families and households are $38,875 and $30,147 respectively.
| Characteristic | Number | Measure |
| Per Capita Income | 1,378 | $24,058 |
| Median Family Income | 306 | $38,875 |
| Mean Family Income | 306 | $51,804 |
| Median Household Income | 582 | $30,147 |
| Mean Household Income | 582 | $54,900 |
| Income Deficit | 306 | $0 |
| Wage / Income Gap (%) | 1,378 | 49.13% |
| Wage / Income Gap ($) | 1,378 | 50.87¢ per $1 |
| Gini / Inequality Index | 1,378 | 0.56 |
Earnings by Sex in Belhaven
Average Earnings in Belhaven are $24,236, $36,563 for men and $18,600 for women, a difference of 49.1%.
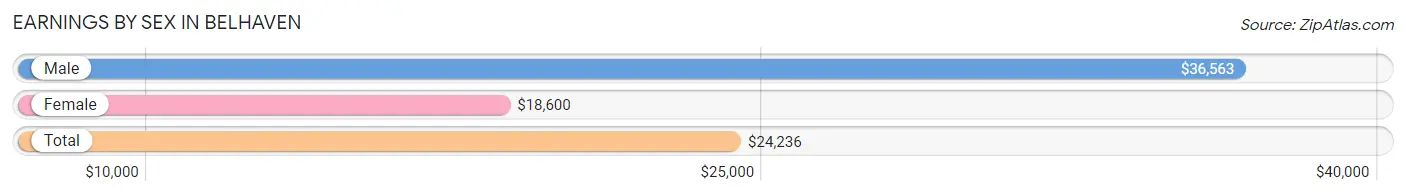
| Sex | Number | Average Earnings |
| Male | 248 (50.4%) | $36,563 |
| Female | 244 (49.6%) | $18,600 |
| Total | 492 (100.0%) | $24,236 |
Earnings by Sex by Income Bracket in Belhaven
The most common earnings brackets in Belhaven are $35,000 to $39,999 for men (41 | 16.5%) and $2,499 or less for women (37 | 15.2%).
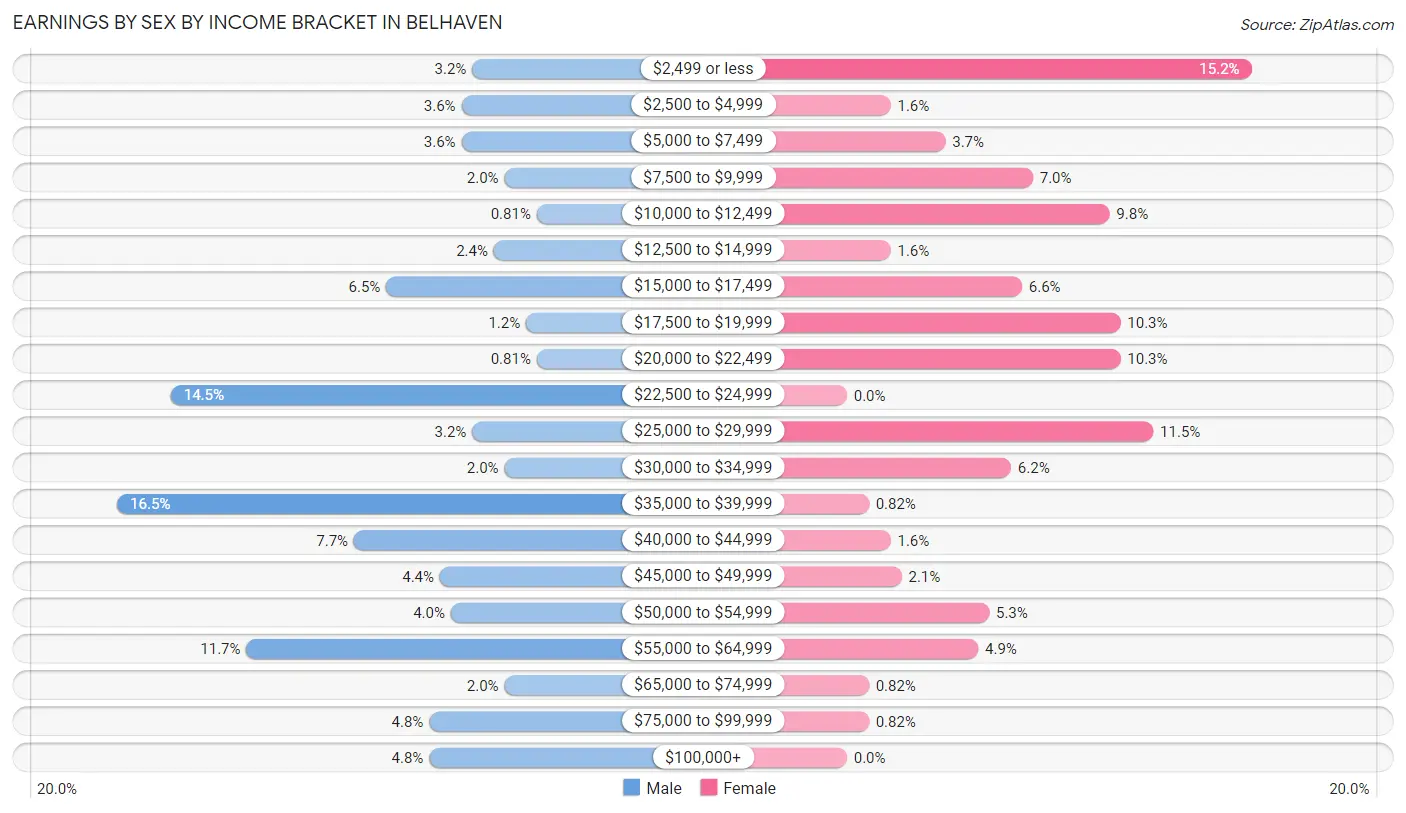
| Income | Male | Female |
| $2,499 or less | 8 (3.2%) | 37 (15.2%) |
| $2,500 to $4,999 | 9 (3.6%) | 4 (1.6%) |
| $5,000 to $7,499 | 9 (3.6%) | 9 (3.7%) |
| $7,500 to $9,999 | 5 (2.0%) | 17 (7.0%) |
| $10,000 to $12,499 | 2 (0.8%) | 24 (9.8%) |
| $12,500 to $14,999 | 6 (2.4%) | 4 (1.6%) |
| $15,000 to $17,499 | 16 (6.5%) | 16 (6.6%) |
| $17,500 to $19,999 | 3 (1.2%) | 25 (10.2%) |
| $20,000 to $22,499 | 2 (0.8%) | 25 (10.2%) |
| $22,500 to $24,999 | 36 (14.5%) | 0 (0.0%) |
| $25,000 to $29,999 | 8 (3.2%) | 28 (11.5%) |
| $30,000 to $34,999 | 5 (2.0%) | 15 (6.1%) |
| $35,000 to $39,999 | 41 (16.5%) | 2 (0.8%) |
| $40,000 to $44,999 | 19 (7.7%) | 4 (1.6%) |
| $45,000 to $49,999 | 11 (4.4%) | 5 (2.1%) |
| $50,000 to $54,999 | 10 (4.0%) | 13 (5.3%) |
| $55,000 to $64,999 | 29 (11.7%) | 12 (4.9%) |
| $65,000 to $74,999 | 5 (2.0%) | 2 (0.8%) |
| $75,000 to $99,999 | 12 (4.8%) | 2 (0.8%) |
| $100,000+ | 12 (4.8%) | 0 (0.0%) |
| Total | 248 (100.0%) | 244 (100.0%) |
Earnings by Sex by Educational Attainment in Belhaven
Average earnings in Belhaven are $36,176 for men and $19,250 for women, a difference of 46.8%. Men with an educational attainment of bachelor's degree enjoy the highest average annual earnings of $49,107, while those with high school diploma education earn the least with $36,103. Women with an educational attainment of bachelor's degree earn the most with the average annual earnings of $45,417, while those with less than high school education have the smallest earnings of $14,688.
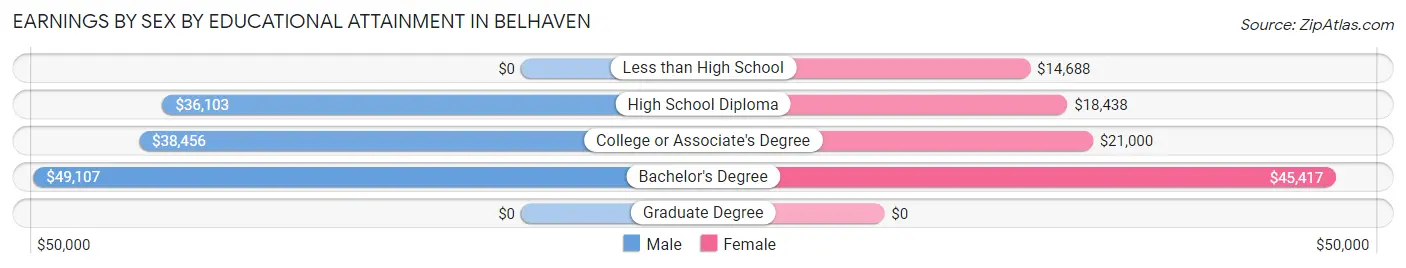
| Educational Attainment | Male Income | Female Income |
| Less than High School | - | - |
| High School Diploma | $36,103 | $18,438 |
| College or Associate's Degree | $38,456 | $21,000 |
| Bachelor's Degree | $49,107 | $45,417 |
| Graduate Degree | - | - |
| Total | $36,176 | $19,250 |
Family Income in Belhaven
Family Income Brackets in Belhaven
According to the Belhaven family income data, there are 60 families falling into the $15,000 to $24,999 income range, which is the most common income bracket and makes up 19.6% of all families.
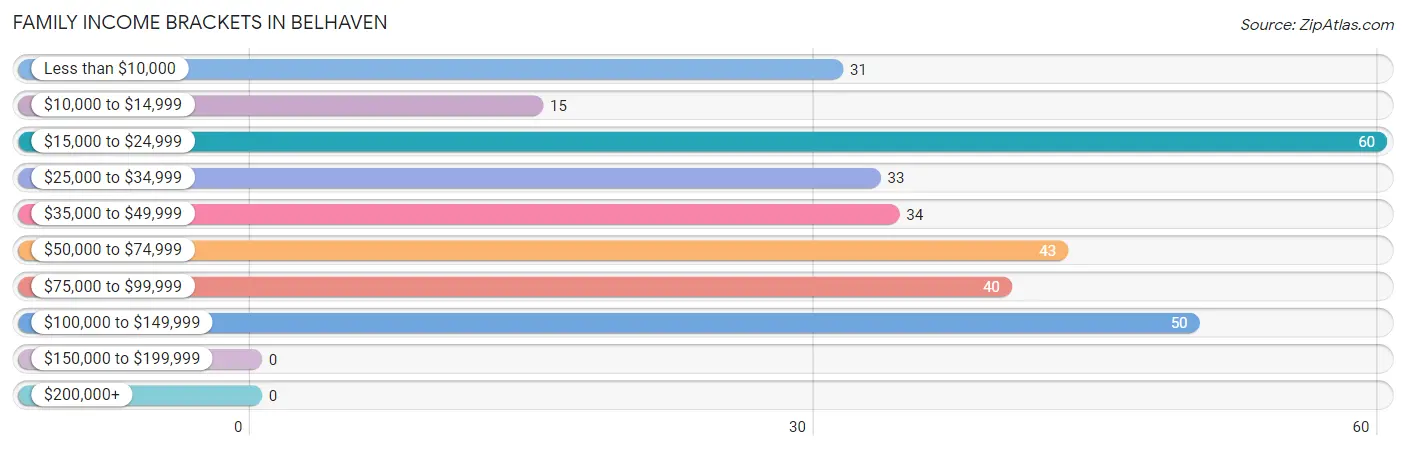
| Income Bracket | # Families | % Families |
| Less than $10,000 | 31 | 10.1% |
| $10,000 to $14,999 | 15 | 4.9% |
| $15,000 to $24,999 | 60 | 19.6% |
| $25,000 to $34,999 | 33 | 10.8% |
| $35,000 to $49,999 | 34 | 11.1% |
| $50,000 to $74,999 | 43 | 14.1% |
| $75,000 to $99,999 | 40 | 13.1% |
| $100,000 to $149,999 | 50 | 16.3% |
| $150,000 to $199,999 | 0 | 0.0% |
| $200,000+ | 0 | 0.0% |
Family Income by Famaliy Size in Belhaven
4-person families (22 | 7.2%) account for the highest median family income in Belhaven with $59,107 per family, while 2-person families (141 | 46.1%) have the highest median income of $19,241 per family member.
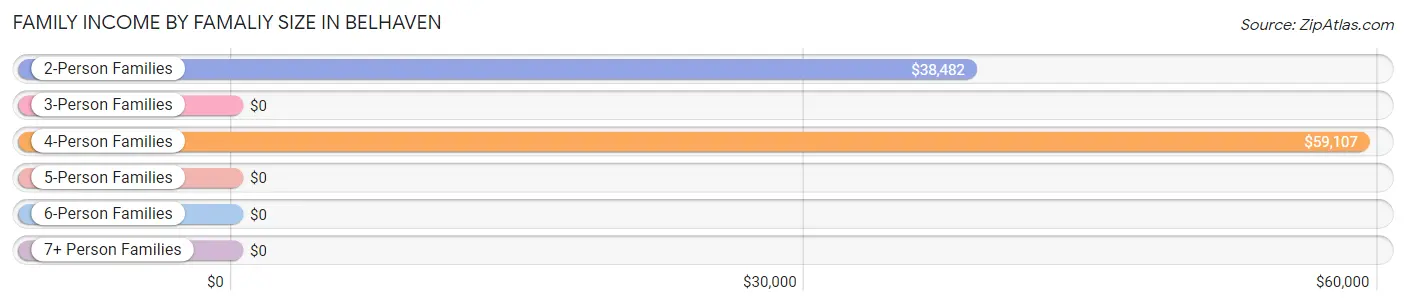
| Income Bracket | # Families | Median Income |
| 2-Person Families | 141 (46.1%) | $38,482 |
| 3-Person Families | 84 (27.5%) | $0 |
| 4-Person Families | 22 (7.2%) | $59,107 |
| 5-Person Families | 37 (12.1%) | $0 |
| 6-Person Families | 21 (6.9%) | $0 |
| 7+ Person Families | 1 (0.3%) | $0 |
| Total | 306 (100.0%) | $38,875 |
Family Income by Number of Earners in Belhaven
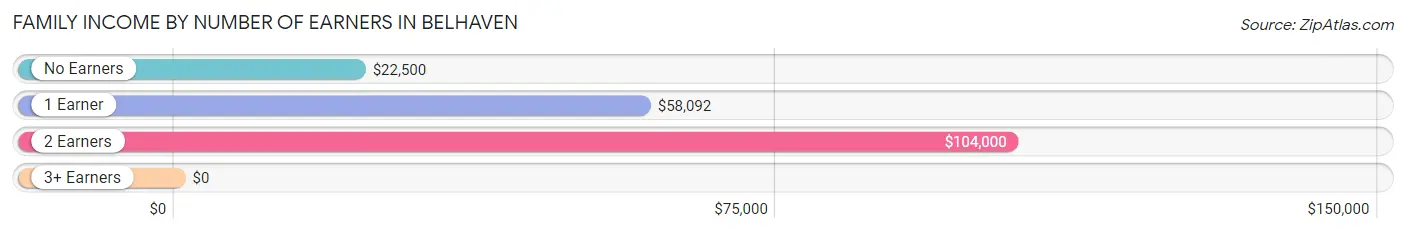
| Number of Earners | # Families | Median Income |
| No Earners | 112 (36.6%) | $22,500 |
| 1 Earner | 133 (43.5%) | $58,092 |
| 2 Earners | 44 (14.4%) | $104,000 |
| 3+ Earners | 17 (5.6%) | $0 |
| Total | 306 (100.0%) | $38,875 |
Household Income in Belhaven
Household Income Brackets in Belhaven
With 109 households falling in the category, the $25,000 to $34,999 income range is the most frequent in Belhaven, accounting for 18.7% of all households.
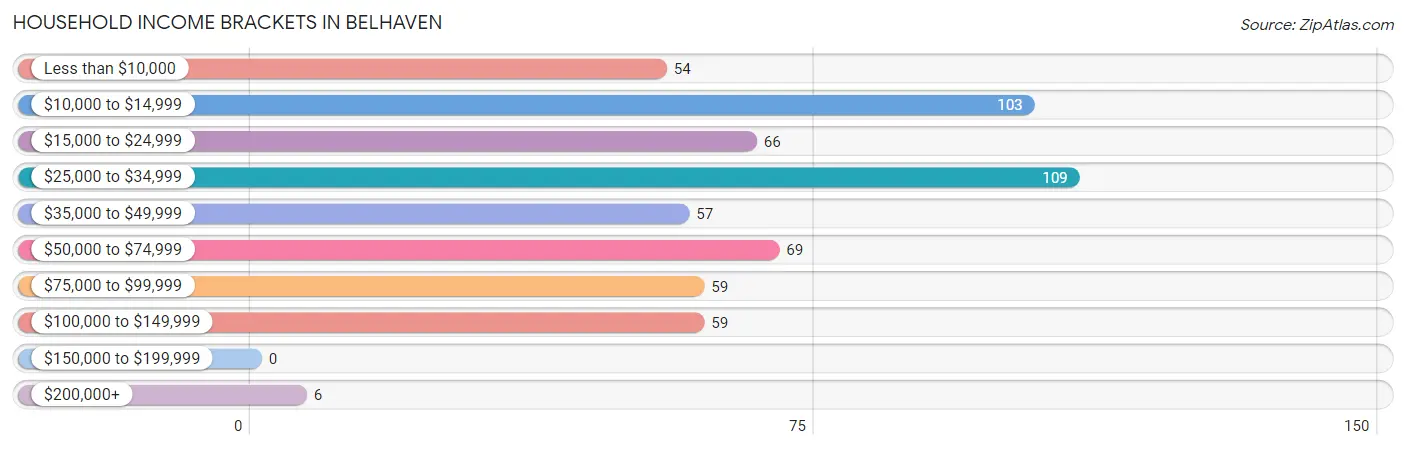
| Income Bracket | # Households | % Households |
| Less than $10,000 | 54 | 9.3% |
| $10,000 to $14,999 | 103 | 17.7% |
| $15,000 to $24,999 | 66 | 11.3% |
| $25,000 to $34,999 | 109 | 18.7% |
| $35,000 to $49,999 | 57 | 9.8% |
| $50,000 to $74,999 | 69 | 11.9% |
| $75,000 to $99,999 | 59 | 10.1% |
| $100,000 to $149,999 | 59 | 10.1% |
| $150,000 to $199,999 | 0 | 0.0% |
| $200,000+ | 6 | 1.0% |
Household Income by Householder Age in Belhaven
The median household income in Belhaven is $30,147, with the highest median household income of $33,333 found in the 65+ years age bracket for the primary householder. A total of 258 households (44.3%) fall into this category. Meanwhile, the 15 to 24 years age bracket for the primary householder has the lowest median household income of $0, with 5 households (0.9%) in this group.
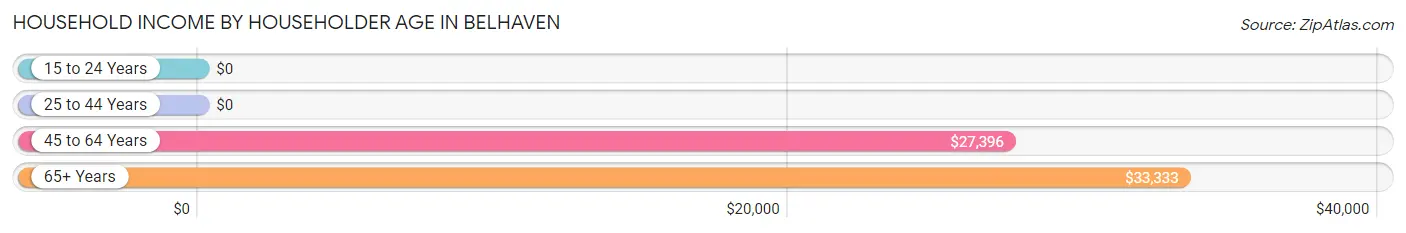
| Income Bracket | # Households | Median Income |
| 15 to 24 Years | 5 (0.9%) | $0 |
| 25 to 44 Years | 83 (14.3%) | $0 |
| 45 to 64 Years | 236 (40.6%) | $27,396 |
| 65+ Years | 258 (44.3%) | $33,333 |
| Total | 582 (100.0%) | $30,147 |
Poverty in Belhaven
Income Below Poverty by Sex and Age in Belhaven
With 24.5% poverty level for males and 48.1% for females among the residents of Belhaven, 5 year old males and under 5 year old females are the most vulnerable to poverty, with 13 males (100.0%) and 5 females (100.0%) in their respective age groups living below the poverty level.
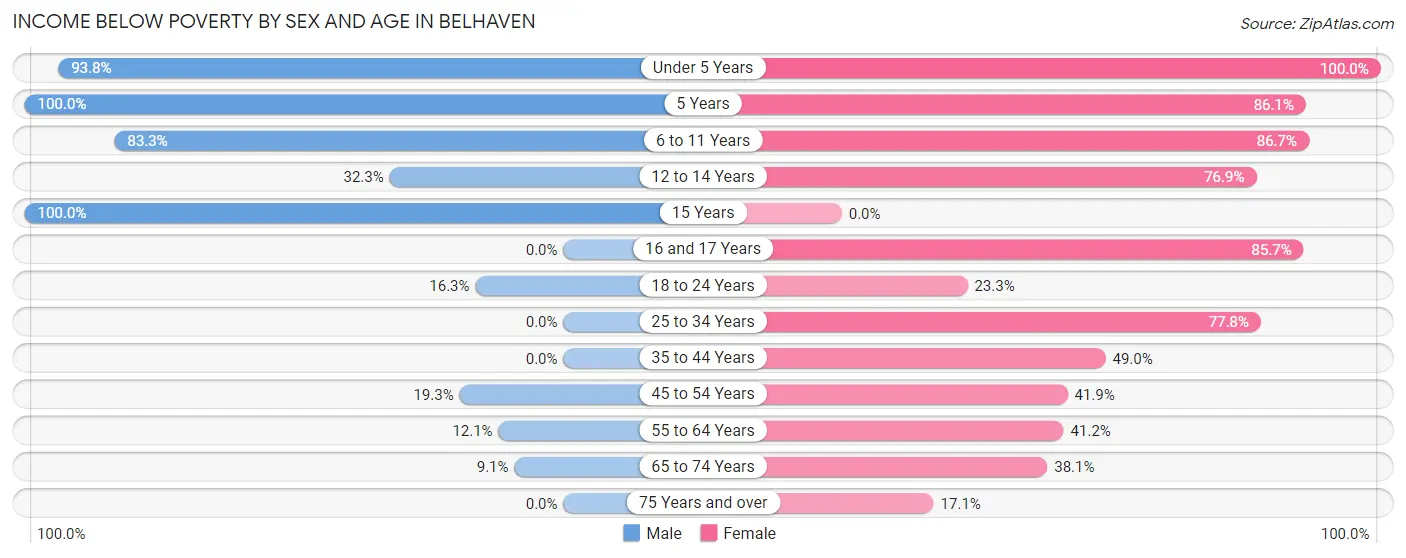
| Age Bracket | Male | Female |
| Under 5 Years | 30 (93.8%) | 5 (100.0%) |
| 5 Years | 13 (100.0%) | 31 (86.1%) |
| 6 to 11 Years | 50 (83.3%) | 26 (86.7%) |
| 12 to 14 Years | 10 (32.3%) | 50 (76.9%) |
| 15 Years | 3 (100.0%) | 0 (0.0%) |
| 16 and 17 Years | 0 (0.0%) | 12 (85.7%) |
| 18 to 24 Years | 8 (16.3%) | 7 (23.3%) |
| 25 to 34 Years | 0 (0.0%) | 35 (77.8%) |
| 35 to 44 Years | 0 (0.0%) | 47 (49.0%) |
| 45 to 54 Years | 16 (19.3%) | 44 (41.9%) |
| 55 to 64 Years | 10 (12.0%) | 56 (41.2%) |
| 65 to 74 Years | 7 (9.1%) | 45 (38.1%) |
| 75 Years and over | 0 (0.0%) | 15 (17.1%) |
| Total | 147 (24.5%) | 373 (48.1%) |
Income Above Poverty by Sex and Age in Belhaven
According to the poverty statistics in Belhaven, males aged 25 to 34 years and females aged 15 years are the age groups that are most secure financially, with 100.0% of males and 100.0% of females in these age groups living above the poverty line.
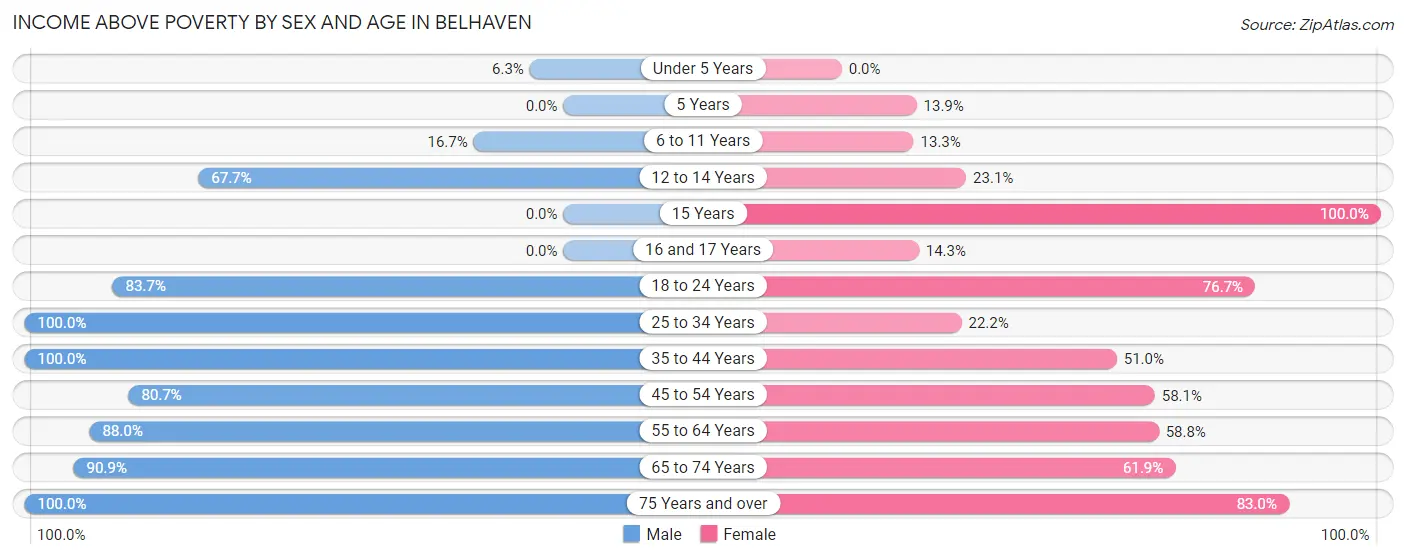
| Age Bracket | Male | Female |
| Under 5 Years | 2 (6.2%) | 0 (0.0%) |
| 5 Years | 0 (0.0%) | 5 (13.9%) |
| 6 to 11 Years | 10 (16.7%) | 4 (13.3%) |
| 12 to 14 Years | 21 (67.7%) | 15 (23.1%) |
| 15 Years | 0 (0.0%) | 8 (100.0%) |
| 16 and 17 Years | 0 (0.0%) | 2 (14.3%) |
| 18 to 24 Years | 41 (83.7%) | 23 (76.7%) |
| 25 to 34 Years | 74 (100.0%) | 10 (22.2%) |
| 35 to 44 Years | 21 (100.0%) | 49 (51.0%) |
| 45 to 54 Years | 67 (80.7%) | 61 (58.1%) |
| 55 to 64 Years | 73 (87.9%) | 80 (58.8%) |
| 65 to 74 Years | 70 (90.9%) | 73 (61.9%) |
| 75 Years and over | 73 (100.0%) | 73 (83.0%) |
| Total | 452 (75.5%) | 403 (51.9%) |
Income Below Poverty Among Married-Couple Families in Belhaven
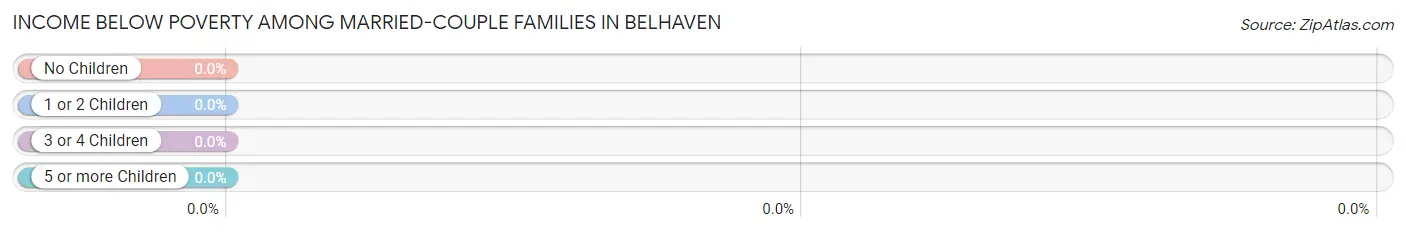
| Children | Above Poverty | Below Poverty |
| No Children | 112 (100.0%) | 0 (0.0%) |
| 1 or 2 Children | 22 (100.0%) | 0 (0.0%) |
| 3 or 4 Children | 1 (100.0%) | 0 (0.0%) |
| 5 or more Children | 0 (0.0%) | 0 (0.0%) |
| Total | 135 (100.0%) | 0 (0.0%) |
Income Below Poverty Among Single-Parent Households in Belhaven
According to the poverty data in Belhaven, 9.1% or 2 single-father households and 59.7% or 89 single-mother households are living below the poverty line. Among single-father households, those with no children have the highest poverty rate, with 2 households (9.1%) experiencing poverty. Likewise, among single-mother households, those with 3 or 4 children have the highest poverty rate, with 18 households (100.0%) falling below the poverty line.
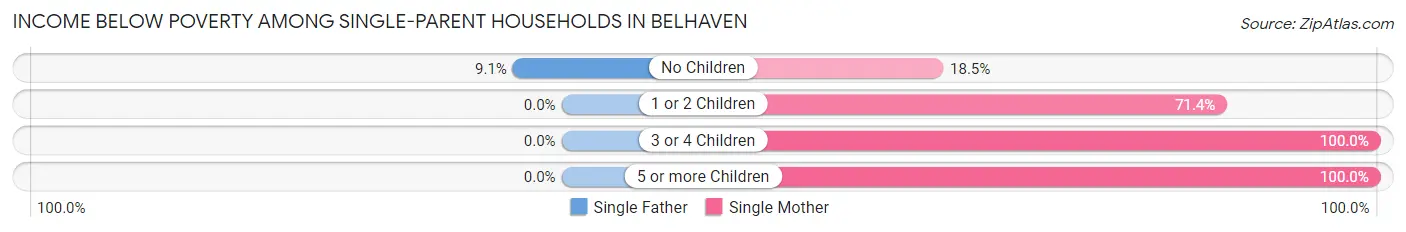
| Children | Single Father | Single Mother |
| No Children | 2 (9.1%) | 10 (18.5%) |
| 1 or 2 Children | 0 (0.0%) | 40 (71.4%) |
| 3 or 4 Children | 0 (0.0%) | 18 (100.0%) |
| 5 or more Children | 0 (0.0%) | 21 (100.0%) |
| Total | 2 (9.1%) | 89 (59.7%) |
Income Below Poverty Among Married-Couple vs Single-Parent Households in Belhaven
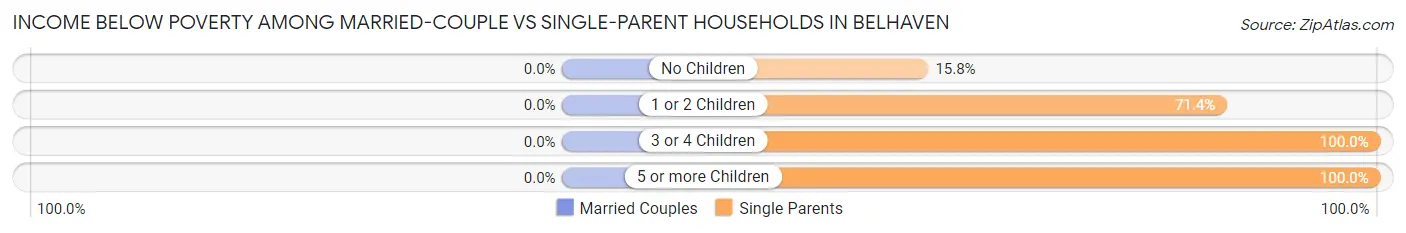
| Children | Married-Couple Families | Single-Parent Households |
| No Children | 0 (0.0%) | 12 (15.8%) |
| 1 or 2 Children | 0 (0.0%) | 40 (71.4%) |
| 3 or 4 Children | 0 (0.0%) | 18 (100.0%) |
| 5 or more Children | 0 (0.0%) | 21 (100.0%) |
| Total | 0 (0.0%) | 91 (53.2%) |
Race in Belhaven
The most populous races in Belhaven are Black / African American (673 | 48.8%), White / Caucasian (593 | 43.0%), and Hispanic or Latino (238 | 17.3%).
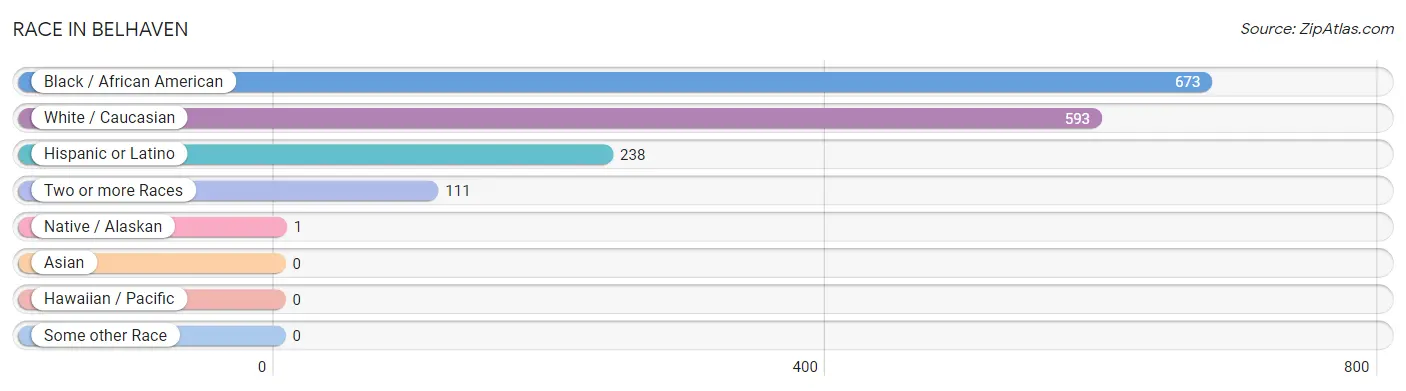
| Race | # Population | % Population |
| Asian | 0 | 0.0% |
| Black / African American | 673 | 48.8% |
| Hawaiian / Pacific | 0 | 0.0% |
| Hispanic or Latino | 238 | 17.3% |
| Native / Alaskan | 1 | 0.1% |
| White / Caucasian | 593 | 43.0% |
| Two or more Races | 111 | 8.1% |
| Some other Race | 0 | 0.0% |
| Total | 1,378 | 100.0% |
Ancestry in Belhaven
The most populous ancestries reported in Belhaven are Mexican (168 | 12.2%), English (94 | 6.8%), Irish (78 | 5.7%), German (36 | 2.6%), and Italian (27 | 2.0%), together accounting for 29.2% of all Belhaven residents.
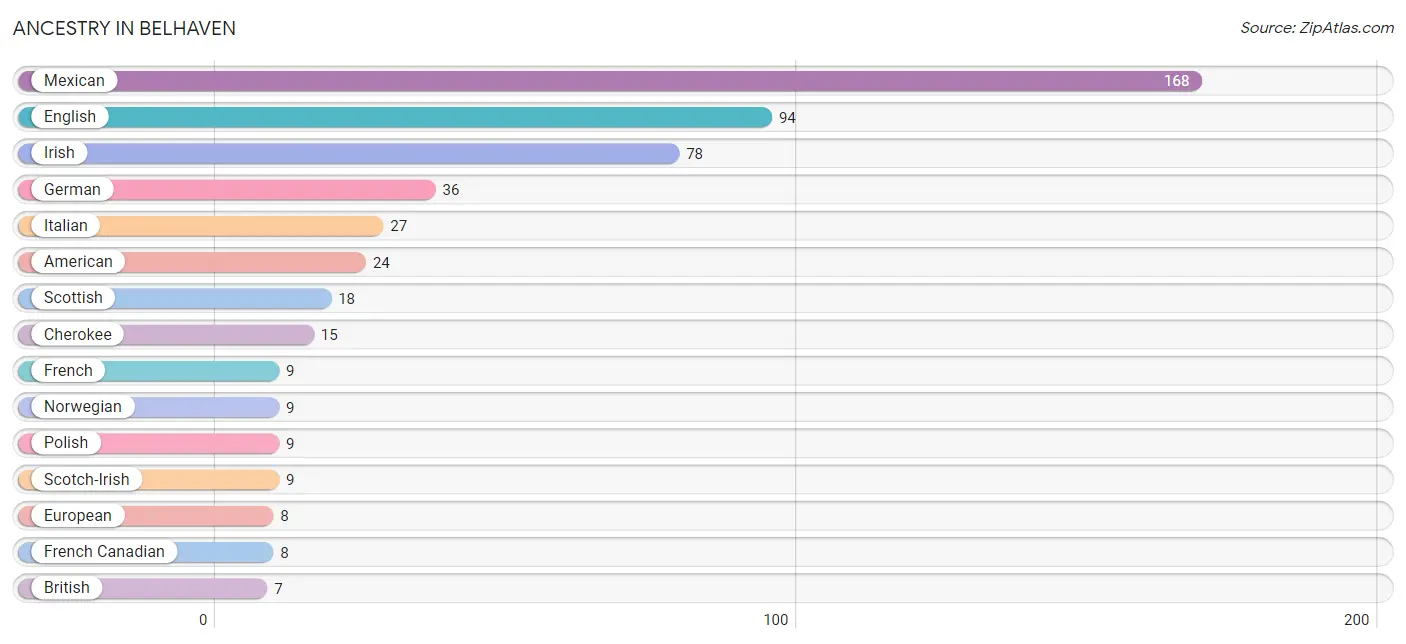
| Ancestry | # Population | % Population |
| African | 4 | 0.3% |
| American | 24 | 1.7% |
| Armenian | 2 | 0.2% |
| Australian | 2 | 0.2% |
| Belgian | 3 | 0.2% |
| British | 7 | 0.5% |
| Cherokee | 15 | 1.1% |
| Cuban | 3 | 0.2% |
| Czech | 2 | 0.2% |
| Dutch | 4 | 0.3% |
| English | 94 | 6.8% |
| European | 8 | 0.6% |
| French | 9 | 0.6% |
| French Canadian | 8 | 0.6% |
| German | 36 | 2.6% |
| Hungarian | 2 | 0.2% |
| Irish | 78 | 5.7% |
| Italian | 27 | 2.0% |
| Mexican | 168 | 12.2% |
| Native Hawaiian | 5 | 0.4% |
| Norwegian | 9 | 0.6% |
| Polish | 9 | 0.6% |
| Scotch-Irish | 9 | 0.6% |
| Scottish | 18 | 1.3% |
| Subsaharan African | 4 | 0.3% |
| Welsh | 3 | 0.2% | View All 26 Rows |
Immigrants in Belhaven
The most numerous immigrant groups reported in Belhaven came from Central America (116 | 8.4%), Latin America (116 | 8.4%), Mexico (116 | 8.4%), Europe (3 | 0.2%), and Netherlands (3 | 0.2%), together accounting for 25.7% of all Belhaven residents.
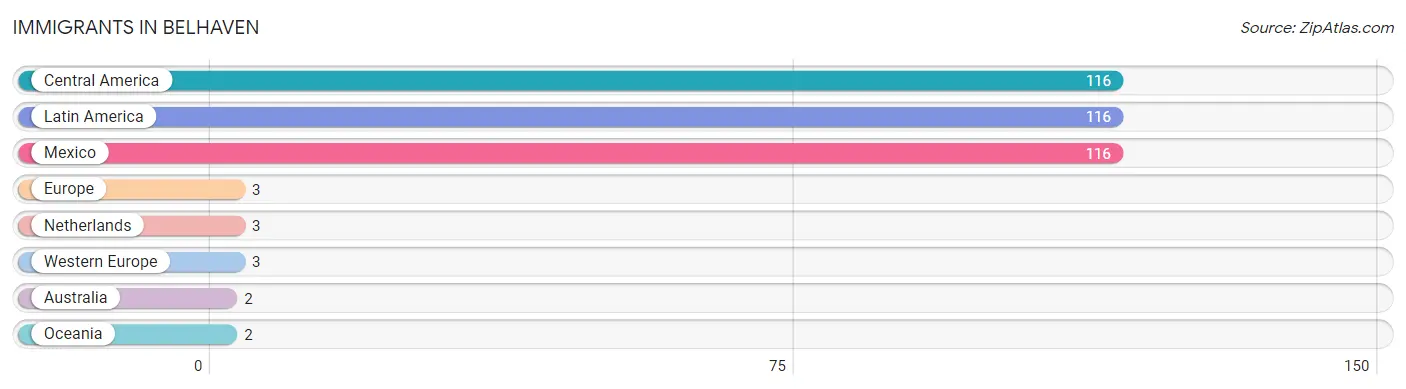
| Immigration Origin | # Population | % Population |
| Australia | 2 | 0.2% |
| Central America | 116 | 8.4% |
| Europe | 3 | 0.2% |
| Latin America | 116 | 8.4% |
| Mexico | 116 | 8.4% |
| Netherlands | 3 | 0.2% |
| Oceania | 2 | 0.2% |
| Western Europe | 3 | 0.2% | View All 8 Rows |
Sex and Age in Belhaven
Sex and Age in Belhaven
The most populous age groups in Belhaven are 5 to 9 Years (60 | 10.0%) for men and 70 to 74 Years (89 | 11.4%) for women.
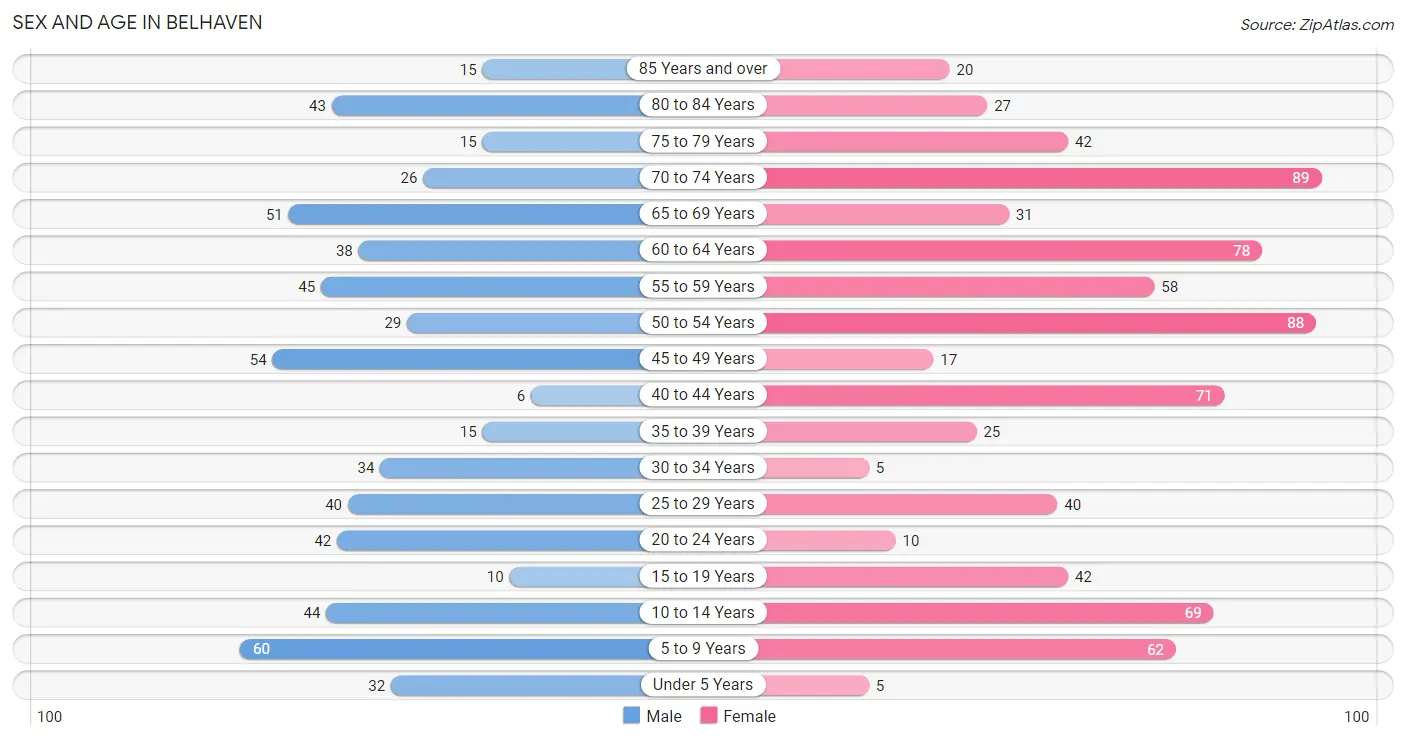
| Age Bracket | Male | Female |
| Under 5 Years | 32 (5.3%) | 5 (0.6%) |
| 5 to 9 Years | 60 (10.0%) | 62 (8.0%) |
| 10 to 14 Years | 44 (7.3%) | 69 (8.9%) |
| 15 to 19 Years | 10 (1.7%) | 42 (5.4%) |
| 20 to 24 Years | 42 (7.0%) | 10 (1.3%) |
| 25 to 29 Years | 40 (6.7%) | 40 (5.1%) |
| 30 to 34 Years | 34 (5.7%) | 5 (0.6%) |
| 35 to 39 Years | 15 (2.5%) | 25 (3.2%) |
| 40 to 44 Years | 6 (1.0%) | 71 (9.1%) |
| 45 to 49 Years | 54 (9.0%) | 17 (2.2%) |
| 50 to 54 Years | 29 (4.8%) | 88 (11.3%) |
| 55 to 59 Years | 45 (7.5%) | 58 (7.4%) |
| 60 to 64 Years | 38 (6.3%) | 78 (10.0%) |
| 65 to 69 Years | 51 (8.5%) | 31 (4.0%) |
| 70 to 74 Years | 26 (4.3%) | 89 (11.4%) |
| 75 to 79 Years | 15 (2.5%) | 42 (5.4%) |
| 80 to 84 Years | 43 (7.2%) | 27 (3.5%) |
| 85 Years and over | 15 (2.5%) | 20 (2.6%) |
| Total | 599 (100.0%) | 779 (100.0%) |
Families and Households in Belhaven
Median Family Size in Belhaven
The median family size in Belhaven is 3.30 persons per family, with single female/mother families (149 | 48.7%) accounting for the largest median family size of 3.7 persons per family. On the other hand, married-couple families (135 | 44.1%) represent the smallest median family size with 2.84 persons per family.
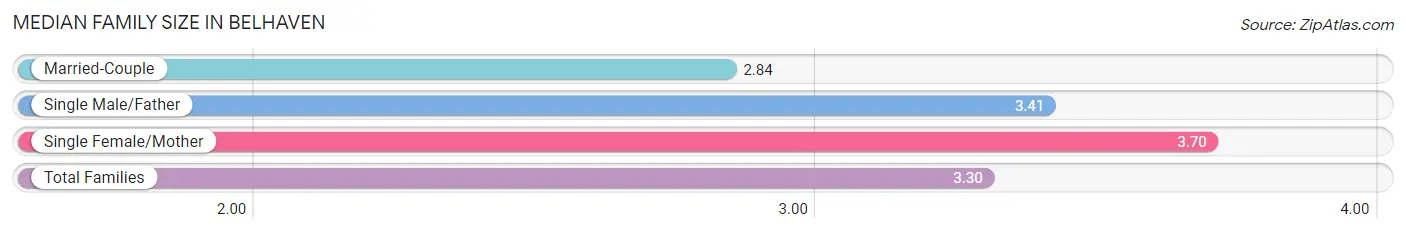
| Family Type | # Families | Family Size |
| Married-Couple | 135 (44.1%) | 2.84 |
| Single Male/Father | 22 (7.2%) | 3.41 |
| Single Female/Mother | 149 (48.7%) | 3.70 |
| Total Families | 306 (100.0%) | 3.30 |
Median Household Size in Belhaven
The median household size in Belhaven is 2.36 persons per household, with single male/father households (22 | 3.8%) accounting for the largest median household size of 4.55 persons per household. non-family households (276 | 47.4%) represent the smallest median household size with 1.16 persons per household.
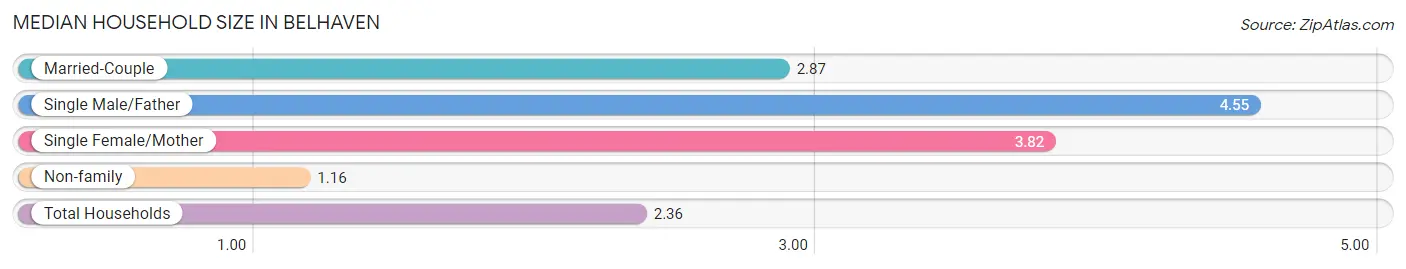
| Household Type | # Households | Household Size |
| Married-Couple | 135 (23.2%) | 2.87 |
| Single Male/Father | 22 (3.8%) | 4.55 |
| Single Female/Mother | 149 (25.6%) | 3.82 |
| Non-family | 276 (47.4%) | 1.16 |
| Total Households | 582 (100.0%) | 2.36 |
Household Size by Marriage Status in Belhaven
Out of a total of 582 households in Belhaven, 306 (52.6%) are family households, while 276 (47.4%) are nonfamily households. The most numerous type of family households are 2-person households, comprising 139, and the most common type of nonfamily households are 1-person households, comprising 239.
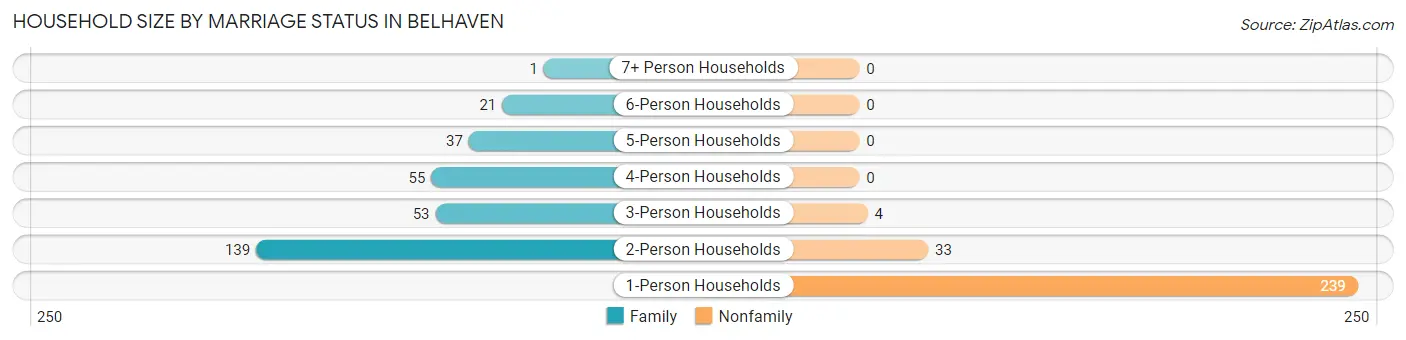
| Household Size | Family Households | Nonfamily Households |
| 1-Person Households | - | 239 (41.1%) |
| 2-Person Households | 139 (23.9%) | 33 (5.7%) |
| 3-Person Households | 53 (9.1%) | 4 (0.7%) |
| 4-Person Households | 55 (9.5%) | 0 (0.0%) |
| 5-Person Households | 37 (6.4%) | 0 (0.0%) |
| 6-Person Households | 21 (3.6%) | 0 (0.0%) |
| 7+ Person Households | 1 (0.2%) | 0 (0.0%) |
| Total | 306 (52.6%) | 276 (47.4%) |
Female Fertility in Belhaven
Fertility by Age in Belhaven
| Age Bracket | Women with Births | Births / 1,000 Women |
| 15 to 19 years | 0 (0.0%) | 0.0 |
| 20 to 34 years | 0 (0.0%) | 0.0 |
| 35 to 50 years | 0 (0.0%) | 0.0 |
| Total | 0 (0.0%) | 0.0 |
Fertility by Age by Marriage Status in Belhaven
| Age Bracket | Married | Unmarried |
| 15 to 19 years | 0 (0.0%) | 0 (0.0%) |
| 20 to 34 years | 0 (0.0%) | 0 (0.0%) |
| 35 to 50 years | 0 (0.0%) | 0 (0.0%) |
| Total | 0 (0.0%) | 0 (0.0%) |
Fertility by Education in Belhaven
| Educational Attainment | Women with Births | Births / 1,000 Women |
| Less than High School | 0 (0.0%) | 0.0 |
| High School Diploma | 0 (0.0%) | 0.0 |
| College or Associate's Degree | 0 (0.0%) | 0.0 |
| Bachelor's Degree | 0 (0.0%) | 0.0 |
| Graduate Degree | 0 (0.0%) | 0.0 |
| Total | 0 (0.0%) | 0.0 |
Fertility by Education by Marriage Status in Belhaven
| Educational Attainment | Married | Unmarried |
| Less than High School | 0 (0.0%) | 0 (0.0%) |
| High School Diploma | 0 (0.0%) | 0 (0.0%) |
| College or Associate's Degree | 0 (0.0%) | 0 (0.0%) |
| Bachelor's Degree | 0 (0.0%) | 0 (0.0%) |
| Graduate Degree | 0 (0.0%) | 0 (0.0%) |
| Total | 0 (0.0%) | 0 (0.0%) |
Employment Characteristics in Belhaven
Employment by Class of Employer in Belhaven
Among the 434 employed individuals in Belhaven, private company employees (285 | 65.7%), state government employees (73 | 16.8%), and self-employed (incorporated) (28 | 6.5%) make up the most common classes of employment.
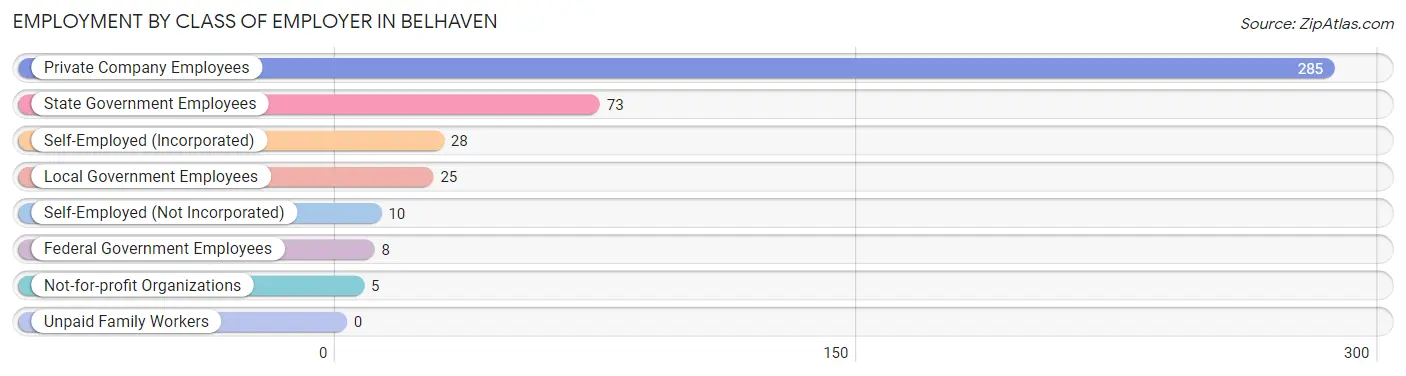
| Employer Class | # Employees | % Employees |
| Private Company Employees | 285 | 65.7% |
| Self-Employed (Incorporated) | 28 | 6.5% |
| Self-Employed (Not Incorporated) | 10 | 2.3% |
| Not-for-profit Organizations | 5 | 1.1% |
| Local Government Employees | 25 | 5.8% |
| State Government Employees | 73 | 16.8% |
| Federal Government Employees | 8 | 1.8% |
| Unpaid Family Workers | 0 | 0.0% |
| Total | 434 | 100.0% |
Employment Status by Age in Belhaven
According to the labor force statistics for Belhaven, out of the total population over 16 years of age (1,095), 44.9% or 492 individuals are in the labor force, with 11.2% or 55 of them unemployed. The age group with the highest labor force participation rate is 25 to 29 years, with 93.8% or 75 individuals in the labor force. Within the labor force, the 25 to 29 years age range has the highest percentage of unemployed individuals, with 40.0% or 30 of them being unemployed.
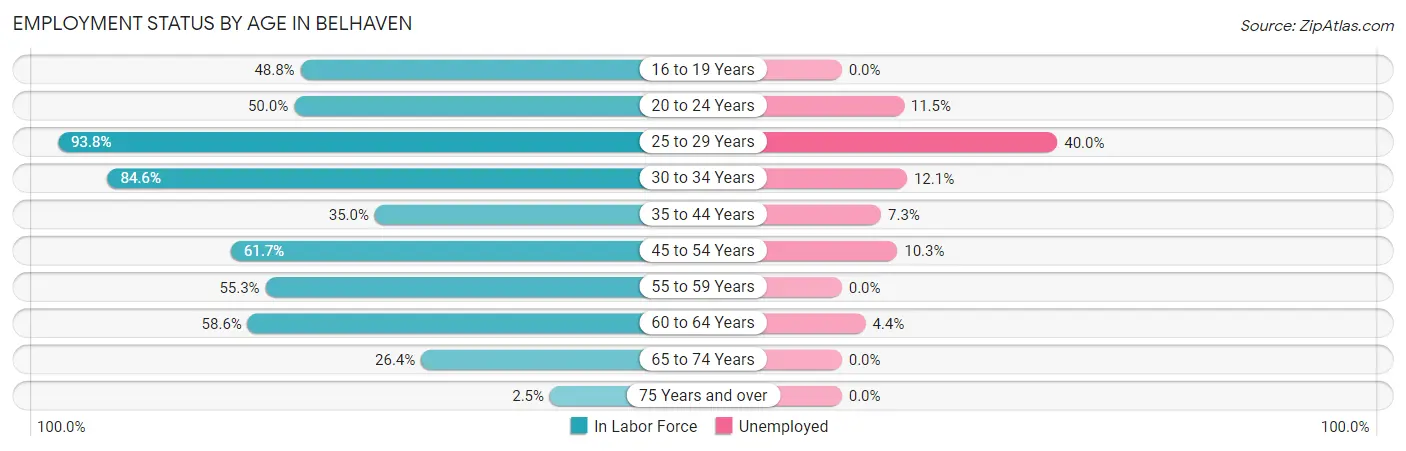
| Age Bracket | In Labor Force | Unemployed |
| 16 to 19 Years | 20 (48.8%) | 0 (0.0%) |
| 20 to 24 Years | 26 (50.0%) | 3 (11.5%) |
| 25 to 29 Years | 75 (93.8%) | 30 (40.0%) |
| 30 to 34 Years | 33 (84.6%) | 4 (12.1%) |
| 35 to 44 Years | 41 (35.0%) | 3 (7.3%) |
| 45 to 54 Years | 116 (61.7%) | 12 (10.3%) |
| 55 to 59 Years | 57 (55.3%) | 0 (0.0%) |
| 60 to 64 Years | 68 (58.6%) | 3 (4.4%) |
| 65 to 74 Years | 52 (26.4%) | 0 (0.0%) |
| 75 Years and over | 4 (2.5%) | 0 (0.0%) |
| Total | 492 (44.9%) | 55 (11.2%) |
Employment Status by Educational Attainment in Belhaven
According to labor force statistics for Belhaven, 60.7% of individuals (390) out of the total population between 25 and 64 years of age (643) are in the labor force, with 13.3% or 52 of them being unemployed. The group with the highest labor force participation rate are those with the educational attainment of college / associate degree, with 78.9% or 146 individuals in the labor force. Within the labor force, individuals with high school diploma education have the highest percentage of unemployment, with 28.7% or 39 of them being unemployed.
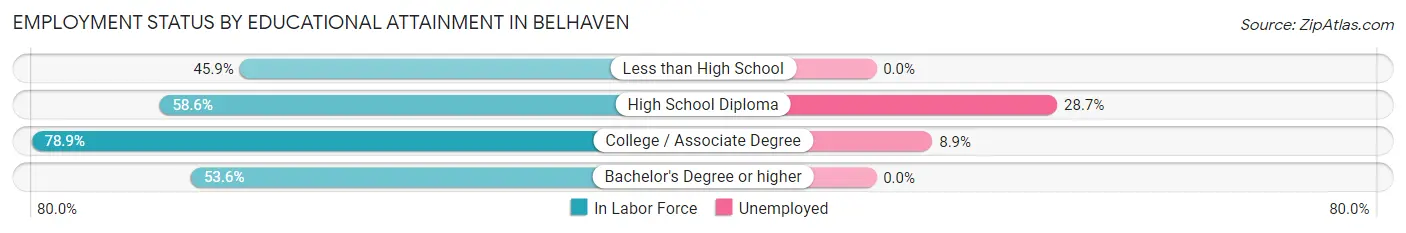
| Educational Attainment | In Labor Force | Unemployed |
| Less than High School | 78 (45.9%) | 0 (0.0%) |
| High School Diploma | 136 (58.6%) | 67 (28.7%) |
| College / Associate Degree | 146 (78.9%) | 16 (8.9%) |
| Bachelor's Degree or higher | 30 (53.6%) | 0 (0.0%) |
| Total | 390 (60.7%) | 86 (13.3%) |
Employment Occupations by Sex in Belhaven
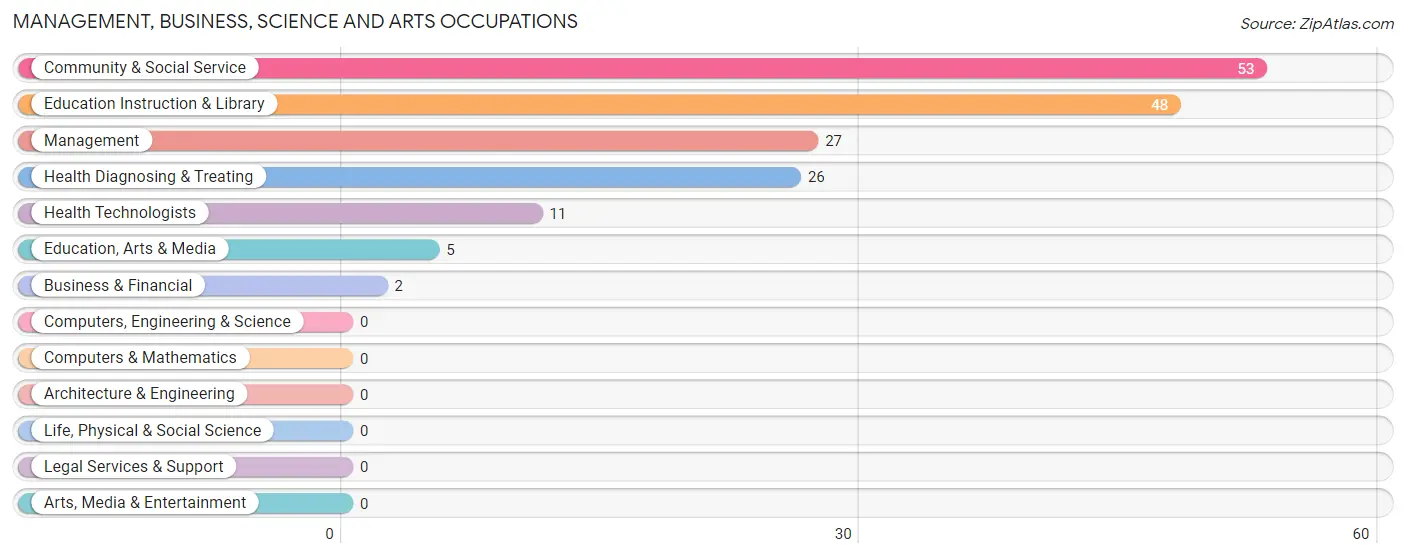
Management, Business, Science and Arts Occupations
The most common Management, Business, Science and Arts occupations in Belhaven are Community & Social Service (53 | 12.1%), Education Instruction & Library (48 | 11.0%), Management (27 | 6.2%), Health Diagnosing & Treating (26 | 5.9%), and Health Technologists (11 | 2.5%).
Management, Business, Science and Arts Occupations by Sex
Within the Management, Business, Science and Arts occupations in Belhaven, the most male-oriented occupations are Management (88.9%), Education, Arts & Media (40.0%), and Community & Social Service (7.5%), while the most female-oriented occupations are Business & Financial (100.0%), Health Diagnosing & Treating (100.0%), and Health Technologists (100.0%).
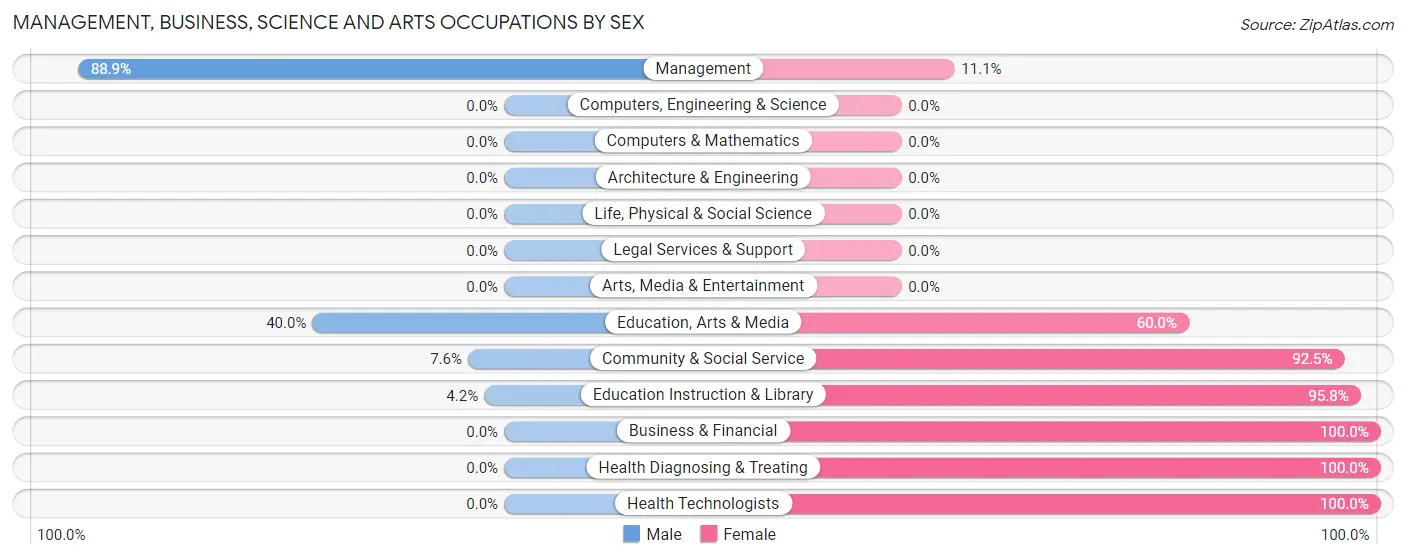
| Occupation | Male | Female |
| Management | 24 (88.9%) | 3 (11.1%) |
| Business & Financial | 0 (0.0%) | 2 (100.0%) |
| Computers, Engineering & Science | 0 (0.0%) | 0 (0.0%) |
| Computers & Mathematics | 0 (0.0%) | 0 (0.0%) |
| Architecture & Engineering | 0 (0.0%) | 0 (0.0%) |
| Life, Physical & Social Science | 0 (0.0%) | 0 (0.0%) |
| Community & Social Service | 4 (7.5%) | 49 (92.4%) |
| Education, Arts & Media | 2 (40.0%) | 3 (60.0%) |
| Legal Services & Support | 0 (0.0%) | 0 (0.0%) |
| Education Instruction & Library | 2 (4.2%) | 46 (95.8%) |
| Arts, Media & Entertainment | 0 (0.0%) | 0 (0.0%) |
| Health Diagnosing & Treating | 0 (0.0%) | 26 (100.0%) |
| Health Technologists | 0 (0.0%) | 11 (100.0%) |
| Total (Category) | 28 (25.9%) | 80 (74.1%) |
| Total (Overall) | 227 (51.9%) | 210 (48.0%) |
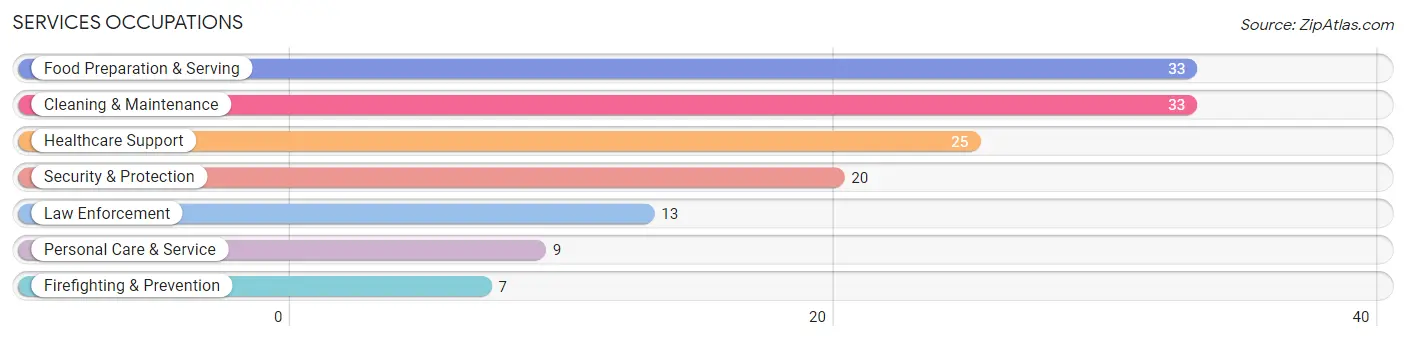
Services Occupations
The most common Services occupations in Belhaven are Food Preparation & Serving (33 | 7.5%), Cleaning & Maintenance (33 | 7.5%), Healthcare Support (25 | 5.7%), Security & Protection (20 | 4.6%), and Law Enforcement (13 | 3.0%).
Services Occupations by Sex
Within the Services occupations in Belhaven, the most male-oriented occupations are Law Enforcement (100.0%), Security & Protection (90.0%), and Firefighting & Prevention (71.4%), while the most female-oriented occupations are Healthcare Support (100.0%), Personal Care & Service (100.0%), and Food Preparation & Serving (69.7%).
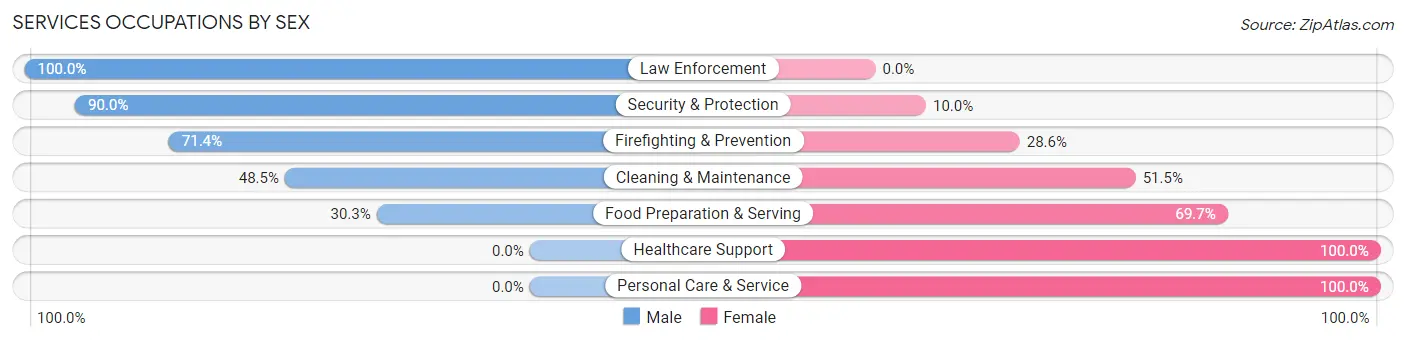
| Occupation | Male | Female |
| Healthcare Support | 0 (0.0%) | 25 (100.0%) |
| Security & Protection | 18 (90.0%) | 2 (10.0%) |
| Firefighting & Prevention | 5 (71.4%) | 2 (28.6%) |
| Law Enforcement | 13 (100.0%) | 0 (0.0%) |
| Food Preparation & Serving | 10 (30.3%) | 23 (69.7%) |
| Cleaning & Maintenance | 16 (48.5%) | 17 (51.5%) |
| Personal Care & Service | 0 (0.0%) | 9 (100.0%) |
| Total (Category) | 44 (36.7%) | 76 (63.3%) |
| Total (Overall) | 227 (51.9%) | 210 (48.0%) |
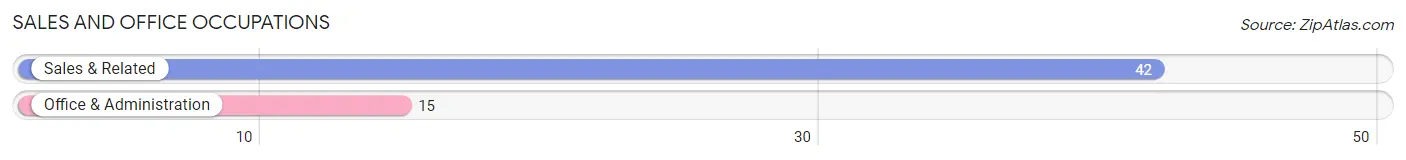
Sales and Office Occupations
The most common Sales and Office occupations in Belhaven are Sales & Related (42 | 9.6%), and Office & Administration (15 | 3.4%).
Sales and Office Occupations by Sex
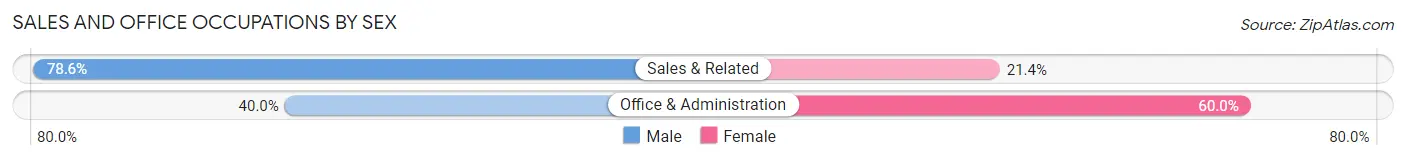
| Occupation | Male | Female |
| Sales & Related | 33 (78.6%) | 9 (21.4%) |
| Office & Administration | 6 (40.0%) | 9 (60.0%) |
| Total (Category) | 39 (68.4%) | 18 (31.6%) |
| Total (Overall) | 227 (51.9%) | 210 (48.0%) |
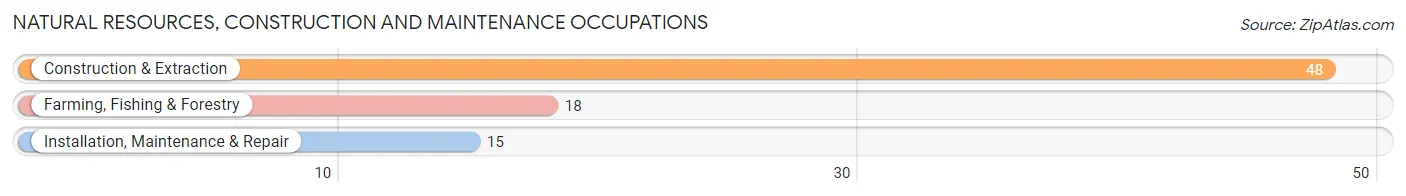
Natural Resources, Construction and Maintenance Occupations
The most common Natural Resources, Construction and Maintenance occupations in Belhaven are Construction & Extraction (48 | 11.0%), Farming, Fishing & Forestry (18 | 4.1%), and Installation, Maintenance & Repair (15 | 3.4%).
Natural Resources, Construction and Maintenance Occupations by Sex
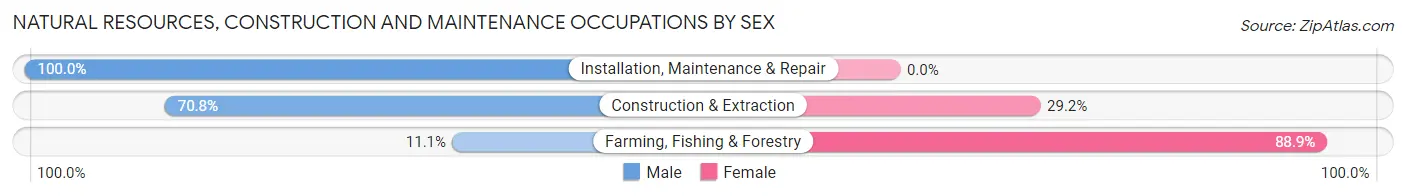
| Occupation | Male | Female |
| Farming, Fishing & Forestry | 2 (11.1%) | 16 (88.9%) |
| Construction & Extraction | 34 (70.8%) | 14 (29.2%) |
| Installation, Maintenance & Repair | 15 (100.0%) | 0 (0.0%) |
| Total (Category) | 51 (63.0%) | 30 (37.0%) |
| Total (Overall) | 227 (51.9%) | 210 (48.0%) |
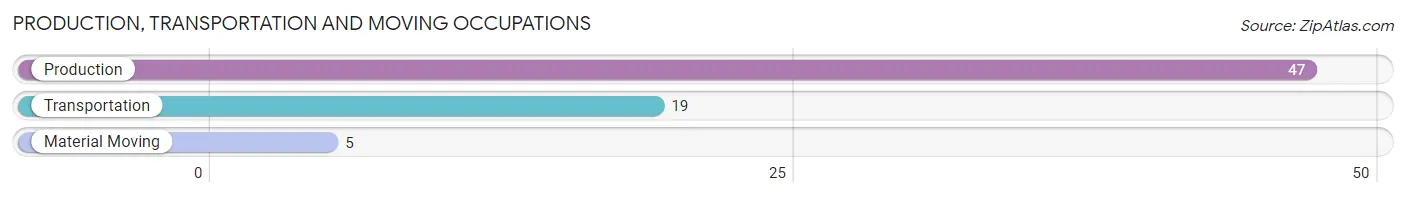
Production, Transportation and Moving Occupations
The most common Production, Transportation and Moving occupations in Belhaven are Production (47 | 10.8%), Transportation (19 | 4.3%), and Material Moving (5 | 1.1%).
Production, Transportation and Moving Occupations by Sex
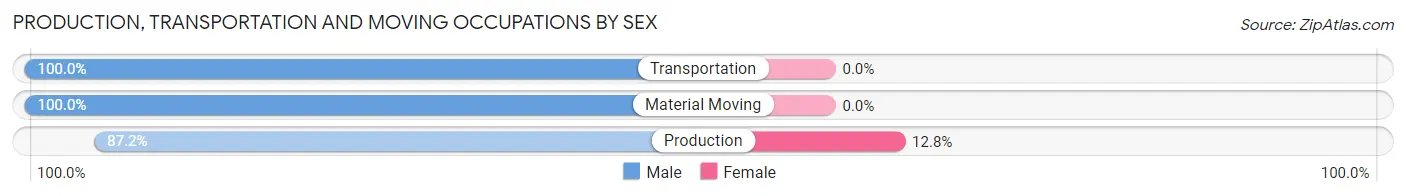
| Occupation | Male | Female |
| Production | 41 (87.2%) | 6 (12.8%) |
| Transportation | 19 (100.0%) | 0 (0.0%) |
| Material Moving | 5 (100.0%) | 0 (0.0%) |
| Total (Category) | 65 (91.5%) | 6 (8.5%) |
| Total (Overall) | 227 (51.9%) | 210 (48.0%) |
Employment Industries by Sex in Belhaven
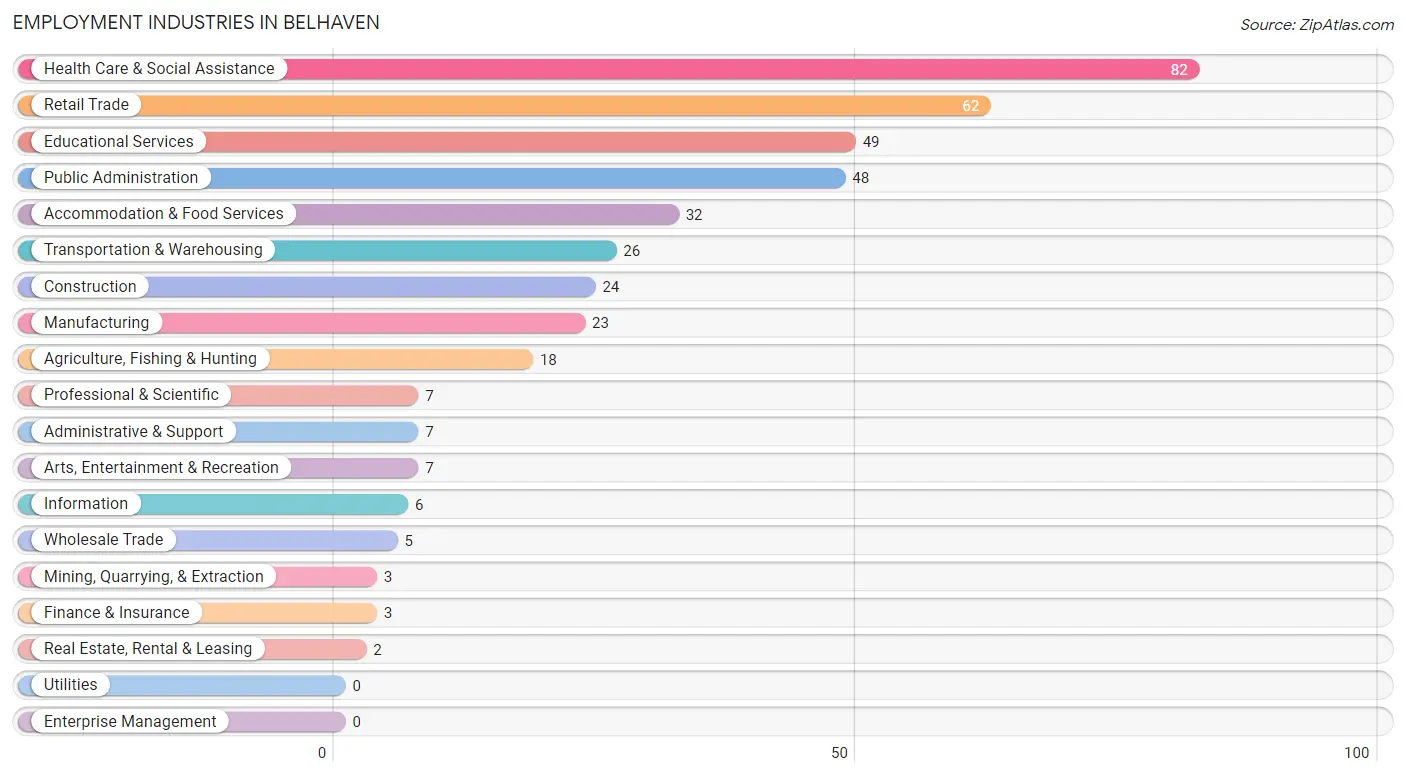
Employment Industries in Belhaven
The major employment industries in Belhaven include Health Care & Social Assistance (82 | 18.8%), Retail Trade (62 | 14.2%), Educational Services (49 | 11.2%), Public Administration (48 | 11.0%), and Accommodation & Food Services (32 | 7.3%).
Employment Industries by Sex in Belhaven
The Belhaven industries that see more men than women are Mining, Quarrying, & Extraction (100.0%), Construction (100.0%), and Wholesale Trade (100.0%), whereas the industries that tend to have a higher number of women are Real Estate, Rental & Leasing (100.0%), Health Care & Social Assistance (92.7%), and Agriculture, Fishing & Hunting (88.9%).
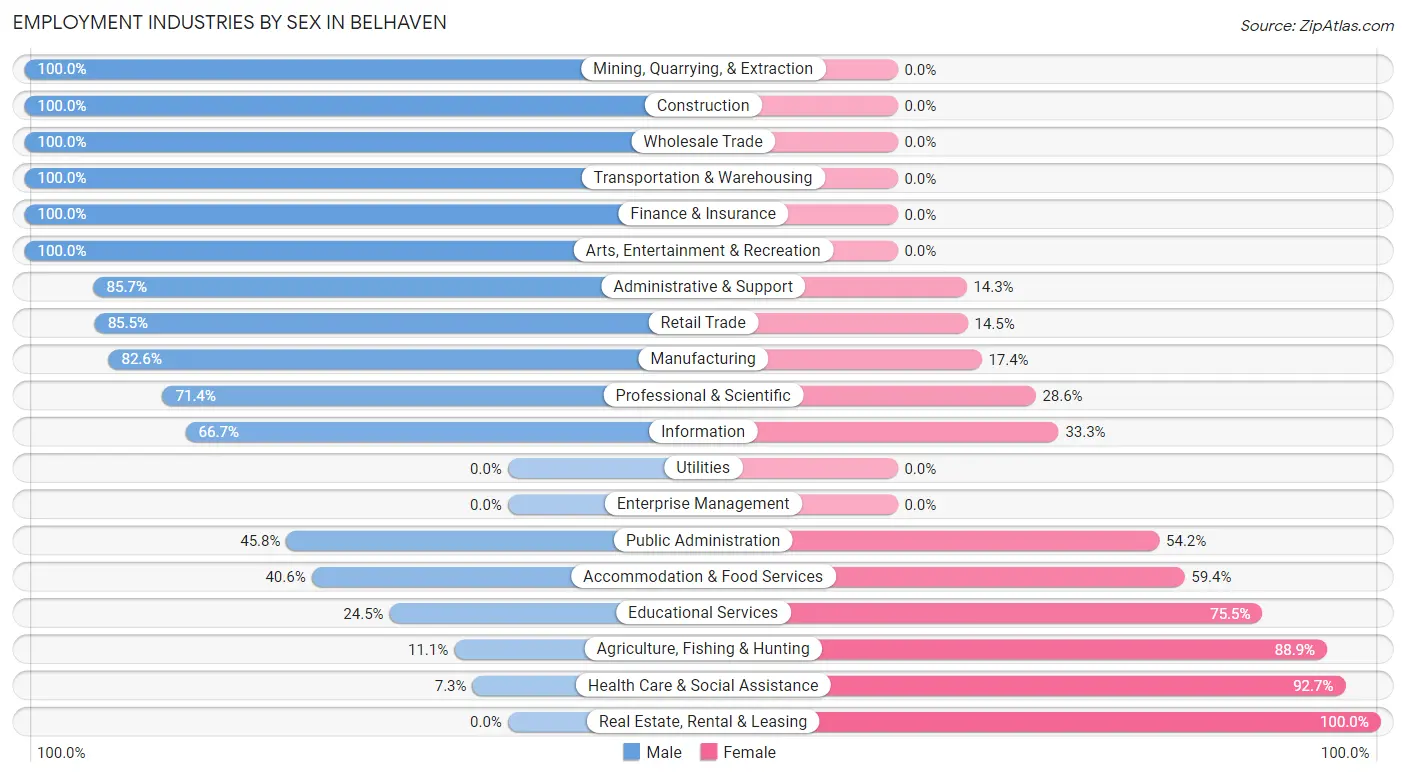
| Industry | Male | Female |
| Agriculture, Fishing & Hunting | 2 (11.1%) | 16 (88.9%) |
| Mining, Quarrying, & Extraction | 3 (100.0%) | 0 (0.0%) |
| Construction | 24 (100.0%) | 0 (0.0%) |
| Manufacturing | 19 (82.6%) | 4 (17.4%) |
| Wholesale Trade | 5 (100.0%) | 0 (0.0%) |
| Retail Trade | 53 (85.5%) | 9 (14.5%) |
| Transportation & Warehousing | 26 (100.0%) | 0 (0.0%) |
| Utilities | 0 (0.0%) | 0 (0.0%) |
| Information | 4 (66.7%) | 2 (33.3%) |
| Finance & Insurance | 3 (100.0%) | 0 (0.0%) |
| Real Estate, Rental & Leasing | 0 (0.0%) | 2 (100.0%) |
| Professional & Scientific | 5 (71.4%) | 2 (28.6%) |
| Enterprise Management | 0 (0.0%) | 0 (0.0%) |
| Administrative & Support | 6 (85.7%) | 1 (14.3%) |
| Educational Services | 12 (24.5%) | 37 (75.5%) |
| Health Care & Social Assistance | 6 (7.3%) | 76 (92.7%) |
| Arts, Entertainment & Recreation | 7 (100.0%) | 0 (0.0%) |
| Accommodation & Food Services | 13 (40.6%) | 19 (59.4%) |
| Public Administration | 22 (45.8%) | 26 (54.2%) |
| Total | 227 (51.9%) | 210 (48.0%) |
Education in Belhaven
School Enrollment in Belhaven
The most common levels of schooling among the 289 students in Belhaven are middle school (103 | 35.6%), elementary school (102 | 35.3%), and high school (39 | 13.5%).
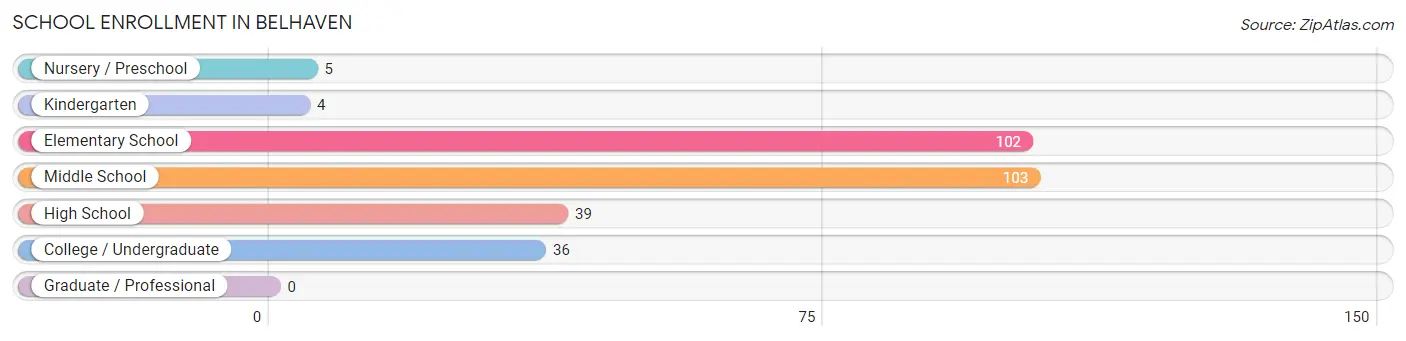
| School Level | # Students | % Students |
| Nursery / Preschool | 5 | 1.7% |
| Kindergarten | 4 | 1.4% |
| Elementary School | 102 | 35.3% |
| Middle School | 103 | 35.6% |
| High School | 39 | 13.5% |
| College / Undergraduate | 36 | 12.5% |
| Graduate / Professional | 0 | 0.0% |
| Total | 289 | 100.0% |
School Enrollment by Age by Funding Source in Belhaven
Out of a total of 289 students who are enrolled in schools in Belhaven, 8 (2.8%) attend a private institution, while the remaining 281 (97.2%) are enrolled in public schools. The age group of 25 to 34 year olds has the highest likelihood of being enrolled in private schools, with 2 (33.3% in the age bracket) enrolled. Conversely, the age group of 3 to 4 year olds has the lowest likelihood of being enrolled in a private school, with 5 (100.0% in the age bracket) attending a public institution.
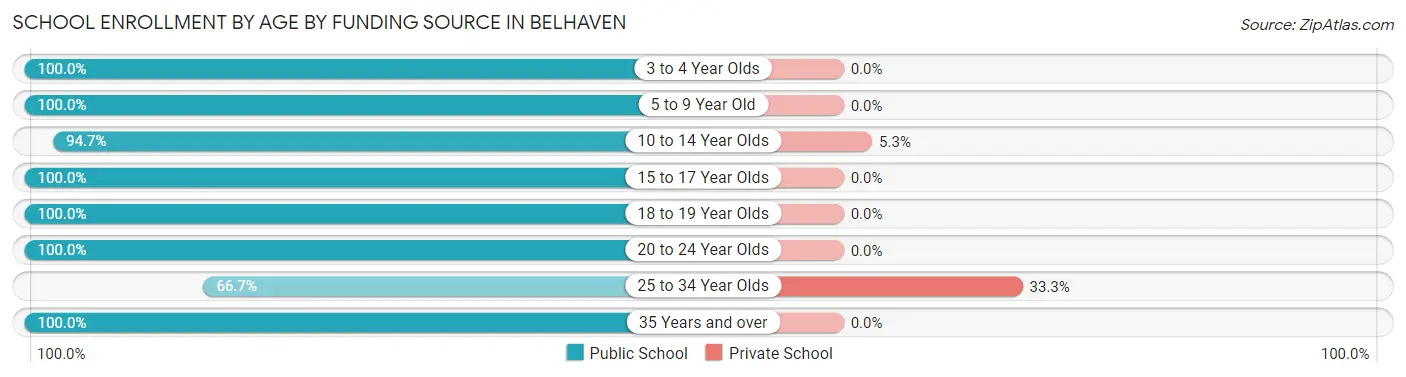
| Age Bracket | Public School | Private School |
| 3 to 4 Year Olds | 5 (100.0%) | 0 (0.0%) |
| 5 to 9 Year Old | 102 (100.0%) | 0 (0.0%) |
| 10 to 14 Year Olds | 107 (94.7%) | 6 (5.3%) |
| 15 to 17 Year Olds | 25 (100.0%) | 0 (0.0%) |
| 18 to 19 Year Olds | 12 (100.0%) | 0 (0.0%) |
| 20 to 24 Year Olds | 17 (100.0%) | 0 (0.0%) |
| 25 to 34 Year Olds | 4 (66.7%) | 2 (33.3%) |
| 35 Years and over | 9 (100.0%) | 0 (0.0%) |
| Total | 281 (97.2%) | 8 (2.8%) |
Educational Attainment by Field of Study in Belhaven
Business (22 | 20.4%), education (22 | 20.4%), science & technology (13 | 12.0%), social sciences (10 | 9.3%), and arts & humanities (8 | 7.4%) are the most common fields of study among 108 individuals in Belhaven who have obtained a bachelor's degree or higher.
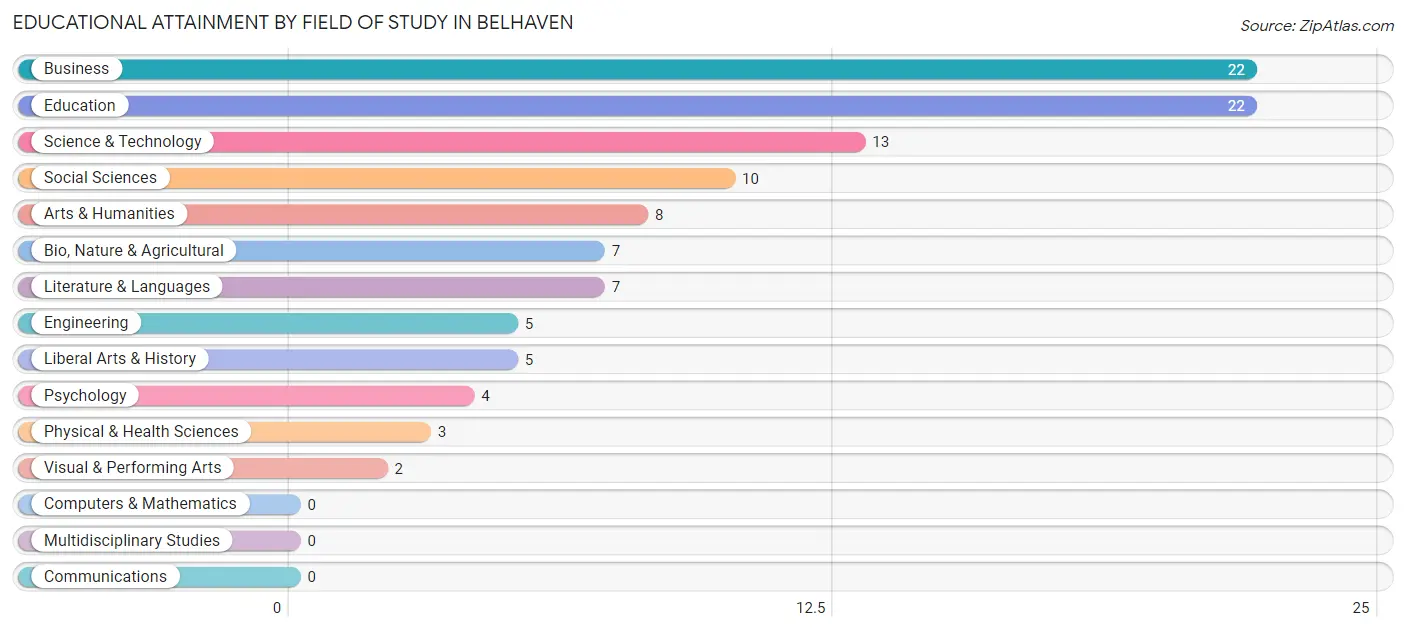
| Field of Study | # Graduates | % Graduates |
| Computers & Mathematics | 0 | 0.0% |
| Bio, Nature & Agricultural | 7 | 6.5% |
| Physical & Health Sciences | 3 | 2.8% |
| Psychology | 4 | 3.7% |
| Social Sciences | 10 | 9.3% |
| Engineering | 5 | 4.6% |
| Multidisciplinary Studies | 0 | 0.0% |
| Science & Technology | 13 | 12.0% |
| Business | 22 | 20.4% |
| Education | 22 | 20.4% |
| Literature & Languages | 7 | 6.5% |
| Liberal Arts & History | 5 | 4.6% |
| Visual & Performing Arts | 2 | 1.8% |
| Communications | 0 | 0.0% |
| Arts & Humanities | 8 | 7.4% |
| Total | 108 | 100.0% |
Transportation & Commute in Belhaven
Vehicle Availability by Sex in Belhaven
The most prevalent vehicle ownership categories in Belhaven are males with 2 vehicles (112, accounting for 49.3%) and females with 2 vehicles (70, making up 54.1%).
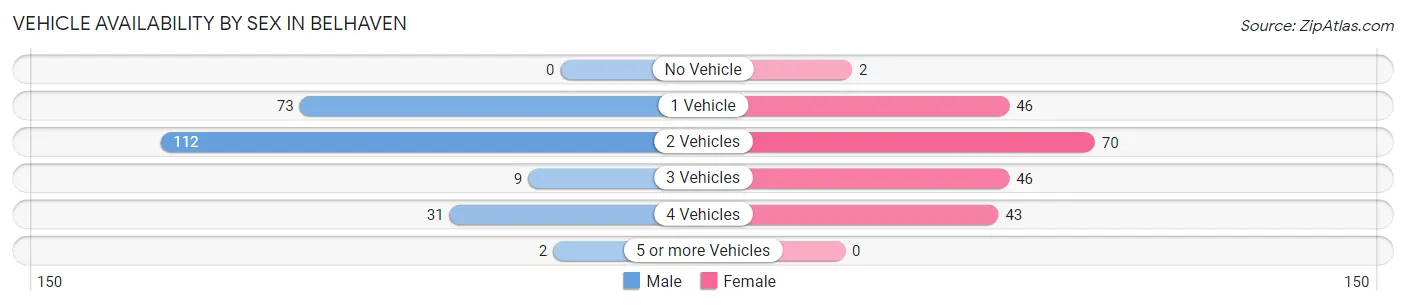
| Vehicles Available | Male | Female |
| No Vehicle | 0 (0.0%) | 2 (1.0%) |
| 1 Vehicle | 73 (32.2%) | 46 (22.2%) |
| 2 Vehicles | 112 (49.3%) | 70 (33.8%) |
| 3 Vehicles | 9 (4.0%) | 46 (22.2%) |
| 4 Vehicles | 31 (13.7%) | 43 (20.8%) |
| 5 or more Vehicles | 2 (0.9%) | 0 (0.0%) |
| Total | 227 (100.0%) | 207 (100.0%) |
Commute Time in Belhaven
The most frequently occuring commute durations in Belhaven are 5 to 9 minutes (98 commuters, 23.6%), 10 to 14 minutes (83 commuters, 20.0%), and 20 to 24 minutes (68 commuters, 16.4%).
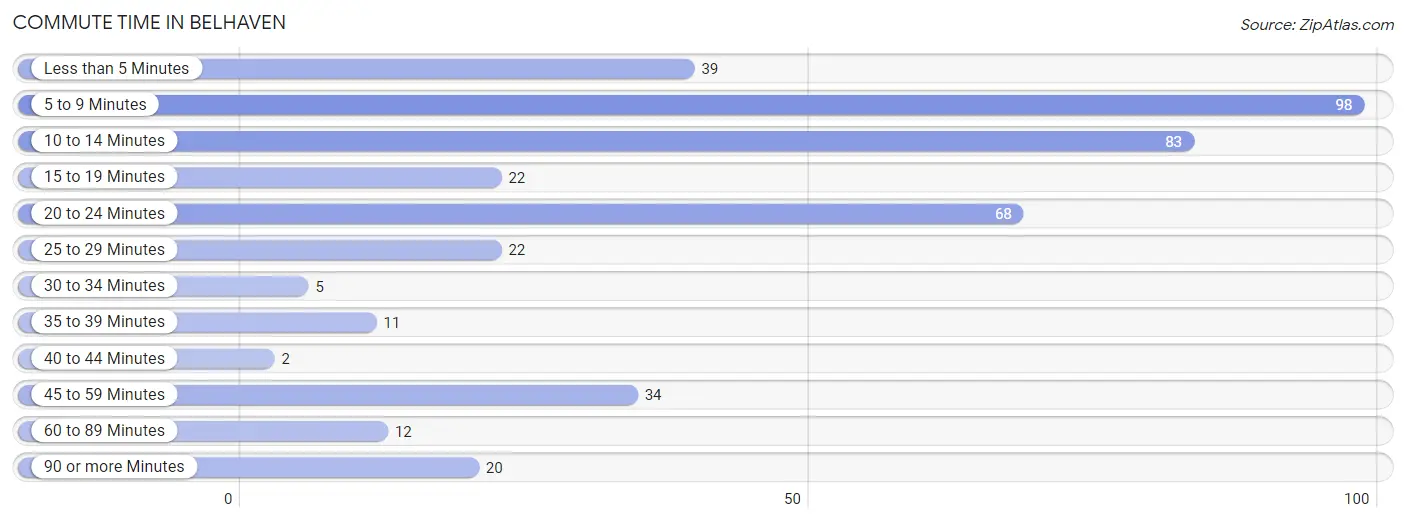
| Commute Time | # Commuters | % Commuters |
| Less than 5 Minutes | 39 | 9.4% |
| 5 to 9 Minutes | 98 | 23.6% |
| 10 to 14 Minutes | 83 | 20.0% |
| 15 to 19 Minutes | 22 | 5.3% |
| 20 to 24 Minutes | 68 | 16.4% |
| 25 to 29 Minutes | 22 | 5.3% |
| 30 to 34 Minutes | 5 | 1.2% |
| 35 to 39 Minutes | 11 | 2.6% |
| 40 to 44 Minutes | 2 | 0.5% |
| 45 to 59 Minutes | 34 | 8.2% |
| 60 to 89 Minutes | 12 | 2.9% |
| 90 or more Minutes | 20 | 4.8% |
Commute Time by Sex in Belhaven
The most common commute times in Belhaven are 5 to 9 minutes (59 commuters, 28.0%) for males and 10 to 14 minutes (49 commuters, 23.9%) for females.
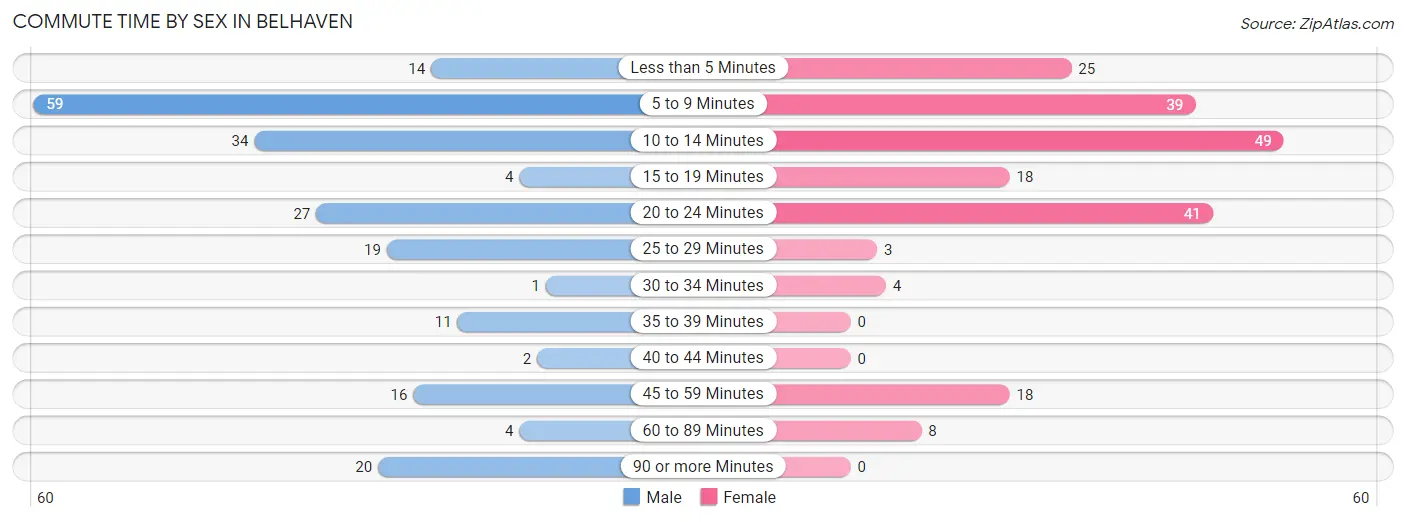
| Commute Time | Male | Female |
| Less than 5 Minutes | 14 (6.6%) | 25 (12.2%) |
| 5 to 9 Minutes | 59 (28.0%) | 39 (19.0%) |
| 10 to 14 Minutes | 34 (16.1%) | 49 (23.9%) |
| 15 to 19 Minutes | 4 (1.9%) | 18 (8.8%) |
| 20 to 24 Minutes | 27 (12.8%) | 41 (20.0%) |
| 25 to 29 Minutes | 19 (9.0%) | 3 (1.5%) |
| 30 to 34 Minutes | 1 (0.5%) | 4 (1.9%) |
| 35 to 39 Minutes | 11 (5.2%) | 0 (0.0%) |
| 40 to 44 Minutes | 2 (0.9%) | 0 (0.0%) |
| 45 to 59 Minutes | 16 (7.6%) | 18 (8.8%) |
| 60 to 89 Minutes | 4 (1.9%) | 8 (3.9%) |
| 90 or more Minutes | 20 (9.5%) | 0 (0.0%) |
Time of Departure to Work by Sex in Belhaven
The most frequent times of departure to work in Belhaven are 7:00 AM to 7:29 AM (55, 26.1%) for males and 8:30 AM to 8:59 AM (44, 21.5%) for females.
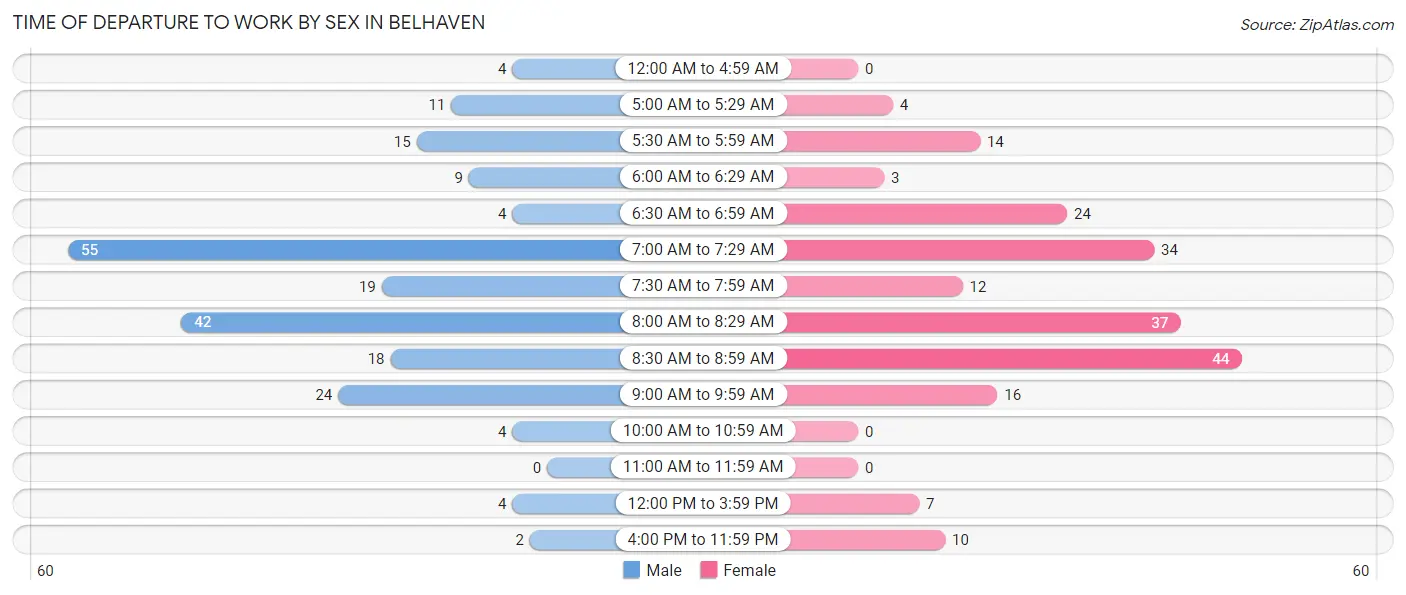
| Time of Departure | Male | Female |
| 12:00 AM to 4:59 AM | 4 (1.9%) | 0 (0.0%) |
| 5:00 AM to 5:29 AM | 11 (5.2%) | 4 (1.9%) |
| 5:30 AM to 5:59 AM | 15 (7.1%) | 14 (6.8%) |
| 6:00 AM to 6:29 AM | 9 (4.3%) | 3 (1.5%) |
| 6:30 AM to 6:59 AM | 4 (1.9%) | 24 (11.7%) |
| 7:00 AM to 7:29 AM | 55 (26.1%) | 34 (16.6%) |
| 7:30 AM to 7:59 AM | 19 (9.0%) | 12 (5.9%) |
| 8:00 AM to 8:29 AM | 42 (19.9%) | 37 (18.0%) |
| 8:30 AM to 8:59 AM | 18 (8.5%) | 44 (21.5%) |
| 9:00 AM to 9:59 AM | 24 (11.4%) | 16 (7.8%) |
| 10:00 AM to 10:59 AM | 4 (1.9%) | 0 (0.0%) |
| 11:00 AM to 11:59 AM | 0 (0.0%) | 0 (0.0%) |
| 12:00 PM to 3:59 PM | 4 (1.9%) | 7 (3.4%) |
| 4:00 PM to 11:59 PM | 2 (0.9%) | 10 (4.9%) |
| Total | 211 (100.0%) | 205 (100.0%) |
Housing Occupancy in Belhaven
Occupancy by Ownership in Belhaven
Of the total 582 dwellings in Belhaven, owner-occupied units account for 335 (57.6%), while renter-occupied units make up 247 (42.4%).
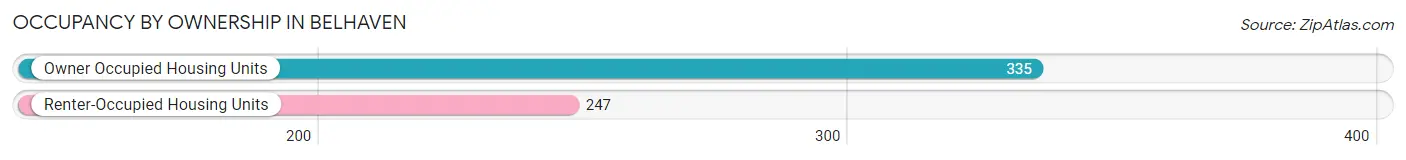
| Occupancy | # Housing Units | % Housing Units |
| Owner Occupied Housing Units | 335 | 57.6% |
| Renter-Occupied Housing Units | 247 | 42.4% |
| Total Occupied Housing Units | 582 | 100.0% |
Occupancy by Household Size in Belhaven
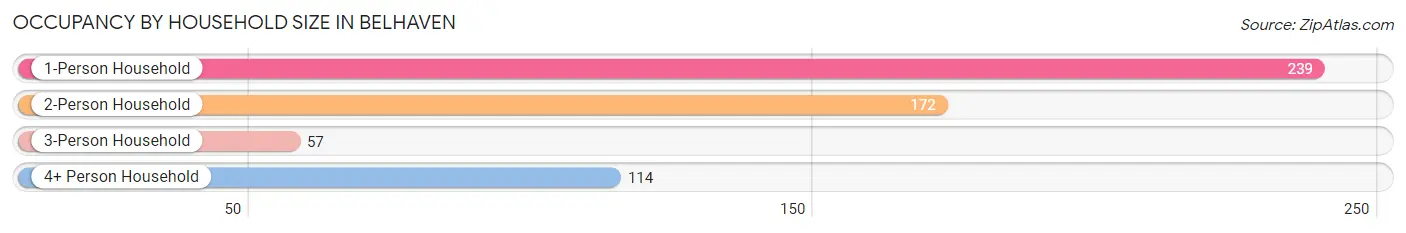
| Household Size | # Housing Units | % Housing Units |
| 1-Person Household | 239 | 41.1% |
| 2-Person Household | 172 | 29.5% |
| 3-Person Household | 57 | 9.8% |
| 4+ Person Household | 114 | 19.6% |
| Total Housing Units | 582 | 100.0% |
Occupancy by Ownership by Household Size in Belhaven
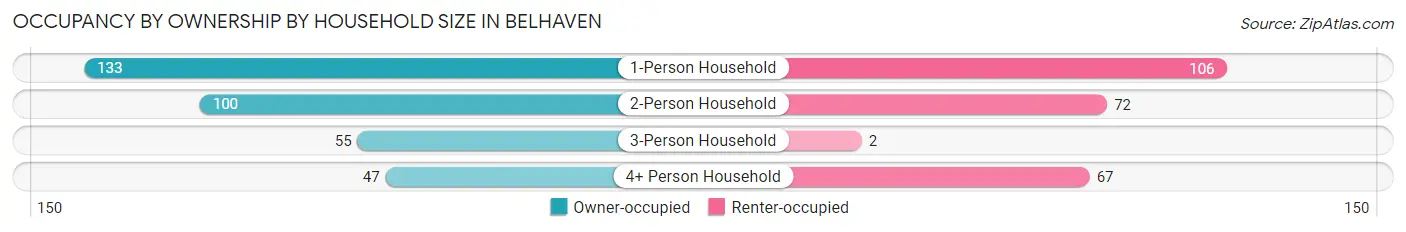
| Household Size | Owner-occupied | Renter-occupied |
| 1-Person Household | 133 (55.6%) | 106 (44.4%) |
| 2-Person Household | 100 (58.1%) | 72 (41.9%) |
| 3-Person Household | 55 (96.5%) | 2 (3.5%) |
| 4+ Person Household | 47 (41.2%) | 67 (58.8%) |
| Total Housing Units | 335 (57.6%) | 247 (42.4%) |
Occupancy by Educational Attainment in Belhaven
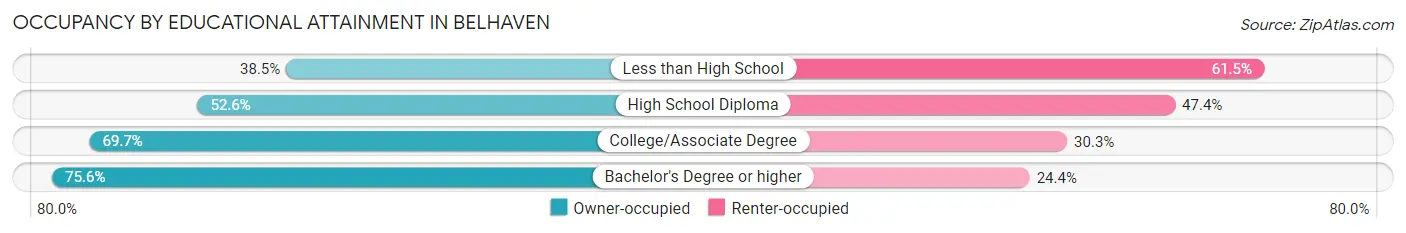
| Household Size | Owner-occupied | Renter-occupied |
| Less than High School | 52 (38.5%) | 83 (61.5%) |
| High School Diploma | 102 (52.6%) | 92 (47.4%) |
| College/Associate Degree | 122 (69.7%) | 53 (30.3%) |
| Bachelor's Degree or higher | 59 (75.6%) | 19 (24.4%) |
Occupancy by Age of Householder in Belhaven
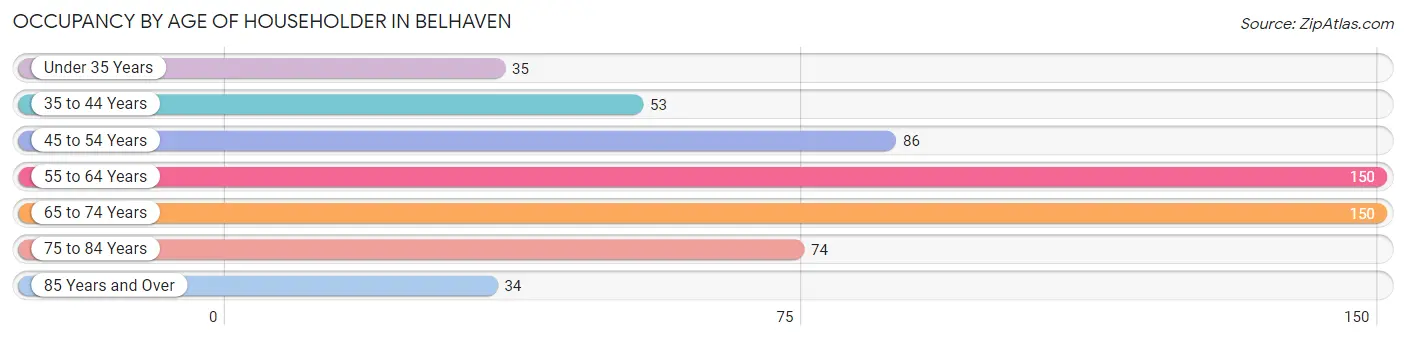
| Age Bracket | # Households | % Households |
| Under 35 Years | 35 | 6.0% |
| 35 to 44 Years | 53 | 9.1% |
| 45 to 54 Years | 86 | 14.8% |
| 55 to 64 Years | 150 | 25.8% |
| 65 to 74 Years | 150 | 25.8% |
| 75 to 84 Years | 74 | 12.7% |
| 85 Years and Over | 34 | 5.8% |
| Total | 582 | 100.0% |
Housing Finances in Belhaven
Median Income by Occupancy in Belhaven
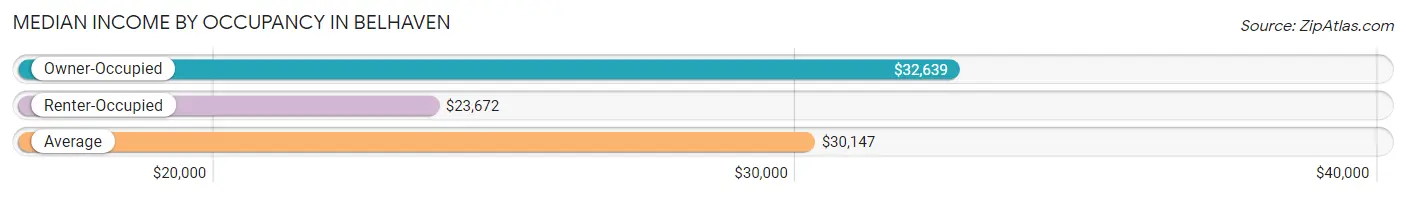
| Occupancy Type | # Households | Median Income |
| Owner-Occupied | 335 (57.6%) | $32,639 |
| Renter-Occupied | 247 (42.4%) | $23,672 |
| Average | 582 (100.0%) | $30,147 |
Occupancy by Householder Income Bracket in Belhaven
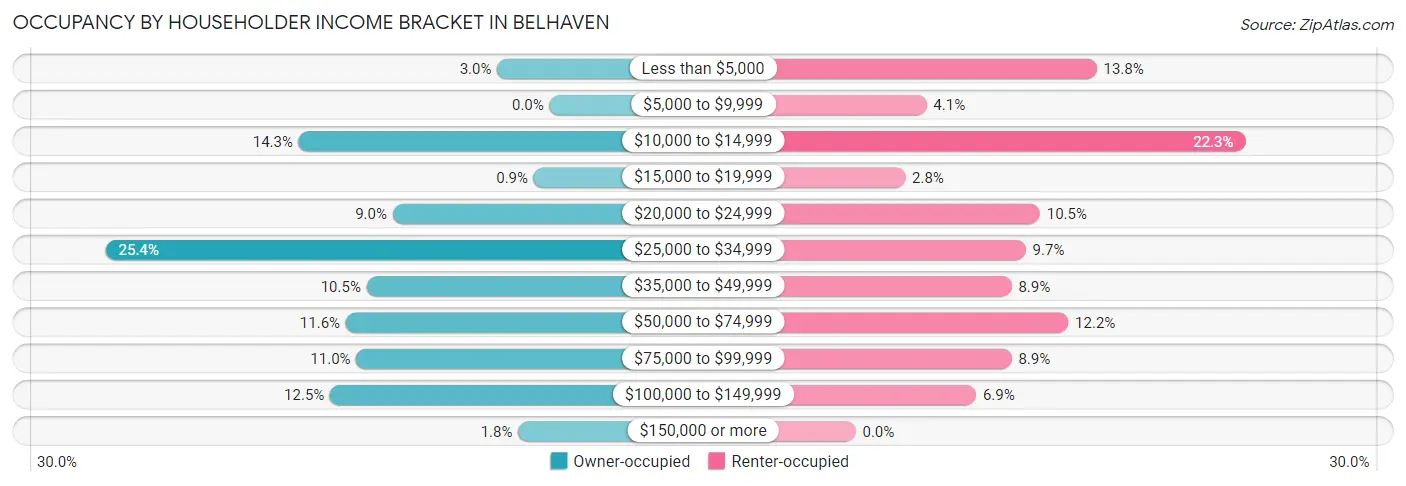
| Income Bracket | Owner-occupied | Renter-occupied |
| Less than $5,000 | 10 (3.0%) | 34 (13.8%) |
| $5,000 to $9,999 | 0 (0.0%) | 10 (4.1%) |
| $10,000 to $14,999 | 48 (14.3%) | 55 (22.3%) |
| $15,000 to $19,999 | 3 (0.9%) | 7 (2.8%) |
| $20,000 to $24,999 | 30 (9.0%) | 26 (10.5%) |
| $25,000 to $34,999 | 85 (25.4%) | 24 (9.7%) |
| $35,000 to $49,999 | 35 (10.4%) | 22 (8.9%) |
| $50,000 to $74,999 | 39 (11.6%) | 30 (12.1%) |
| $75,000 to $99,999 | 37 (11.0%) | 22 (8.9%) |
| $100,000 to $149,999 | 42 (12.5%) | 17 (6.9%) |
| $150,000 or more | 6 (1.8%) | 0 (0.0%) |
| Total | 335 (100.0%) | 247 (100.0%) |
Monthly Housing Cost Tiers in Belhaven
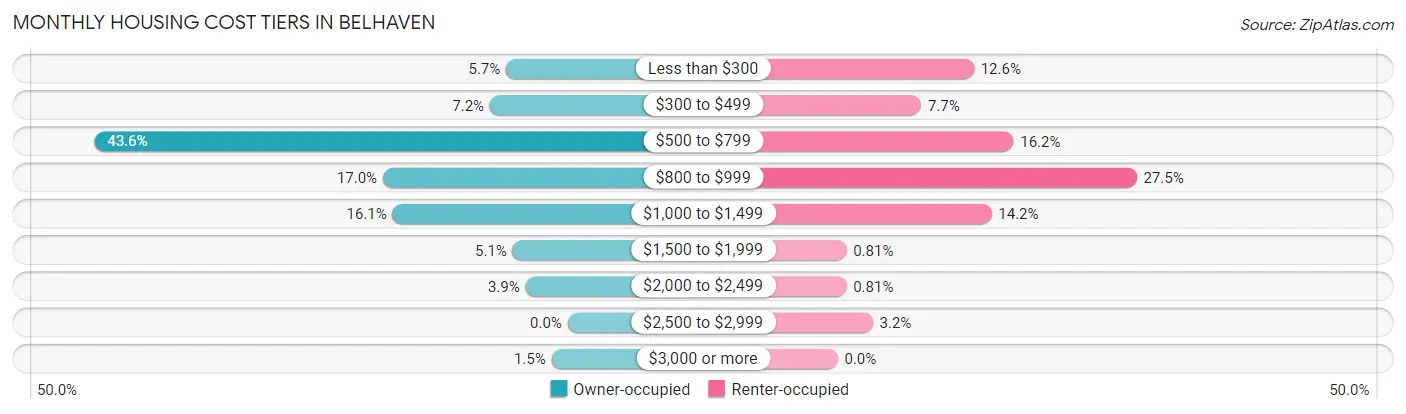
| Monthly Cost | Owner-occupied | Renter-occupied |
| Less than $300 | 19 (5.7%) | 31 (12.6%) |
| $300 to $499 | 24 (7.2%) | 19 (7.7%) |
| $500 to $799 | 146 (43.6%) | 40 (16.2%) |
| $800 to $999 | 57 (17.0%) | 68 (27.5%) |
| $1,000 to $1,499 | 54 (16.1%) | 35 (14.2%) |
| $1,500 to $1,999 | 17 (5.1%) | 2 (0.8%) |
| $2,000 to $2,499 | 13 (3.9%) | 2 (0.8%) |
| $2,500 to $2,999 | 0 (0.0%) | 8 (3.2%) |
| $3,000 or more | 5 (1.5%) | 0 (0.0%) |
| Total | 335 (100.0%) | 247 (100.0%) |
Physical Housing Characteristics in Belhaven
Housing Structures in Belhaven
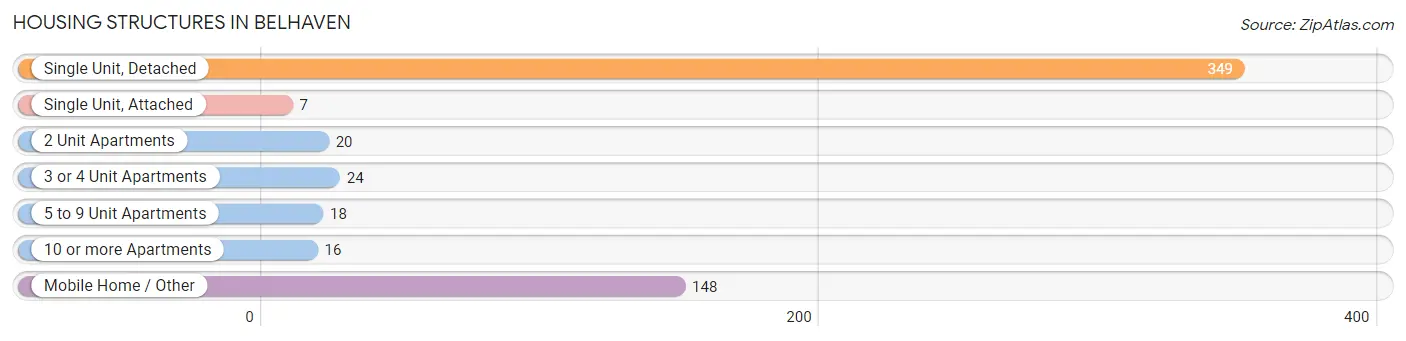
| Structure Type | # Housing Units | % Housing Units |
| Single Unit, Detached | 349 | 60.0% |
| Single Unit, Attached | 7 | 1.2% |
| 2 Unit Apartments | 20 | 3.4% |
| 3 or 4 Unit Apartments | 24 | 4.1% |
| 5 to 9 Unit Apartments | 18 | 3.1% |
| 10 or more Apartments | 16 | 2.8% |
| Mobile Home / Other | 148 | 25.4% |
| Total | 582 | 100.0% |
Housing Structures by Occupancy in Belhaven
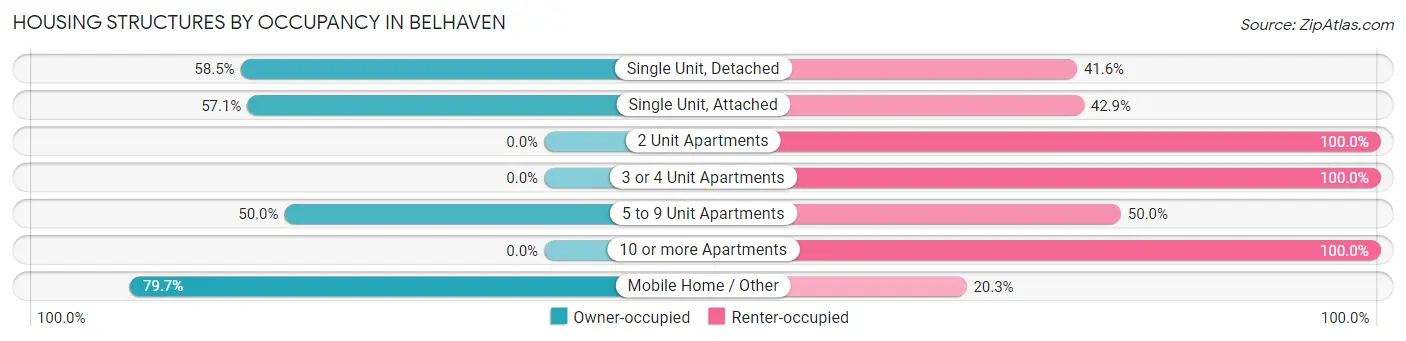
| Structure Type | Owner-occupied | Renter-occupied |
| Single Unit, Detached | 204 (58.5%) | 145 (41.5%) |
| Single Unit, Attached | 4 (57.1%) | 3 (42.9%) |
| 2 Unit Apartments | 0 (0.0%) | 20 (100.0%) |
| 3 or 4 Unit Apartments | 0 (0.0%) | 24 (100.0%) |
| 5 to 9 Unit Apartments | 9 (50.0%) | 9 (50.0%) |
| 10 or more Apartments | 0 (0.0%) | 16 (100.0%) |
| Mobile Home / Other | 118 (79.7%) | 30 (20.3%) |
| Total | 335 (57.6%) | 247 (42.4%) |
Housing Structures by Number of Rooms in Belhaven
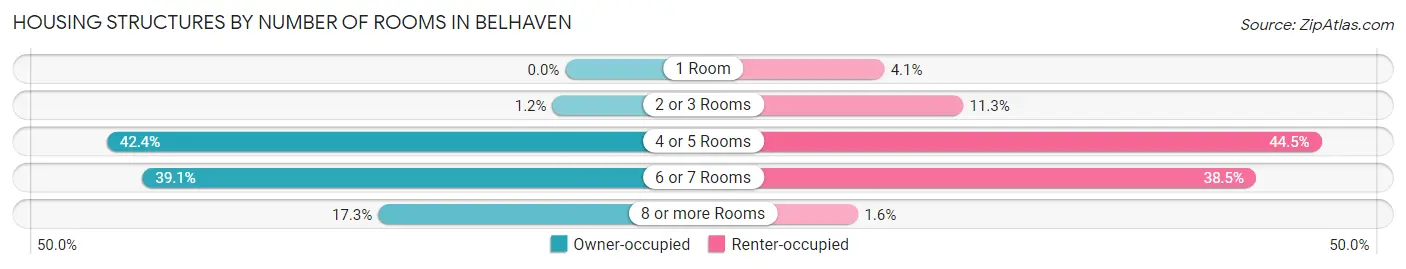
| Number of Rooms | Owner-occupied | Renter-occupied |
| 1 Room | 0 (0.0%) | 10 (4.1%) |
| 2 or 3 Rooms | 4 (1.2%) | 28 (11.3%) |
| 4 or 5 Rooms | 142 (42.4%) | 110 (44.5%) |
| 6 or 7 Rooms | 131 (39.1%) | 95 (38.5%) |
| 8 or more Rooms | 58 (17.3%) | 4 (1.6%) |
| Total | 335 (100.0%) | 247 (100.0%) |
Housing Structure by Heating Type in Belhaven
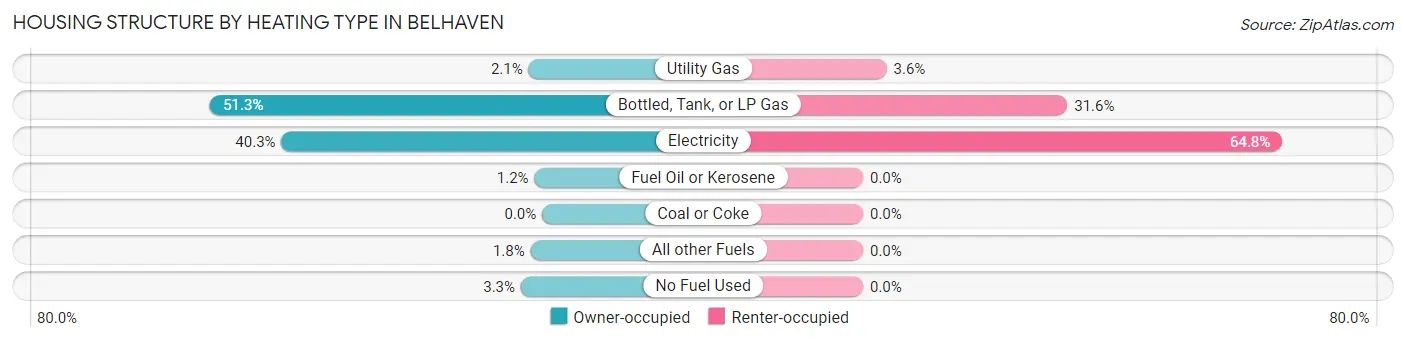
| Heating Type | Owner-occupied | Renter-occupied |
| Utility Gas | 7 (2.1%) | 9 (3.6%) |
| Bottled, Tank, or LP Gas | 172 (51.3%) | 78 (31.6%) |
| Electricity | 135 (40.3%) | 160 (64.8%) |
| Fuel Oil or Kerosene | 4 (1.2%) | 0 (0.0%) |
| Coal or Coke | 0 (0.0%) | 0 (0.0%) |
| All other Fuels | 6 (1.8%) | 0 (0.0%) |
| No Fuel Used | 11 (3.3%) | 0 (0.0%) |
| Total | 335 (100.0%) | 247 (100.0%) |
Household Vehicle Usage in Belhaven
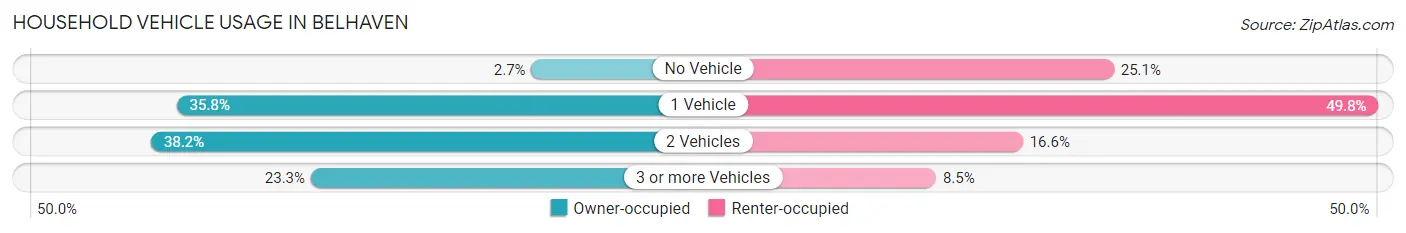
| Vehicles per Household | Owner-occupied | Renter-occupied |
| No Vehicle | 9 (2.7%) | 62 (25.1%) |
| 1 Vehicle | 120 (35.8%) | 123 (49.8%) |
| 2 Vehicles | 128 (38.2%) | 41 (16.6%) |
| 3 or more Vehicles | 78 (23.3%) | 21 (8.5%) |
| Total | 335 (100.0%) | 247 (100.0%) |
Real Estate & Mortgages in Belhaven
Real Estate and Mortgage Overview in Belhaven
| Characteristic | Without Mortgage | With Mortgage |
| Housing Units | 217 | 118 |
| Median Property Value | $91,900 | $109,200 |
| Median Household Income | $31,211 | $0 |
| Monthly Housing Costs | $612 | $5 |
| Real Estate Taxes | $770 | $0 |
Property Value by Mortgage Status in Belhaven
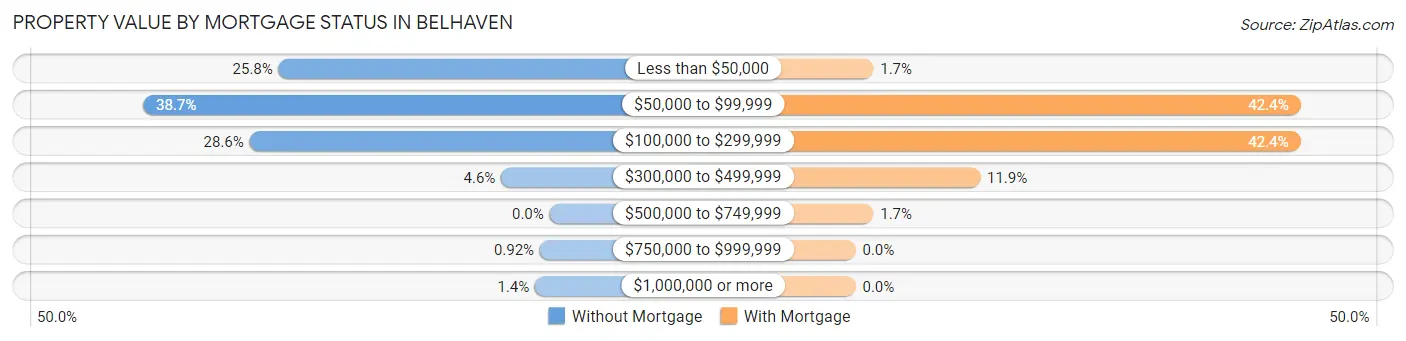
| Property Value | Without Mortgage | With Mortgage |
| Less than $50,000 | 56 (25.8%) | 2 (1.7%) |
| $50,000 to $99,999 | 84 (38.7%) | 50 (42.4%) |
| $100,000 to $299,999 | 62 (28.6%) | 50 (42.4%) |
| $300,000 to $499,999 | 10 (4.6%) | 14 (11.9%) |
| $500,000 to $749,999 | 0 (0.0%) | 2 (1.7%) |
| $750,000 to $999,999 | 2 (0.9%) | 0 (0.0%) |
| $1,000,000 or more | 3 (1.4%) | 0 (0.0%) |
| Total | 217 (100.0%) | 118 (100.0%) |
Household Income by Mortgage Status in Belhaven
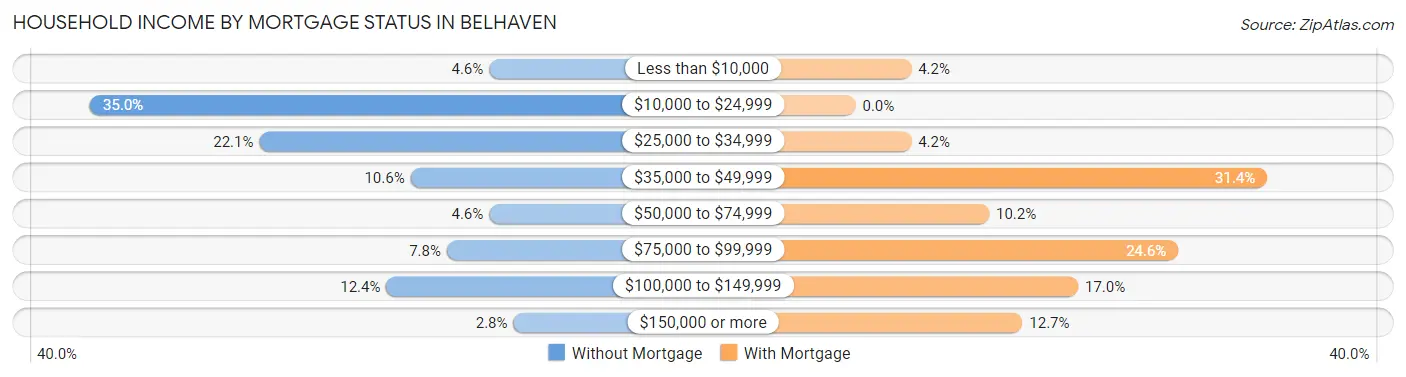
| Household Income | Without Mortgage | With Mortgage |
| Less than $10,000 | 10 (4.6%) | 5 (4.2%) |
| $10,000 to $24,999 | 76 (35.0%) | 0 (0.0%) |
| $25,000 to $34,999 | 48 (22.1%) | 5 (4.2%) |
| $35,000 to $49,999 | 23 (10.6%) | 37 (31.4%) |
| $50,000 to $74,999 | 10 (4.6%) | 12 (10.2%) |
| $75,000 to $99,999 | 17 (7.8%) | 29 (24.6%) |
| $100,000 to $149,999 | 27 (12.4%) | 20 (17.0%) |
| $150,000 or more | 6 (2.8%) | 15 (12.7%) |
| Total | 217 (100.0%) | 118 (100.0%) |
Property Value to Household Income Ratio in Belhaven
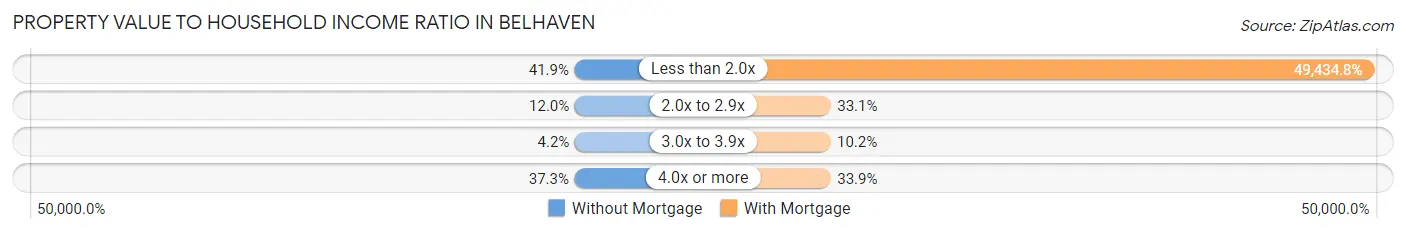
| Value-to-Income Ratio | Without Mortgage | With Mortgage |
| Less than 2.0x | 91 (41.9%) | 58,333 (49,434.8%) |
| 2.0x to 2.9x | 26 (12.0%) | 39 (33.1%) |
| 3.0x to 3.9x | 9 (4.2%) | 12 (10.2%) |
| 4.0x or more | 81 (37.3%) | 40 (33.9%) |
| Total | 217 (100.0%) | 118 (100.0%) |
Real Estate Taxes by Mortgage Status in Belhaven
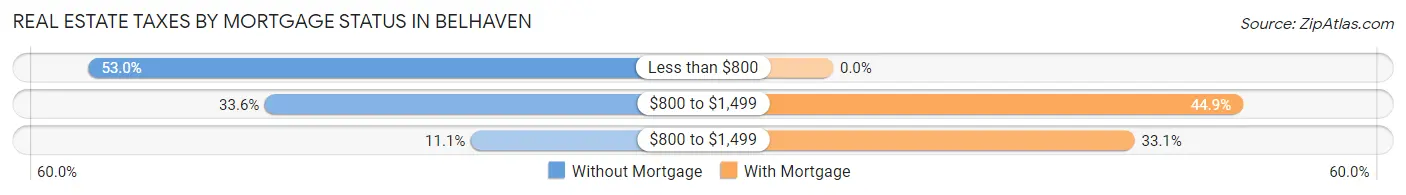
| Property Taxes | Without Mortgage | With Mortgage |
| Less than $800 | 115 (53.0%) | 0 (0.0%) |
| $800 to $1,499 | 73 (33.6%) | 53 (44.9%) |
| $800 to $1,499 | 24 (11.1%) | 39 (33.1%) |
| Total | 217 (100.0%) | 118 (100.0%) |
Health & Disability in Belhaven
Health Insurance Coverage by Age in Belhaven
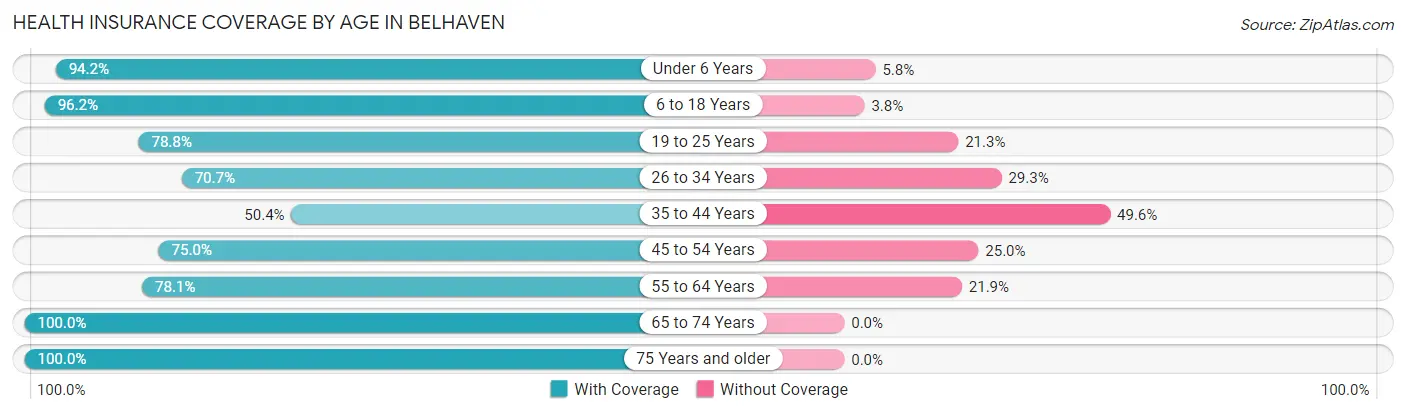
| Age Bracket | With Coverage | Without Coverage |
| Under 6 Years | 81 (94.2%) | 5 (5.8%) |
| 6 to 18 Years | 205 (96.2%) | 8 (3.8%) |
| 19 to 25 Years | 63 (78.7%) | 17 (21.2%) |
| 26 to 34 Years | 82 (70.7%) | 34 (29.3%) |
| 35 to 44 Years | 59 (50.4%) | 58 (49.6%) |
| 45 to 54 Years | 141 (75.0%) | 47 (25.0%) |
| 55 to 64 Years | 171 (78.1%) | 48 (21.9%) |
| 65 to 74 Years | 195 (100.0%) | 0 (0.0%) |
| 75 Years and older | 161 (100.0%) | 0 (0.0%) |
| Total | 1,158 (84.2%) | 217 (15.8%) |
Health Insurance Coverage by Citizenship Status in Belhaven
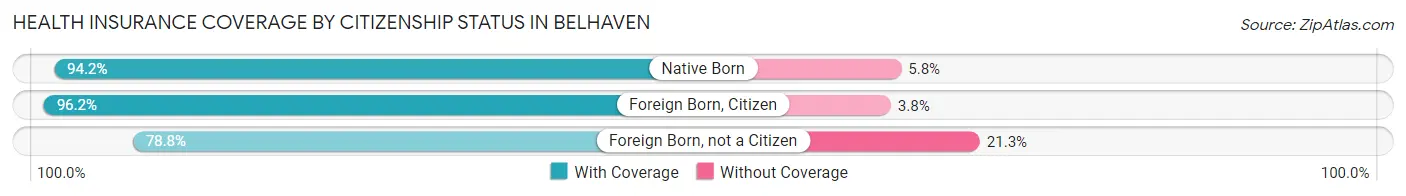
| Citizenship Status | With Coverage | Without Coverage |
| Native Born | 81 (94.2%) | 5 (5.8%) |
| Foreign Born, Citizen | 205 (96.2%) | 8 (3.8%) |
| Foreign Born, not a Citizen | 63 (78.7%) | 17 (21.2%) |
Health Insurance Coverage by Household Income in Belhaven
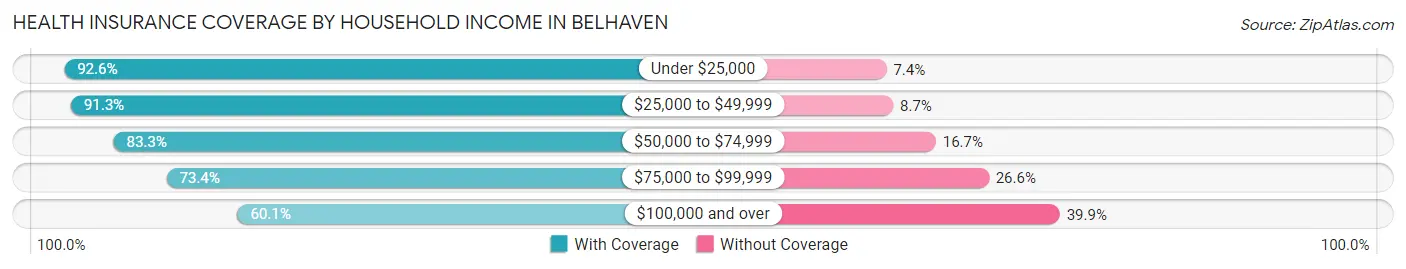
| Household Income | With Coverage | Without Coverage |
| Under $25,000 | 386 (92.6%) | 31 (7.4%) |
| $25,000 to $49,999 | 368 (91.3%) | 35 (8.7%) |
| $50,000 to $74,999 | 170 (83.3%) | 34 (16.7%) |
| $75,000 to $99,999 | 127 (73.4%) | 46 (26.6%) |
| $100,000 and over | 107 (60.1%) | 71 (39.9%) |
Public vs Private Health Insurance Coverage by Age in Belhaven
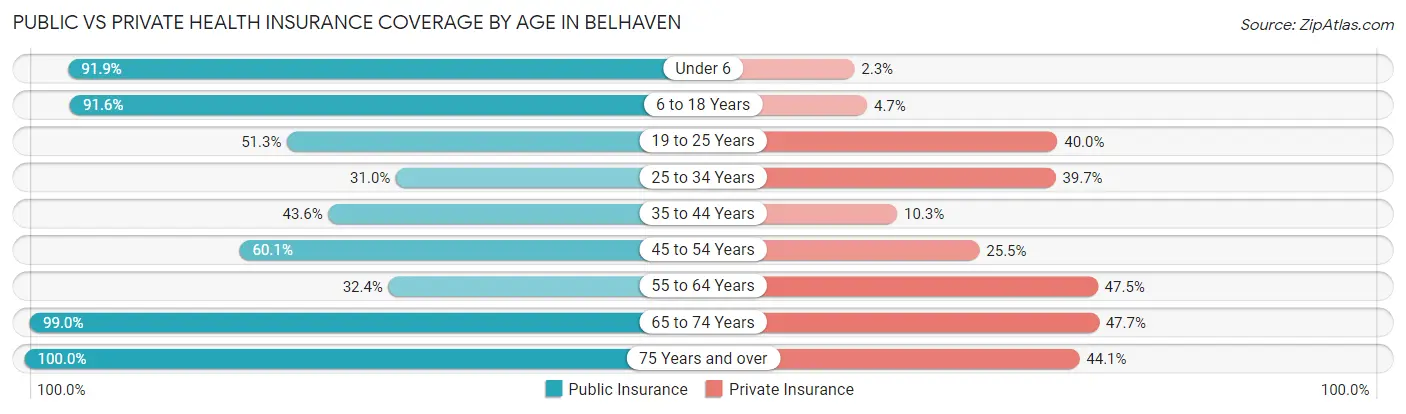
| Age Bracket | Public Insurance | Private Insurance |
| Under 6 | 79 (91.9%) | 2 (2.3%) |
| 6 to 18 Years | 195 (91.5%) | 10 (4.7%) |
| 19 to 25 Years | 41 (51.2%) | 32 (40.0%) |
| 25 to 34 Years | 36 (31.0%) | 46 (39.7%) |
| 35 to 44 Years | 51 (43.6%) | 12 (10.3%) |
| 45 to 54 Years | 113 (60.1%) | 48 (25.5%) |
| 55 to 64 Years | 71 (32.4%) | 104 (47.5%) |
| 65 to 74 Years | 193 (99.0%) | 93 (47.7%) |
| 75 Years and over | 161 (100.0%) | 71 (44.1%) |
| Total | 940 (68.4%) | 418 (30.4%) |
Disability Status by Sex by Age in Belhaven
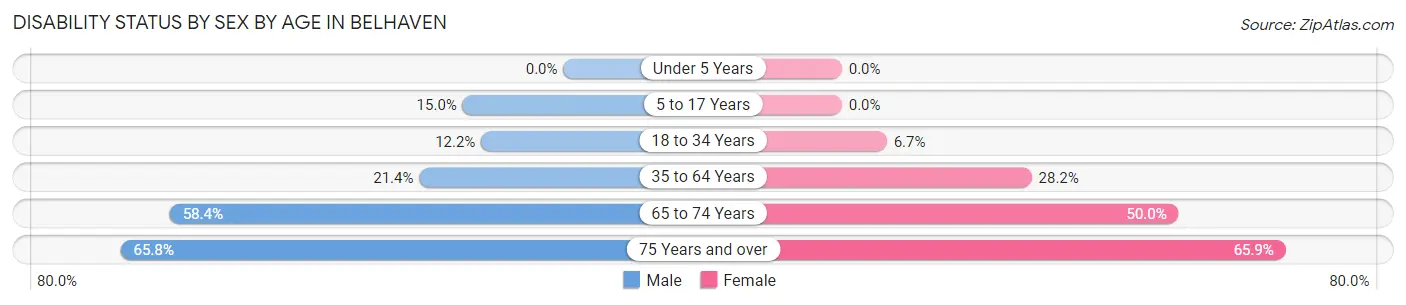
| Age Bracket | Male | Female |
| Under 5 Years | 0 (0.0%) | 0 (0.0%) |
| 5 to 17 Years | 16 (14.9%) | 0 (0.0%) |
| 18 to 34 Years | 15 (12.2%) | 5 (6.7%) |
| 35 to 64 Years | 40 (21.4%) | 95 (28.2%) |
| 65 to 74 Years | 45 (58.4%) | 59 (50.0%) |
| 75 Years and over | 48 (65.7%) | 58 (65.9%) |
Disability Class by Sex by Age in Belhaven
Disability Class: Hearing Difficulty
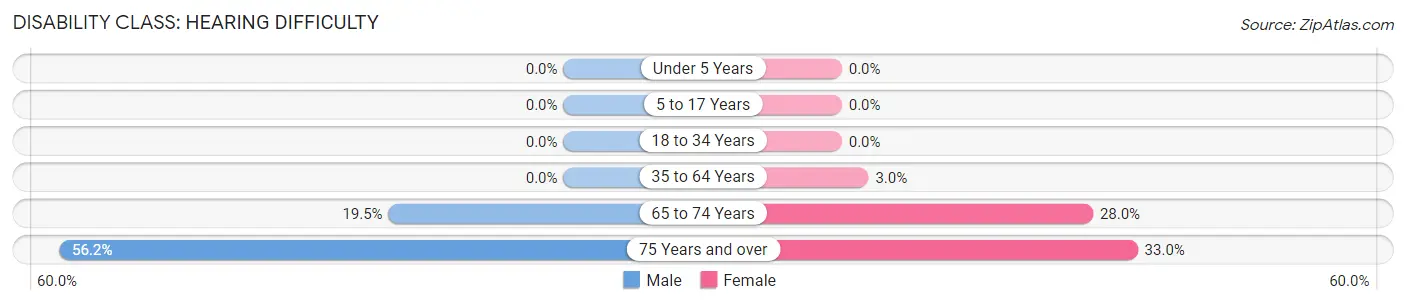
| Age Bracket | Male | Female |
| Under 5 Years | 0 (0.0%) | 0 (0.0%) |
| 5 to 17 Years | 0 (0.0%) | 0 (0.0%) |
| 18 to 34 Years | 0 (0.0%) | 0 (0.0%) |
| 35 to 64 Years | 0 (0.0%) | 10 (3.0%) |
| 65 to 74 Years | 15 (19.5%) | 33 (28.0%) |
| 75 Years and over | 41 (56.2%) | 29 (33.0%) |
Disability Class: Vision Difficulty
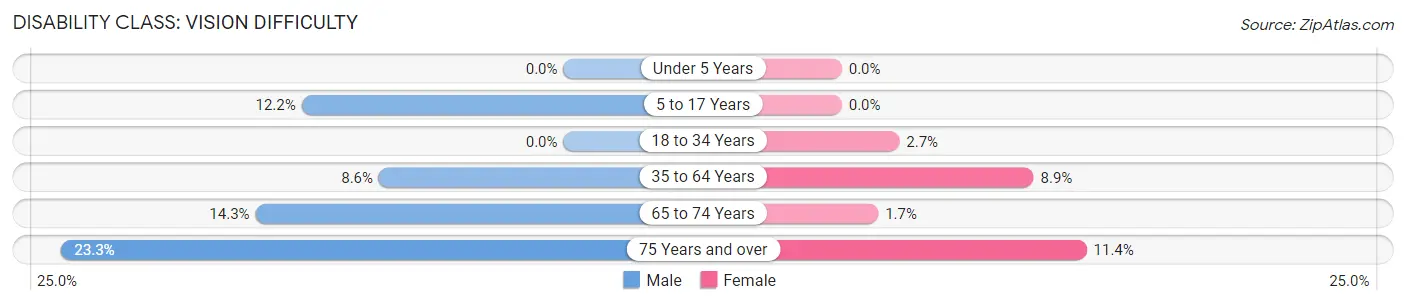
| Age Bracket | Male | Female |
| Under 5 Years | 0 (0.0%) | 0 (0.0%) |
| 5 to 17 Years | 13 (12.1%) | 0 (0.0%) |
| 18 to 34 Years | 0 (0.0%) | 2 (2.7%) |
| 35 to 64 Years | 16 (8.6%) | 30 (8.9%) |
| 65 to 74 Years | 11 (14.3%) | 2 (1.7%) |
| 75 Years and over | 17 (23.3%) | 10 (11.4%) |
Disability Class: Cognitive Difficulty
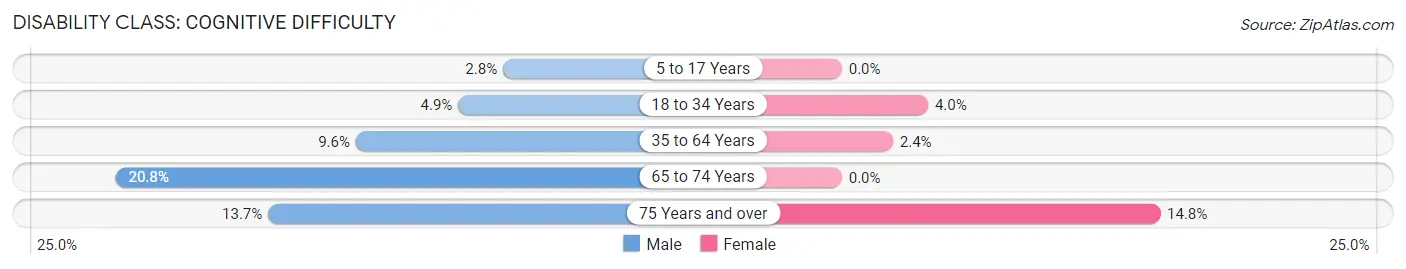
| Age Bracket | Male | Female |
| 5 to 17 Years | 3 (2.8%) | 0 (0.0%) |
| 18 to 34 Years | 6 (4.9%) | 3 (4.0%) |
| 35 to 64 Years | 18 (9.6%) | 8 (2.4%) |
| 65 to 74 Years | 16 (20.8%) | 0 (0.0%) |
| 75 Years and over | 10 (13.7%) | 13 (14.8%) |
Disability Class: Ambulatory Difficulty
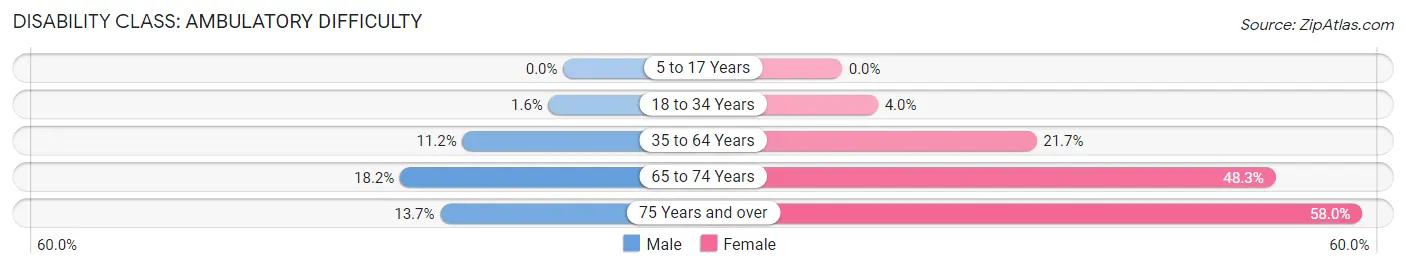
| Age Bracket | Male | Female |
| 5 to 17 Years | 0 (0.0%) | 0 (0.0%) |
| 18 to 34 Years | 2 (1.6%) | 3 (4.0%) |
| 35 to 64 Years | 21 (11.2%) | 73 (21.7%) |
| 65 to 74 Years | 14 (18.2%) | 57 (48.3%) |
| 75 Years and over | 10 (13.7%) | 51 (58.0%) |
Disability Class: Self-Care Difficulty
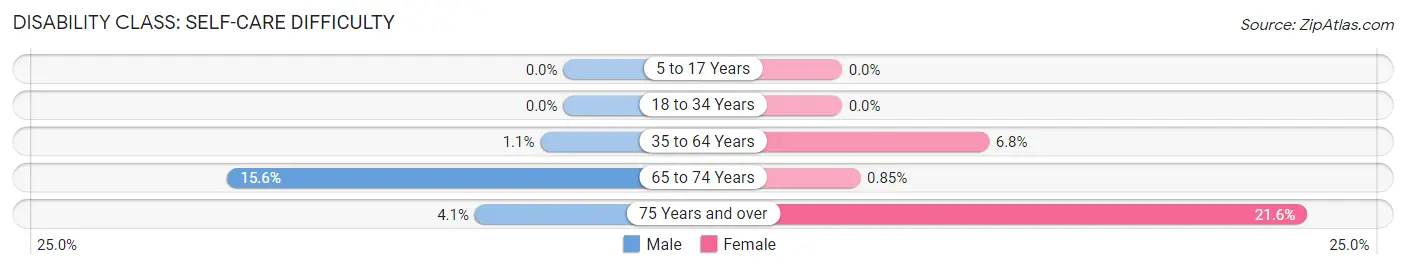
| Age Bracket | Male | Female |
| 5 to 17 Years | 0 (0.0%) | 0 (0.0%) |
| 18 to 34 Years | 0 (0.0%) | 0 (0.0%) |
| 35 to 64 Years | 2 (1.1%) | 23 (6.8%) |
| 65 to 74 Years | 12 (15.6%) | 1 (0.9%) |
| 75 Years and over | 3 (4.1%) | 19 (21.6%) |
Technology Access in Belhaven
Computing Device Access in Belhaven
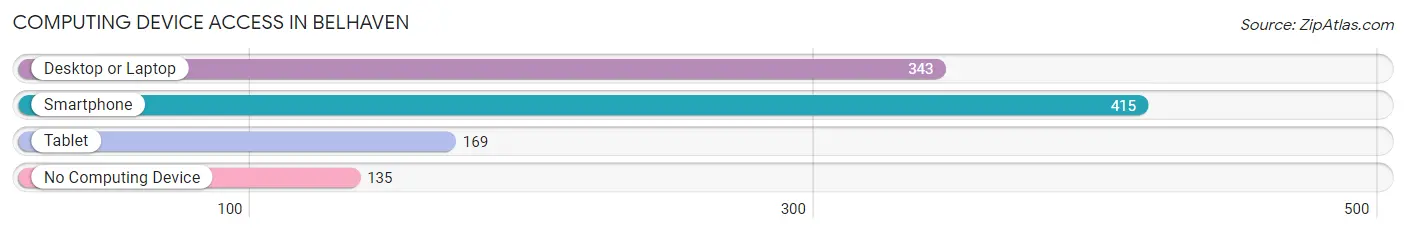
| Device Type | # Households | % Households |
| Desktop or Laptop | 343 | 58.9% |
| Smartphone | 415 | 71.3% |
| Tablet | 169 | 29.0% |
| No Computing Device | 135 | 23.2% |
| Total | 582 | 100.0% |
Internet Access in Belhaven
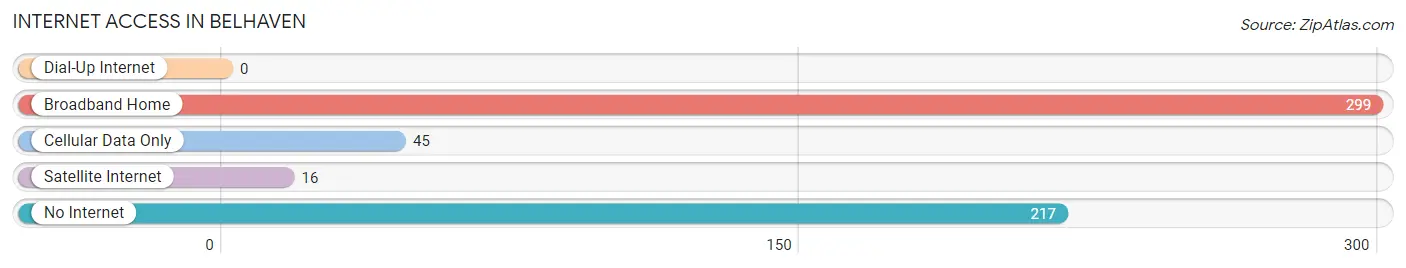
| Internet Type | # Households | % Households |
| Dial-Up Internet | 0 | 0.0% |
| Broadband Home | 299 | 51.4% |
| Cellular Data Only | 45 | 7.7% |
| Satellite Internet | 16 | 2.8% |
| No Internet | 217 | 37.3% |
| Total | 582 | 100.0% |
Belhaven Summary
Belhaven, North Carolina is a small town located in the northeastern corner of the state, in Beaufort County. It is situated on the banks of the Pamlico River, and is part of the Inner Banks region of North Carolina. The town has a population of 1,687 as of the 2010 census, and is the county seat of Beaufort County.
Geography
Belhaven is located at 35°31'N, 76°37'W, and is situated on the banks of the Pamlico River. The town is located in the Inner Banks region of North Carolina, and is part of the Albemarle-Pamlico Estuarine System. The town is bordered by the towns of Aurora to the north, Pantego to the east, and Washington to the south. The town is located approximately 40 miles east of Greenville, and is approximately 90 miles east of Raleigh.
The town is situated on a flat coastal plain, and is surrounded by a mix of farmland, forests, and wetlands. The town is located in a humid subtropical climate zone, and experiences hot, humid summers and mild winters. The average annual temperature is around 70°F, and the average annual precipitation is around 50 inches.
History
Belhaven was founded in 1795 by William Bell, a planter from Virginia. The town was originally known as Bell's Haven, and was incorporated in 1883. The town was named after William Bell, and was originally a port town, serving as a major shipping hub for the region. The town was also a major center for the lumber industry, and was home to several sawmills and lumberyards.
The town was also home to several other industries, including a cotton mill, a brickyard, and a cannery. The town was also home to several churches, including the First Baptist Church, which was founded in 1820.
The town was also home to several schools, including the Belhaven Academy, which was founded in 1845. The town was also home to several newspapers, including the Belhaven News, which was founded in 1883.
The town was also home to several notable people, including William Bell, who founded the town, and William Bell Jr., who served as the mayor of Belhaven from 1883 to 1887.
Economy
The economy of Belhaven is largely based on agriculture and tourism. The town is home to several farms, which produce a variety of crops, including corn, soybeans, and cotton. The town is also home to several seafood processing plants, which process a variety of seafood, including shrimp, oysters, and crabs.
The town is also home to several tourist attractions, including the Belhaven Museum, which is housed in the former Belhaven Academy building, and the Belhaven Waterfront Park, which offers a variety of recreational activities, including fishing, boating, and swimming.
Demographics
As of the 2010 census, the population of Belhaven was 1,687. The racial makeup of the town was 79.3% White, 17.2% African American, 0.7% Native American, 0.3% Asian, 0.1% Pacific Islander, 0.7% from other races, and 1.9% from two or more races. Hispanic or Latino of any race were 2.2% of the population.
The median household income in Belhaven was $30,938, and the median family income was $37,917. The per capita income in Belhaven was $17,845. About 17.2% of families and 20.3% of the population were below the poverty line, including 28.3% of those under age 18 and 15.2% of those age 65 or over.
Common Questions
What is Per Capita Income in Belhaven?
Per Capita income in Belhaven is $24,058.
What is the Median Family Income in Belhaven?
Median Family Income in Belhaven is $38,875.
What is the Median Household income in Belhaven?
Median Household Income in Belhaven is $30,147.
What is Income or Wage Gap in Belhaven?
Income or Wage Gap in Belhaven is 49.1%.
Women in Belhaven earn 50.9 cents for every dollar earned by a man.
What is Inequality or Gini Index in Belhaven?
Inequality or Gini Index in Belhaven is 0.56.
What is the Total Population of Belhaven?
Total Population of Belhaven is 1,378.
What is the Total Male Population of Belhaven?
Total Male Population of Belhaven is 599.
What is the Total Female Population of Belhaven?
Total Female Population of Belhaven is 779.
What is the Ratio of Males per 100 Females in Belhaven?
There are 76.89 Males per 100 Females in Belhaven.
What is the Ratio of Females per 100 Males in Belhaven?
There are 130.05 Females per 100 Males in Belhaven.
What is the Median Population Age in Belhaven?
Median Population Age in Belhaven is 50.4 Years.
What is the Average Family Size in Belhaven
Average Family Size in Belhaven is 3.3 People.
What is the Average Household Size in Belhaven
Average Household Size in Belhaven is 2.4 People.
How Large is the Labor Force in Belhaven?
There are 492 People in the Labor Forcein in Belhaven.
What is the Percentage of People in the Labor Force in Belhaven?
44.9% of People are in the Labor Force in Belhaven.
What is the Unemployment Rate in Belhaven?
Unemployment Rate in Belhaven is 11.2%.