Murfreesboro, NC Map & Demographics
Murfreesboro Map
Murfreesboro Overview
$27,672
PER CAPITA INCOME
$55,759
AVG FAMILY INCOME
$42,685
AVG HOUSEHOLD INCOME
45.4%
WAGE / INCOME GAP [ % ]
54.6¢/ $1
WAGE / INCOME GAP [ $ ]
$15,722
FAMILY INCOME DEFICIT
0.54
INEQUALITY / GINI INDEX
2,612
TOTAL POPULATION
1,037
MALE POPULATION
1,575
FEMALE POPULATION
65.84
MALES / 100 FEMALES
151.88
FEMALES / 100 MALES
29.1
MEDIAN AGE
3.1
AVG FAMILY SIZE
2.2
AVG HOUSEHOLD SIZE
1,033
LABOR FORCE [ PEOPLE ]
49.8%
PERCENT IN LABOR FORCE
5.0%
UNEMPLOYMENT RATE
Murfreesboro Zip Codes
Murfreesboro Area Codes
Income in Murfreesboro
Income Overview in Murfreesboro
Per Capita Income in Murfreesboro is $27,672, while median incomes of families and households are $55,759 and $42,685 respectively.
| Characteristic | Number | Measure |
| Per Capita Income | 2,612 | $27,672 |
| Median Family Income | 539 | $55,759 |
| Mean Family Income | 539 | $64,205 |
| Median Household Income | 972 | $42,685 |
| Mean Household Income | 972 | $69,305 |
| Income Deficit | 539 | $15,722 |
| Wage / Income Gap (%) | 2,612 | 45.37% |
| Wage / Income Gap ($) | 2,612 | 54.63¢ per $1 |
| Gini / Inequality Index | 2,612 | 0.54 |
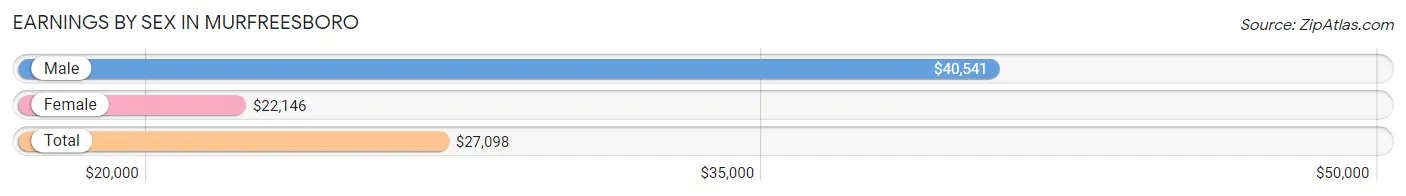
Earnings by Sex in Murfreesboro
Average Earnings in Murfreesboro are $27,098, $40,541 for men and $22,146 for women, a difference of 45.4%.
| Sex | Number | Average Earnings |
| Male | 478 (41.1%) | $40,541 |
| Female | 685 (58.9%) | $22,146 |
| Total | 1,163 (100.0%) | $27,098 |
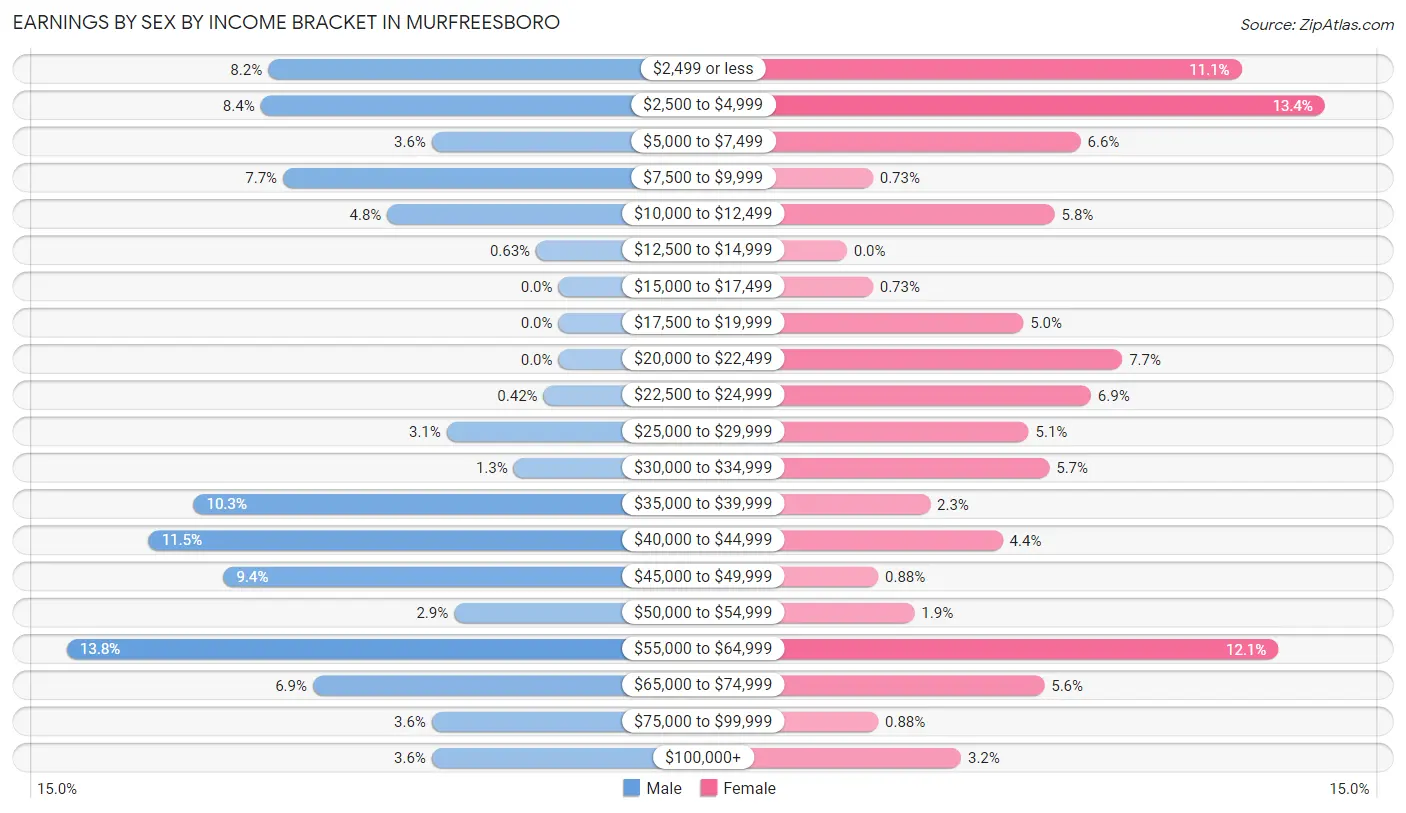
Earnings by Sex by Income Bracket in Murfreesboro
The most common earnings brackets in Murfreesboro are $55,000 to $64,999 for men (66 | 13.8%) and $2,500 to $4,999 for women (92 | 13.4%).
| Income | Male | Female |
| $2,499 or less | 39 (8.2%) | 76 (11.1%) |
| $2,500 to $4,999 | 40 (8.4%) | 92 (13.4%) |
| $5,000 to $7,499 | 17 (3.6%) | 45 (6.6%) |
| $7,500 to $9,999 | 37 (7.7%) | 5 (0.7%) |
| $10,000 to $12,499 | 23 (4.8%) | 40 (5.8%) |
| $12,500 to $14,999 | 3 (0.6%) | 0 (0.0%) |
| $15,000 to $17,499 | 0 (0.0%) | 5 (0.7%) |
| $17,500 to $19,999 | 0 (0.0%) | 34 (5.0%) |
| $20,000 to $22,499 | 0 (0.0%) | 53 (7.7%) |
| $22,500 to $24,999 | 2 (0.4%) | 47 (6.9%) |
| $25,000 to $29,999 | 15 (3.1%) | 35 (5.1%) |
| $30,000 to $34,999 | 6 (1.3%) | 39 (5.7%) |
| $35,000 to $39,999 | 49 (10.2%) | 16 (2.3%) |
| $40,000 to $44,999 | 55 (11.5%) | 30 (4.4%) |
| $45,000 to $49,999 | 45 (9.4%) | 6 (0.9%) |
| $50,000 to $54,999 | 14 (2.9%) | 13 (1.9%) |
| $55,000 to $64,999 | 66 (13.8%) | 83 (12.1%) |
| $65,000 to $74,999 | 33 (6.9%) | 38 (5.6%) |
| $75,000 to $99,999 | 17 (3.6%) | 6 (0.9%) |
| $100,000+ | 17 (3.6%) | 22 (3.2%) |
| Total | 478 (100.0%) | 685 (100.0%) |
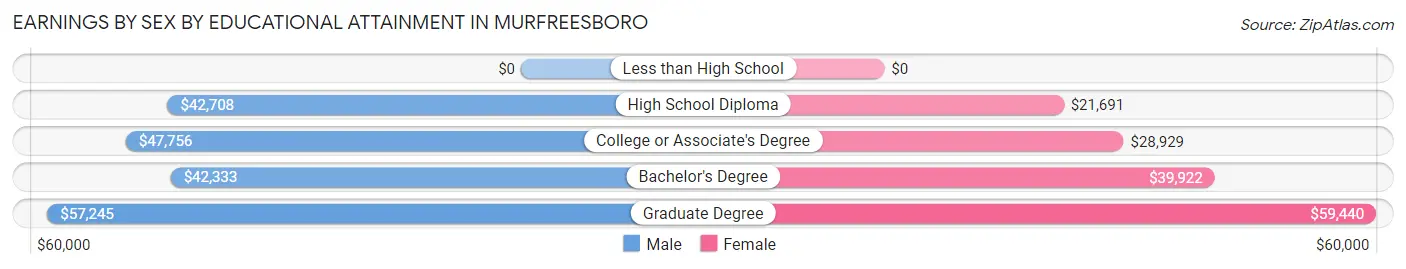
Earnings by Sex by Educational Attainment in Murfreesboro
Average earnings in Murfreesboro are $48,611 for men and $30,000 for women, a difference of 38.3%. Men with an educational attainment of graduate degree enjoy the highest average annual earnings of $57,245, while those with bachelor's degree education earn the least with $42,333. Women with an educational attainment of graduate degree earn the most with the average annual earnings of $59,440, while those with high school diploma education have the smallest earnings of $21,691.
| Educational Attainment | Male Income | Female Income |
| Less than High School | - | - |
| High School Diploma | $42,708 | $21,691 |
| College or Associate's Degree | $47,756 | $28,929 |
| Bachelor's Degree | $42,333 | $39,922 |
| Graduate Degree | $57,245 | $59,440 |
| Total | $48,611 | $30,000 |
Family Income in Murfreesboro
Family Income Brackets in Murfreesboro
According to the Murfreesboro family income data, there are 124 families falling into the $100,000 to $149,999 income range, which is the most common income bracket and makes up 23.0% of all families. Conversely, the $150,000 to $199,999 income bracket is the least frequent group with only 9 families (1.7%) belonging to this category.
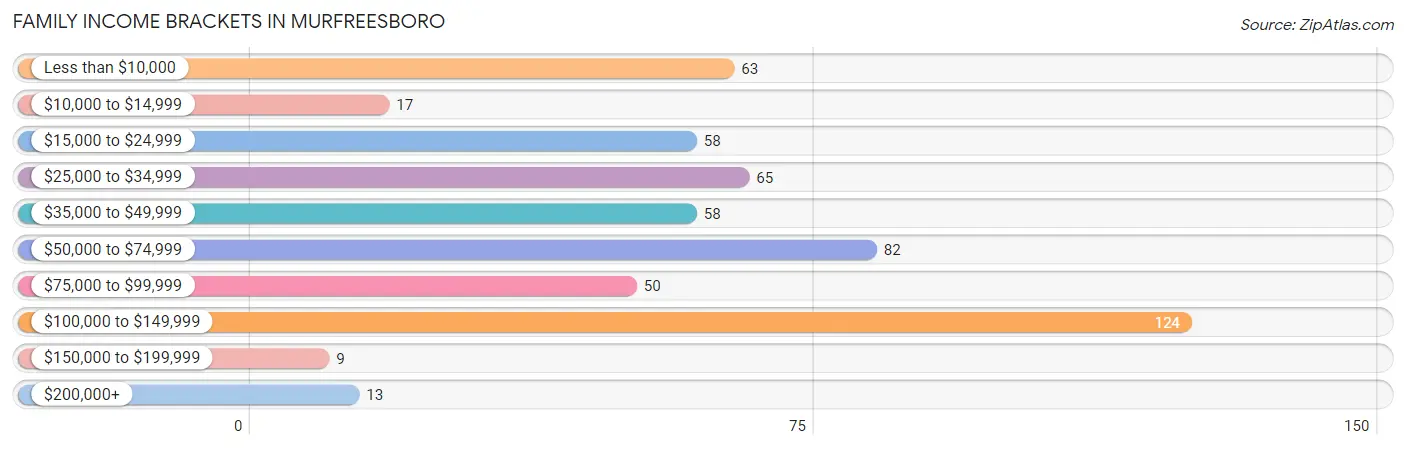
| Income Bracket | # Families | % Families |
| Less than $10,000 | 63 | 11.7% |
| $10,000 to $14,999 | 17 | 3.2% |
| $15,000 to $24,999 | 58 | 10.8% |
| $25,000 to $34,999 | 65 | 12.1% |
| $35,000 to $49,999 | 58 | 10.8% |
| $50,000 to $74,999 | 82 | 15.2% |
| $75,000 to $99,999 | 50 | 9.3% |
| $100,000 to $149,999 | 124 | 23.0% |
| $150,000 to $199,999 | 9 | 1.7% |
| $200,000+ | 13 | 2.4% |
Family Income by Famaliy Size in Murfreesboro
2-person families (279 | 51.8%) account for the highest median family income in Murfreesboro with $58,750 per family, while 2-person families (279 | 51.8%) have the highest median income of $29,375 per family member.
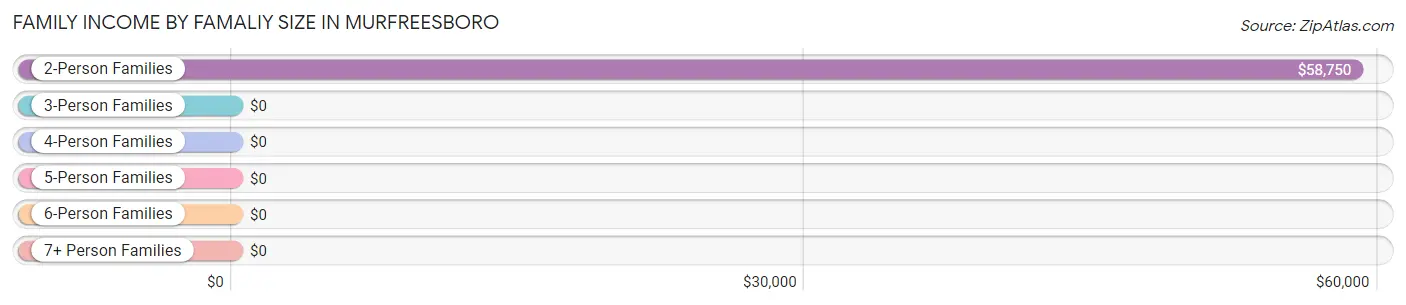
| Income Bracket | # Families | Median Income |
| 2-Person Families | 279 (51.8%) | $58,750 |
| 3-Person Families | 89 (16.5%) | $0 |
| 4-Person Families | 127 (23.6%) | $0 |
| 5-Person Families | 18 (3.3%) | $0 |
| 6-Person Families | 17 (3.2%) | $0 |
| 7+ Person Families | 9 (1.7%) | $0 |
| Total | 539 (100.0%) | $55,759 |
Family Income by Number of Earners in Murfreesboro
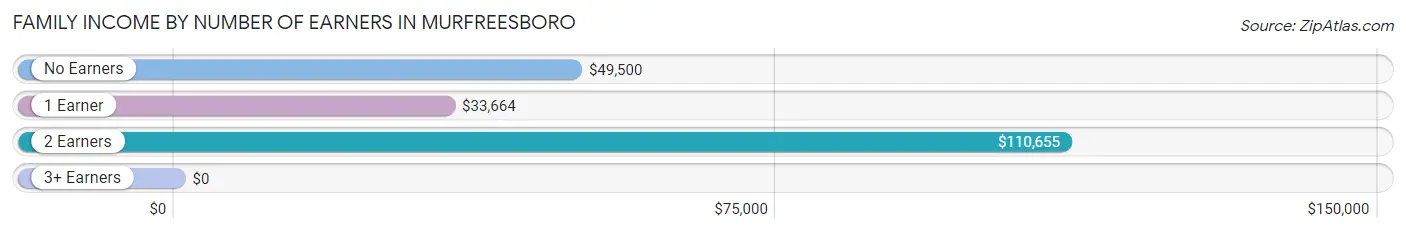
| Number of Earners | # Families | Median Income |
| No Earners | 182 (33.8%) | $49,500 |
| 1 Earner | 159 (29.5%) | $33,664 |
| 2 Earners | 171 (31.7%) | $110,655 |
| 3+ Earners | 27 (5.0%) | $0 |
| Total | 539 (100.0%) | $55,759 |
Household Income in Murfreesboro
Household Income Brackets in Murfreesboro
With 194 households falling in the category, the $50,000 to $74,999 income range is the most frequent in Murfreesboro, accounting for 20.0% of all households. In contrast, only 9 households (0.9%) fall into the $150,000 to $199,999 income bracket, making it the least populous group.
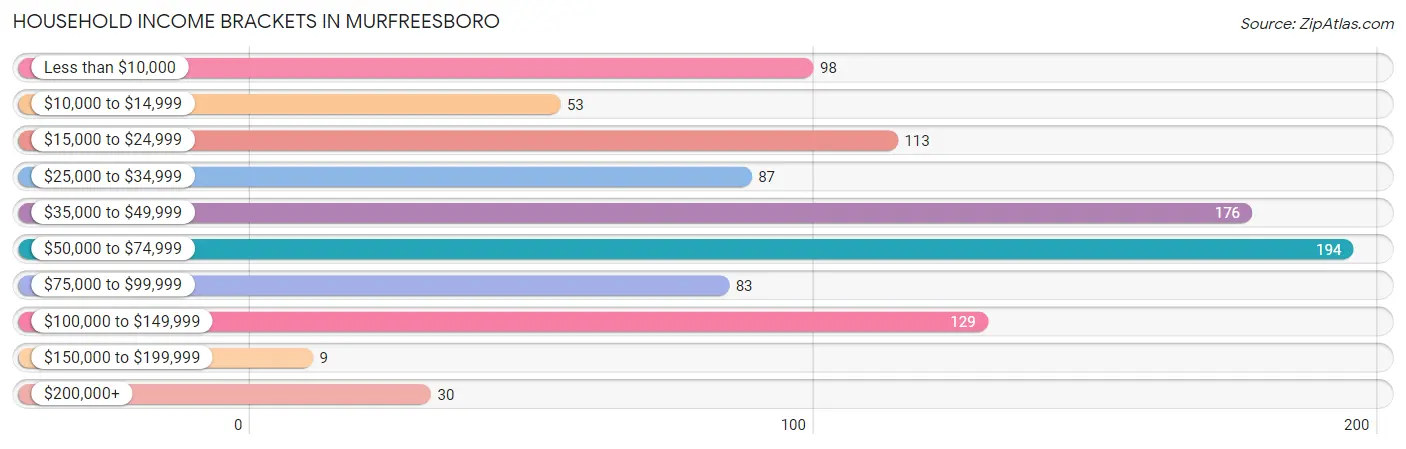
| Income Bracket | # Households | % Households |
| Less than $10,000 | 98 | 10.1% |
| $10,000 to $14,999 | 53 | 5.5% |
| $15,000 to $24,999 | 113 | 11.6% |
| $25,000 to $34,999 | 87 | 9.0% |
| $35,000 to $49,999 | 176 | 18.1% |
| $50,000 to $74,999 | 194 | 20.0% |
| $75,000 to $99,999 | 83 | 8.5% |
| $100,000 to $149,999 | 129 | 13.3% |
| $150,000 to $199,999 | 9 | 0.9% |
| $200,000+ | 30 | 3.1% |
Household Income by Householder Age in Murfreesboro
The median household income in Murfreesboro is $42,685, with the highest median household income of $59,583 found in the 45 to 64 years age bracket for the primary householder. A total of 271 households (27.9%) fall into this category. Meanwhile, the 15 to 24 years age bracket for the primary householder has the lowest median household income of $0, with 11 households (1.1%) in this group.
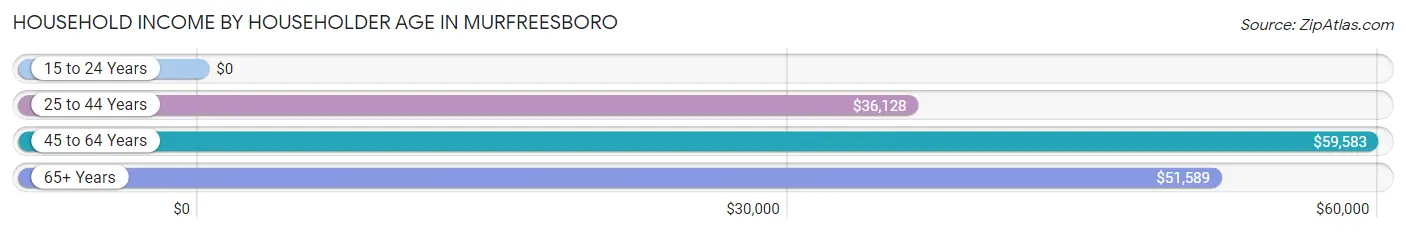
| Income Bracket | # Households | Median Income |
| 15 to 24 Years | 11 (1.1%) | $0 |
| 25 to 44 Years | 355 (36.5%) | $36,128 |
| 45 to 64 Years | 271 (27.9%) | $59,583 |
| 65+ Years | 335 (34.5%) | $51,589 |
| Total | 972 (100.0%) | $42,685 |
Poverty in Murfreesboro
Income Below Poverty by Sex and Age in Murfreesboro
With 24.9% poverty level for males and 36.5% for females among the residents of Murfreesboro, 6 to 11 year old males and 12 to 14 year old females are the most vulnerable to poverty, with 98 males (79.0%) and 37 females (100.0%) in their respective age groups living below the poverty level.
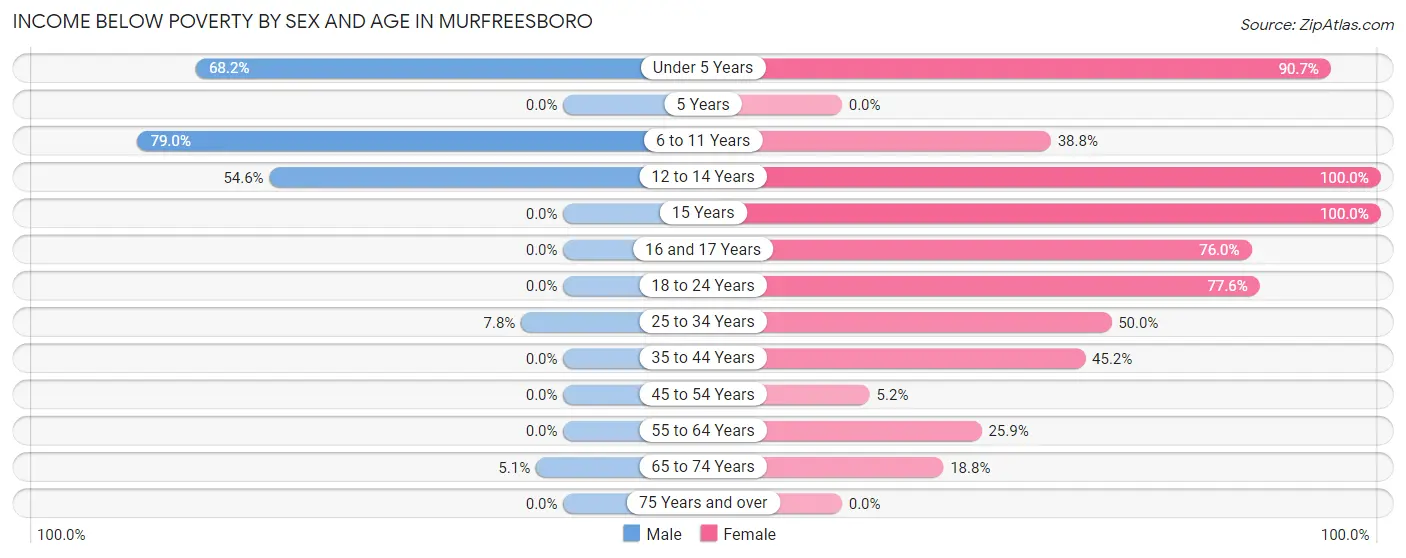
| Age Bracket | Male | Female |
| Under 5 Years | 75 (68.2%) | 49 (90.7%) |
| 5 Years | 0 (0.0%) | 0 (0.0%) |
| 6 to 11 Years | 98 (79.0%) | 38 (38.8%) |
| 12 to 14 Years | 24 (54.5%) | 37 (100.0%) |
| 15 Years | 0 (0.0%) | 31 (100.0%) |
| 16 and 17 Years | 0 (0.0%) | 38 (76.0%) |
| 18 to 24 Years | 0 (0.0%) | 38 (77.5%) |
| 25 to 34 Years | 14 (7.8%) | 87 (50.0%) |
| 35 to 44 Years | 0 (0.0%) | 70 (45.2%) |
| 45 to 54 Years | 0 (0.0%) | 6 (5.2%) |
| 55 to 64 Years | 0 (0.0%) | 42 (25.9%) |
| 65 to 74 Years | 6 (5.1%) | 29 (18.8%) |
| 75 Years and over | 0 (0.0%) | 0 (0.0%) |
| Total | 217 (24.9%) | 465 (36.5%) |
Income Above Poverty by Sex and Age in Murfreesboro
According to the poverty statistics in Murfreesboro, males aged 15 years and females aged 5 years are the age groups that are most secure financially, with 100.0% of males and 100.0% of females in these age groups living above the poverty line.
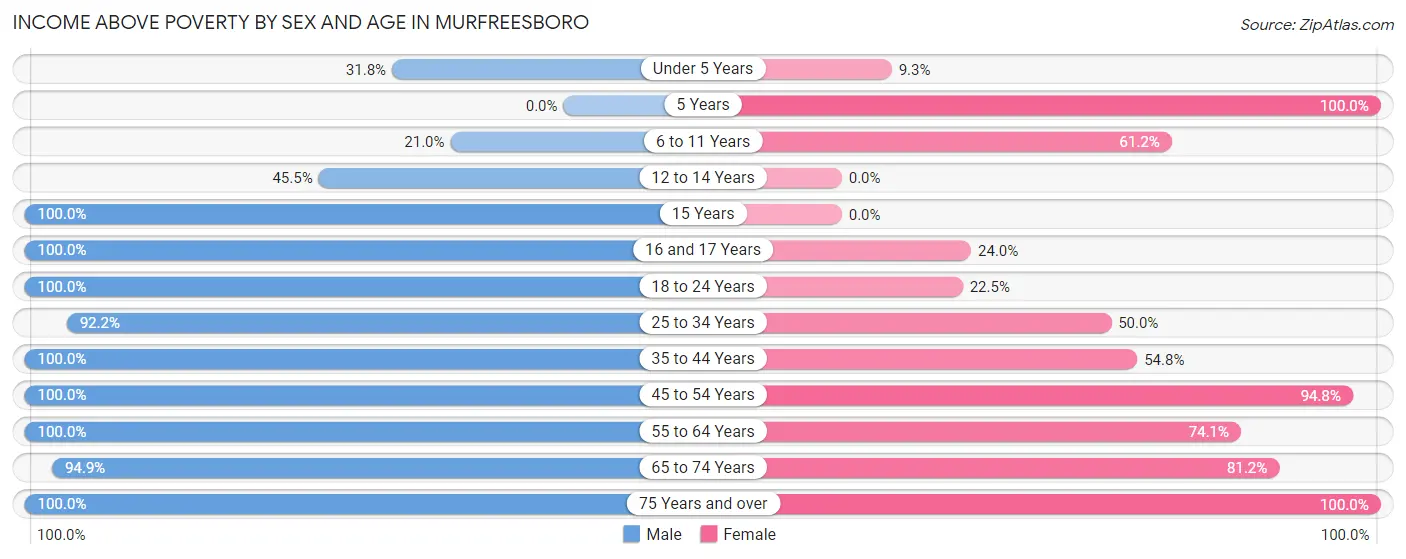
| Age Bracket | Male | Female |
| Under 5 Years | 35 (31.8%) | 5 (9.3%) |
| 5 Years | 0 (0.0%) | 3 (100.0%) |
| 6 to 11 Years | 26 (21.0%) | 60 (61.2%) |
| 12 to 14 Years | 20 (45.5%) | 0 (0.0%) |
| 15 Years | 20 (100.0%) | 0 (0.0%) |
| 16 and 17 Years | 24 (100.0%) | 12 (24.0%) |
| 18 to 24 Years | 33 (100.0%) | 11 (22.5%) |
| 25 to 34 Years | 165 (92.2%) | 87 (50.0%) |
| 35 to 44 Years | 75 (100.0%) | 85 (54.8%) |
| 45 to 54 Years | 50 (100.0%) | 110 (94.8%) |
| 55 to 64 Years | 46 (100.0%) | 120 (74.1%) |
| 65 to 74 Years | 112 (94.9%) | 125 (81.2%) |
| 75 Years and over | 48 (100.0%) | 191 (100.0%) |
| Total | 654 (75.1%) | 809 (63.5%) |
Income Below Poverty Among Married-Couple Families in Murfreesboro
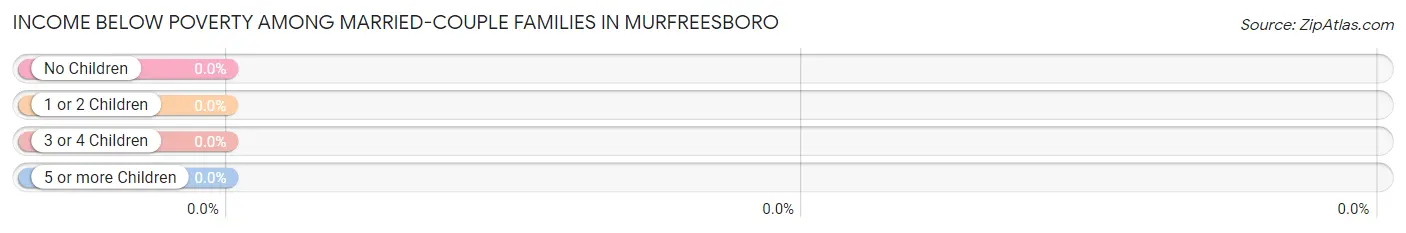
| Children | Above Poverty | Below Poverty |
| No Children | 165 (100.0%) | 0 (0.0%) |
| 1 or 2 Children | 74 (100.0%) | 0 (0.0%) |
| 3 or 4 Children | 4 (100.0%) | 0 (0.0%) |
| 5 or more Children | 0 (0.0%) | 0 (0.0%) |
| Total | 243 (100.0%) | 0 (0.0%) |
Income Below Poverty Among Single-Parent Households in Murfreesboro
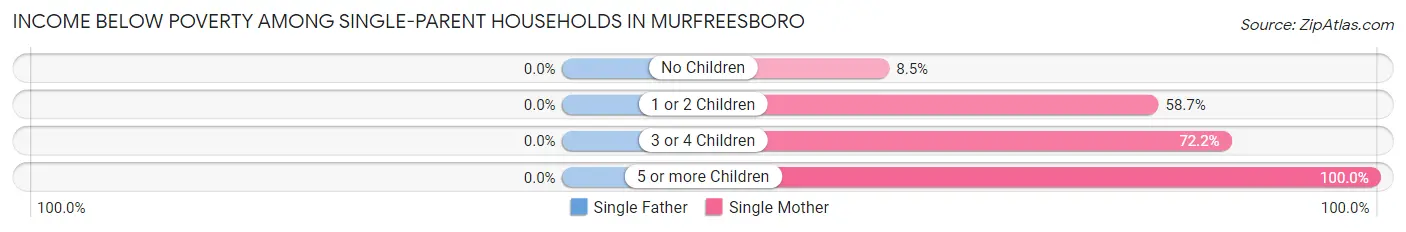
| Children | Single Father | Single Mother |
| No Children | 0 (0.0%) | 8 (8.5%) |
| 1 or 2 Children | 0 (0.0%) | 61 (58.7%) |
| 3 or 4 Children | 0 (0.0%) | 52 (72.2%) |
| 5 or more Children | 0 (0.0%) | 17 (100.0%) |
| Total | 0 (0.0%) | 138 (48.1%) |
Income Below Poverty Among Married-Couple vs Single-Parent Households in Murfreesboro
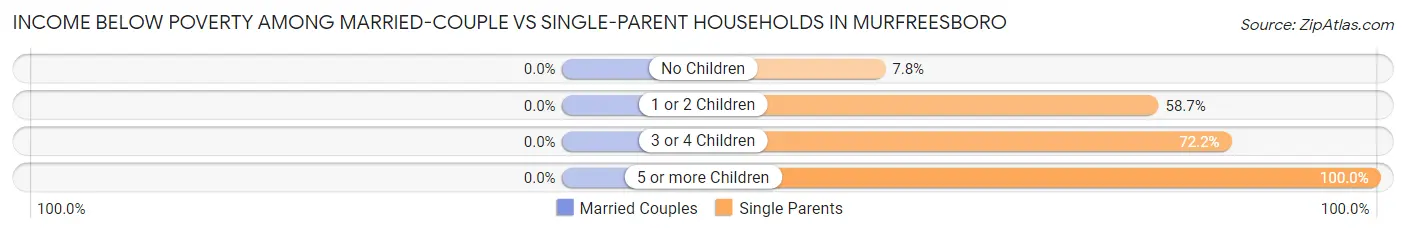
| Children | Married-Couple Families | Single-Parent Households |
| No Children | 0 (0.0%) | 8 (7.8%) |
| 1 or 2 Children | 0 (0.0%) | 61 (58.7%) |
| 3 or 4 Children | 0 (0.0%) | 52 (72.2%) |
| 5 or more Children | 0 (0.0%) | 17 (100.0%) |
| Total | 0 (0.0%) | 138 (46.6%) |
Race in Murfreesboro
The most populous races in Murfreesboro are Black / African American (1,467 | 56.2%), White / Caucasian (985 | 37.7%), and Two or more Races (101 | 3.9%).
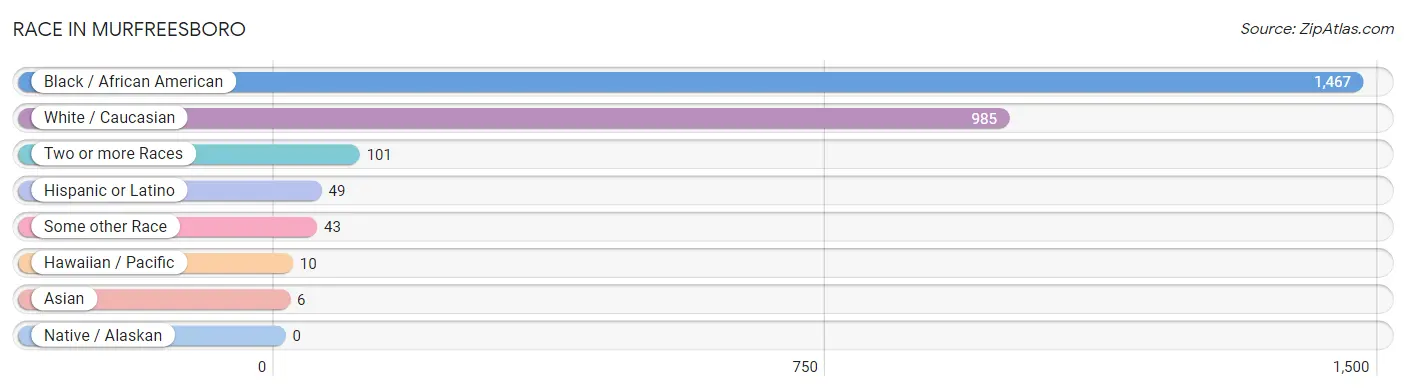
| Race | # Population | % Population |
| Asian | 6 | 0.2% |
| Black / African American | 1,467 | 56.2% |
| Hawaiian / Pacific | 10 | 0.4% |
| Hispanic or Latino | 49 | 1.9% |
| Native / Alaskan | 0 | 0.0% |
| White / Caucasian | 985 | 37.7% |
| Two or more Races | 101 | 3.9% |
| Some other Race | 43 | 1.7% |
| Total | 2,612 | 100.0% |
Ancestry in Murfreesboro
The most populous ancestries reported in Murfreesboro are English (307 | 11.7%), American (193 | 7.4%), Irish (131 | 5.0%), German (106 | 4.1%), and Italian (65 | 2.5%), together accounting for 30.7% of all Murfreesboro residents.
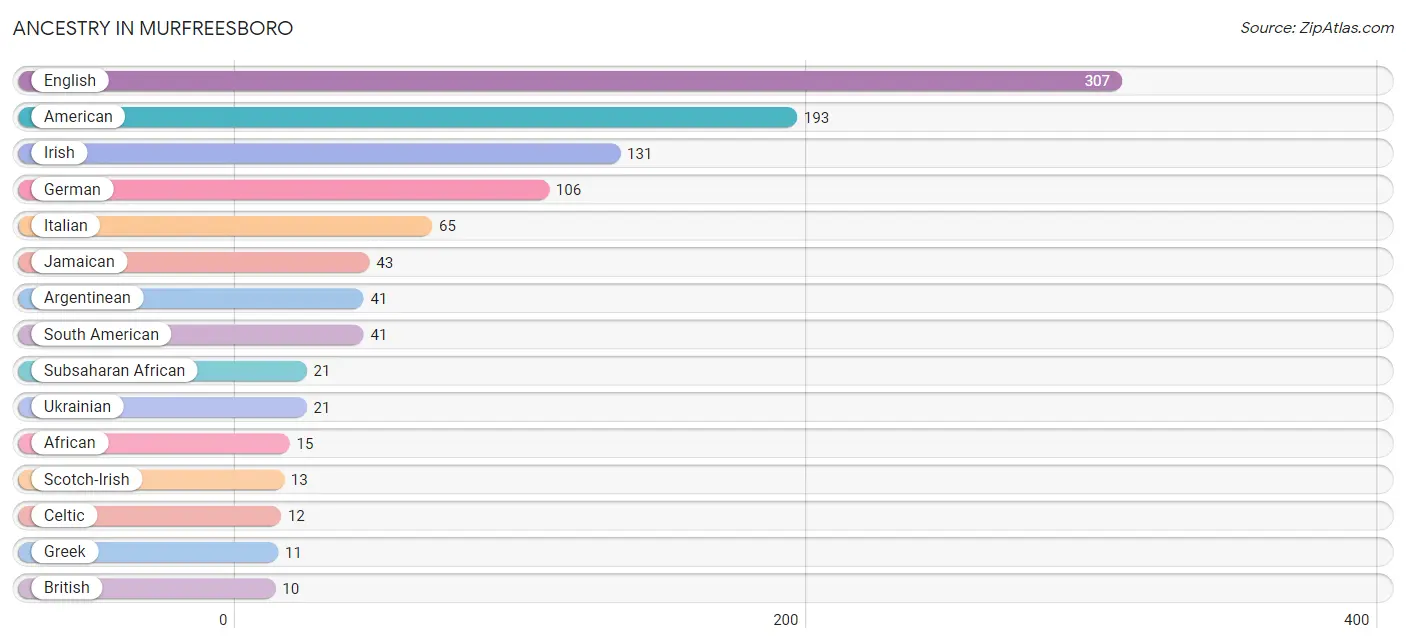
| Ancestry | # Population | % Population |
| African | 15 | 0.6% |
| American | 193 | 7.4% |
| Argentinean | 41 | 1.6% |
| Bhutanese | 5 | 0.2% |
| British | 10 | 0.4% |
| Celtic | 12 | 0.5% |
| Dutch | 6 | 0.2% |
| Eastern European | 6 | 0.2% |
| English | 307 | 11.7% |
| European | 9 | 0.3% |
| French | 5 | 0.2% |
| German | 106 | 4.1% |
| Greek | 11 | 0.4% |
| Guamanian / Chamorro | 10 | 0.4% |
| Indian (Asian) | 4 | 0.2% |
| Irish | 131 | 5.0% |
| Italian | 65 | 2.5% |
| Jamaican | 43 | 1.7% |
| Kenyan | 2 | 0.1% |
| Korean | 3 | 0.1% |
| Mexican | 2 | 0.1% |
| Native Hawaiian | 3 | 0.1% |
| Nigerian | 4 | 0.2% |
| Polish | 10 | 0.4% |
| Puerto Rican | 6 | 0.2% |
| Scotch-Irish | 13 | 0.5% |
| Scottish | 8 | 0.3% |
| South American | 41 | 1.6% |
| Subsaharan African | 21 | 0.8% |
| Swiss | 1 | 0.0% |
| Ukrainian | 21 | 0.8% |
| Welsh | 2 | 0.1% | View All 32 Rows |
Immigrants in Murfreesboro
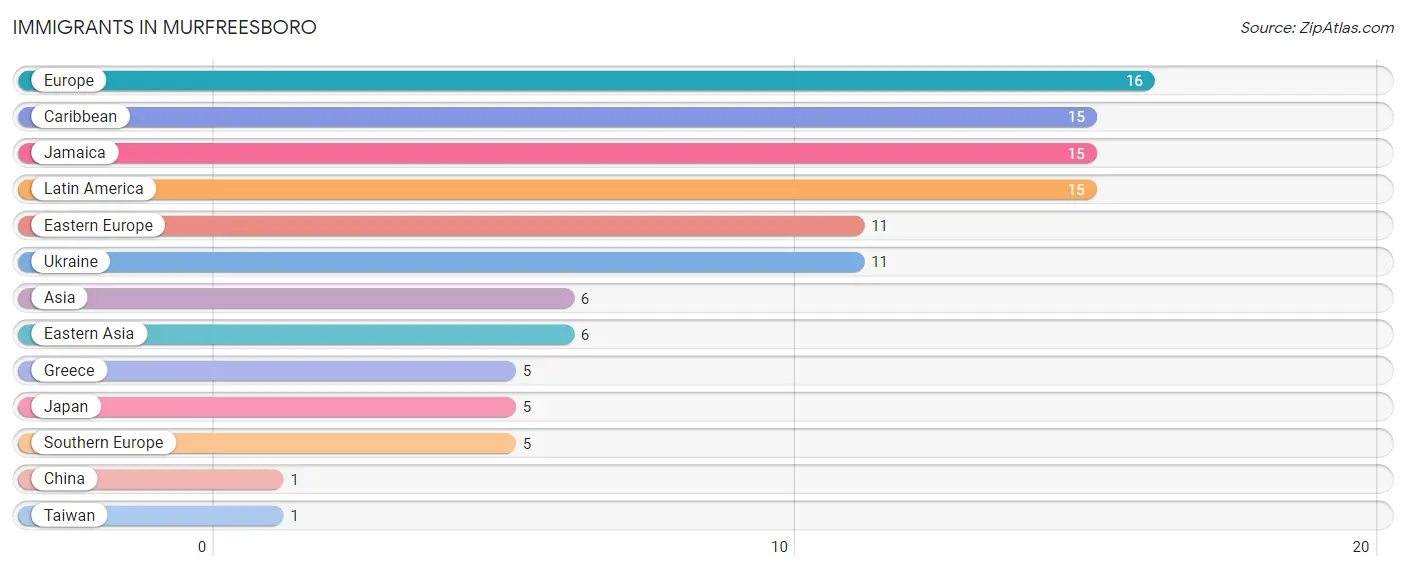
The most numerous immigrant groups reported in Murfreesboro came from Europe (16 | 0.6%), Caribbean (15 | 0.6%), Jamaica (15 | 0.6%), Latin America (15 | 0.6%), and Eastern Europe (11 | 0.4%), together accounting for 2.7% of all Murfreesboro residents.
| Immigration Origin | # Population | % Population |
| Asia | 6 | 0.2% |
| Caribbean | 15 | 0.6% |
| China | 1 | 0.0% |
| Eastern Asia | 6 | 0.2% |
| Eastern Europe | 11 | 0.4% |
| Europe | 16 | 0.6% |
| Greece | 5 | 0.2% |
| Jamaica | 15 | 0.6% |
| Japan | 5 | 0.2% |
| Latin America | 15 | 0.6% |
| Southern Europe | 5 | 0.2% |
| Taiwan | 1 | 0.0% |
| Ukraine | 11 | 0.4% | View All 13 Rows |
Sex and Age in Murfreesboro
Sex and Age in Murfreesboro
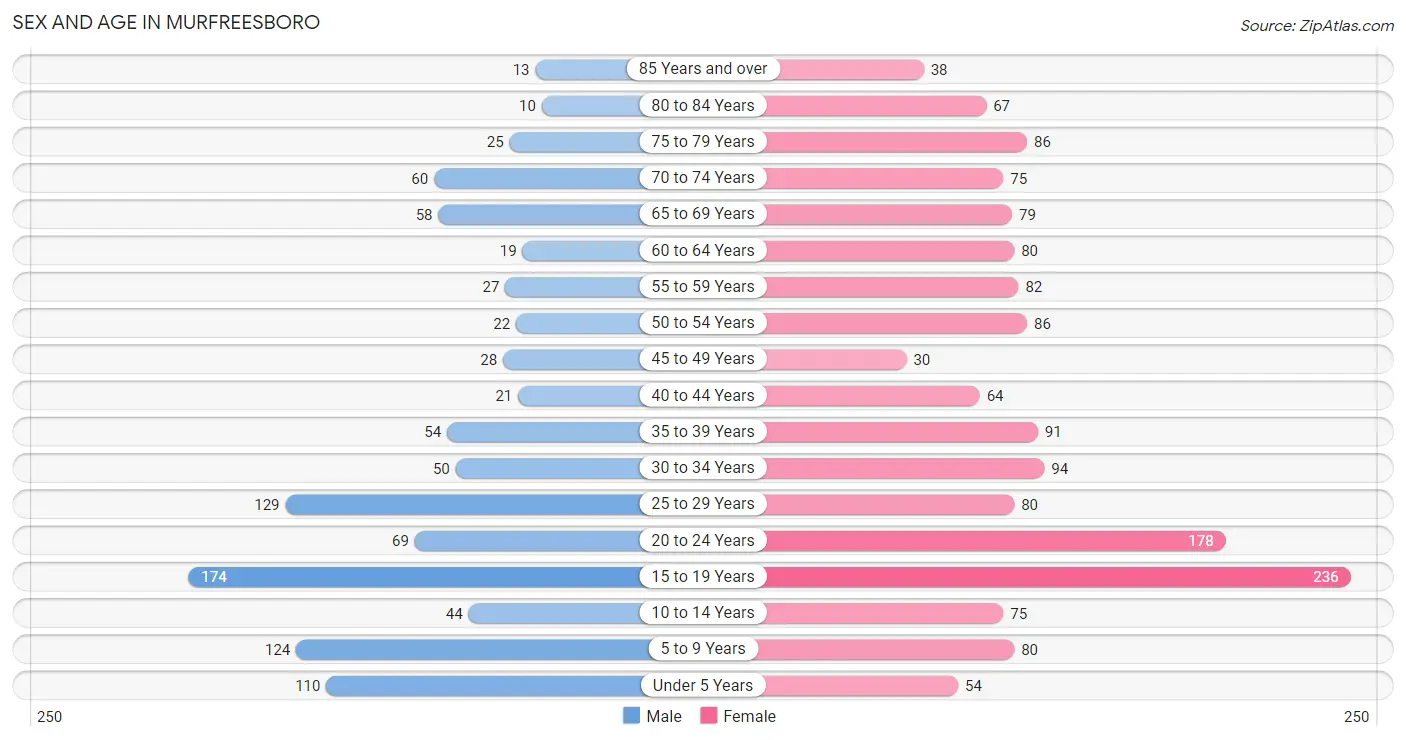
The most populous age groups in Murfreesboro are 15 to 19 Years (174 | 16.8%) for men and 15 to 19 Years (236 | 15.0%) for women.
| Age Bracket | Male | Female |
| Under 5 Years | 110 (10.6%) | 54 (3.4%) |
| 5 to 9 Years | 124 (12.0%) | 80 (5.1%) |
| 10 to 14 Years | 44 (4.2%) | 75 (4.8%) |
| 15 to 19 Years | 174 (16.8%) | 236 (15.0%) |
| 20 to 24 Years | 69 (6.7%) | 178 (11.3%) |
| 25 to 29 Years | 129 (12.4%) | 80 (5.1%) |
| 30 to 34 Years | 50 (4.8%) | 94 (6.0%) |
| 35 to 39 Years | 54 (5.2%) | 91 (5.8%) |
| 40 to 44 Years | 21 (2.0%) | 64 (4.1%) |
| 45 to 49 Years | 28 (2.7%) | 30 (1.9%) |
| 50 to 54 Years | 22 (2.1%) | 86 (5.5%) |
| 55 to 59 Years | 27 (2.6%) | 82 (5.2%) |
| 60 to 64 Years | 19 (1.8%) | 80 (5.1%) |
| 65 to 69 Years | 58 (5.6%) | 79 (5.0%) |
| 70 to 74 Years | 60 (5.8%) | 75 (4.8%) |
| 75 to 79 Years | 25 (2.4%) | 86 (5.5%) |
| 80 to 84 Years | 10 (1.0%) | 67 (4.3%) |
| 85 Years and over | 13 (1.3%) | 38 (2.4%) |
| Total | 1,037 (100.0%) | 1,575 (100.0%) |
Families and Households in Murfreesboro
Median Family Size in Murfreesboro
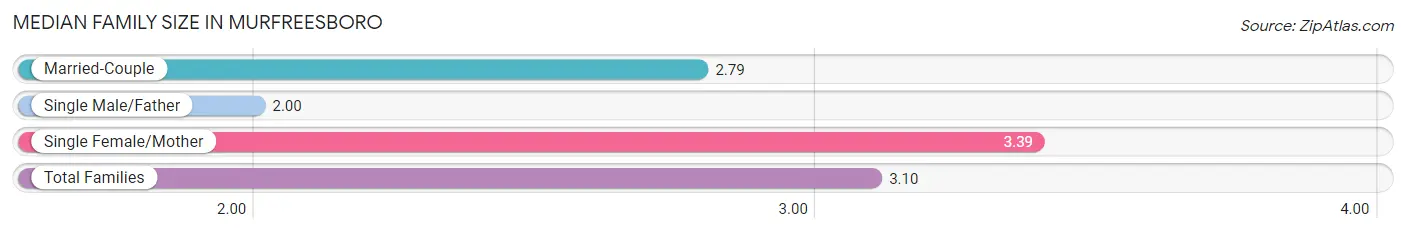
The median family size in Murfreesboro is 3.10 persons per family, with single female/mother families (287 | 53.2%) accounting for the largest median family size of 3.39 persons per family. On the other hand, single male/father families (9 | 1.7%) represent the smallest median family size with 2.00 persons per family.
| Family Type | # Families | Family Size |
| Married-Couple | 243 (45.1%) | 2.79 |
| Single Male/Father | 9 (1.7%) | 2.00 |
| Single Female/Mother | 287 (53.2%) | 3.39 |
| Total Families | 539 (100.0%) | 3.10 |
Median Household Size in Murfreesboro
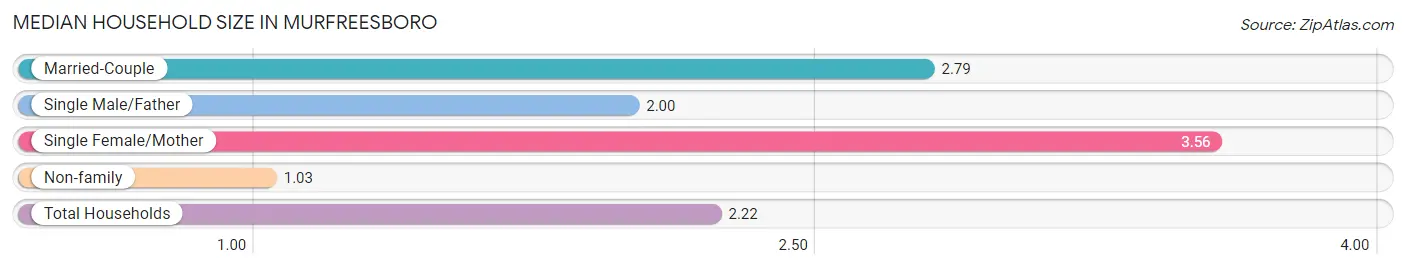
The median household size in Murfreesboro is 2.22 persons per household, with single female/mother households (287 | 29.5%) accounting for the largest median household size of 3.56 persons per household. non-family households (433 | 44.6%) represent the smallest median household size with 1.03 persons per household.
| Household Type | # Households | Household Size |
| Married-Couple | 243 (25.0%) | 2.79 |
| Single Male/Father | 9 (0.9%) | 2.00 |
| Single Female/Mother | 287 (29.5%) | 3.56 |
| Non-family | 433 (44.6%) | 1.03 |
| Total Households | 972 (100.0%) | 2.22 |
Household Size by Marriage Status in Murfreesboro
Out of a total of 972 households in Murfreesboro, 539 (55.4%) are family households, while 433 (44.6%) are nonfamily households. The most numerous type of family households are 2-person households, comprising 279, and the most common type of nonfamily households are 1-person households, comprising 421.
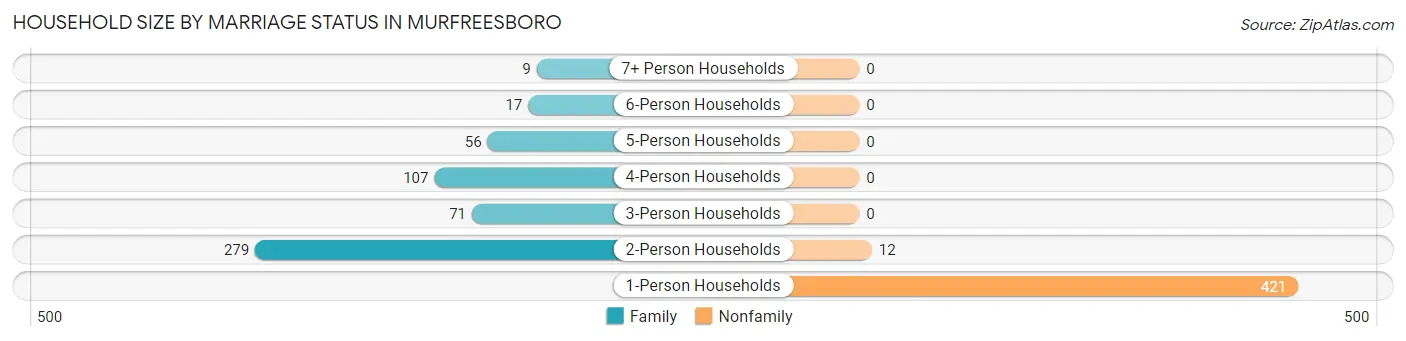
| Household Size | Family Households | Nonfamily Households |
| 1-Person Households | - | 421 (43.3%) |
| 2-Person Households | 279 (28.7%) | 12 (1.2%) |
| 3-Person Households | 71 (7.3%) | 0 (0.0%) |
| 4-Person Households | 107 (11.0%) | 0 (0.0%) |
| 5-Person Households | 56 (5.8%) | 0 (0.0%) |
| 6-Person Households | 17 (1.8%) | 0 (0.0%) |
| 7+ Person Households | 9 (0.9%) | 0 (0.0%) |
| Total | 539 (55.4%) | 433 (44.6%) |
Female Fertility in Murfreesboro
Fertility by Age in Murfreesboro
Average fertility rate in Murfreesboro is 75.0 births per 1,000 women. Women in the age bracket of 35 to 50 years have the highest fertility rate with 205.0 births per 1,000 women. Women in the age bracket of 35 to 50 years acount for 65.5% of all women with births.
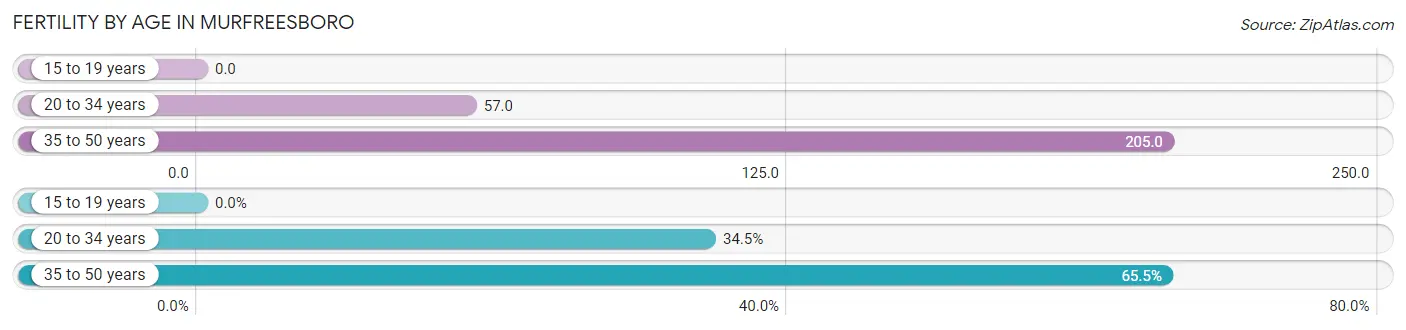
| Age Bracket | Women with Births | Births / 1,000 Women |
| 15 to 19 years | 0 (0.0%) | 0.0 |
| 20 to 34 years | 20 (34.5%) | 57.0 |
| 35 to 50 years | 38 (65.5%) | 205.0 |
| Total | 58 (100.0%) | 75.0 |
Fertility by Age by Marriage Status in Murfreesboro
65.5% of women with births (58) in Murfreesboro are married. The highest percentage of unmarried women with births falls into 20 to 34 years age bracket with 100.0% of them unmarried at the time of birth, while the lowest percentage of unmarried women with births belong to 35 to 50 years age bracket with 0.0% of them unmarried.
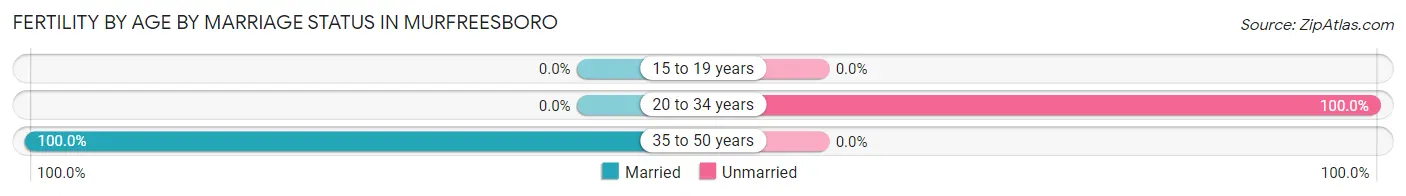
| Age Bracket | Married | Unmarried |
| 15 to 19 years | 0 (0.0%) | 0 (0.0%) |
| 20 to 34 years | 0 (0.0%) | 20 (100.0%) |
| 35 to 50 years | 38 (100.0%) | 0 (0.0%) |
| Total | 38 (65.5%) | 20 (34.5%) |
Fertility by Education in Murfreesboro
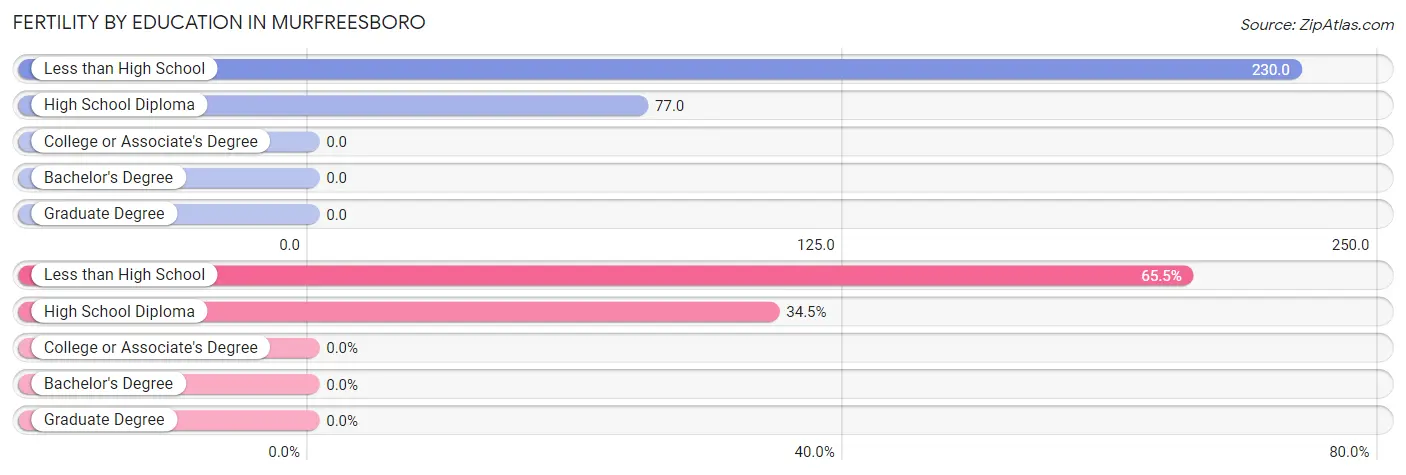
| Educational Attainment | Women with Births | Births / 1,000 Women |
| Less than High School | 38 (65.5%) | 230.0 |
| High School Diploma | 20 (34.5%) | 77.0 |
| College or Associate's Degree | 0 (0.0%) | 0.0 |
| Bachelor's Degree | 0 (0.0%) | 0.0 |
| Graduate Degree | 0 (0.0%) | 0.0 |
| Total | 58 (100.0%) | 75.0 |
Fertility by Education by Marriage Status in Murfreesboro
34.5% of women with births in Murfreesboro are unmarried. Women with the educational attainment of less than high school are most likely to be married with 100.0% of them married at childbirth, while women with the educational attainment of high school diploma are least likely to be married with 100.0% of them unmarried at childbirth.
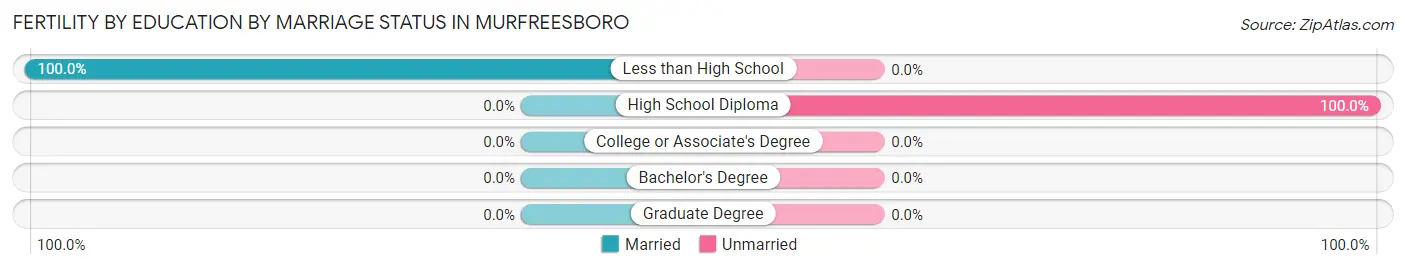
| Educational Attainment | Married | Unmarried |
| Less than High School | 38 (100.0%) | 0 (0.0%) |
| High School Diploma | 0 (0.0%) | 20 (100.0%) |
| College or Associate's Degree | 0 (0.0%) | 0 (0.0%) |
| Bachelor's Degree | 0 (0.0%) | 0 (0.0%) |
| Graduate Degree | 0 (0.0%) | 0 (0.0%) |
| Total | 38 (65.5%) | 20 (34.5%) |
Employment Characteristics in Murfreesboro
Employment by Class of Employer in Murfreesboro
Among the 907 employed individuals in Murfreesboro, private company employees (391 | 43.1%), state government employees (256 | 28.2%), and not-for-profit organizations (114 | 12.6%) make up the most common classes of employment.
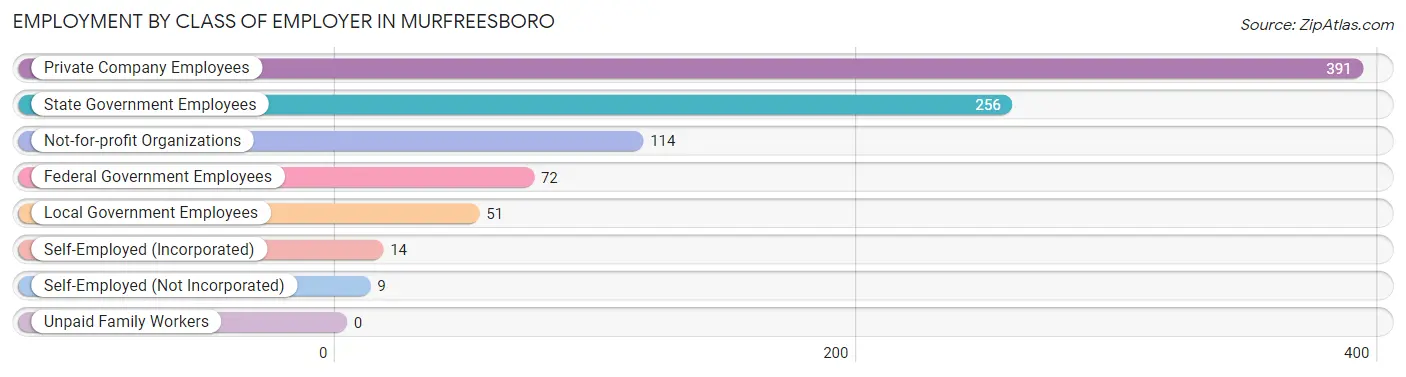
| Employer Class | # Employees | % Employees |
| Private Company Employees | 391 | 43.1% |
| Self-Employed (Incorporated) | 14 | 1.5% |
| Self-Employed (Not Incorporated) | 9 | 1.0% |
| Not-for-profit Organizations | 114 | 12.6% |
| Local Government Employees | 51 | 5.6% |
| State Government Employees | 256 | 28.2% |
| Federal Government Employees | 72 | 7.9% |
| Unpaid Family Workers | 0 | 0.0% |
| Total | 907 | 100.0% |
Employment Status by Age in Murfreesboro
According to the labor force statistics for Murfreesboro, out of the total population over 16 years of age (2,074), 49.8% or 1,033 individuals are in the labor force, with 5.0% or 52 of them unemployed. The age group with the highest labor force participation rate is 25 to 29 years, with 95.7% or 200 individuals in the labor force. Within the labor force, the 25 to 29 years age range has the highest percentage of unemployed individuals, with 12.6% or 25 of them being unemployed.
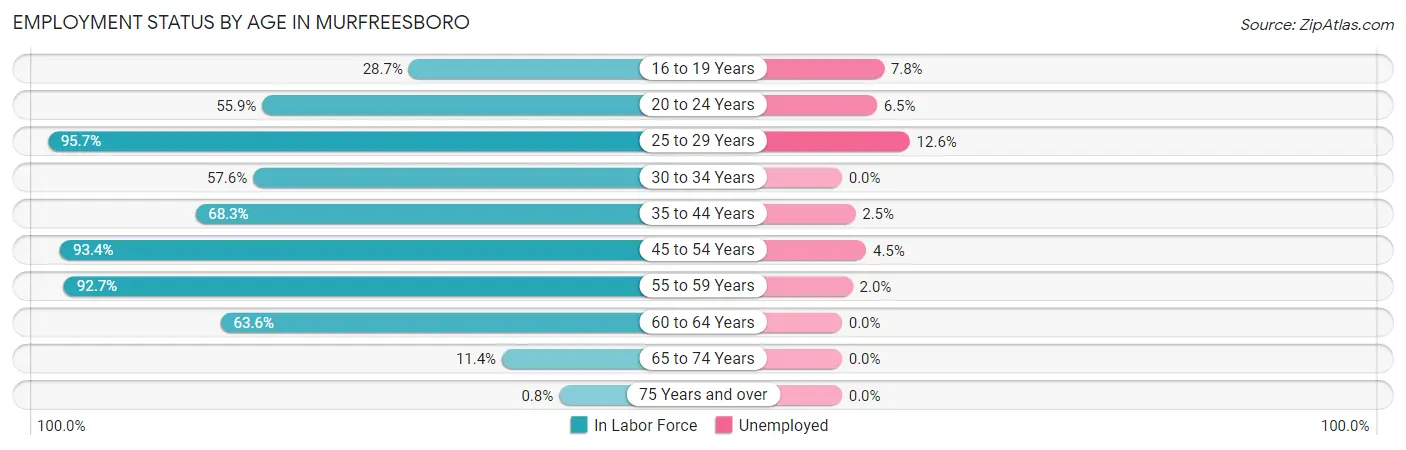
| Age Bracket | In Labor Force | Unemployed |
| 16 to 19 Years | 103 (28.7%) | 8 (7.8%) |
| 20 to 24 Years | 138 (55.9%) | 9 (6.5%) |
| 25 to 29 Years | 200 (95.7%) | 25 (12.6%) |
| 30 to 34 Years | 83 (57.6%) | 0 (0.0%) |
| 35 to 44 Years | 157 (68.3%) | 4 (2.5%) |
| 45 to 54 Years | 155 (93.4%) | 7 (4.5%) |
| 55 to 59 Years | 101 (92.7%) | 2 (2.0%) |
| 60 to 64 Years | 63 (63.6%) | 0 (0.0%) |
| 65 to 74 Years | 31 (11.4%) | 0 (0.0%) |
| 75 Years and over | 2 (0.8%) | 0 (0.0%) |
| Total | 1,033 (49.8%) | 52 (5.0%) |
Employment Status by Educational Attainment in Murfreesboro
According to labor force statistics for Murfreesboro, 79.3% of individuals (759) out of the total population between 25 and 64 years of age (957) are in the labor force, with 4.6% or 35 of them being unemployed. The group with the highest labor force participation rate are those with the educational attainment of bachelor's degree or higher, with 92.0% or 298 individuals in the labor force. Within the labor force, individuals with high school diploma education have the highest percentage of unemployment, with 10.9% or 20 of them being unemployed.
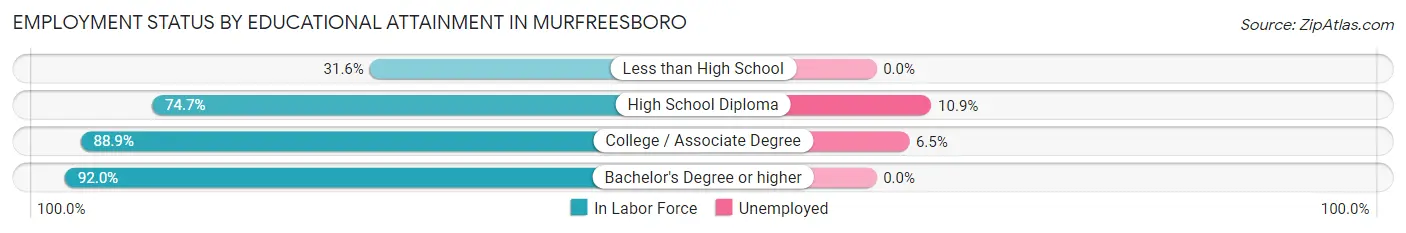
| Educational Attainment | In Labor Force | Unemployed |
| Less than High School | 37 (31.6%) | 0 (0.0%) |
| High School Diploma | 183 (74.7%) | 27 (10.9%) |
| College / Associate Degree | 241 (88.9%) | 18 (6.5%) |
| Bachelor's Degree or higher | 298 (92.0%) | 0 (0.0%) |
| Total | 759 (79.3%) | 44 (4.6%) |
Employment Occupations by Sex in Murfreesboro
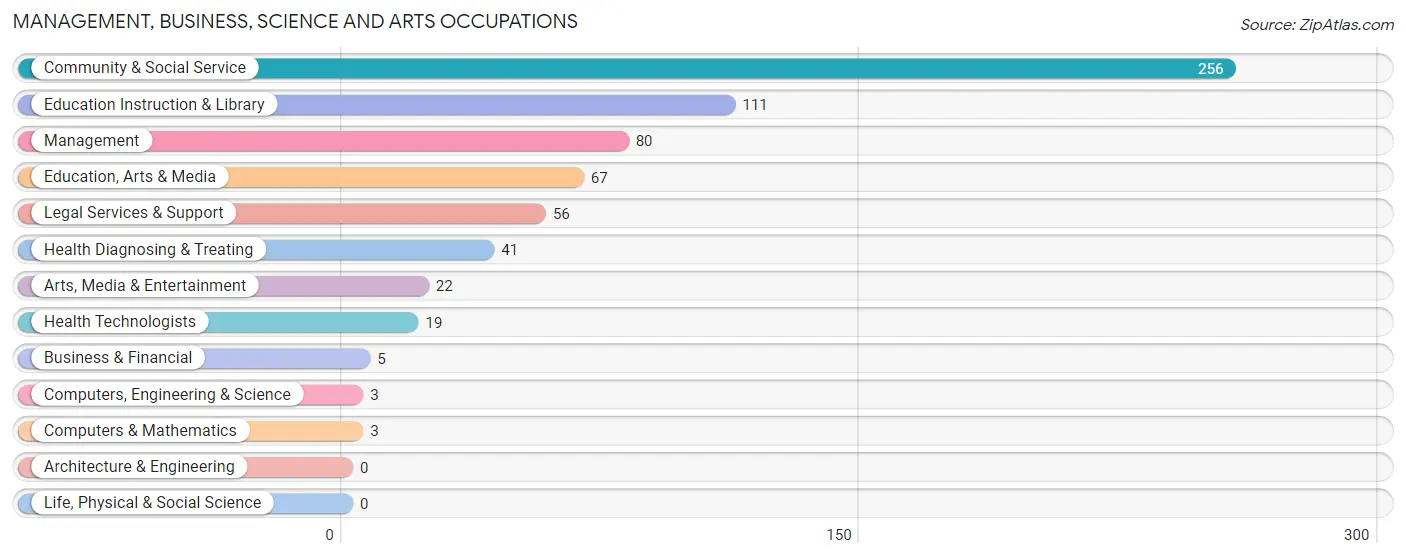
Management, Business, Science and Arts Occupations
The most common Management, Business, Science and Arts occupations in Murfreesboro are Community & Social Service (256 | 27.2%), Education Instruction & Library (111 | 11.8%), Management (80 | 8.5%), Education, Arts & Media (67 | 7.1%), and Legal Services & Support (56 | 5.9%).
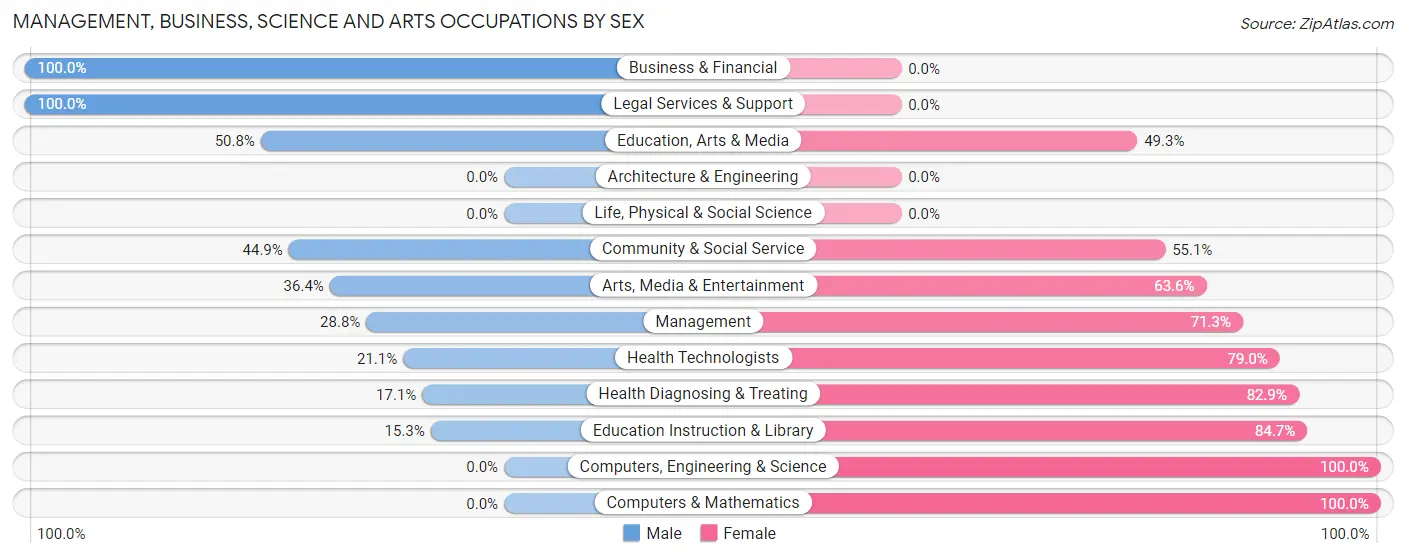
Management, Business, Science and Arts Occupations by Sex
Within the Management, Business, Science and Arts occupations in Murfreesboro, the most male-oriented occupations are Business & Financial (100.0%), Legal Services & Support (100.0%), and Education, Arts & Media (50.7%), while the most female-oriented occupations are Computers, Engineering & Science (100.0%), Computers & Mathematics (100.0%), and Education Instruction & Library (84.7%).
| Occupation | Male | Female |
| Management | 23 (28.7%) | 57 (71.3%) |
| Business & Financial | 5 (100.0%) | 0 (0.0%) |
| Computers, Engineering & Science | 0 (0.0%) | 3 (100.0%) |
| Computers & Mathematics | 0 (0.0%) | 3 (100.0%) |
| Architecture & Engineering | 0 (0.0%) | 0 (0.0%) |
| Life, Physical & Social Science | 0 (0.0%) | 0 (0.0%) |
| Community & Social Service | 115 (44.9%) | 141 (55.1%) |
| Education, Arts & Media | 34 (50.7%) | 33 (49.2%) |
| Legal Services & Support | 56 (100.0%) | 0 (0.0%) |
| Education Instruction & Library | 17 (15.3%) | 94 (84.7%) |
| Arts, Media & Entertainment | 8 (36.4%) | 14 (63.6%) |
| Health Diagnosing & Treating | 7 (17.1%) | 34 (82.9%) |
| Health Technologists | 4 (21.0%) | 15 (78.9%) |
| Total (Category) | 150 (39.0%) | 235 (61.0%) |
| Total (Overall) | 346 (36.7%) | 596 (63.3%) |
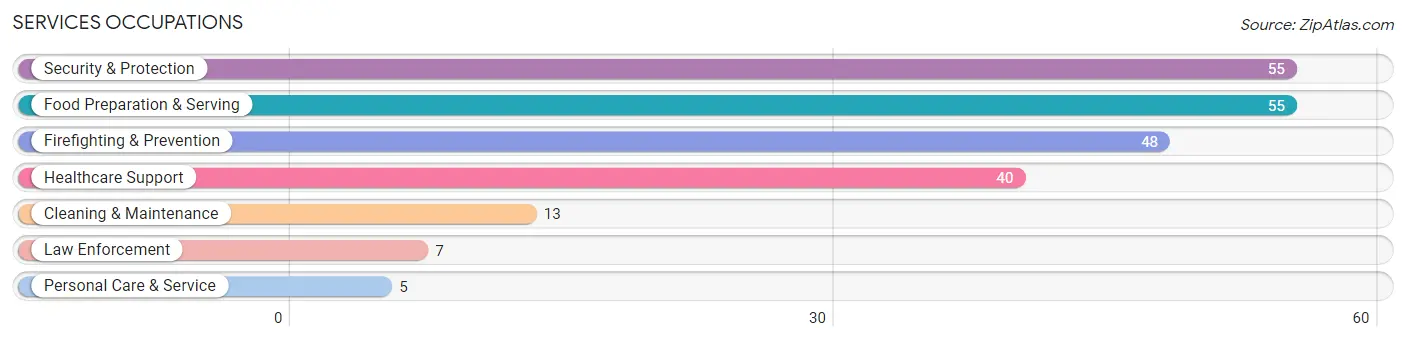
Services Occupations
The most common Services occupations in Murfreesboro are Security & Protection (55 | 5.8%), Food Preparation & Serving (55 | 5.8%), Firefighting & Prevention (48 | 5.1%), Healthcare Support (40 | 4.3%), and Cleaning & Maintenance (13 | 1.4%).
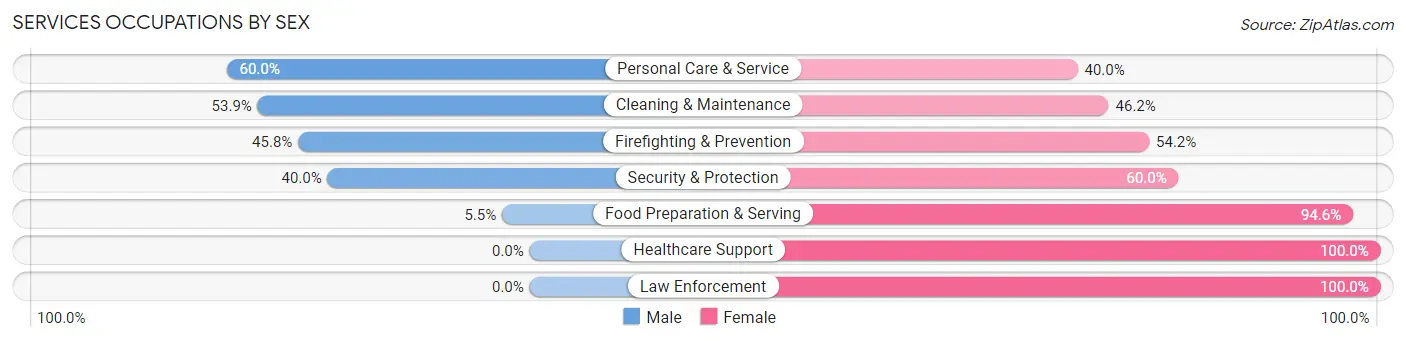
Services Occupations by Sex
Within the Services occupations in Murfreesboro, the most male-oriented occupations are Personal Care & Service (60.0%), Cleaning & Maintenance (53.8%), and Firefighting & Prevention (45.8%), while the most female-oriented occupations are Healthcare Support (100.0%), Law Enforcement (100.0%), and Food Preparation & Serving (94.6%).
| Occupation | Male | Female |
| Healthcare Support | 0 (0.0%) | 40 (100.0%) |
| Security & Protection | 22 (40.0%) | 33 (60.0%) |
| Firefighting & Prevention | 22 (45.8%) | 26 (54.2%) |
| Law Enforcement | 0 (0.0%) | 7 (100.0%) |
| Food Preparation & Serving | 3 (5.4%) | 52 (94.6%) |
| Cleaning & Maintenance | 7 (53.8%) | 6 (46.2%) |
| Personal Care & Service | 3 (60.0%) | 2 (40.0%) |
| Total (Category) | 35 (20.8%) | 133 (79.2%) |
| Total (Overall) | 346 (36.7%) | 596 (63.3%) |
Sales and Office Occupations
The most common Sales and Office occupations in Murfreesboro are Office & Administration (160 | 17.0%), and Sales & Related (58 | 6.2%).
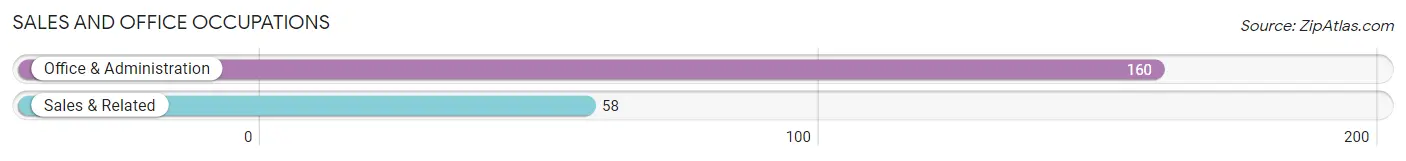
Sales and Office Occupations by Sex

| Occupation | Male | Female |
| Sales & Related | 0 (0.0%) | 58 (100.0%) |
| Office & Administration | 28 (17.5%) | 132 (82.5%) |
| Total (Category) | 28 (12.8%) | 190 (87.2%) |
| Total (Overall) | 346 (36.7%) | 596 (63.3%) |
Natural Resources, Construction and Maintenance Occupations
The most common Natural Resources, Construction and Maintenance occupations in Murfreesboro are Construction & Extraction (42 | 4.5%), and Installation, Maintenance & Repair (6 | 0.6%).
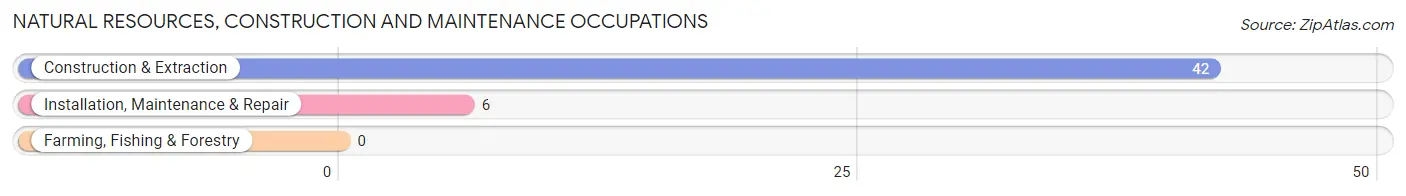
Natural Resources, Construction and Maintenance Occupations by Sex

| Occupation | Male | Female |
| Farming, Fishing & Forestry | 0 (0.0%) | 0 (0.0%) |
| Construction & Extraction | 39 (92.9%) | 3 (7.1%) |
| Installation, Maintenance & Repair | 6 (100.0%) | 0 (0.0%) |
| Total (Category) | 45 (93.8%) | 3 (6.2%) |
| Total (Overall) | 346 (36.7%) | 596 (63.3%) |
Production, Transportation and Moving Occupations
The most common Production, Transportation and Moving occupations in Murfreesboro are Transportation (55 | 5.8%), Production (36 | 3.8%), and Material Moving (32 | 3.4%).
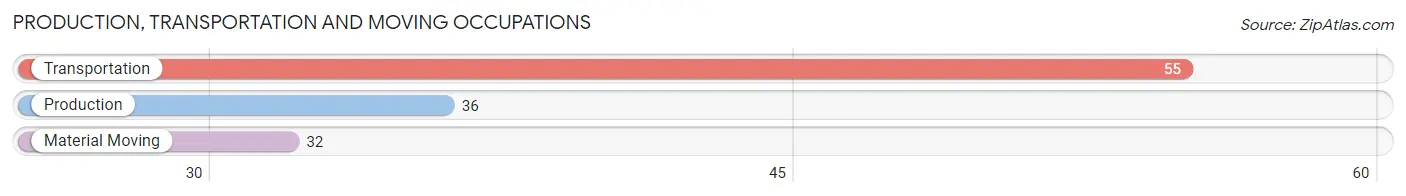
Production, Transportation and Moving Occupations by Sex
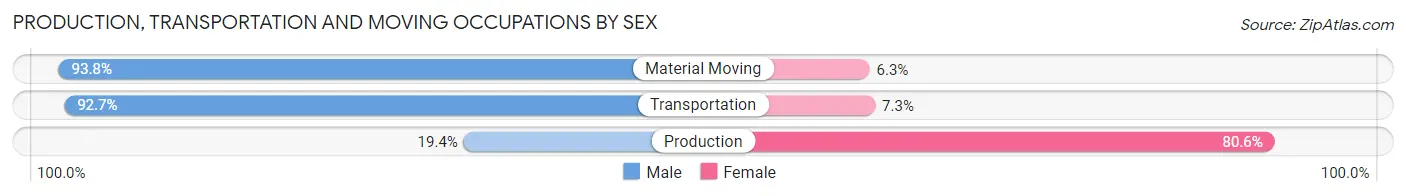
| Occupation | Male | Female |
| Production | 7 (19.4%) | 29 (80.6%) |
| Transportation | 51 (92.7%) | 4 (7.3%) |
| Material Moving | 30 (93.8%) | 2 (6.2%) |
| Total (Category) | 88 (71.5%) | 35 (28.5%) |
| Total (Overall) | 346 (36.7%) | 596 (63.3%) |
Employment Industries by Sex in Murfreesboro
Employment Industries in Murfreesboro
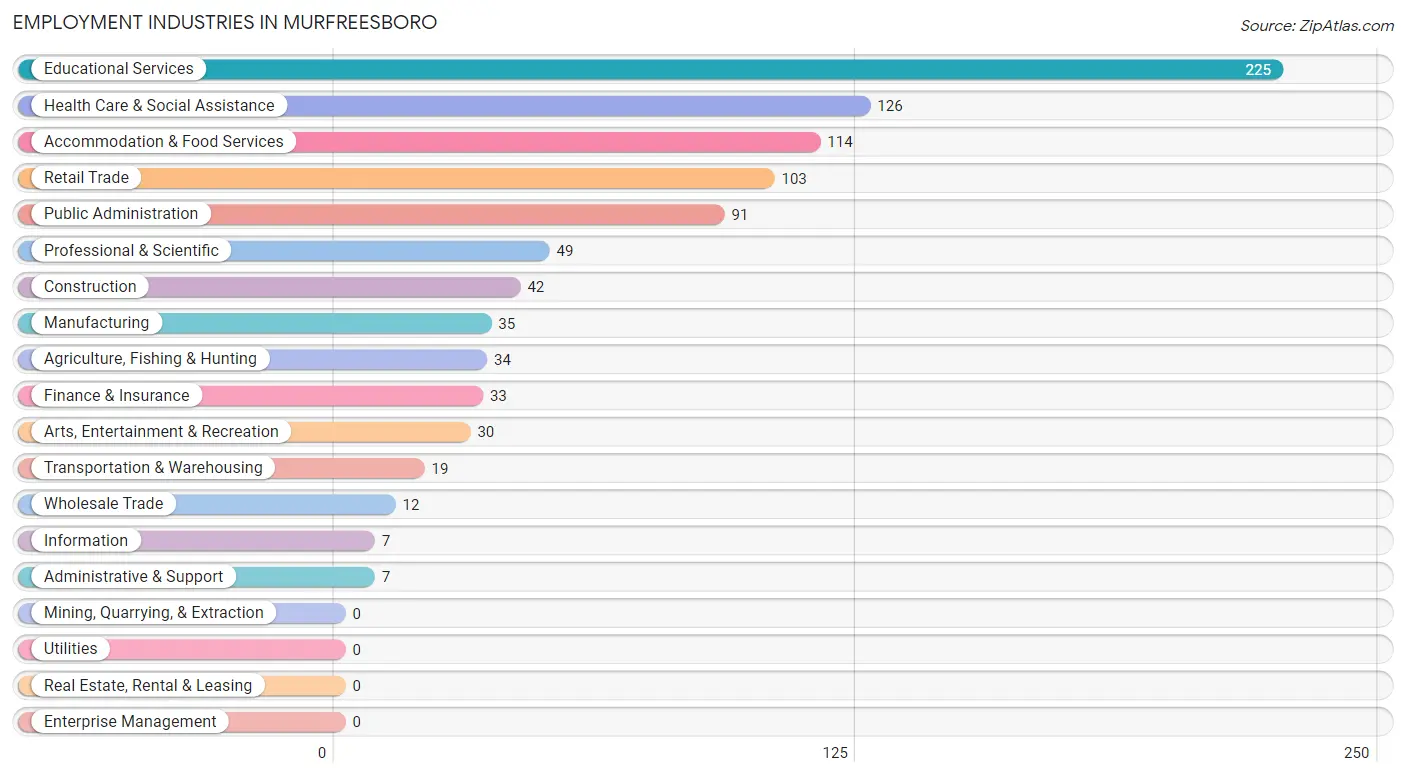
The major employment industries in Murfreesboro include Educational Services (225 | 23.9%), Health Care & Social Assistance (126 | 13.4%), Accommodation & Food Services (114 | 12.1%), Retail Trade (103 | 10.9%), and Public Administration (91 | 9.7%).
Employment Industries by Sex in Murfreesboro
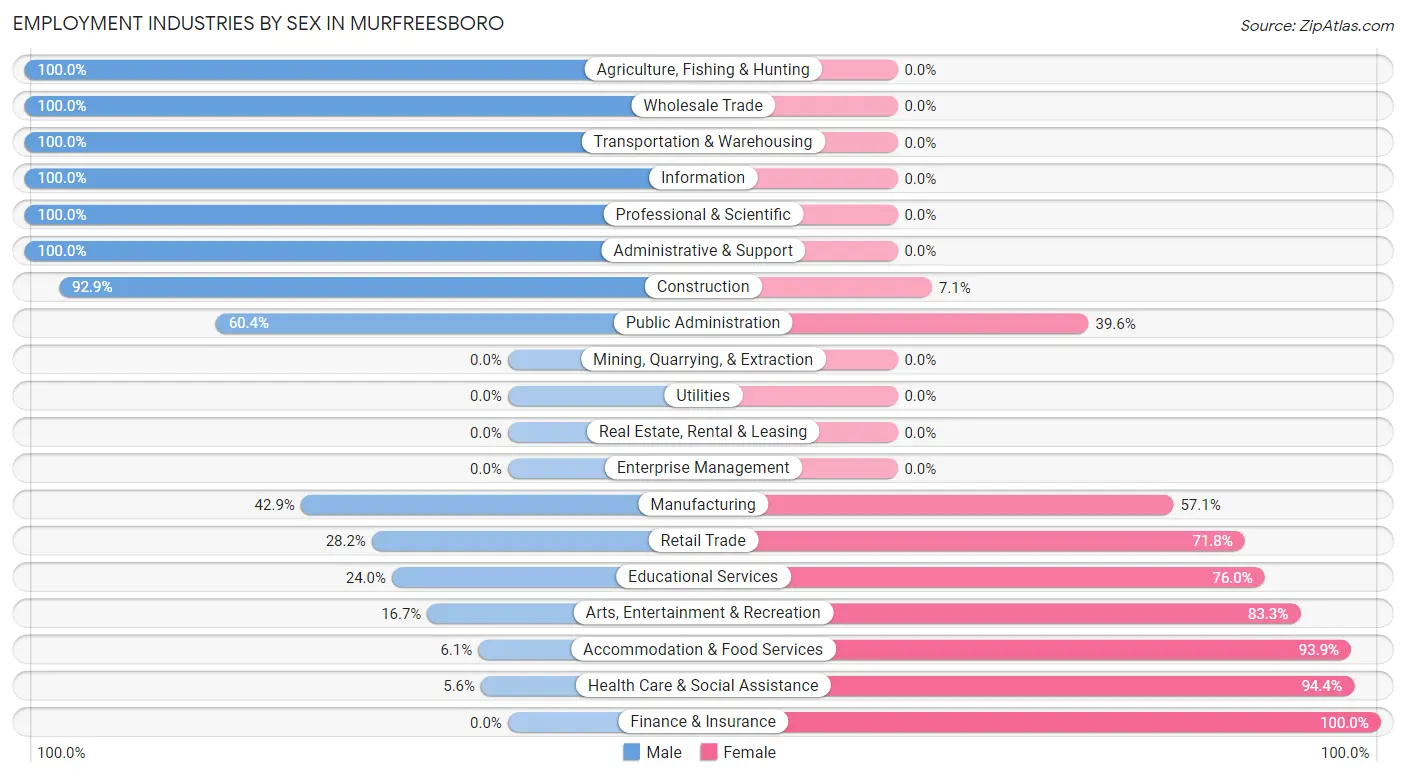
The Murfreesboro industries that see more men than women are Agriculture, Fishing & Hunting (100.0%), Wholesale Trade (100.0%), and Transportation & Warehousing (100.0%), whereas the industries that tend to have a higher number of women are Finance & Insurance (100.0%), Health Care & Social Assistance (94.4%), and Accommodation & Food Services (93.9%).
| Industry | Male | Female |
| Agriculture, Fishing & Hunting | 34 (100.0%) | 0 (0.0%) |
| Mining, Quarrying, & Extraction | 0 (0.0%) | 0 (0.0%) |
| Construction | 39 (92.9%) | 3 (7.1%) |
| Manufacturing | 15 (42.9%) | 20 (57.1%) |
| Wholesale Trade | 12 (100.0%) | 0 (0.0%) |
| Retail Trade | 29 (28.2%) | 74 (71.8%) |
| Transportation & Warehousing | 19 (100.0%) | 0 (0.0%) |
| Utilities | 0 (0.0%) | 0 (0.0%) |
| Information | 7 (100.0%) | 0 (0.0%) |
| Finance & Insurance | 0 (0.0%) | 33 (100.0%) |
| Real Estate, Rental & Leasing | 0 (0.0%) | 0 (0.0%) |
| Professional & Scientific | 49 (100.0%) | 0 (0.0%) |
| Enterprise Management | 0 (0.0%) | 0 (0.0%) |
| Administrative & Support | 7 (100.0%) | 0 (0.0%) |
| Educational Services | 54 (24.0%) | 171 (76.0%) |
| Health Care & Social Assistance | 7 (5.6%) | 119 (94.4%) |
| Arts, Entertainment & Recreation | 5 (16.7%) | 25 (83.3%) |
| Accommodation & Food Services | 7 (6.1%) | 107 (93.9%) |
| Public Administration | 55 (60.4%) | 36 (39.6%) |
| Total | 346 (36.7%) | 596 (63.3%) |
Education in Murfreesboro
School Enrollment in Murfreesboro
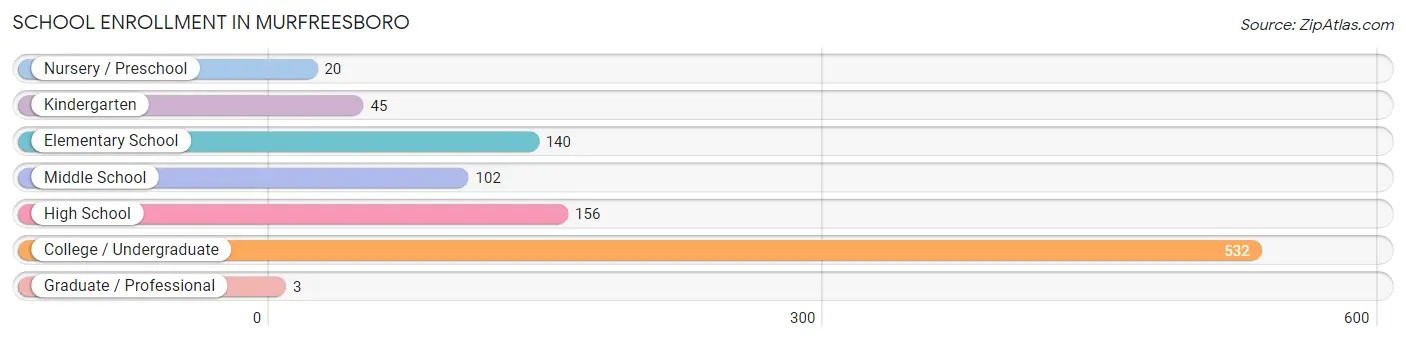
The most common levels of schooling among the 998 students in Murfreesboro are college / undergraduate (532 | 53.3%), high school (156 | 15.6%), and elementary school (140 | 14.0%).
| School Level | # Students | % Students |
| Nursery / Preschool | 20 | 2.0% |
| Kindergarten | 45 | 4.5% |
| Elementary School | 140 | 14.0% |
| Middle School | 102 | 10.2% |
| High School | 156 | 15.6% |
| College / Undergraduate | 532 | 53.3% |
| Graduate / Professional | 3 | 0.3% |
| Total | 998 | 100.0% |
School Enrollment by Age by Funding Source in Murfreesboro
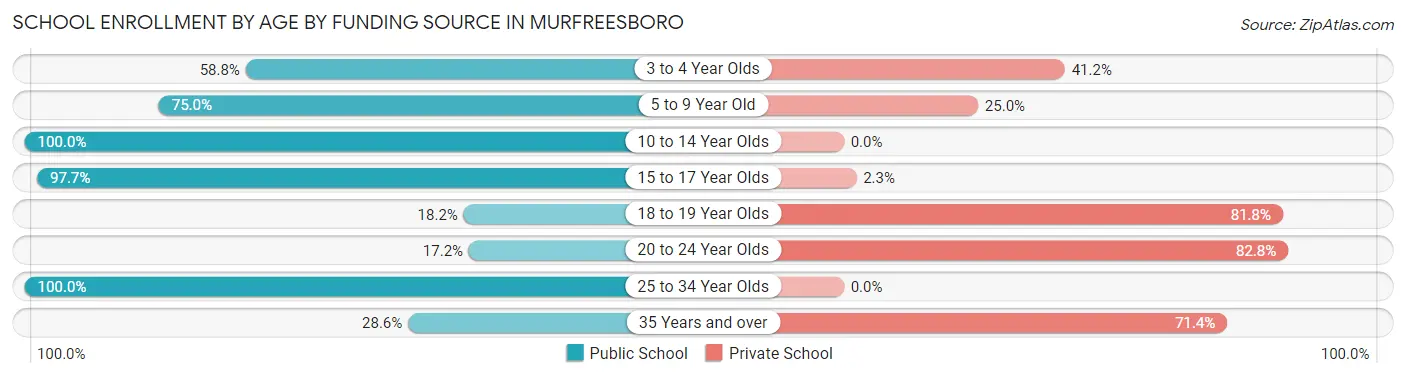
Out of a total of 998 students who are enrolled in schools in Murfreesboro, 460 (46.1%) attend a private institution, while the remaining 538 (53.9%) are enrolled in public schools. The age group of 20 to 24 year olds has the highest likelihood of being enrolled in private schools, with 168 (82.8% in the age bracket) enrolled. Conversely, the age group of 10 to 14 year olds has the lowest likelihood of being enrolled in a private school, with 119 (100.0% in the age bracket) attending a public institution.
| Age Bracket | Public School | Private School |
| 3 to 4 Year Olds | 10 (58.8%) | 7 (41.2%) |
| 5 to 9 Year Old | 141 (75.0%) | 47 (25.0%) |
| 10 to 14 Year Olds | 119 (100.0%) | 0 (0.0%) |
| 15 to 17 Year Olds | 125 (97.7%) | 3 (2.3%) |
| 18 to 19 Year Olds | 49 (18.2%) | 220 (81.8%) |
| 20 to 24 Year Olds | 35 (17.2%) | 168 (82.8%) |
| 25 to 34 Year Olds | 53 (100.0%) | 0 (0.0%) |
| 35 Years and over | 6 (28.6%) | 15 (71.4%) |
| Total | 538 (53.9%) | 460 (46.1%) |
Educational Attainment by Field of Study in Murfreesboro
Liberal arts & history (95 | 18.7%), education (87 | 17.1%), literature & languages (58 | 11.4%), arts & humanities (47 | 9.2%), and social sciences (44 | 8.7%) are the most common fields of study among 508 individuals in Murfreesboro who have obtained a bachelor's degree or higher.
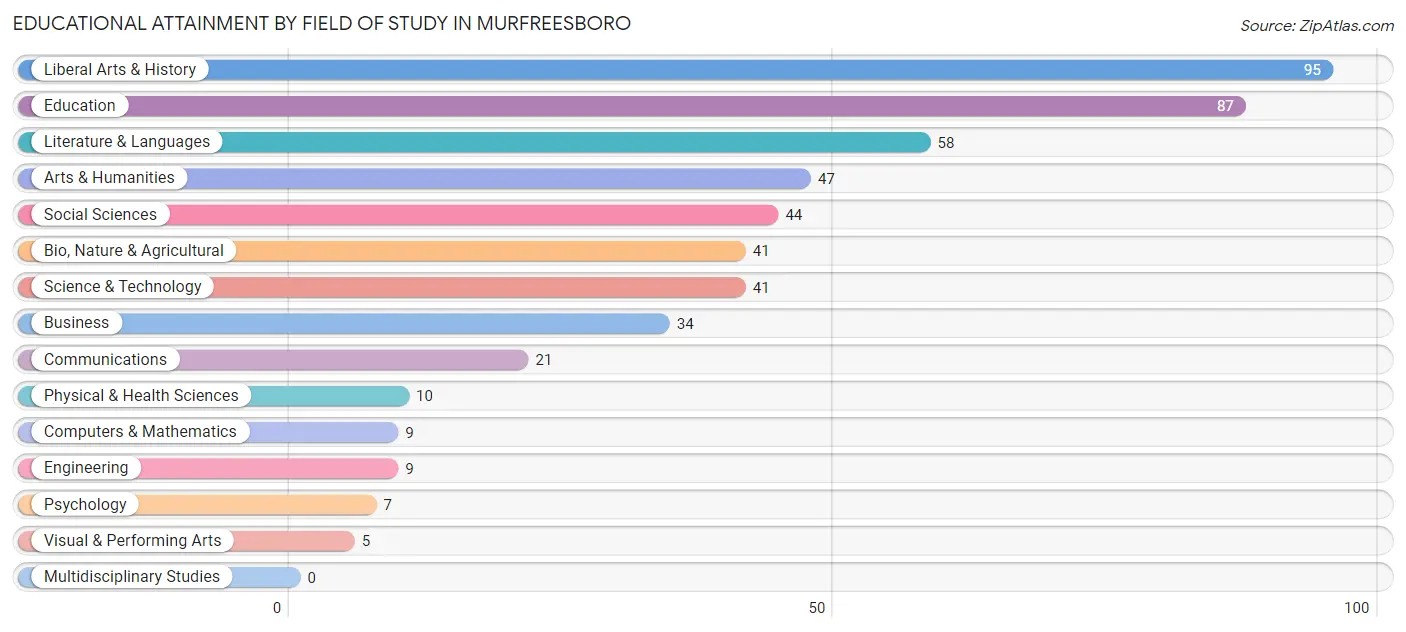
| Field of Study | # Graduates | % Graduates |
| Computers & Mathematics | 9 | 1.8% |
| Bio, Nature & Agricultural | 41 | 8.1% |
| Physical & Health Sciences | 10 | 2.0% |
| Psychology | 7 | 1.4% |
| Social Sciences | 44 | 8.7% |
| Engineering | 9 | 1.8% |
| Multidisciplinary Studies | 0 | 0.0% |
| Science & Technology | 41 | 8.1% |
| Business | 34 | 6.7% |
| Education | 87 | 17.1% |
| Literature & Languages | 58 | 11.4% |
| Liberal Arts & History | 95 | 18.7% |
| Visual & Performing Arts | 5 | 1.0% |
| Communications | 21 | 4.1% |
| Arts & Humanities | 47 | 9.2% |
| Total | 508 | 100.0% |
Transportation & Commute in Murfreesboro
Vehicle Availability by Sex in Murfreesboro
The most prevalent vehicle ownership categories in Murfreesboro are males with 1 vehicle (162, accounting for 45.6%) and females with 1 vehicle (149, making up 38.9%).
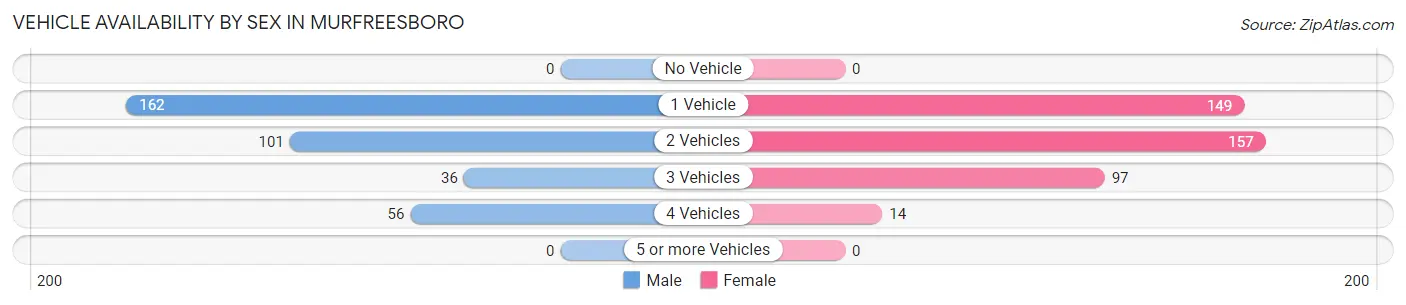
| Vehicles Available | Male | Female |
| No Vehicle | 0 (0.0%) | 0 (0.0%) |
| 1 Vehicle | 162 (45.6%) | 149 (35.7%) |
| 2 Vehicles | 101 (28.4%) | 157 (37.7%) |
| 3 Vehicles | 36 (10.1%) | 97 (23.3%) |
| 4 Vehicles | 56 (15.8%) | 14 (3.4%) |
| 5 or more Vehicles | 0 (0.0%) | 0 (0.0%) |
| Total | 355 (100.0%) | 417 (100.0%) |
Commute Time in Murfreesboro
The most frequently occuring commute durations in Murfreesboro are 45 to 59 minutes (199 commuters, 22.1%), 5 to 9 minutes (148 commuters, 16.5%), and 15 to 19 minutes (138 commuters, 15.3%).
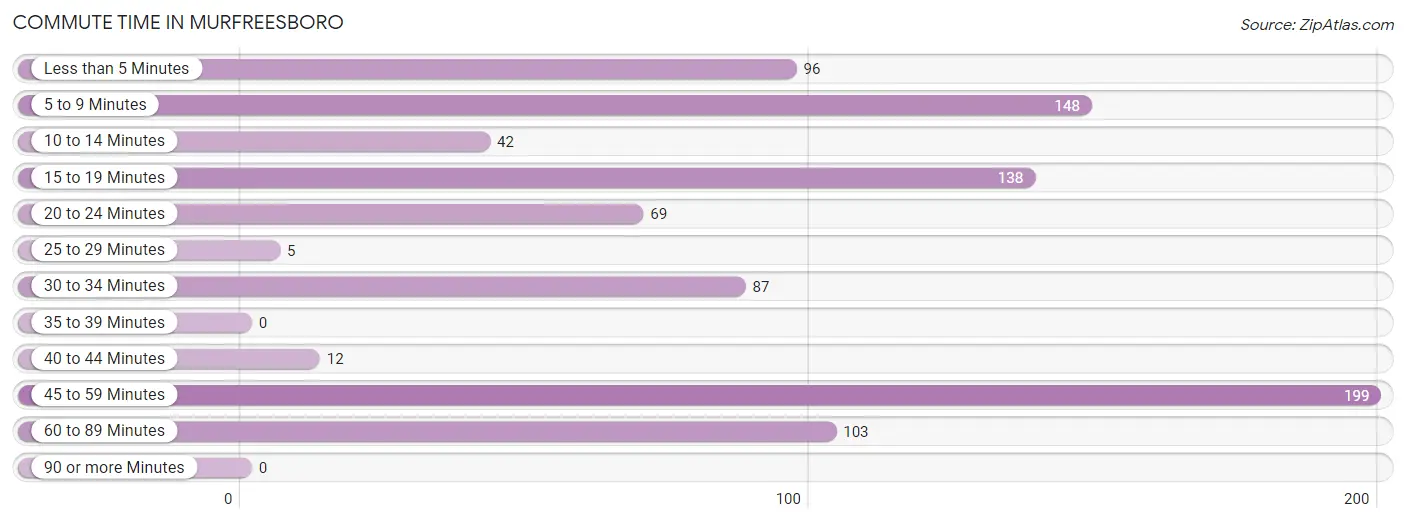
| Commute Time | # Commuters | % Commuters |
| Less than 5 Minutes | 96 | 10.7% |
| 5 to 9 Minutes | 148 | 16.5% |
| 10 to 14 Minutes | 42 | 4.7% |
| 15 to 19 Minutes | 138 | 15.3% |
| 20 to 24 Minutes | 69 | 7.7% |
| 25 to 29 Minutes | 5 | 0.6% |
| 30 to 34 Minutes | 87 | 9.7% |
| 35 to 39 Minutes | 0 | 0.0% |
| 40 to 44 Minutes | 12 | 1.3% |
| 45 to 59 Minutes | 199 | 22.1% |
| 60 to 89 Minutes | 103 | 11.5% |
| 90 or more Minutes | 0 | 0.0% |
Commute Time by Sex in Murfreesboro
The most common commute times in Murfreesboro are 15 to 19 minutes (87 commuters, 23.1%) for males and 5 to 9 minutes (124 commuters, 23.7%) for females.
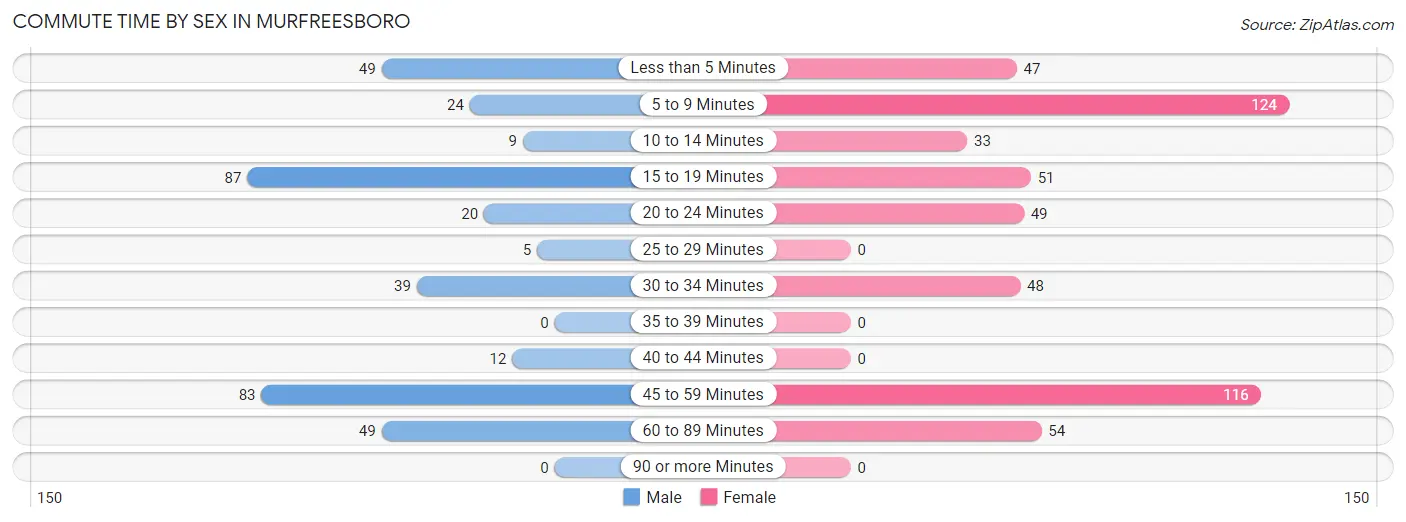
| Commute Time | Male | Female |
| Less than 5 Minutes | 49 (13.0%) | 47 (9.0%) |
| 5 to 9 Minutes | 24 (6.4%) | 124 (23.7%) |
| 10 to 14 Minutes | 9 (2.4%) | 33 (6.3%) |
| 15 to 19 Minutes | 87 (23.1%) | 51 (9.8%) |
| 20 to 24 Minutes | 20 (5.3%) | 49 (9.4%) |
| 25 to 29 Minutes | 5 (1.3%) | 0 (0.0%) |
| 30 to 34 Minutes | 39 (10.3%) | 48 (9.2%) |
| 35 to 39 Minutes | 0 (0.0%) | 0 (0.0%) |
| 40 to 44 Minutes | 12 (3.2%) | 0 (0.0%) |
| 45 to 59 Minutes | 83 (22.0%) | 116 (22.2%) |
| 60 to 89 Minutes | 49 (13.0%) | 54 (10.3%) |
| 90 or more Minutes | 0 (0.0%) | 0 (0.0%) |
Time of Departure to Work by Sex in Murfreesboro
The most frequent times of departure to work in Murfreesboro are 7:30 AM to 7:59 AM (105, 27.9%) for males and 12:00 PM to 3:59 PM (100, 19.2%) for females.
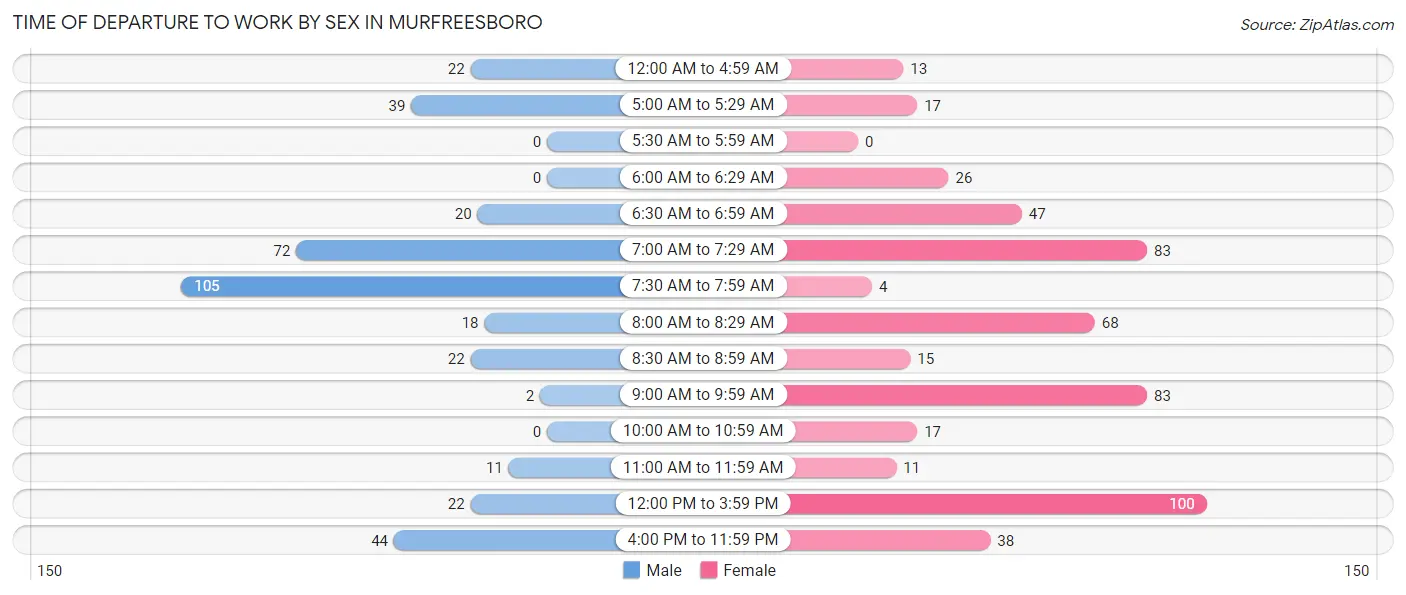
| Time of Departure | Male | Female |
| 12:00 AM to 4:59 AM | 22 (5.8%) | 13 (2.5%) |
| 5:00 AM to 5:29 AM | 39 (10.3%) | 17 (3.3%) |
| 5:30 AM to 5:59 AM | 0 (0.0%) | 0 (0.0%) |
| 6:00 AM to 6:29 AM | 0 (0.0%) | 26 (5.0%) |
| 6:30 AM to 6:59 AM | 20 (5.3%) | 47 (9.0%) |
| 7:00 AM to 7:29 AM | 72 (19.1%) | 83 (15.9%) |
| 7:30 AM to 7:59 AM | 105 (27.9%) | 4 (0.8%) |
| 8:00 AM to 8:29 AM | 18 (4.8%) | 68 (13.0%) |
| 8:30 AM to 8:59 AM | 22 (5.8%) | 15 (2.9%) |
| 9:00 AM to 9:59 AM | 2 (0.5%) | 83 (15.9%) |
| 10:00 AM to 10:59 AM | 0 (0.0%) | 17 (3.3%) |
| 11:00 AM to 11:59 AM | 11 (2.9%) | 11 (2.1%) |
| 12:00 PM to 3:59 PM | 22 (5.8%) | 100 (19.2%) |
| 4:00 PM to 11:59 PM | 44 (11.7%) | 38 (7.3%) |
| Total | 377 (100.0%) | 522 (100.0%) |
Housing Occupancy in Murfreesboro
Occupancy by Ownership in Murfreesboro
Of the total 972 dwellings in Murfreesboro, owner-occupied units account for 502 (51.6%), while renter-occupied units make up 470 (48.3%).
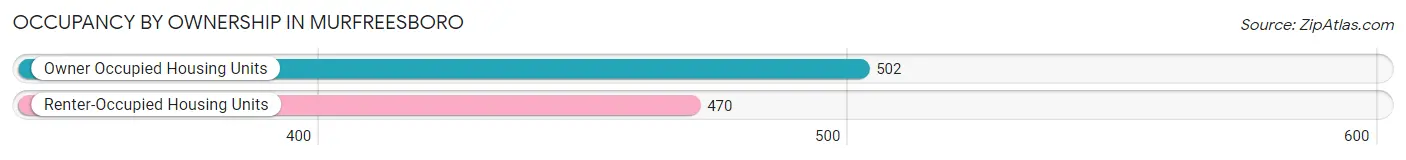
| Occupancy | # Housing Units | % Housing Units |
| Owner Occupied Housing Units | 502 | 51.6% |
| Renter-Occupied Housing Units | 470 | 48.3% |
| Total Occupied Housing Units | 972 | 100.0% |
Occupancy by Household Size in Murfreesboro
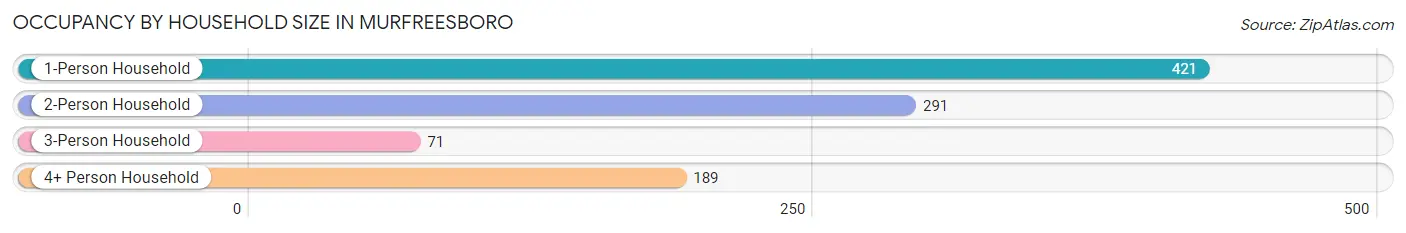
| Household Size | # Housing Units | % Housing Units |
| 1-Person Household | 421 | 43.3% |
| 2-Person Household | 291 | 29.9% |
| 3-Person Household | 71 | 7.3% |
| 4+ Person Household | 189 | 19.4% |
| Total Housing Units | 972 | 100.0% |
Occupancy by Ownership by Household Size in Murfreesboro
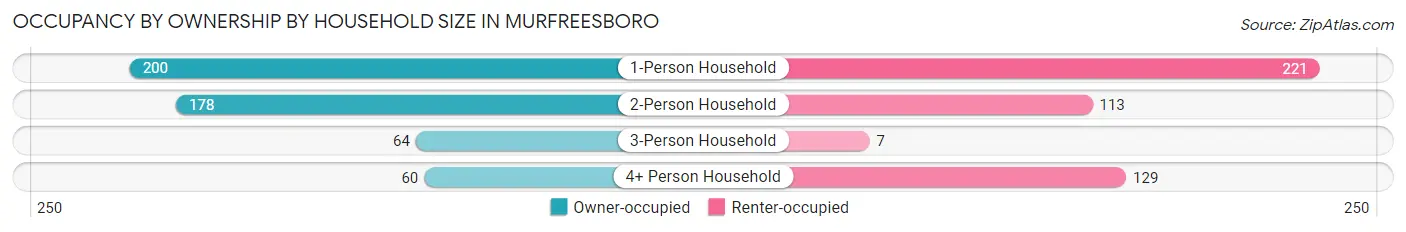
| Household Size | Owner-occupied | Renter-occupied |
| 1-Person Household | 200 (47.5%) | 221 (52.5%) |
| 2-Person Household | 178 (61.2%) | 113 (38.8%) |
| 3-Person Household | 64 (90.1%) | 7 (9.9%) |
| 4+ Person Household | 60 (31.8%) | 129 (68.2%) |
| Total Housing Units | 502 (51.6%) | 470 (48.3%) |
Occupancy by Educational Attainment in Murfreesboro
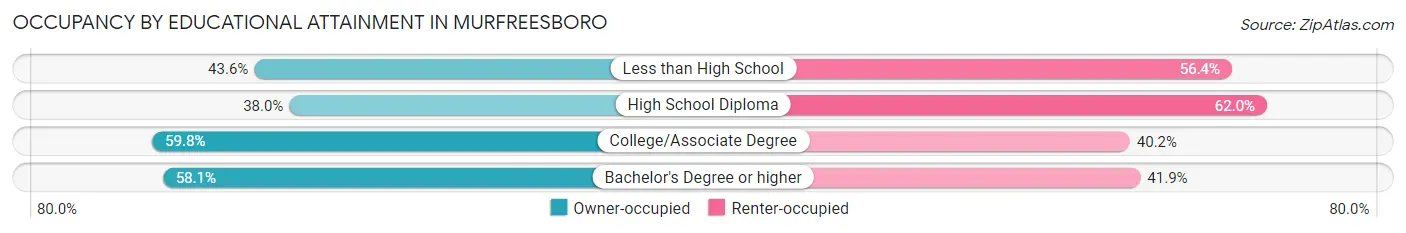
| Household Size | Owner-occupied | Renter-occupied |
| Less than High School | 34 (43.6%) | 44 (56.4%) |
| High School Diploma | 108 (38.0%) | 176 (62.0%) |
| College/Associate Degree | 202 (59.8%) | 136 (40.2%) |
| Bachelor's Degree or higher | 158 (58.1%) | 114 (41.9%) |
Occupancy by Age of Householder in Murfreesboro
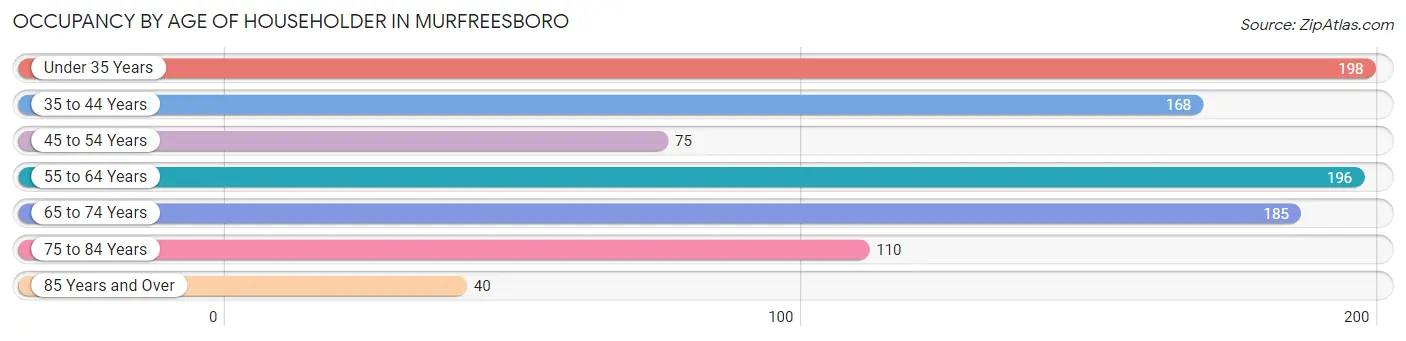
| Age Bracket | # Households | % Households |
| Under 35 Years | 198 | 20.4% |
| 35 to 44 Years | 168 | 17.3% |
| 45 to 54 Years | 75 | 7.7% |
| 55 to 64 Years | 196 | 20.2% |
| 65 to 74 Years | 185 | 19.0% |
| 75 to 84 Years | 110 | 11.3% |
| 85 Years and Over | 40 | 4.1% |
| Total | 972 | 100.0% |
Housing Finances in Murfreesboro
Median Income by Occupancy in Murfreesboro
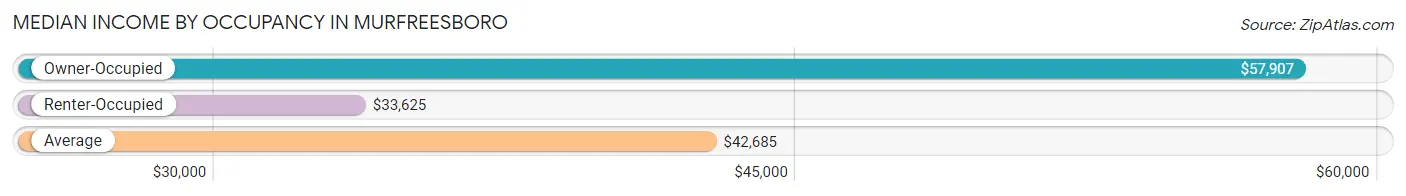
| Occupancy Type | # Households | Median Income |
| Owner-Occupied | 502 (51.6%) | $57,907 |
| Renter-Occupied | 470 (48.3%) | $33,625 |
| Average | 972 (100.0%) | $42,685 |
Occupancy by Householder Income Bracket in Murfreesboro
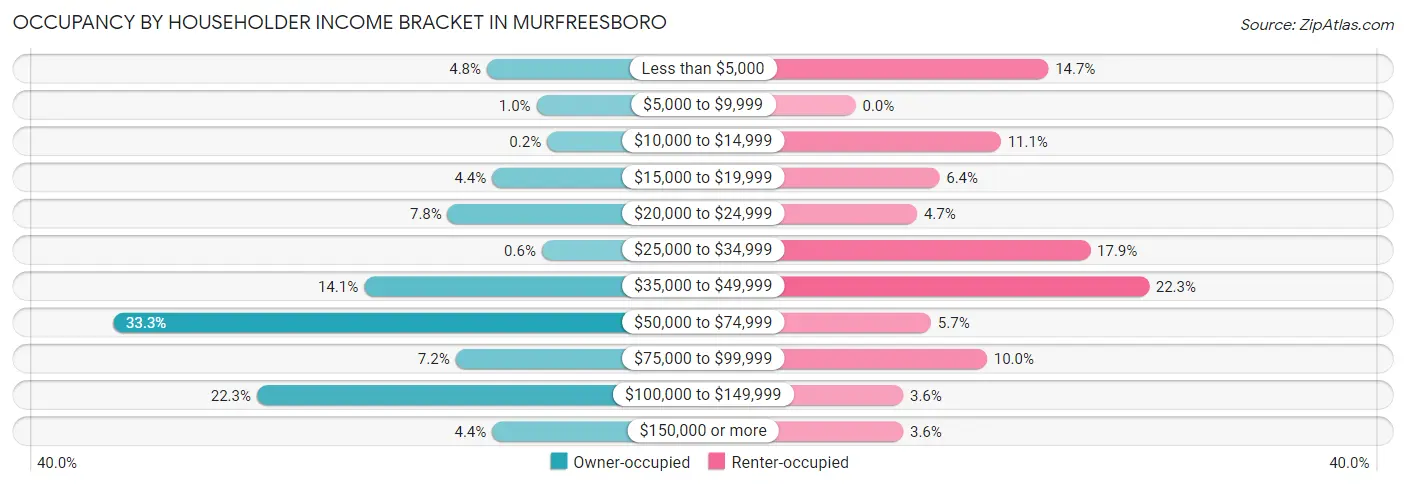
| Income Bracket | Owner-occupied | Renter-occupied |
| Less than $5,000 | 24 (4.8%) | 69 (14.7%) |
| $5,000 to $9,999 | 5 (1.0%) | 0 (0.0%) |
| $10,000 to $14,999 | 1 (0.2%) | 52 (11.1%) |
| $15,000 to $19,999 | 22 (4.4%) | 30 (6.4%) |
| $20,000 to $24,999 | 39 (7.8%) | 22 (4.7%) |
| $25,000 to $34,999 | 3 (0.6%) | 84 (17.9%) |
| $35,000 to $49,999 | 71 (14.1%) | 105 (22.3%) |
| $50,000 to $74,999 | 167 (33.3%) | 27 (5.7%) |
| $75,000 to $99,999 | 36 (7.2%) | 47 (10.0%) |
| $100,000 to $149,999 | 112 (22.3%) | 17 (3.6%) |
| $150,000 or more | 22 (4.4%) | 17 (3.6%) |
| Total | 502 (100.0%) | 470 (100.0%) |
Monthly Housing Cost Tiers in Murfreesboro
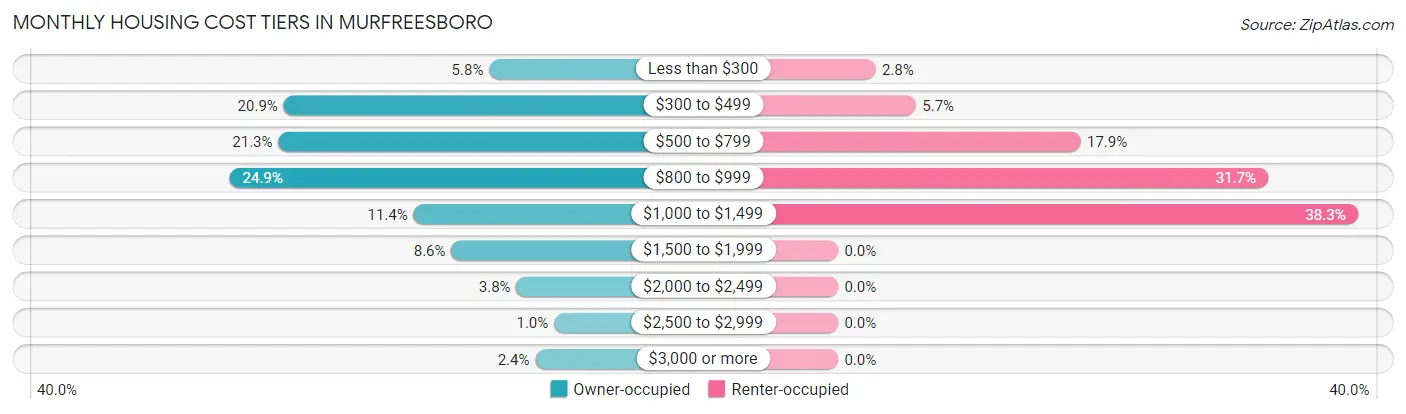
| Monthly Cost | Owner-occupied | Renter-occupied |
| Less than $300 | 29 (5.8%) | 13 (2.8%) |
| $300 to $499 | 105 (20.9%) | 27 (5.7%) |
| $500 to $799 | 107 (21.3%) | 84 (17.9%) |
| $800 to $999 | 125 (24.9%) | 149 (31.7%) |
| $1,000 to $1,499 | 57 (11.4%) | 180 (38.3%) |
| $1,500 to $1,999 | 43 (8.6%) | 0 (0.0%) |
| $2,000 to $2,499 | 19 (3.8%) | 0 (0.0%) |
| $2,500 to $2,999 | 5 (1.0%) | 0 (0.0%) |
| $3,000 or more | 12 (2.4%) | 0 (0.0%) |
| Total | 502 (100.0%) | 470 (100.0%) |
Physical Housing Characteristics in Murfreesboro
Housing Structures in Murfreesboro
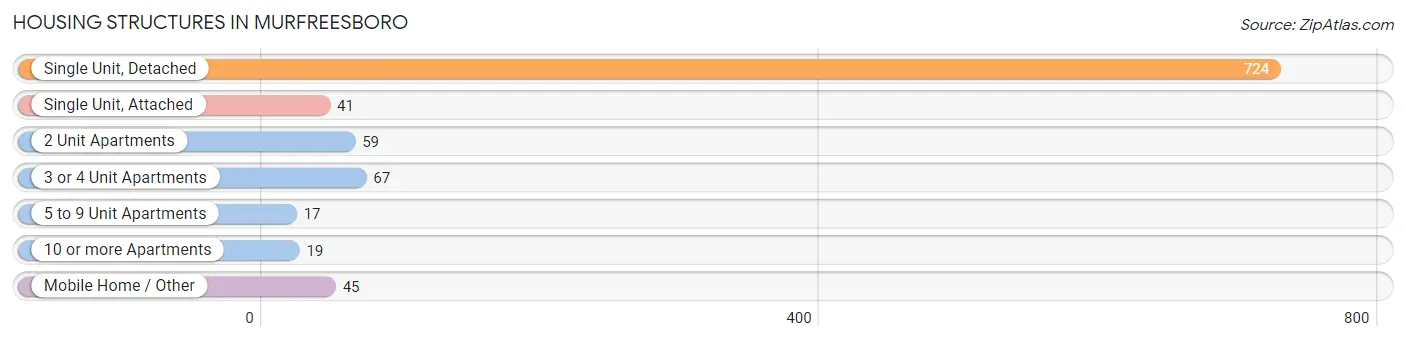
| Structure Type | # Housing Units | % Housing Units |
| Single Unit, Detached | 724 | 74.5% |
| Single Unit, Attached | 41 | 4.2% |
| 2 Unit Apartments | 59 | 6.1% |
| 3 or 4 Unit Apartments | 67 | 6.9% |
| 5 to 9 Unit Apartments | 17 | 1.8% |
| 10 or more Apartments | 19 | 1.9% |
| Mobile Home / Other | 45 | 4.6% |
| Total | 972 | 100.0% |
Housing Structures by Occupancy in Murfreesboro
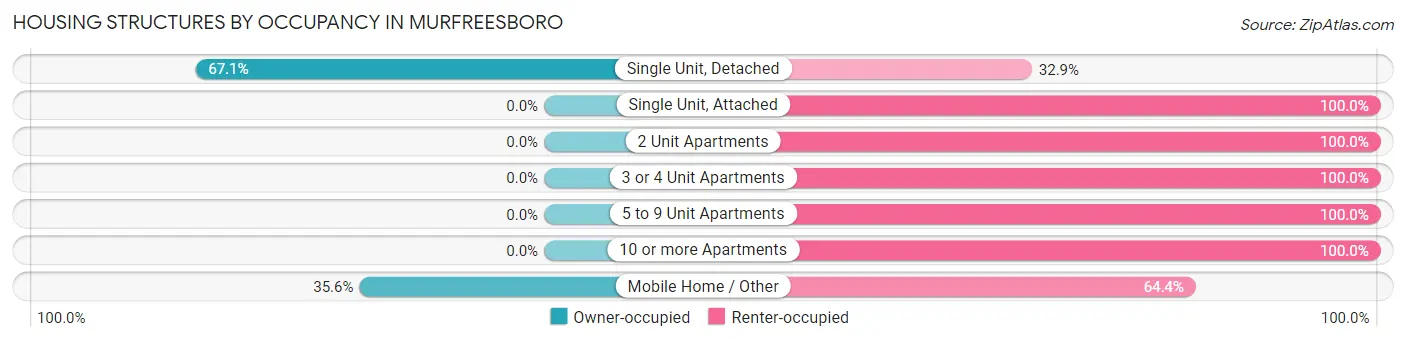
| Structure Type | Owner-occupied | Renter-occupied |
| Single Unit, Detached | 486 (67.1%) | 238 (32.9%) |
| Single Unit, Attached | 0 (0.0%) | 41 (100.0%) |
| 2 Unit Apartments | 0 (0.0%) | 59 (100.0%) |
| 3 or 4 Unit Apartments | 0 (0.0%) | 67 (100.0%) |
| 5 to 9 Unit Apartments | 0 (0.0%) | 17 (100.0%) |
| 10 or more Apartments | 0 (0.0%) | 19 (100.0%) |
| Mobile Home / Other | 16 (35.6%) | 29 (64.4%) |
| Total | 502 (51.6%) | 470 (48.3%) |
Housing Structures by Number of Rooms in Murfreesboro
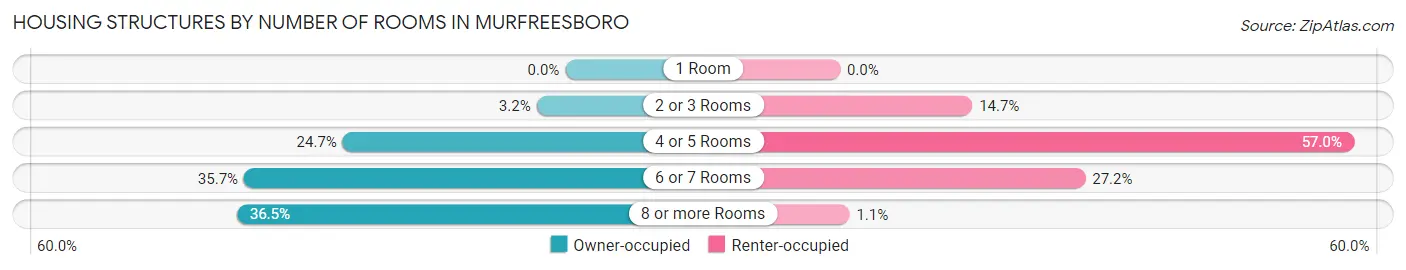
| Number of Rooms | Owner-occupied | Renter-occupied |
| 1 Room | 0 (0.0%) | 0 (0.0%) |
| 2 or 3 Rooms | 16 (3.2%) | 69 (14.7%) |
| 4 or 5 Rooms | 124 (24.7%) | 268 (57.0%) |
| 6 or 7 Rooms | 179 (35.7%) | 128 (27.2%) |
| 8 or more Rooms | 183 (36.4%) | 5 (1.1%) |
| Total | 502 (100.0%) | 470 (100.0%) |
Housing Structure by Heating Type in Murfreesboro
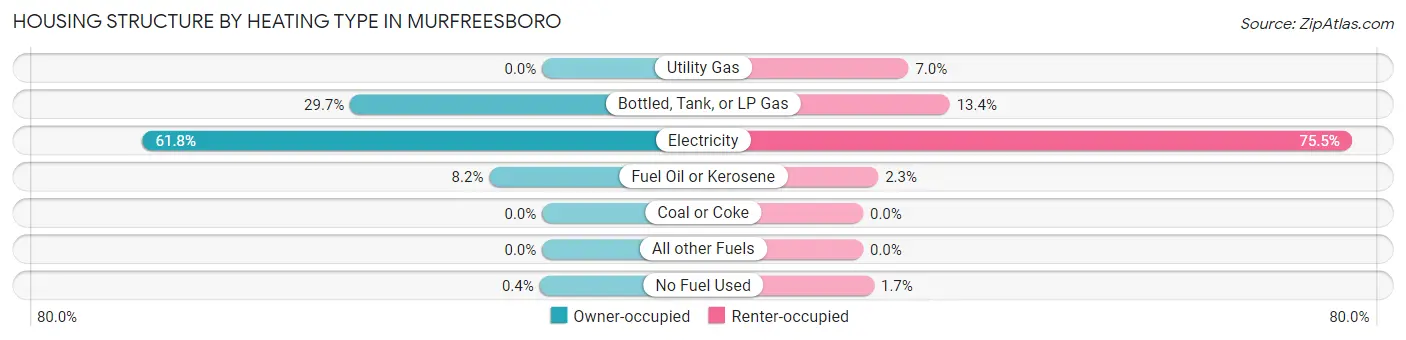
| Heating Type | Owner-occupied | Renter-occupied |
| Utility Gas | 0 (0.0%) | 33 (7.0%) |
| Bottled, Tank, or LP Gas | 149 (29.7%) | 63 (13.4%) |
| Electricity | 310 (61.8%) | 355 (75.5%) |
| Fuel Oil or Kerosene | 41 (8.2%) | 11 (2.3%) |
| Coal or Coke | 0 (0.0%) | 0 (0.0%) |
| All other Fuels | 0 (0.0%) | 0 (0.0%) |
| No Fuel Used | 2 (0.4%) | 8 (1.7%) |
| Total | 502 (100.0%) | 470 (100.0%) |
Household Vehicle Usage in Murfreesboro
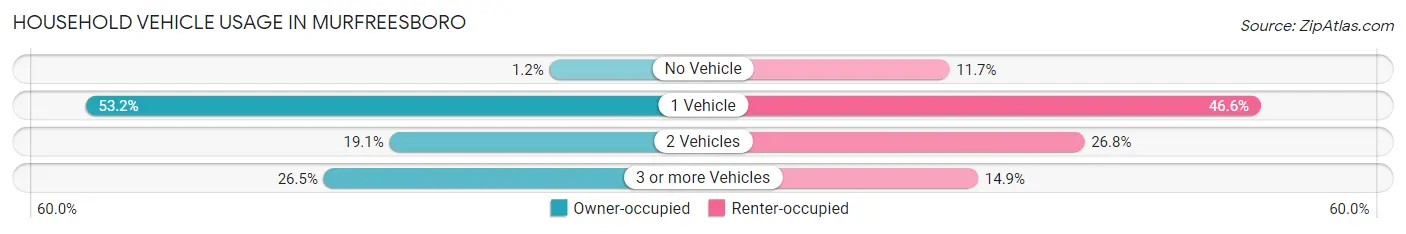
| Vehicles per Household | Owner-occupied | Renter-occupied |
| No Vehicle | 6 (1.2%) | 55 (11.7%) |
| 1 Vehicle | 267 (53.2%) | 219 (46.6%) |
| 2 Vehicles | 96 (19.1%) | 126 (26.8%) |
| 3 or more Vehicles | 133 (26.5%) | 70 (14.9%) |
| Total | 502 (100.0%) | 470 (100.0%) |
Real Estate & Mortgages in Murfreesboro
Real Estate and Mortgage Overview in Murfreesboro
| Characteristic | Without Mortgage | With Mortgage |
| Housing Units | 241 | 261 |
| Median Property Value | $124,300 | $152,100 |
| Median Household Income | $59,563 | $9 |
| Monthly Housing Costs | $482 | $12 |
| Real Estate Taxes | $1,375 | $0 |
Property Value by Mortgage Status in Murfreesboro
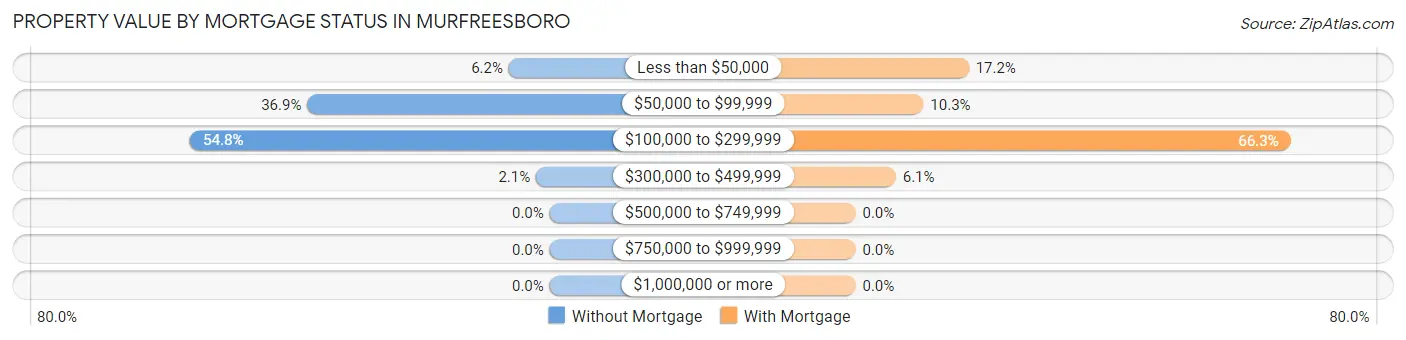
| Property Value | Without Mortgage | With Mortgage |
| Less than $50,000 | 15 (6.2%) | 45 (17.2%) |
| $50,000 to $99,999 | 89 (36.9%) | 27 (10.3%) |
| $100,000 to $299,999 | 132 (54.8%) | 173 (66.3%) |
| $300,000 to $499,999 | 5 (2.1%) | 16 (6.1%) |
| $500,000 to $749,999 | 0 (0.0%) | 0 (0.0%) |
| $750,000 to $999,999 | 0 (0.0%) | 0 (0.0%) |
| $1,000,000 or more | 0 (0.0%) | 0 (0.0%) |
| Total | 241 (100.0%) | 261 (100.0%) |
Household Income by Mortgage Status in Murfreesboro
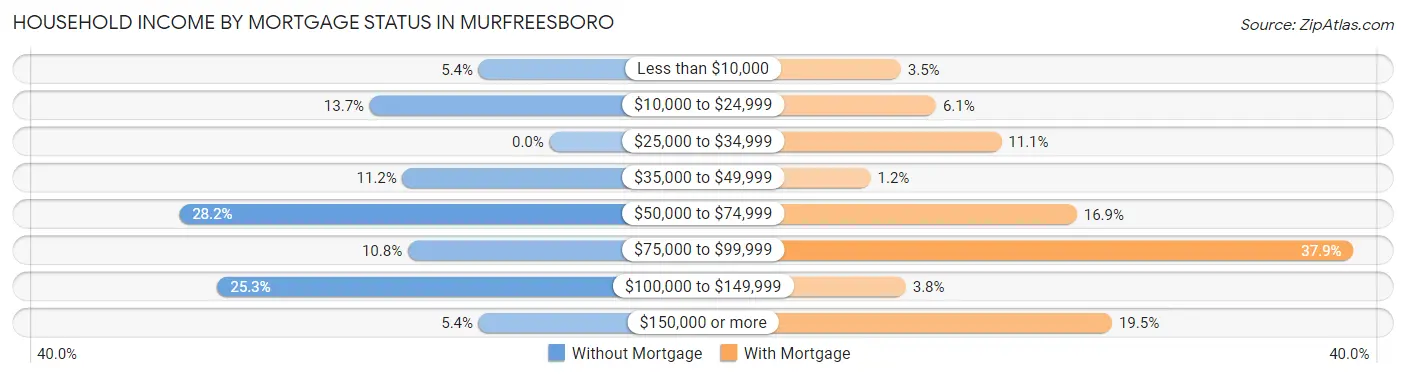
| Household Income | Without Mortgage | With Mortgage |
| Less than $10,000 | 13 (5.4%) | 9 (3.5%) |
| $10,000 to $24,999 | 33 (13.7%) | 16 (6.1%) |
| $25,000 to $34,999 | 0 (0.0%) | 29 (11.1%) |
| $35,000 to $49,999 | 27 (11.2%) | 3 (1.1%) |
| $50,000 to $74,999 | 68 (28.2%) | 44 (16.9%) |
| $75,000 to $99,999 | 26 (10.8%) | 99 (37.9%) |
| $100,000 to $149,999 | 61 (25.3%) | 10 (3.8%) |
| $150,000 or more | 13 (5.4%) | 51 (19.5%) |
| Total | 241 (100.0%) | 261 (100.0%) |
Property Value to Household Income Ratio in Murfreesboro
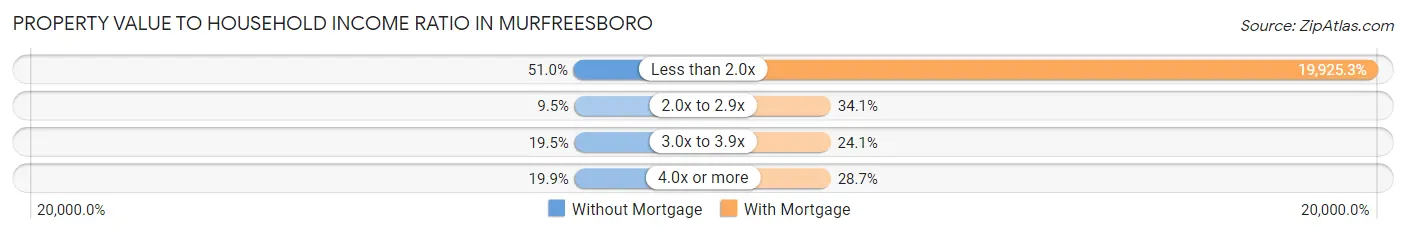
| Value-to-Income Ratio | Without Mortgage | With Mortgage |
| Less than 2.0x | 123 (51.0%) | 52,005 (19,925.3%) |
| 2.0x to 2.9x | 23 (9.5%) | 89 (34.1%) |
| 3.0x to 3.9x | 47 (19.5%) | 63 (24.1%) |
| 4.0x or more | 48 (19.9%) | 75 (28.7%) |
| Total | 241 (100.0%) | 261 (100.0%) |
Real Estate Taxes by Mortgage Status in Murfreesboro
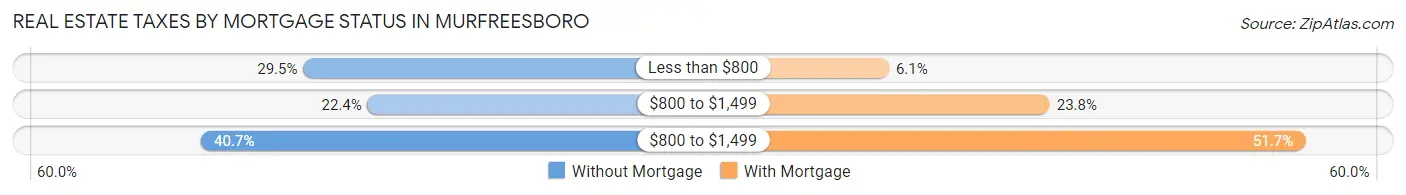
| Property Taxes | Without Mortgage | With Mortgage |
| Less than $800 | 71 (29.5%) | 16 (6.1%) |
| $800 to $1,499 | 54 (22.4%) | 62 (23.7%) |
| $800 to $1,499 | 98 (40.7%) | 135 (51.7%) |
| Total | 241 (100.0%) | 261 (100.0%) |
Health & Disability in Murfreesboro
Health Insurance Coverage by Age in Murfreesboro
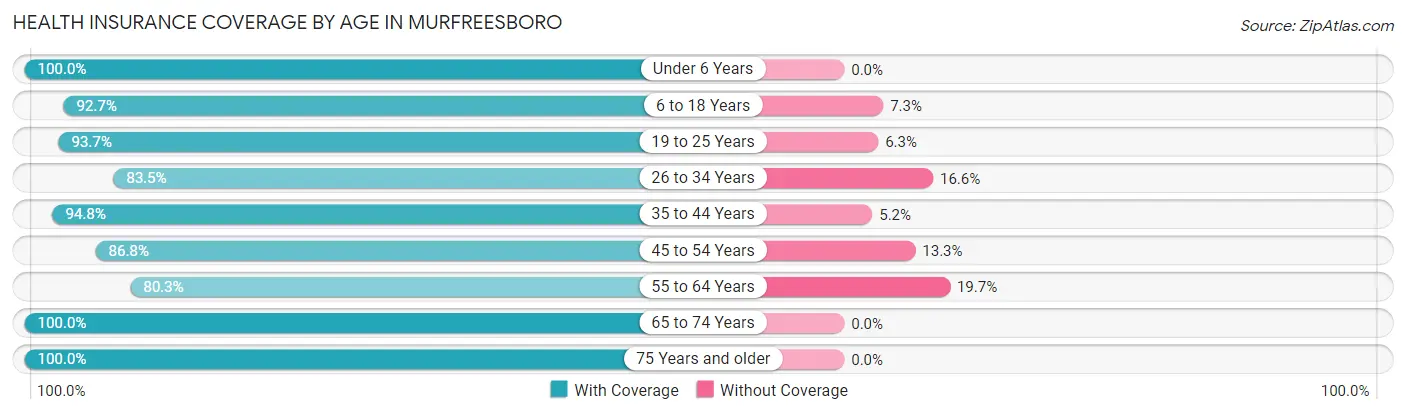
| Age Bracket | With Coverage | Without Coverage |
| Under 6 Years | 167 (100.0%) | 0 (0.0%) |
| 6 to 18 Years | 511 (92.7%) | 40 (7.3%) |
| 19 to 25 Years | 414 (93.7%) | 28 (6.3%) |
| 26 to 34 Years | 247 (83.5%) | 49 (16.6%) |
| 35 to 44 Years | 218 (94.8%) | 12 (5.2%) |
| 45 to 54 Years | 144 (86.8%) | 22 (13.3%) |
| 55 to 64 Years | 167 (80.3%) | 41 (19.7%) |
| 65 to 74 Years | 272 (100.0%) | 0 (0.0%) |
| 75 Years and older | 239 (100.0%) | 0 (0.0%) |
| Total | 2,379 (92.5%) | 192 (7.5%) |
Health Insurance Coverage by Citizenship Status in Murfreesboro
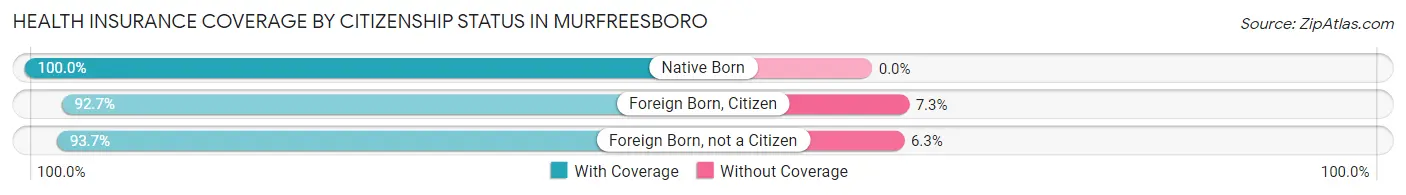
| Citizenship Status | With Coverage | Without Coverage |
| Native Born | 167 (100.0%) | 0 (0.0%) |
| Foreign Born, Citizen | 511 (92.7%) | 40 (7.3%) |
| Foreign Born, not a Citizen | 414 (93.7%) | 28 (6.3%) |
Health Insurance Coverage by Household Income in Murfreesboro
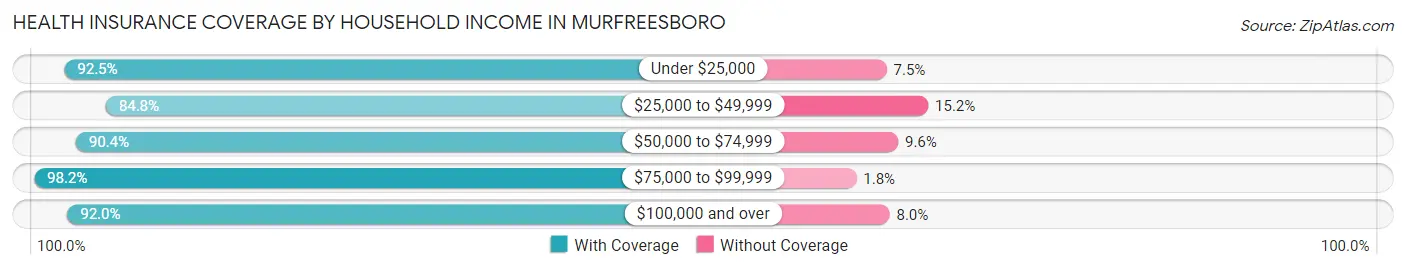
| Household Income | With Coverage | Without Coverage |
| Under $25,000 | 608 (92.5%) | 49 (7.5%) |
| $25,000 to $49,999 | 345 (84.8%) | 62 (15.2%) |
| $50,000 to $74,999 | 358 (90.4%) | 38 (9.6%) |
| $75,000 to $99,999 | 220 (98.2%) | 4 (1.8%) |
| $100,000 and over | 402 (92.0%) | 35 (8.0%) |
Public vs Private Health Insurance Coverage by Age in Murfreesboro
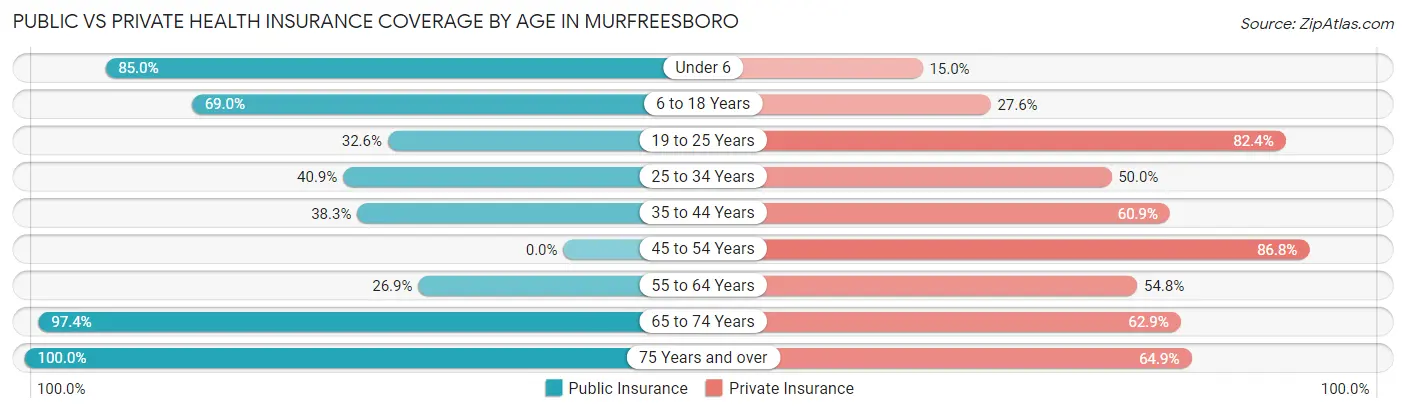
| Age Bracket | Public Insurance | Private Insurance |
| Under 6 | 142 (85.0%) | 25 (15.0%) |
| 6 to 18 Years | 380 (69.0%) | 152 (27.6%) |
| 19 to 25 Years | 144 (32.6%) | 364 (82.4%) |
| 25 to 34 Years | 121 (40.9%) | 148 (50.0%) |
| 35 to 44 Years | 88 (38.3%) | 140 (60.9%) |
| 45 to 54 Years | 0 (0.0%) | 144 (86.8%) |
| 55 to 64 Years | 56 (26.9%) | 114 (54.8%) |
| 65 to 74 Years | 265 (97.4%) | 171 (62.9%) |
| 75 Years and over | 239 (100.0%) | 155 (64.8%) |
| Total | 1,435 (55.8%) | 1,413 (55.0%) |
Disability Status by Sex by Age in Murfreesboro
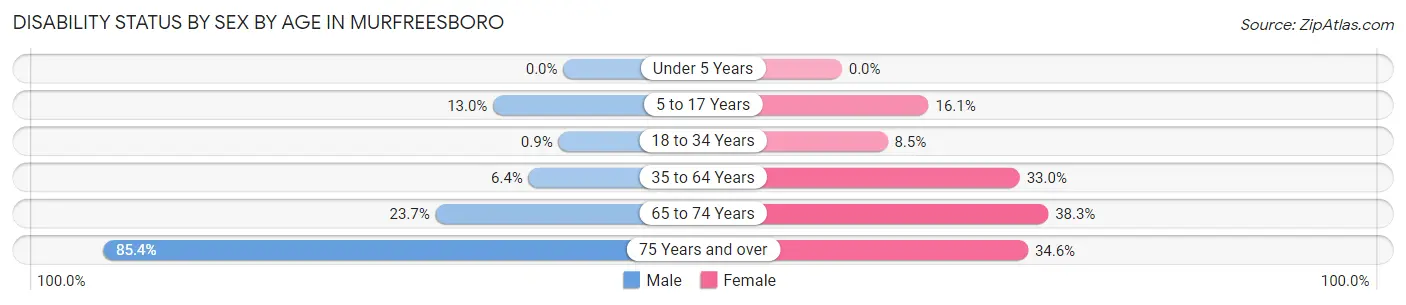
| Age Bracket | Male | Female |
| Under 5 Years | 0 (0.0%) | 0 (0.0%) |
| 5 to 17 Years | 28 (13.0%) | 38 (16.1%) |
| 18 to 34 Years | 3 (0.9%) | 43 (8.5%) |
| 35 to 64 Years | 11 (6.4%) | 143 (33.0%) |
| 65 to 74 Years | 28 (23.7%) | 59 (38.3%) |
| 75 Years and over | 41 (85.4%) | 66 (34.5%) |
Disability Class by Sex by Age in Murfreesboro
Disability Class: Hearing Difficulty
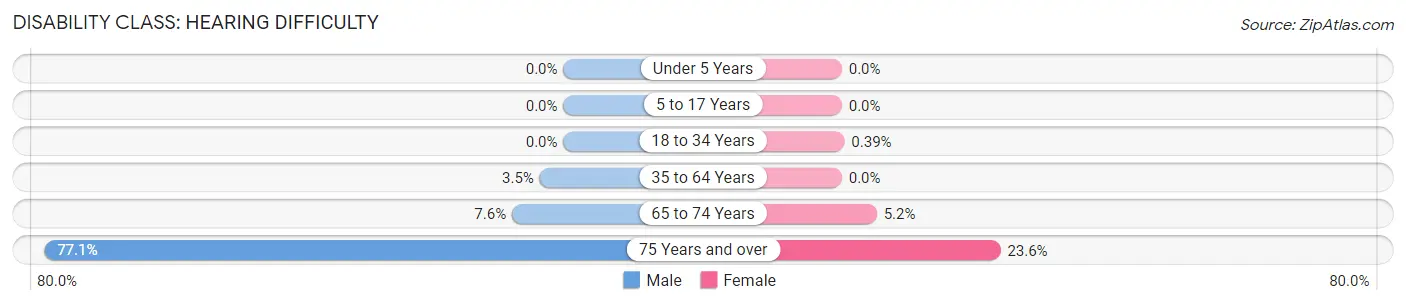
| Age Bracket | Male | Female |
| Under 5 Years | 0 (0.0%) | 0 (0.0%) |
| 5 to 17 Years | 0 (0.0%) | 0 (0.0%) |
| 18 to 34 Years | 0 (0.0%) | 2 (0.4%) |
| 35 to 64 Years | 6 (3.5%) | 0 (0.0%) |
| 65 to 74 Years | 9 (7.6%) | 8 (5.2%) |
| 75 Years and over | 37 (77.1%) | 45 (23.6%) |
Disability Class: Vision Difficulty
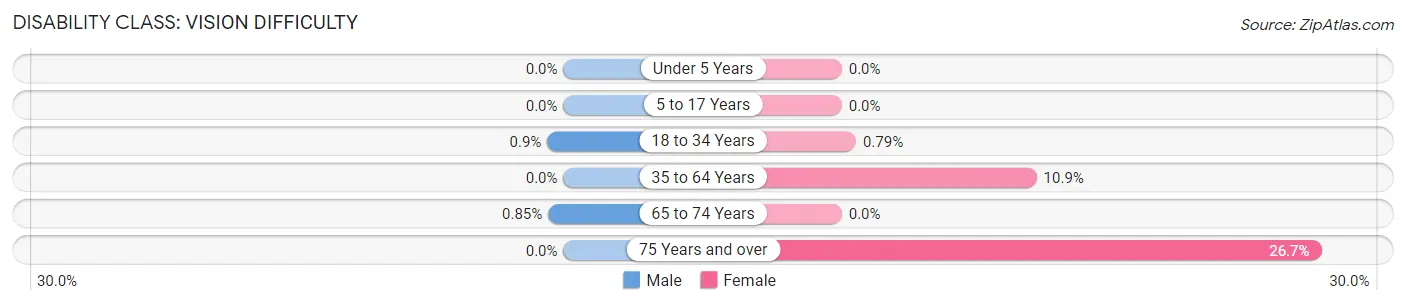
| Age Bracket | Male | Female |
| Under 5 Years | 0 (0.0%) | 0 (0.0%) |
| 5 to 17 Years | 0 (0.0%) | 0 (0.0%) |
| 18 to 34 Years | 3 (0.9%) | 4 (0.8%) |
| 35 to 64 Years | 0 (0.0%) | 47 (10.8%) |
| 65 to 74 Years | 1 (0.9%) | 0 (0.0%) |
| 75 Years and over | 0 (0.0%) | 51 (26.7%) |
Disability Class: Cognitive Difficulty
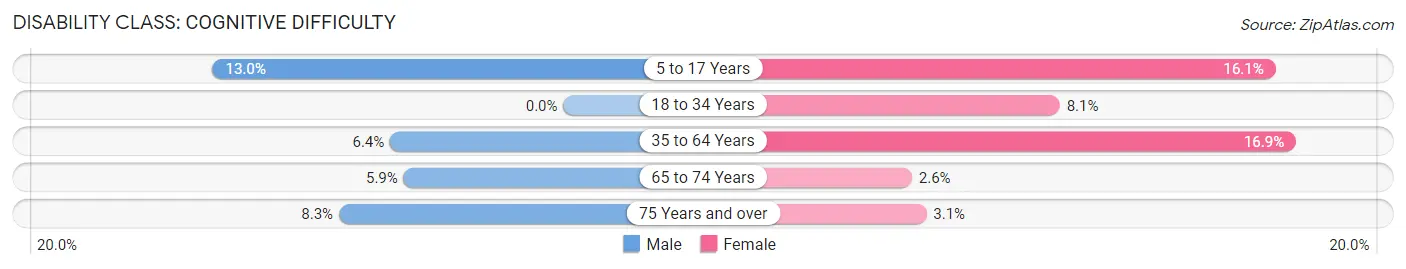
| Age Bracket | Male | Female |
| 5 to 17 Years | 28 (13.0%) | 38 (16.1%) |
| 18 to 34 Years | 0 (0.0%) | 41 (8.1%) |
| 35 to 64 Years | 11 (6.4%) | 73 (16.9%) |
| 65 to 74 Years | 7 (5.9%) | 4 (2.6%) |
| 75 Years and over | 4 (8.3%) | 6 (3.1%) |
Disability Class: Ambulatory Difficulty
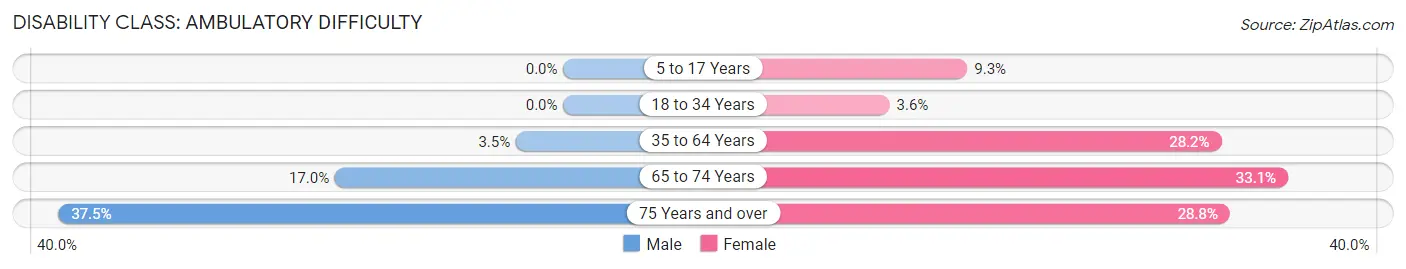
| Age Bracket | Male | Female |
| 5 to 17 Years | 0 (0.0%) | 22 (9.3%) |
| 18 to 34 Years | 0 (0.0%) | 18 (3.5%) |
| 35 to 64 Years | 6 (3.5%) | 122 (28.2%) |
| 65 to 74 Years | 20 (17.0%) | 51 (33.1%) |
| 75 Years and over | 18 (37.5%) | 55 (28.8%) |
Disability Class: Self-Care Difficulty
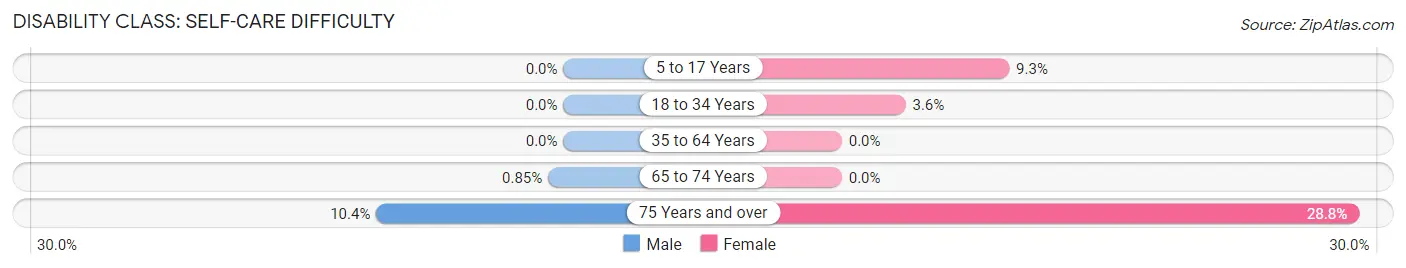
| Age Bracket | Male | Female |
| 5 to 17 Years | 0 (0.0%) | 22 (9.3%) |
| 18 to 34 Years | 0 (0.0%) | 18 (3.5%) |
| 35 to 64 Years | 0 (0.0%) | 0 (0.0%) |
| 65 to 74 Years | 1 (0.9%) | 0 (0.0%) |
| 75 Years and over | 5 (10.4%) | 55 (28.8%) |
Technology Access in Murfreesboro
Computing Device Access in Murfreesboro
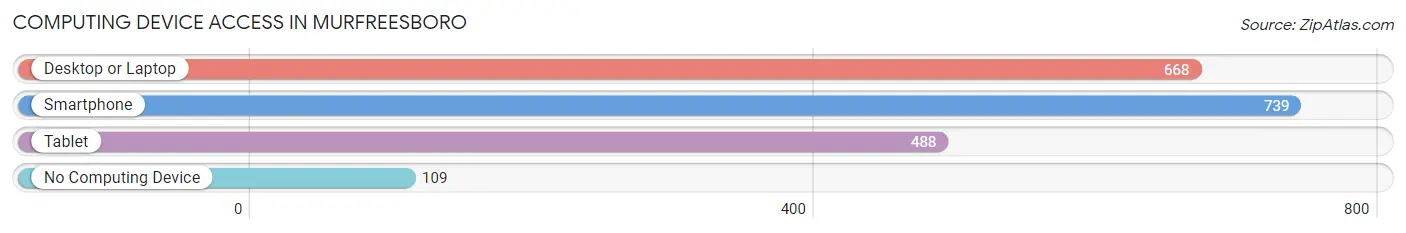
| Device Type | # Households | % Households |
| Desktop or Laptop | 668 | 68.7% |
| Smartphone | 739 | 76.0% |
| Tablet | 488 | 50.2% |
| No Computing Device | 109 | 11.2% |
| Total | 972 | 100.0% |
Internet Access in Murfreesboro
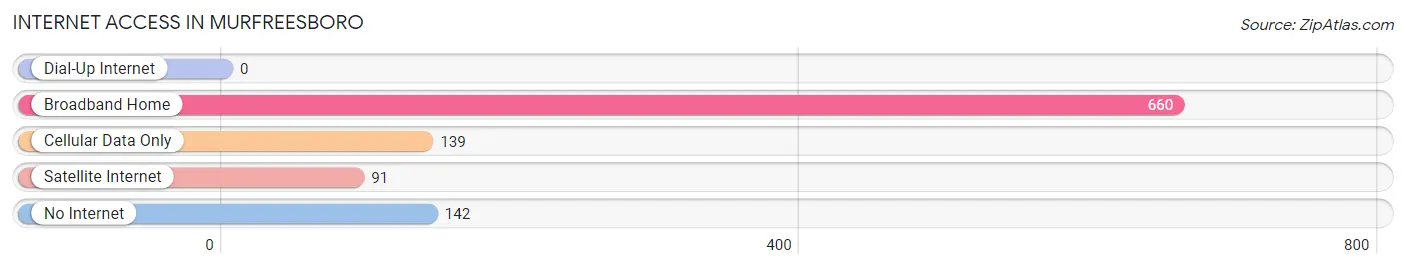
| Internet Type | # Households | % Households |
| Dial-Up Internet | 0 | 0.0% |
| Broadband Home | 660 | 67.9% |
| Cellular Data Only | 139 | 14.3% |
| Satellite Internet | 91 | 9.4% |
| No Internet | 142 | 14.6% |
| Total | 972 | 100.0% |
Murfreesboro Summary
Murfreesboro, North Carolina is a small town located in Hertford County, North Carolina. It is situated on the Chowan River, approximately 30 miles from the Virginia border. The town has a population of approximately 1,500 people and is the county seat of Hertford County.
Geography
Murfreesboro is located in the Coastal Plain region of North Carolina, which is characterized by flat terrain and sandy soils. The town is situated on the Chowan River, which is a tributary of the Albemarle Sound. The town is surrounded by a number of small towns and villages, including Ahoskie, Cofield, and Winton. The town is located approximately 30 miles from the Virginia border and is approximately 90 miles from the state capital of Raleigh.
History
Murfreesboro was founded in 1790 by William Murfree, a Revolutionary War veteran. The town was named after him and was originally a trading post. In 1810, the town was officially incorporated and became the county seat of Hertford County. During the Civil War, Murfreesboro was the site of a major battle between Union and Confederate forces. The town was also the site of a major battle during the Revolutionary War.
Economy
The economy of Murfreesboro is largely based on agriculture and manufacturing. The town is home to several large farms, which produce a variety of crops, including corn, soybeans, and cotton. The town is also home to several manufacturing companies, which produce a variety of products, including furniture, textiles, and paper products. The town is also home to a number of small businesses, including restaurants, retail stores, and service providers.
Demographics
As of the 2010 census, the population of Murfreesboro was 1,500. The racial makeup of the town was 79.2% White, 17.2% African American, 0.7% Native American, 0.3% Asian, and 2.6% from other races. The median household income in the town was $30,938, and the median family income was $37,813. The per capita income in the town was $15,945.
Murfreesboro is a small town with a rich history and a diverse economy. The town is home to a number of farms and manufacturing companies, as well as a variety of small businesses. The town has a population of approximately 1,500 people and is the county seat of Hertford County. The town is located in the Coastal Plain region of North Carolina and is surrounded by a number of small towns and villages. The town is situated on the Chowan River and is approximately 30 miles from the Virginia border.
Common Questions
What is Per Capita Income in Murfreesboro?
Per Capita income in Murfreesboro is $27,672.
What is the Median Family Income in Murfreesboro?
Median Family Income in Murfreesboro is $55,759.
What is the Median Household income in Murfreesboro?
Median Household Income in Murfreesboro is $42,685.
What is Income or Wage Gap in Murfreesboro?
Income or Wage Gap in Murfreesboro is 45.4%.
Women in Murfreesboro earn 54.6 cents for every dollar earned by a man.
What is Family Income Deficit in Murfreesboro?
Family Income Deficit in Murfreesboro is $15,722.
Families that are below poverty line in Murfreesboro earn $15,722 less on average than the poverty threshold level.
What is Inequality or Gini Index in Murfreesboro?
Inequality or Gini Index in Murfreesboro is 0.54.
What is the Total Population of Murfreesboro?
Total Population of Murfreesboro is 2,612.
What is the Total Male Population of Murfreesboro?
Total Male Population of Murfreesboro is 1,037.
What is the Total Female Population of Murfreesboro?
Total Female Population of Murfreesboro is 1,575.
What is the Ratio of Males per 100 Females in Murfreesboro?
There are 65.84 Males per 100 Females in Murfreesboro.
What is the Ratio of Females per 100 Males in Murfreesboro?
There are 151.88 Females per 100 Males in Murfreesboro.
What is the Median Population Age in Murfreesboro?
Median Population Age in Murfreesboro is 29.1 Years.
What is the Average Family Size in Murfreesboro
Average Family Size in Murfreesboro is 3.1 People.
What is the Average Household Size in Murfreesboro
Average Household Size in Murfreesboro is 2.2 People.
How Large is the Labor Force in Murfreesboro?
There are 1,033 People in the Labor Forcein in Murfreesboro.
What is the Percentage of People in the Labor Force in Murfreesboro?
49.8% of People are in the Labor Force in Murfreesboro.
What is the Unemployment Rate in Murfreesboro?
Unemployment Rate in Murfreesboro is 5.0%.