East Spencer, NC Map & Demographics
East Spencer Map
East Spencer Overview
$25,641
PER CAPITA INCOME
$61,071
AVG FAMILY INCOME
$37,917
AVG HOUSEHOLD INCOME
16.5%
WAGE / INCOME GAP [ % ]
83.5¢/ $1
WAGE / INCOME GAP [ $ ]
0.51
INEQUALITY / GINI INDEX
1,216
TOTAL POPULATION
557
MALE POPULATION
659
FEMALE POPULATION
84.52
MALES / 100 FEMALES
118.31
FEMALES / 100 MALES
52.9
MEDIAN AGE
2.4
AVG FAMILY SIZE
1.9
AVG HOUSEHOLD SIZE
435
LABOR FORCE [ PEOPLE ]
40.1%
PERCENT IN LABOR FORCE
8.0%
UNEMPLOYMENT RATE
East Spencer Zip Codes
Income in East Spencer
Income Overview in East Spencer
Per Capita Income in East Spencer is $25,641, while median incomes of families and households are $61,071 and $37,917 respectively.
| Characteristic | Number | Measure |
| Per Capita Income | 1,216 | $25,641 |
| Median Family Income | 342 | $61,071 |
| Mean Family Income | 342 | $78,927 |
| Median Household Income | 631 | $37,917 |
| Mean Household Income | 631 | $55,417 |
| Income Deficit | 342 | $0 |
| Wage / Income Gap (%) | 1,216 | 16.53% |
| Wage / Income Gap ($) | 1,216 | 83.47¢ per $1 |
| Gini / Inequality Index | 1,216 | 0.51 |
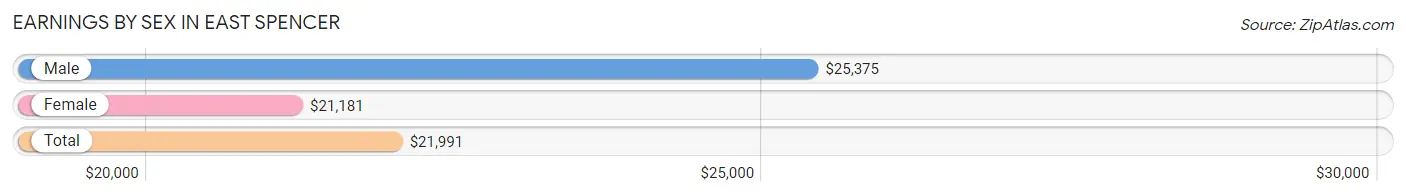
Earnings by Sex in East Spencer
Average Earnings in East Spencer are $21,991, $25,375 for men and $21,181 for women, a difference of 16.5%.
| Sex | Number | Average Earnings |
| Male | 237 (53.6%) | $25,375 |
| Female | 205 (46.4%) | $21,181 |
| Total | 442 (100.0%) | $21,991 |
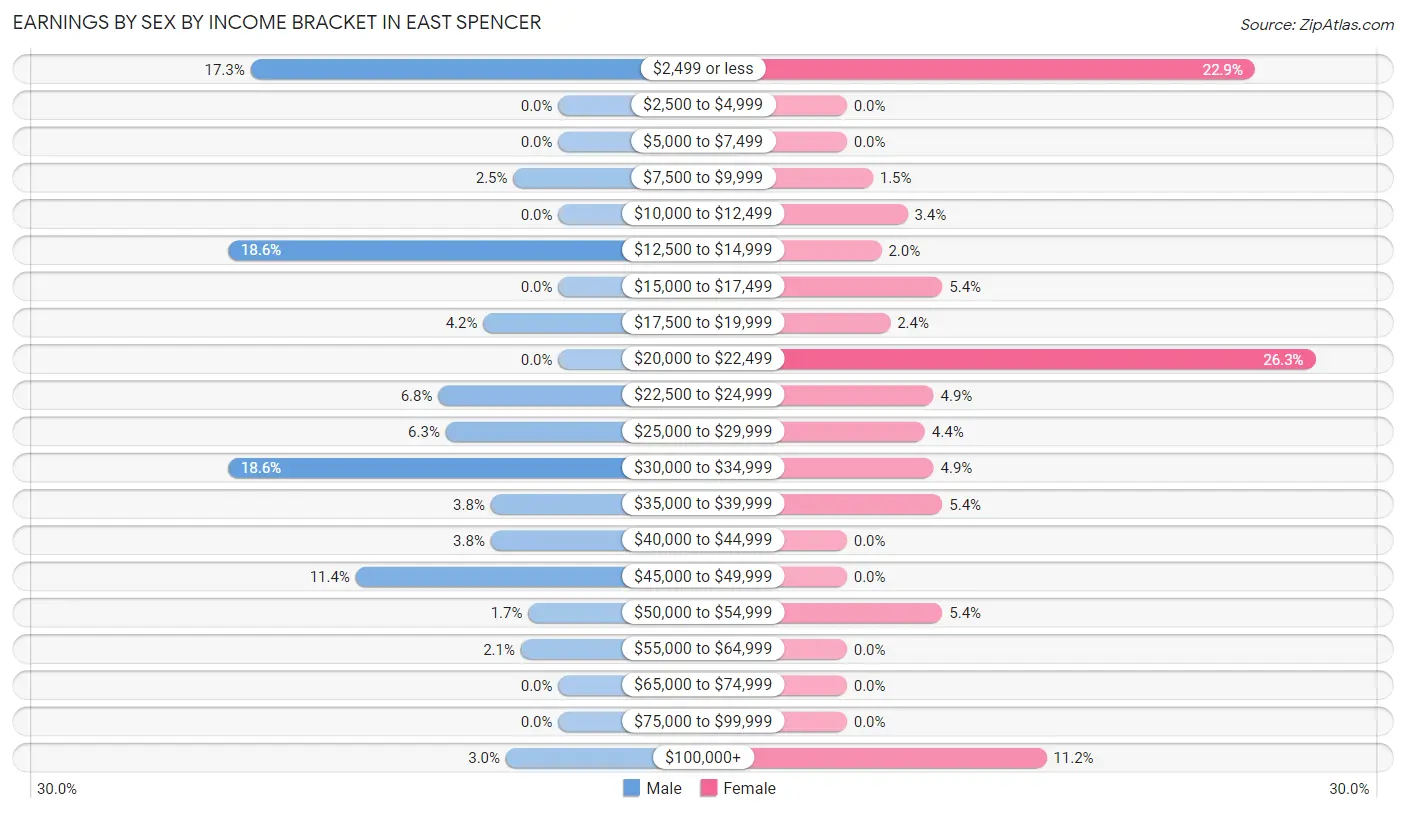
Earnings by Sex by Income Bracket in East Spencer
The most common earnings brackets in East Spencer are $12,500 to $14,999 for men (44 | 18.6%) and $20,000 to $22,499 for women (54 | 26.3%).
| Income | Male | Female |
| $2,499 or less | 41 (17.3%) | 47 (22.9%) |
| $2,500 to $4,999 | 0 (0.0%) | 0 (0.0%) |
| $5,000 to $7,499 | 0 (0.0%) | 0 (0.0%) |
| $7,500 to $9,999 | 6 (2.5%) | 3 (1.5%) |
| $10,000 to $12,499 | 0 (0.0%) | 7 (3.4%) |
| $12,500 to $14,999 | 44 (18.6%) | 4 (1.9%) |
| $15,000 to $17,499 | 0 (0.0%) | 11 (5.4%) |
| $17,500 to $19,999 | 10 (4.2%) | 5 (2.4%) |
| $20,000 to $22,499 | 0 (0.0%) | 54 (26.3%) |
| $22,500 to $24,999 | 16 (6.8%) | 10 (4.9%) |
| $25,000 to $29,999 | 15 (6.3%) | 9 (4.4%) |
| $30,000 to $34,999 | 44 (18.6%) | 10 (4.9%) |
| $35,000 to $39,999 | 9 (3.8%) | 11 (5.4%) |
| $40,000 to $44,999 | 9 (3.8%) | 0 (0.0%) |
| $45,000 to $49,999 | 27 (11.4%) | 0 (0.0%) |
| $50,000 to $54,999 | 4 (1.7%) | 11 (5.4%) |
| $55,000 to $64,999 | 5 (2.1%) | 0 (0.0%) |
| $65,000 to $74,999 | 0 (0.0%) | 0 (0.0%) |
| $75,000 to $99,999 | 0 (0.0%) | 0 (0.0%) |
| $100,000+ | 7 (2.9%) | 23 (11.2%) |
| Total | 237 (100.0%) | 205 (100.0%) |
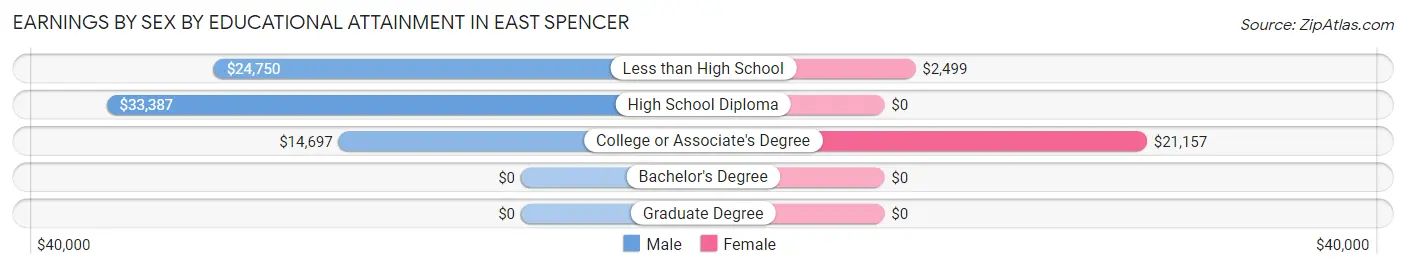
Earnings by Sex by Educational Attainment in East Spencer
Average earnings in East Spencer are $24,766 for men and $21,458 for women, a difference of 13.4%. Men with an educational attainment of high school diploma enjoy the highest average annual earnings of $33,387, while those with college or associate's degree education earn the least with $14,697. Women with an educational attainment of college or associate's degree earn the most with the average annual earnings of $21,157, while those with less than high school education have the smallest earnings of $2,499.
| Educational Attainment | Male Income | Female Income |
| Less than High School | $24,750 | $2,499 |
| High School Diploma | $33,387 | $0 |
| College or Associate's Degree | $14,697 | $21,157 |
| Bachelor's Degree | - | - |
| Graduate Degree | - | - |
| Total | $24,766 | $21,458 |
Family Income in East Spencer
Family Income Brackets in East Spencer
According to the East Spencer family income data, there are 100 families falling into the $150,000 to $199,999 income range, which is the most common income bracket and makes up 29.2% of all families. Conversely, the $100,000 to $149,999 income bracket is the least frequent group with only 4 families (1.2%) belonging to this category.
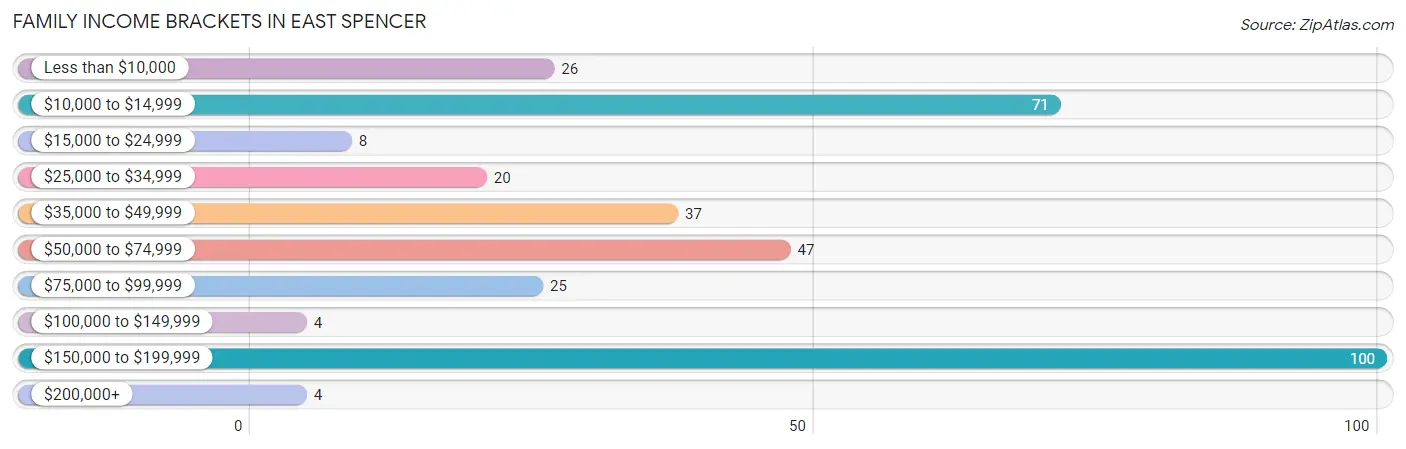
| Income Bracket | # Families | % Families |
| Less than $10,000 | 26 | 7.6% |
| $10,000 to $14,999 | 71 | 20.8% |
| $15,000 to $24,999 | 8 | 2.3% |
| $25,000 to $34,999 | 20 | 5.8% |
| $35,000 to $49,999 | 37 | 10.8% |
| $50,000 to $74,999 | 47 | 13.7% |
| $75,000 to $99,999 | 25 | 7.3% |
| $100,000 to $149,999 | 4 | 1.2% |
| $150,000 to $199,999 | 100 | 29.2% |
| $200,000+ | 4 | 1.2% |
Family Income by Famaliy Size in East Spencer
3-person families (67 | 19.6%) account for the highest median family income in East Spencer with $66,705 per family, while 3-person families (67 | 19.6%) have the highest median income of $22,235 per family member.
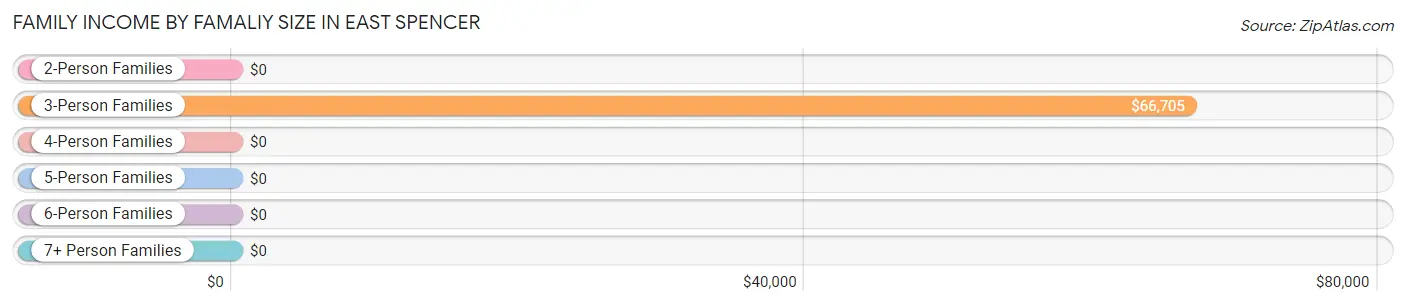
| Income Bracket | # Families | Median Income |
| 2-Person Families | 243 (71.1%) | $0 |
| 3-Person Families | 67 (19.6%) | $66,705 |
| 4-Person Families | 14 (4.1%) | $0 |
| 5-Person Families | 8 (2.3%) | $0 |
| 6-Person Families | 10 (2.9%) | $0 |
| 7+ Person Families | 0 (0.0%) | $0 |
| Total | 342 (100.0%) | $61,071 |
Family Income by Number of Earners in East Spencer
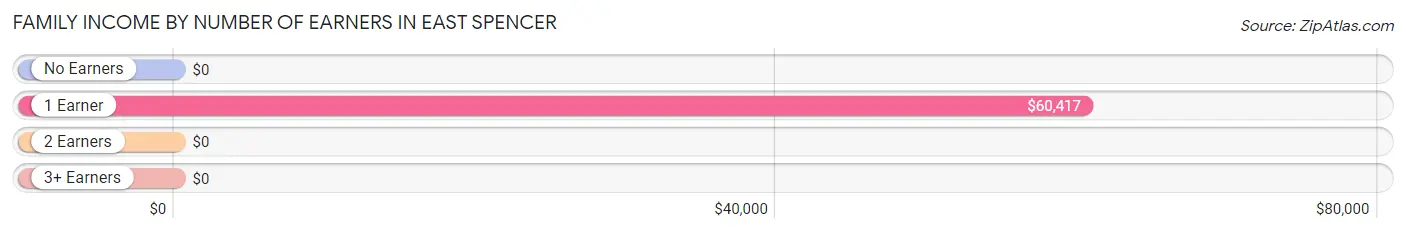
| Number of Earners | # Families | Median Income |
| No Earners | 174 (50.9%) | $0 |
| 1 Earner | 81 (23.7%) | $60,417 |
| 2 Earners | 79 (23.1%) | $0 |
| 3+ Earners | 8 (2.3%) | $0 |
| Total | 342 (100.0%) | $61,071 |
Household Income in East Spencer
Household Income Brackets in East Spencer
With 137 households falling in the category, the $10,000 to $14,999 income range is the most frequent in East Spencer, accounting for 21.7% of all households. In contrast, only 4 households (0.6%) fall into the $200,000+ income bracket, making it the least populous group.
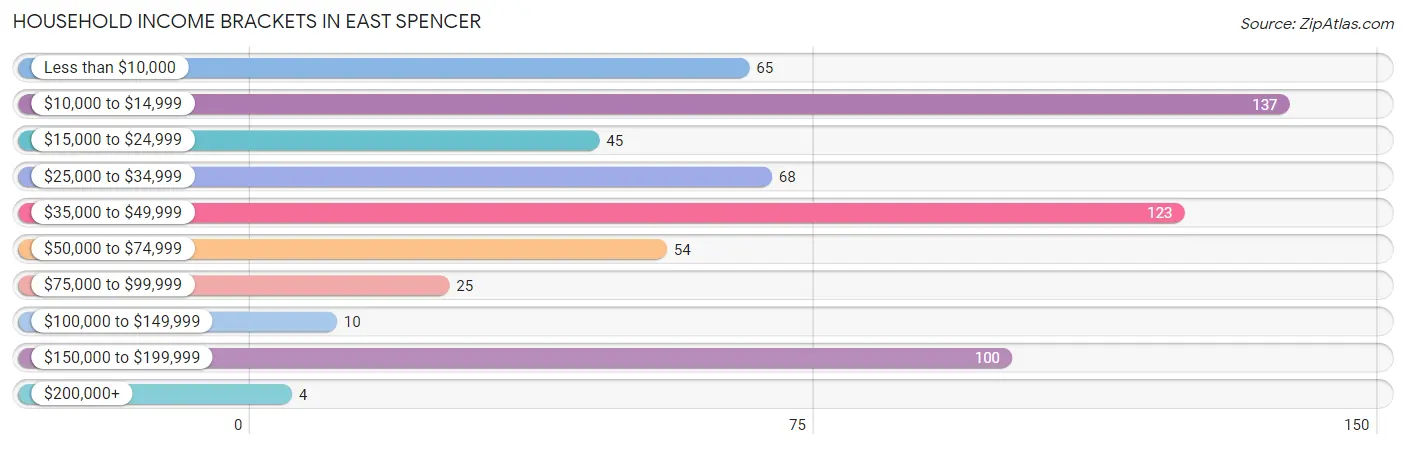
| Income Bracket | # Households | % Households |
| Less than $10,000 | 65 | 10.3% |
| $10,000 to $14,999 | 137 | 21.7% |
| $15,000 to $24,999 | 45 | 7.1% |
| $25,000 to $34,999 | 68 | 10.8% |
| $35,000 to $49,999 | 123 | 19.5% |
| $50,000 to $74,999 | 54 | 8.6% |
| $75,000 to $99,999 | 25 | 4.0% |
| $100,000 to $149,999 | 10 | 1.6% |
| $150,000 to $199,999 | 100 | 15.8% |
| $200,000+ | 4 | 0.6% |
Household Income by Householder Age in East Spencer
The median household income in East Spencer is $37,917, with the highest median household income of $44,167 found in the 65+ years age bracket for the primary householder. A total of 262 households (41.5%) fall into this category.
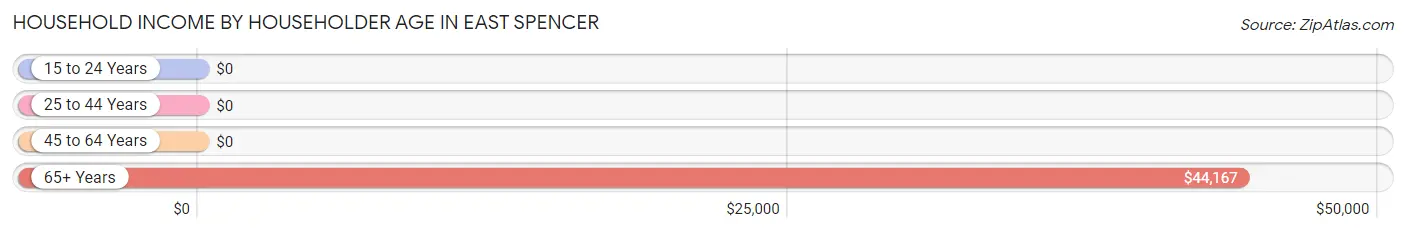
| Income Bracket | # Households | Median Income |
| 15 to 24 Years | 0 (0.0%) | $0 |
| 25 to 44 Years | 126 (20.0%) | $0 |
| 45 to 64 Years | 243 (38.5%) | $0 |
| 65+ Years | 262 (41.5%) | $44,167 |
| Total | 631 (100.0%) | $37,917 |
Poverty in East Spencer
Income Below Poverty by Sex and Age in East Spencer
With 24.2% poverty level for males and 35.8% for females among the residents of East Spencer, 12 to 14 year old males and under 5 year old females are the most vulnerable to poverty, with 23 males (71.9%) and 11 females (100.0%) in their respective age groups living below the poverty level.
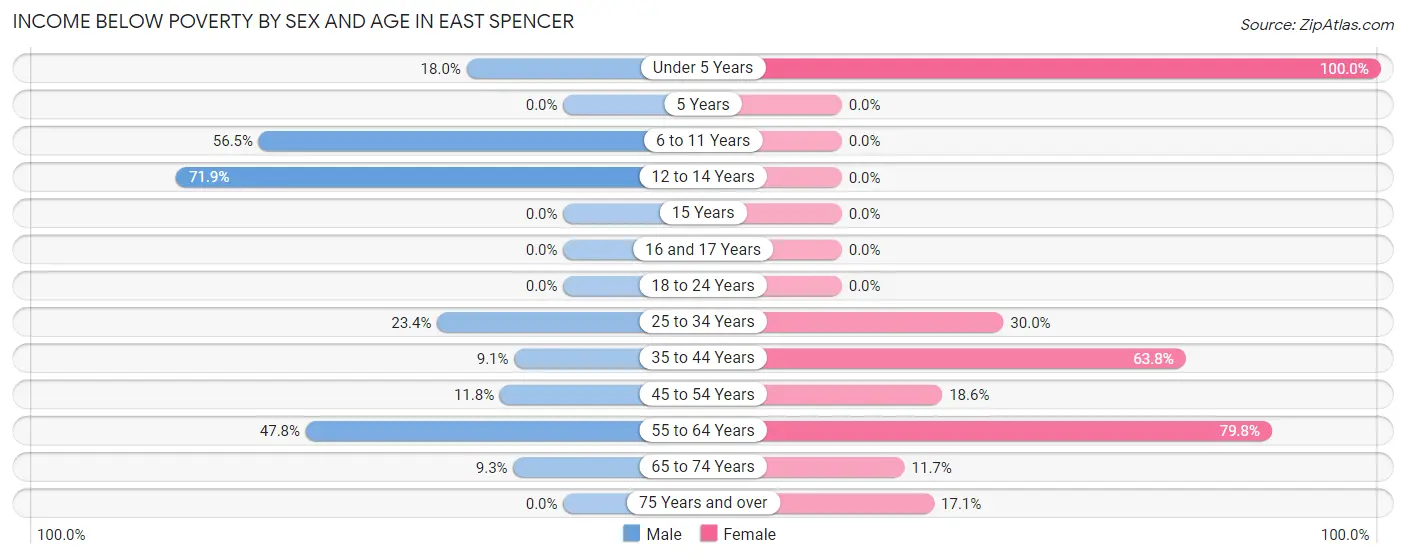
| Age Bracket | Male | Female |
| Under 5 Years | 7 (17.9%) | 11 (100.0%) |
| 5 Years | 0 (0.0%) | 0 (0.0%) |
| 6 to 11 Years | 13 (56.5%) | 0 (0.0%) |
| 12 to 14 Years | 23 (71.9%) | 0 (0.0%) |
| 15 Years | 0 (0.0%) | 0 (0.0%) |
| 16 and 17 Years | 0 (0.0%) | 0 (0.0%) |
| 18 to 24 Years | 0 (0.0%) | 0 (0.0%) |
| 25 to 34 Years | 11 (23.4%) | 21 (30.0%) |
| 35 to 44 Years | 7 (9.1%) | 74 (63.8%) |
| 45 to 54 Years | 6 (11.8%) | 22 (18.6%) |
| 55 to 64 Years | 54 (47.8%) | 83 (79.8%) |
| 65 to 74 Years | 14 (9.3%) | 19 (11.7%) |
| 75 Years and over | 0 (0.0%) | 6 (17.1%) |
| Total | 135 (24.2%) | 236 (35.8%) |
Income Above Poverty by Sex and Age in East Spencer
According to the poverty statistics in East Spencer, males aged 18 to 24 years and females aged 6 to 11 years are the age groups that are most secure financially, with 100.0% of males and 100.0% of females in these age groups living above the poverty line.
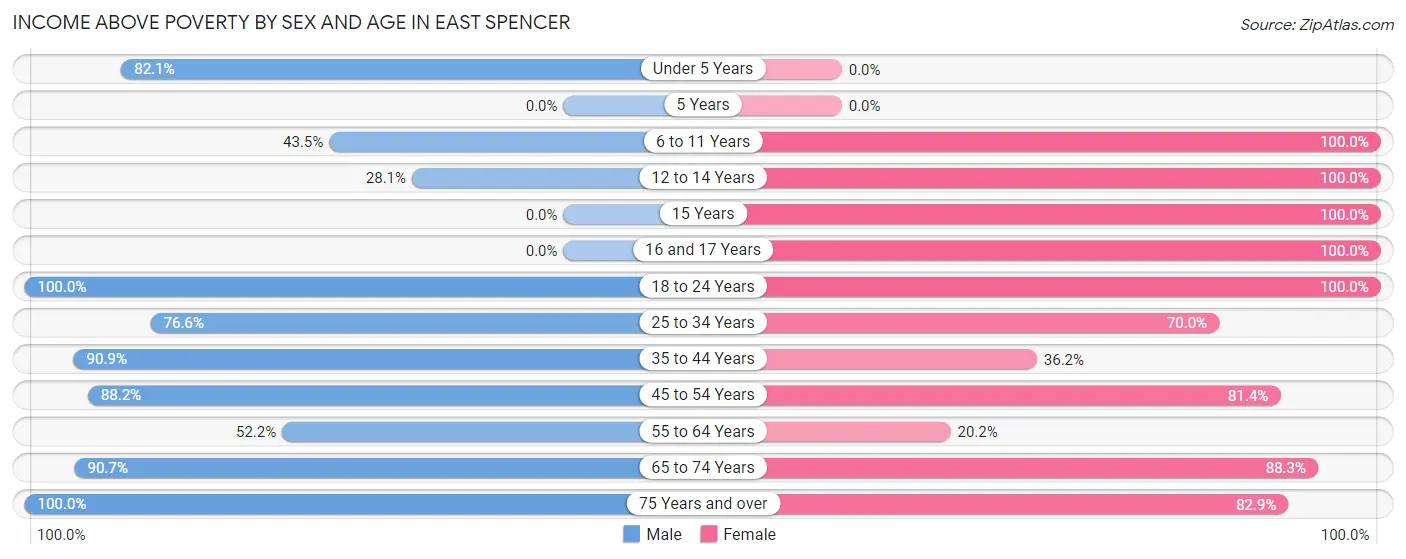
| Age Bracket | Male | Female |
| Under 5 Years | 32 (82.1%) | 0 (0.0%) |
| 5 Years | 0 (0.0%) | 0 (0.0%) |
| 6 to 11 Years | 10 (43.5%) | 17 (100.0%) |
| 12 to 14 Years | 9 (28.1%) | 4 (100.0%) |
| 15 Years | 0 (0.0%) | 4 (100.0%) |
| 16 and 17 Years | 0 (0.0%) | 5 (100.0%) |
| 18 to 24 Years | 11 (100.0%) | 12 (100.0%) |
| 25 to 34 Years | 36 (76.6%) | 49 (70.0%) |
| 35 to 44 Years | 70 (90.9%) | 42 (36.2%) |
| 45 to 54 Years | 45 (88.2%) | 96 (81.4%) |
| 55 to 64 Years | 59 (52.2%) | 21 (20.2%) |
| 65 to 74 Years | 137 (90.7%) | 144 (88.3%) |
| 75 Years and over | 13 (100.0%) | 29 (82.9%) |
| Total | 422 (75.8%) | 423 (64.2%) |
Income Below Poverty Among Married-Couple Families in East Spencer
The poverty statistics for married-couple families in East Spencer show that 17.8% or 40 of the total 225 families live below the poverty line. Families with 1 or 2 children have the highest poverty rate of 40.7%, comprising of 11 families. On the other hand, families with no children have the lowest poverty rate of 14.1%, which includes 26 families.
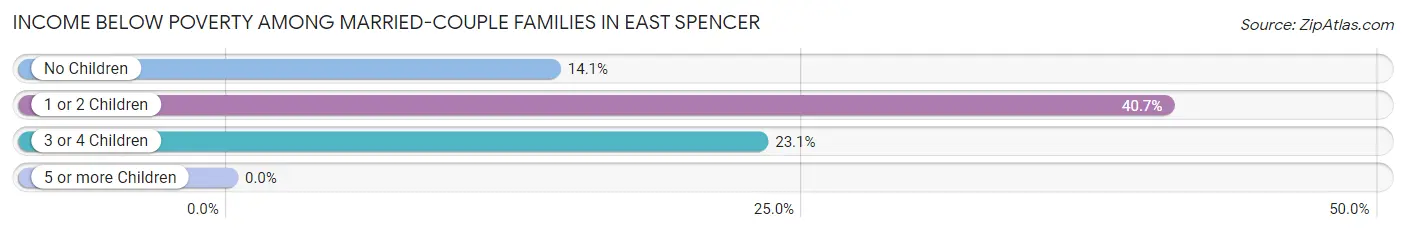
| Children | Above Poverty | Below Poverty |
| No Children | 159 (86.0%) | 26 (14.1%) |
| 1 or 2 Children | 16 (59.3%) | 11 (40.7%) |
| 3 or 4 Children | 10 (76.9%) | 3 (23.1%) |
| 5 or more Children | 0 (0.0%) | 0 (0.0%) |
| Total | 185 (82.2%) | 40 (17.8%) |
Income Below Poverty Among Single-Parent Households in East Spencer
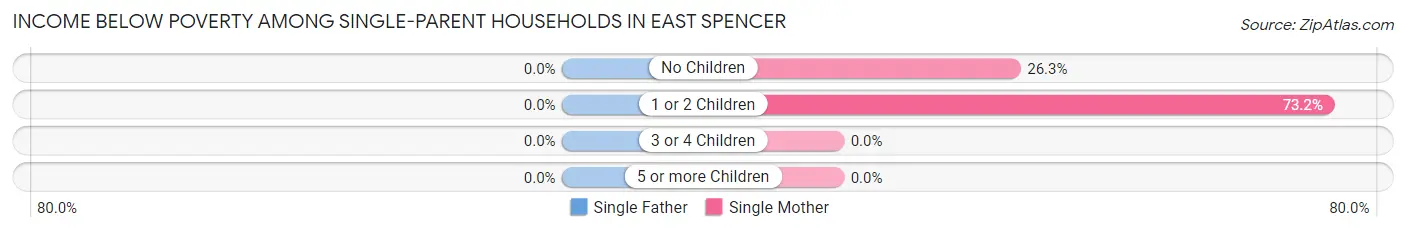
| Children | Single Father | Single Mother |
| No Children | 0 (0.0%) | 5 (26.3%) |
| 1 or 2 Children | 0 (0.0%) | 60 (73.2%) |
| 3 or 4 Children | 0 (0.0%) | 0 (0.0%) |
| 5 or more Children | 0 (0.0%) | 0 (0.0%) |
| Total | 0 (0.0%) | 65 (64.4%) |
Income Below Poverty Among Married-Couple vs Single-Parent Households in East Spencer
The poverty data for East Spencer shows that 40 of the married-couple family households (17.8%) and 65 of the single-parent households (55.6%) are living below the poverty level. Within the married-couple family households, those with 1 or 2 children have the highest poverty rate, with 11 households (40.7%) falling below the poverty line. Among the single-parent households, those with 1 or 2 children have the highest poverty rate, with 60 household (64.5%) living below poverty.
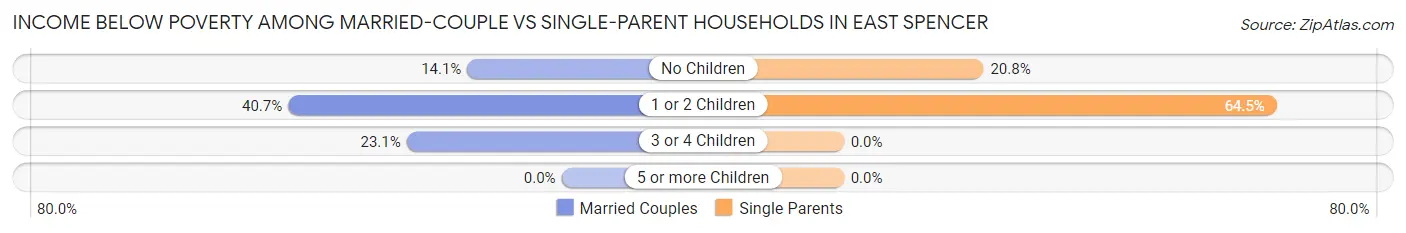
| Children | Married-Couple Families | Single-Parent Households |
| No Children | 26 (14.1%) | 5 (20.8%) |
| 1 or 2 Children | 11 (40.7%) | 60 (64.5%) |
| 3 or 4 Children | 3 (23.1%) | 0 (0.0%) |
| 5 or more Children | 0 (0.0%) | 0 (0.0%) |
| Total | 40 (17.8%) | 65 (55.6%) |
Race in East Spencer
The most populous races in East Spencer are Black / African American (916 | 75.3%), White / Caucasian (192 | 15.8%), and Hispanic or Latino (106 | 8.7%).
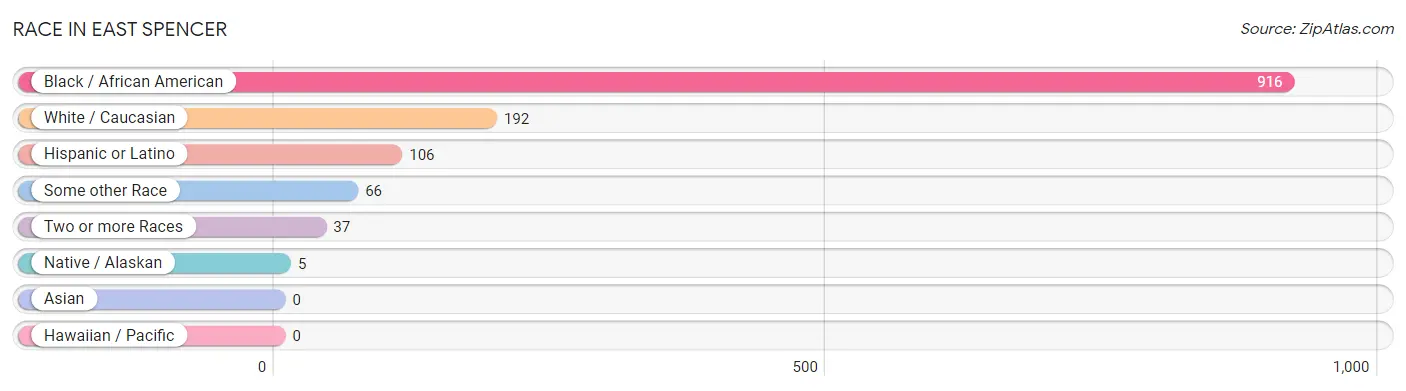
| Race | # Population | % Population |
| Asian | 0 | 0.0% |
| Black / African American | 916 | 75.3% |
| Hawaiian / Pacific | 0 | 0.0% |
| Hispanic or Latino | 106 | 8.7% |
| Native / Alaskan | 5 | 0.4% |
| White / Caucasian | 192 | 15.8% |
| Two or more Races | 37 | 3.0% |
| Some other Race | 66 | 5.4% |
| Total | 1,216 | 100.0% |
Ancestry in East Spencer
The most populous ancestries reported in East Spencer are American (69 | 5.7%), Mexican (56 | 4.6%), Central American (40 | 3.3%), Honduran (40 | 3.3%), and German (18 | 1.5%), together accounting for 18.3% of all East Spencer residents.
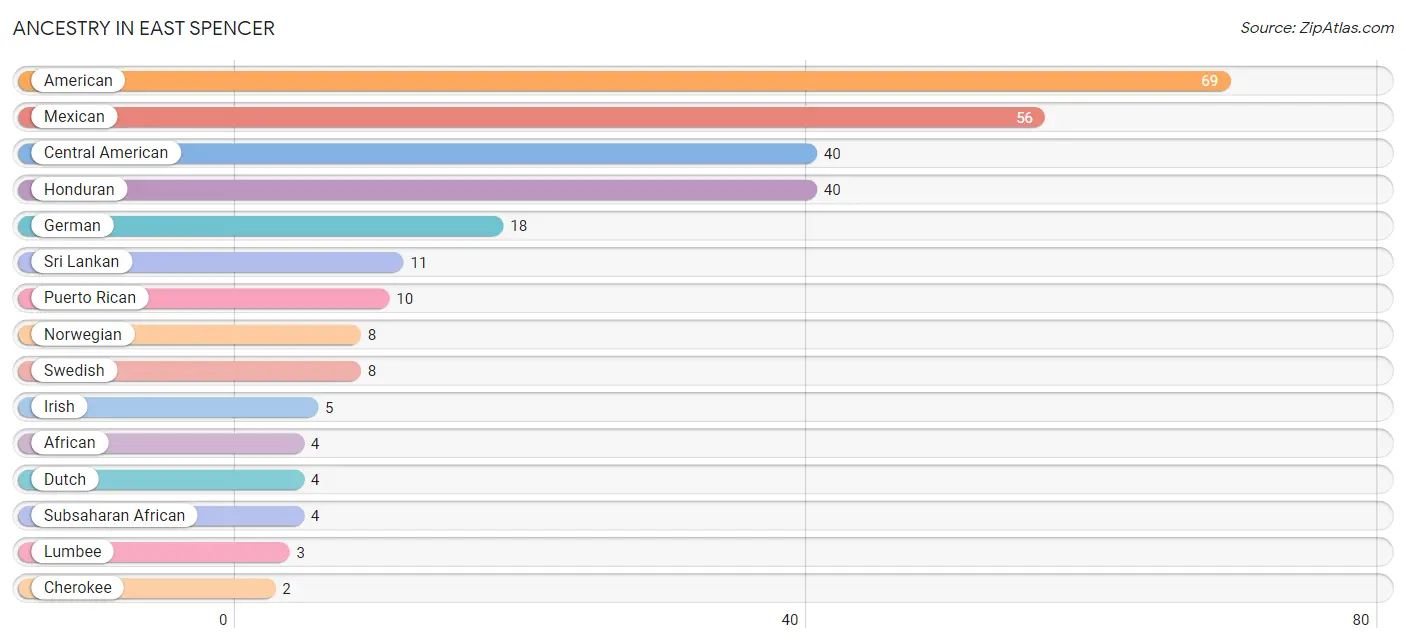
| Ancestry | # Population | % Population |
| African | 4 | 0.3% |
| American | 69 | 5.7% |
| Central American | 40 | 3.3% |
| Cherokee | 2 | 0.2% |
| Dutch | 4 | 0.3% |
| German | 18 | 1.5% |
| Honduran | 40 | 3.3% |
| Irish | 5 | 0.4% |
| Lumbee | 3 | 0.3% |
| Mexican | 56 | 4.6% |
| Norwegian | 8 | 0.7% |
| Puerto Rican | 10 | 0.8% |
| Seminole | 2 | 0.2% |
| Sri Lankan | 11 | 0.9% |
| Subsaharan African | 4 | 0.3% |
| Swedish | 8 | 0.7% | View All 16 Rows |
Immigrants in East Spencer
The most numerous immigrant groups reported in East Spencer came from Central America (74 | 6.1%), Latin America (74 | 6.1%), Honduras (37 | 3.0%), Mexico (37 | 3.0%), and Africa (4 | 0.3%), together accounting for 18.6% of all East Spencer residents.
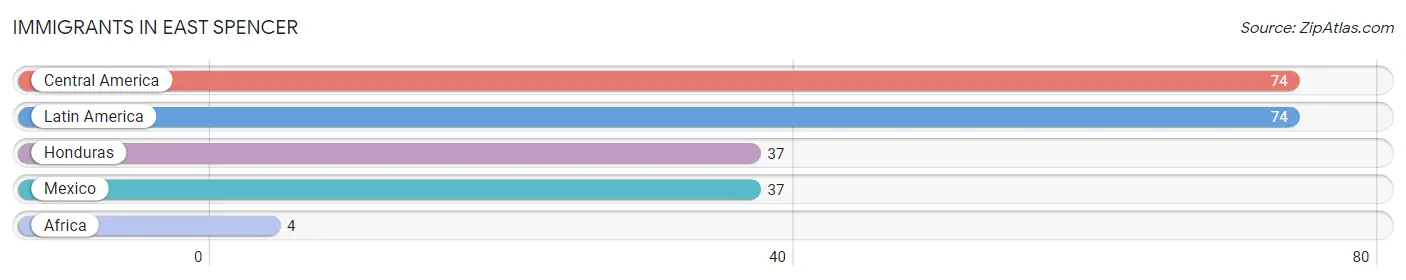
| Immigration Origin | # Population | % Population |
| Africa | 4 | 0.3% |
| Central America | 74 | 6.1% |
| Honduras | 37 | 3.0% |
| Latin America | 74 | 6.1% |
| Mexico | 37 | 3.0% | View All 5 Rows |
Sex and Age in East Spencer
Sex and Age in East Spencer
The most populous age groups in East Spencer are 60 to 64 Years (92 | 16.5%) for men and 70 to 74 Years (131 | 19.9%) for women.
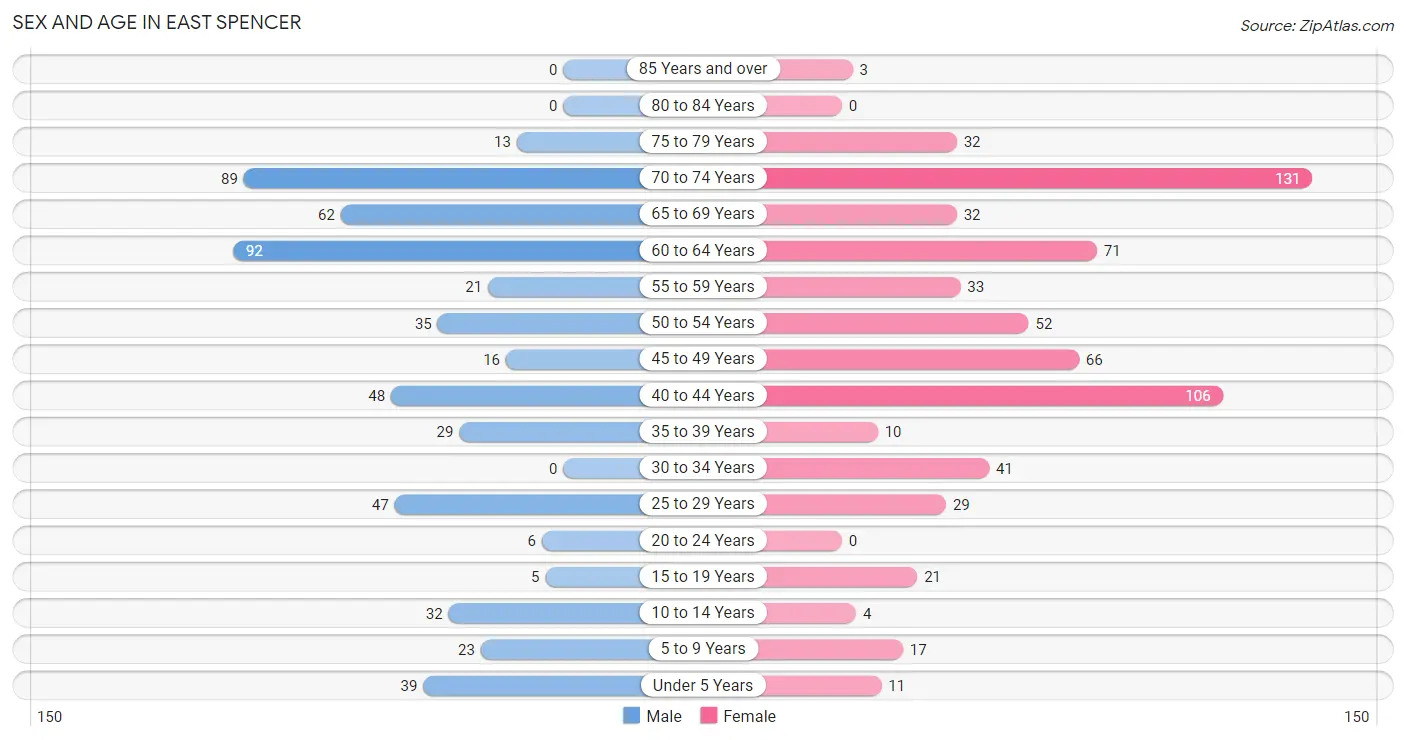
| Age Bracket | Male | Female |
| Under 5 Years | 39 (7.0%) | 11 (1.7%) |
| 5 to 9 Years | 23 (4.1%) | 17 (2.6%) |
| 10 to 14 Years | 32 (5.8%) | 4 (0.6%) |
| 15 to 19 Years | 5 (0.9%) | 21 (3.2%) |
| 20 to 24 Years | 6 (1.1%) | 0 (0.0%) |
| 25 to 29 Years | 47 (8.4%) | 29 (4.4%) |
| 30 to 34 Years | 0 (0.0%) | 41 (6.2%) |
| 35 to 39 Years | 29 (5.2%) | 10 (1.5%) |
| 40 to 44 Years | 48 (8.6%) | 106 (16.1%) |
| 45 to 49 Years | 16 (2.9%) | 66 (10.0%) |
| 50 to 54 Years | 35 (6.3%) | 52 (7.9%) |
| 55 to 59 Years | 21 (3.8%) | 33 (5.0%) |
| 60 to 64 Years | 92 (16.5%) | 71 (10.8%) |
| 65 to 69 Years | 62 (11.1%) | 32 (4.9%) |
| 70 to 74 Years | 89 (16.0%) | 131 (19.9%) |
| 75 to 79 Years | 13 (2.3%) | 32 (4.9%) |
| 80 to 84 Years | 0 (0.0%) | 0 (0.0%) |
| 85 Years and over | 0 (0.0%) | 3 (0.5%) |
| Total | 557 (100.0%) | 659 (100.0%) |
Families and Households in East Spencer
Median Family Size in East Spencer
The median family size in East Spencer is 2.44 persons per family, with single male/father families (16 | 4.7%) accounting for the largest median family size of 2.63 persons per family. On the other hand, single female/mother families (101 | 29.5%) represent the smallest median family size with 2.41 persons per family.
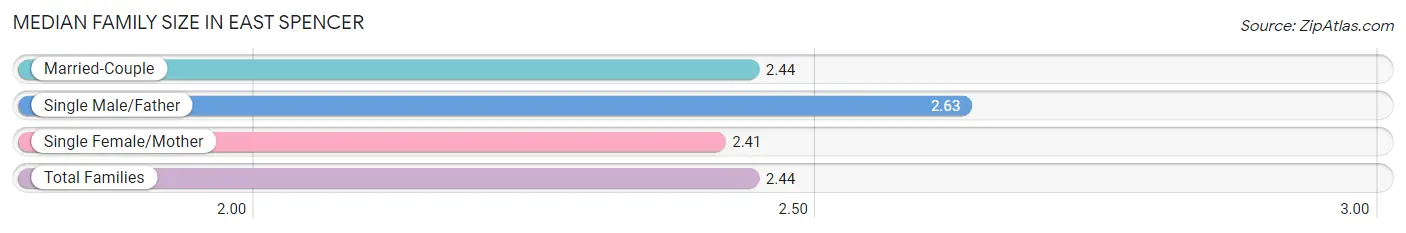
| Family Type | # Families | Family Size |
| Married-Couple | 225 (65.8%) | 2.44 |
| Single Male/Father | 16 (4.7%) | 2.63 |
| Single Female/Mother | 101 (29.5%) | 2.41 |
| Total Families | 342 (100.0%) | 2.44 |
Median Household Size in East Spencer
The median household size in East Spencer is 1.93 persons per household, with single male/father households (16 | 2.5%) accounting for the largest median household size of 2.63 persons per household. non-family households (289 | 45.8%) represent the smallest median household size with 1.25 persons per household.

| Household Type | # Households | Household Size |
| Married-Couple | 225 (35.7%) | 2.44 |
| Single Male/Father | 16 (2.5%) | 2.63 |
| Single Female/Mother | 101 (16.0%) | 2.62 |
| Non-family | 289 (45.8%) | 1.25 |
| Total Households | 631 (100.0%) | 1.93 |
Household Size by Marriage Status in East Spencer
Out of a total of 631 households in East Spencer, 342 (54.2%) are family households, while 289 (45.8%) are nonfamily households. The most numerous type of family households are 2-person households, comprising 243, and the most common type of nonfamily households are 1-person households, comprising 208.
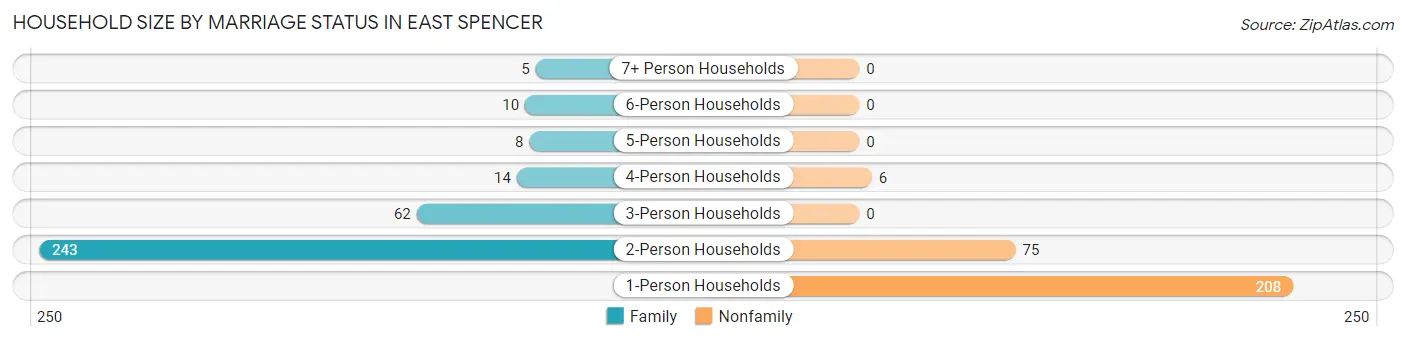
| Household Size | Family Households | Nonfamily Households |
| 1-Person Households | - | 208 (33.0%) |
| 2-Person Households | 243 (38.5%) | 75 (11.9%) |
| 3-Person Households | 62 (9.8%) | 0 (0.0%) |
| 4-Person Households | 14 (2.2%) | 6 (0.9%) |
| 5-Person Households | 8 (1.3%) | 0 (0.0%) |
| 6-Person Households | 10 (1.6%) | 0 (0.0%) |
| 7+ Person Households | 5 (0.8%) | 0 (0.0%) |
| Total | 342 (54.2%) | 289 (45.8%) |
Female Fertility in East Spencer
Fertility by Age in East Spencer
Average fertility rate in East Spencer is 36.0 births per 1,000 women. Women in the age bracket of 20 to 34 years have the highest fertility rate with 143.0 births per 1,000 women. Women in the age bracket of 20 to 34 years acount for 100.0% of all women with births.
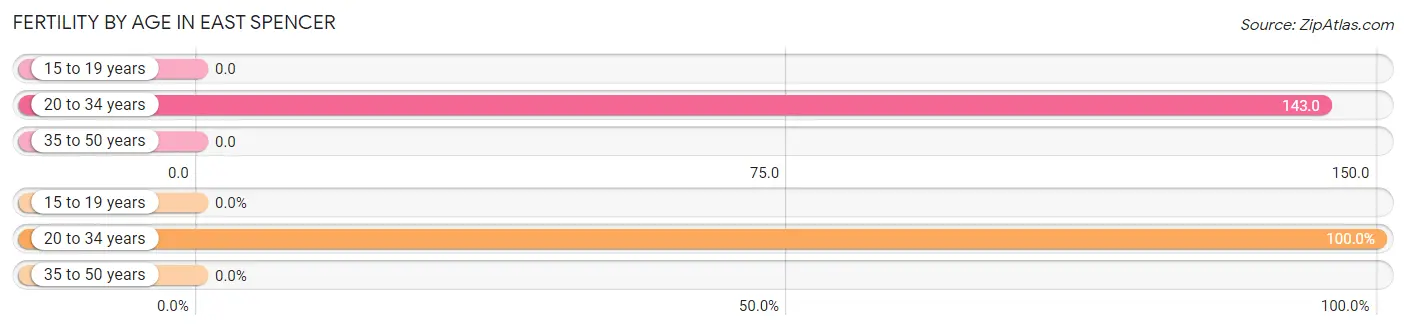
| Age Bracket | Women with Births | Births / 1,000 Women |
| 15 to 19 years | 0 (0.0%) | 0.0 |
| 20 to 34 years | 10 (100.0%) | 143.0 |
| 35 to 50 years | 0 (0.0%) | 0.0 |
| Total | 10 (100.0%) | 36.0 |
Fertility by Age by Marriage Status in East Spencer
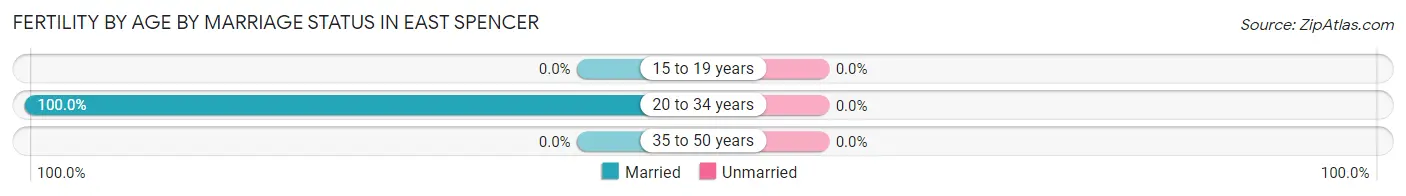
| Age Bracket | Married | Unmarried |
| 15 to 19 years | 0 (0.0%) | 0 (0.0%) |
| 20 to 34 years | 10 (100.0%) | 0 (0.0%) |
| 35 to 50 years | 0 (0.0%) | 0 (0.0%) |
| Total | 10 (100.0%) | 0 (0.0%) |
Fertility by Education in East Spencer
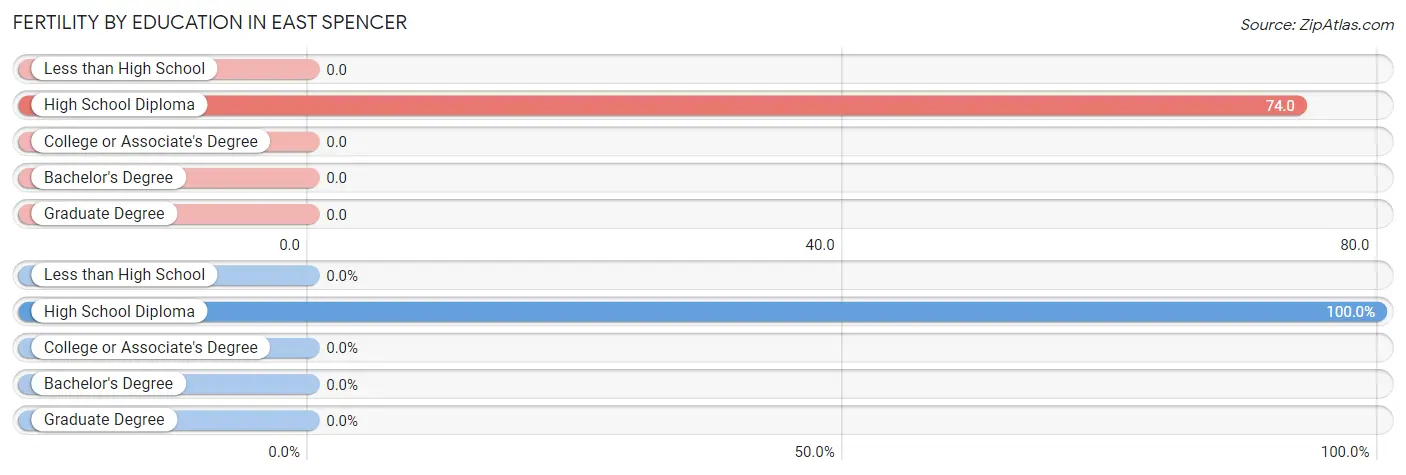
| Educational Attainment | Women with Births | Births / 1,000 Women |
| Less than High School | 0 (0.0%) | 0.0 |
| High School Diploma | 10 (100.0%) | 74.0 |
| College or Associate's Degree | 0 (0.0%) | 0.0 |
| Bachelor's Degree | 0 (0.0%) | 0.0 |
| Graduate Degree | 0 (0.0%) | 0.0 |
| Total | 10 (100.0%) | 36.0 |
Fertility by Education by Marriage Status in East Spencer
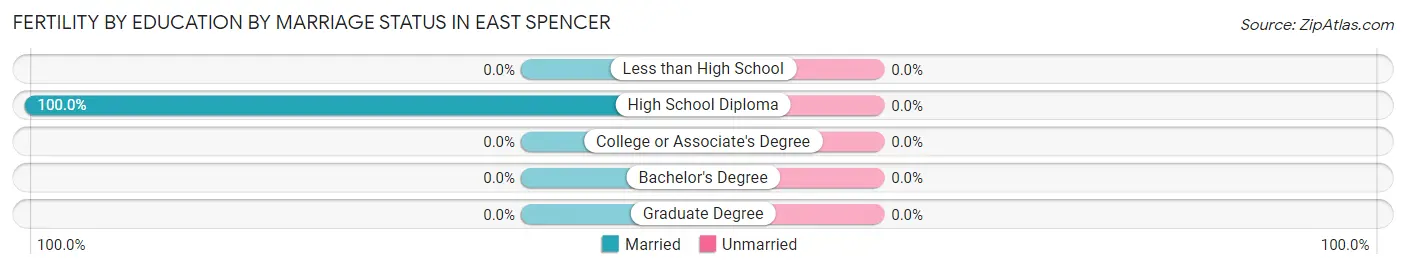
| Educational Attainment | Married | Unmarried |
| Less than High School | 0 (0.0%) | 0 (0.0%) |
| High School Diploma | 10 (100.0%) | 0 (0.0%) |
| College or Associate's Degree | 0 (0.0%) | 0 (0.0%) |
| Bachelor's Degree | 0 (0.0%) | 0 (0.0%) |
| Graduate Degree | 0 (0.0%) | 0 (0.0%) |
| Total | 10 (100.0%) | 0 (0.0%) |
Employment Characteristics in East Spencer
Employment by Class of Employer in East Spencer
Among the 383 employed individuals in East Spencer, private company employees (209 | 54.6%), federal government employees (77 | 20.1%), and self-employed (not incorporated) (52 | 13.6%) make up the most common classes of employment.
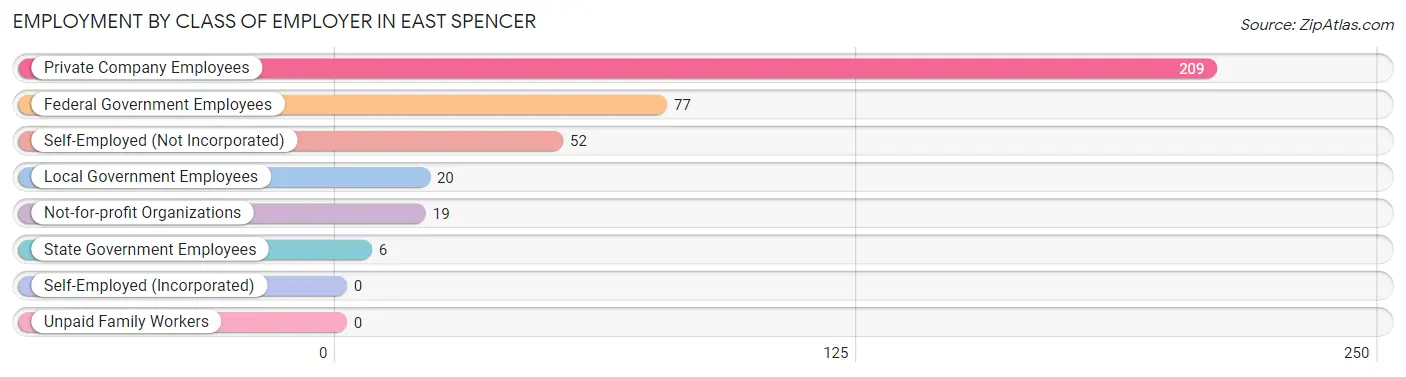
| Employer Class | # Employees | % Employees |
| Private Company Employees | 209 | 54.6% |
| Self-Employed (Incorporated) | 0 | 0.0% |
| Self-Employed (Not Incorporated) | 52 | 13.6% |
| Not-for-profit Organizations | 19 | 5.0% |
| Local Government Employees | 20 | 5.2% |
| State Government Employees | 6 | 1.6% |
| Federal Government Employees | 77 | 20.1% |
| Unpaid Family Workers | 0 | 0.0% |
| Total | 383 | 100.0% |
Employment Status by Age in East Spencer
According to the labor force statistics for East Spencer, out of the total population over 16 years of age (1,086), 40.1% or 435 individuals are in the labor force, with 8.0% or 35 of them unemployed. The age group with the highest labor force participation rate is 20 to 24 years, with 100.0% or 6 individuals in the labor force. Within the labor force, the 25 to 29 years age range has the highest percentage of unemployed individuals, with 17.8% or 13 of them being unemployed.
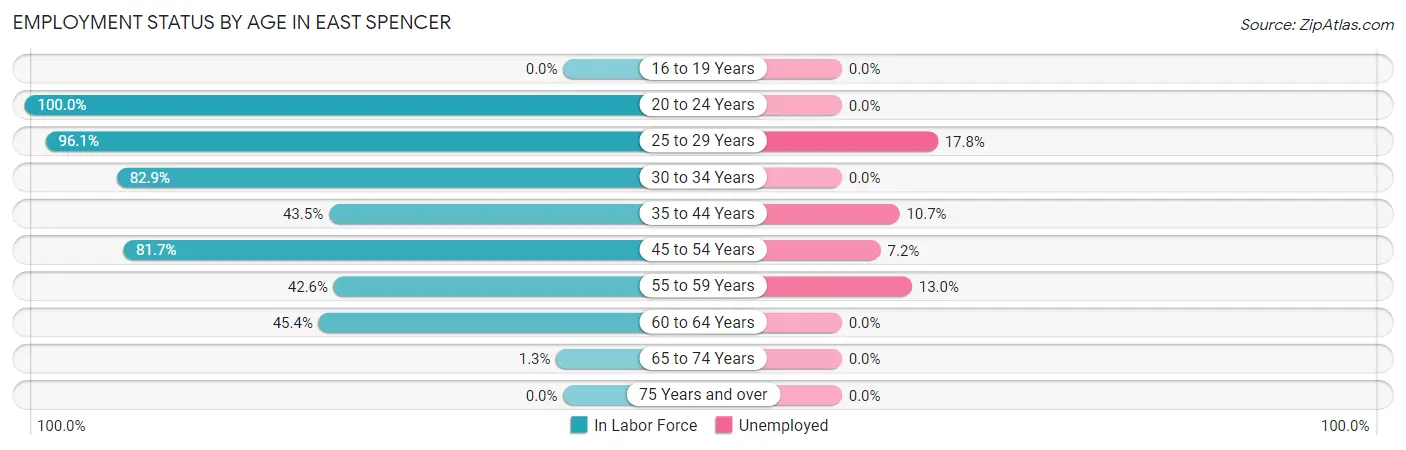
| Age Bracket | In Labor Force | Unemployed |
| 16 to 19 Years | 0 (0.0%) | 0 (0.0%) |
| 20 to 24 Years | 6 (100.0%) | 0 (0.0%) |
| 25 to 29 Years | 73 (96.1%) | 13 (17.8%) |
| 30 to 34 Years | 34 (82.9%) | 0 (0.0%) |
| 35 to 44 Years | 84 (43.5%) | 9 (10.7%) |
| 45 to 54 Years | 138 (81.7%) | 10 (7.2%) |
| 55 to 59 Years | 23 (42.6%) | 3 (13.0%) |
| 60 to 64 Years | 74 (45.4%) | 0 (0.0%) |
| 65 to 74 Years | 4 (1.3%) | 0 (0.0%) |
| 75 Years and over | 0 (0.0%) | 0 (0.0%) |
| Total | 435 (40.1%) | 35 (8.0%) |
Employment Status by Educational Attainment in East Spencer
According to labor force statistics for East Spencer, 61.2% of individuals (426) out of the total population between 25 and 64 years of age (696) are in the labor force, with 8.2% or 35 of them being unemployed. The group with the highest labor force participation rate are those with the educational attainment of college / associate degree, with 73.7% or 151 individuals in the labor force. Within the labor force, individuals with high school diploma education have the highest percentage of unemployment, with 10.1% or 17 of them being unemployed.
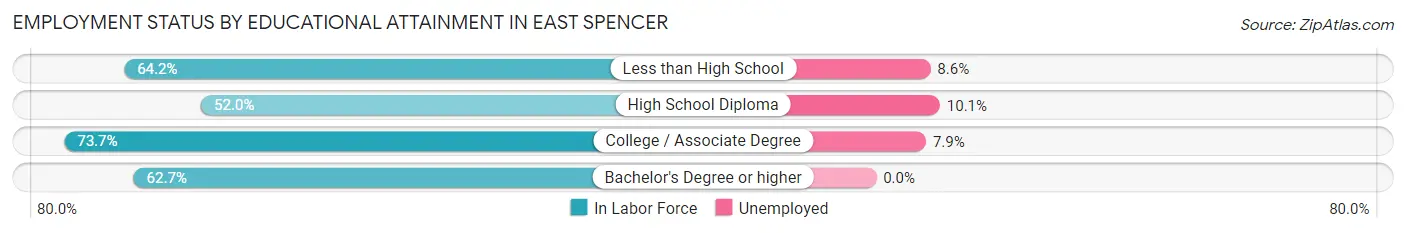
| Educational Attainment | In Labor Force | Unemployed |
| Less than High School | 70 (64.2%) | 9 (8.6%) |
| High School Diploma | 168 (52.0%) | 33 (10.1%) |
| College / Associate Degree | 151 (73.7%) | 16 (7.9%) |
| Bachelor's Degree or higher | 37 (62.7%) | 0 (0.0%) |
| Total | 426 (61.2%) | 57 (8.2%) |
Employment Occupations by Sex in East Spencer
Management, Business, Science and Arts Occupations
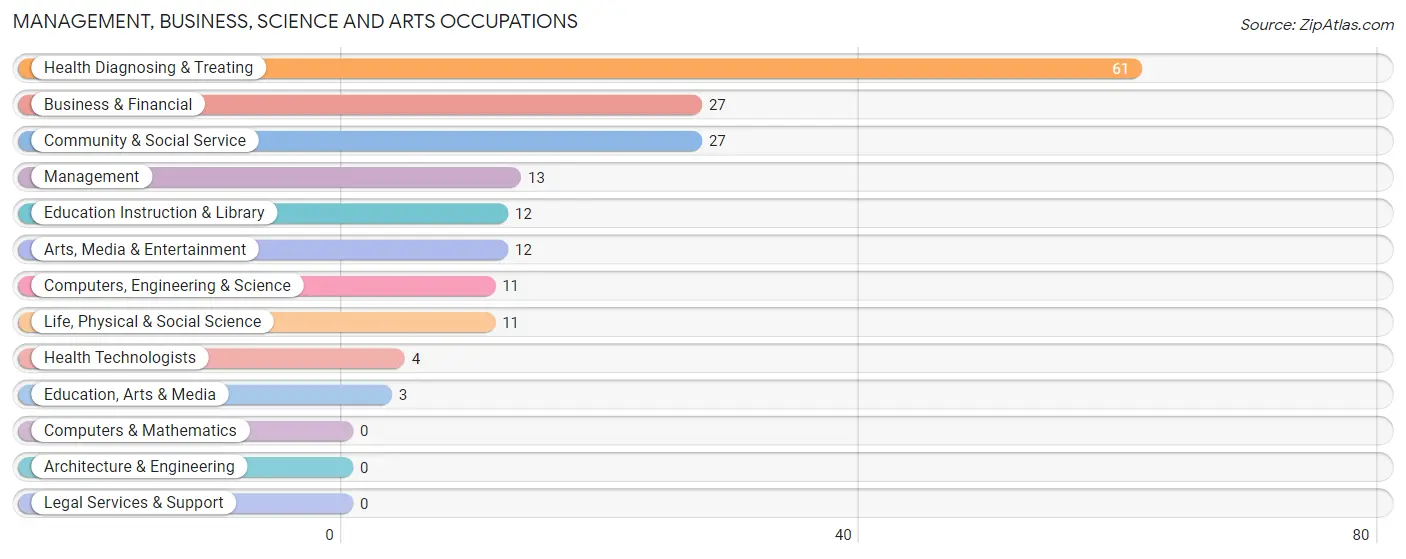
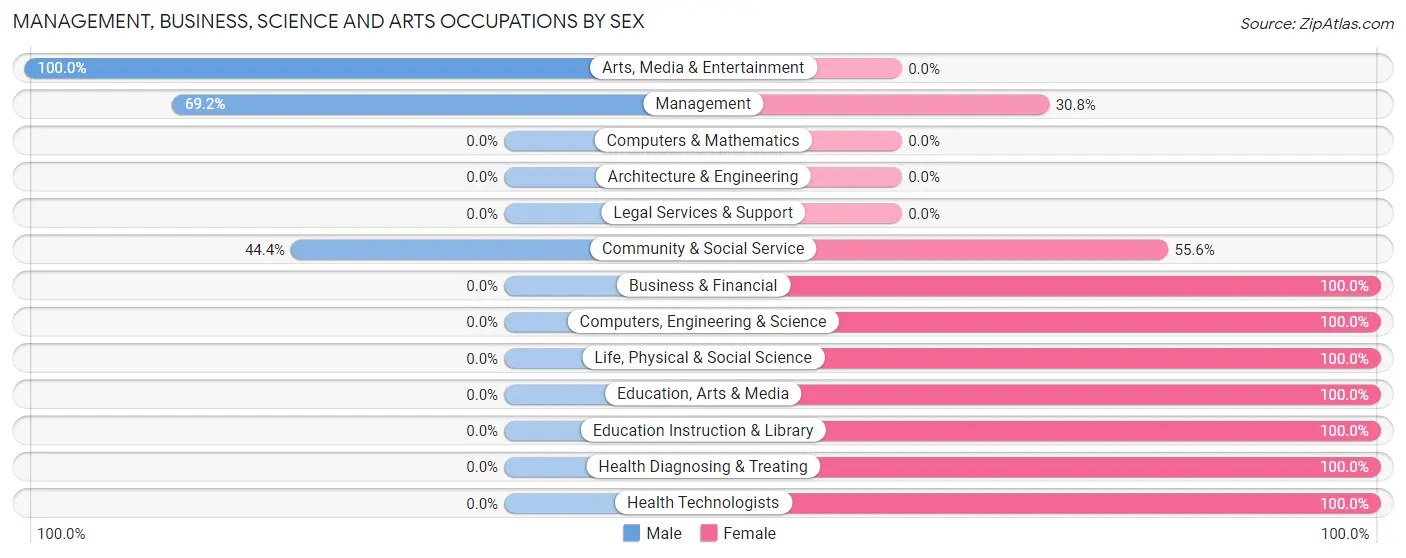
The most common Management, Business, Science and Arts occupations in East Spencer are Health Diagnosing & Treating (61 | 15.2%), Business & Financial (27 | 6.7%), Community & Social Service (27 | 6.7%), Management (13 | 3.2%), and Education Instruction & Library (12 | 3.0%).
Management, Business, Science and Arts Occupations by Sex
Within the Management, Business, Science and Arts occupations in East Spencer, the most male-oriented occupations are Arts, Media & Entertainment (100.0%), Management (69.2%), and Community & Social Service (44.4%), while the most female-oriented occupations are Business & Financial (100.0%), Computers, Engineering & Science (100.0%), and Life, Physical & Social Science (100.0%).
| Occupation | Male | Female |
| Management | 9 (69.2%) | 4 (30.8%) |
| Business & Financial | 0 (0.0%) | 27 (100.0%) |
| Computers, Engineering & Science | 0 (0.0%) | 11 (100.0%) |
| Computers & Mathematics | 0 (0.0%) | 0 (0.0%) |
| Architecture & Engineering | 0 (0.0%) | 0 (0.0%) |
| Life, Physical & Social Science | 0 (0.0%) | 11 (100.0%) |
| Community & Social Service | 12 (44.4%) | 15 (55.6%) |
| Education, Arts & Media | 0 (0.0%) | 3 (100.0%) |
| Legal Services & Support | 0 (0.0%) | 0 (0.0%) |
| Education Instruction & Library | 0 (0.0%) | 12 (100.0%) |
| Arts, Media & Entertainment | 12 (100.0%) | 0 (0.0%) |
| Health Diagnosing & Treating | 0 (0.0%) | 61 (100.0%) |
| Health Technologists | 0 (0.0%) | 4 (100.0%) |
| Total (Category) | 21 (15.1%) | 118 (84.9%) |
| Total (Overall) | 224 (55.9%) | 177 (44.1%) |
Services Occupations
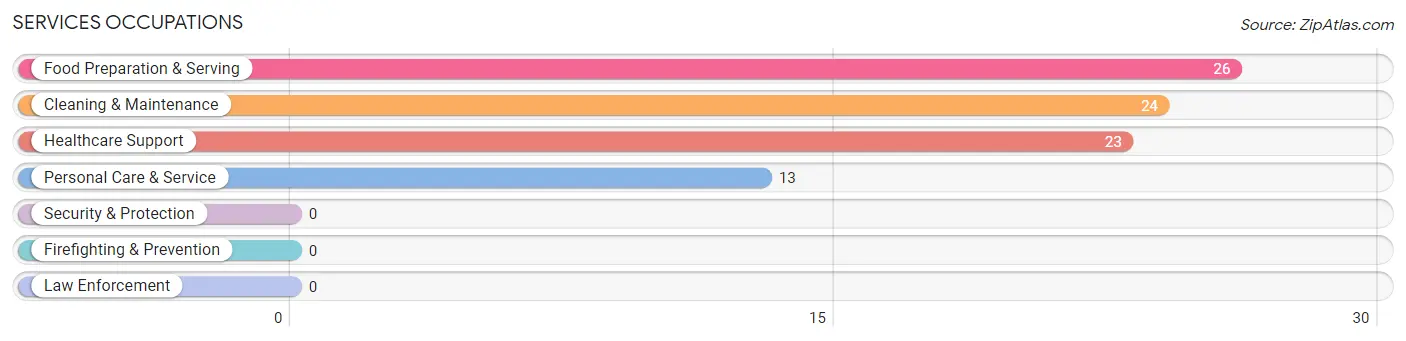
The most common Services occupations in East Spencer are Food Preparation & Serving (26 | 6.5%), Cleaning & Maintenance (24 | 6.0%), Healthcare Support (23 | 5.7%), and Personal Care & Service (13 | 3.2%).
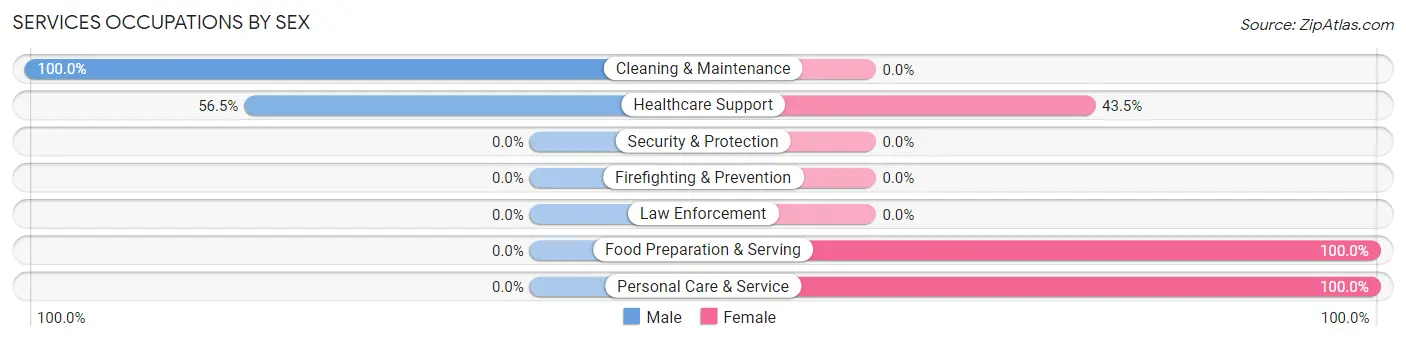
Services Occupations by Sex
Within the Services occupations in East Spencer, the most male-oriented occupations are Cleaning & Maintenance (100.0%), and Healthcare Support (56.5%), while the most female-oriented occupations are Food Preparation & Serving (100.0%), Personal Care & Service (100.0%), and Healthcare Support (43.5%).
| Occupation | Male | Female |
| Healthcare Support | 13 (56.5%) | 10 (43.5%) |
| Security & Protection | 0 (0.0%) | 0 (0.0%) |
| Firefighting & Prevention | 0 (0.0%) | 0 (0.0%) |
| Law Enforcement | 0 (0.0%) | 0 (0.0%) |
| Food Preparation & Serving | 0 (0.0%) | 26 (100.0%) |
| Cleaning & Maintenance | 24 (100.0%) | 0 (0.0%) |
| Personal Care & Service | 0 (0.0%) | 13 (100.0%) |
| Total (Category) | 37 (43.0%) | 49 (57.0%) |
| Total (Overall) | 224 (55.9%) | 177 (44.1%) |
Sales and Office Occupations
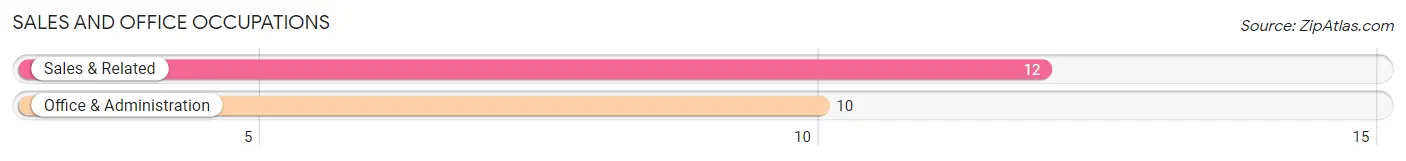
The most common Sales and Office occupations in East Spencer are Sales & Related (12 | 3.0%), and Office & Administration (10 | 2.5%).
Sales and Office Occupations by Sex
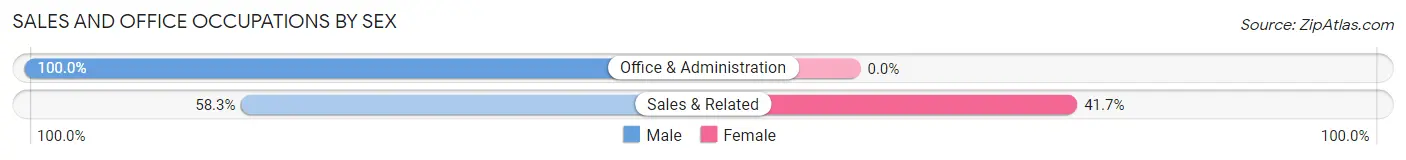
| Occupation | Male | Female |
| Sales & Related | 7 (58.3%) | 5 (41.7%) |
| Office & Administration | 10 (100.0%) | 0 (0.0%) |
| Total (Category) | 17 (77.3%) | 5 (22.7%) |
| Total (Overall) | 224 (55.9%) | 177 (44.1%) |
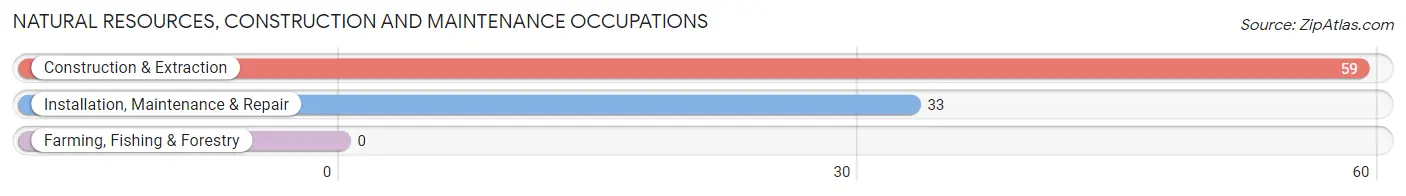
Natural Resources, Construction and Maintenance Occupations
The most common Natural Resources, Construction and Maintenance occupations in East Spencer are Construction & Extraction (59 | 14.7%), and Installation, Maintenance & Repair (33 | 8.2%).
Natural Resources, Construction and Maintenance Occupations by Sex
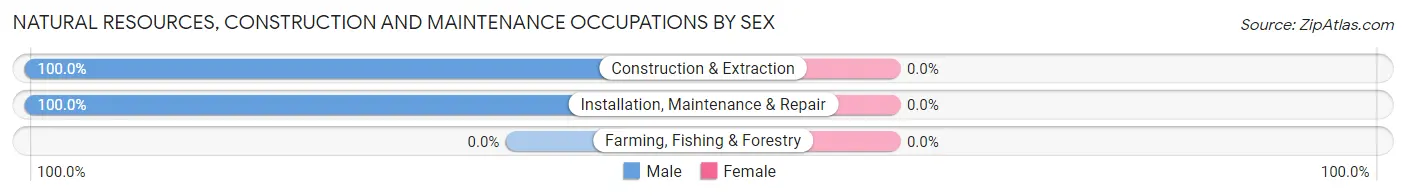
| Occupation | Male | Female |
| Farming, Fishing & Forestry | 0 (0.0%) | 0 (0.0%) |
| Construction & Extraction | 59 (100.0%) | 0 (0.0%) |
| Installation, Maintenance & Repair | 33 (100.0%) | 0 (0.0%) |
| Total (Category) | 92 (100.0%) | 0 (0.0%) |
| Total (Overall) | 224 (55.9%) | 177 (44.1%) |
Production, Transportation and Moving Occupations
The most common Production, Transportation and Moving occupations in East Spencer are Production (45 | 11.2%), Material Moving (10 | 2.5%), and Transportation (7 | 1.8%).
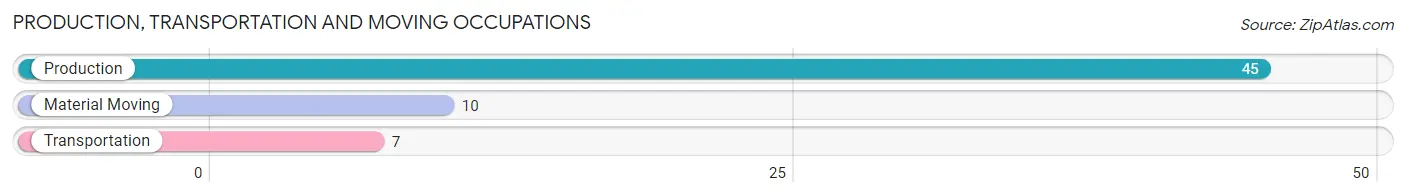
Production, Transportation and Moving Occupations by Sex
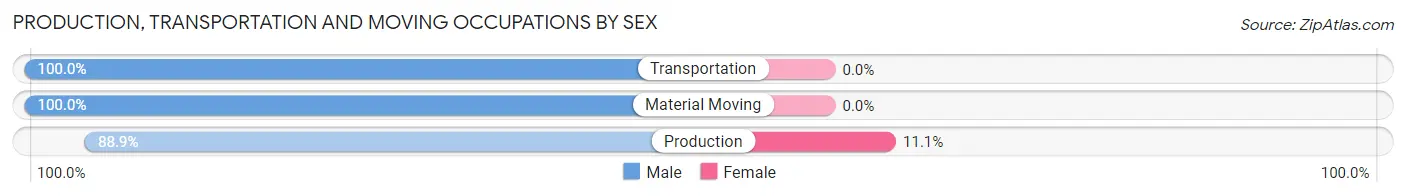
| Occupation | Male | Female |
| Production | 40 (88.9%) | 5 (11.1%) |
| Transportation | 7 (100.0%) | 0 (0.0%) |
| Material Moving | 10 (100.0%) | 0 (0.0%) |
| Total (Category) | 57 (91.9%) | 5 (8.1%) |
| Total (Overall) | 224 (55.9%) | 177 (44.1%) |
Employment Industries by Sex in East Spencer
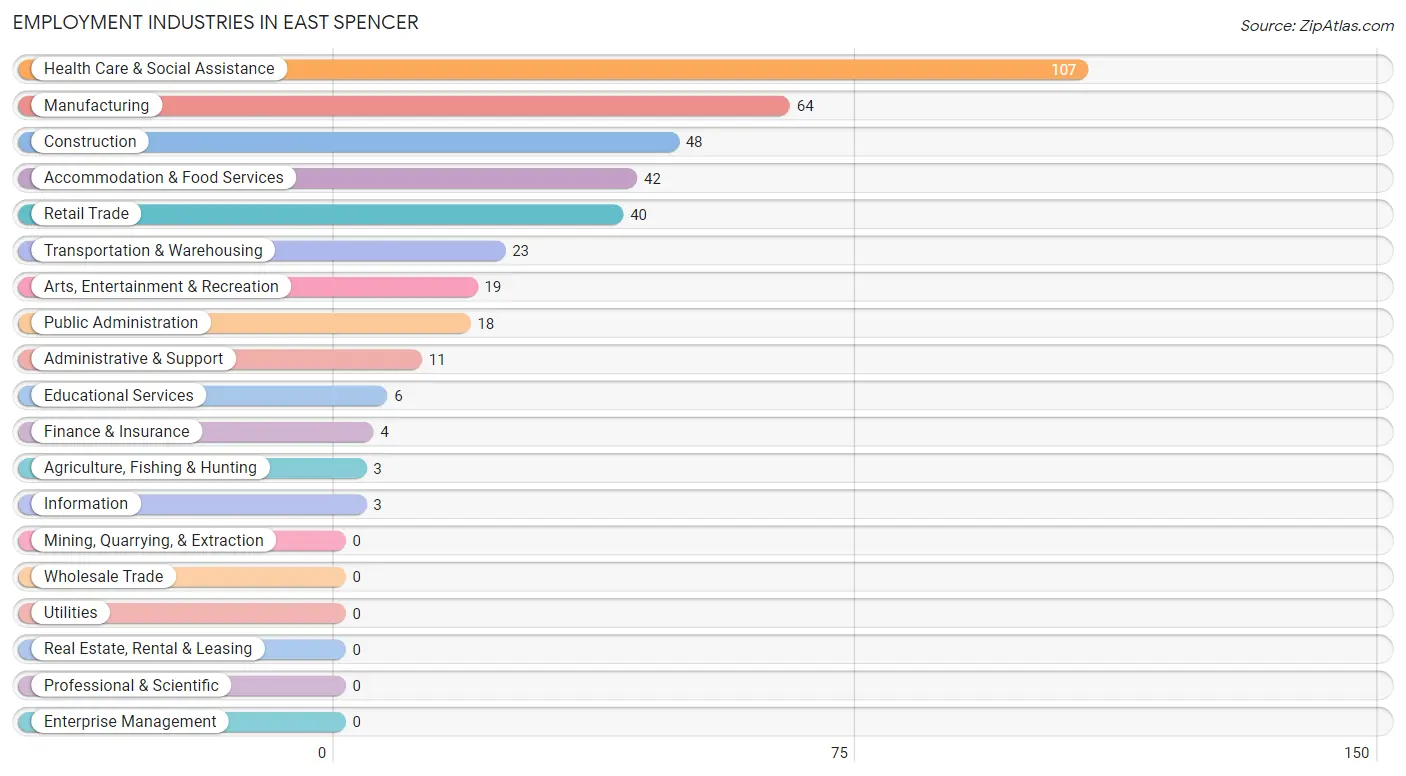
Employment Industries in East Spencer
The major employment industries in East Spencer include Health Care & Social Assistance (107 | 26.7%), Manufacturing (64 | 16.0%), Construction (48 | 12.0%), Accommodation & Food Services (42 | 10.5%), and Retail Trade (40 | 10.0%).
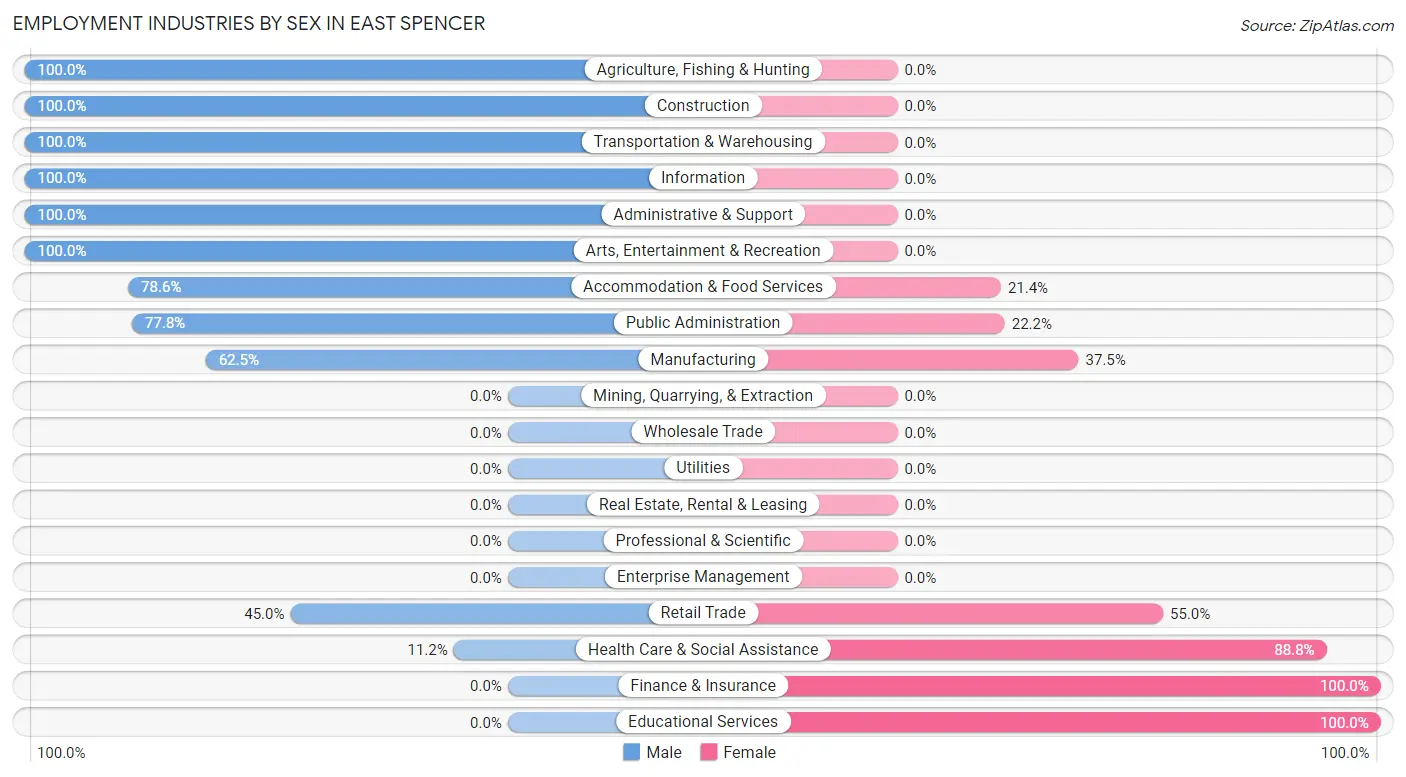
Employment Industries by Sex in East Spencer
The East Spencer industries that see more men than women are Agriculture, Fishing & Hunting (100.0%), Construction (100.0%), and Transportation & Warehousing (100.0%), whereas the industries that tend to have a higher number of women are Finance & Insurance (100.0%), Educational Services (100.0%), and Health Care & Social Assistance (88.8%).
| Industry | Male | Female |
| Agriculture, Fishing & Hunting | 3 (100.0%) | 0 (0.0%) |
| Mining, Quarrying, & Extraction | 0 (0.0%) | 0 (0.0%) |
| Construction | 48 (100.0%) | 0 (0.0%) |
| Manufacturing | 40 (62.5%) | 24 (37.5%) |
| Wholesale Trade | 0 (0.0%) | 0 (0.0%) |
| Retail Trade | 18 (45.0%) | 22 (55.0%) |
| Transportation & Warehousing | 23 (100.0%) | 0 (0.0%) |
| Utilities | 0 (0.0%) | 0 (0.0%) |
| Information | 3 (100.0%) | 0 (0.0%) |
| Finance & Insurance | 0 (0.0%) | 4 (100.0%) |
| Real Estate, Rental & Leasing | 0 (0.0%) | 0 (0.0%) |
| Professional & Scientific | 0 (0.0%) | 0 (0.0%) |
| Enterprise Management | 0 (0.0%) | 0 (0.0%) |
| Administrative & Support | 11 (100.0%) | 0 (0.0%) |
| Educational Services | 0 (0.0%) | 6 (100.0%) |
| Health Care & Social Assistance | 12 (11.2%) | 95 (88.8%) |
| Arts, Entertainment & Recreation | 19 (100.0%) | 0 (0.0%) |
| Accommodation & Food Services | 33 (78.6%) | 9 (21.4%) |
| Public Administration | 14 (77.8%) | 4 (22.2%) |
| Total | 224 (55.9%) | 177 (44.1%) |
Education in East Spencer
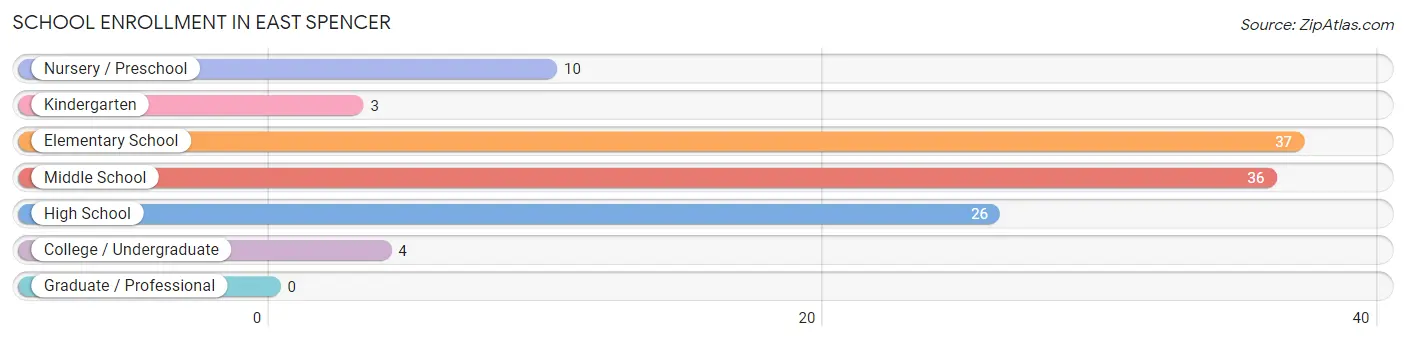
School Enrollment in East Spencer
The most common levels of schooling among the 116 students in East Spencer are elementary school (37 | 31.9%), middle school (36 | 31.0%), and high school (26 | 22.4%).
| School Level | # Students | % Students |
| Nursery / Preschool | 10 | 8.6% |
| Kindergarten | 3 | 2.6% |
| Elementary School | 37 | 31.9% |
| Middle School | 36 | 31.0% |
| High School | 26 | 22.4% |
| College / Undergraduate | 4 | 3.5% |
| Graduate / Professional | 0 | 0.0% |
| Total | 116 | 100.0% |
School Enrollment by Age by Funding Source in East Spencer
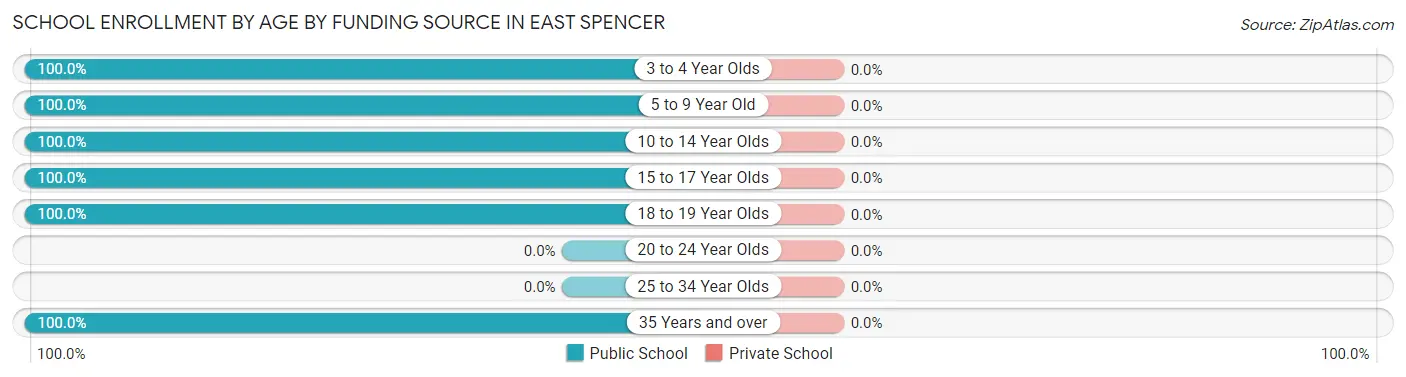
| Age Bracket | Public School | Private School |
| 3 to 4 Year Olds | 10 (100.0%) | 0 (0.0%) |
| 5 to 9 Year Old | 40 (100.0%) | 0 (0.0%) |
| 10 to 14 Year Olds | 36 (100.0%) | 0 (0.0%) |
| 15 to 17 Year Olds | 9 (100.0%) | 0 (0.0%) |
| 18 to 19 Year Olds | 17 (100.0%) | 0 (0.0%) |
| 20 to 24 Year Olds | 0 (0.0%) | 0 (0.0%) |
| 25 to 34 Year Olds | 0 (0.0%) | 0 (0.0%) |
| 35 Years and over | 4 (100.0%) | 0 (0.0%) |
| Total | 116 (100.0%) | 0 (0.0%) |
Educational Attainment by Field of Study in East Spencer
Business (92 | 66.7%), bio, nature & agricultural (11 | 8.0%), social sciences (11 | 8.0%), computers & mathematics (9 | 6.5%), and psychology (8 | 5.8%) are the most common fields of study among 138 individuals in East Spencer who have obtained a bachelor's degree or higher.
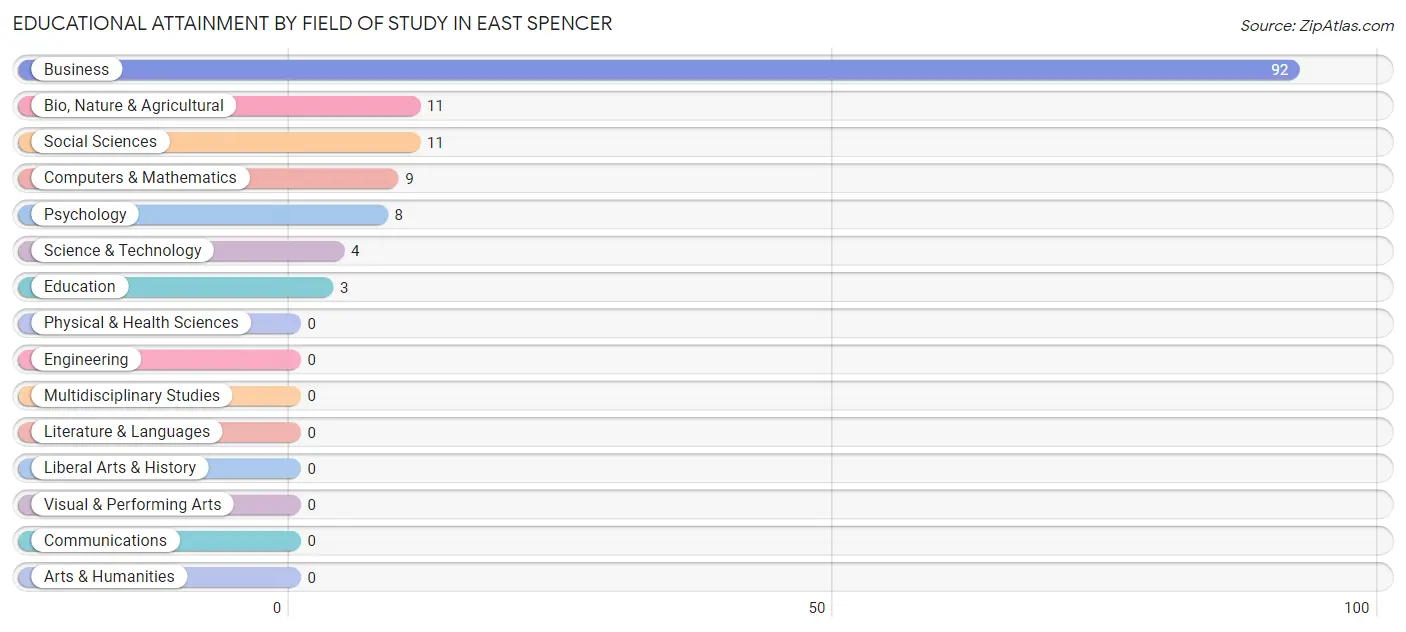
| Field of Study | # Graduates | % Graduates |
| Computers & Mathematics | 9 | 6.5% |
| Bio, Nature & Agricultural | 11 | 8.0% |
| Physical & Health Sciences | 0 | 0.0% |
| Psychology | 8 | 5.8% |
| Social Sciences | 11 | 8.0% |
| Engineering | 0 | 0.0% |
| Multidisciplinary Studies | 0 | 0.0% |
| Science & Technology | 4 | 2.9% |
| Business | 92 | 66.7% |
| Education | 3 | 2.2% |
| Literature & Languages | 0 | 0.0% |
| Liberal Arts & History | 0 | 0.0% |
| Visual & Performing Arts | 0 | 0.0% |
| Communications | 0 | 0.0% |
| Arts & Humanities | 0 | 0.0% |
| Total | 138 | 100.0% |
Transportation & Commute in East Spencer
Vehicle Availability by Sex in East Spencer
The most prevalent vehicle ownership categories in East Spencer are males with 2 vehicles (111, accounting for 51.6%) and females with 2 vehicles (105, making up 66.1%).
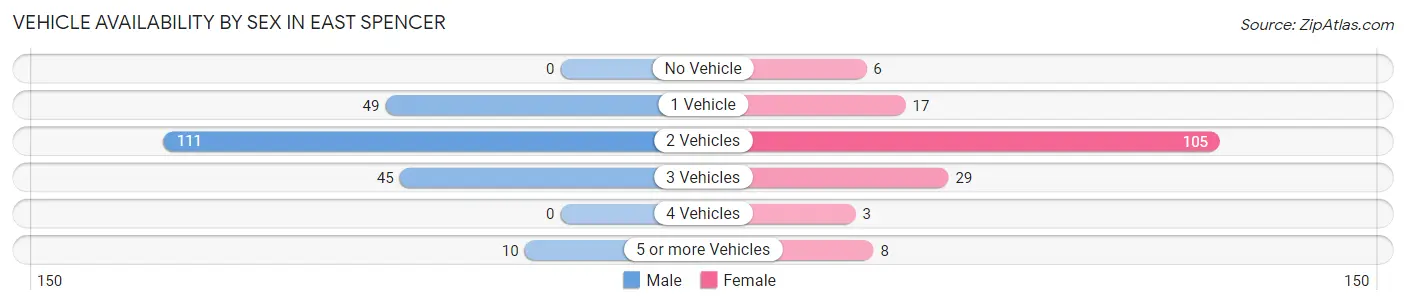
| Vehicles Available | Male | Female |
| No Vehicle | 0 (0.0%) | 6 (3.6%) |
| 1 Vehicle | 49 (22.8%) | 17 (10.1%) |
| 2 Vehicles | 111 (51.6%) | 105 (62.5%) |
| 3 Vehicles | 45 (20.9%) | 29 (17.3%) |
| 4 Vehicles | 0 (0.0%) | 3 (1.8%) |
| 5 or more Vehicles | 10 (4.6%) | 8 (4.8%) |
| Total | 215 (100.0%) | 168 (100.0%) |
Commute Time in East Spencer
The most frequently occuring commute durations in East Spencer are 30 to 34 minutes (99 commuters, 26.8%), 15 to 19 minutes (91 commuters, 24.6%), and 10 to 14 minutes (68 commuters, 18.4%).
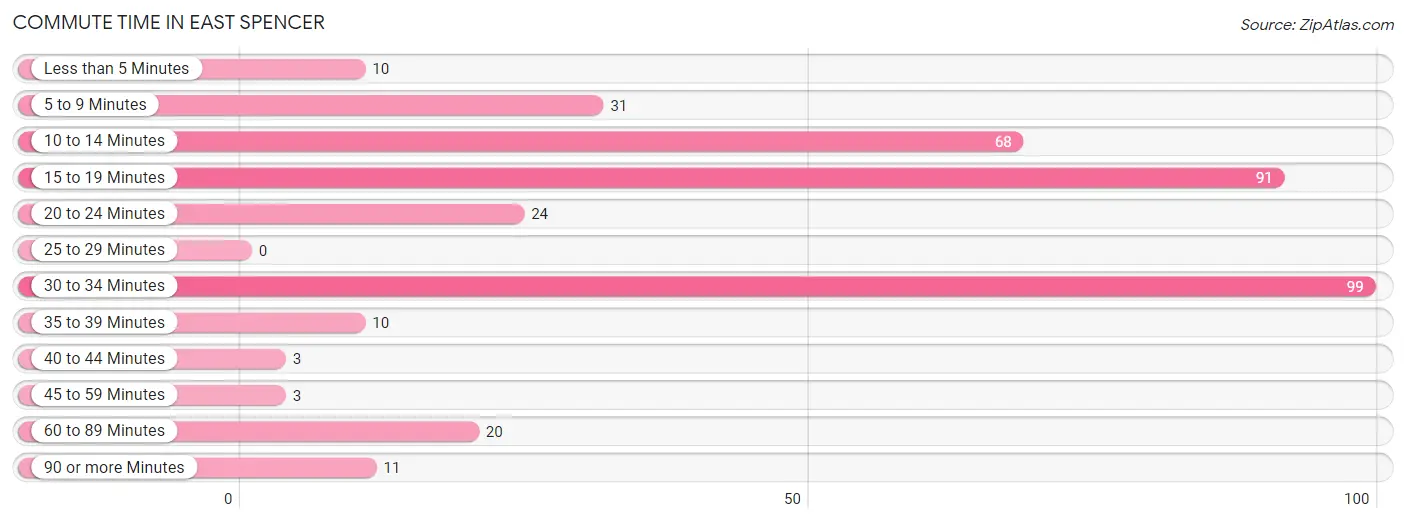
| Commute Time | # Commuters | % Commuters |
| Less than 5 Minutes | 10 | 2.7% |
| 5 to 9 Minutes | 31 | 8.4% |
| 10 to 14 Minutes | 68 | 18.4% |
| 15 to 19 Minutes | 91 | 24.6% |
| 20 to 24 Minutes | 24 | 6.5% |
| 25 to 29 Minutes | 0 | 0.0% |
| 30 to 34 Minutes | 99 | 26.8% |
| 35 to 39 Minutes | 10 | 2.7% |
| 40 to 44 Minutes | 3 | 0.8% |
| 45 to 59 Minutes | 3 | 0.8% |
| 60 to 89 Minutes | 20 | 5.4% |
| 90 or more Minutes | 11 | 3.0% |
Commute Time by Sex in East Spencer
The most common commute times in East Spencer are 30 to 34 minutes (93 commuters, 43.3%) for males and 15 to 19 minutes (72 commuters, 46.5%) for females.
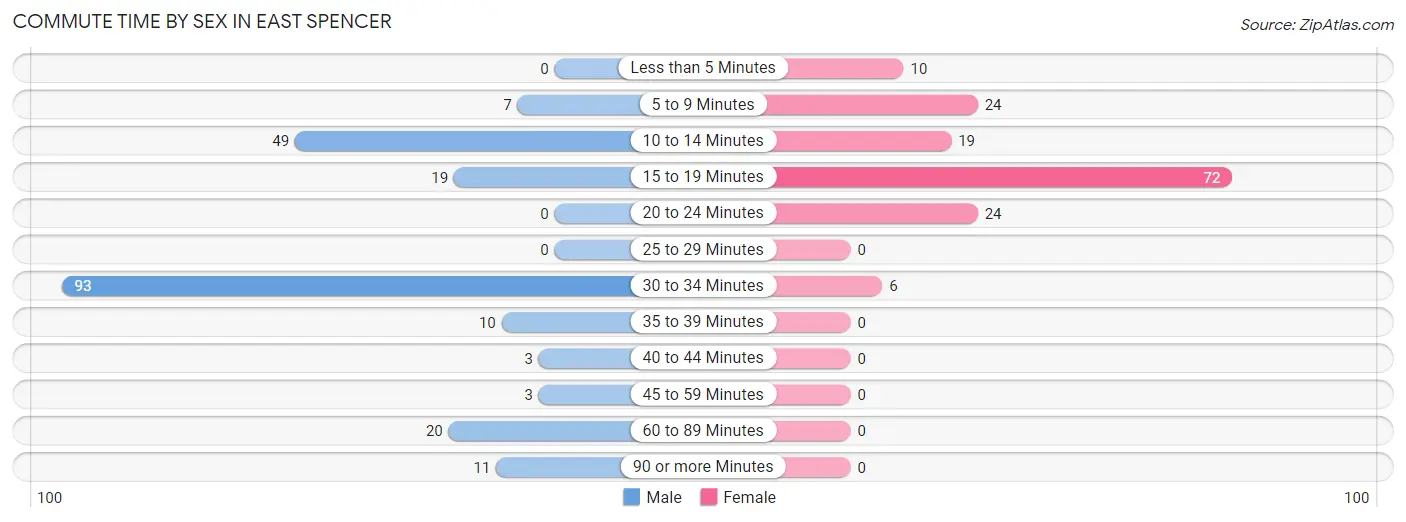
| Commute Time | Male | Female |
| Less than 5 Minutes | 0 (0.0%) | 10 (6.5%) |
| 5 to 9 Minutes | 7 (3.3%) | 24 (15.5%) |
| 10 to 14 Minutes | 49 (22.8%) | 19 (12.3%) |
| 15 to 19 Minutes | 19 (8.8%) | 72 (46.5%) |
| 20 to 24 Minutes | 0 (0.0%) | 24 (15.5%) |
| 25 to 29 Minutes | 0 (0.0%) | 0 (0.0%) |
| 30 to 34 Minutes | 93 (43.3%) | 6 (3.9%) |
| 35 to 39 Minutes | 10 (4.6%) | 0 (0.0%) |
| 40 to 44 Minutes | 3 (1.4%) | 0 (0.0%) |
| 45 to 59 Minutes | 3 (1.4%) | 0 (0.0%) |
| 60 to 89 Minutes | 20 (9.3%) | 0 (0.0%) |
| 90 or more Minutes | 11 (5.1%) | 0 (0.0%) |
Time of Departure to Work by Sex in East Spencer
The most frequent times of departure to work in East Spencer are 7:00 AM to 7:29 AM (63, 29.3%) for males and 6:30 AM to 6:59 AM (54, 34.8%) for females.
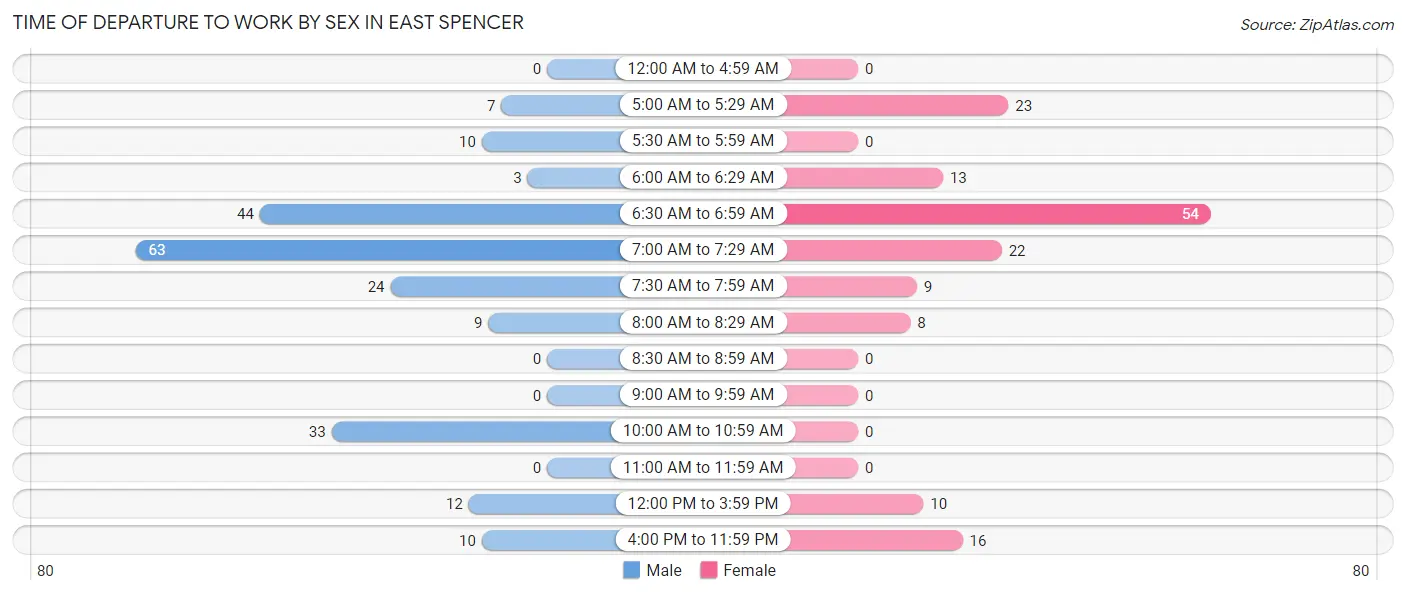
| Time of Departure | Male | Female |
| 12:00 AM to 4:59 AM | 0 (0.0%) | 0 (0.0%) |
| 5:00 AM to 5:29 AM | 7 (3.3%) | 23 (14.8%) |
| 5:30 AM to 5:59 AM | 10 (4.6%) | 0 (0.0%) |
| 6:00 AM to 6:29 AM | 3 (1.4%) | 13 (8.4%) |
| 6:30 AM to 6:59 AM | 44 (20.5%) | 54 (34.8%) |
| 7:00 AM to 7:29 AM | 63 (29.3%) | 22 (14.2%) |
| 7:30 AM to 7:59 AM | 24 (11.2%) | 9 (5.8%) |
| 8:00 AM to 8:29 AM | 9 (4.2%) | 8 (5.2%) |
| 8:30 AM to 8:59 AM | 0 (0.0%) | 0 (0.0%) |
| 9:00 AM to 9:59 AM | 0 (0.0%) | 0 (0.0%) |
| 10:00 AM to 10:59 AM | 33 (15.3%) | 0 (0.0%) |
| 11:00 AM to 11:59 AM | 0 (0.0%) | 0 (0.0%) |
| 12:00 PM to 3:59 PM | 12 (5.6%) | 10 (6.5%) |
| 4:00 PM to 11:59 PM | 10 (4.6%) | 16 (10.3%) |
| Total | 215 (100.0%) | 155 (100.0%) |
Housing Occupancy in East Spencer
Occupancy by Ownership in East Spencer
Of the total 631 dwellings in East Spencer, owner-occupied units account for 345 (54.7%), while renter-occupied units make up 286 (45.3%).
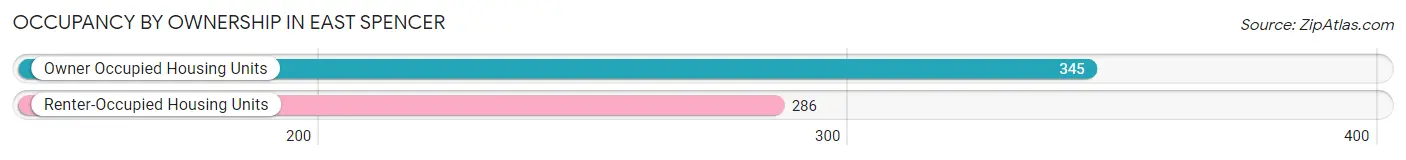
| Occupancy | # Housing Units | % Housing Units |
| Owner Occupied Housing Units | 345 | 54.7% |
| Renter-Occupied Housing Units | 286 | 45.3% |
| Total Occupied Housing Units | 631 | 100.0% |
Occupancy by Household Size in East Spencer
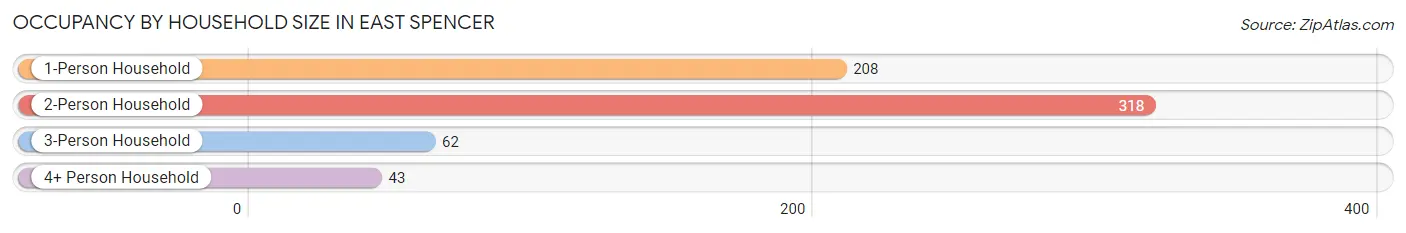
| Household Size | # Housing Units | % Housing Units |
| 1-Person Household | 208 | 33.0% |
| 2-Person Household | 318 | 50.4% |
| 3-Person Household | 62 | 9.8% |
| 4+ Person Household | 43 | 6.8% |
| Total Housing Units | 631 | 100.0% |
Occupancy by Ownership by Household Size in East Spencer
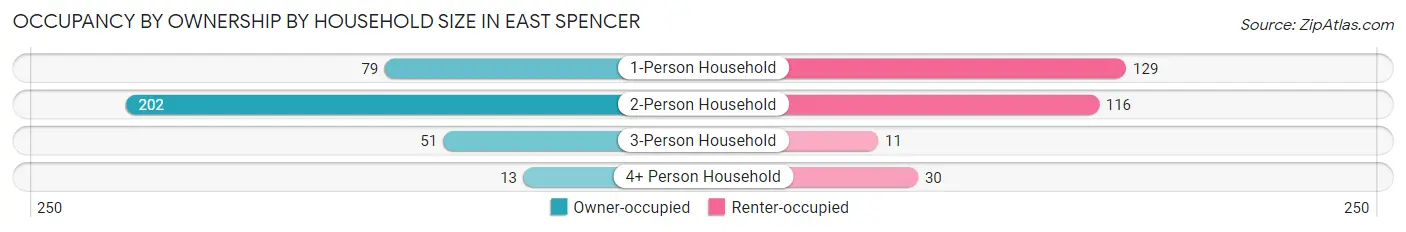
| Household Size | Owner-occupied | Renter-occupied |
| 1-Person Household | 79 (38.0%) | 129 (62.0%) |
| 2-Person Household | 202 (63.5%) | 116 (36.5%) |
| 3-Person Household | 51 (82.3%) | 11 (17.7%) |
| 4+ Person Household | 13 (30.2%) | 30 (69.8%) |
| Total Housing Units | 345 (54.7%) | 286 (45.3%) |
Occupancy by Educational Attainment in East Spencer
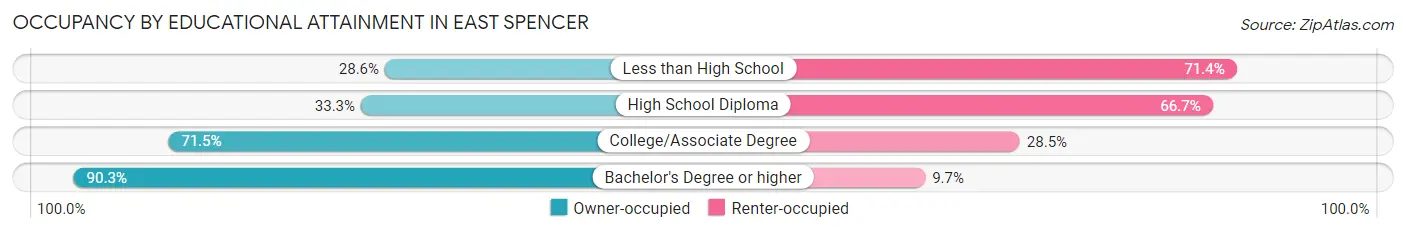
| Household Size | Owner-occupied | Renter-occupied |
| Less than High School | 20 (28.6%) | 50 (71.4%) |
| High School Diploma | 85 (33.3%) | 170 (66.7%) |
| College/Associate Degree | 138 (71.5%) | 55 (28.5%) |
| Bachelor's Degree or higher | 102 (90.3%) | 11 (9.7%) |
Occupancy by Age of Householder in East Spencer
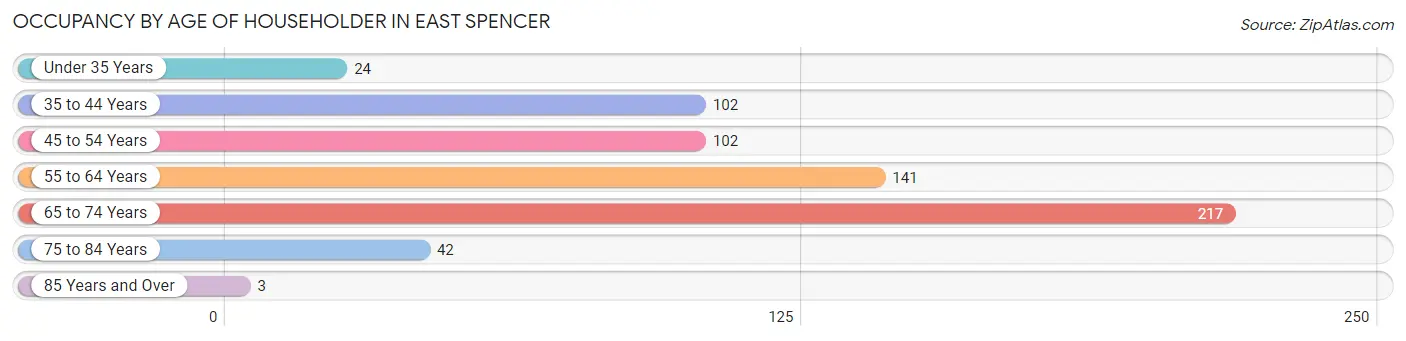
| Age Bracket | # Households | % Households |
| Under 35 Years | 24 | 3.8% |
| 35 to 44 Years | 102 | 16.2% |
| 45 to 54 Years | 102 | 16.2% |
| 55 to 64 Years | 141 | 22.4% |
| 65 to 74 Years | 217 | 34.4% |
| 75 to 84 Years | 42 | 6.7% |
| 85 Years and Over | 3 | 0.5% |
| Total | 631 | 100.0% |
Housing Finances in East Spencer
Median Income by Occupancy in East Spencer
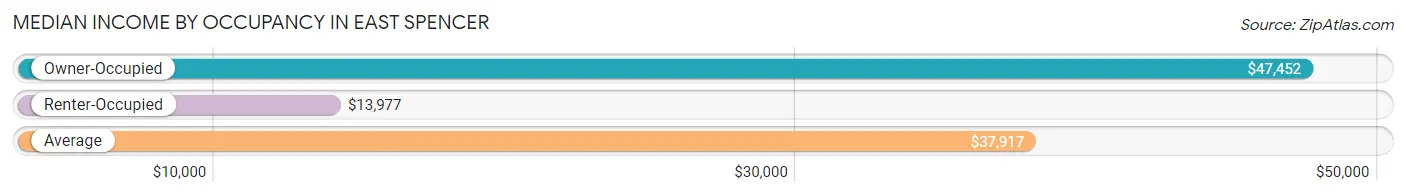
| Occupancy Type | # Households | Median Income |
| Owner-Occupied | 345 (54.7%) | $47,452 |
| Renter-Occupied | 286 (45.3%) | $13,977 |
| Average | 631 (100.0%) | $37,917 |
Occupancy by Householder Income Bracket in East Spencer
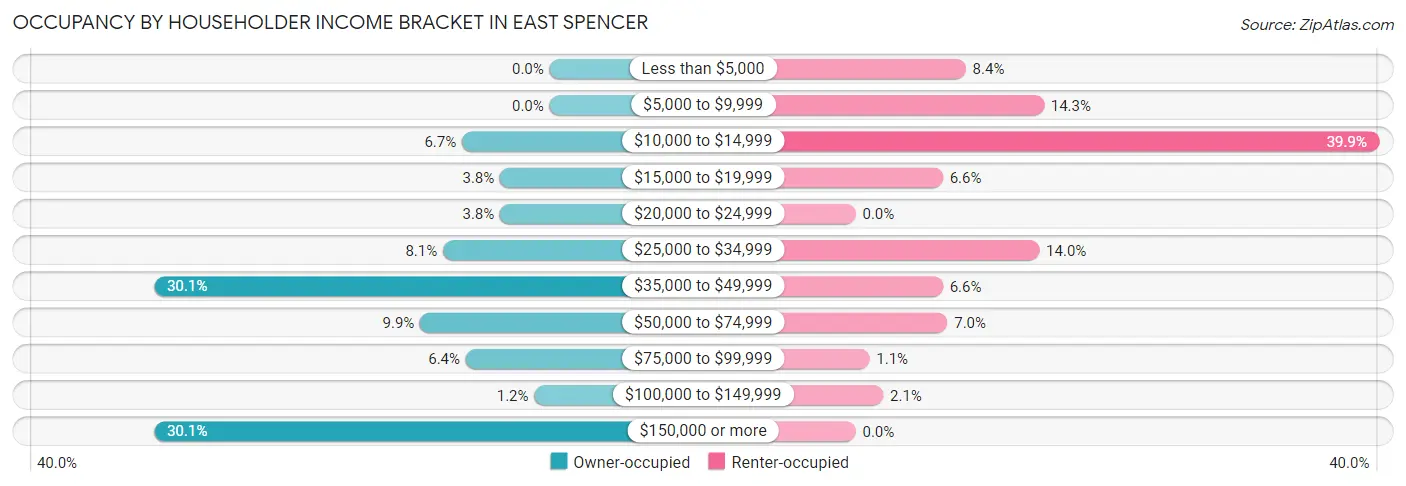
| Income Bracket | Owner-occupied | Renter-occupied |
| Less than $5,000 | 0 (0.0%) | 24 (8.4%) |
| $5,000 to $9,999 | 0 (0.0%) | 41 (14.3%) |
| $10,000 to $14,999 | 23 (6.7%) | 114 (39.9%) |
| $15,000 to $19,999 | 13 (3.8%) | 19 (6.6%) |
| $20,000 to $24,999 | 13 (3.8%) | 0 (0.0%) |
| $25,000 to $34,999 | 28 (8.1%) | 40 (14.0%) |
| $35,000 to $49,999 | 104 (30.1%) | 19 (6.6%) |
| $50,000 to $74,999 | 34 (9.9%) | 20 (7.0%) |
| $75,000 to $99,999 | 22 (6.4%) | 3 (1.1%) |
| $100,000 to $149,999 | 4 (1.2%) | 6 (2.1%) |
| $150,000 or more | 104 (30.1%) | 0 (0.0%) |
| Total | 345 (100.0%) | 286 (100.0%) |
Monthly Housing Cost Tiers in East Spencer
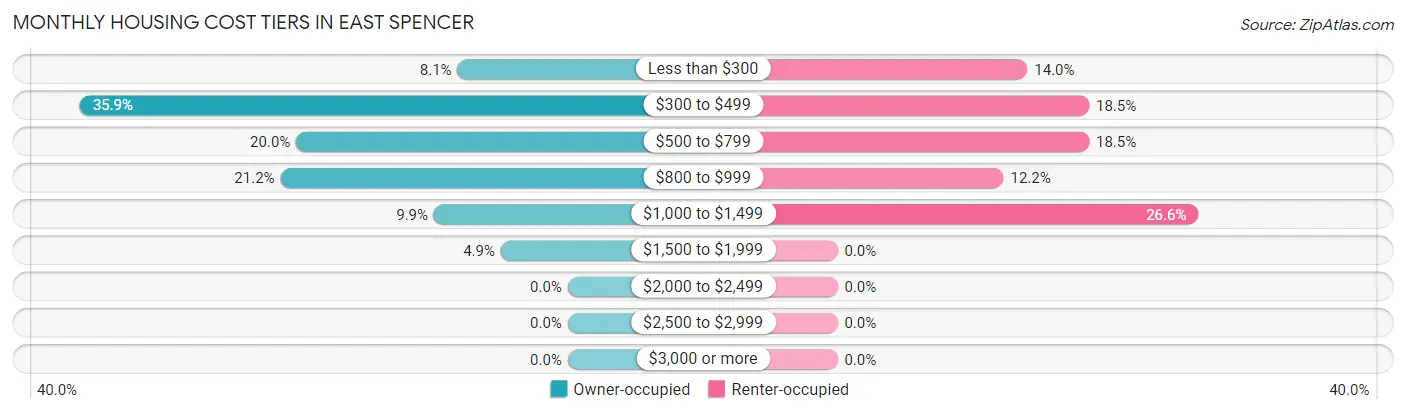
| Monthly Cost | Owner-occupied | Renter-occupied |
| Less than $300 | 28 (8.1%) | 40 (14.0%) |
| $300 to $499 | 124 (35.9%) | 53 (18.5%) |
| $500 to $799 | 69 (20.0%) | 53 (18.5%) |
| $800 to $999 | 73 (21.2%) | 35 (12.2%) |
| $1,000 to $1,499 | 34 (9.9%) | 76 (26.6%) |
| $1,500 to $1,999 | 17 (4.9%) | 0 (0.0%) |
| $2,000 to $2,499 | 0 (0.0%) | 0 (0.0%) |
| $2,500 to $2,999 | 0 (0.0%) | 0 (0.0%) |
| $3,000 or more | 0 (0.0%) | 0 (0.0%) |
| Total | 345 (100.0%) | 286 (100.0%) |
Physical Housing Characteristics in East Spencer
Housing Structures in East Spencer
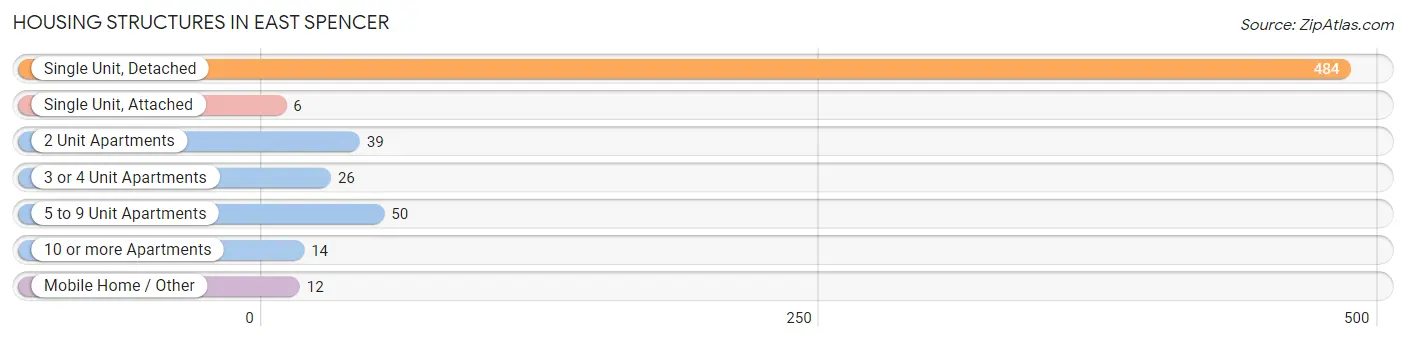
| Structure Type | # Housing Units | % Housing Units |
| Single Unit, Detached | 484 | 76.7% |
| Single Unit, Attached | 6 | 0.9% |
| 2 Unit Apartments | 39 | 6.2% |
| 3 or 4 Unit Apartments | 26 | 4.1% |
| 5 to 9 Unit Apartments | 50 | 7.9% |
| 10 or more Apartments | 14 | 2.2% |
| Mobile Home / Other | 12 | 1.9% |
| Total | 631 | 100.0% |
Housing Structures by Occupancy in East Spencer
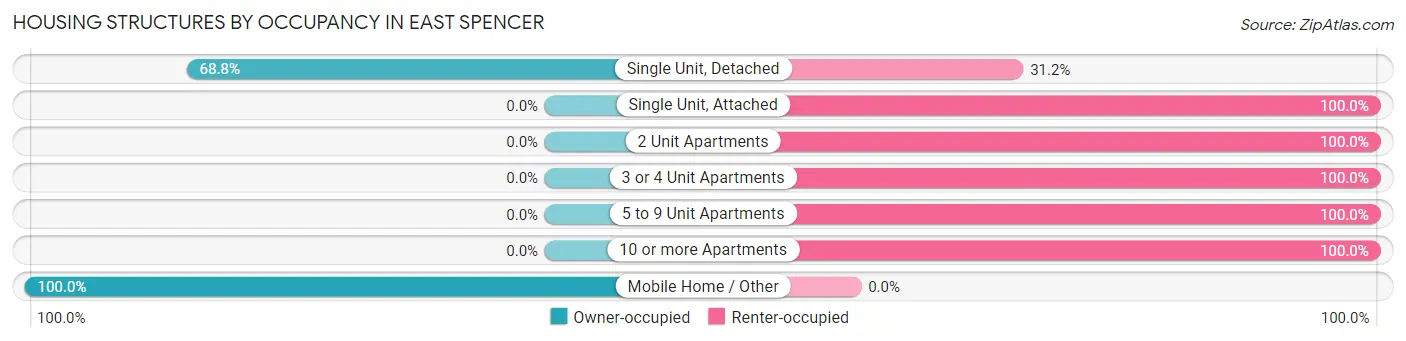
| Structure Type | Owner-occupied | Renter-occupied |
| Single Unit, Detached | 333 (68.8%) | 151 (31.2%) |
| Single Unit, Attached | 0 (0.0%) | 6 (100.0%) |
| 2 Unit Apartments | 0 (0.0%) | 39 (100.0%) |
| 3 or 4 Unit Apartments | 0 (0.0%) | 26 (100.0%) |
| 5 to 9 Unit Apartments | 0 (0.0%) | 50 (100.0%) |
| 10 or more Apartments | 0 (0.0%) | 14 (100.0%) |
| Mobile Home / Other | 12 (100.0%) | 0 (0.0%) |
| Total | 345 (54.7%) | 286 (45.3%) |
Housing Structures by Number of Rooms in East Spencer
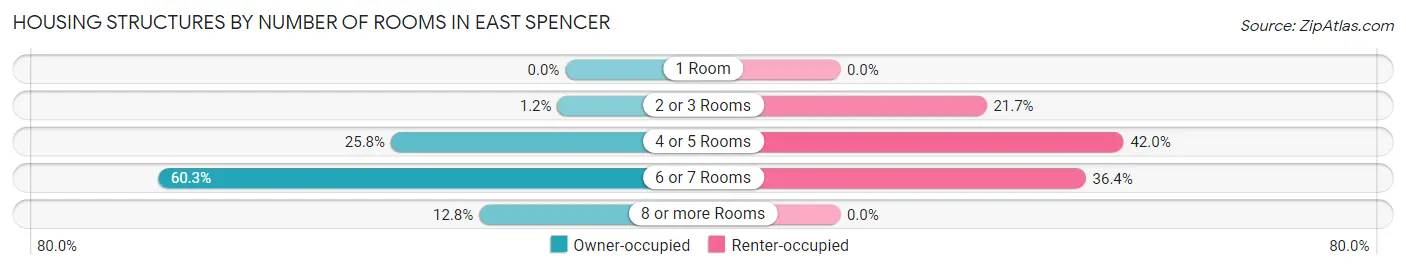
| Number of Rooms | Owner-occupied | Renter-occupied |
| 1 Room | 0 (0.0%) | 0 (0.0%) |
| 2 or 3 Rooms | 4 (1.2%) | 62 (21.7%) |
| 4 or 5 Rooms | 89 (25.8%) | 120 (42.0%) |
| 6 or 7 Rooms | 208 (60.3%) | 104 (36.4%) |
| 8 or more Rooms | 44 (12.8%) | 0 (0.0%) |
| Total | 345 (100.0%) | 286 (100.0%) |
Housing Structure by Heating Type in East Spencer
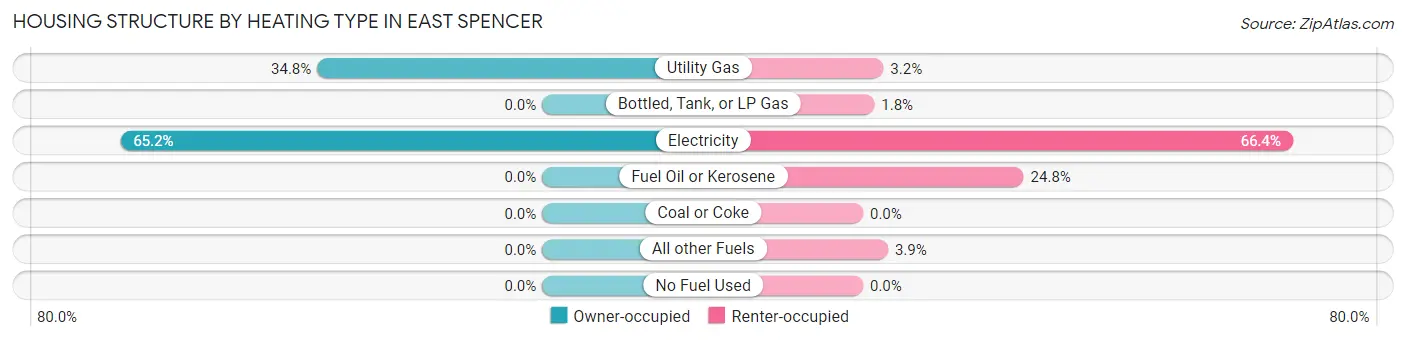
| Heating Type | Owner-occupied | Renter-occupied |
| Utility Gas | 120 (34.8%) | 9 (3.2%) |
| Bottled, Tank, or LP Gas | 0 (0.0%) | 5 (1.8%) |
| Electricity | 225 (65.2%) | 190 (66.4%) |
| Fuel Oil or Kerosene | 0 (0.0%) | 71 (24.8%) |
| Coal or Coke | 0 (0.0%) | 0 (0.0%) |
| All other Fuels | 0 (0.0%) | 11 (3.8%) |
| No Fuel Used | 0 (0.0%) | 0 (0.0%) |
| Total | 345 (100.0%) | 286 (100.0%) |
Household Vehicle Usage in East Spencer
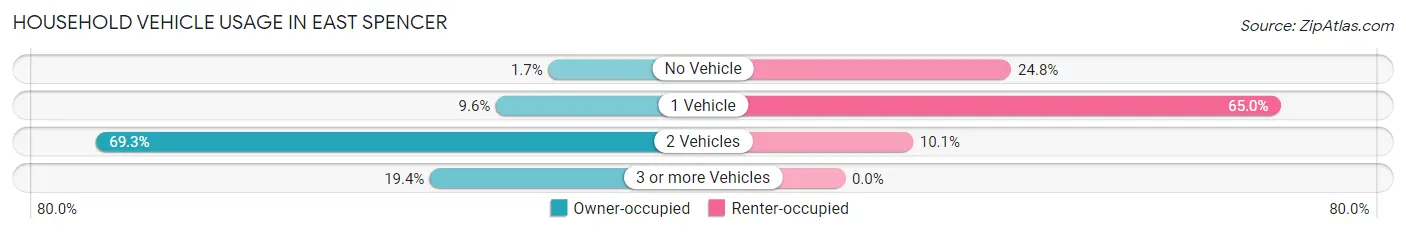
| Vehicles per Household | Owner-occupied | Renter-occupied |
| No Vehicle | 6 (1.7%) | 71 (24.8%) |
| 1 Vehicle | 33 (9.6%) | 186 (65.0%) |
| 2 Vehicles | 239 (69.3%) | 29 (10.1%) |
| 3 or more Vehicles | 67 (19.4%) | 0 (0.0%) |
| Total | 345 (100.0%) | 286 (100.0%) |
Real Estate & Mortgages in East Spencer
Real Estate and Mortgage Overview in East Spencer
| Characteristic | Without Mortgage | With Mortgage |
| Housing Units | 183 | 162 |
| Median Property Value | - | - |
| Median Household Income | - | - |
| Monthly Housing Costs | $438 | $0 |
| Real Estate Taxes | $735 | $0 |
Property Value by Mortgage Status in East Spencer
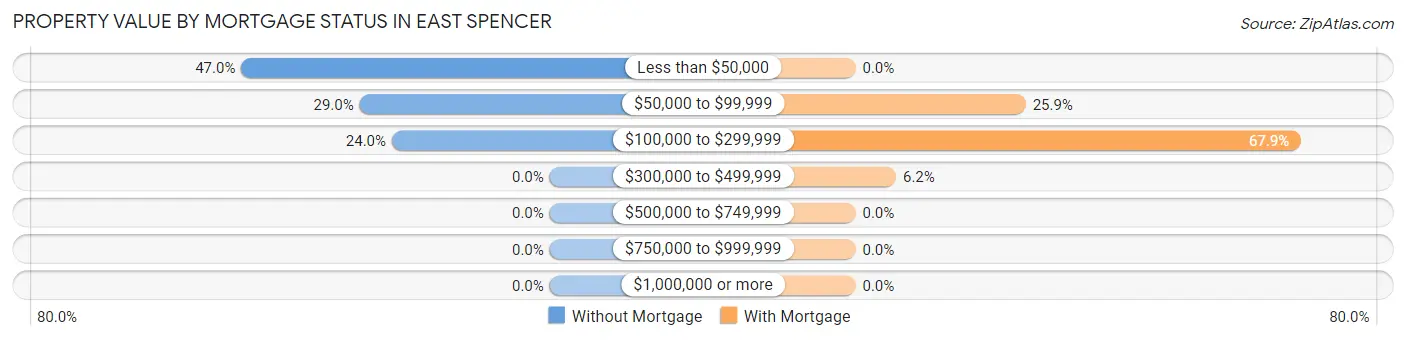
| Property Value | Without Mortgage | With Mortgage |
| Less than $50,000 | 86 (47.0%) | 0 (0.0%) |
| $50,000 to $99,999 | 53 (29.0%) | 42 (25.9%) |
| $100,000 to $299,999 | 44 (24.0%) | 110 (67.9%) |
| $300,000 to $499,999 | 0 (0.0%) | 10 (6.2%) |
| $500,000 to $749,999 | 0 (0.0%) | 0 (0.0%) |
| $750,000 to $999,999 | 0 (0.0%) | 0 (0.0%) |
| $1,000,000 or more | 0 (0.0%) | 0 (0.0%) |
| Total | 183 (100.0%) | 162 (100.0%) |
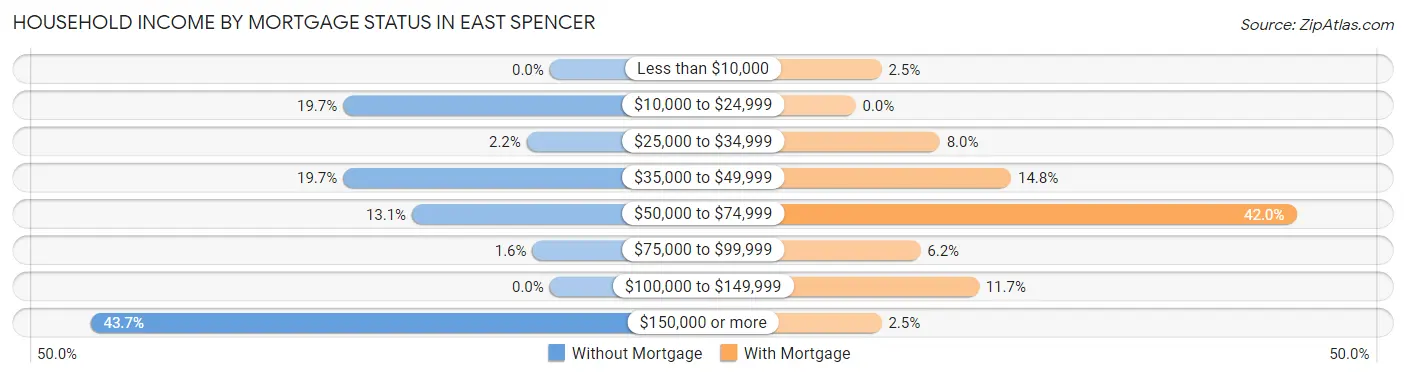
Household Income by Mortgage Status in East Spencer
| Household Income | Without Mortgage | With Mortgage |
| Less than $10,000 | 0 (0.0%) | 4 (2.5%) |
| $10,000 to $24,999 | 36 (19.7%) | 0 (0.0%) |
| $25,000 to $34,999 | 4 (2.2%) | 13 (8.0%) |
| $35,000 to $49,999 | 36 (19.7%) | 24 (14.8%) |
| $50,000 to $74,999 | 24 (13.1%) | 68 (42.0%) |
| $75,000 to $99,999 | 3 (1.6%) | 10 (6.2%) |
| $100,000 to $149,999 | 0 (0.0%) | 19 (11.7%) |
| $150,000 or more | 80 (43.7%) | 4 (2.5%) |
| Total | 183 (100.0%) | 162 (100.0%) |
Property Value to Household Income Ratio in East Spencer
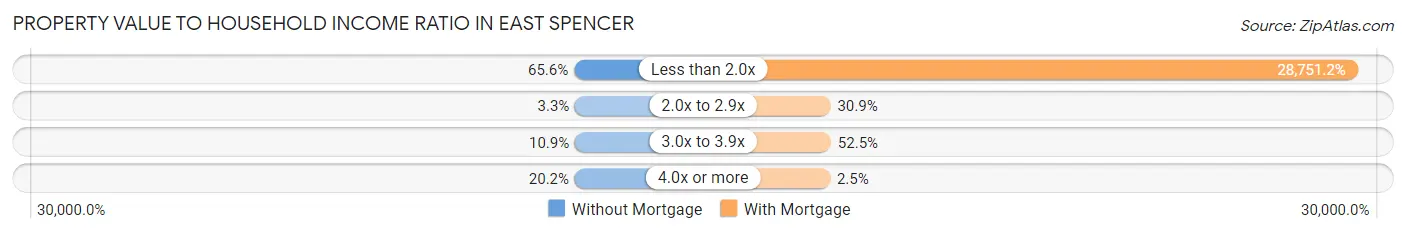
| Value-to-Income Ratio | Without Mortgage | With Mortgage |
| Less than 2.0x | 120 (65.6%) | 46,577 (28,751.2%) |
| 2.0x to 2.9x | 6 (3.3%) | 50 (30.9%) |
| 3.0x to 3.9x | 20 (10.9%) | 85 (52.5%) |
| 4.0x or more | 37 (20.2%) | 4 (2.5%) |
| Total | 183 (100.0%) | 162 (100.0%) |
Real Estate Taxes by Mortgage Status in East Spencer
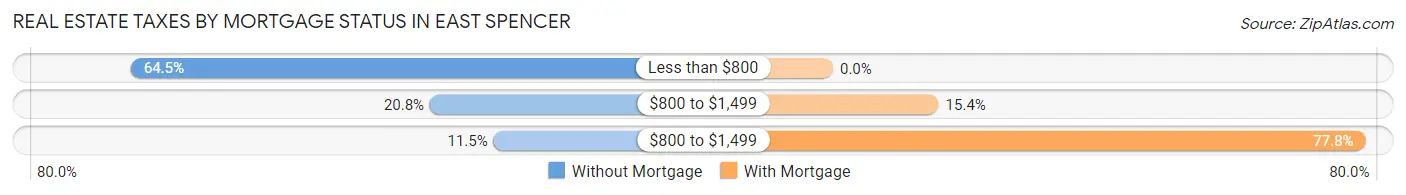
| Property Taxes | Without Mortgage | With Mortgage |
| Less than $800 | 118 (64.5%) | 0 (0.0%) |
| $800 to $1,499 | 38 (20.8%) | 25 (15.4%) |
| $800 to $1,499 | 21 (11.5%) | 126 (77.8%) |
| Total | 183 (100.0%) | 162 (100.0%) |
Health & Disability in East Spencer
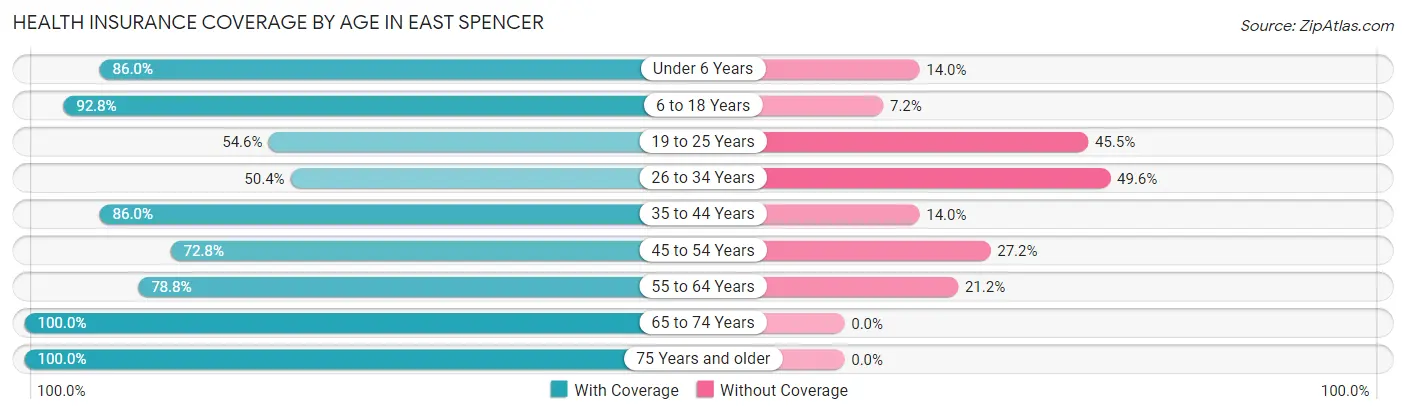
Health Insurance Coverage by Age in East Spencer
| Age Bracket | With Coverage | Without Coverage |
| Under 6 Years | 43 (86.0%) | 7 (14.0%) |
| 6 to 18 Years | 90 (92.8%) | 7 (7.2%) |
| 19 to 25 Years | 6 (54.5%) | 5 (45.5%) |
| 26 to 34 Years | 59 (50.4%) | 58 (49.6%) |
| 35 to 44 Years | 166 (86.0%) | 27 (14.0%) |
| 45 to 54 Years | 123 (72.8%) | 46 (27.2%) |
| 55 to 64 Years | 171 (78.8%) | 46 (21.2%) |
| 65 to 74 Years | 314 (100.0%) | 0 (0.0%) |
| 75 Years and older | 48 (100.0%) | 0 (0.0%) |
| Total | 1,020 (83.9%) | 196 (16.1%) |
Health Insurance Coverage by Citizenship Status in East Spencer
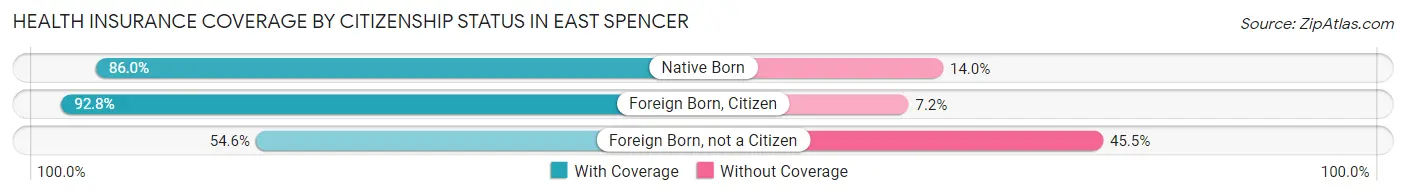
| Citizenship Status | With Coverage | Without Coverage |
| Native Born | 43 (86.0%) | 7 (14.0%) |
| Foreign Born, Citizen | 90 (92.8%) | 7 (7.2%) |
| Foreign Born, not a Citizen | 6 (54.5%) | 5 (45.5%) |
Health Insurance Coverage by Household Income in East Spencer
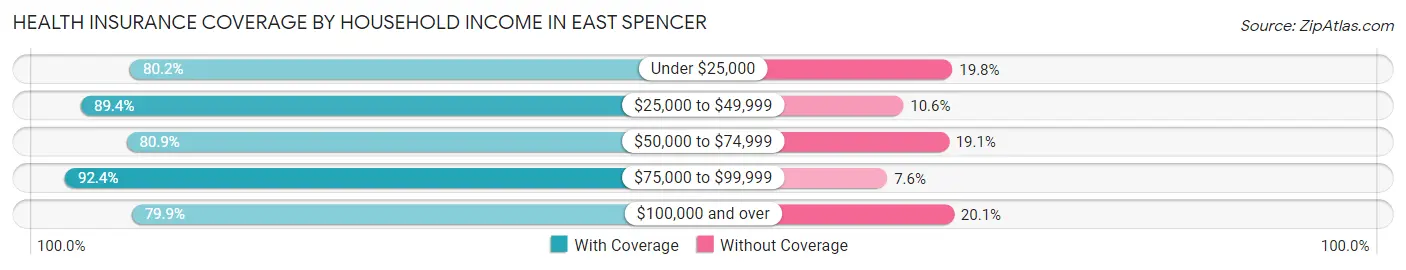
| Household Income | With Coverage | Without Coverage |
| Under $25,000 | 292 (80.2%) | 72 (19.8%) |
| $25,000 to $49,999 | 355 (89.4%) | 42 (10.6%) |
| $50,000 to $74,999 | 89 (80.9%) | 21 (19.1%) |
| $75,000 to $99,999 | 61 (92.4%) | 5 (7.6%) |
| $100,000 and over | 223 (79.9%) | 56 (20.1%) |
Public vs Private Health Insurance Coverage by Age in East Spencer
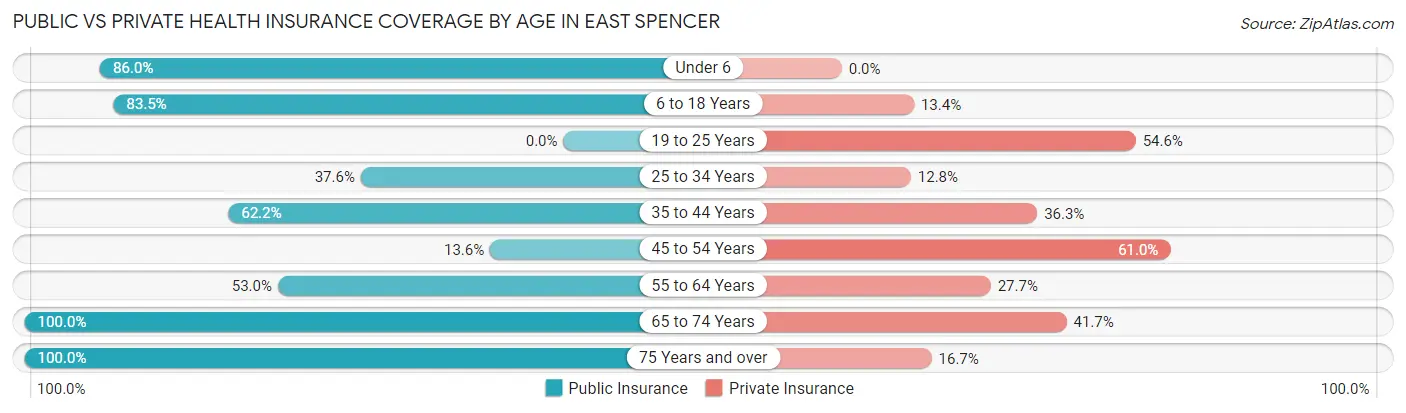
| Age Bracket | Public Insurance | Private Insurance |
| Under 6 | 43 (86.0%) | 0 (0.0%) |
| 6 to 18 Years | 81 (83.5%) | 13 (13.4%) |
| 19 to 25 Years | 0 (0.0%) | 6 (54.5%) |
| 25 to 34 Years | 44 (37.6%) | 15 (12.8%) |
| 35 to 44 Years | 120 (62.2%) | 70 (36.3%) |
| 45 to 54 Years | 23 (13.6%) | 103 (61.0%) |
| 55 to 64 Years | 115 (53.0%) | 60 (27.7%) |
| 65 to 74 Years | 314 (100.0%) | 131 (41.7%) |
| 75 Years and over | 48 (100.0%) | 8 (16.7%) |
| Total | 788 (64.8%) | 406 (33.4%) |
Disability Status by Sex by Age in East Spencer
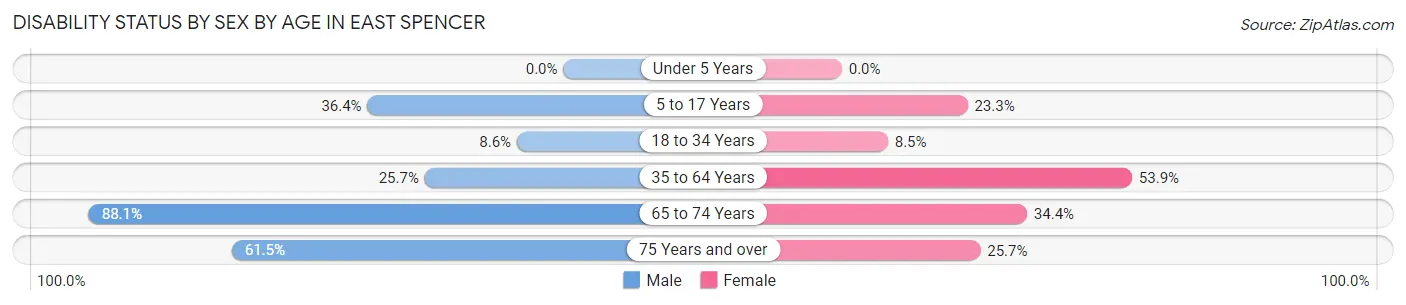
| Age Bracket | Male | Female |
| Under 5 Years | 0 (0.0%) | 0 (0.0%) |
| 5 to 17 Years | 20 (36.4%) | 7 (23.3%) |
| 18 to 34 Years | 5 (8.6%) | 7 (8.5%) |
| 35 to 64 Years | 62 (25.7%) | 182 (53.8%) |
| 65 to 74 Years | 133 (88.1%) | 56 (34.4%) |
| 75 Years and over | 8 (61.5%) | 9 (25.7%) |
Disability Class by Sex by Age in East Spencer
Disability Class: Hearing Difficulty
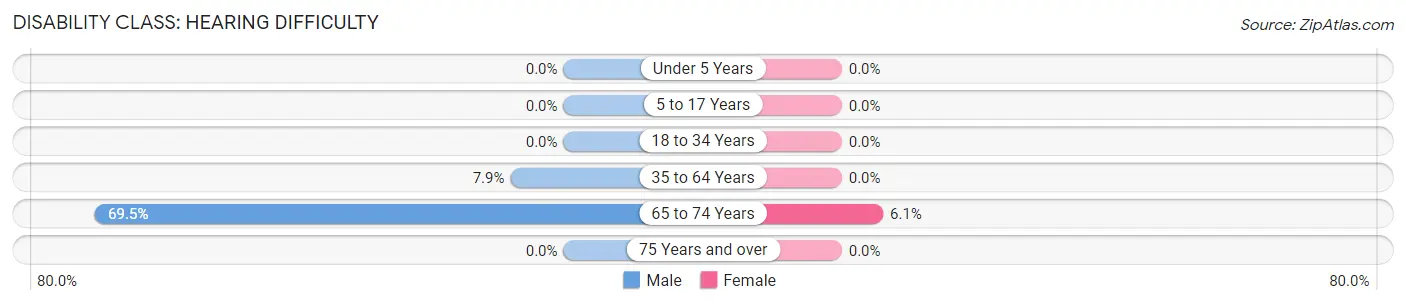
| Age Bracket | Male | Female |
| Under 5 Years | 0 (0.0%) | 0 (0.0%) |
| 5 to 17 Years | 0 (0.0%) | 0 (0.0%) |
| 18 to 34 Years | 0 (0.0%) | 0 (0.0%) |
| 35 to 64 Years | 19 (7.9%) | 0 (0.0%) |
| 65 to 74 Years | 105 (69.5%) | 10 (6.1%) |
| 75 Years and over | 0 (0.0%) | 0 (0.0%) |
Disability Class: Vision Difficulty
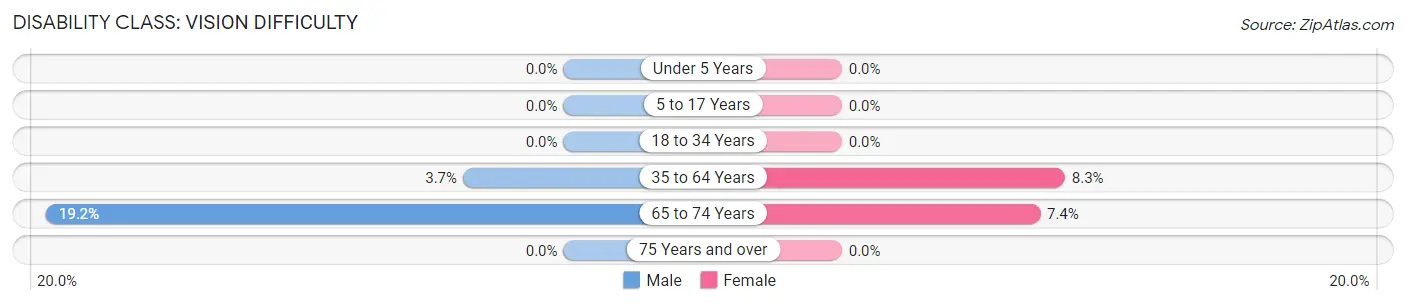
| Age Bracket | Male | Female |
| Under 5 Years | 0 (0.0%) | 0 (0.0%) |
| 5 to 17 Years | 0 (0.0%) | 0 (0.0%) |
| 18 to 34 Years | 0 (0.0%) | 0 (0.0%) |
| 35 to 64 Years | 9 (3.7%) | 28 (8.3%) |
| 65 to 74 Years | 29 (19.2%) | 12 (7.4%) |
| 75 Years and over | 0 (0.0%) | 0 (0.0%) |
Disability Class: Cognitive Difficulty
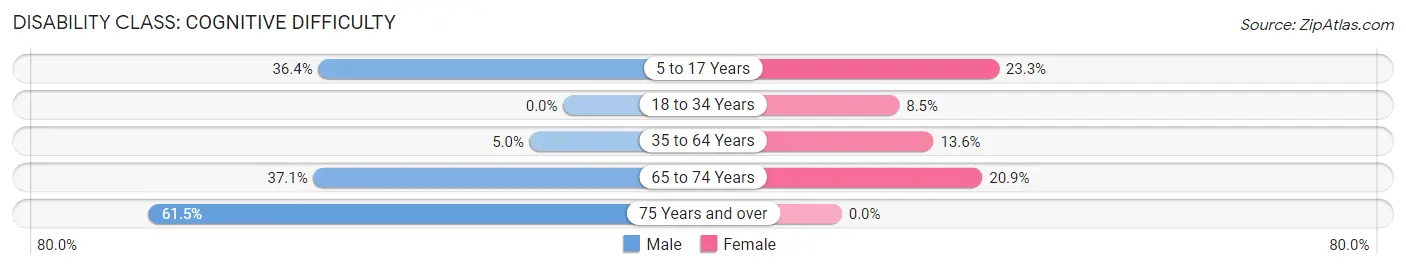
| Age Bracket | Male | Female |
| 5 to 17 Years | 20 (36.4%) | 7 (23.3%) |
| 18 to 34 Years | 0 (0.0%) | 7 (8.5%) |
| 35 to 64 Years | 12 (5.0%) | 46 (13.6%) |
| 65 to 74 Years | 56 (37.1%) | 34 (20.9%) |
| 75 Years and over | 8 (61.5%) | 0 (0.0%) |
Disability Class: Ambulatory Difficulty
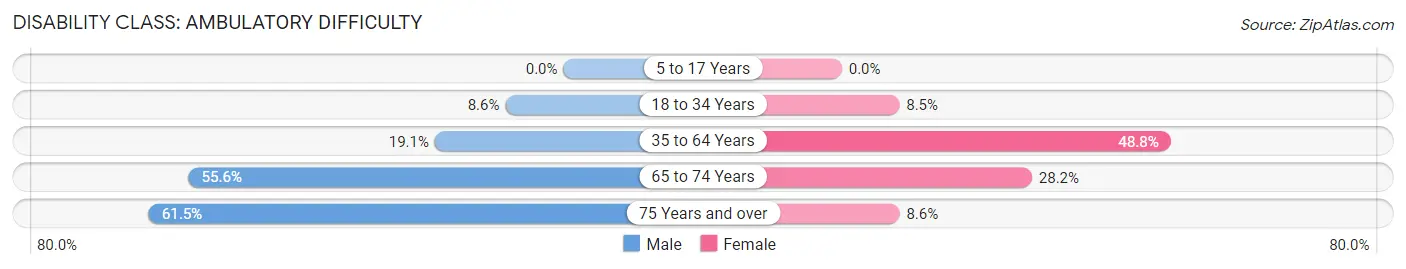
| Age Bracket | Male | Female |
| 5 to 17 Years | 0 (0.0%) | 0 (0.0%) |
| 18 to 34 Years | 5 (8.6%) | 7 (8.5%) |
| 35 to 64 Years | 46 (19.1%) | 165 (48.8%) |
| 65 to 74 Years | 84 (55.6%) | 46 (28.2%) |
| 75 Years and over | 8 (61.5%) | 3 (8.6%) |
Disability Class: Self-Care Difficulty
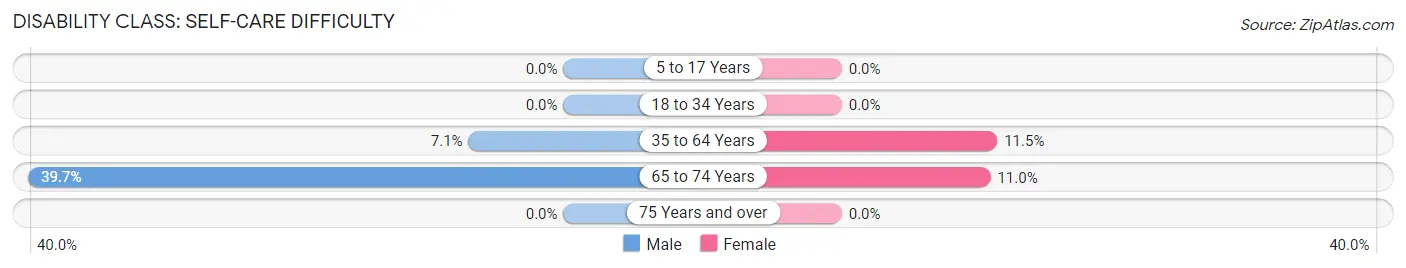
| Age Bracket | Male | Female |
| 5 to 17 Years | 0 (0.0%) | 0 (0.0%) |
| 18 to 34 Years | 0 (0.0%) | 0 (0.0%) |
| 35 to 64 Years | 17 (7.0%) | 39 (11.5%) |
| 65 to 74 Years | 60 (39.7%) | 18 (11.0%) |
| 75 Years and over | 0 (0.0%) | 0 (0.0%) |
Technology Access in East Spencer
Computing Device Access in East Spencer
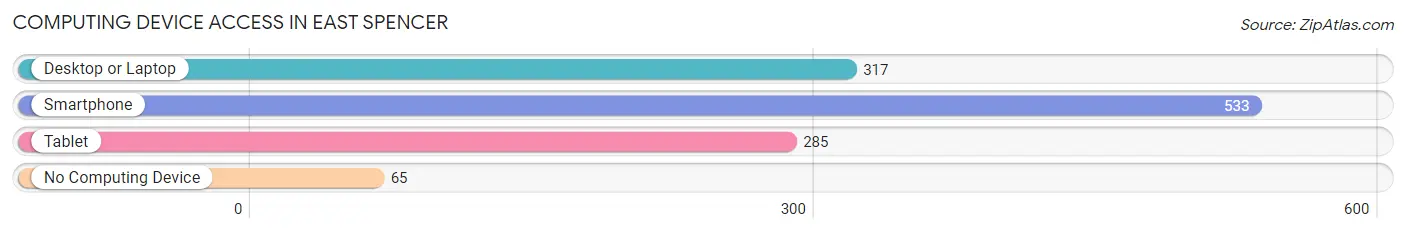
| Device Type | # Households | % Households |
| Desktop or Laptop | 317 | 50.2% |
| Smartphone | 533 | 84.5% |
| Tablet | 285 | 45.2% |
| No Computing Device | 65 | 10.3% |
| Total | 631 | 100.0% |
Internet Access in East Spencer
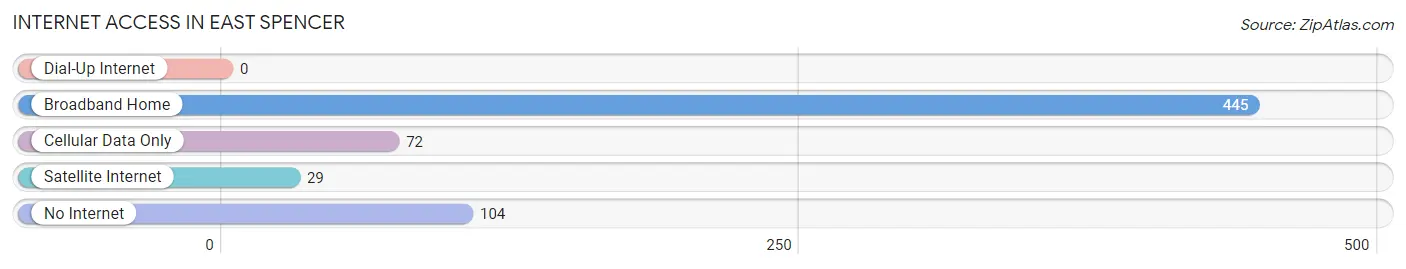
| Internet Type | # Households | % Households |
| Dial-Up Internet | 0 | 0.0% |
| Broadband Home | 445 | 70.5% |
| Cellular Data Only | 72 | 11.4% |
| Satellite Internet | 29 | 4.6% |
| No Internet | 104 | 16.5% |
| Total | 631 | 100.0% |
East Spencer Summary
History
East Spencer, North Carolina is a small town located in Rowan County, North Carolina. It is located just east of the city of Salisbury, and is part of the Charlotte metropolitan area. The town was founded in 1887 by the East Spencer Land Company, and was named after the nearby Spencer Shops, a railroad repair facility. The town was incorporated in 1895, and has since grown to a population of 1,717 as of the 2010 census.
East Spencer has a rich history, and has been home to many notable figures throughout its history. The town was home to the first African-American mayor in North Carolina, Dr. William H. Anderson, who served from 1969 to 1971. The town was also home to the first African-American woman to serve in the North Carolina General Assembly, Dr. Alma Adams, who served from 1994 to 2020.
Geography
East Spencer is located in the Piedmont region of North Carolina, and is situated in the Yadkin-Pee Dee River Basin. The town is located at the intersection of Interstate 85 and US Highway 29, and is approximately 8 miles east of Salisbury. The town is located at an elevation of 645 feet above sea level, and has a total area of 1.2 square miles.
The town is located in a humid subtropical climate, and experiences hot, humid summers and mild winters. The average annual temperature is around 61 degrees Fahrenheit, and the average annual precipitation is around 44 inches.
Economy
East Spencer’s economy is largely based on manufacturing and retail. The town is home to several manufacturing companies, including a furniture factory, a textile mill, and a plastics plant. The town is also home to several retail stores, including a grocery store, a hardware store, and a variety of other shops.
The town is also home to several small businesses, including restaurants, auto repair shops, and other services. The town is also home to a number of churches, and is served by the Rowan-Salisbury School System.
Demographics
As of the 2010 census, East Spencer had a population of 1,717. The racial makeup of the town was 79.3% White, 16.2% African American, 0.3% Native American, 0.7% Asian, 0.1% Pacific Islander, 1.2% from other races, and 2.4% from two or more races. Hispanic or Latino of any race were 3.2% of the population.
The median income for a household in East Spencer was $31,250, and the median income for a family was $37,500. The per capita income for the town was $15,945. About 17.2% of families and 20.2% of the population were below the poverty line, including 28.3% of those under age 18 and 11.2% of those age 65 or over.
Common Questions
What is Per Capita Income in East Spencer?
Per Capita income in East Spencer is $25,641.
What is the Median Family Income in East Spencer?
Median Family Income in East Spencer is $61,071.
What is the Median Household income in East Spencer?
Median Household Income in East Spencer is $37,917.
What is Income or Wage Gap in East Spencer?
Income or Wage Gap in East Spencer is 16.5%.
Women in East Spencer earn 83.5 cents for every dollar earned by a man.
What is Inequality or Gini Index in East Spencer?
Inequality or Gini Index in East Spencer is 0.51.
What is the Total Population of East Spencer?
Total Population of East Spencer is 1,216.
What is the Total Male Population of East Spencer?
Total Male Population of East Spencer is 557.
What is the Total Female Population of East Spencer?
Total Female Population of East Spencer is 659.
What is the Ratio of Males per 100 Females in East Spencer?
There are 84.52 Males per 100 Females in East Spencer.
What is the Ratio of Females per 100 Males in East Spencer?
There are 118.31 Females per 100 Males in East Spencer.
What is the Median Population Age in East Spencer?
Median Population Age in East Spencer is 52.9 Years.
What is the Average Family Size in East Spencer
Average Family Size in East Spencer is 2.4 People.
What is the Average Household Size in East Spencer
Average Household Size in East Spencer is 1.9 People.
How Large is the Labor Force in East Spencer?
There are 435 People in the Labor Forcein in East Spencer.
What is the Percentage of People in the Labor Force in East Spencer?
40.1% of People are in the Labor Force in East Spencer.
What is the Unemployment Rate in East Spencer?
Unemployment Rate in East Spencer is 8.0%.