Laurel Hill, NC Map & Demographics
Laurel Hill Map
Laurel Hill Overview
$13,985
PER CAPITA INCOME
$28,361
AVG FAMILY INCOME
$23,086
AVG HOUSEHOLD INCOME
21.3%
WAGE / INCOME GAP [ % ]
78.7¢/ $1
WAGE / INCOME GAP [ $ ]
0.45
INEQUALITY / GINI INDEX
869
TOTAL POPULATION
294
MALE POPULATION
575
FEMALE POPULATION
51.13
MALES / 100 FEMALES
195.58
FEMALES / 100 MALES
40.6
MEDIAN AGE
3.1
AVG FAMILY SIZE
2.4
AVG HOUSEHOLD SIZE
279
LABOR FORCE [ PEOPLE ]
42.7%
PERCENT IN LABOR FORCE
17.9%
UNEMPLOYMENT RATE
Laurel Hill Zip Codes
Laurel Hill Area Codes
Income in Laurel Hill
Income Overview in Laurel Hill
Per Capita Income in Laurel Hill is $13,985, while median incomes of families and households are $28,361 and $23,086 respectively.
| Characteristic | Number | Measure |
| Per Capita Income | 869 | $13,985 |
| Median Family Income | 233 | $28,361 |
| Mean Family Income | 233 | $41,307 |
| Median Household Income | 369 | $23,086 |
| Mean Household Income | 369 | $31,314 |
| Income Deficit | 233 | $0 |
| Wage / Income Gap (%) | 869 | 21.29% |
| Wage / Income Gap ($) | 869 | 78.71¢ per $1 |
| Gini / Inequality Index | 869 | 0.45 |
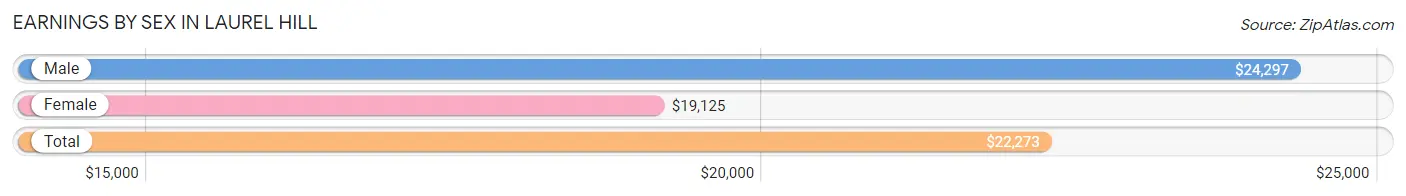
Earnings by Sex in Laurel Hill
Average Earnings in Laurel Hill are $22,273, $24,297 for men and $19,125 for women, a difference of 21.3%.
| Sex | Number | Average Earnings |
| Male | 109 (42.6%) | $24,297 |
| Female | 147 (57.4%) | $19,125 |
| Total | 256 (100.0%) | $22,273 |
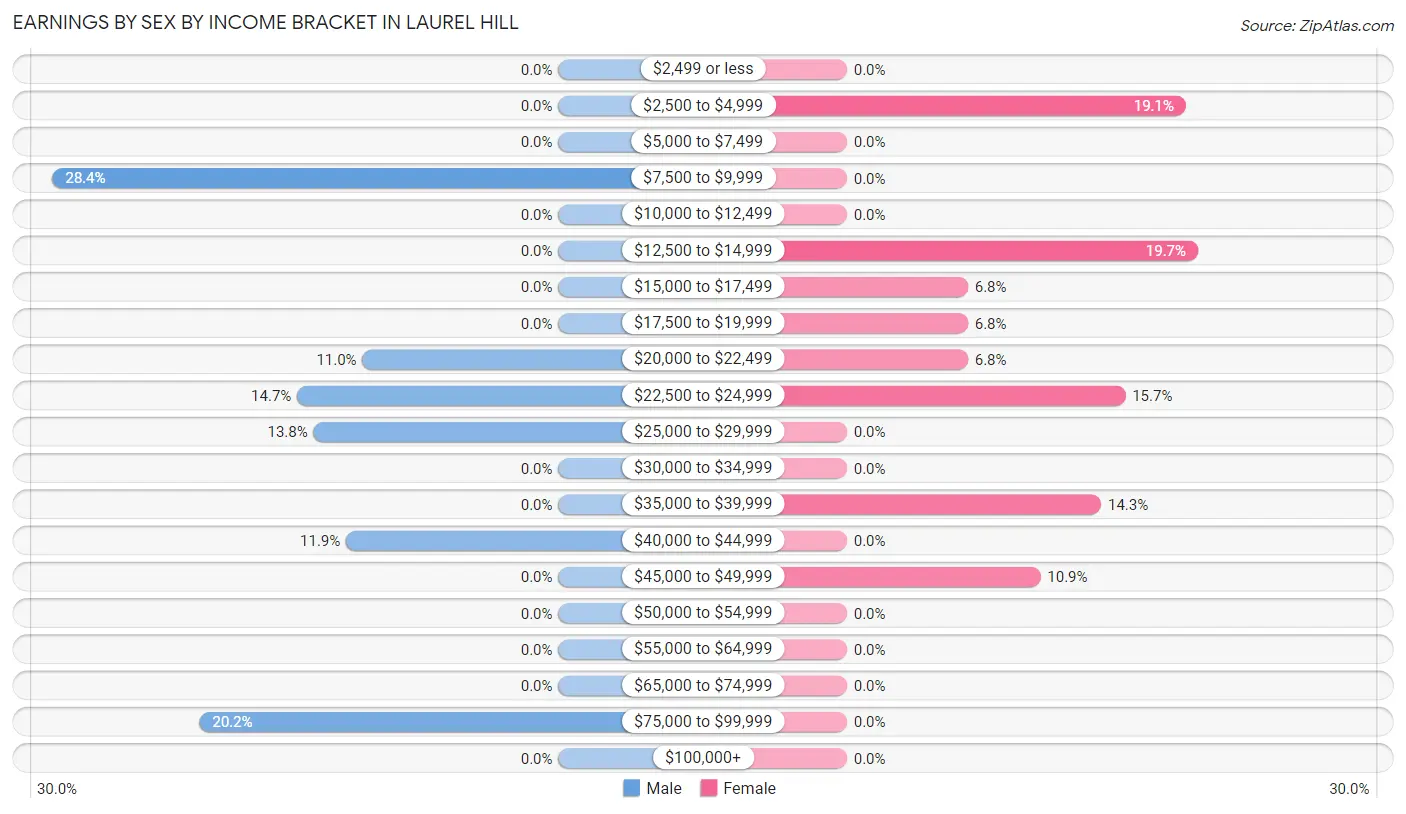
Earnings by Sex by Income Bracket in Laurel Hill
The most common earnings brackets in Laurel Hill are $7,500 to $9,999 for men (31 | 28.4%) and $12,500 to $14,999 for women (29 | 19.7%).
| Income | Male | Female |
| $2,499 or less | 0 (0.0%) | 0 (0.0%) |
| $2,500 to $4,999 | 0 (0.0%) | 28 (19.1%) |
| $5,000 to $7,499 | 0 (0.0%) | 0 (0.0%) |
| $7,500 to $9,999 | 31 (28.4%) | 0 (0.0%) |
| $10,000 to $12,499 | 0 (0.0%) | 0 (0.0%) |
| $12,500 to $14,999 | 0 (0.0%) | 29 (19.7%) |
| $15,000 to $17,499 | 0 (0.0%) | 10 (6.8%) |
| $17,500 to $19,999 | 0 (0.0%) | 10 (6.8%) |
| $20,000 to $22,499 | 12 (11.0%) | 10 (6.8%) |
| $22,500 to $24,999 | 16 (14.7%) | 23 (15.7%) |
| $25,000 to $29,999 | 15 (13.8%) | 0 (0.0%) |
| $30,000 to $34,999 | 0 (0.0%) | 0 (0.0%) |
| $35,000 to $39,999 | 0 (0.0%) | 21 (14.3%) |
| $40,000 to $44,999 | 13 (11.9%) | 0 (0.0%) |
| $45,000 to $49,999 | 0 (0.0%) | 16 (10.9%) |
| $50,000 to $54,999 | 0 (0.0%) | 0 (0.0%) |
| $55,000 to $64,999 | 0 (0.0%) | 0 (0.0%) |
| $65,000 to $74,999 | 0 (0.0%) | 0 (0.0%) |
| $75,000 to $99,999 | 22 (20.2%) | 0 (0.0%) |
| $100,000+ | 0 (0.0%) | 0 (0.0%) |
| Total | 109 (100.0%) | 147 (100.0%) |
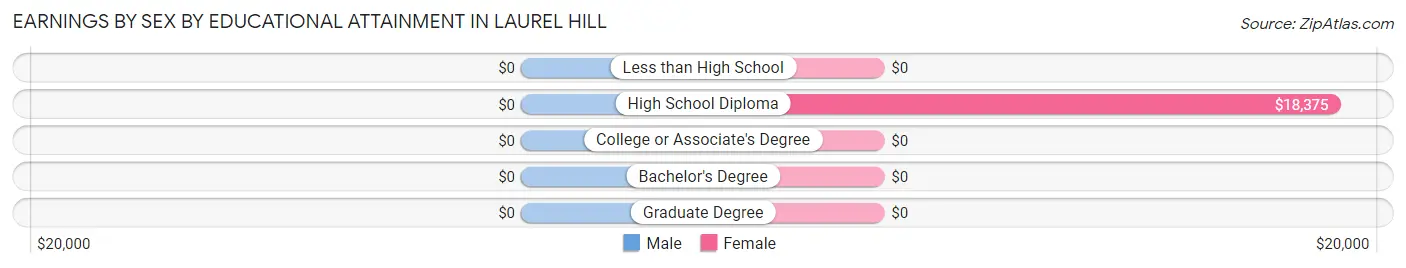
Earnings by Sex by Educational Attainment in Laurel Hill
| Educational Attainment | Male Income | Female Income |
| Less than High School | - | - |
| High School Diploma | - | - |
| College or Associate's Degree | - | - |
| Bachelor's Degree | - | - |
| Graduate Degree | - | - |
| Total | $29,333 | $17,625 |
Family Income in Laurel Hill
Family Income Brackets in Laurel Hill
According to the Laurel Hill family income data, there are 65 families falling into the $25,000 to $34,999 income range, which is the most common income bracket and makes up 27.9% of all families.
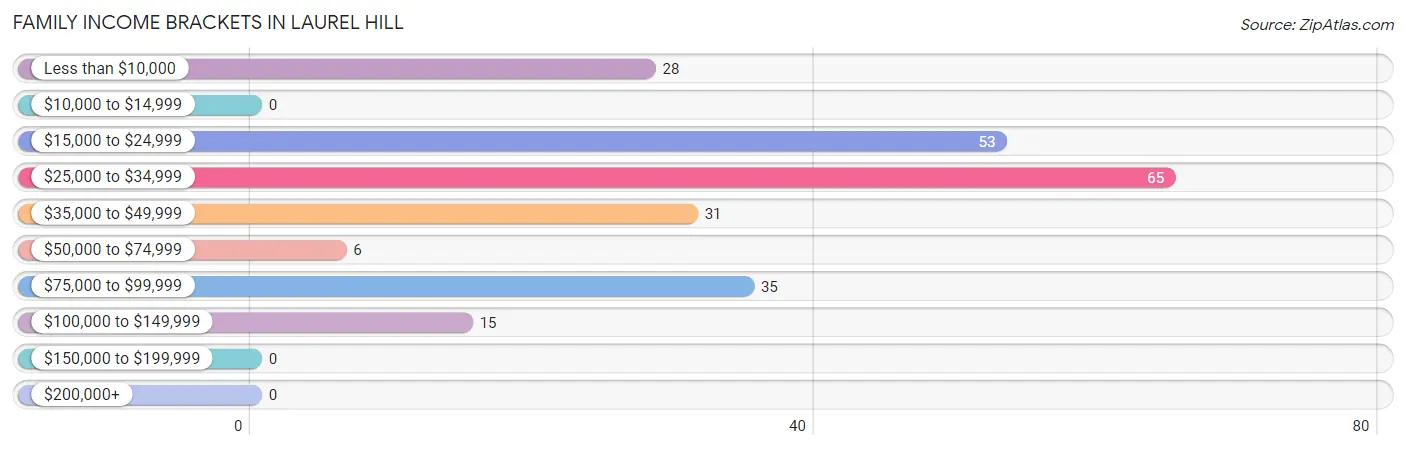
| Income Bracket | # Families | % Families |
| Less than $10,000 | 28 | 12.0% |
| $10,000 to $14,999 | 0 | 0.0% |
| $15,000 to $24,999 | 53 | 22.7% |
| $25,000 to $34,999 | 65 | 27.9% |
| $35,000 to $49,999 | 31 | 13.3% |
| $50,000 to $74,999 | 6 | 2.6% |
| $75,000 to $99,999 | 35 | 15.0% |
| $100,000 to $149,999 | 15 | 6.4% |
| $150,000 to $199,999 | 0 | 0.0% |
| $200,000+ | 0 | 0.0% |
Family Income by Famaliy Size in Laurel Hill
2-person families (104 | 44.6%) account for the highest median family income in Laurel Hill with $28,750 per family, while 2-person families (104 | 44.6%) have the highest median income of $14,375 per family member.
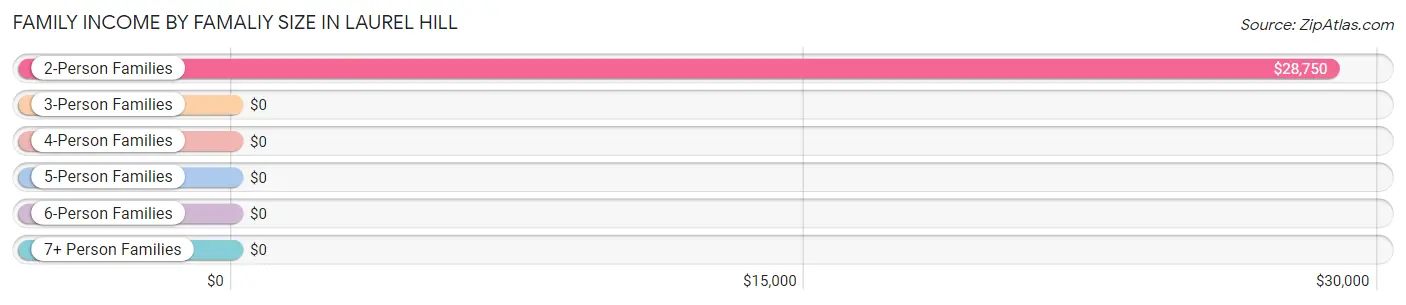
| Income Bracket | # Families | Median Income |
| 2-Person Families | 104 (44.6%) | $28,750 |
| 3-Person Families | 92 (39.5%) | $0 |
| 4-Person Families | 37 (15.9%) | $0 |
| 5-Person Families | 0 (0.0%) | $0 |
| 6-Person Families | 0 (0.0%) | $0 |
| 7+ Person Families | 0 (0.0%) | $0 |
| Total | 233 (100.0%) | $28,361 |
Family Income by Number of Earners in Laurel Hill
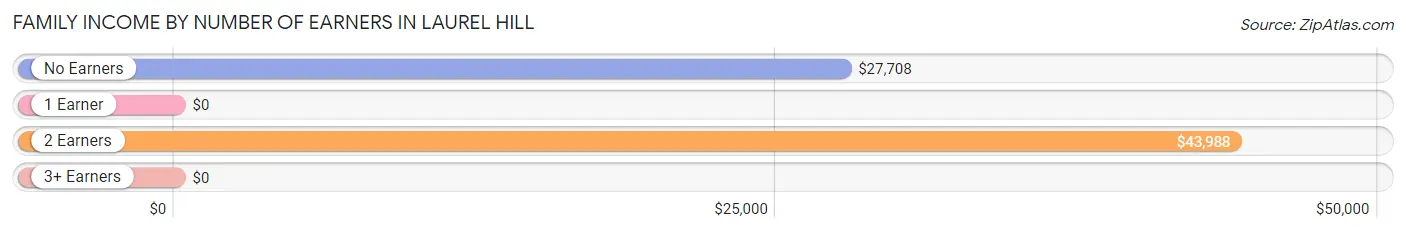
| Number of Earners | # Families | Median Income |
| No Earners | 67 (28.8%) | $27,708 |
| 1 Earner | 121 (51.9%) | $0 |
| 2 Earners | 45 (19.3%) | $43,988 |
| 3+ Earners | 0 (0.0%) | $0 |
| Total | 233 (100.0%) | $28,361 |
Household Income in Laurel Hill
Household Income Brackets in Laurel Hill
With 85 households falling in the category, the $10,000 to $14,999 income range is the most frequent in Laurel Hill, accounting for 23.0% of all households.
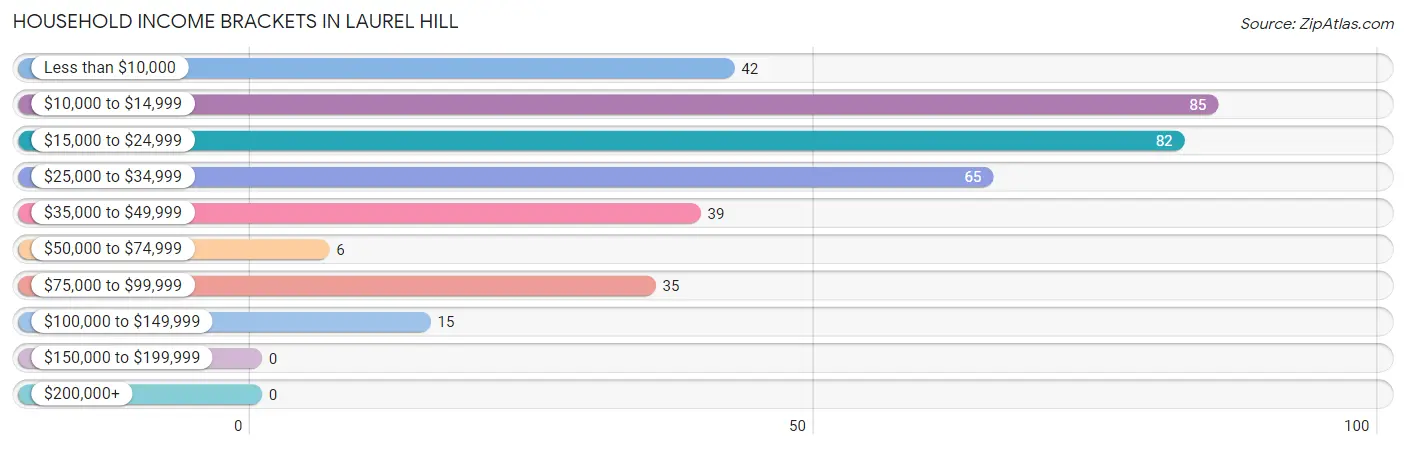
| Income Bracket | # Households | % Households |
| Less than $10,000 | 42 | 11.4% |
| $10,000 to $14,999 | 85 | 23.0% |
| $15,000 to $24,999 | 82 | 22.2% |
| $25,000 to $34,999 | 65 | 17.6% |
| $35,000 to $49,999 | 39 | 10.6% |
| $50,000 to $74,999 | 6 | 1.6% |
| $75,000 to $99,999 | 35 | 9.5% |
| $100,000 to $149,999 | 15 | 4.1% |
| $150,000 to $199,999 | 0 | 0.0% |
| $200,000+ | 0 | 0.0% |
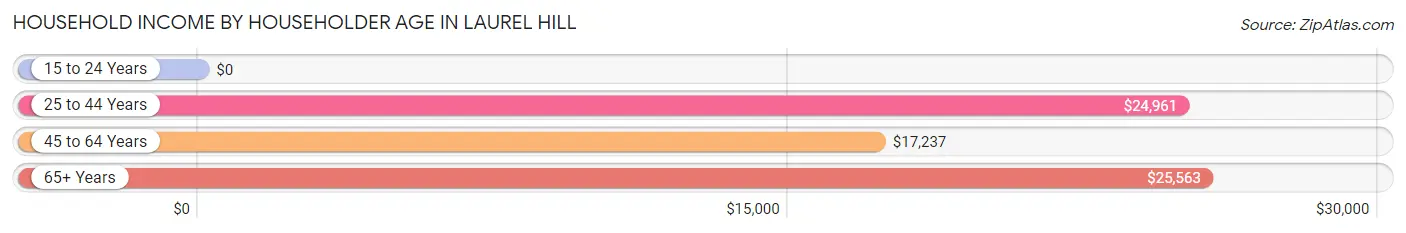
Household Income by Householder Age in Laurel Hill
The median household income in Laurel Hill is $23,086, with the highest median household income of $25,563 found in the 65+ years age bracket for the primary householder. A total of 83 households (22.5%) fall into this category. Meanwhile, the 15 to 24 years age bracket for the primary householder has the lowest median household income of $0, with 11 households (3.0%) in this group.
| Income Bracket | # Households | Median Income |
| 15 to 24 Years | 11 (3.0%) | $0 |
| 25 to 44 Years | 117 (31.7%) | $24,961 |
| 45 to 64 Years | 158 (42.8%) | $17,237 |
| 65+ Years | 83 (22.5%) | $25,563 |
| Total | 369 (100.0%) | $23,086 |
Poverty in Laurel Hill
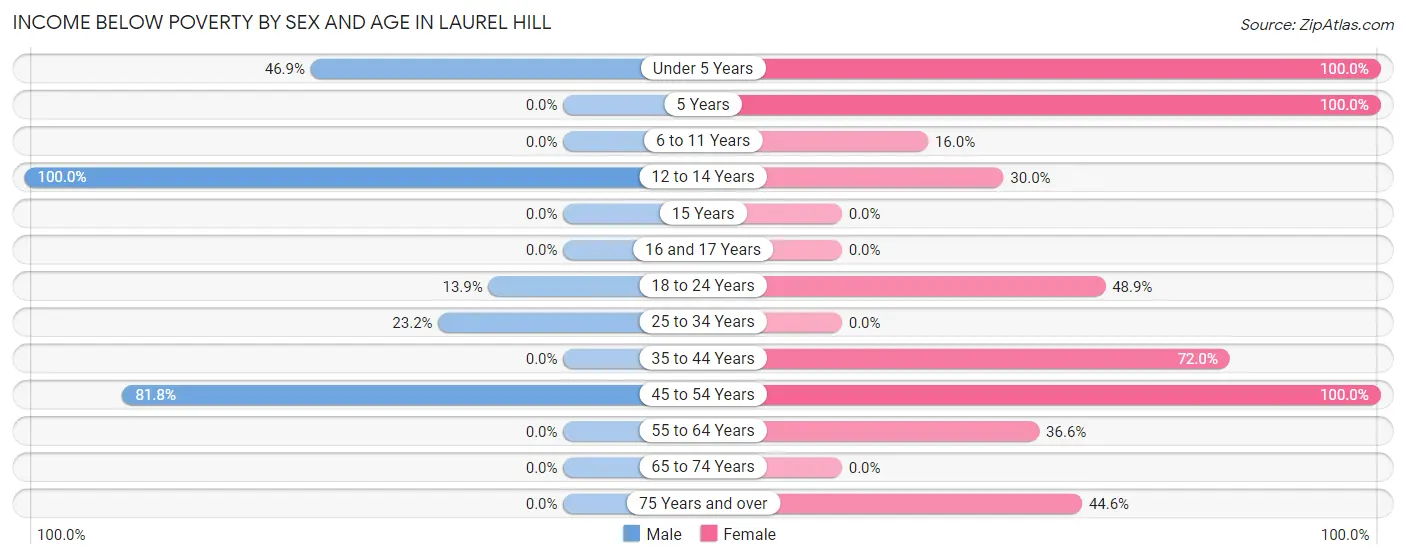
Income Below Poverty by Sex and Age in Laurel Hill
With 32.0% poverty level for males and 37.6% for females among the residents of Laurel Hill, 12 to 14 year old males and under 5 year old females are the most vulnerable to poverty, with 22 males (100.0%) and 11 females (100.0%) in their respective age groups living below the poverty level.
| Age Bracket | Male | Female |
| Under 5 Years | 15 (46.9%) | 11 (100.0%) |
| 5 Years | 0 (0.0%) | 12 (100.0%) |
| 6 to 11 Years | 0 (0.0%) | 12 (16.0%) |
| 12 to 14 Years | 22 (100.0%) | 12 (30.0%) |
| 15 Years | 0 (0.0%) | 0 (0.0%) |
| 16 and 17 Years | 0 (0.0%) | 0 (0.0%) |
| 18 to 24 Years | 5 (13.9%) | 22 (48.9%) |
| 25 to 34 Years | 16 (23.2%) | 0 (0.0%) |
| 35 to 44 Years | 0 (0.0%) | 54 (72.0%) |
| 45 to 54 Years | 36 (81.8%) | 19 (100.0%) |
| 55 to 64 Years | 0 (0.0%) | 37 (36.6%) |
| 65 to 74 Years | 0 (0.0%) | 0 (0.0%) |
| 75 Years and over | 0 (0.0%) | 37 (44.6%) |
| Total | 94 (32.0%) | 216 (37.6%) |
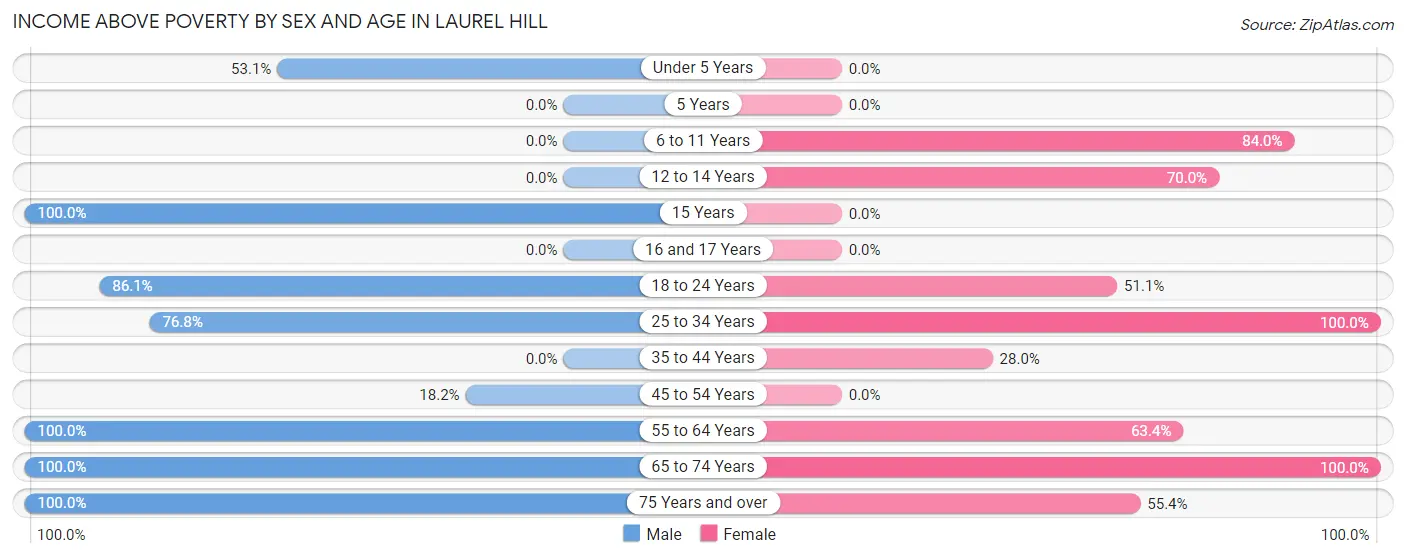
Income Above Poverty by Sex and Age in Laurel Hill
According to the poverty statistics in Laurel Hill, males aged 15 years and females aged 25 to 34 years are the age groups that are most secure financially, with 100.0% of males and 100.0% of females in these age groups living above the poverty line.
| Age Bracket | Male | Female |
| Under 5 Years | 17 (53.1%) | 0 (0.0%) |
| 5 Years | 0 (0.0%) | 0 (0.0%) |
| 6 to 11 Years | 0 (0.0%) | 63 (84.0%) |
| 12 to 14 Years | 0 (0.0%) | 28 (70.0%) |
| 15 Years | 24 (100.0%) | 0 (0.0%) |
| 16 and 17 Years | 0 (0.0%) | 0 (0.0%) |
| 18 to 24 Years | 31 (86.1%) | 23 (51.1%) |
| 25 to 34 Years | 53 (76.8%) | 37 (100.0%) |
| 35 to 44 Years | 0 (0.0%) | 21 (28.0%) |
| 45 to 54 Years | 8 (18.2%) | 0 (0.0%) |
| 55 to 64 Years | 27 (100.0%) | 64 (63.4%) |
| 65 to 74 Years | 25 (100.0%) | 77 (100.0%) |
| 75 Years and over | 15 (100.0%) | 46 (55.4%) |
| Total | 200 (68.0%) | 359 (62.4%) |
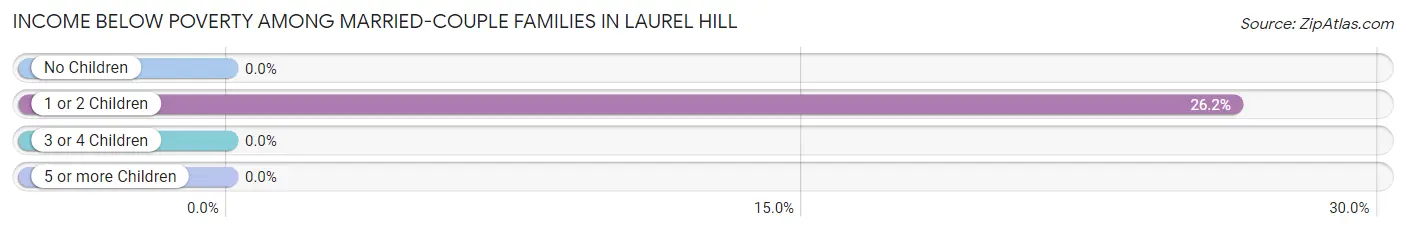
Income Below Poverty Among Married-Couple Families in Laurel Hill
The poverty statistics for married-couple families in Laurel Hill show that 11.4% or 16 of the total 141 families live below the poverty line. Families with 1 or 2 children have the highest poverty rate of 26.2%, comprising of 16 families. On the other hand, families with no children have the lowest poverty rate of 0.0%, which includes 0 families.
| Children | Above Poverty | Below Poverty |
| No Children | 80 (100.0%) | 0 (0.0%) |
| 1 or 2 Children | 45 (73.8%) | 16 (26.2%) |
| 3 or 4 Children | 0 (0.0%) | 0 (0.0%) |
| 5 or more Children | 0 (0.0%) | 0 (0.0%) |
| Total | 125 (88.6%) | 16 (11.4%) |
Income Below Poverty Among Single-Parent Households in Laurel Hill
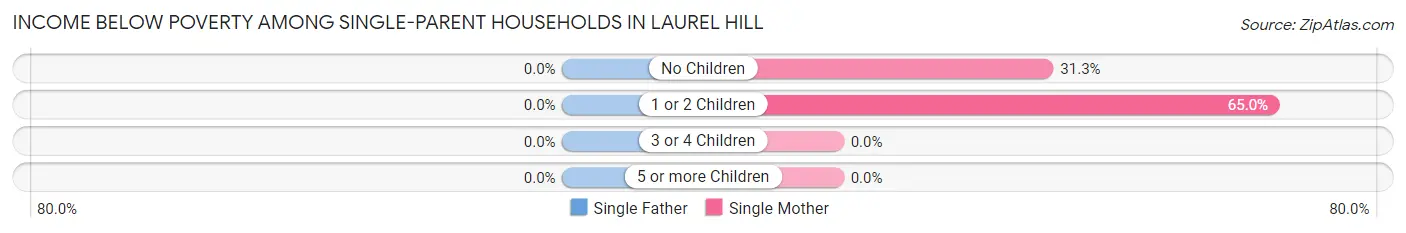
| Children | Single Father | Single Mother |
| No Children | 0 (0.0%) | 10 (31.2%) |
| 1 or 2 Children | 0 (0.0%) | 39 (65.0%) |
| 3 or 4 Children | 0 (0.0%) | 0 (0.0%) |
| 5 or more Children | 0 (0.0%) | 0 (0.0%) |
| Total | 0 (0.0%) | 49 (53.3%) |
Income Below Poverty Among Married-Couple vs Single-Parent Households in Laurel Hill
The poverty data for Laurel Hill shows that 16 of the married-couple family households (11.4%) and 49 of the single-parent households (53.3%) are living below the poverty level. Within the married-couple family households, those with 1 or 2 children have the highest poverty rate, with 16 households (26.2%) falling below the poverty line. Among the single-parent households, those with 1 or 2 children have the highest poverty rate, with 39 household (65.0%) living below poverty.
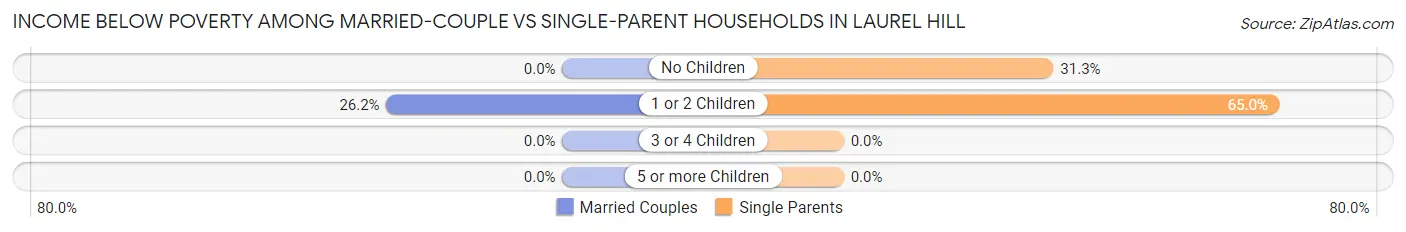
| Children | Married-Couple Families | Single-Parent Households |
| No Children | 0 (0.0%) | 10 (31.2%) |
| 1 or 2 Children | 16 (26.2%) | 39 (65.0%) |
| 3 or 4 Children | 0 (0.0%) | 0 (0.0%) |
| 5 or more Children | 0 (0.0%) | 0 (0.0%) |
| Total | 16 (11.4%) | 49 (53.3%) |
Race in Laurel Hill
The most populous races in Laurel Hill are White / Caucasian (403 | 46.4%), Black / African American (236 | 27.2%), and Native / Alaskan (185 | 21.3%).
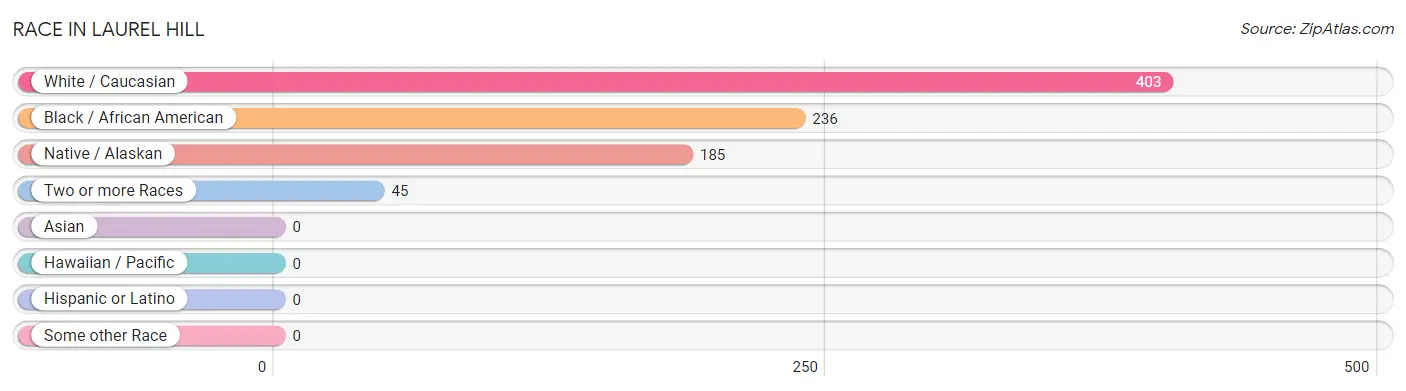
| Race | # Population | % Population |
| Asian | 0 | 0.0% |
| Black / African American | 236 | 27.2% |
| Hawaiian / Pacific | 0 | 0.0% |
| Hispanic or Latino | 0 | 0.0% |
| Native / Alaskan | 185 | 21.3% |
| White / Caucasian | 403 | 46.4% |
| Two or more Races | 45 | 5.2% |
| Some other Race | 0 | 0.0% |
| Total | 869 | 100.0% |
Ancestry in Laurel Hill
The most populous ancestries reported in Laurel Hill are Lumbee (127 | 14.6%), European (49 | 5.6%), American (35 | 4.0%), French (18 | 2.1%), and Scottish (18 | 2.1%), together accounting for 28.4% of all Laurel Hill residents.
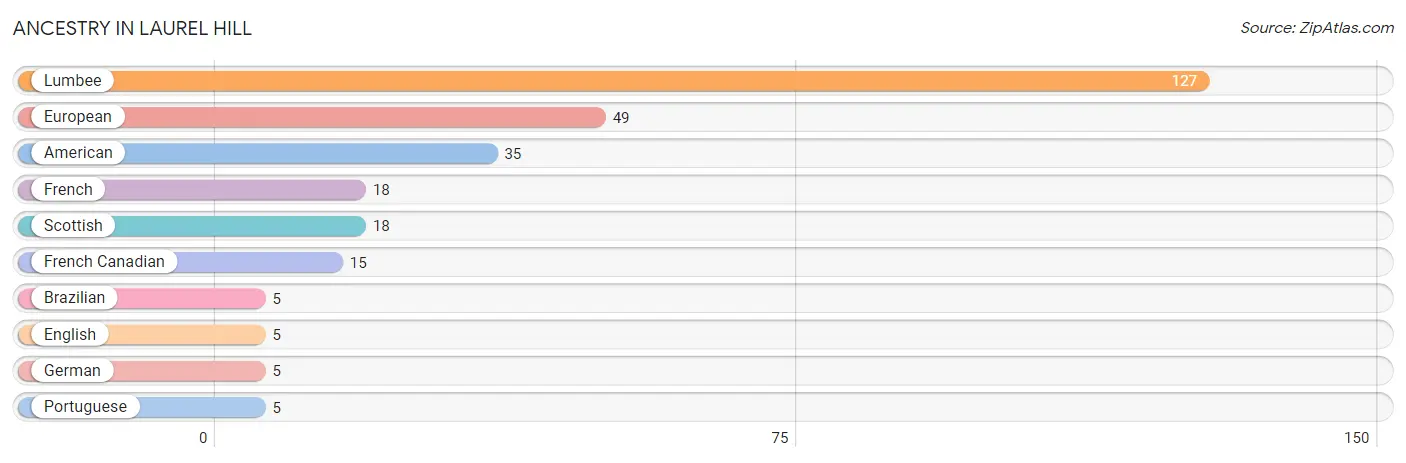
| Ancestry | # Population | % Population |
| American | 35 | 4.0% |
| Brazilian | 5 | 0.6% |
| English | 5 | 0.6% |
| European | 49 | 5.6% |
| French | 18 | 2.1% |
| French Canadian | 15 | 1.7% |
| German | 5 | 0.6% |
| Lumbee | 127 | 14.6% |
| Portuguese | 5 | 0.6% |
| Scottish | 18 | 2.1% | View All 10 Rows |
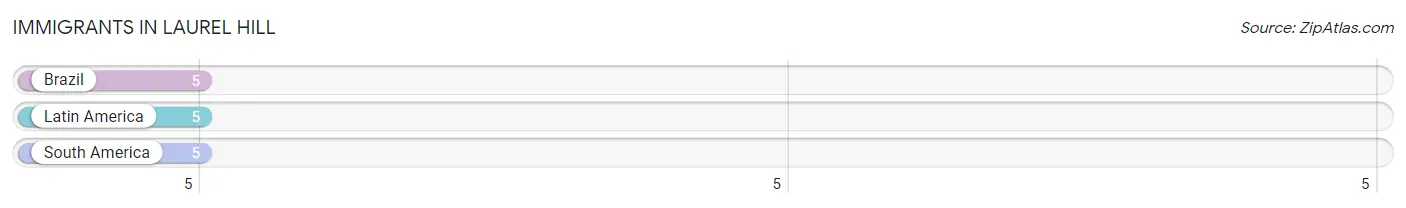
Immigrants in Laurel Hill
The most numerous immigrant groups reported in Laurel Hill came from Brazil (5 | 0.6%), Latin America (5 | 0.6%), and South America (5 | 0.6%), together accounting for 1.7% of all Laurel Hill residents.
| Immigration Origin | # Population | % Population |
| Brazil | 5 | 0.6% |
| Latin America | 5 | 0.6% |
| South America | 5 | 0.6% | View All 3 Rows |
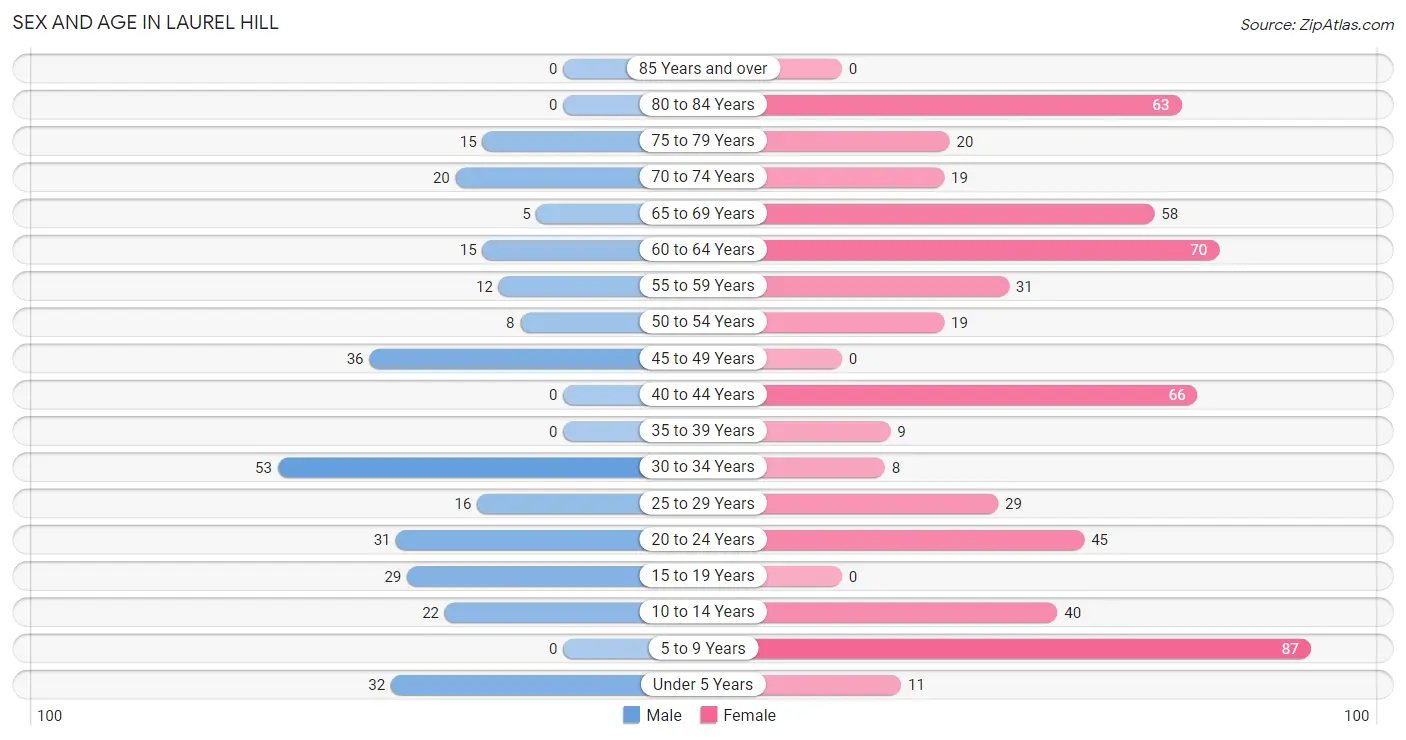
Sex and Age in Laurel Hill
Sex and Age in Laurel Hill
The most populous age groups in Laurel Hill are 30 to 34 Years (53 | 18.0%) for men and 5 to 9 Years (87 | 15.1%) for women.
| Age Bracket | Male | Female |
| Under 5 Years | 32 (10.9%) | 11 (1.9%) |
| 5 to 9 Years | 0 (0.0%) | 87 (15.1%) |
| 10 to 14 Years | 22 (7.5%) | 40 (7.0%) |
| 15 to 19 Years | 29 (9.9%) | 0 (0.0%) |
| 20 to 24 Years | 31 (10.5%) | 45 (7.8%) |
| 25 to 29 Years | 16 (5.4%) | 29 (5.0%) |
| 30 to 34 Years | 53 (18.0%) | 8 (1.4%) |
| 35 to 39 Years | 0 (0.0%) | 9 (1.6%) |
| 40 to 44 Years | 0 (0.0%) | 66 (11.5%) |
| 45 to 49 Years | 36 (12.2%) | 0 (0.0%) |
| 50 to 54 Years | 8 (2.7%) | 19 (3.3%) |
| 55 to 59 Years | 12 (4.1%) | 31 (5.4%) |
| 60 to 64 Years | 15 (5.1%) | 70 (12.2%) |
| 65 to 69 Years | 5 (1.7%) | 58 (10.1%) |
| 70 to 74 Years | 20 (6.8%) | 19 (3.3%) |
| 75 to 79 Years | 15 (5.1%) | 20 (3.5%) |
| 80 to 84 Years | 0 (0.0%) | 63 (11.0%) |
| 85 Years and over | 0 (0.0%) | 0 (0.0%) |
| Total | 294 (100.0%) | 575 (100.0%) |
Families and Households in Laurel Hill
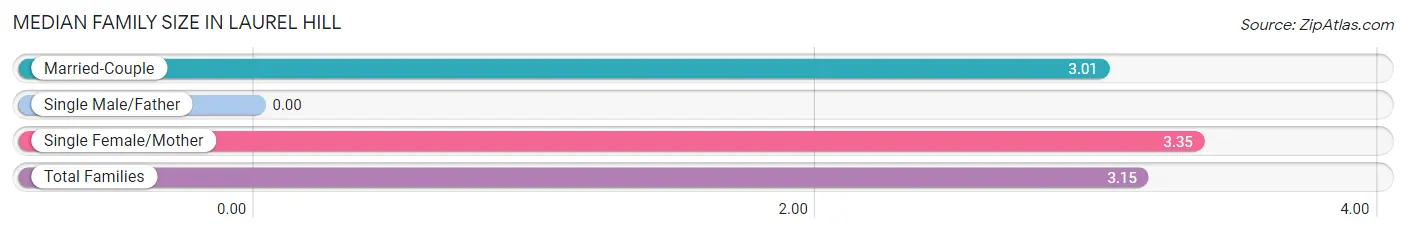
Median Family Size in Laurel Hill
| Family Type | # Families | Family Size |
| Married-Couple | 141 (60.5%) | 3.01 |
| Single Male/Father | 0 (0.0%) | - |
| Single Female/Mother | 92 (39.5%) | 3.35 |
| Total Families | 233 (100.0%) | 3.15 |
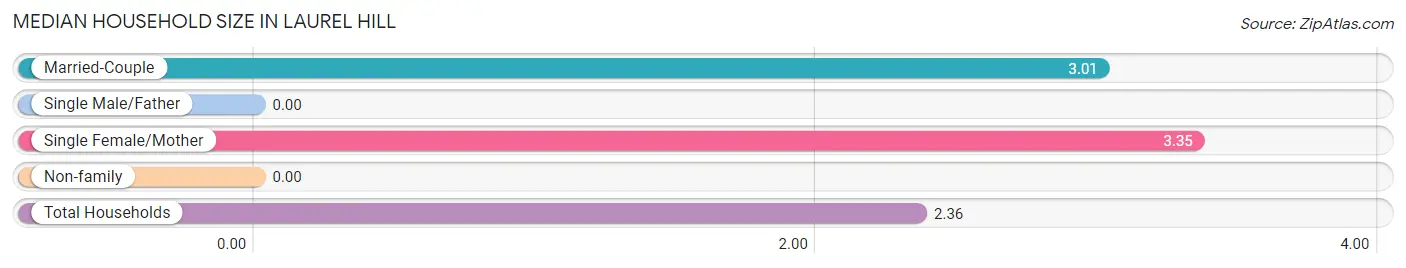
Median Household Size in Laurel Hill
| Household Type | # Households | Household Size |
| Married-Couple | 141 (38.2%) | 3.01 |
| Single Male/Father | 0 (0.0%) | - |
| Single Female/Mother | 92 (24.9%) | 3.35 |
| Non-family | 136 (36.9%) | - |
| Total Households | 369 (100.0%) | 2.36 |
Household Size by Marriage Status in Laurel Hill
Out of a total of 369 households in Laurel Hill, 233 (63.1%) are family households, while 136 (36.9%) are nonfamily households. The most numerous type of family households are 2-person households, comprising 104, and the most common type of nonfamily households are 1-person households, comprising 136.
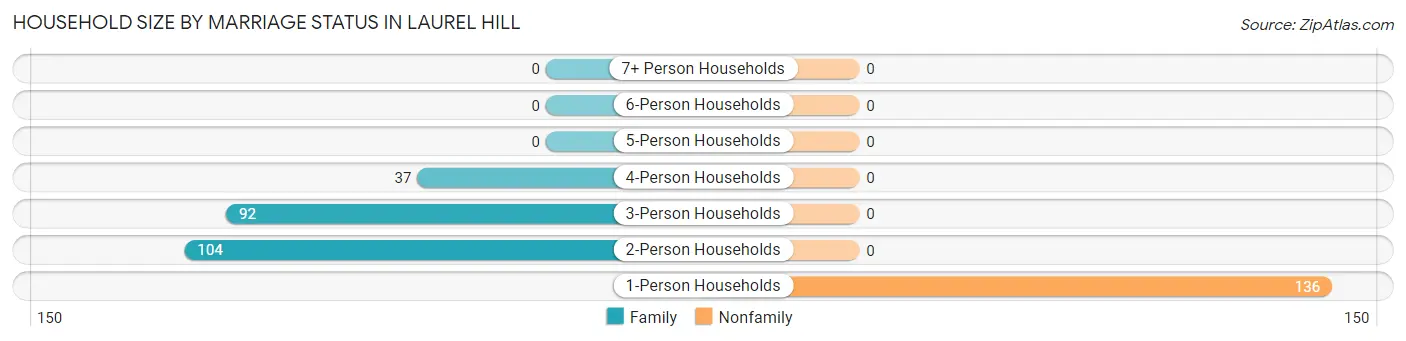
| Household Size | Family Households | Nonfamily Households |
| 1-Person Households | - | 136 (36.9%) |
| 2-Person Households | 104 (28.2%) | 0 (0.0%) |
| 3-Person Households | 92 (24.9%) | 0 (0.0%) |
| 4-Person Households | 37 (10.0%) | 0 (0.0%) |
| 5-Person Households | 0 (0.0%) | 0 (0.0%) |
| 6-Person Households | 0 (0.0%) | 0 (0.0%) |
| 7+ Person Households | 0 (0.0%) | 0 (0.0%) |
| Total | 233 (63.1%) | 136 (36.9%) |
Female Fertility in Laurel Hill
Fertility by Age in Laurel Hill
| Age Bracket | Women with Births | Births / 1,000 Women |
| 15 to 19 years | 0 (0.0%) | 0.0 |
| 20 to 34 years | 0 (0.0%) | 0.0 |
| 35 to 50 years | 0 (0.0%) | 0.0 |
| Total | 0 (0.0%) | 0.0 |
Fertility by Age by Marriage Status in Laurel Hill
| Age Bracket | Married | Unmarried |
| 15 to 19 years | 0 (0.0%) | 0 (0.0%) |
| 20 to 34 years | 0 (0.0%) | 0 (0.0%) |
| 35 to 50 years | 0 (0.0%) | 0 (0.0%) |
| Total | 0 (0.0%) | 0 (0.0%) |
Fertility by Education in Laurel Hill
| Educational Attainment | Women with Births | Births / 1,000 Women |
| Less than High School | 0 (0.0%) | 0.0 |
| High School Diploma | 0 (0.0%) | 0.0 |
| College or Associate's Degree | 0 (0.0%) | 0.0 |
| Bachelor's Degree | 0 (0.0%) | 0.0 |
| Graduate Degree | 0 (0.0%) | 0.0 |
| Total | 0 (0.0%) | 0.0 |
Fertility by Education by Marriage Status in Laurel Hill
| Educational Attainment | Married | Unmarried |
| Less than High School | 0 (0.0%) | 0 (0.0%) |
| High School Diploma | 0 (0.0%) | 0 (0.0%) |
| College or Associate's Degree | 0 (0.0%) | 0 (0.0%) |
| Bachelor's Degree | 0 (0.0%) | 0 (0.0%) |
| Graduate Degree | 0 (0.0%) | 0 (0.0%) |
| Total | 0 (0.0%) | 0 (0.0%) |
Employment Characteristics in Laurel Hill
Employment by Class of Employer in Laurel Hill
Among the 229 employed individuals in Laurel Hill, private company employees (124 | 54.1%), not-for-profit organizations (34 | 14.8%), and local government employees (31 | 13.5%) make up the most common classes of employment.
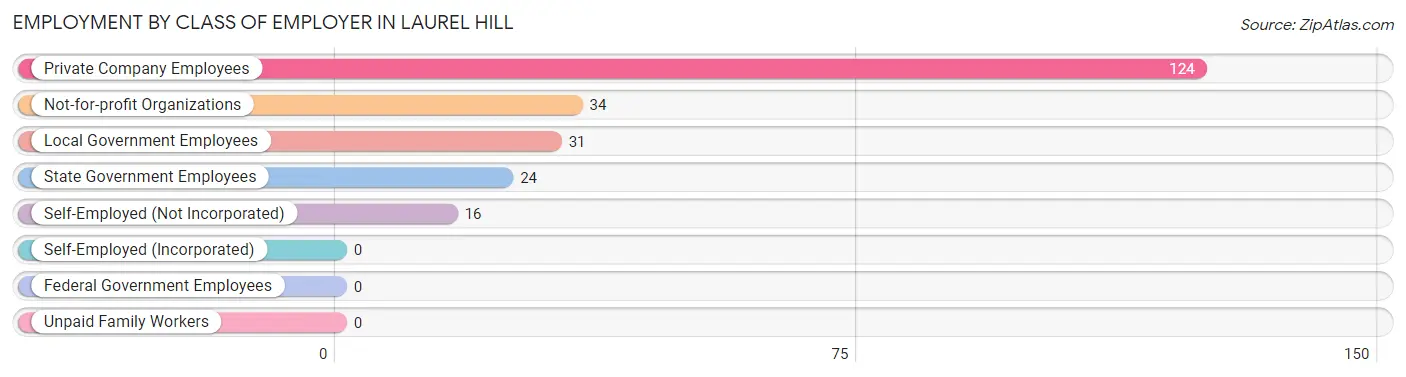
| Employer Class | # Employees | % Employees |
| Private Company Employees | 124 | 54.1% |
| Self-Employed (Incorporated) | 0 | 0.0% |
| Self-Employed (Not Incorporated) | 16 | 7.0% |
| Not-for-profit Organizations | 34 | 14.8% |
| Local Government Employees | 31 | 13.5% |
| State Government Employees | 24 | 10.5% |
| Federal Government Employees | 0 | 0.0% |
| Unpaid Family Workers | 0 | 0.0% |
| Total | 229 | 100.0% |
Employment Status by Age in Laurel Hill
According to the labor force statistics for Laurel Hill, out of the total population over 16 years of age (653), 42.7% or 279 individuals are in the labor force, with 17.9% or 50 of them unemployed. The age group with the highest labor force participation rate is 16 to 19 years, with 100.0% or 5 individuals in the labor force. Within the labor force, the 16 to 19 years age range has the highest percentage of unemployed individuals, with 100.0% or 5 of them being unemployed.
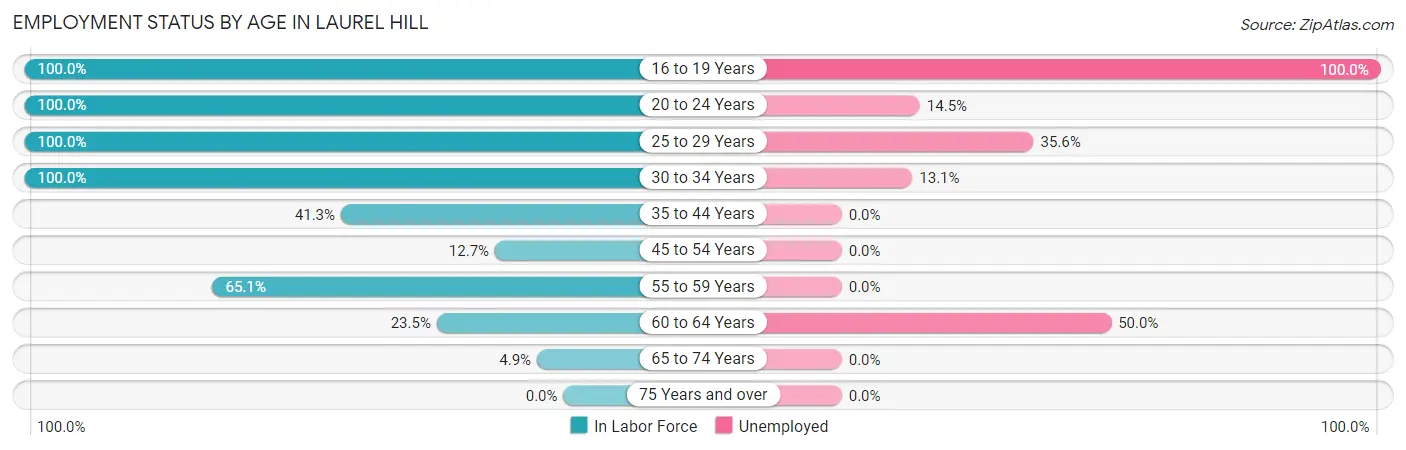
| Age Bracket | In Labor Force | Unemployed |
| 16 to 19 Years | 5 (100.0%) | 5 (100.0%) |
| 20 to 24 Years | 76 (100.0%) | 11 (14.5%) |
| 25 to 29 Years | 45 (100.0%) | 16 (35.6%) |
| 30 to 34 Years | 61 (100.0%) | 8 (13.1%) |
| 35 to 44 Years | 31 (41.3%) | 0 (0.0%) |
| 45 to 54 Years | 8 (12.7%) | 0 (0.0%) |
| 55 to 59 Years | 28 (65.1%) | 0 (0.0%) |
| 60 to 64 Years | 20 (23.5%) | 10 (50.0%) |
| 65 to 74 Years | 5 (4.9%) | 0 (0.0%) |
| 75 Years and over | 0 (0.0%) | 0 (0.0%) |
| Total | 279 (42.7%) | 50 (17.9%) |
Employment Status by Educational Attainment in Laurel Hill
According to labor force statistics for Laurel Hill, 51.9% of individuals (193) out of the total population between 25 and 64 years of age (372) are in the labor force, with 17.6% or 34 of them being unemployed. The group with the highest labor force participation rate are those with the educational attainment of bachelor's degree or higher, with 100.0% or 22 individuals in the labor force. Within the labor force, individuals with high school diploma education have the highest percentage of unemployment, with 28.0% or 26 of them being unemployed.
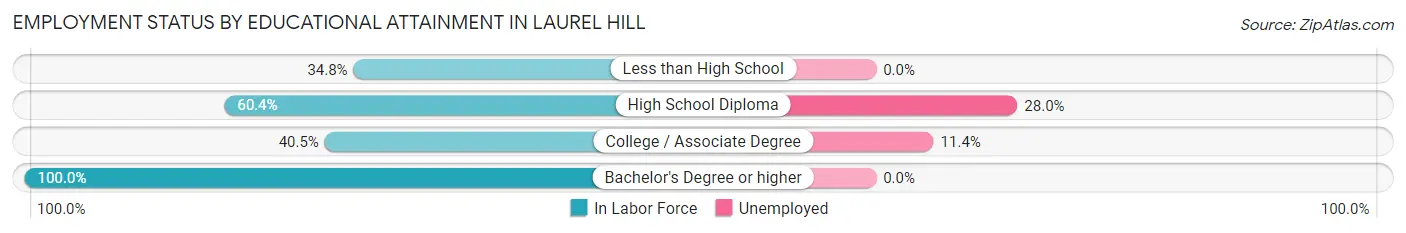
| Educational Attainment | In Labor Force | Unemployed |
| Less than High School | 8 (34.8%) | 0 (0.0%) |
| High School Diploma | 93 (60.4%) | 43 (28.0%) |
| College / Associate Degree | 70 (40.5%) | 20 (11.4%) |
| Bachelor's Degree or higher | 22 (100.0%) | 0 (0.0%) |
| Total | 193 (51.9%) | 65 (17.6%) |
Employment Occupations by Sex in Laurel Hill
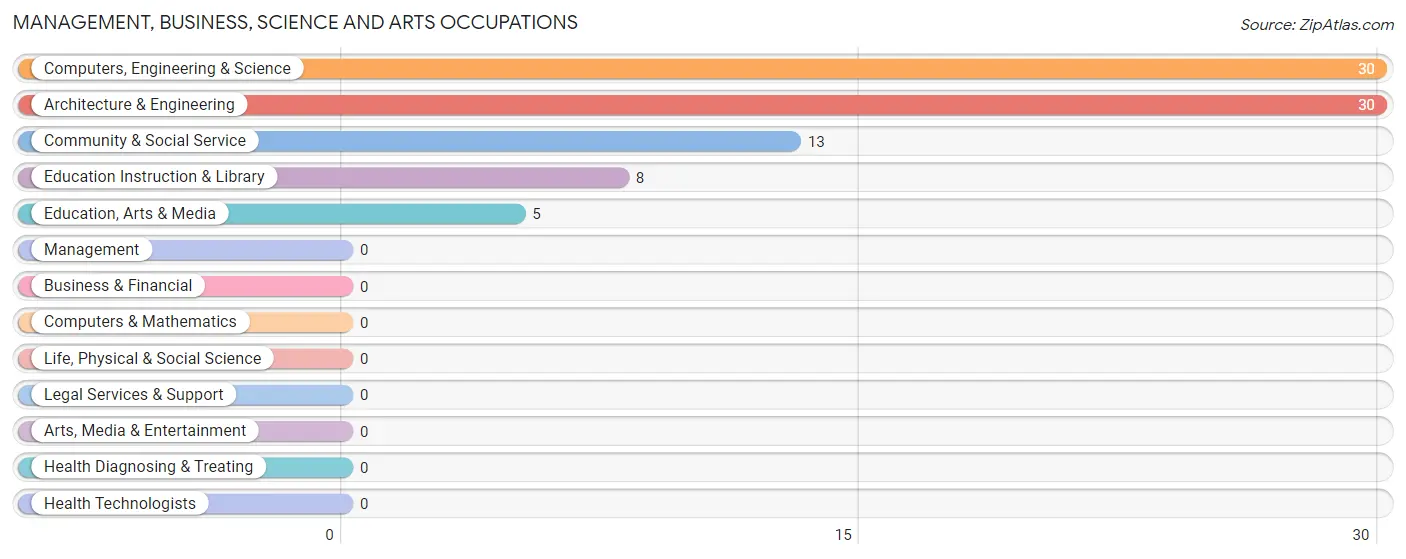
Management, Business, Science and Arts Occupations
The most common Management, Business, Science and Arts occupations in Laurel Hill are Computers, Engineering & Science (30 | 13.1%), Architecture & Engineering (30 | 13.1%), Community & Social Service (13 | 5.7%), Education Instruction & Library (8 | 3.5%), and Education, Arts & Media (5 | 2.2%).
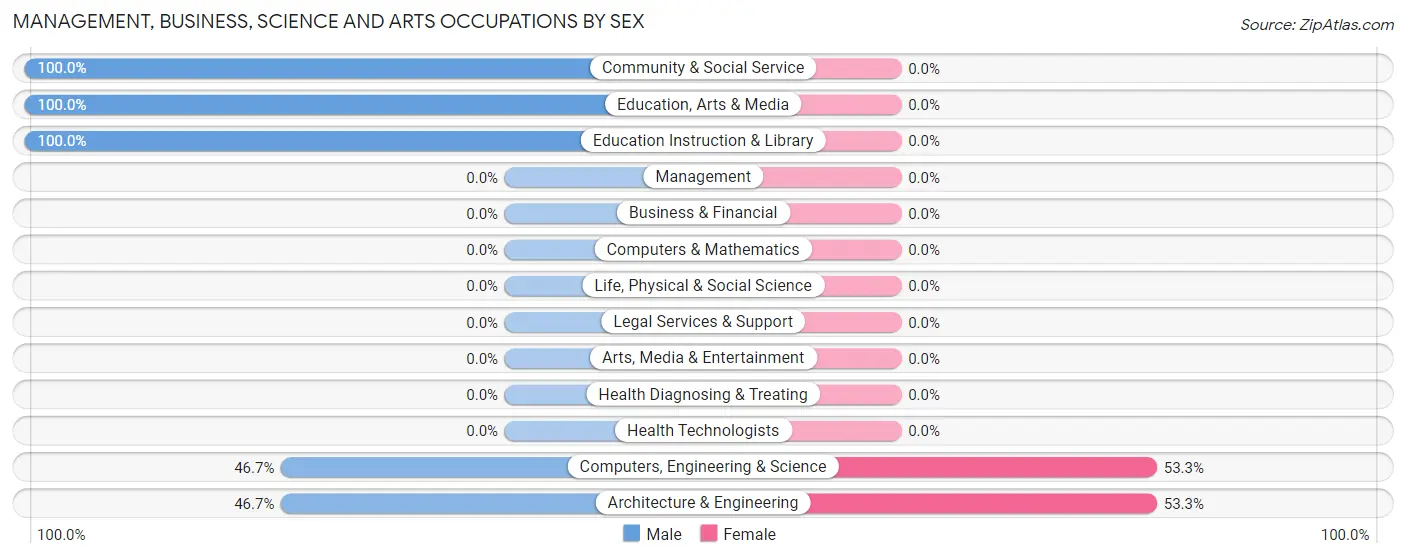
Management, Business, Science and Arts Occupations by Sex
Within the Management, Business, Science and Arts occupations in Laurel Hill, the most male-oriented occupations are Community & Social Service (100.0%), Education, Arts & Media (100.0%), and Education Instruction & Library (100.0%), while the most female-oriented occupations are Computers, Engineering & Science (53.3%), and Architecture & Engineering (53.3%).
| Occupation | Male | Female |
| Management | 0 (0.0%) | 0 (0.0%) |
| Business & Financial | 0 (0.0%) | 0 (0.0%) |
| Computers, Engineering & Science | 14 (46.7%) | 16 (53.3%) |
| Computers & Mathematics | 0 (0.0%) | 0 (0.0%) |
| Architecture & Engineering | 14 (46.7%) | 16 (53.3%) |
| Life, Physical & Social Science | 0 (0.0%) | 0 (0.0%) |
| Community & Social Service | 13 (100.0%) | 0 (0.0%) |
| Education, Arts & Media | 5 (100.0%) | 0 (0.0%) |
| Legal Services & Support | 0 (0.0%) | 0 (0.0%) |
| Education Instruction & Library | 8 (100.0%) | 0 (0.0%) |
| Arts, Media & Entertainment | 0 (0.0%) | 0 (0.0%) |
| Health Diagnosing & Treating | 0 (0.0%) | 0 (0.0%) |
| Health Technologists | 0 (0.0%) | 0 (0.0%) |
| Total (Category) | 27 (62.8%) | 16 (37.2%) |
| Total (Overall) | 109 (47.6%) | 120 (52.4%) |
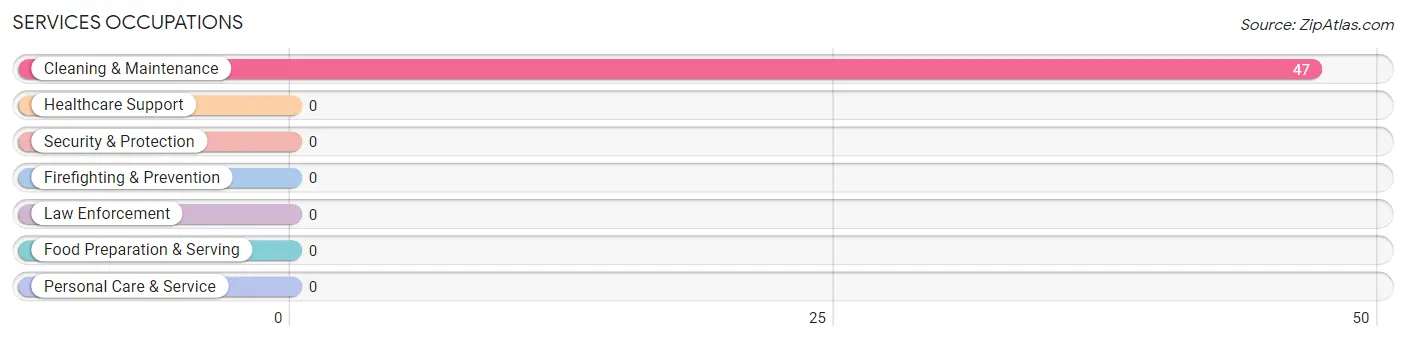
Services Occupations
The most common Services occupations in Laurel Hill are , and Cleaning & Maintenance (47 | 20.5%).
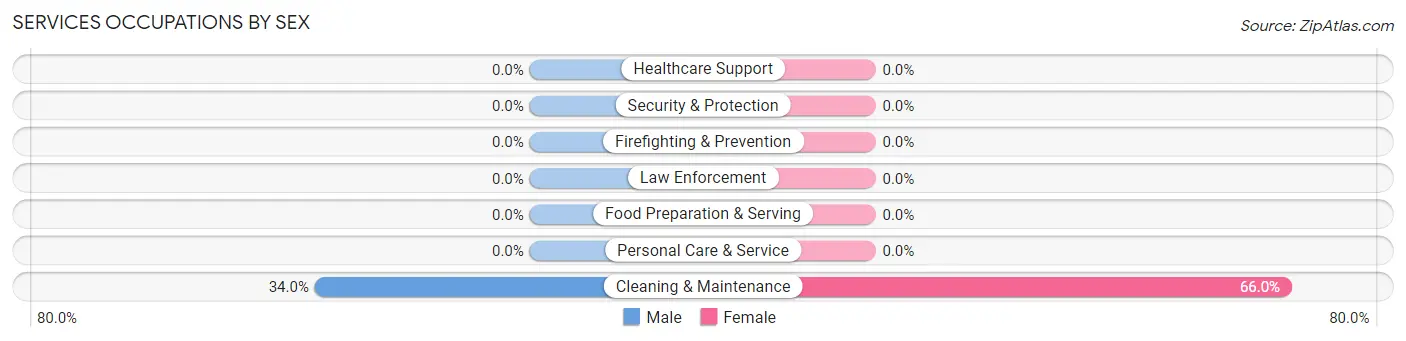
Services Occupations by Sex
| Occupation | Male | Female |
| Healthcare Support | 0 (0.0%) | 0 (0.0%) |
| Security & Protection | 0 (0.0%) | 0 (0.0%) |
| Firefighting & Prevention | 0 (0.0%) | 0 (0.0%) |
| Law Enforcement | 0 (0.0%) | 0 (0.0%) |
| Food Preparation & Serving | 0 (0.0%) | 0 (0.0%) |
| Cleaning & Maintenance | 16 (34.0%) | 31 (66.0%) |
| Personal Care & Service | 0 (0.0%) | 0 (0.0%) |
| Total (Category) | 16 (34.0%) | 31 (66.0%) |
| Total (Overall) | 109 (47.6%) | 120 (52.4%) |
Sales and Office Occupations
The most common Sales and Office occupations in Laurel Hill are Sales & Related (87 | 38.0%), and Office & Administration (44 | 19.2%).
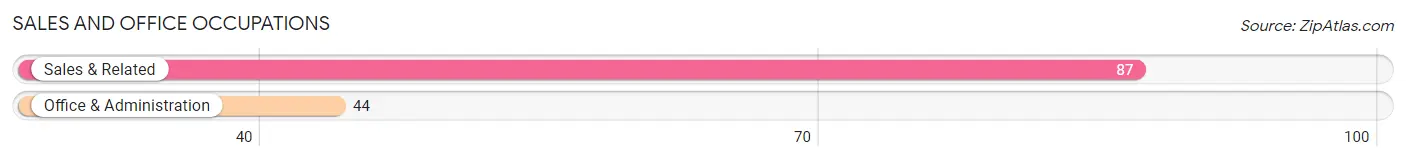
Sales and Office Occupations by Sex

| Occupation | Male | Female |
| Sales & Related | 58 (66.7%) | 29 (33.3%) |
| Office & Administration | 0 (0.0%) | 44 (100.0%) |
| Total (Category) | 58 (44.3%) | 73 (55.7%) |
| Total (Overall) | 109 (47.6%) | 120 (52.4%) |
Natural Resources, Construction and Maintenance Occupations

Natural Resources, Construction and Maintenance Occupations by Sex
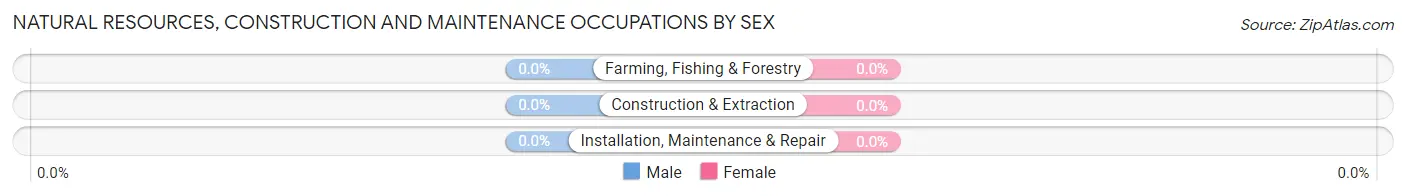
| Occupation | Male | Female |
| Farming, Fishing & Forestry | 0 (0.0%) | 0 (0.0%) |
| Construction & Extraction | 0 (0.0%) | 0 (0.0%) |
| Installation, Maintenance & Repair | 0 (0.0%) | 0 (0.0%) |
| Total (Category) | 0 (0.0%) | 0 (0.0%) |
| Total (Overall) | 109 (47.6%) | 120 (52.4%) |
Production, Transportation and Moving Occupations
The most common Production, Transportation and Moving occupations in Laurel Hill are , and Transportation (8 | 3.5%).
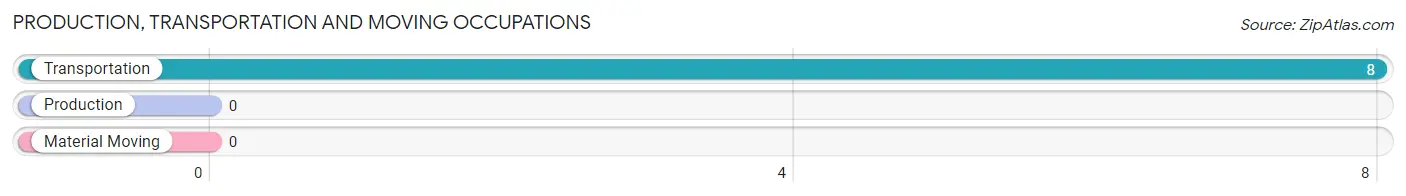
Production, Transportation and Moving Occupations by Sex
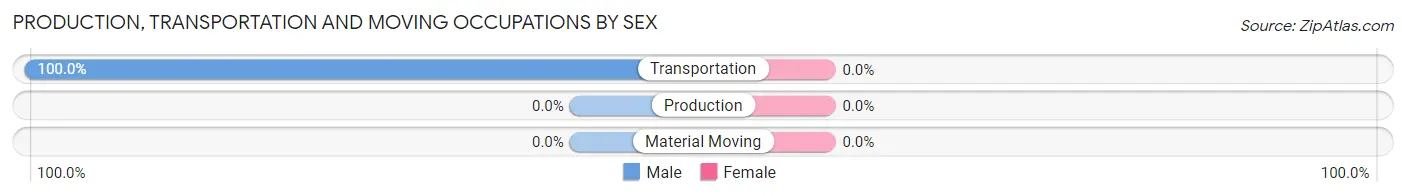
| Occupation | Male | Female |
| Production | 0 (0.0%) | 0 (0.0%) |
| Transportation | 8 (100.0%) | 0 (0.0%) |
| Material Moving | 0 (0.0%) | 0 (0.0%) |
| Total (Category) | 8 (100.0%) | 0 (0.0%) |
| Total (Overall) | 109 (47.6%) | 120 (52.4%) |
Employment Industries by Sex in Laurel Hill
Employment Industries in Laurel Hill
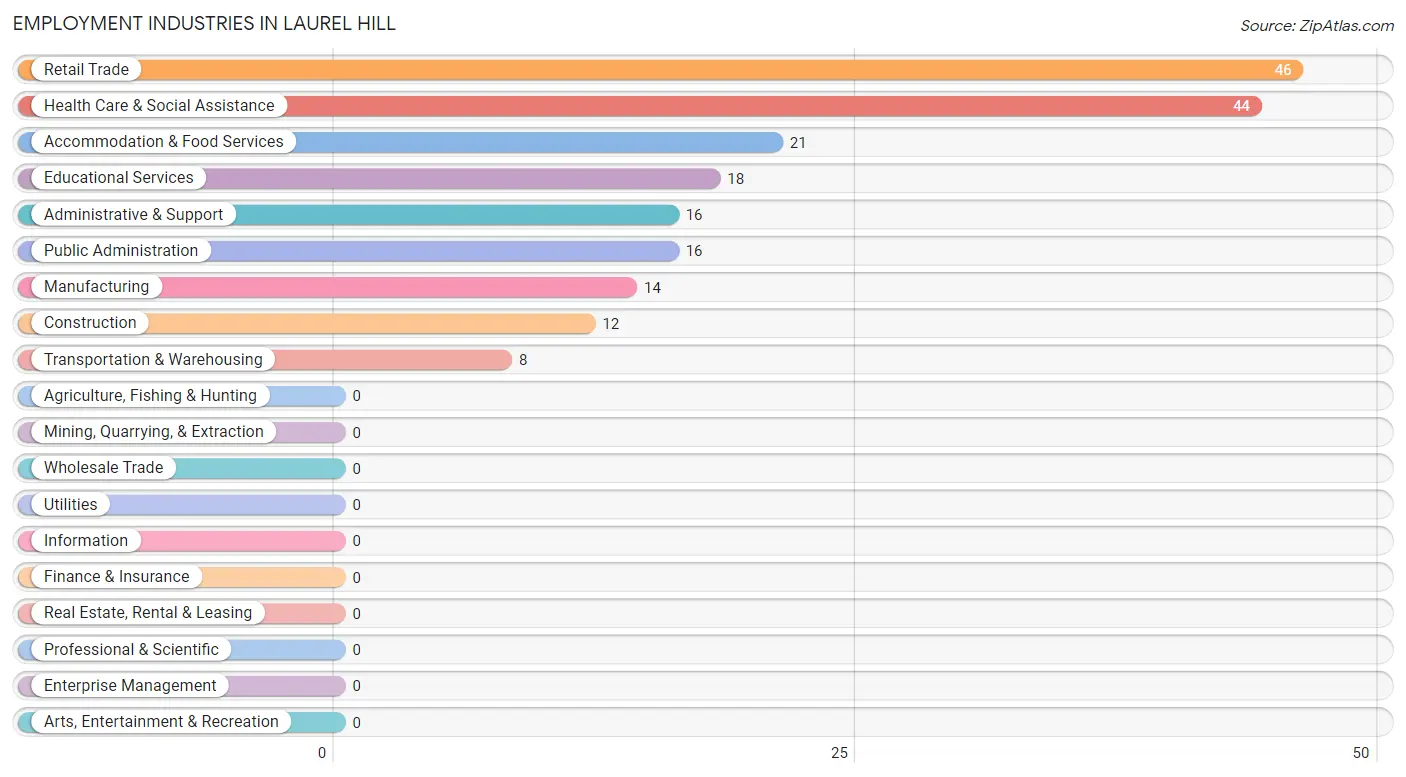
The major employment industries in Laurel Hill include Retail Trade (46 | 20.1%), Health Care & Social Assistance (44 | 19.2%), Accommodation & Food Services (21 | 9.2%), Educational Services (18 | 7.9%), and Administrative & Support (16 | 7.0%).
Employment Industries by Sex in Laurel Hill
The Laurel Hill industries that see more men than women are Construction (100.0%), Manufacturing (100.0%), and Retail Trade (100.0%), whereas the industries that tend to have a higher number of women are Health Care & Social Assistance (100.0%), Accommodation & Food Services (100.0%), and Public Administration (100.0%).
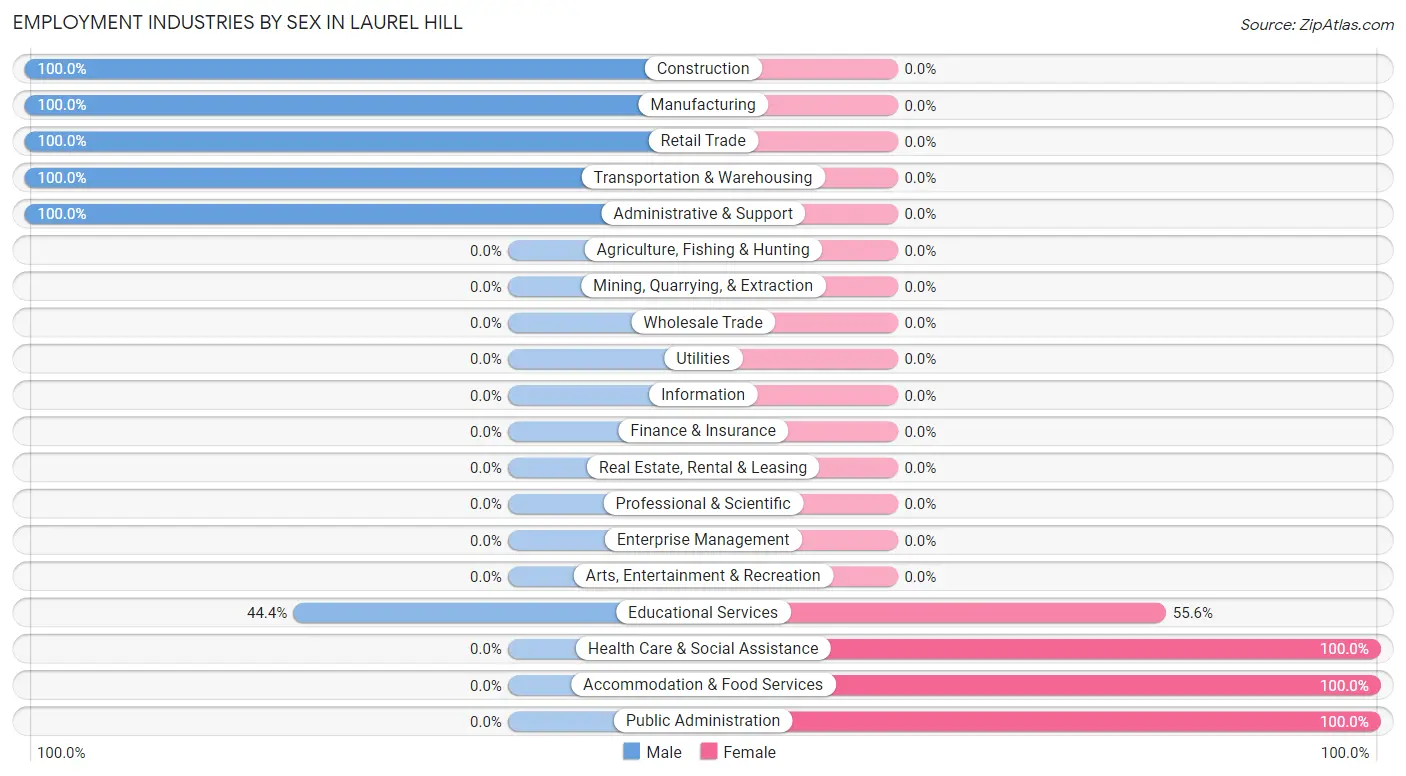
| Industry | Male | Female |
| Agriculture, Fishing & Hunting | 0 (0.0%) | 0 (0.0%) |
| Mining, Quarrying, & Extraction | 0 (0.0%) | 0 (0.0%) |
| Construction | 12 (100.0%) | 0 (0.0%) |
| Manufacturing | 14 (100.0%) | 0 (0.0%) |
| Wholesale Trade | 0 (0.0%) | 0 (0.0%) |
| Retail Trade | 46 (100.0%) | 0 (0.0%) |
| Transportation & Warehousing | 8 (100.0%) | 0 (0.0%) |
| Utilities | 0 (0.0%) | 0 (0.0%) |
| Information | 0 (0.0%) | 0 (0.0%) |
| Finance & Insurance | 0 (0.0%) | 0 (0.0%) |
| Real Estate, Rental & Leasing | 0 (0.0%) | 0 (0.0%) |
| Professional & Scientific | 0 (0.0%) | 0 (0.0%) |
| Enterprise Management | 0 (0.0%) | 0 (0.0%) |
| Administrative & Support | 16 (100.0%) | 0 (0.0%) |
| Educational Services | 8 (44.4%) | 10 (55.6%) |
| Health Care & Social Assistance | 0 (0.0%) | 44 (100.0%) |
| Arts, Entertainment & Recreation | 0 (0.0%) | 0 (0.0%) |
| Accommodation & Food Services | 0 (0.0%) | 21 (100.0%) |
| Public Administration | 0 (0.0%) | 16 (100.0%) |
| Total | 109 (47.6%) | 120 (52.4%) |
Education in Laurel Hill
School Enrollment in Laurel Hill
The most common levels of schooling among the 238 students in Laurel Hill are elementary school (75 | 31.5%), middle school (62 | 26.1%), and college / undergraduate (50 | 21.0%).
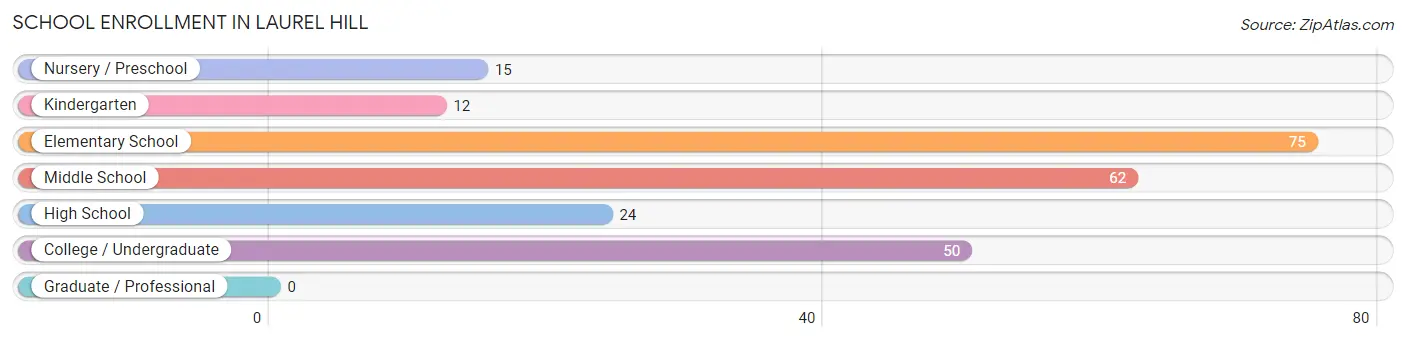
| School Level | # Students | % Students |
| Nursery / Preschool | 15 | 6.3% |
| Kindergarten | 12 | 5.0% |
| Elementary School | 75 | 31.5% |
| Middle School | 62 | 26.1% |
| High School | 24 | 10.1% |
| College / Undergraduate | 50 | 21.0% |
| Graduate / Professional | 0 | 0.0% |
| Total | 238 | 100.0% |
School Enrollment by Age by Funding Source in Laurel Hill
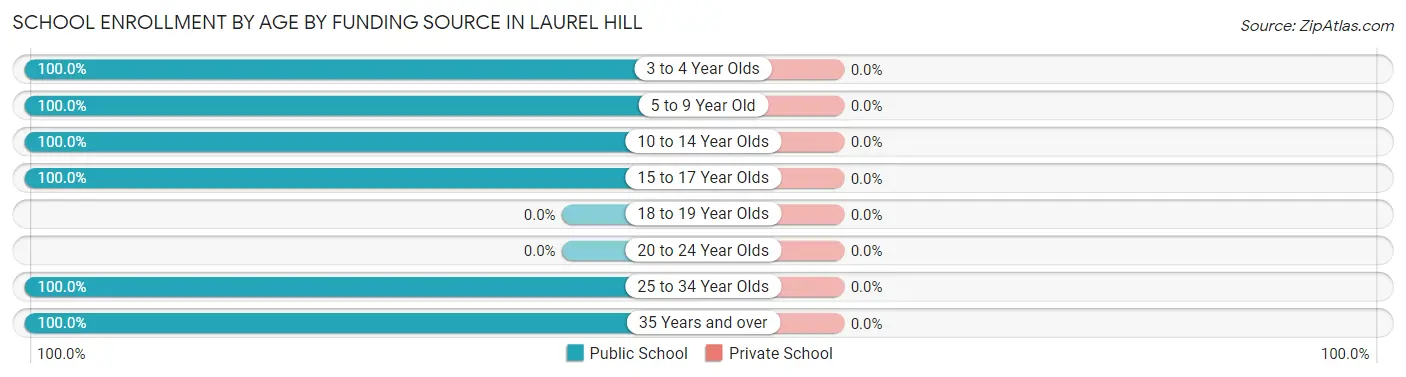
| Age Bracket | Public School | Private School |
| 3 to 4 Year Olds | 15 (100.0%) | 0 (0.0%) |
| 5 to 9 Year Old | 87 (100.0%) | 0 (0.0%) |
| 10 to 14 Year Olds | 62 (100.0%) | 0 (0.0%) |
| 15 to 17 Year Olds | 24 (100.0%) | 0 (0.0%) |
| 18 to 19 Year Olds | 0 (0.0%) | 0 (0.0%) |
| 20 to 24 Year Olds | 0 (0.0%) | 0 (0.0%) |
| 25 to 34 Year Olds | 29 (100.0%) | 0 (0.0%) |
| 35 Years and over | 21 (100.0%) | 0 (0.0%) |
| Total | 238 (100.0%) | 0 (0.0%) |
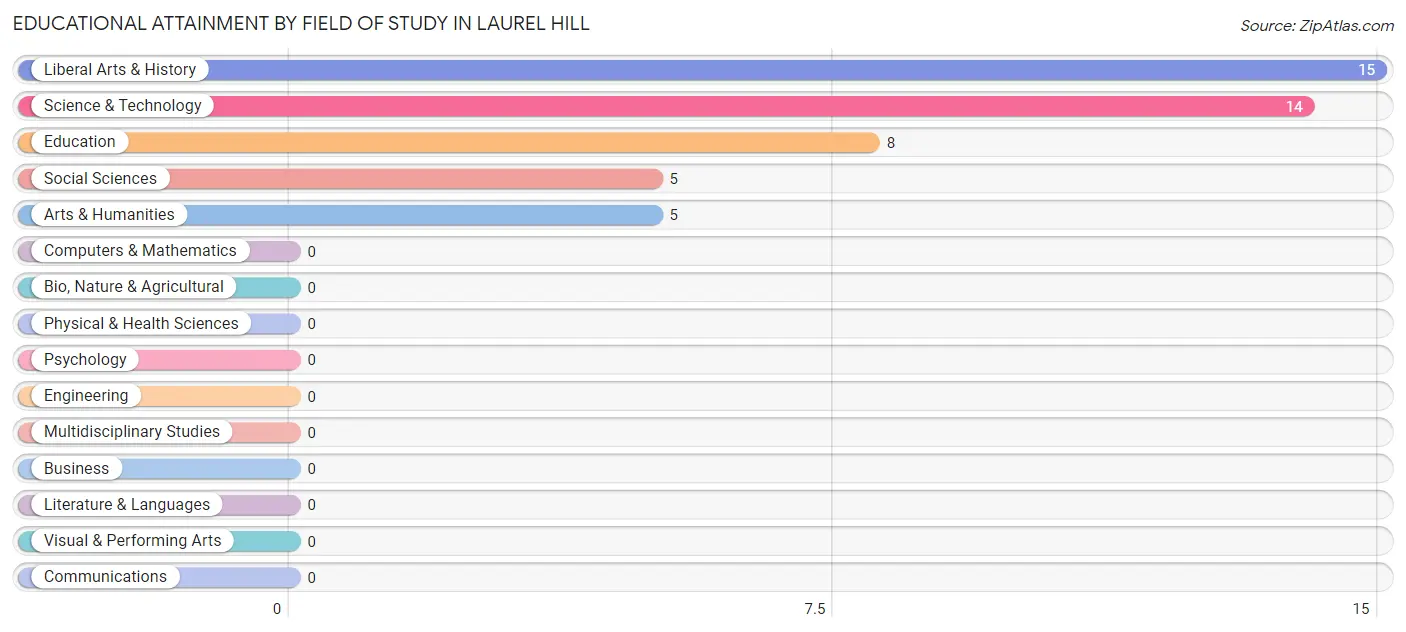
Educational Attainment by Field of Study in Laurel Hill
Liberal arts & history (15 | 31.9%), science & technology (14 | 29.8%), education (8 | 17.0%), social sciences (5 | 10.6%), and arts & humanities (5 | 10.6%) are the most common fields of study among 47 individuals in Laurel Hill who have obtained a bachelor's degree or higher.
| Field of Study | # Graduates | % Graduates |
| Computers & Mathematics | 0 | 0.0% |
| Bio, Nature & Agricultural | 0 | 0.0% |
| Physical & Health Sciences | 0 | 0.0% |
| Psychology | 0 | 0.0% |
| Social Sciences | 5 | 10.6% |
| Engineering | 0 | 0.0% |
| Multidisciplinary Studies | 0 | 0.0% |
| Science & Technology | 14 | 29.8% |
| Business | 0 | 0.0% |
| Education | 8 | 17.0% |
| Literature & Languages | 0 | 0.0% |
| Liberal Arts & History | 15 | 31.9% |
| Visual & Performing Arts | 0 | 0.0% |
| Communications | 0 | 0.0% |
| Arts & Humanities | 5 | 10.6% |
| Total | 47 | 100.0% |
Transportation & Commute in Laurel Hill
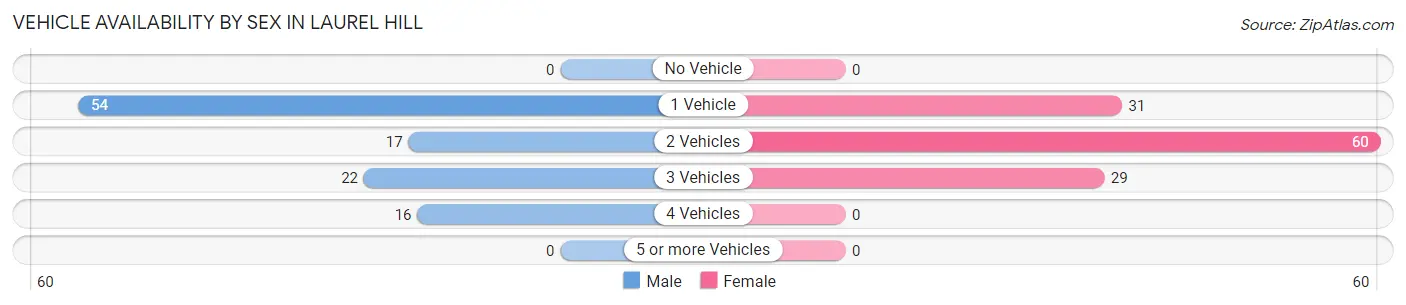
Vehicle Availability by Sex in Laurel Hill
The most prevalent vehicle ownership categories in Laurel Hill are males with 1 vehicle (54, accounting for 49.5%) and females with 1 vehicle (31, making up 45.0%).
| Vehicles Available | Male | Female |
| No Vehicle | 0 (0.0%) | 0 (0.0%) |
| 1 Vehicle | 54 (49.5%) | 31 (25.8%) |
| 2 Vehicles | 17 (15.6%) | 60 (50.0%) |
| 3 Vehicles | 22 (20.2%) | 29 (24.2%) |
| 4 Vehicles | 16 (14.7%) | 0 (0.0%) |
| 5 or more Vehicles | 0 (0.0%) | 0 (0.0%) |
| Total | 109 (100.0%) | 120 (100.0%) |
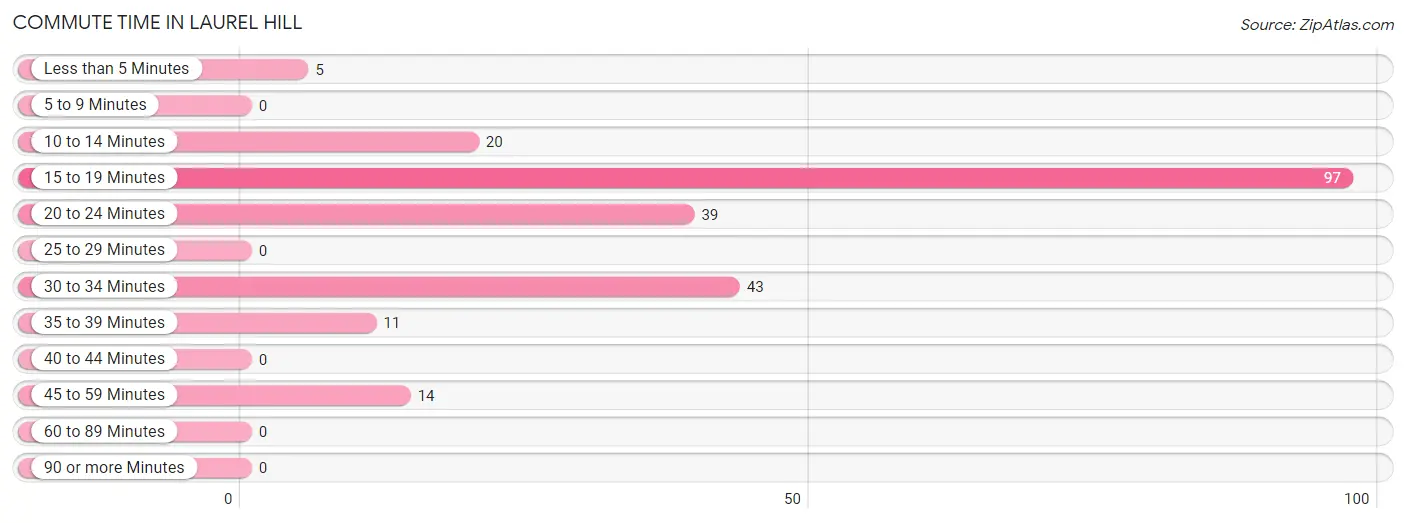
Commute Time in Laurel Hill
The most frequently occuring commute durations in Laurel Hill are 15 to 19 minutes (97 commuters, 42.4%), 30 to 34 minutes (43 commuters, 18.8%), and 20 to 24 minutes (39 commuters, 17.0%).
| Commute Time | # Commuters | % Commuters |
| Less than 5 Minutes | 5 | 2.2% |
| 5 to 9 Minutes | 0 | 0.0% |
| 10 to 14 Minutes | 20 | 8.7% |
| 15 to 19 Minutes | 97 | 42.4% |
| 20 to 24 Minutes | 39 | 17.0% |
| 25 to 29 Minutes | 0 | 0.0% |
| 30 to 34 Minutes | 43 | 18.8% |
| 35 to 39 Minutes | 11 | 4.8% |
| 40 to 44 Minutes | 0 | 0.0% |
| 45 to 59 Minutes | 14 | 6.1% |
| 60 to 89 Minutes | 0 | 0.0% |
| 90 or more Minutes | 0 | 0.0% |
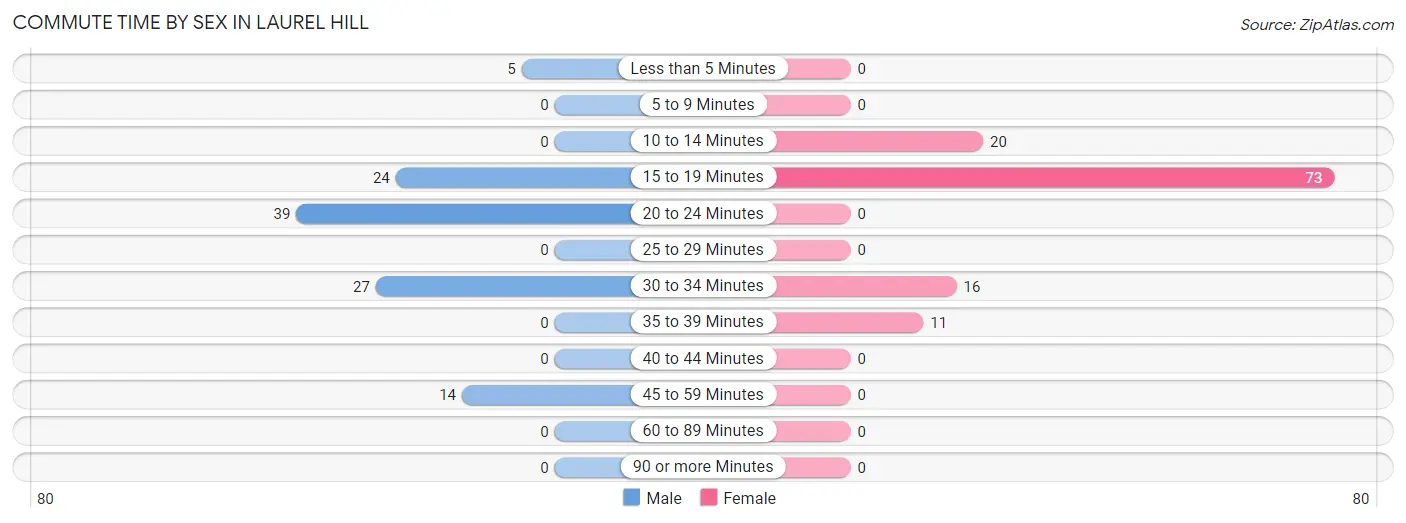
Commute Time by Sex in Laurel Hill
The most common commute times in Laurel Hill are 20 to 24 minutes (39 commuters, 35.8%) for males and 15 to 19 minutes (73 commuters, 60.8%) for females.
| Commute Time | Male | Female |
| Less than 5 Minutes | 5 (4.6%) | 0 (0.0%) |
| 5 to 9 Minutes | 0 (0.0%) | 0 (0.0%) |
| 10 to 14 Minutes | 0 (0.0%) | 20 (16.7%) |
| 15 to 19 Minutes | 24 (22.0%) | 73 (60.8%) |
| 20 to 24 Minutes | 39 (35.8%) | 0 (0.0%) |
| 25 to 29 Minutes | 0 (0.0%) | 0 (0.0%) |
| 30 to 34 Minutes | 27 (24.8%) | 16 (13.3%) |
| 35 to 39 Minutes | 0 (0.0%) | 11 (9.2%) |
| 40 to 44 Minutes | 0 (0.0%) | 0 (0.0%) |
| 45 to 59 Minutes | 14 (12.8%) | 0 (0.0%) |
| 60 to 89 Minutes | 0 (0.0%) | 0 (0.0%) |
| 90 or more Minutes | 0 (0.0%) | 0 (0.0%) |
Time of Departure to Work by Sex in Laurel Hill
The most frequent times of departure to work in Laurel Hill are 6:00 AM to 6:29 AM (39, 35.8%) for males and 7:30 AM to 7:59 AM (83, 69.2%) for females.
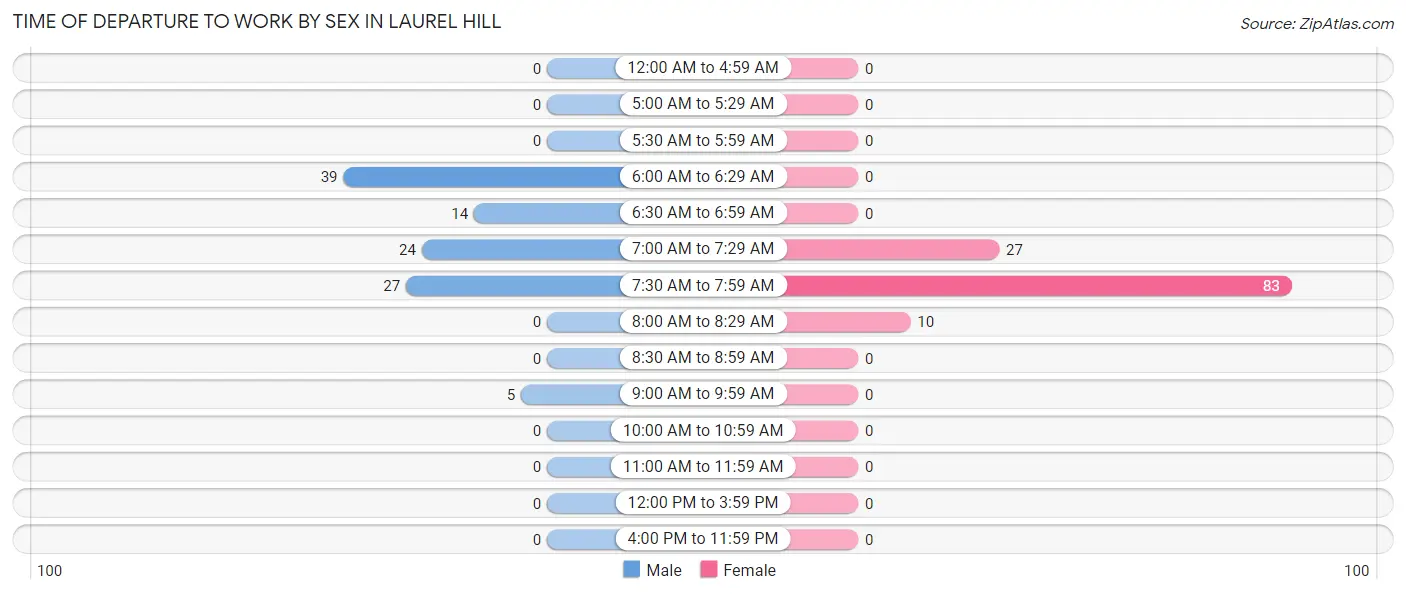
| Time of Departure | Male | Female |
| 12:00 AM to 4:59 AM | 0 (0.0%) | 0 (0.0%) |
| 5:00 AM to 5:29 AM | 0 (0.0%) | 0 (0.0%) |
| 5:30 AM to 5:59 AM | 0 (0.0%) | 0 (0.0%) |
| 6:00 AM to 6:29 AM | 39 (35.8%) | 0 (0.0%) |
| 6:30 AM to 6:59 AM | 14 (12.8%) | 0 (0.0%) |
| 7:00 AM to 7:29 AM | 24 (22.0%) | 27 (22.5%) |
| 7:30 AM to 7:59 AM | 27 (24.8%) | 83 (69.2%) |
| 8:00 AM to 8:29 AM | 0 (0.0%) | 10 (8.3%) |
| 8:30 AM to 8:59 AM | 0 (0.0%) | 0 (0.0%) |
| 9:00 AM to 9:59 AM | 5 (4.6%) | 0 (0.0%) |
| 10:00 AM to 10:59 AM | 0 (0.0%) | 0 (0.0%) |
| 11:00 AM to 11:59 AM | 0 (0.0%) | 0 (0.0%) |
| 12:00 PM to 3:59 PM | 0 (0.0%) | 0 (0.0%) |
| 4:00 PM to 11:59 PM | 0 (0.0%) | 0 (0.0%) |
| Total | 109 (100.0%) | 120 (100.0%) |
Housing Occupancy in Laurel Hill
Occupancy by Ownership in Laurel Hill
Of the total 369 dwellings in Laurel Hill, owner-occupied units account for 236 (64.0%), while renter-occupied units make up 133 (36.0%).
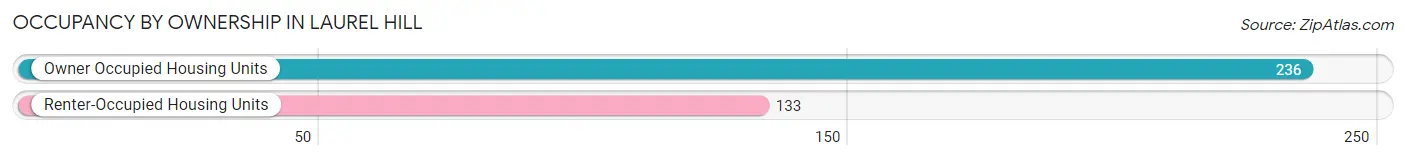
| Occupancy | # Housing Units | % Housing Units |
| Owner Occupied Housing Units | 236 | 64.0% |
| Renter-Occupied Housing Units | 133 | 36.0% |
| Total Occupied Housing Units | 369 | 100.0% |
Occupancy by Household Size in Laurel Hill
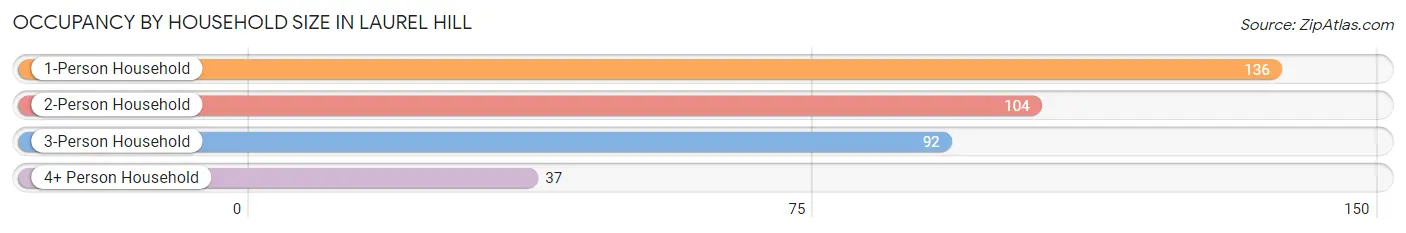
| Household Size | # Housing Units | % Housing Units |
| 1-Person Household | 136 | 36.9% |
| 2-Person Household | 104 | 28.2% |
| 3-Person Household | 92 | 24.9% |
| 4+ Person Household | 37 | 10.0% |
| Total Housing Units | 369 | 100.0% |
Occupancy by Ownership by Household Size in Laurel Hill
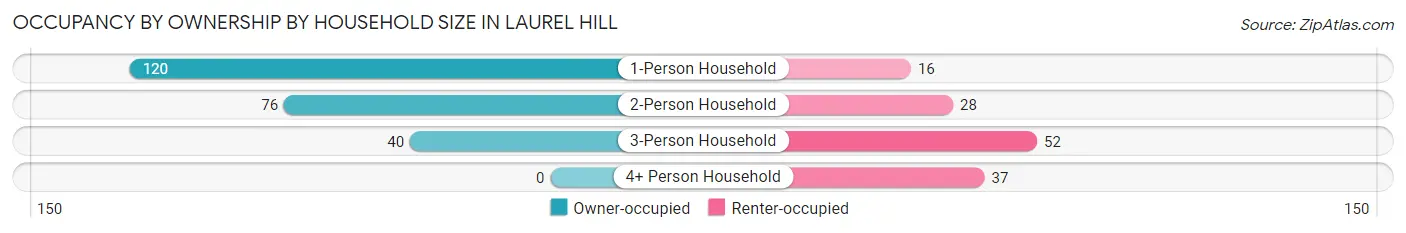
| Household Size | Owner-occupied | Renter-occupied |
| 1-Person Household | 120 (88.2%) | 16 (11.8%) |
| 2-Person Household | 76 (73.1%) | 28 (26.9%) |
| 3-Person Household | 40 (43.5%) | 52 (56.5%) |
| 4+ Person Household | 0 (0.0%) | 37 (100.0%) |
| Total Housing Units | 236 (64.0%) | 133 (36.0%) |
Occupancy by Educational Attainment in Laurel Hill
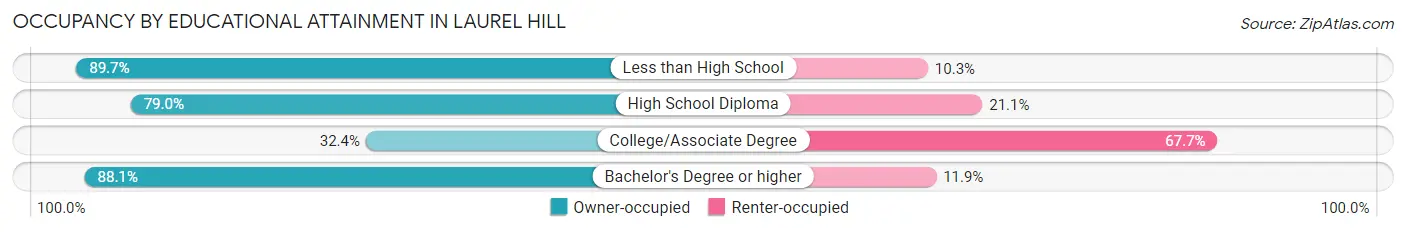
| Household Size | Owner-occupied | Renter-occupied |
| Less than High School | 35 (89.7%) | 4 (10.3%) |
| High School Diploma | 120 (78.9%) | 32 (21.0%) |
| College/Associate Degree | 44 (32.4%) | 92 (67.6%) |
| Bachelor's Degree or higher | 37 (88.1%) | 5 (11.9%) |
Occupancy by Age of Householder in Laurel Hill
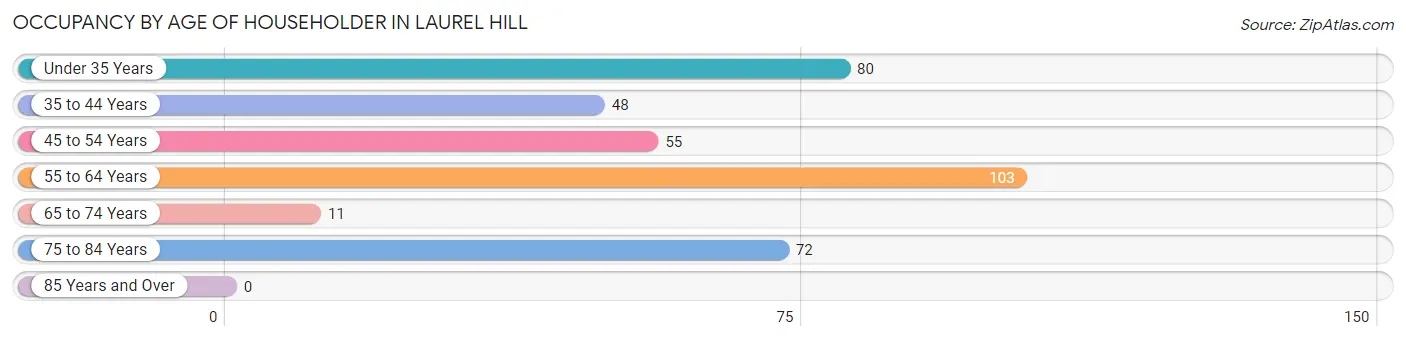
| Age Bracket | # Households | % Households |
| Under 35 Years | 80 | 21.7% |
| 35 to 44 Years | 48 | 13.0% |
| 45 to 54 Years | 55 | 14.9% |
| 55 to 64 Years | 103 | 27.9% |
| 65 to 74 Years | 11 | 3.0% |
| 75 to 84 Years | 72 | 19.5% |
| 85 Years and Over | 0 | 0.0% |
| Total | 369 | 100.0% |
Housing Finances in Laurel Hill
Median Income by Occupancy in Laurel Hill
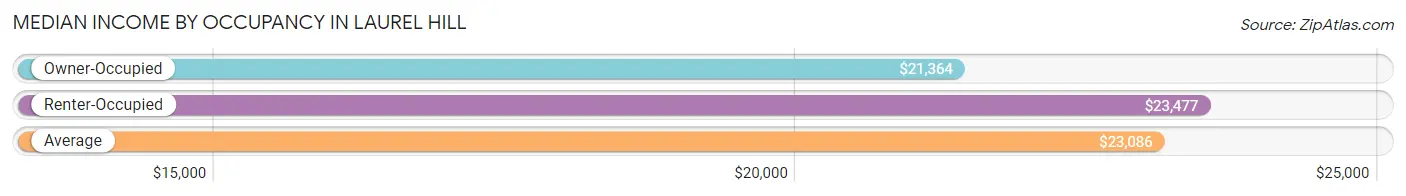
| Occupancy Type | # Households | Median Income |
| Owner-Occupied | 236 (64.0%) | $21,364 |
| Renter-Occupied | 133 (36.0%) | $23,477 |
| Average | 369 (100.0%) | $23,086 |
Occupancy by Householder Income Bracket in Laurel Hill
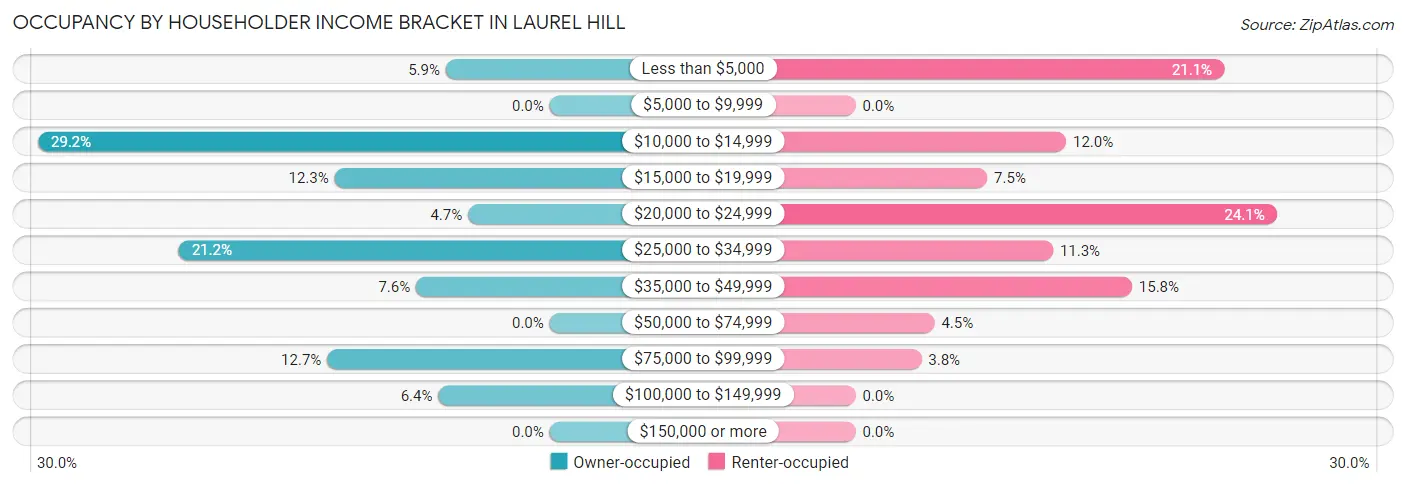
| Income Bracket | Owner-occupied | Renter-occupied |
| Less than $5,000 | 14 (5.9%) | 28 (21.0%) |
| $5,000 to $9,999 | 0 (0.0%) | 0 (0.0%) |
| $10,000 to $14,999 | 69 (29.2%) | 16 (12.0%) |
| $15,000 to $19,999 | 29 (12.3%) | 10 (7.5%) |
| $20,000 to $24,999 | 11 (4.7%) | 32 (24.1%) |
| $25,000 to $34,999 | 50 (21.2%) | 15 (11.3%) |
| $35,000 to $49,999 | 18 (7.6%) | 21 (15.8%) |
| $50,000 to $74,999 | 0 (0.0%) | 6 (4.5%) |
| $75,000 to $99,999 | 30 (12.7%) | 5 (3.8%) |
| $100,000 to $149,999 | 15 (6.4%) | 0 (0.0%) |
| $150,000 or more | 0 (0.0%) | 0 (0.0%) |
| Total | 236 (100.0%) | 133 (100.0%) |
Monthly Housing Cost Tiers in Laurel Hill
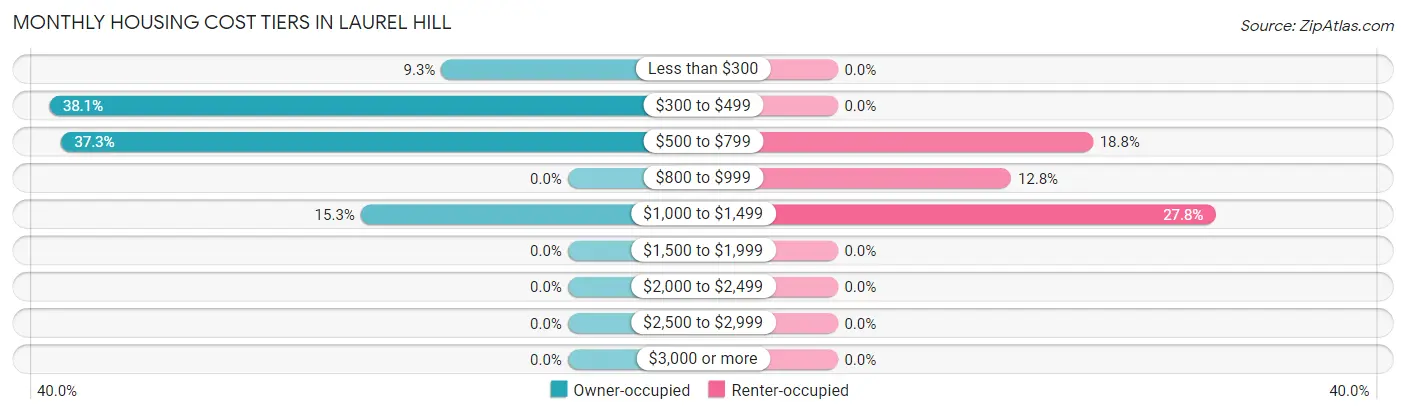
| Monthly Cost | Owner-occupied | Renter-occupied |
| Less than $300 | 22 (9.3%) | 0 (0.0%) |
| $300 to $499 | 90 (38.1%) | 0 (0.0%) |
| $500 to $799 | 88 (37.3%) | 25 (18.8%) |
| $800 to $999 | 0 (0.0%) | 17 (12.8%) |
| $1,000 to $1,499 | 36 (15.2%) | 37 (27.8%) |
| $1,500 to $1,999 | 0 (0.0%) | 0 (0.0%) |
| $2,000 to $2,499 | 0 (0.0%) | 0 (0.0%) |
| $2,500 to $2,999 | 0 (0.0%) | 0 (0.0%) |
| $3,000 or more | 0 (0.0%) | 0 (0.0%) |
| Total | 236 (100.0%) | 133 (100.0%) |
Physical Housing Characteristics in Laurel Hill
Housing Structures in Laurel Hill
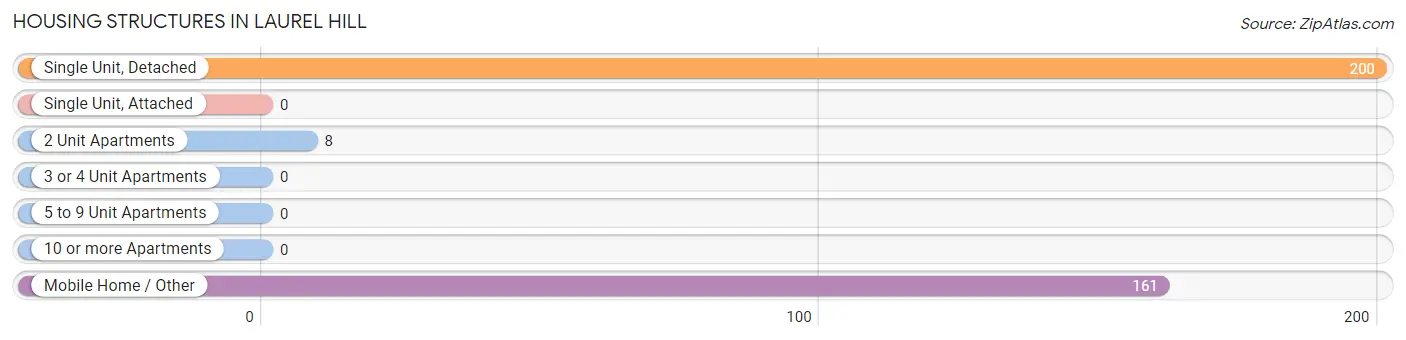
| Structure Type | # Housing Units | % Housing Units |
| Single Unit, Detached | 200 | 54.2% |
| Single Unit, Attached | 0 | 0.0% |
| 2 Unit Apartments | 8 | 2.2% |
| 3 or 4 Unit Apartments | 0 | 0.0% |
| 5 to 9 Unit Apartments | 0 | 0.0% |
| 10 or more Apartments | 0 | 0.0% |
| Mobile Home / Other | 161 | 43.6% |
| Total | 369 | 100.0% |
Housing Structures by Occupancy in Laurel Hill
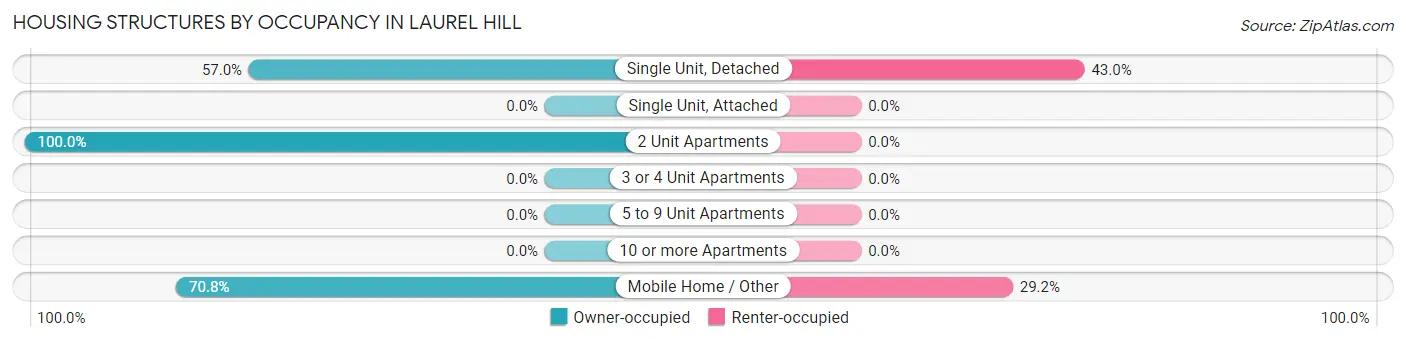
| Structure Type | Owner-occupied | Renter-occupied |
| Single Unit, Detached | 114 (57.0%) | 86 (43.0%) |
| Single Unit, Attached | 0 (0.0%) | 0 (0.0%) |
| 2 Unit Apartments | 8 (100.0%) | 0 (0.0%) |
| 3 or 4 Unit Apartments | 0 (0.0%) | 0 (0.0%) |
| 5 to 9 Unit Apartments | 0 (0.0%) | 0 (0.0%) |
| 10 or more Apartments | 0 (0.0%) | 0 (0.0%) |
| Mobile Home / Other | 114 (70.8%) | 47 (29.2%) |
| Total | 236 (64.0%) | 133 (36.0%) |
Housing Structures by Number of Rooms in Laurel Hill
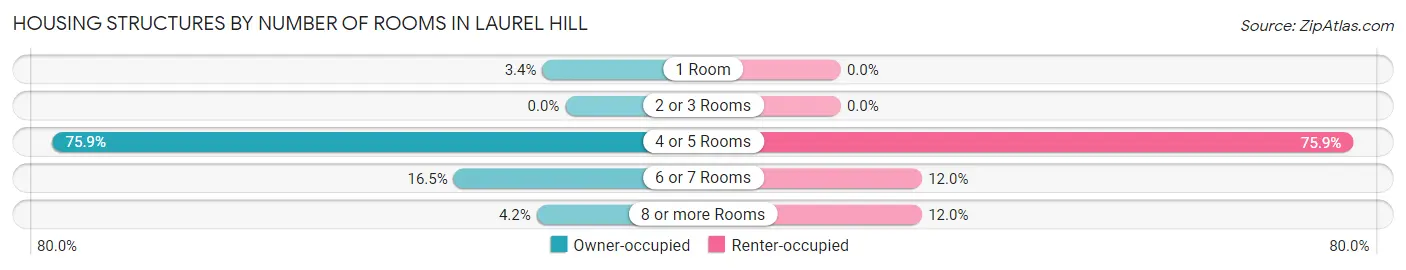
| Number of Rooms | Owner-occupied | Renter-occupied |
| 1 Room | 8 (3.4%) | 0 (0.0%) |
| 2 or 3 Rooms | 0 (0.0%) | 0 (0.0%) |
| 4 or 5 Rooms | 179 (75.8%) | 101 (75.9%) |
| 6 or 7 Rooms | 39 (16.5%) | 16 (12.0%) |
| 8 or more Rooms | 10 (4.2%) | 16 (12.0%) |
| Total | 236 (100.0%) | 133 (100.0%) |
Housing Structure by Heating Type in Laurel Hill
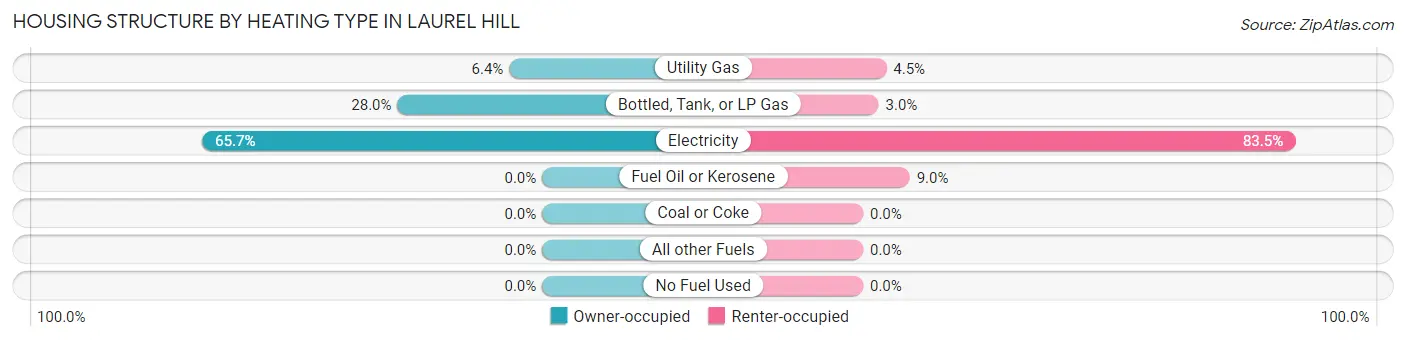
| Heating Type | Owner-occupied | Renter-occupied |
| Utility Gas | 15 (6.4%) | 6 (4.5%) |
| Bottled, Tank, or LP Gas | 66 (28.0%) | 4 (3.0%) |
| Electricity | 155 (65.7%) | 111 (83.5%) |
| Fuel Oil or Kerosene | 0 (0.0%) | 12 (9.0%) |
| Coal or Coke | 0 (0.0%) | 0 (0.0%) |
| All other Fuels | 0 (0.0%) | 0 (0.0%) |
| No Fuel Used | 0 (0.0%) | 0 (0.0%) |
| Total | 236 (100.0%) | 133 (100.0%) |
Household Vehicle Usage in Laurel Hill
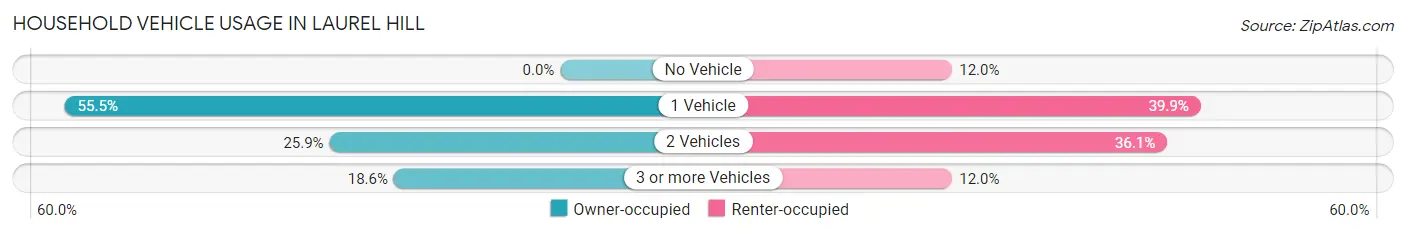
| Vehicles per Household | Owner-occupied | Renter-occupied |
| No Vehicle | 0 (0.0%) | 16 (12.0%) |
| 1 Vehicle | 131 (55.5%) | 53 (39.9%) |
| 2 Vehicles | 61 (25.9%) | 48 (36.1%) |
| 3 or more Vehicles | 44 (18.6%) | 16 (12.0%) |
| Total | 236 (100.0%) | 133 (100.0%) |
Real Estate & Mortgages in Laurel Hill
Real Estate and Mortgage Overview in Laurel Hill
| Characteristic | Without Mortgage | With Mortgage |
| Housing Units | 132 | 104 |
| Median Property Value | - | - |
| Median Household Income | $16,447 | $0 |
| Monthly Housing Costs | $363 | $0 |
| Real Estate Taxes | $567 | $0 |
Property Value by Mortgage Status in Laurel Hill
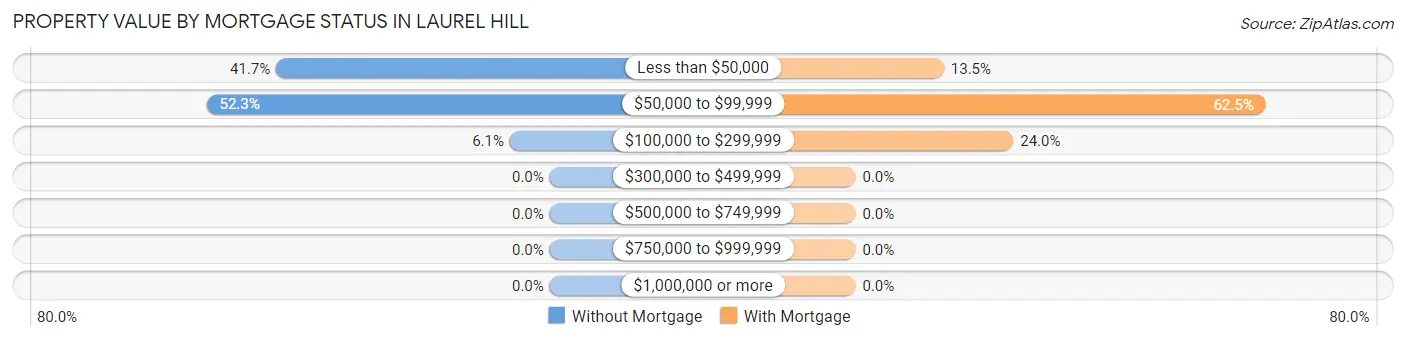
| Property Value | Without Mortgage | With Mortgage |
| Less than $50,000 | 55 (41.7%) | 14 (13.5%) |
| $50,000 to $99,999 | 69 (52.3%) | 65 (62.5%) |
| $100,000 to $299,999 | 8 (6.1%) | 25 (24.0%) |
| $300,000 to $499,999 | 0 (0.0%) | 0 (0.0%) |
| $500,000 to $749,999 | 0 (0.0%) | 0 (0.0%) |
| $750,000 to $999,999 | 0 (0.0%) | 0 (0.0%) |
| $1,000,000 or more | 0 (0.0%) | 0 (0.0%) |
| Total | 132 (100.0%) | 104 (100.0%) |
Household Income by Mortgage Status in Laurel Hill
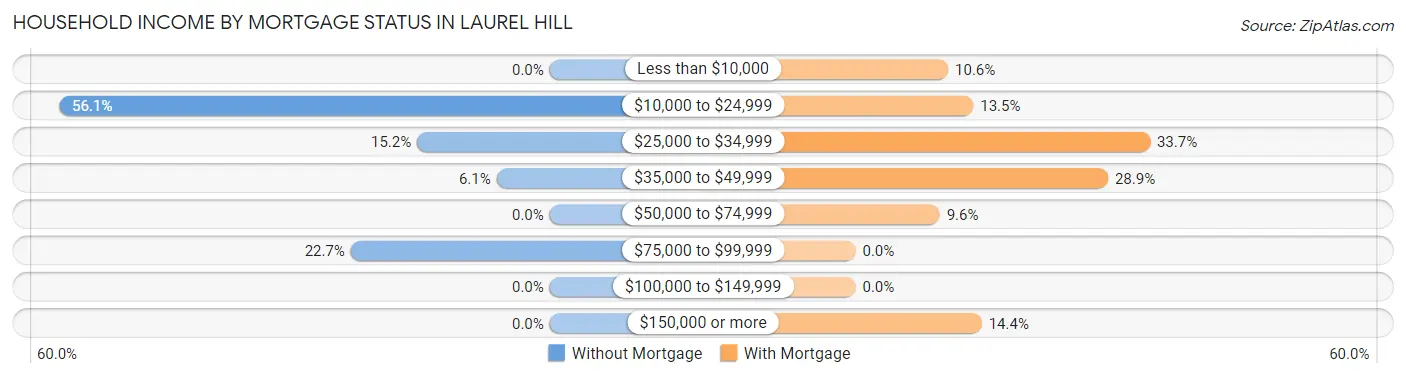
| Household Income | Without Mortgage | With Mortgage |
| Less than $10,000 | 0 (0.0%) | 11 (10.6%) |
| $10,000 to $24,999 | 74 (56.1%) | 14 (13.5%) |
| $25,000 to $34,999 | 20 (15.1%) | 35 (33.7%) |
| $35,000 to $49,999 | 8 (6.1%) | 30 (28.8%) |
| $50,000 to $74,999 | 0 (0.0%) | 10 (9.6%) |
| $75,000 to $99,999 | 30 (22.7%) | 0 (0.0%) |
| $100,000 to $149,999 | 0 (0.0%) | 0 (0.0%) |
| $150,000 or more | 0 (0.0%) | 15 (14.4%) |
| Total | 132 (100.0%) | 104 (100.0%) |
Property Value to Household Income Ratio in Laurel Hill
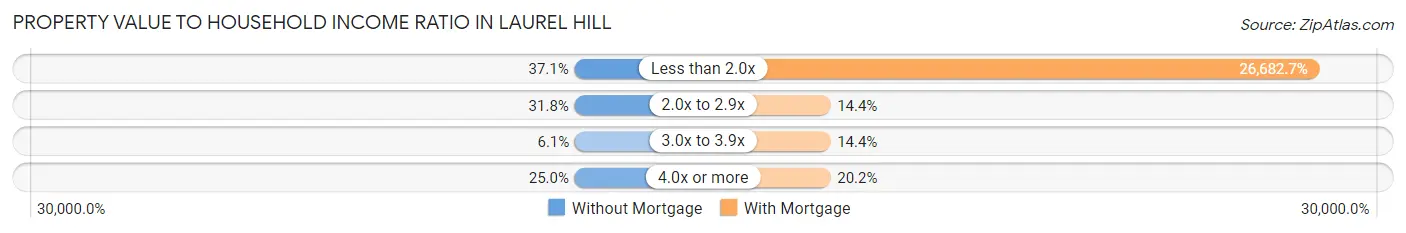
| Value-to-Income Ratio | Without Mortgage | With Mortgage |
| Less than 2.0x | 49 (37.1%) | 27,750 (26,682.7%) |
| 2.0x to 2.9x | 42 (31.8%) | 15 (14.4%) |
| 3.0x to 3.9x | 8 (6.1%) | 15 (14.4%) |
| 4.0x or more | 33 (25.0%) | 21 (20.2%) |
| Total | 132 (100.0%) | 104 (100.0%) |
Real Estate Taxes by Mortgage Status in Laurel Hill
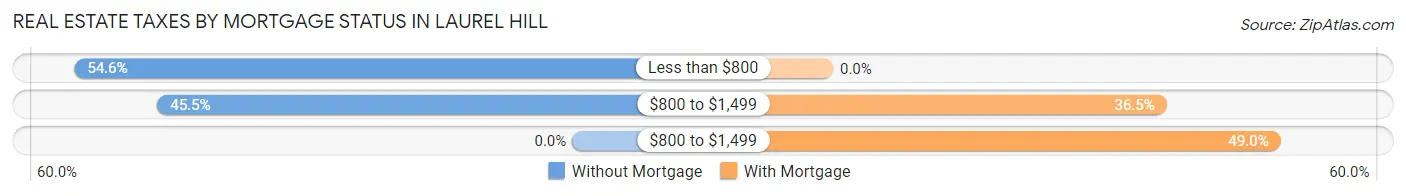
| Property Taxes | Without Mortgage | With Mortgage |
| Less than $800 | 72 (54.5%) | 0 (0.0%) |
| $800 to $1,499 | 60 (45.5%) | 38 (36.5%) |
| $800 to $1,499 | 0 (0.0%) | 51 (49.0%) |
| Total | 132 (100.0%) | 104 (100.0%) |
Health & Disability in Laurel Hill
Health Insurance Coverage by Age in Laurel Hill
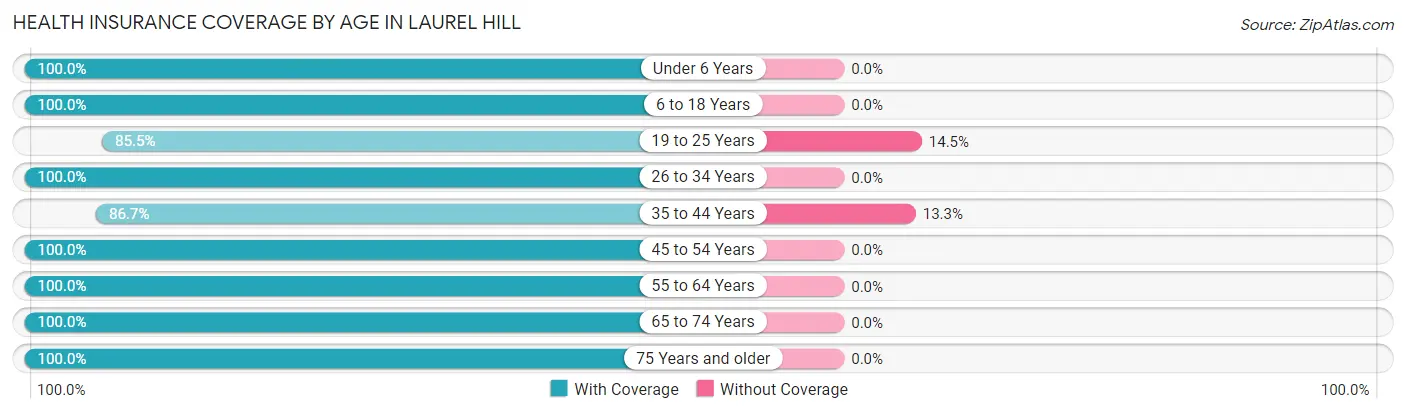
| Age Bracket | With Coverage | Without Coverage |
| Under 6 Years | 55 (100.0%) | 0 (0.0%) |
| 6 to 18 Years | 166 (100.0%) | 0 (0.0%) |
| 19 to 25 Years | 65 (85.5%) | 11 (14.5%) |
| 26 to 34 Years | 106 (100.0%) | 0 (0.0%) |
| 35 to 44 Years | 65 (86.7%) | 10 (13.3%) |
| 45 to 54 Years | 63 (100.0%) | 0 (0.0%) |
| 55 to 64 Years | 128 (100.0%) | 0 (0.0%) |
| 65 to 74 Years | 102 (100.0%) | 0 (0.0%) |
| 75 Years and older | 98 (100.0%) | 0 (0.0%) |
| Total | 848 (97.6%) | 21 (2.4%) |
Health Insurance Coverage by Citizenship Status in Laurel Hill

| Citizenship Status | With Coverage | Without Coverage |
| Native Born | 55 (100.0%) | 0 (0.0%) |
| Foreign Born, Citizen | 166 (100.0%) | 0 (0.0%) |
| Foreign Born, not a Citizen | 65 (85.5%) | 11 (14.5%) |
Health Insurance Coverage by Household Income in Laurel Hill
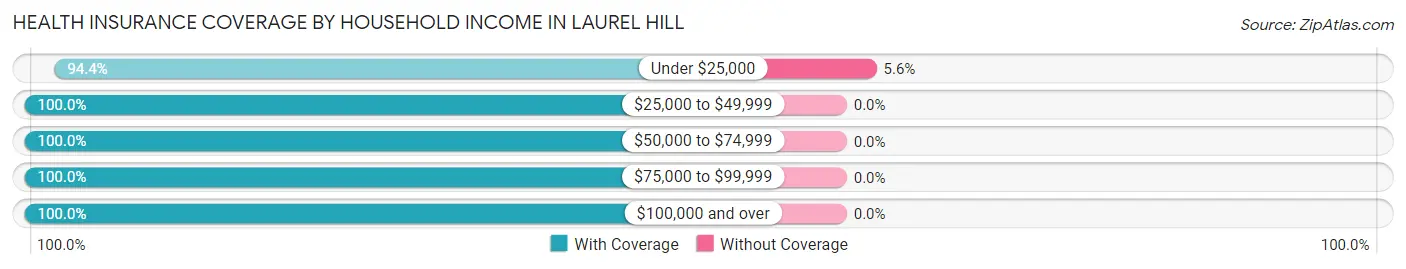
| Household Income | With Coverage | Without Coverage |
| Under $25,000 | 355 (94.4%) | 21 (5.6%) |
| $25,000 to $49,999 | 270 (100.0%) | 0 (0.0%) |
| $50,000 to $74,999 | 19 (100.0%) | 0 (0.0%) |
| $75,000 to $99,999 | 146 (100.0%) | 0 (0.0%) |
| $100,000 and over | 58 (100.0%) | 0 (0.0%) |
Public vs Private Health Insurance Coverage by Age in Laurel Hill
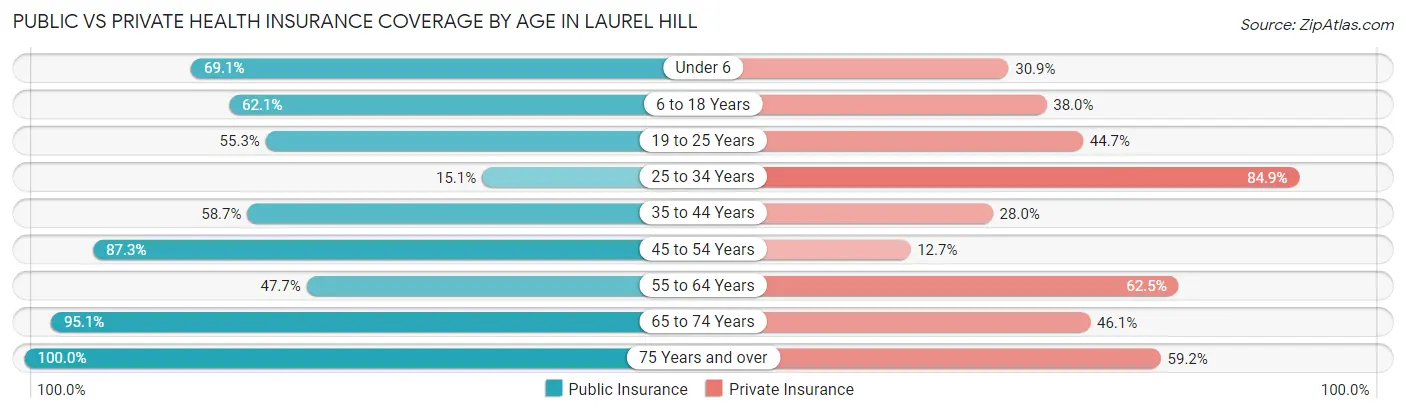
| Age Bracket | Public Insurance | Private Insurance |
| Under 6 | 38 (69.1%) | 17 (30.9%) |
| 6 to 18 Years | 103 (62.1%) | 63 (38.0%) |
| 19 to 25 Years | 42 (55.3%) | 34 (44.7%) |
| 25 to 34 Years | 16 (15.1%) | 90 (84.9%) |
| 35 to 44 Years | 44 (58.7%) | 21 (28.0%) |
| 45 to 54 Years | 55 (87.3%) | 8 (12.7%) |
| 55 to 64 Years | 61 (47.7%) | 80 (62.5%) |
| 65 to 74 Years | 97 (95.1%) | 47 (46.1%) |
| 75 Years and over | 98 (100.0%) | 58 (59.2%) |
| Total | 554 (63.7%) | 418 (48.1%) |
Disability Status by Sex by Age in Laurel Hill
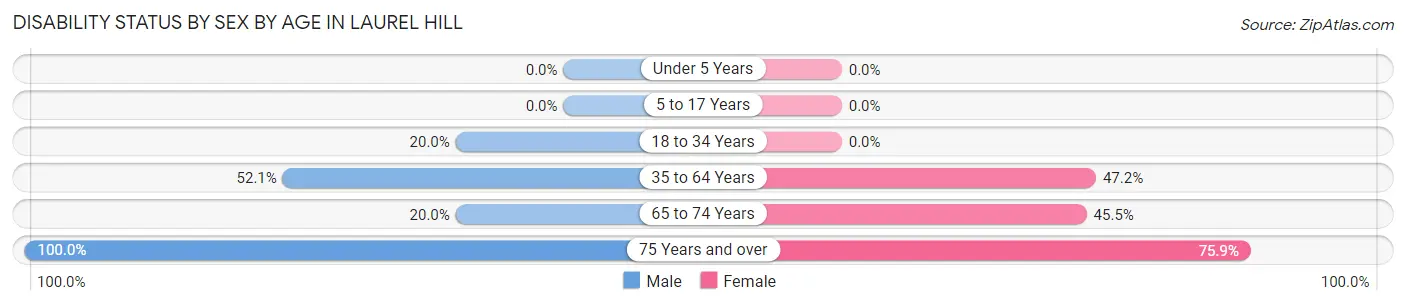
| Age Bracket | Male | Female |
| Under 5 Years | 0 (0.0%) | 0 (0.0%) |
| 5 to 17 Years | 0 (0.0%) | 0 (0.0%) |
| 18 to 34 Years | 21 (20.0%) | 0 (0.0%) |
| 35 to 64 Years | 37 (52.1%) | 92 (47.2%) |
| 65 to 74 Years | 5 (20.0%) | 35 (45.5%) |
| 75 Years and over | 15 (100.0%) | 63 (75.9%) |
Disability Class by Sex by Age in Laurel Hill
Disability Class: Hearing Difficulty
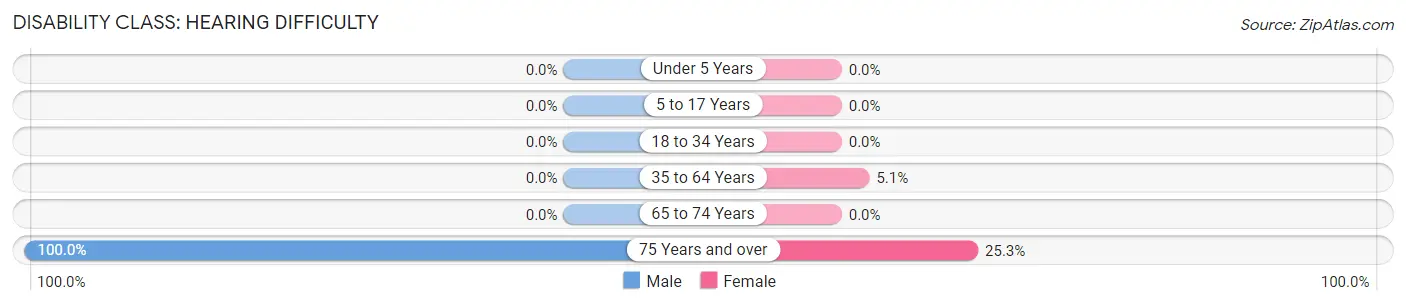
| Age Bracket | Male | Female |
| Under 5 Years | 0 (0.0%) | 0 (0.0%) |
| 5 to 17 Years | 0 (0.0%) | 0 (0.0%) |
| 18 to 34 Years | 0 (0.0%) | 0 (0.0%) |
| 35 to 64 Years | 0 (0.0%) | 10 (5.1%) |
| 65 to 74 Years | 0 (0.0%) | 0 (0.0%) |
| 75 Years and over | 15 (100.0%) | 21 (25.3%) |
Disability Class: Vision Difficulty
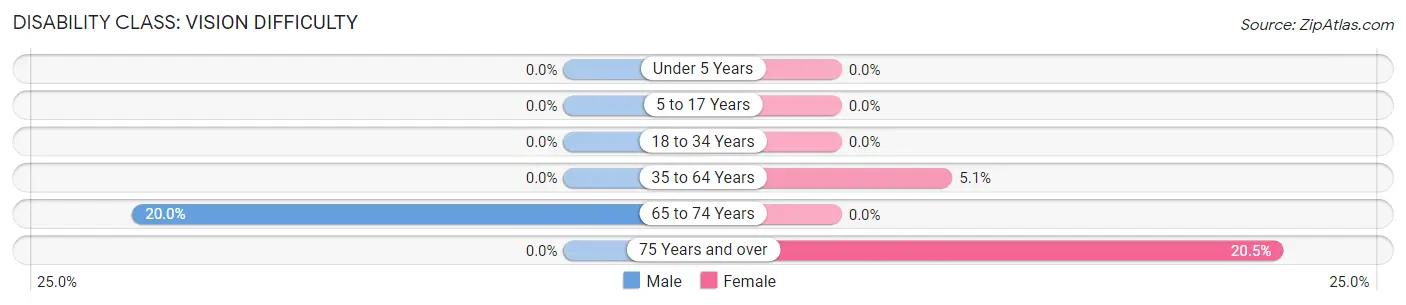
| Age Bracket | Male | Female |
| Under 5 Years | 0 (0.0%) | 0 (0.0%) |
| 5 to 17 Years | 0 (0.0%) | 0 (0.0%) |
| 18 to 34 Years | 0 (0.0%) | 0 (0.0%) |
| 35 to 64 Years | 0 (0.0%) | 10 (5.1%) |
| 65 to 74 Years | 5 (20.0%) | 0 (0.0%) |
| 75 Years and over | 0 (0.0%) | 17 (20.5%) |
Disability Class: Cognitive Difficulty
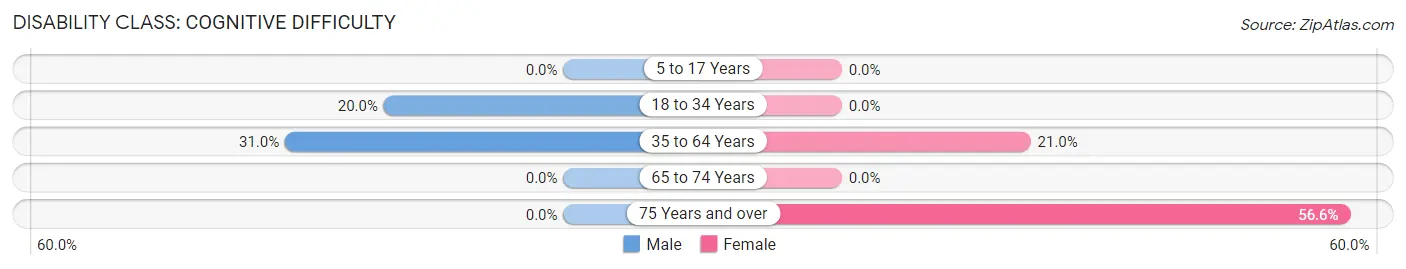
| Age Bracket | Male | Female |
| 5 to 17 Years | 0 (0.0%) | 0 (0.0%) |
| 18 to 34 Years | 21 (20.0%) | 0 (0.0%) |
| 35 to 64 Years | 22 (31.0%) | 41 (21.0%) |
| 65 to 74 Years | 0 (0.0%) | 0 (0.0%) |
| 75 Years and over | 0 (0.0%) | 47 (56.6%) |
Disability Class: Ambulatory Difficulty
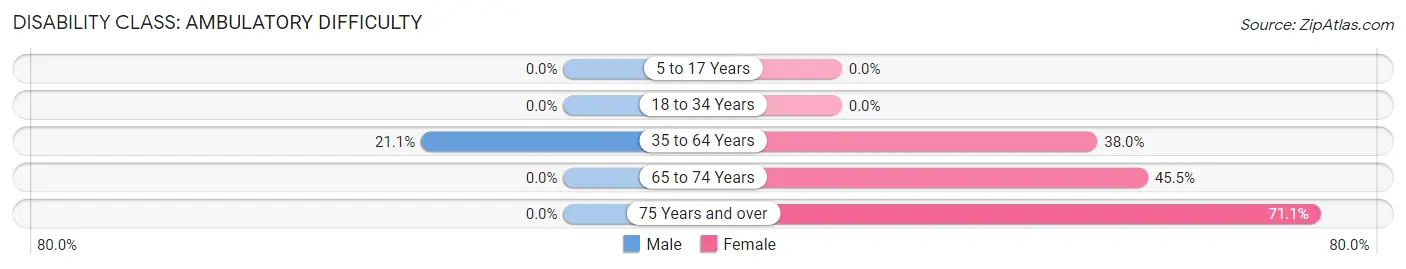
| Age Bracket | Male | Female |
| 5 to 17 Years | 0 (0.0%) | 0 (0.0%) |
| 18 to 34 Years | 0 (0.0%) | 0 (0.0%) |
| 35 to 64 Years | 15 (21.1%) | 74 (38.0%) |
| 65 to 74 Years | 0 (0.0%) | 35 (45.5%) |
| 75 Years and over | 0 (0.0%) | 59 (71.1%) |
Disability Class: Self-Care Difficulty
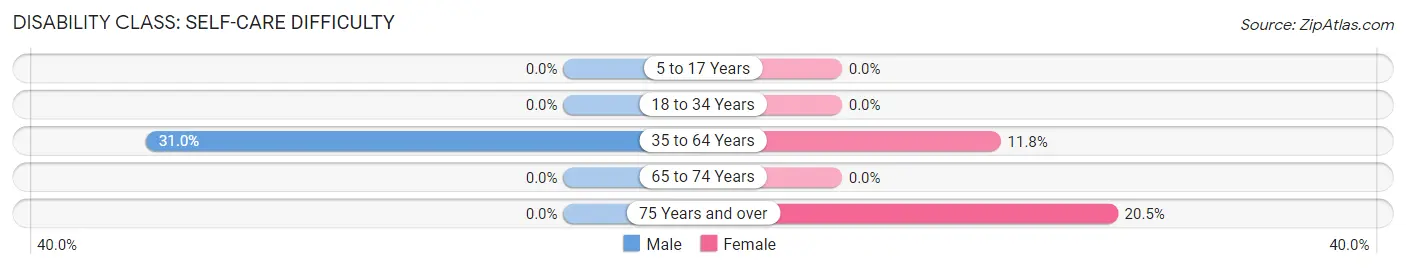
| Age Bracket | Male | Female |
| 5 to 17 Years | 0 (0.0%) | 0 (0.0%) |
| 18 to 34 Years | 0 (0.0%) | 0 (0.0%) |
| 35 to 64 Years | 22 (31.0%) | 23 (11.8%) |
| 65 to 74 Years | 0 (0.0%) | 0 (0.0%) |
| 75 Years and over | 0 (0.0%) | 17 (20.5%) |
Technology Access in Laurel Hill
Computing Device Access in Laurel Hill
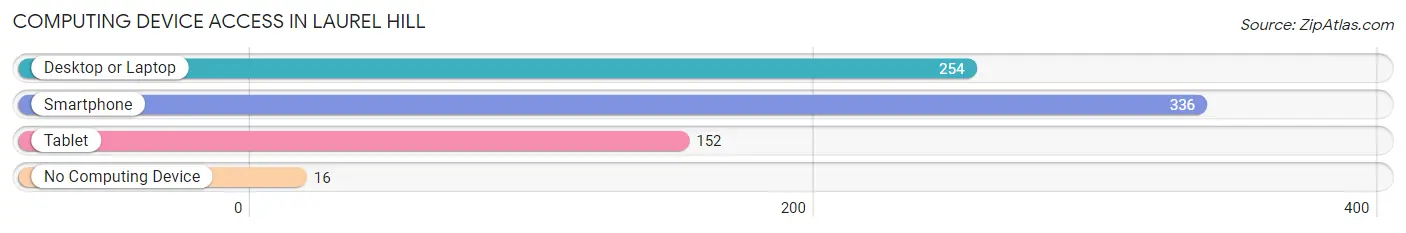
| Device Type | # Households | % Households |
| Desktop or Laptop | 254 | 68.8% |
| Smartphone | 336 | 91.1% |
| Tablet | 152 | 41.2% |
| No Computing Device | 16 | 4.3% |
| Total | 369 | 100.0% |
Internet Access in Laurel Hill
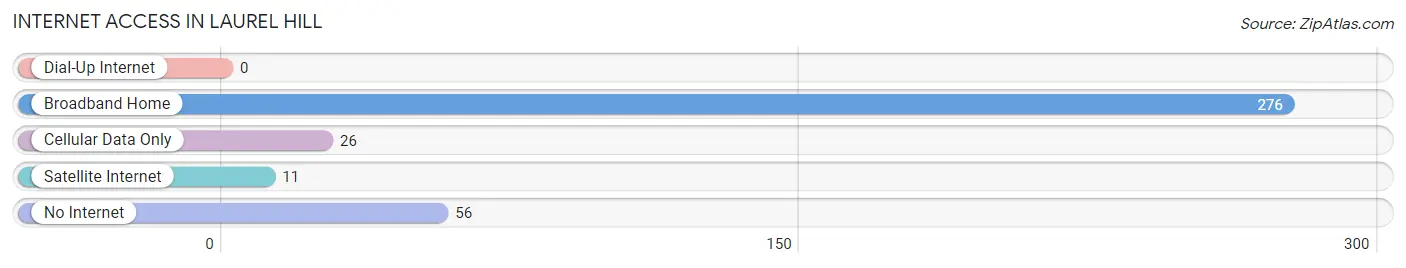
| Internet Type | # Households | % Households |
| Dial-Up Internet | 0 | 0.0% |
| Broadband Home | 276 | 74.8% |
| Cellular Data Only | 26 | 7.0% |
| Satellite Internet | 11 | 3.0% |
| No Internet | 56 | 15.2% |
| Total | 369 | 100.0% |
Laurel Hill Summary
Laurel Hill is a small town located in Scotland County, North Carolina. It is situated on the banks of the Lumber River, which is a tributary of the Cape Fear River. The town was founded in 1845 and is named after the laurel trees that grow in the area. The population of Laurel Hill was 1,845 at the 2010 census.
Geography
Laurel Hill is located at 34°45'25" North, 79°20'25" West (34.7569, -79.3402). It is situated on the banks of the Lumber River, which is a tributary of the Cape Fear River. The town is located in the Sandhills region of North Carolina, which is characterized by rolling hills and sandy soils. The town is located in Scotland County, which is part of the Fayetteville, North Carolina metropolitan area.
The town has a total area of 1.3 square miles, all of which is land. The terrain is mostly flat, with some rolling hills. The town is located in the humid subtropical climate zone, with hot, humid summers and mild winters.
History
Laurel Hill was founded in 1845 by a group of settlers from Scotland. The town was named after the laurel trees that grew in the area. The town was originally a farming community, but it soon became a center for the lumber industry. The town was incorporated in 1887.
In the early 20th century, the town was a major producer of lumber and turpentine. The town also had a thriving textile industry, with several mills located in the area. The town was also home to a number of other businesses, including a furniture factory, a brickyard, and a canning factory.
The town experienced a period of decline in the mid-20th century, as the lumber and textile industries moved away. The town was revitalized in the late 20th century, with the opening of a new industrial park and the development of a number of new businesses.
Economy
The economy of Laurel Hill is largely based on manufacturing and agriculture. The town is home to a number of manufacturing companies, including a furniture factory, a brickyard, and a canning factory. The town is also home to a number of agricultural businesses, including a dairy farm and a poultry farm.
The town is also home to a number of retail businesses, including a grocery store, a hardware store, and a number of restaurants. The town is also home to a number of service businesses, including a bank, a post office, and a number of medical offices.
Demographics
As of the 2010 census, the population of Laurel Hill was 1,845. The racial makeup of the town was 79.3% White, 17.2% African American, 0.7% Native American, 0.3% Asian, 0.1% Pacific Islander, and 2.4% from other races. The median household income was $30,938, and the median family income was $37,813.
The town is served by the Scotland County School District, which includes two elementary schools, a middle school, and a high school. The town is also home to a number of churches, including Baptist, Methodist, and Presbyterian.
Conclusion
Laurel Hill is a small town located in Scotland County, North Carolina. It is situated on the banks of the Lumber River, which is a tributary of the Cape Fear River. The town was founded in 1845 and is named after the laurel trees that grow in the area. The population of Laurel Hill was 1,845 at the 2010 census. The economy of the town is largely based on manufacturing and agriculture, and the town is home to a number of retail businesses and service businesses. The town is served by the Scotland County School District, and is home to a number of churches.
Common Questions
What is Per Capita Income in Laurel Hill?
Per Capita income in Laurel Hill is $13,985.
What is the Median Family Income in Laurel Hill?
Median Family Income in Laurel Hill is $28,361.
What is the Median Household income in Laurel Hill?
Median Household Income in Laurel Hill is $23,086.
What is Income or Wage Gap in Laurel Hill?
Income or Wage Gap in Laurel Hill is 21.3%.
Women in Laurel Hill earn 78.7 cents for every dollar earned by a man.
What is Inequality or Gini Index in Laurel Hill?
Inequality or Gini Index in Laurel Hill is 0.45.
What is the Total Population of Laurel Hill?
Total Population of Laurel Hill is 869.
What is the Total Male Population of Laurel Hill?
Total Male Population of Laurel Hill is 294.
What is the Total Female Population of Laurel Hill?
Total Female Population of Laurel Hill is 575.
What is the Ratio of Males per 100 Females in Laurel Hill?
There are 51.13 Males per 100 Females in Laurel Hill.
What is the Ratio of Females per 100 Males in Laurel Hill?
There are 195.58 Females per 100 Males in Laurel Hill.
What is the Median Population Age in Laurel Hill?
Median Population Age in Laurel Hill is 40.6 Years.
What is the Average Family Size in Laurel Hill
Average Family Size in Laurel Hill is 3.1 People.
What is the Average Household Size in Laurel Hill
Average Household Size in Laurel Hill is 2.4 People.
How Large is the Labor Force in Laurel Hill?
There are 279 People in the Labor Forcein in Laurel Hill.
What is the Percentage of People in the Labor Force in Laurel Hill?
42.7% of People are in the Labor Force in Laurel Hill.
What is the Unemployment Rate in Laurel Hill?
Unemployment Rate in Laurel Hill is 17.9%.