Tar Heel, NC Map & Demographics
Tar Heel Map
Tar Heel Overview
$19,714
PER CAPITA INCOME
$57,000
AVG FAMILY INCOME
54.8%
WAGE / INCOME GAP [ % ]
45.2¢/ $1
WAGE / INCOME GAP [ $ ]
0.41
INEQUALITY / GINI INDEX
104
TOTAL POPULATION
58
MALE POPULATION
46
FEMALE POPULATION
126.09
MALES / 100 FEMALES
79.31
FEMALES / 100 MALES
38.4
MEDIAN AGE
2.9
AVG FAMILY SIZE
2.2
AVG HOUSEHOLD SIZE
27
LABOR FORCE [ PEOPLE ]
35.5%
PERCENT IN LABOR FORCE
Tar Heel Zip Codes
Tar Heel Area Codes
Income in Tar Heel
Income Overview in Tar Heel
| Characteristic | Number | Measure |
| Per Capita Income | 104 | $19,714 |
| Median Family Income | 26 | $57,000 |
| Mean Family Income | 26 | $56,800 |
| Median Household Income | 47 | $0 |
| Mean Household Income | 47 | $45,566 |
| Income Deficit | 26 | $0 |
| Wage / Income Gap (%) | 104 | 54.82% |
| Wage / Income Gap ($) | 104 | 45.18¢ per $1 |
| Gini / Inequality Index | 104 | 0.41 |
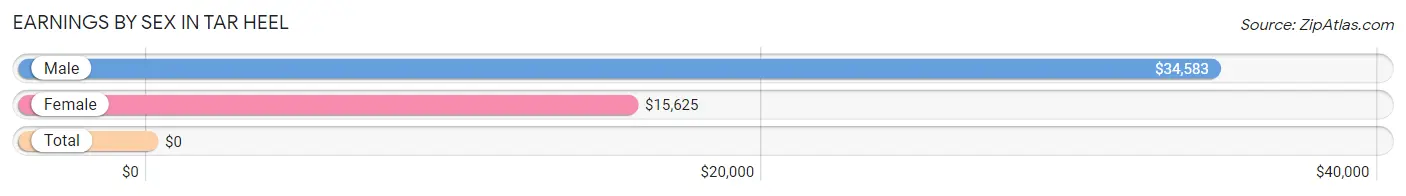
Earnings by Sex in Tar Heel
| Sex | Number | Average Earnings |
| Male | 24 (60.0%) | $34,583 |
| Female | 16 (40.0%) | $15,625 |
| Total | 40 (100.0%) | $0 |
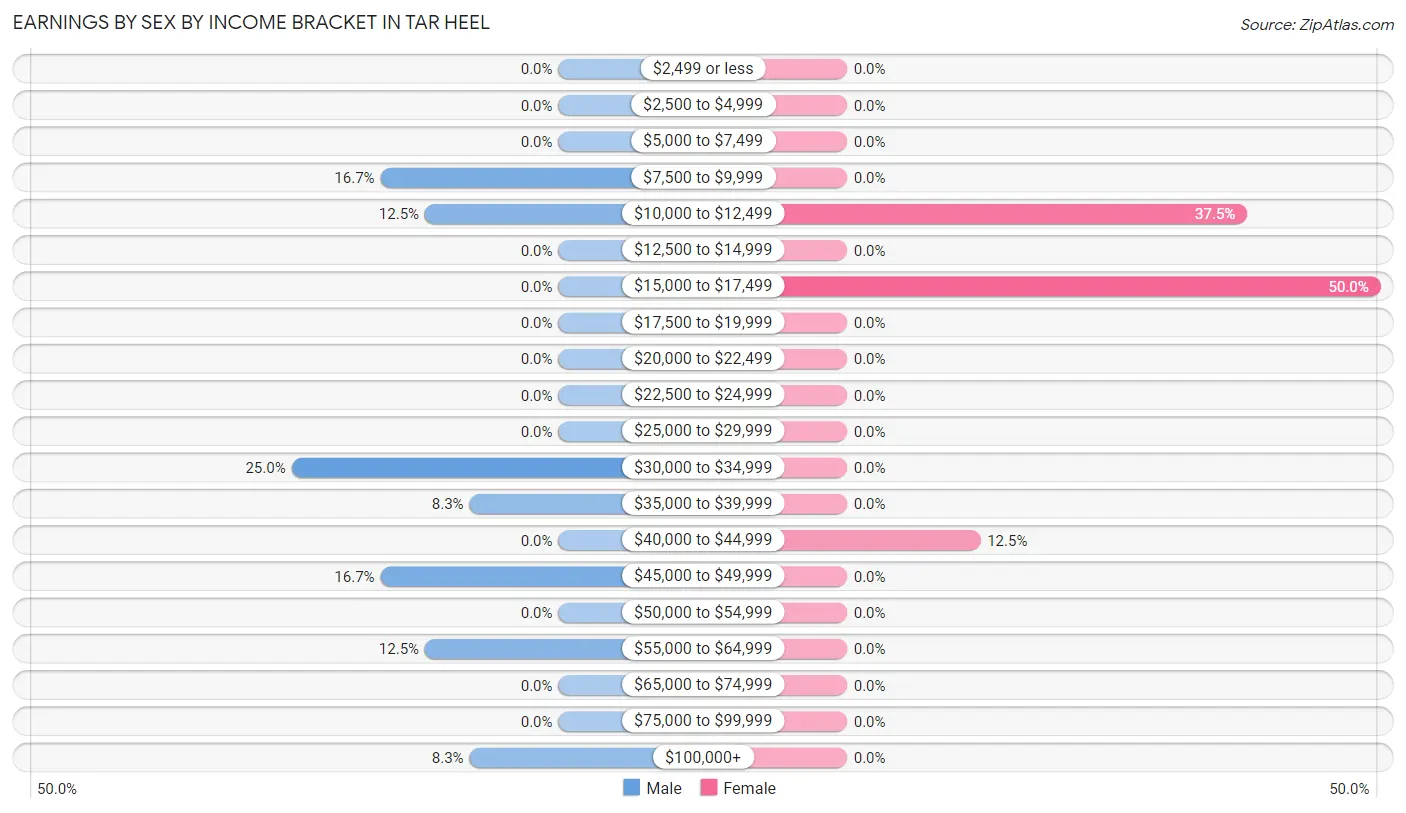
Earnings by Sex by Income Bracket in Tar Heel
The most common earnings brackets in Tar Heel are $30,000 to $34,999 for men (6 | 25.0%) and $15,000 to $17,499 for women (8 | 50.0%).
| Income | Male | Female |
| $2,499 or less | 0 (0.0%) | 0 (0.0%) |
| $2,500 to $4,999 | 0 (0.0%) | 0 (0.0%) |
| $5,000 to $7,499 | 0 (0.0%) | 0 (0.0%) |
| $7,500 to $9,999 | 4 (16.7%) | 0 (0.0%) |
| $10,000 to $12,499 | 3 (12.5%) | 6 (37.5%) |
| $12,500 to $14,999 | 0 (0.0%) | 0 (0.0%) |
| $15,000 to $17,499 | 0 (0.0%) | 8 (50.0%) |
| $17,500 to $19,999 | 0 (0.0%) | 0 (0.0%) |
| $20,000 to $22,499 | 0 (0.0%) | 0 (0.0%) |
| $22,500 to $24,999 | 0 (0.0%) | 0 (0.0%) |
| $25,000 to $29,999 | 0 (0.0%) | 0 (0.0%) |
| $30,000 to $34,999 | 6 (25.0%) | 0 (0.0%) |
| $35,000 to $39,999 | 2 (8.3%) | 0 (0.0%) |
| $40,000 to $44,999 | 0 (0.0%) | 2 (12.5%) |
| $45,000 to $49,999 | 4 (16.7%) | 0 (0.0%) |
| $50,000 to $54,999 | 0 (0.0%) | 0 (0.0%) |
| $55,000 to $64,999 | 3 (12.5%) | 0 (0.0%) |
| $65,000 to $74,999 | 0 (0.0%) | 0 (0.0%) |
| $75,000 to $99,999 | 0 (0.0%) | 0 (0.0%) |
| $100,000+ | 2 (8.3%) | 0 (0.0%) |
| Total | 24 (100.0%) | 16 (100.0%) |
Earnings by Sex by Educational Attainment in Tar Heel
| Educational Attainment | Male Income | Female Income |
| Less than High School | - | - |
| High School Diploma | - | - |
| College or Associate's Degree | - | - |
| Bachelor's Degree | - | - |
| Graduate Degree | - | - |
| Total | $34,750 | $15,625 |
Family Income in Tar Heel
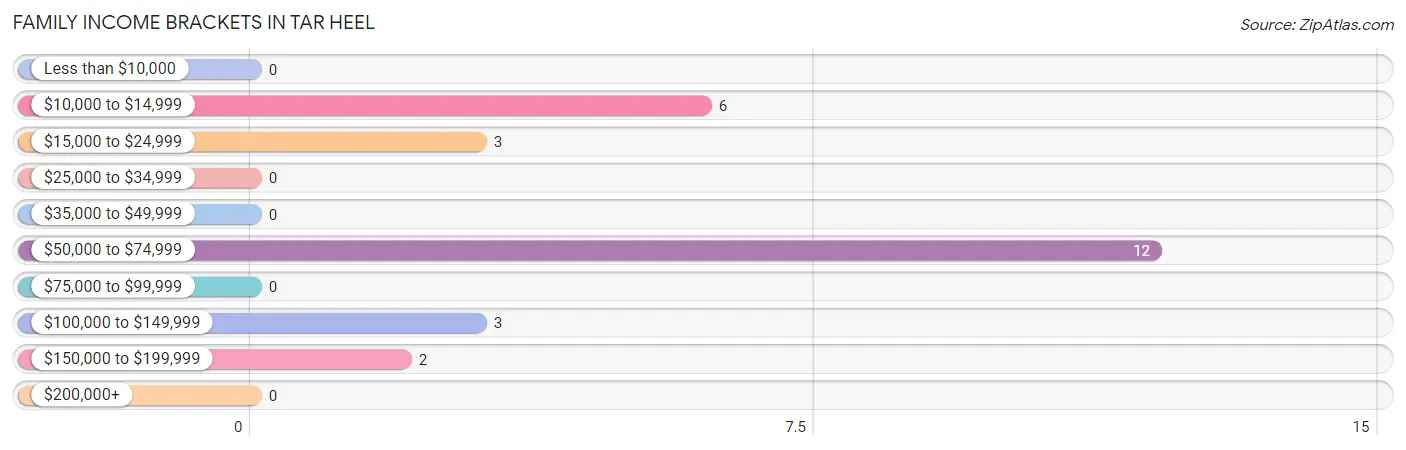
Family Income Brackets in Tar Heel
According to the Tar Heel family income data, there are 12 families falling into the $50,000 to $74,999 income range, which is the most common income bracket and makes up 46.2% of all families.
| Income Bracket | # Families | % Families |
| Less than $10,000 | 0 | 0.0% |
| $10,000 to $14,999 | 6 | 23.1% |
| $15,000 to $24,999 | 3 | 11.5% |
| $25,000 to $34,999 | 0 | 0.0% |
| $35,000 to $49,999 | 0 | 0.0% |
| $50,000 to $74,999 | 12 | 46.2% |
| $75,000 to $99,999 | 0 | 0.0% |
| $100,000 to $149,999 | 3 | 11.5% |
| $150,000 to $199,999 | 2 | 7.7% |
| $200,000+ | 0 | 0.0% |
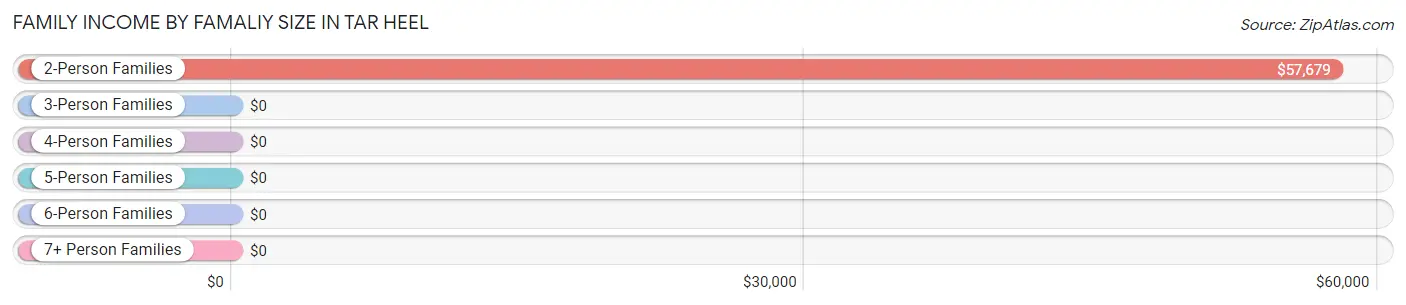
Family Income by Famaliy Size in Tar Heel
2-person families (17 | 65.4%) account for the highest median family income in Tar Heel with $57,679 per family, while 2-person families (17 | 65.4%) have the highest median income of $28,840 per family member.
| Income Bracket | # Families | Median Income |
| 2-Person Families | 17 (65.4%) | $57,679 |
| 3-Person Families | 0 (0.0%) | $0 |
| 4-Person Families | 3 (11.5%) | $0 |
| 5-Person Families | 6 (23.1%) | $0 |
| 6-Person Families | 0 (0.0%) | $0 |
| 7+ Person Families | 0 (0.0%) | $0 |
| Total | 26 (100.0%) | $57,000 |
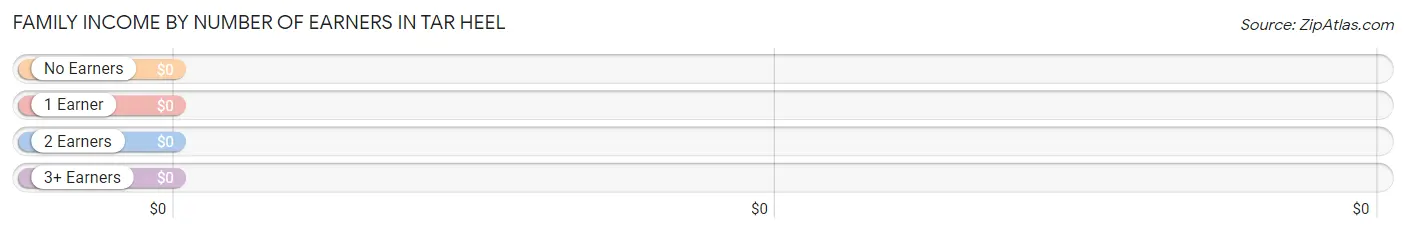
Family Income by Number of Earners in Tar Heel
| Number of Earners | # Families | Median Income |
| No Earners | 7 (26.9%) | $0 |
| 1 Earner | 16 (61.5%) | $0 |
| 2 Earners | 3 (11.5%) | $0 |
| 3+ Earners | 0 (0.0%) | $0 |
| Total | 26 (100.0%) | $57,000 |
Household Income in Tar Heel
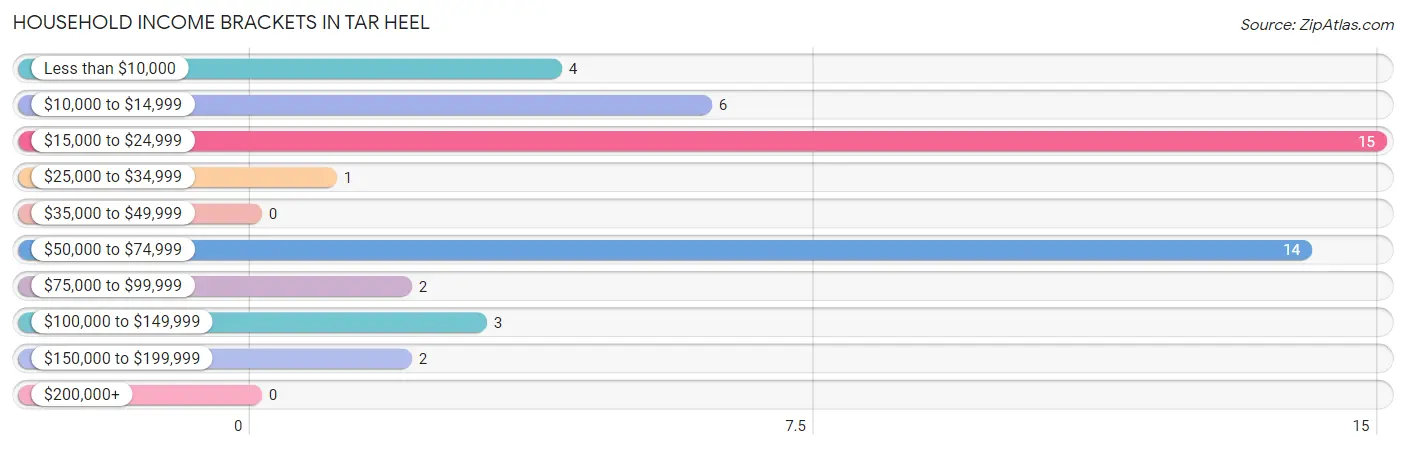
Household Income Brackets in Tar Heel
With 15 households falling in the category, the $15,000 to $24,999 income range is the most frequent in Tar Heel, accounting for 31.9% of all households.
| Income Bracket | # Households | % Households |
| Less than $10,000 | 4 | 8.5% |
| $10,000 to $14,999 | 6 | 12.8% |
| $15,000 to $24,999 | 15 | 31.9% |
| $25,000 to $34,999 | 1 | 2.1% |
| $35,000 to $49,999 | 0 | 0.0% |
| $50,000 to $74,999 | 14 | 29.8% |
| $75,000 to $99,999 | 2 | 4.3% |
| $100,000 to $149,999 | 3 | 6.4% |
| $150,000 to $199,999 | 2 | 4.3% |
| $200,000+ | 0 | 0.0% |
Household Income by Householder Age in Tar Heel
The median household income in Tar Heel is $0, with the highest median household income of $57,857 found in the 65+ years age bracket for the primary householder. A total of 20 households (42.5%) fall into this category. Meanwhile, the 15 to 24 years age bracket for the primary householder has the lowest median household income of $0, with 1 households (2.1%) in this group.
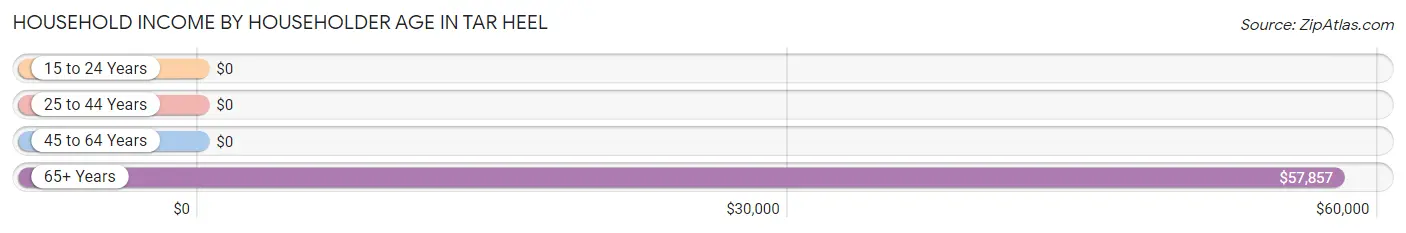
| Income Bracket | # Households | Median Income |
| 15 to 24 Years | 1 (2.1%) | $0 |
| 25 to 44 Years | 15 (31.9%) | $0 |
| 45 to 64 Years | 11 (23.4%) | $0 |
| 65+ Years | 20 (42.5%) | $57,857 |
| Total | 47 (100.0%) | $0 |
Poverty in Tar Heel
Income Below Poverty by Sex and Age in Tar Heel
With 44.8% poverty level for males and 28.3% for females among the residents of Tar Heel, under 5 year old males and 12 to 14 year old females are the most vulnerable to poverty, with 4 males (100.0%) and 7 females (100.0%) in their respective age groups living below the poverty level.
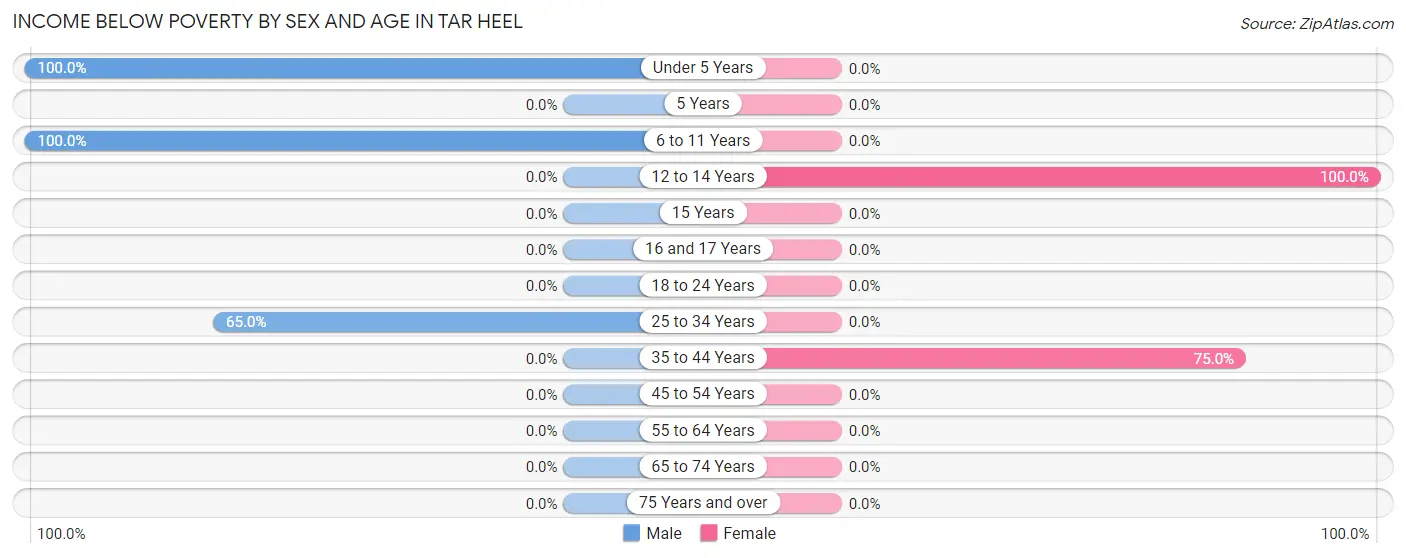
| Age Bracket | Male | Female |
| Under 5 Years | 4 (100.0%) | 0 (0.0%) |
| 5 Years | 0 (0.0%) | 0 (0.0%) |
| 6 to 11 Years | 9 (100.0%) | 0 (0.0%) |
| 12 to 14 Years | 0 (0.0%) | 7 (100.0%) |
| 15 Years | 0 (0.0%) | 0 (0.0%) |
| 16 and 17 Years | 0 (0.0%) | 0 (0.0%) |
| 18 to 24 Years | 0 (0.0%) | 0 (0.0%) |
| 25 to 34 Years | 13 (65.0%) | 0 (0.0%) |
| 35 to 44 Years | 0 (0.0%) | 6 (75.0%) |
| 45 to 54 Years | 0 (0.0%) | 0 (0.0%) |
| 55 to 64 Years | 0 (0.0%) | 0 (0.0%) |
| 65 to 74 Years | 0 (0.0%) | 0 (0.0%) |
| 75 Years and over | 0 (0.0%) | 0 (0.0%) |
| Total | 26 (44.8%) | 13 (28.3%) |
Income Above Poverty by Sex and Age in Tar Heel
According to the poverty statistics in Tar Heel, males aged 12 to 14 years and females aged 6 to 11 years are the age groups that are most secure financially, with 100.0% of males and 100.0% of females in these age groups living above the poverty line.
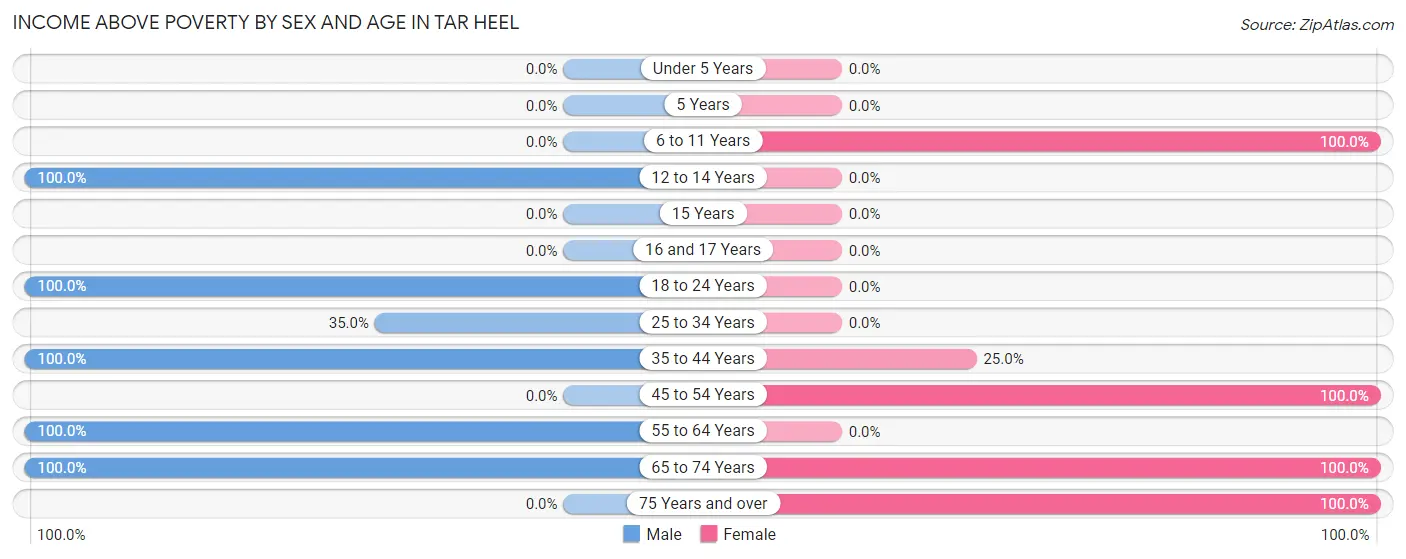
| Age Bracket | Male | Female |
| Under 5 Years | 0 (0.0%) | 0 (0.0%) |
| 5 Years | 0 (0.0%) | 0 (0.0%) |
| 6 to 11 Years | 0 (0.0%) | 3 (100.0%) |
| 12 to 14 Years | 5 (100.0%) | 0 (0.0%) |
| 15 Years | 0 (0.0%) | 0 (0.0%) |
| 16 and 17 Years | 0 (0.0%) | 0 (0.0%) |
| 18 to 24 Years | 1 (100.0%) | 0 (0.0%) |
| 25 to 34 Years | 7 (35.0%) | 0 (0.0%) |
| 35 to 44 Years | 3 (100.0%) | 2 (25.0%) |
| 45 to 54 Years | 0 (0.0%) | 8 (100.0%) |
| 55 to 64 Years | 7 (100.0%) | 0 (0.0%) |
| 65 to 74 Years | 9 (100.0%) | 16 (100.0%) |
| 75 Years and over | 0 (0.0%) | 4 (100.0%) |
| Total | 32 (55.2%) | 33 (71.7%) |
Income Below Poverty Among Married-Couple Families in Tar Heel
The poverty statistics for married-couple families in Tar Heel show that 23.1% or 6 of the total 26 families live below the poverty line. Families with 3 or 4 children have the highest poverty rate of 100.0%, comprising of 6 families. On the other hand, families with no children have the lowest poverty rate of 0.0%, which includes 0 families.
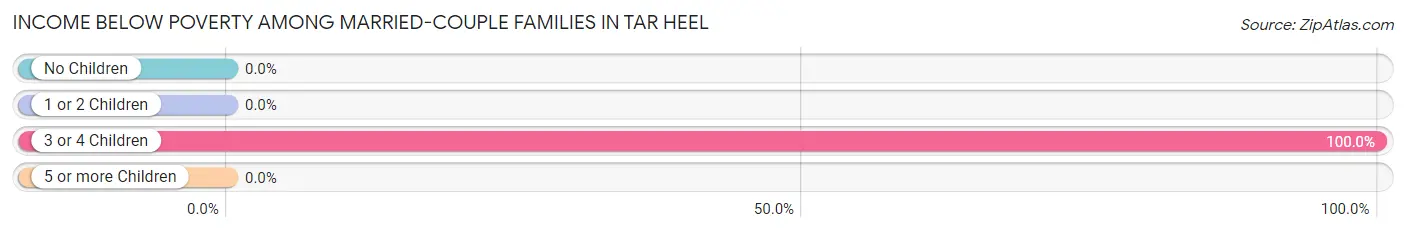
| Children | Above Poverty | Below Poverty |
| No Children | 17 (100.0%) | 0 (0.0%) |
| 1 or 2 Children | 3 (100.0%) | 0 (0.0%) |
| 3 or 4 Children | 0 (0.0%) | 6 (100.0%) |
| 5 or more Children | 0 (0.0%) | 0 (0.0%) |
| Total | 20 (76.9%) | 6 (23.1%) |
Income Below Poverty Among Single-Parent Households in Tar Heel
| Children | Single Father | Single Mother |
| No Children | 0 (0.0%) | 0 (0.0%) |
| 1 or 2 Children | 0 (0.0%) | 0 (0.0%) |
| 3 or 4 Children | 0 (0.0%) | 0 (0.0%) |
| 5 or more Children | 0 (0.0%) | 0 (0.0%) |
| Total | 0 (0.0%) | 0 (0.0%) |
Income Below Poverty Among Married-Couple vs Single-Parent Households in Tar Heel
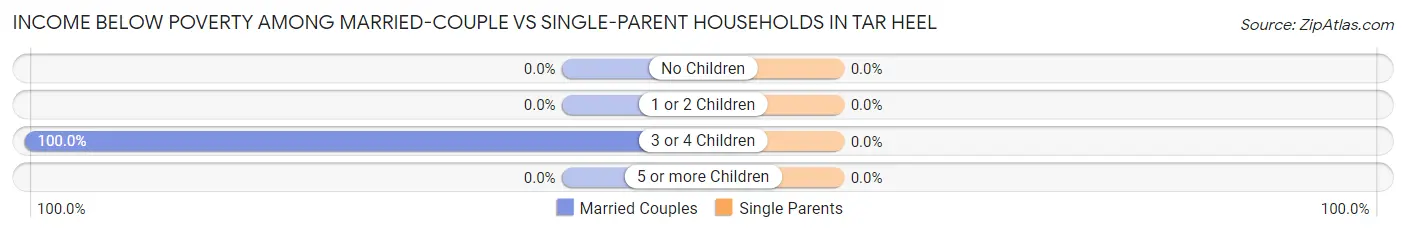
| Children | Married-Couple Families | Single-Parent Households |
| No Children | 0 (0.0%) | 0 (0.0%) |
| 1 or 2 Children | 0 (0.0%) | 0 (0.0%) |
| 3 or 4 Children | 6 (100.0%) | 0 (0.0%) |
| 5 or more Children | 0 (0.0%) | 0 (0.0%) |
| Total | 6 (23.1%) | 0 (0.0%) |
Race in Tar Heel
The most populous races in Tar Heel are White / Caucasian (103 | 99.0%), and Two or more Races (1 | 1.0%).
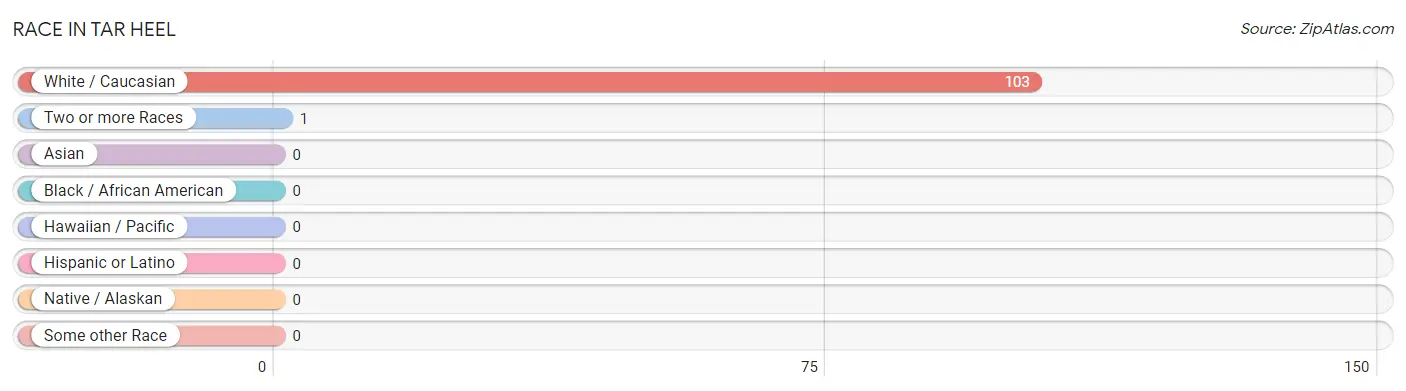
| Race | # Population | % Population |
| Asian | 0 | 0.0% |
| Black / African American | 0 | 0.0% |
| Hawaiian / Pacific | 0 | 0.0% |
| Hispanic or Latino | 0 | 0.0% |
| Native / Alaskan | 0 | 0.0% |
| White / Caucasian | 103 | 99.0% |
| Two or more Races | 1 | 1.0% |
| Some other Race | 0 | 0.0% |
| Total | 104 | 100.0% |
Ancestry in Tar Heel
The most populous ancestries reported in Tar Heel are American (66 | 63.5%), French (6 | 5.8%), European (4 | 3.8%), Polish (2 | 1.9%), and Burmese (1 | 1.0%), together accounting for 76.0% of all Tar Heel residents.
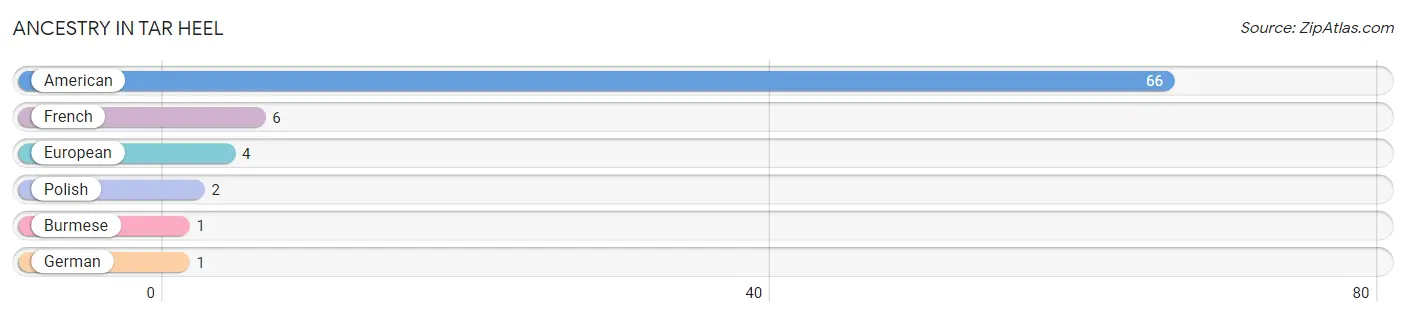
| Ancestry | # Population | % Population |
| American | 66 | 63.5% |
| Burmese | 1 | 1.0% |
| European | 4 | 3.8% |
| French | 6 | 5.8% |
| German | 1 | 1.0% |
| Polish | 2 | 1.9% | View All 6 Rows |
Immigrants in Tar Heel

| Immigration Origin | # Population | % Population | View All 0 Rows |
Sex and Age in Tar Heel
Sex and Age in Tar Heel
The most populous age groups in Tar Heel are 25 to 29 Years (11 | 19.0%) for men and 65 to 69 Years (16 | 34.8%) for women.
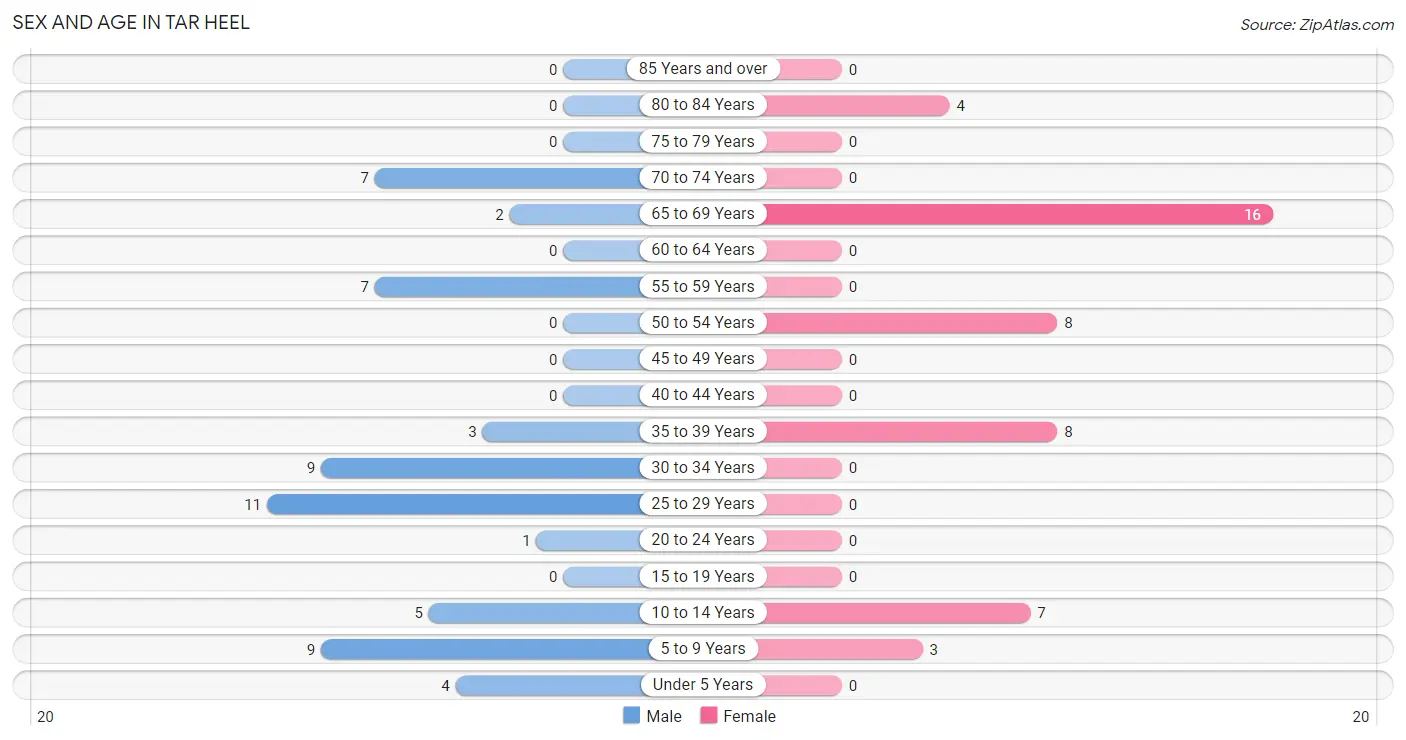
| Age Bracket | Male | Female |
| Under 5 Years | 4 (6.9%) | 0 (0.0%) |
| 5 to 9 Years | 9 (15.5%) | 3 (6.5%) |
| 10 to 14 Years | 5 (8.6%) | 7 (15.2%) |
| 15 to 19 Years | 0 (0.0%) | 0 (0.0%) |
| 20 to 24 Years | 1 (1.7%) | 0 (0.0%) |
| 25 to 29 Years | 11 (19.0%) | 0 (0.0%) |
| 30 to 34 Years | 9 (15.5%) | 0 (0.0%) |
| 35 to 39 Years | 3 (5.2%) | 8 (17.4%) |
| 40 to 44 Years | 0 (0.0%) | 0 (0.0%) |
| 45 to 49 Years | 0 (0.0%) | 0 (0.0%) |
| 50 to 54 Years | 0 (0.0%) | 8 (17.4%) |
| 55 to 59 Years | 7 (12.1%) | 0 (0.0%) |
| 60 to 64 Years | 0 (0.0%) | 0 (0.0%) |
| 65 to 69 Years | 2 (3.5%) | 16 (34.8%) |
| 70 to 74 Years | 7 (12.1%) | 0 (0.0%) |
| 75 to 79 Years | 0 (0.0%) | 0 (0.0%) |
| 80 to 84 Years | 0 (0.0%) | 4 (8.7%) |
| 85 Years and over | 0 (0.0%) | 0 (0.0%) |
| Total | 58 (100.0%) | 46 (100.0%) |
Families and Households in Tar Heel
Median Family Size in Tar Heel
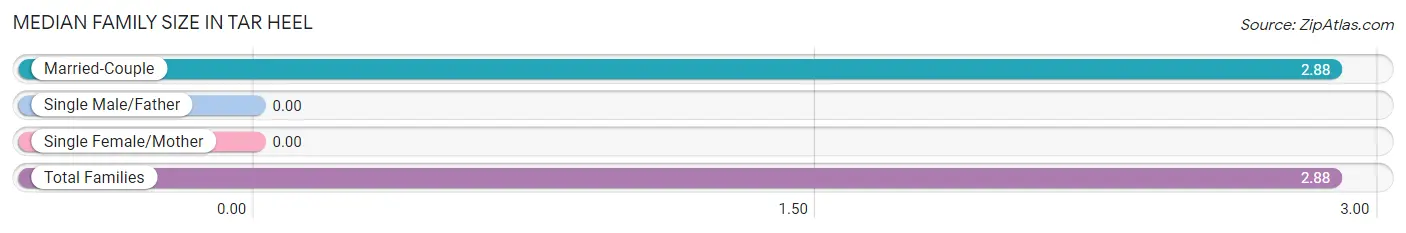
| Family Type | # Families | Family Size |
| Married-Couple | 26 (100.0%) | 2.88 |
| Single Male/Father | 0 (0.0%) | - |
| Single Female/Mother | 0 (0.0%) | - |
| Total Families | 26 (100.0%) | 2.88 |
Median Household Size in Tar Heel
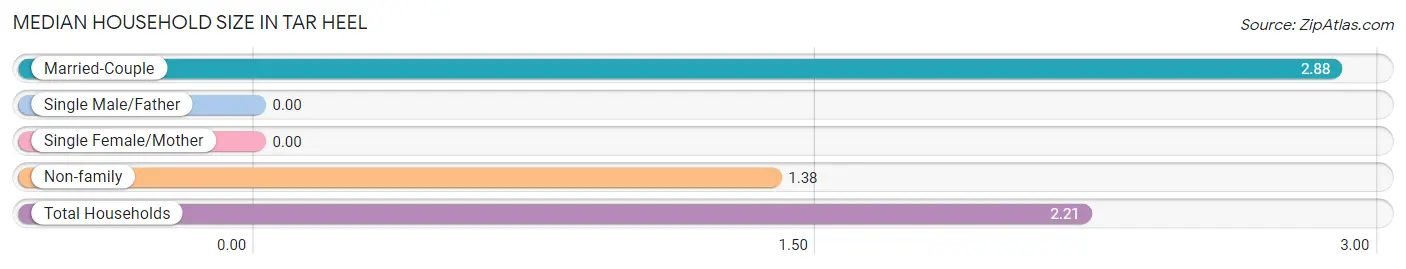
| Household Type | # Households | Household Size |
| Married-Couple | 26 (55.3%) | 2.88 |
| Single Male/Father | 0 (0.0%) | - |
| Single Female/Mother | 0 (0.0%) | - |
| Non-family | 21 (44.7%) | 1.38 |
| Total Households | 47 (100.0%) | 2.21 |
Household Size by Marriage Status in Tar Heel
Out of a total of 47 households in Tar Heel, 26 (55.3%) are family households, while 21 (44.7%) are nonfamily households. The most numerous type of family households are 2-person households, comprising 17, and the most common type of nonfamily households are 1-person households, comprising 11.
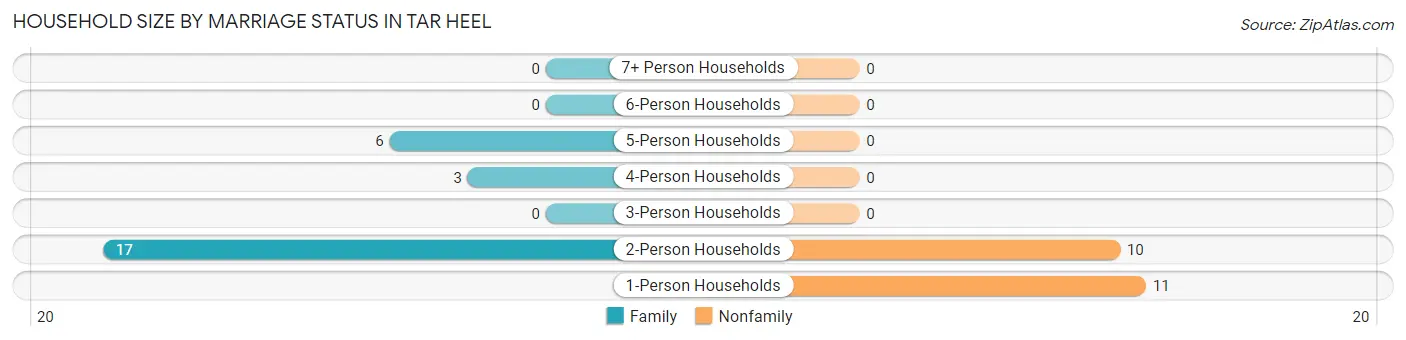
| Household Size | Family Households | Nonfamily Households |
| 1-Person Households | - | 11 (23.4%) |
| 2-Person Households | 17 (36.2%) | 10 (21.3%) |
| 3-Person Households | 0 (0.0%) | 0 (0.0%) |
| 4-Person Households | 3 (6.4%) | 0 (0.0%) |
| 5-Person Households | 6 (12.8%) | 0 (0.0%) |
| 6-Person Households | 0 (0.0%) | 0 (0.0%) |
| 7+ Person Households | 0 (0.0%) | 0 (0.0%) |
| Total | 26 (55.3%) | 21 (44.7%) |
Female Fertility in Tar Heel
Fertility by Age in Tar Heel
| Age Bracket | Women with Births | Births / 1,000 Women |
| 15 to 19 years | 0 (0.0%) | 0.0 |
| 20 to 34 years | 0 (0.0%) | 0.0 |
| 35 to 50 years | 0 (0.0%) | 0.0 |
| Total | 0 (0.0%) | 0.0 |
Fertility by Age by Marriage Status in Tar Heel
| Age Bracket | Married | Unmarried |
| 15 to 19 years | 0 (0.0%) | 0 (0.0%) |
| 20 to 34 years | 0 (0.0%) | 0 (0.0%) |
| 35 to 50 years | 0 (0.0%) | 0 (0.0%) |
| Total | 0 (0.0%) | 0 (0.0%) |
Fertility by Education in Tar Heel
| Educational Attainment | Women with Births | Births / 1,000 Women |
| Less than High School | 0 (0.0%) | 0.0 |
| High School Diploma | 0 (0.0%) | 0.0 |
| College or Associate's Degree | 0 (0.0%) | 0.0 |
| Bachelor's Degree | 0 (0.0%) | 0.0 |
| Graduate Degree | 0 (0.0%) | 0.0 |
| Total | 0 (0.0%) | 0.0 |
Fertility by Education by Marriage Status in Tar Heel
| Educational Attainment | Married | Unmarried |
| Less than High School | 0 (0.0%) | 0 (0.0%) |
| High School Diploma | 0 (0.0%) | 0 (0.0%) |
| College or Associate's Degree | 0 (0.0%) | 0 (0.0%) |
| Bachelor's Degree | 0 (0.0%) | 0 (0.0%) |
| Graduate Degree | 0 (0.0%) | 0 (0.0%) |
| Total | 0 (0.0%) | 0 (0.0%) |
Employment Characteristics in Tar Heel
Employment by Class of Employer in Tar Heel
Among the 27 employed individuals in Tar Heel, private company employees (25 | 92.6%), and self-employed (not incorporated) (2 | 7.4%) make up the most common classes of employment.
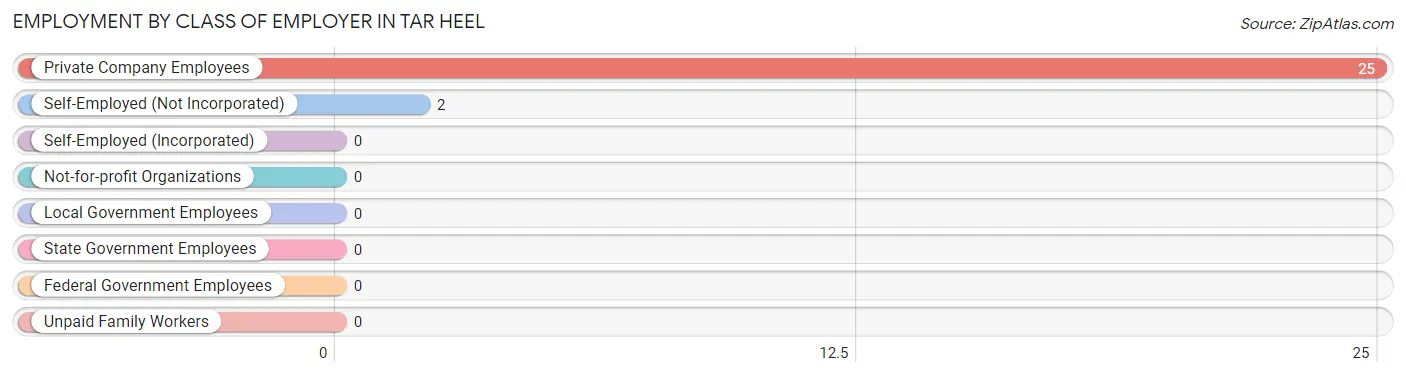
| Employer Class | # Employees | % Employees |
| Private Company Employees | 25 | 92.6% |
| Self-Employed (Incorporated) | 0 | 0.0% |
| Self-Employed (Not Incorporated) | 2 | 7.4% |
| Not-for-profit Organizations | 0 | 0.0% |
| Local Government Employees | 0 | 0.0% |
| State Government Employees | 0 | 0.0% |
| Federal Government Employees | 0 | 0.0% |
| Unpaid Family Workers | 0 | 0.0% |
| Total | 27 | 100.0% |
Employment Status by Age in Tar Heel
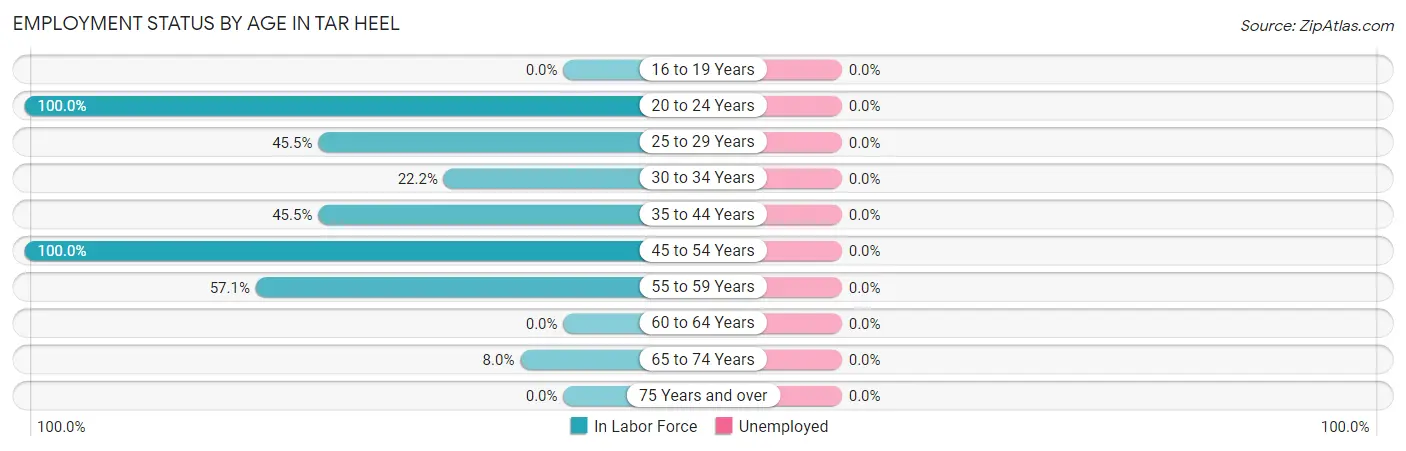
| Age Bracket | In Labor Force | Unemployed |
| 16 to 19 Years | 0 (0.0%) | 0 (0.0%) |
| 20 to 24 Years | 1 (100.0%) | 0 (0.0%) |
| 25 to 29 Years | 5 (45.5%) | 0 (0.0%) |
| 30 to 34 Years | 2 (22.2%) | 0 (0.0%) |
| 35 to 44 Years | 5 (45.5%) | 0 (0.0%) |
| 45 to 54 Years | 8 (100.0%) | 0 (0.0%) |
| 55 to 59 Years | 4 (57.1%) | 0 (0.0%) |
| 60 to 64 Years | 0 (0.0%) | 0 (0.0%) |
| 65 to 74 Years | 2 (8.0%) | 0 (0.0%) |
| 75 Years and over | 0 (0.0%) | 0 (0.0%) |
| Total | 27 (35.5%) | 0 (0.0%) |
Employment Status by Educational Attainment in Tar Heel
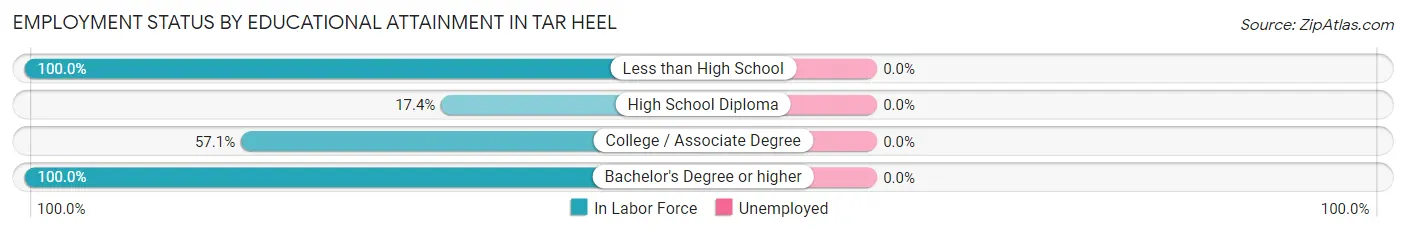
| Educational Attainment | In Labor Force | Unemployed |
| Less than High School | 11 (100.0%) | 0 (0.0%) |
| High School Diploma | 4 (17.4%) | 0 (0.0%) |
| College / Associate Degree | 4 (57.1%) | 0 (0.0%) |
| Bachelor's Degree or higher | 5 (100.0%) | 0 (0.0%) |
| Total | 24 (52.2%) | 0 (0.0%) |
Employment Occupations by Sex in Tar Heel
Management, Business, Science and Arts Occupations
The most common Management, Business, Science and Arts occupations in Tar Heel are Management (5 | 18.5%), Computers, Engineering & Science (1 | 3.7%), and Architecture & Engineering (1 | 3.7%).
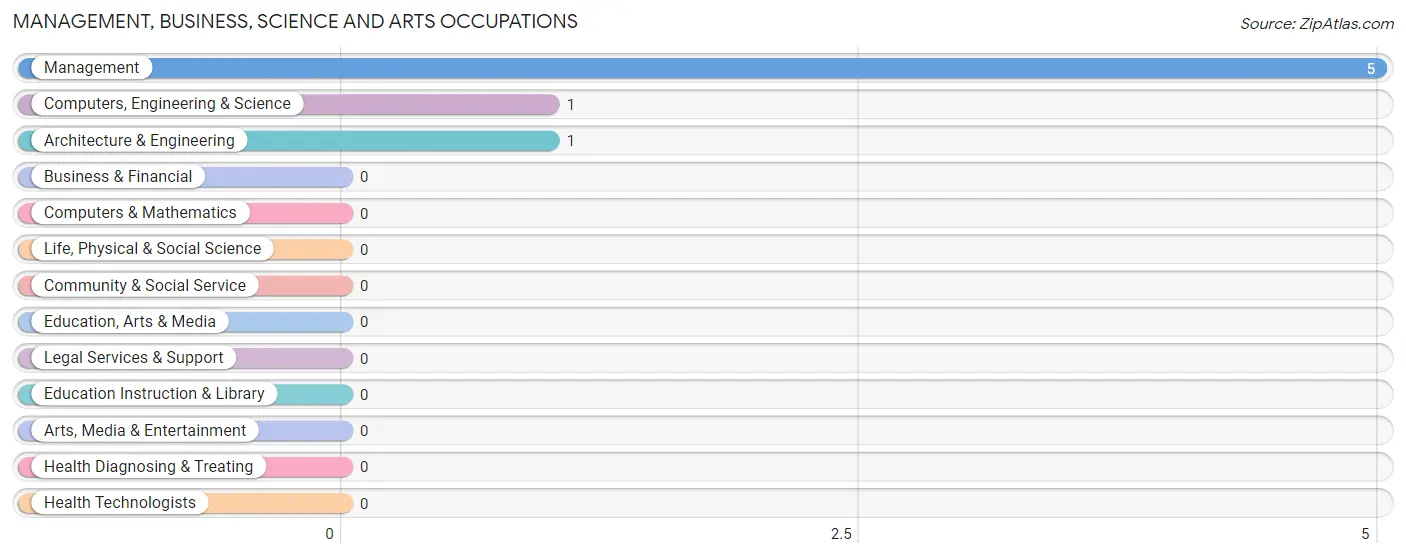
Management, Business, Science and Arts Occupations by Sex
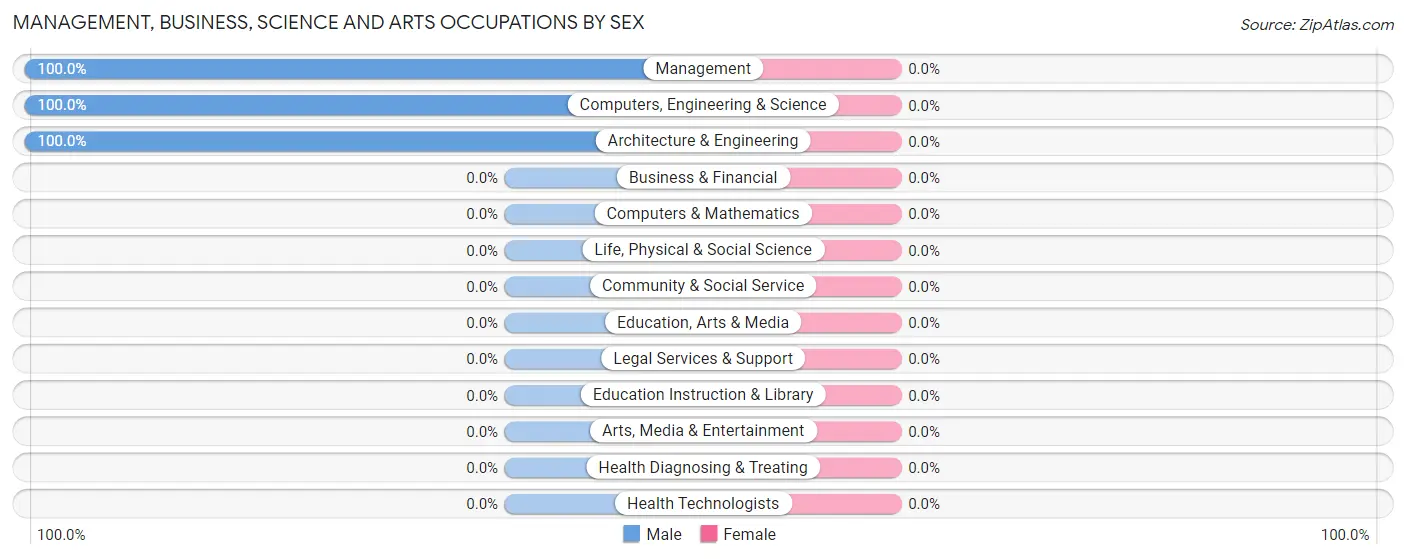
| Occupation | Male | Female |
| Management | 5 (100.0%) | 0 (0.0%) |
| Business & Financial | 0 (0.0%) | 0 (0.0%) |
| Computers, Engineering & Science | 1 (100.0%) | 0 (0.0%) |
| Computers & Mathematics | 0 (0.0%) | 0 (0.0%) |
| Architecture & Engineering | 1 (100.0%) | 0 (0.0%) |
| Life, Physical & Social Science | 0 (0.0%) | 0 (0.0%) |
| Community & Social Service | 0 (0.0%) | 0 (0.0%) |
| Education, Arts & Media | 0 (0.0%) | 0 (0.0%) |
| Legal Services & Support | 0 (0.0%) | 0 (0.0%) |
| Education Instruction & Library | 0 (0.0%) | 0 (0.0%) |
| Arts, Media & Entertainment | 0 (0.0%) | 0 (0.0%) |
| Health Diagnosing & Treating | 0 (0.0%) | 0 (0.0%) |
| Health Technologists | 0 (0.0%) | 0 (0.0%) |
| Total (Category) | 6 (100.0%) | 0 (0.0%) |
| Total (Overall) | 17 (63.0%) | 10 (37.0%) |
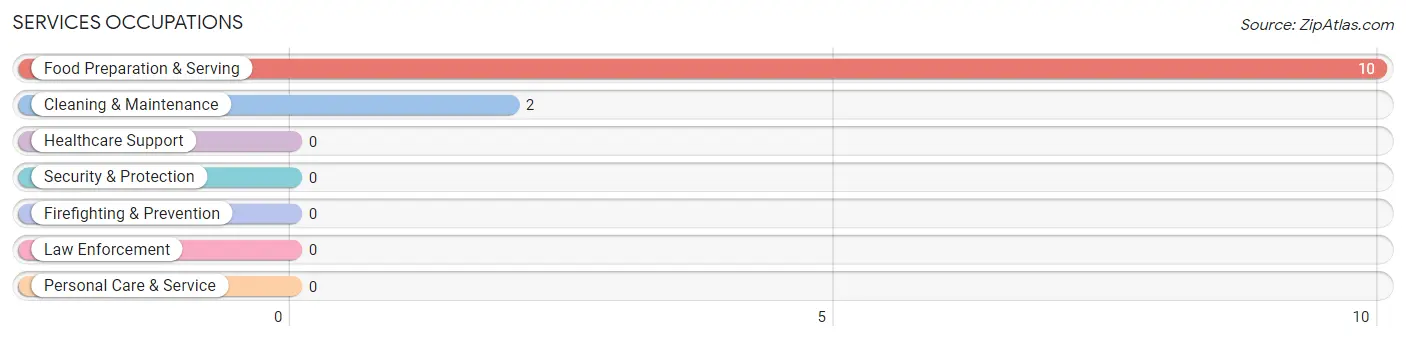
Services Occupations
The most common Services occupations in Tar Heel are Food Preparation & Serving (10 | 37.0%), and Cleaning & Maintenance (2 | 7.4%).
Services Occupations by Sex
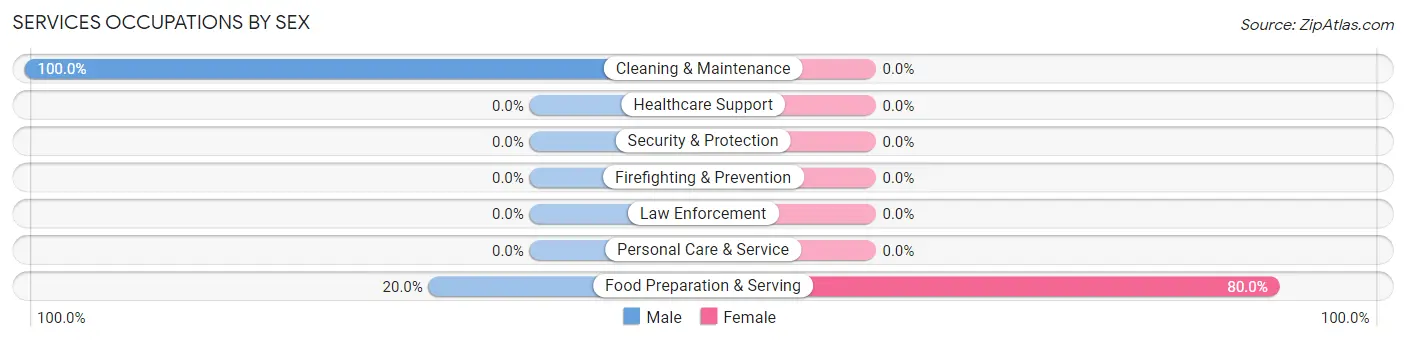
| Occupation | Male | Female |
| Healthcare Support | 0 (0.0%) | 0 (0.0%) |
| Security & Protection | 0 (0.0%) | 0 (0.0%) |
| Firefighting & Prevention | 0 (0.0%) | 0 (0.0%) |
| Law Enforcement | 0 (0.0%) | 0 (0.0%) |
| Food Preparation & Serving | 2 (20.0%) | 8 (80.0%) |
| Cleaning & Maintenance | 2 (100.0%) | 0 (0.0%) |
| Personal Care & Service | 0 (0.0%) | 0 (0.0%) |
| Total (Category) | 4 (33.3%) | 8 (66.7%) |
| Total (Overall) | 17 (63.0%) | 10 (37.0%) |
Sales and Office Occupations
The most common Sales and Office occupations in Tar Heel are , and Office & Administration (2 | 7.4%).
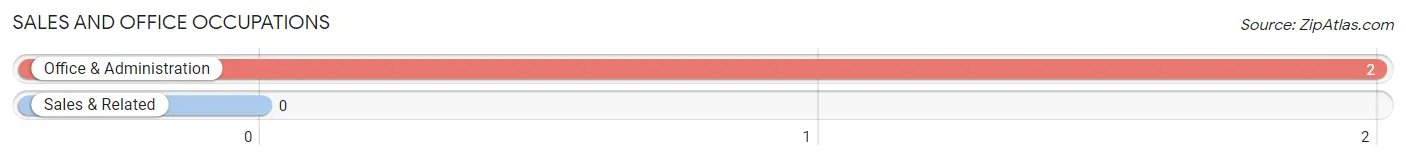
Sales and Office Occupations by Sex
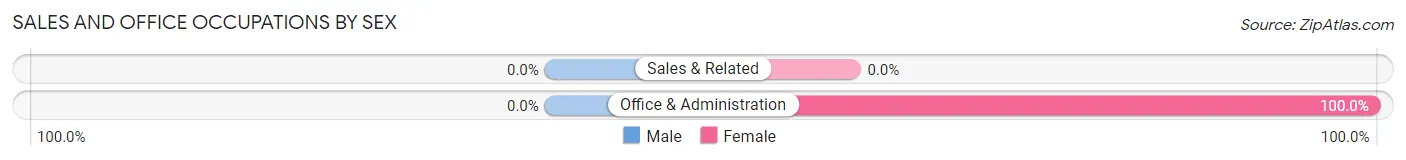
| Occupation | Male | Female |
| Sales & Related | 0 (0.0%) | 0 (0.0%) |
| Office & Administration | 0 (0.0%) | 2 (100.0%) |
| Total (Category) | 0 (0.0%) | 2 (100.0%) |
| Total (Overall) | 17 (63.0%) | 10 (37.0%) |
Natural Resources, Construction and Maintenance Occupations
The most common Natural Resources, Construction and Maintenance occupations in Tar Heel are , and Construction & Extraction (7 | 25.9%).
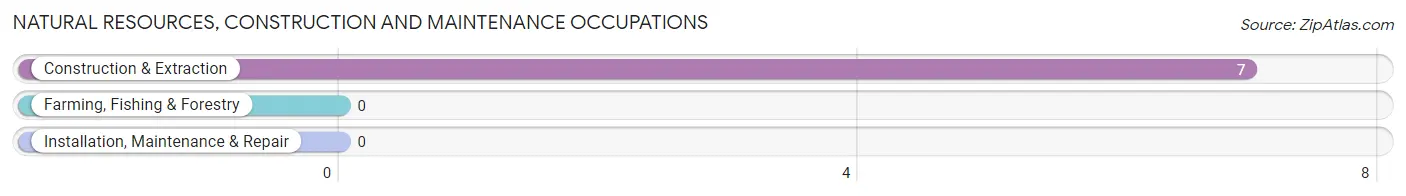
Natural Resources, Construction and Maintenance Occupations by Sex
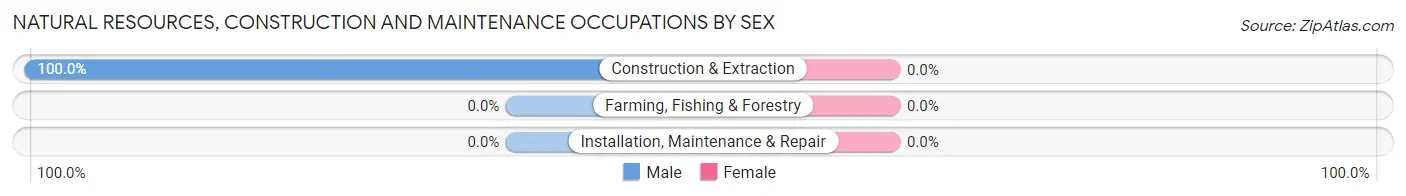
| Occupation | Male | Female |
| Farming, Fishing & Forestry | 0 (0.0%) | 0 (0.0%) |
| Construction & Extraction | 7 (100.0%) | 0 (0.0%) |
| Installation, Maintenance & Repair | 0 (0.0%) | 0 (0.0%) |
| Total (Category) | 7 (100.0%) | 0 (0.0%) |
| Total (Overall) | 17 (63.0%) | 10 (37.0%) |
Production, Transportation and Moving Occupations
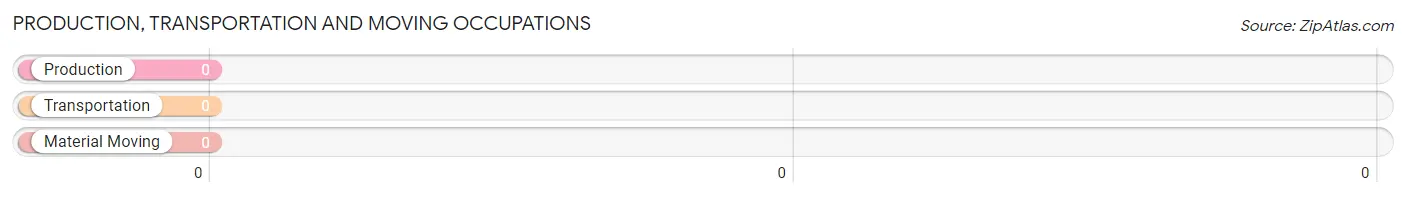
Production, Transportation and Moving Occupations by Sex
| Occupation | Male | Female |
| Production | 0 (0.0%) | 0 (0.0%) |
| Transportation | 0 (0.0%) | 0 (0.0%) |
| Material Moving | 0 (0.0%) | 0 (0.0%) |
| Total (Category) | 0 (0.0%) | 0 (0.0%) |
| Total (Overall) | 17 (63.0%) | 10 (37.0%) |
Employment Industries by Sex in Tar Heel
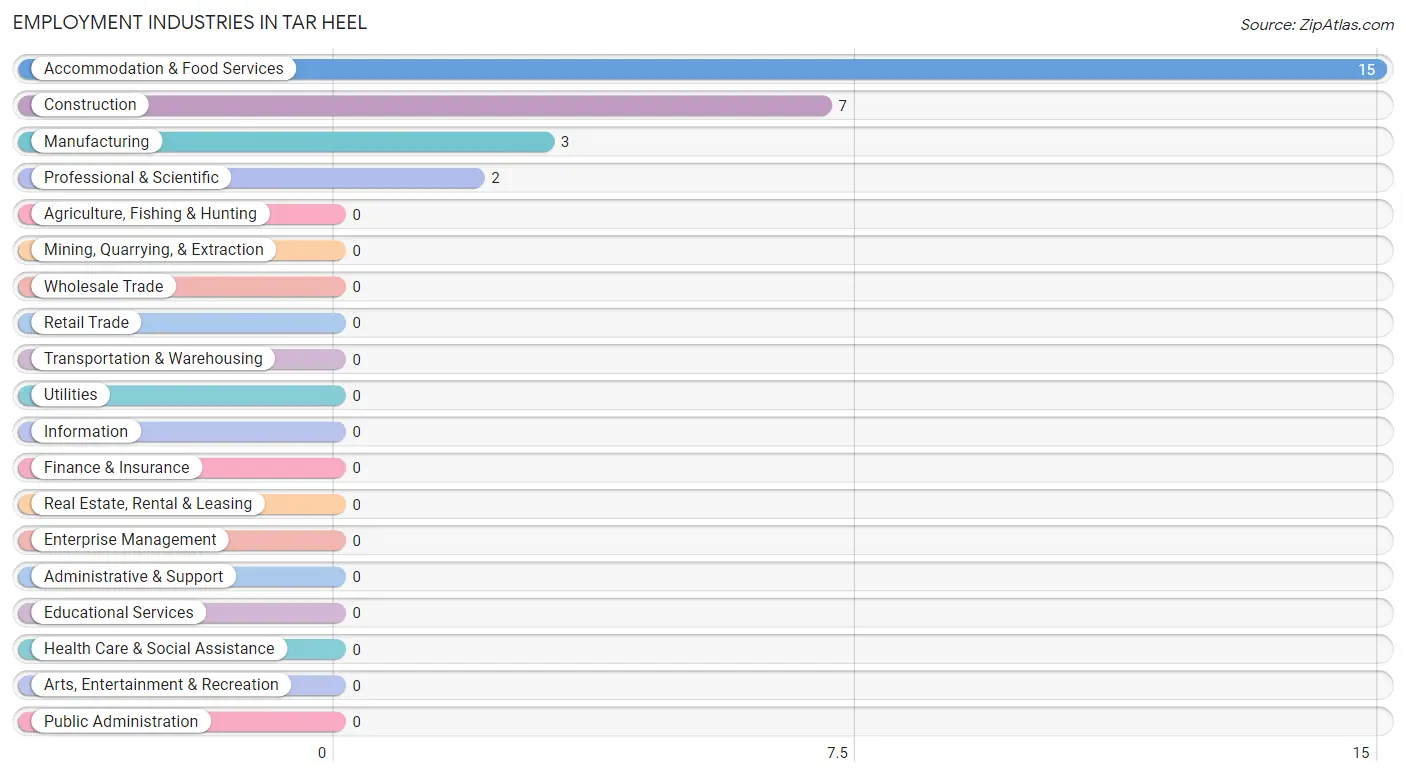
Employment Industries in Tar Heel
The major employment industries in Tar Heel include Accommodation & Food Services (15 | 55.6%), Construction (7 | 25.9%), Manufacturing (3 | 11.1%), and Professional & Scientific (2 | 7.4%).
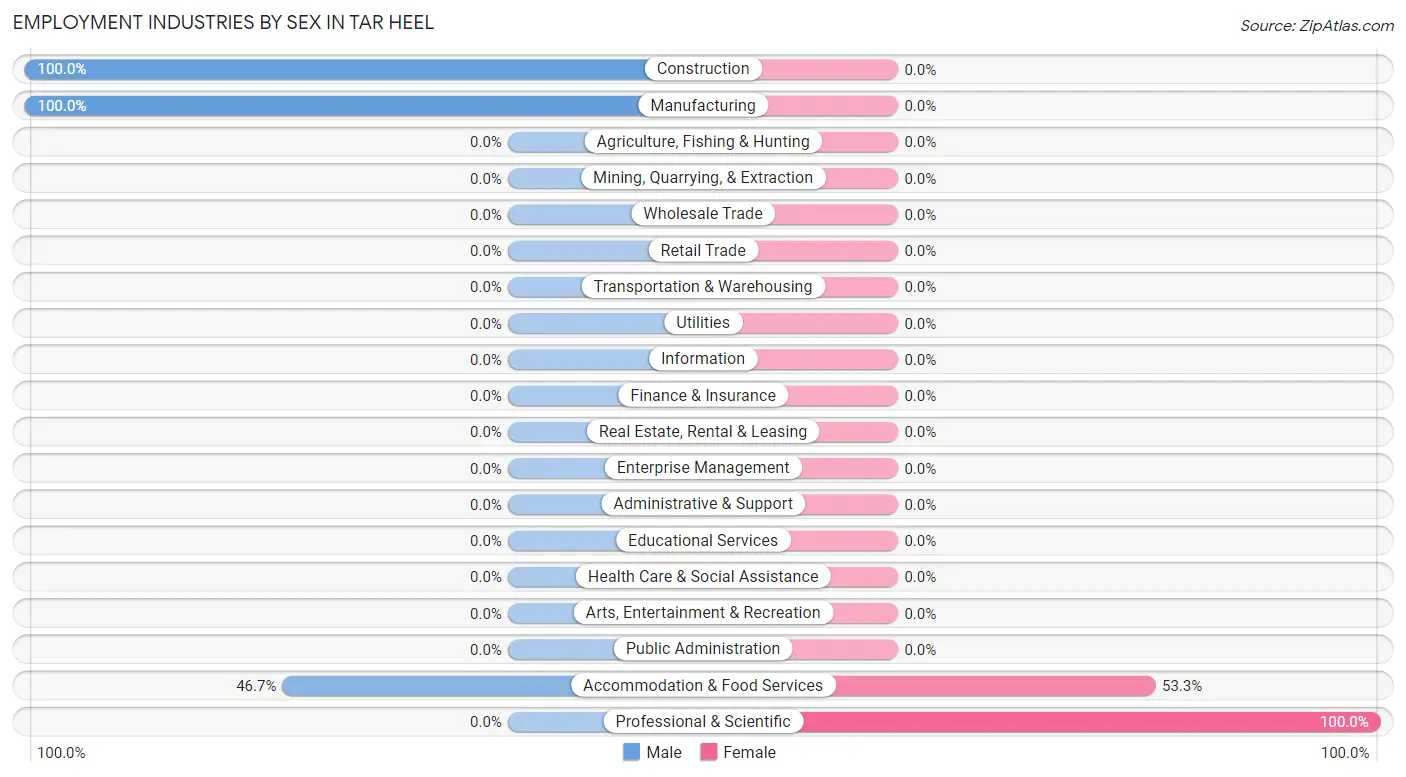
Employment Industries by Sex in Tar Heel
The Tar Heel industries that see more men than women are Construction (100.0%), Manufacturing (100.0%), and Accommodation & Food Services (46.7%), whereas the industries that tend to have a higher number of women are Professional & Scientific (100.0%), and Accommodation & Food Services (53.3%).
| Industry | Male | Female |
| Agriculture, Fishing & Hunting | 0 (0.0%) | 0 (0.0%) |
| Mining, Quarrying, & Extraction | 0 (0.0%) | 0 (0.0%) |
| Construction | 7 (100.0%) | 0 (0.0%) |
| Manufacturing | 3 (100.0%) | 0 (0.0%) |
| Wholesale Trade | 0 (0.0%) | 0 (0.0%) |
| Retail Trade | 0 (0.0%) | 0 (0.0%) |
| Transportation & Warehousing | 0 (0.0%) | 0 (0.0%) |
| Utilities | 0 (0.0%) | 0 (0.0%) |
| Information | 0 (0.0%) | 0 (0.0%) |
| Finance & Insurance | 0 (0.0%) | 0 (0.0%) |
| Real Estate, Rental & Leasing | 0 (0.0%) | 0 (0.0%) |
| Professional & Scientific | 0 (0.0%) | 2 (100.0%) |
| Enterprise Management | 0 (0.0%) | 0 (0.0%) |
| Administrative & Support | 0 (0.0%) | 0 (0.0%) |
| Educational Services | 0 (0.0%) | 0 (0.0%) |
| Health Care & Social Assistance | 0 (0.0%) | 0 (0.0%) |
| Arts, Entertainment & Recreation | 0 (0.0%) | 0 (0.0%) |
| Accommodation & Food Services | 7 (46.7%) | 8 (53.3%) |
| Public Administration | 0 (0.0%) | 0 (0.0%) |
| Total | 17 (63.0%) | 10 (37.0%) |
Education in Tar Heel
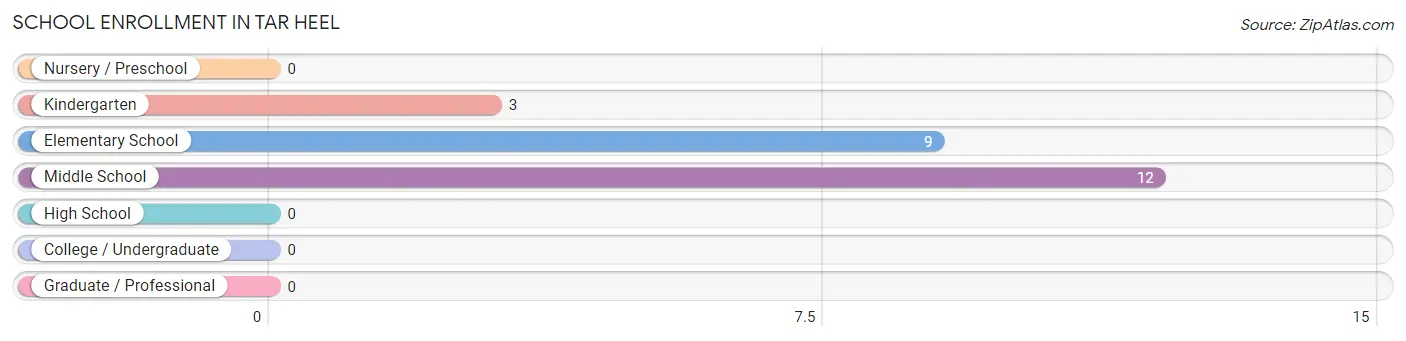
School Enrollment in Tar Heel
The most common levels of schooling among the 24 students in Tar Heel are middle school (12 | 50.0%), elementary school (9 | 37.5%), and kindergarten (3 | 12.5%).
| School Level | # Students | % Students |
| Nursery / Preschool | 0 | 0.0% |
| Kindergarten | 3 | 12.5% |
| Elementary School | 9 | 37.5% |
| Middle School | 12 | 50.0% |
| High School | 0 | 0.0% |
| College / Undergraduate | 0 | 0.0% |
| Graduate / Professional | 0 | 0.0% |
| Total | 24 | 100.0% |
School Enrollment by Age by Funding Source in Tar Heel
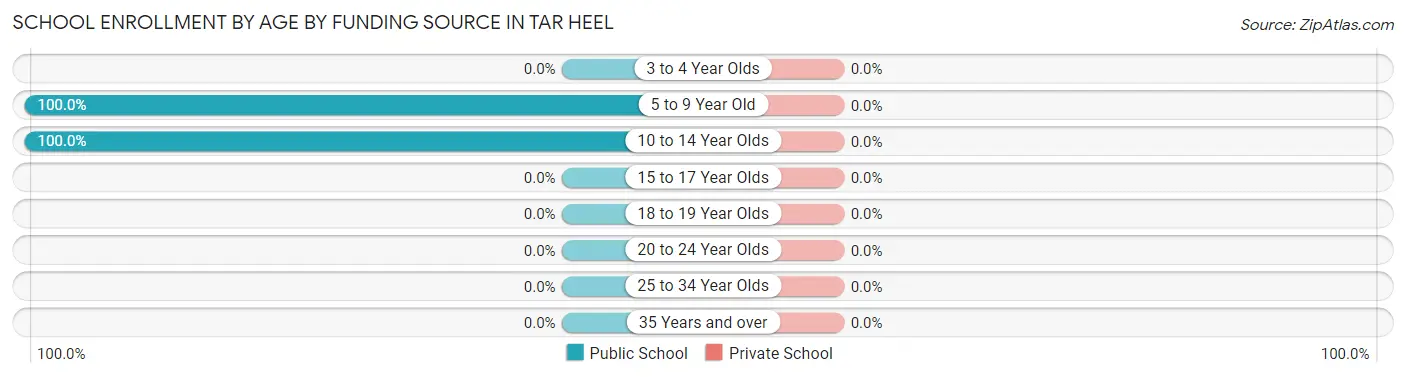
| Age Bracket | Public School | Private School |
| 3 to 4 Year Olds | 0 (0.0%) | 0 (0.0%) |
| 5 to 9 Year Old | 12 (100.0%) | 0 (0.0%) |
| 10 to 14 Year Olds | 12 (100.0%) | 0 (0.0%) |
| 15 to 17 Year Olds | 0 (0.0%) | 0 (0.0%) |
| 18 to 19 Year Olds | 0 (0.0%) | 0 (0.0%) |
| 20 to 24 Year Olds | 0 (0.0%) | 0 (0.0%) |
| 25 to 34 Year Olds | 0 (0.0%) | 0 (0.0%) |
| 35 Years and over | 0 (0.0%) | 0 (0.0%) |
| Total | 24 (100.0%) | 0 (0.0%) |
Educational Attainment by Field of Study in Tar Heel
Business (5 | 71.4%), and education (2 | 28.6%) are the most common fields of study among 7 individuals in Tar Heel who have obtained a bachelor's degree or higher.
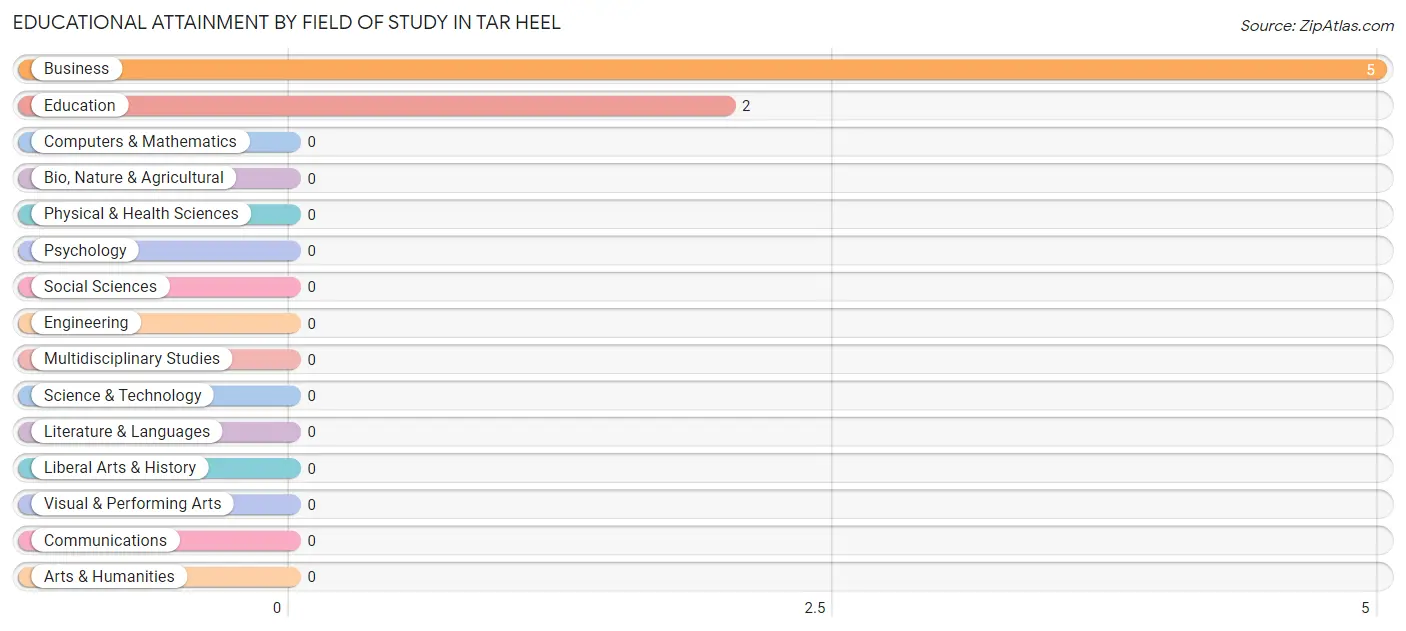
| Field of Study | # Graduates | % Graduates |
| Computers & Mathematics | 0 | 0.0% |
| Bio, Nature & Agricultural | 0 | 0.0% |
| Physical & Health Sciences | 0 | 0.0% |
| Psychology | 0 | 0.0% |
| Social Sciences | 0 | 0.0% |
| Engineering | 0 | 0.0% |
| Multidisciplinary Studies | 0 | 0.0% |
| Science & Technology | 0 | 0.0% |
| Business | 5 | 71.4% |
| Education | 2 | 28.6% |
| Literature & Languages | 0 | 0.0% |
| Liberal Arts & History | 0 | 0.0% |
| Visual & Performing Arts | 0 | 0.0% |
| Communications | 0 | 0.0% |
| Arts & Humanities | 0 | 0.0% |
| Total | 7 | 100.0% |
Transportation & Commute in Tar Heel
Vehicle Availability by Sex in Tar Heel
The most prevalent vehicle ownership categories in Tar Heel are males with 2 vehicles (12, accounting for 70.6%) and females with 2 vehicles (0, making up 120.0%).
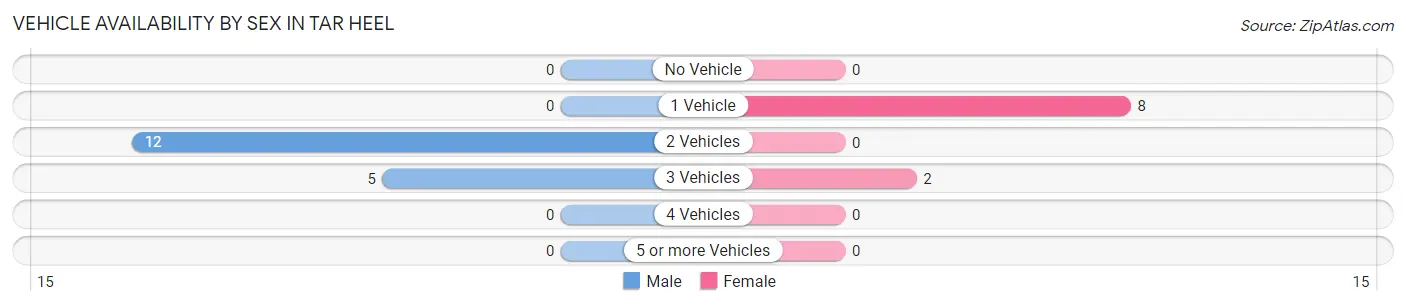
| Vehicles Available | Male | Female |
| No Vehicle | 0 (0.0%) | 0 (0.0%) |
| 1 Vehicle | 0 (0.0%) | 8 (80.0%) |
| 2 Vehicles | 12 (70.6%) | 0 (0.0%) |
| 3 Vehicles | 5 (29.4%) | 2 (20.0%) |
| 4 Vehicles | 0 (0.0%) | 0 (0.0%) |
| 5 or more Vehicles | 0 (0.0%) | 0 (0.0%) |
| Total | 17 (100.0%) | 10 (100.0%) |
Commute Time in Tar Heel
The most frequently occuring commute durations in Tar Heel are 20 to 24 minutes (15 commuters, 55.6%), 90 or more minutes (9 commuters, 33.3%), and 45 to 59 minutes (2 commuters, 7.4%).
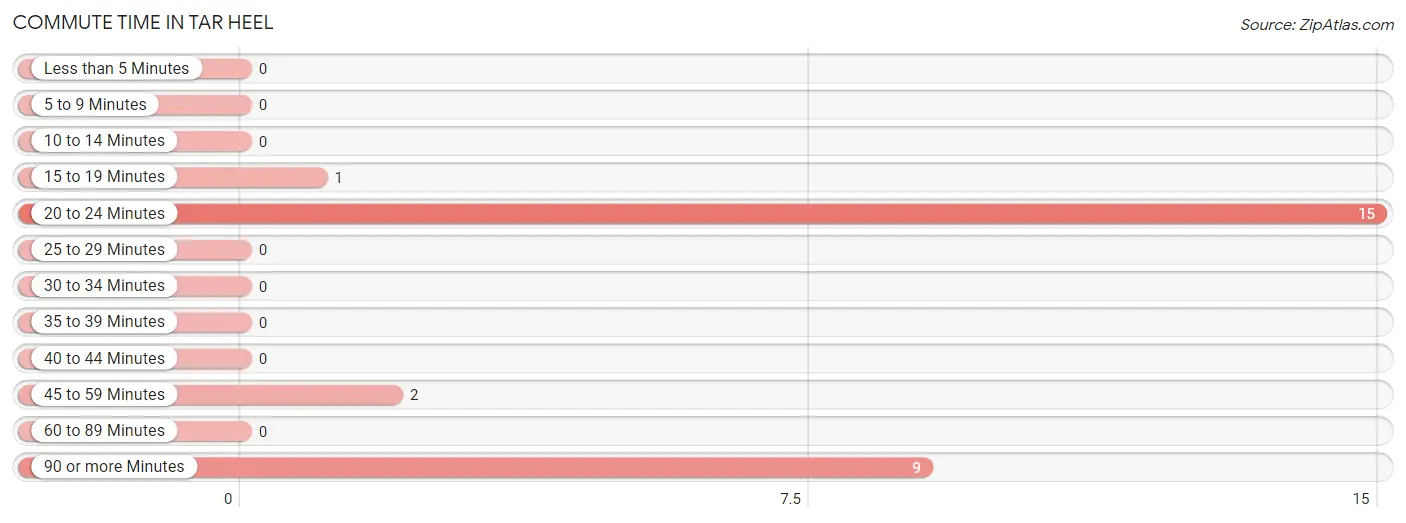
| Commute Time | # Commuters | % Commuters |
| Less than 5 Minutes | 0 | 0.0% |
| 5 to 9 Minutes | 0 | 0.0% |
| 10 to 14 Minutes | 0 | 0.0% |
| 15 to 19 Minutes | 1 | 3.7% |
| 20 to 24 Minutes | 15 | 55.6% |
| 25 to 29 Minutes | 0 | 0.0% |
| 30 to 34 Minutes | 0 | 0.0% |
| 35 to 39 Minutes | 0 | 0.0% |
| 40 to 44 Minutes | 0 | 0.0% |
| 45 to 59 Minutes | 2 | 7.4% |
| 60 to 89 Minutes | 0 | 0.0% |
| 90 or more Minutes | 9 | 33.3% |
Commute Time by Sex in Tar Heel
The most common commute times in Tar Heel are 20 to 24 minutes (7 commuters, 41.2%) for males and 20 to 24 minutes (8 commuters, 80.0%) for females.
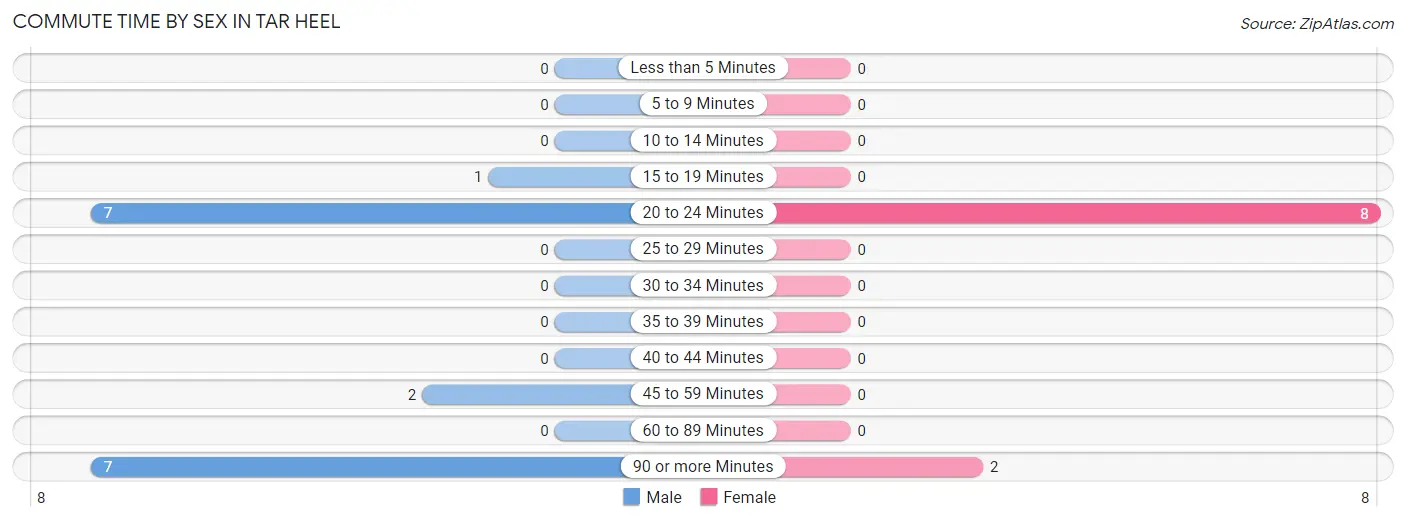
| Commute Time | Male | Female |
| Less than 5 Minutes | 0 (0.0%) | 0 (0.0%) |
| 5 to 9 Minutes | 0 (0.0%) | 0 (0.0%) |
| 10 to 14 Minutes | 0 (0.0%) | 0 (0.0%) |
| 15 to 19 Minutes | 1 (5.9%) | 0 (0.0%) |
| 20 to 24 Minutes | 7 (41.2%) | 8 (80.0%) |
| 25 to 29 Minutes | 0 (0.0%) | 0 (0.0%) |
| 30 to 34 Minutes | 0 (0.0%) | 0 (0.0%) |
| 35 to 39 Minutes | 0 (0.0%) | 0 (0.0%) |
| 40 to 44 Minutes | 0 (0.0%) | 0 (0.0%) |
| 45 to 59 Minutes | 2 (11.8%) | 0 (0.0%) |
| 60 to 89 Minutes | 0 (0.0%) | 0 (0.0%) |
| 90 or more Minutes | 7 (41.2%) | 2 (20.0%) |
Time of Departure to Work by Sex in Tar Heel
The most frequent times of departure to work in Tar Heel are 7:00 AM to 7:29 AM (8, 47.1%) for males and 9:00 AM to 9:59 AM (8, 80.0%) for females.
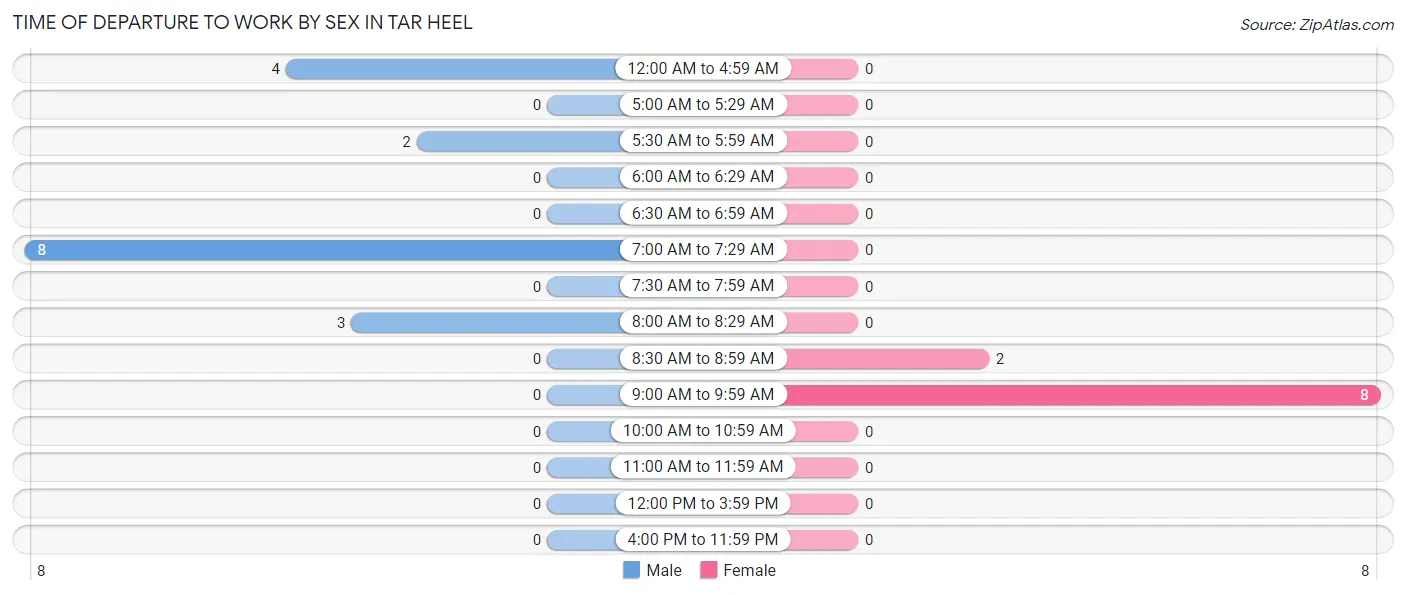
| Time of Departure | Male | Female |
| 12:00 AM to 4:59 AM | 4 (23.5%) | 0 (0.0%) |
| 5:00 AM to 5:29 AM | 0 (0.0%) | 0 (0.0%) |
| 5:30 AM to 5:59 AM | 2 (11.8%) | 0 (0.0%) |
| 6:00 AM to 6:29 AM | 0 (0.0%) | 0 (0.0%) |
| 6:30 AM to 6:59 AM | 0 (0.0%) | 0 (0.0%) |
| 7:00 AM to 7:29 AM | 8 (47.1%) | 0 (0.0%) |
| 7:30 AM to 7:59 AM | 0 (0.0%) | 0 (0.0%) |
| 8:00 AM to 8:29 AM | 3 (17.6%) | 0 (0.0%) |
| 8:30 AM to 8:59 AM | 0 (0.0%) | 2 (20.0%) |
| 9:00 AM to 9:59 AM | 0 (0.0%) | 8 (80.0%) |
| 10:00 AM to 10:59 AM | 0 (0.0%) | 0 (0.0%) |
| 11:00 AM to 11:59 AM | 0 (0.0%) | 0 (0.0%) |
| 12:00 PM to 3:59 PM | 0 (0.0%) | 0 (0.0%) |
| 4:00 PM to 11:59 PM | 0 (0.0%) | 0 (0.0%) |
| Total | 17 (100.0%) | 10 (100.0%) |
Housing Occupancy in Tar Heel
Occupancy by Ownership in Tar Heel
Of the total 47 dwellings in Tar Heel, owner-occupied units account for 28 (59.6%), while renter-occupied units make up 19 (40.4%).
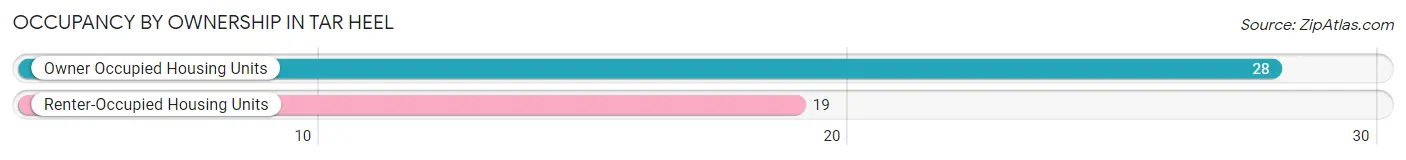
| Occupancy | # Housing Units | % Housing Units |
| Owner Occupied Housing Units | 28 | 59.6% |
| Renter-Occupied Housing Units | 19 | 40.4% |
| Total Occupied Housing Units | 47 | 100.0% |
Occupancy by Household Size in Tar Heel
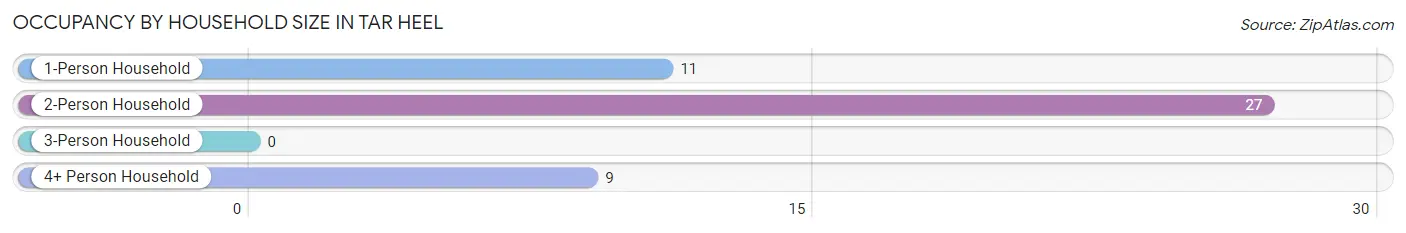
| Household Size | # Housing Units | % Housing Units |
| 1-Person Household | 11 | 23.4% |
| 2-Person Household | 27 | 57.5% |
| 3-Person Household | 0 | 0.0% |
| 4+ Person Household | 9 | 19.2% |
| Total Housing Units | 47 | 100.0% |
Occupancy by Ownership by Household Size in Tar Heel
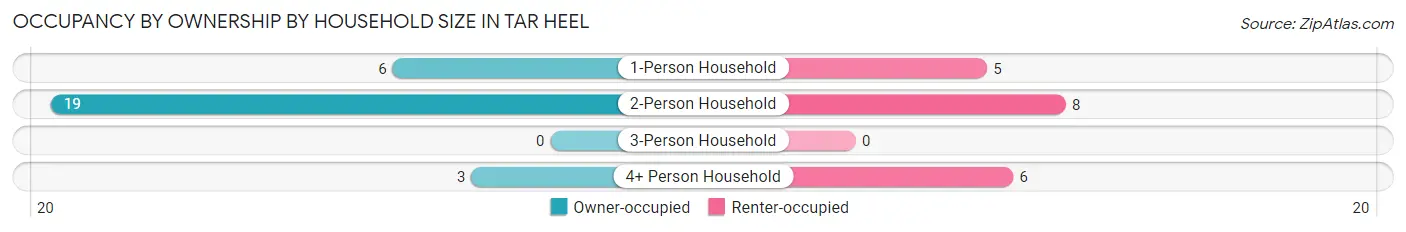
| Household Size | Owner-occupied | Renter-occupied |
| 1-Person Household | 6 (54.5%) | 5 (45.5%) |
| 2-Person Household | 19 (70.4%) | 8 (29.6%) |
| 3-Person Household | 0 (0.0%) | 0 (0.0%) |
| 4+ Person Household | 3 (33.3%) | 6 (66.7%) |
| Total Housing Units | 28 (59.6%) | 19 (40.4%) |
Occupancy by Educational Attainment in Tar Heel
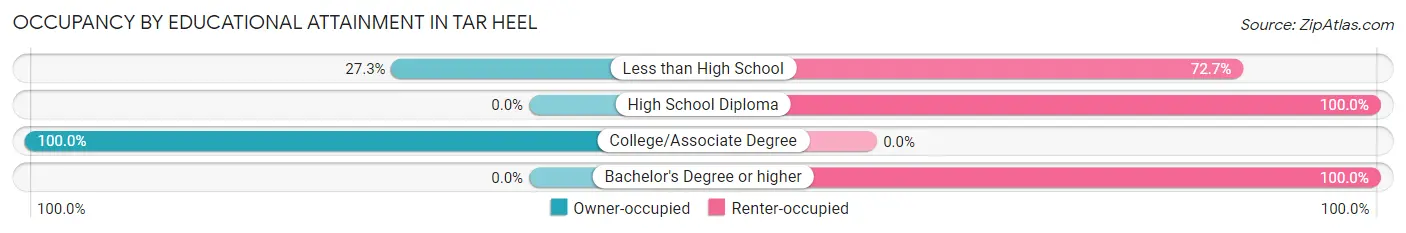
| Household Size | Owner-occupied | Renter-occupied |
| Less than High School | 3 (27.3%) | 8 (72.7%) |
| High School Diploma | 0 (0.0%) | 10 (100.0%) |
| College/Associate Degree | 25 (100.0%) | 0 (0.0%) |
| Bachelor's Degree or higher | 0 (0.0%) | 1 (100.0%) |
Occupancy by Age of Householder in Tar Heel
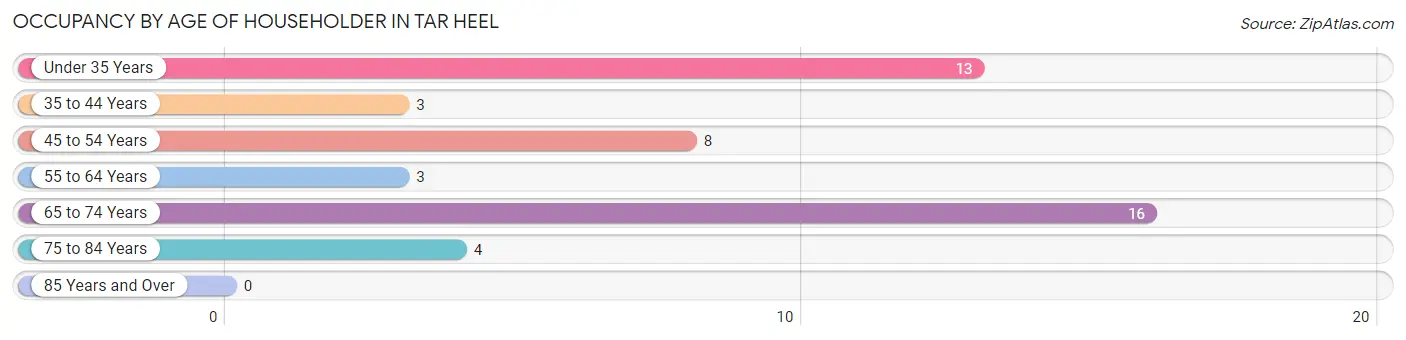
| Age Bracket | # Households | % Households |
| Under 35 Years | 13 | 27.7% |
| 35 to 44 Years | 3 | 6.4% |
| 45 to 54 Years | 8 | 17.0% |
| 55 to 64 Years | 3 | 6.4% |
| 65 to 74 Years | 16 | 34.0% |
| 75 to 84 Years | 4 | 8.5% |
| 85 Years and Over | 0 | 0.0% |
| Total | 47 | 100.0% |
Housing Finances in Tar Heel
Median Income by Occupancy in Tar Heel
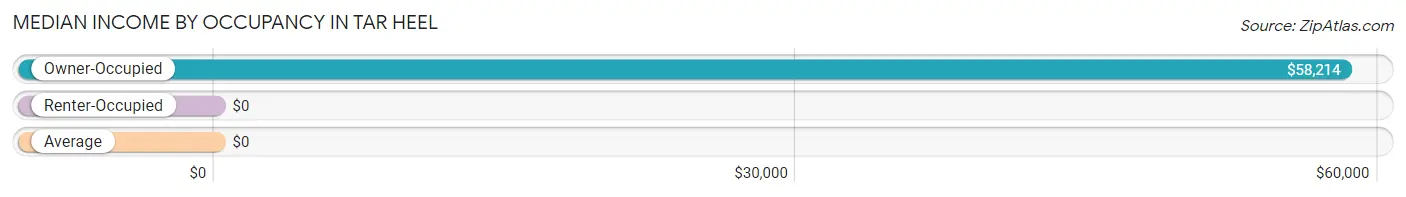
| Occupancy Type | # Households | Median Income |
| Owner-Occupied | 28 (59.6%) | $58,214 |
| Renter-Occupied | 19 (40.4%) | $0 |
| Average | 47 (100.0%) | $0 |
Occupancy by Householder Income Bracket in Tar Heel
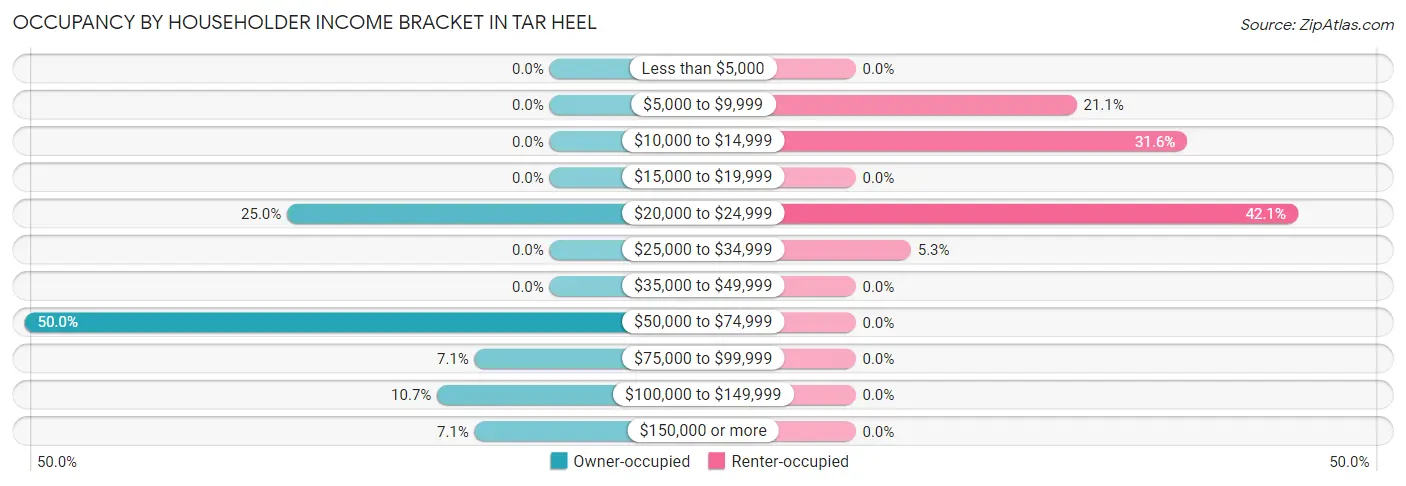
| Income Bracket | Owner-occupied | Renter-occupied |
| Less than $5,000 | 0 (0.0%) | 0 (0.0%) |
| $5,000 to $9,999 | 0 (0.0%) | 4 (21.0%) |
| $10,000 to $14,999 | 0 (0.0%) | 6 (31.6%) |
| $15,000 to $19,999 | 0 (0.0%) | 0 (0.0%) |
| $20,000 to $24,999 | 7 (25.0%) | 8 (42.1%) |
| $25,000 to $34,999 | 0 (0.0%) | 1 (5.3%) |
| $35,000 to $49,999 | 0 (0.0%) | 0 (0.0%) |
| $50,000 to $74,999 | 14 (50.0%) | 0 (0.0%) |
| $75,000 to $99,999 | 2 (7.1%) | 0 (0.0%) |
| $100,000 to $149,999 | 3 (10.7%) | 0 (0.0%) |
| $150,000 or more | 2 (7.1%) | 0 (0.0%) |
| Total | 28 (100.0%) | 19 (100.0%) |
Monthly Housing Cost Tiers in Tar Heel
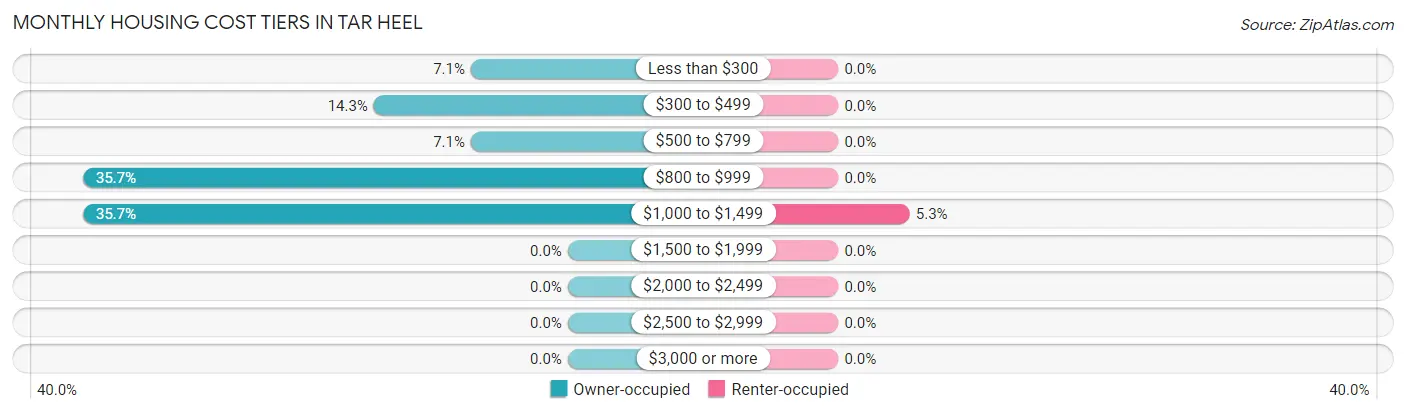
| Monthly Cost | Owner-occupied | Renter-occupied |
| Less than $300 | 2 (7.1%) | 0 (0.0%) |
| $300 to $499 | 4 (14.3%) | 0 (0.0%) |
| $500 to $799 | 2 (7.1%) | 0 (0.0%) |
| $800 to $999 | 10 (35.7%) | 0 (0.0%) |
| $1,000 to $1,499 | 10 (35.7%) | 1 (5.3%) |
| $1,500 to $1,999 | 0 (0.0%) | 0 (0.0%) |
| $2,000 to $2,499 | 0 (0.0%) | 0 (0.0%) |
| $2,500 to $2,999 | 0 (0.0%) | 0 (0.0%) |
| $3,000 or more | 0 (0.0%) | 0 (0.0%) |
| Total | 28 (100.0%) | 19 (100.0%) |
Physical Housing Characteristics in Tar Heel
Housing Structures in Tar Heel
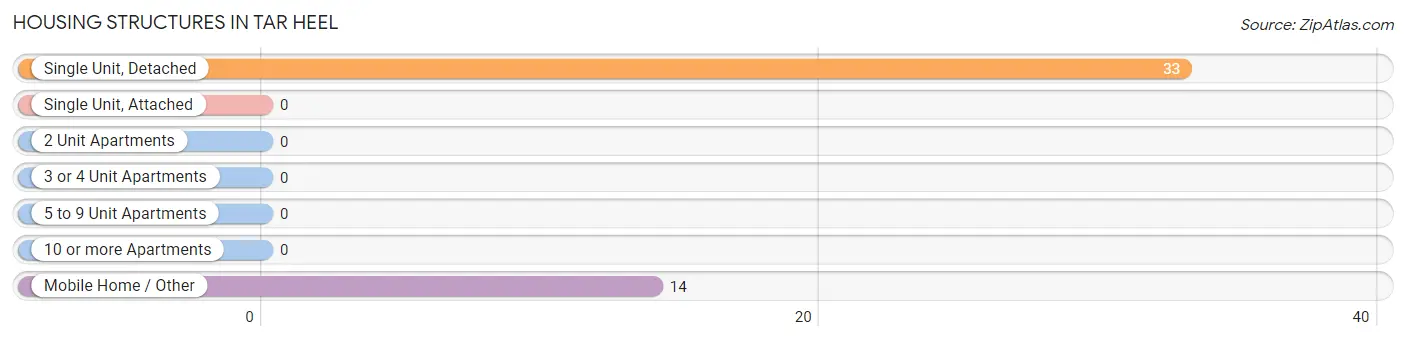
| Structure Type | # Housing Units | % Housing Units |
| Single Unit, Detached | 33 | 70.2% |
| Single Unit, Attached | 0 | 0.0% |
| 2 Unit Apartments | 0 | 0.0% |
| 3 or 4 Unit Apartments | 0 | 0.0% |
| 5 to 9 Unit Apartments | 0 | 0.0% |
| 10 or more Apartments | 0 | 0.0% |
| Mobile Home / Other | 14 | 29.8% |
| Total | 47 | 100.0% |
Housing Structures by Occupancy in Tar Heel
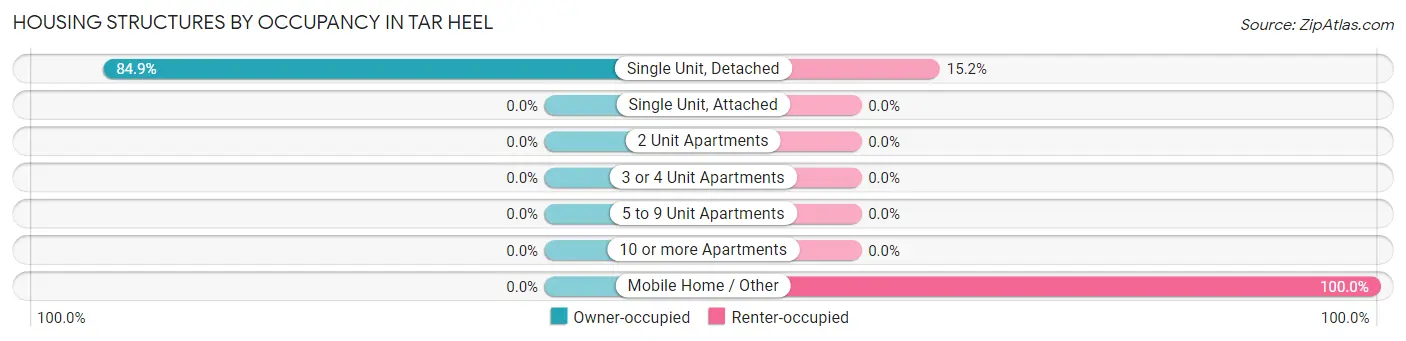
| Structure Type | Owner-occupied | Renter-occupied |
| Single Unit, Detached | 28 (84.9%) | 5 (15.1%) |
| Single Unit, Attached | 0 (0.0%) | 0 (0.0%) |
| 2 Unit Apartments | 0 (0.0%) | 0 (0.0%) |
| 3 or 4 Unit Apartments | 0 (0.0%) | 0 (0.0%) |
| 5 to 9 Unit Apartments | 0 (0.0%) | 0 (0.0%) |
| 10 or more Apartments | 0 (0.0%) | 0 (0.0%) |
| Mobile Home / Other | 0 (0.0%) | 14 (100.0%) |
| Total | 28 (59.6%) | 19 (40.4%) |
Housing Structures by Number of Rooms in Tar Heel
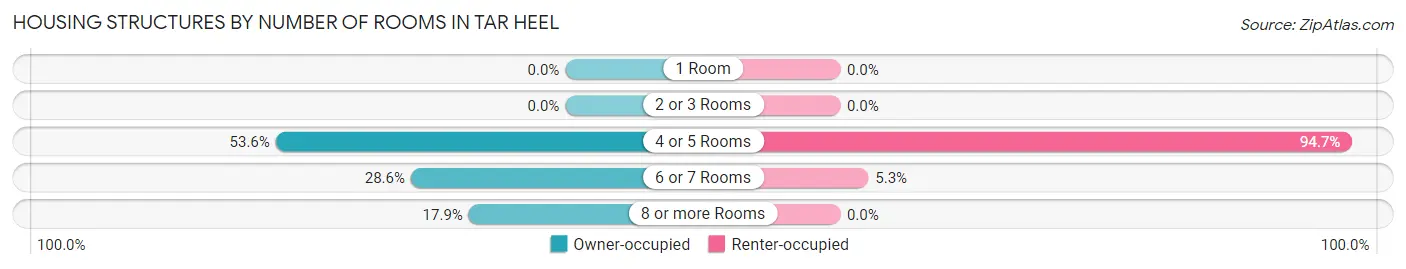
| Number of Rooms | Owner-occupied | Renter-occupied |
| 1 Room | 0 (0.0%) | 0 (0.0%) |
| 2 or 3 Rooms | 0 (0.0%) | 0 (0.0%) |
| 4 or 5 Rooms | 15 (53.6%) | 18 (94.7%) |
| 6 or 7 Rooms | 8 (28.6%) | 1 (5.3%) |
| 8 or more Rooms | 5 (17.9%) | 0 (0.0%) |
| Total | 28 (100.0%) | 19 (100.0%) |
Housing Structure by Heating Type in Tar Heel
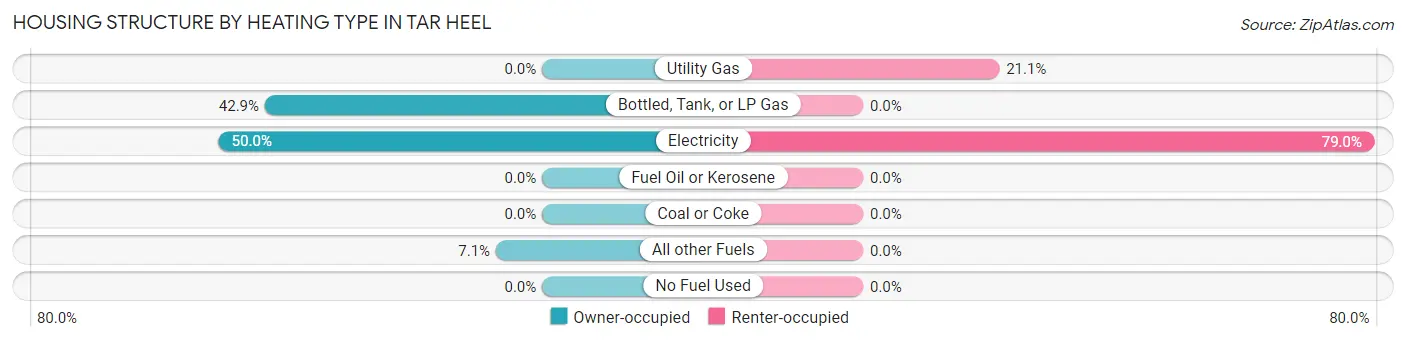
| Heating Type | Owner-occupied | Renter-occupied |
| Utility Gas | 0 (0.0%) | 4 (21.0%) |
| Bottled, Tank, or LP Gas | 12 (42.9%) | 0 (0.0%) |
| Electricity | 14 (50.0%) | 15 (78.9%) |
| Fuel Oil or Kerosene | 0 (0.0%) | 0 (0.0%) |
| Coal or Coke | 0 (0.0%) | 0 (0.0%) |
| All other Fuels | 2 (7.1%) | 0 (0.0%) |
| No Fuel Used | 0 (0.0%) | 0 (0.0%) |
| Total | 28 (100.0%) | 19 (100.0%) |
Household Vehicle Usage in Tar Heel
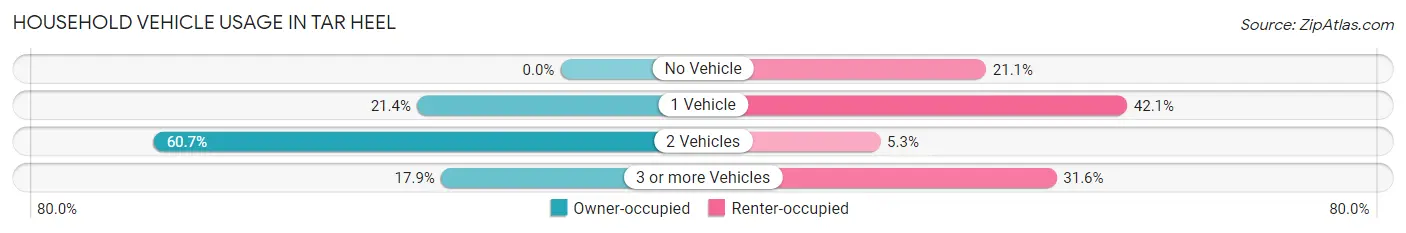
| Vehicles per Household | Owner-occupied | Renter-occupied |
| No Vehicle | 0 (0.0%) | 4 (21.0%) |
| 1 Vehicle | 6 (21.4%) | 8 (42.1%) |
| 2 Vehicles | 17 (60.7%) | 1 (5.3%) |
| 3 or more Vehicles | 5 (17.9%) | 6 (31.6%) |
| Total | 28 (100.0%) | 19 (100.0%) |
Real Estate & Mortgages in Tar Heel
Real Estate and Mortgage Overview in Tar Heel
| Characteristic | Without Mortgage | With Mortgage |
| Housing Units | 8 | 20 |
| Median Property Value | $200,000 | $135,000 |
| Median Household Income | - | - |
| Monthly Housing Costs | $450 | $0 |
| Real Estate Taxes | $1,750 | $0 |
Property Value by Mortgage Status in Tar Heel
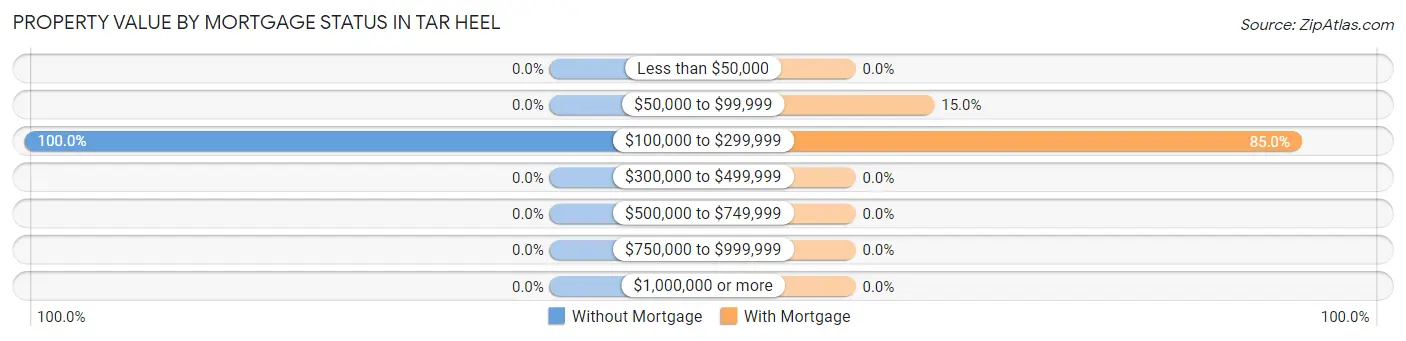
| Property Value | Without Mortgage | With Mortgage |
| Less than $50,000 | 0 (0.0%) | 0 (0.0%) |
| $50,000 to $99,999 | 0 (0.0%) | 3 (15.0%) |
| $100,000 to $299,999 | 8 (100.0%) | 17 (85.0%) |
| $300,000 to $499,999 | 0 (0.0%) | 0 (0.0%) |
| $500,000 to $749,999 | 0 (0.0%) | 0 (0.0%) |
| $750,000 to $999,999 | 0 (0.0%) | 0 (0.0%) |
| $1,000,000 or more | 0 (0.0%) | 0 (0.0%) |
| Total | 8 (100.0%) | 20 (100.0%) |
Household Income by Mortgage Status in Tar Heel
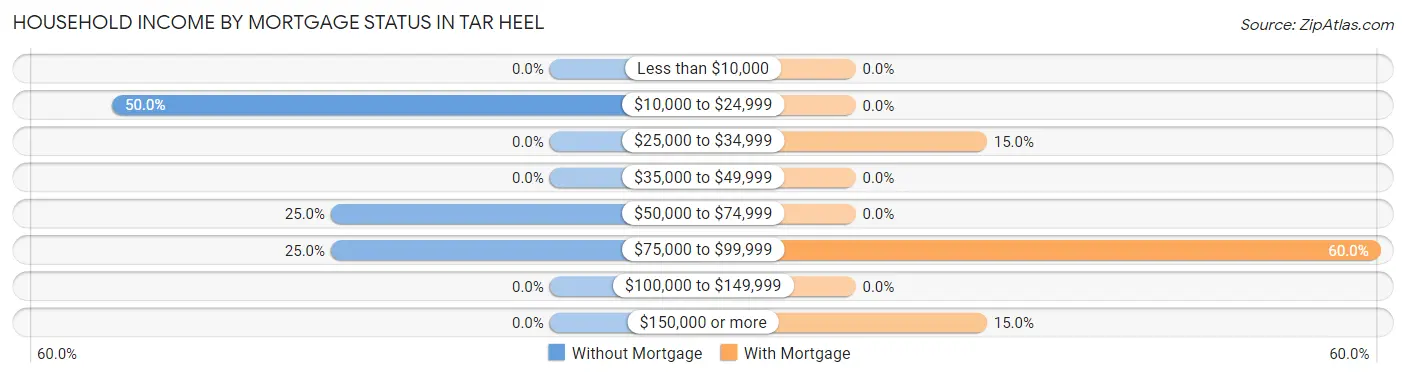
| Household Income | Without Mortgage | With Mortgage |
| Less than $10,000 | 0 (0.0%) | 0 (0.0%) |
| $10,000 to $24,999 | 4 (50.0%) | 0 (0.0%) |
| $25,000 to $34,999 | 0 (0.0%) | 3 (15.0%) |
| $35,000 to $49,999 | 0 (0.0%) | 0 (0.0%) |
| $50,000 to $74,999 | 2 (25.0%) | 0 (0.0%) |
| $75,000 to $99,999 | 2 (25.0%) | 12 (60.0%) |
| $100,000 to $149,999 | 0 (0.0%) | 0 (0.0%) |
| $150,000 or more | 0 (0.0%) | 3 (15.0%) |
| Total | 8 (100.0%) | 20 (100.0%) |
Property Value to Household Income Ratio in Tar Heel
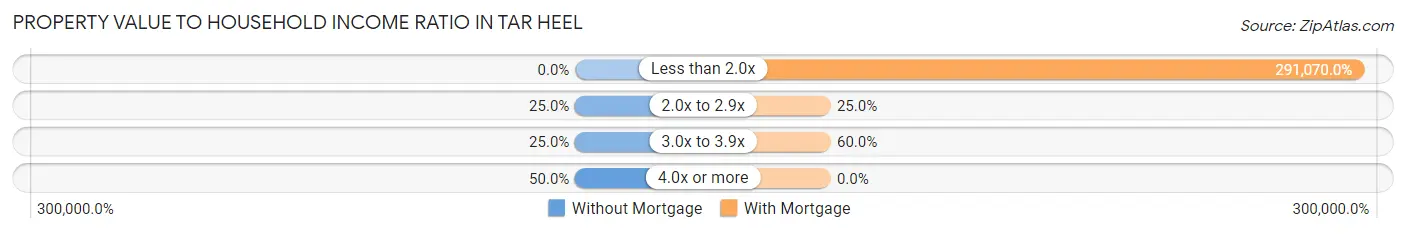
| Value-to-Income Ratio | Without Mortgage | With Mortgage |
| Less than 2.0x | 0 (0.0%) | 58,214 (291,070.0%) |
| 2.0x to 2.9x | 2 (25.0%) | 5 (25.0%) |
| 3.0x to 3.9x | 2 (25.0%) | 12 (60.0%) |
| 4.0x or more | 4 (50.0%) | 0 (0.0%) |
| Total | 8 (100.0%) | 20 (100.0%) |
Real Estate Taxes by Mortgage Status in Tar Heel
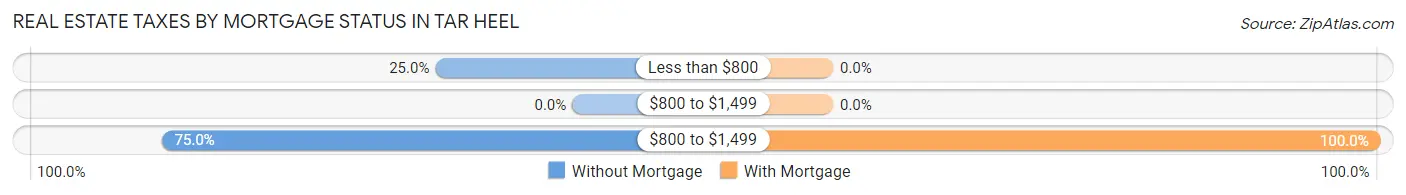
| Property Taxes | Without Mortgage | With Mortgage |
| Less than $800 | 2 (25.0%) | 0 (0.0%) |
| $800 to $1,499 | 0 (0.0%) | 0 (0.0%) |
| $800 to $1,499 | 6 (75.0%) | 20 (100.0%) |
| Total | 8 (100.0%) | 20 (100.0%) |
Health & Disability in Tar Heel
Health Insurance Coverage by Age in Tar Heel
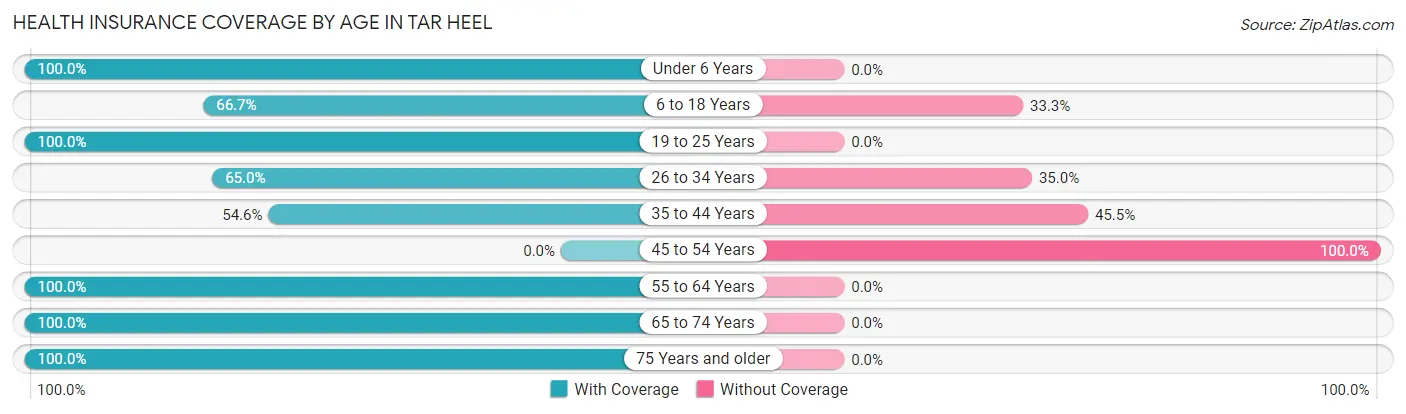
| Age Bracket | With Coverage | Without Coverage |
| Under 6 Years | 4 (100.0%) | 0 (0.0%) |
| 6 to 18 Years | 16 (66.7%) | 8 (33.3%) |
| 19 to 25 Years | 1 (100.0%) | 0 (0.0%) |
| 26 to 34 Years | 13 (65.0%) | 7 (35.0%) |
| 35 to 44 Years | 6 (54.5%) | 5 (45.5%) |
| 45 to 54 Years | 0 (0.0%) | 8 (100.0%) |
| 55 to 64 Years | 7 (100.0%) | 0 (0.0%) |
| 65 to 74 Years | 25 (100.0%) | 0 (0.0%) |
| 75 Years and older | 4 (100.0%) | 0 (0.0%) |
| Total | 76 (73.1%) | 28 (26.9%) |
Health Insurance Coverage by Citizenship Status in Tar Heel
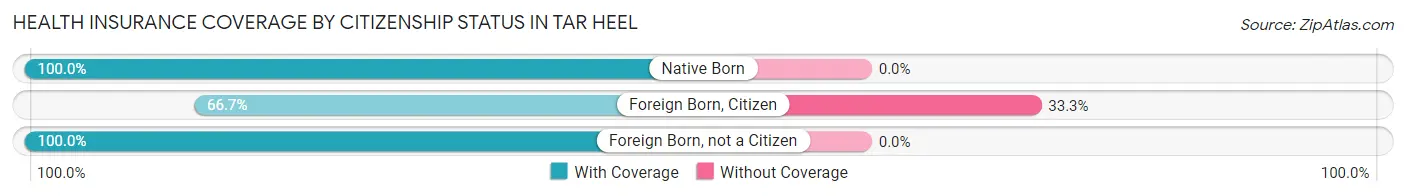
| Citizenship Status | With Coverage | Without Coverage |
| Native Born | 4 (100.0%) | 0 (0.0%) |
| Foreign Born, Citizen | 16 (66.7%) | 8 (33.3%) |
| Foreign Born, not a Citizen | 1 (100.0%) | 0 (0.0%) |
Health Insurance Coverage by Household Income in Tar Heel
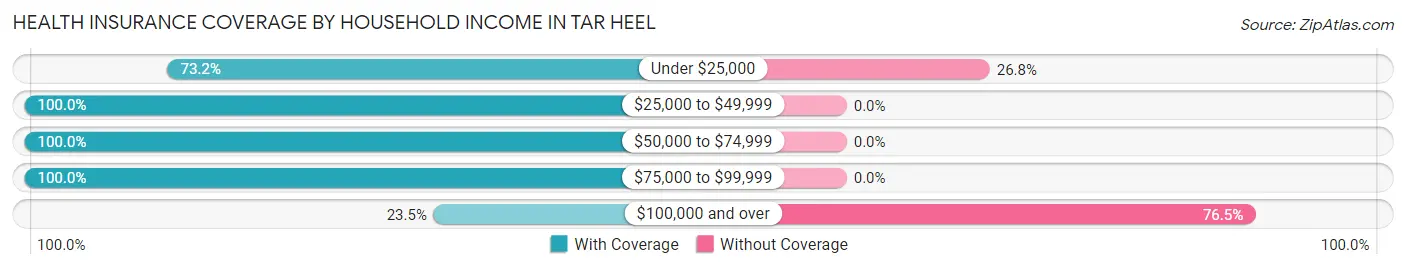
| Household Income | With Coverage | Without Coverage |
| Under $25,000 | 41 (73.2%) | 15 (26.8%) |
| $25,000 to $49,999 | 1 (100.0%) | 0 (0.0%) |
| $50,000 to $74,999 | 28 (100.0%) | 0 (0.0%) |
| $75,000 to $99,999 | 2 (100.0%) | 0 (0.0%) |
| $100,000 and over | 4 (23.5%) | 13 (76.5%) |
Public vs Private Health Insurance Coverage by Age in Tar Heel
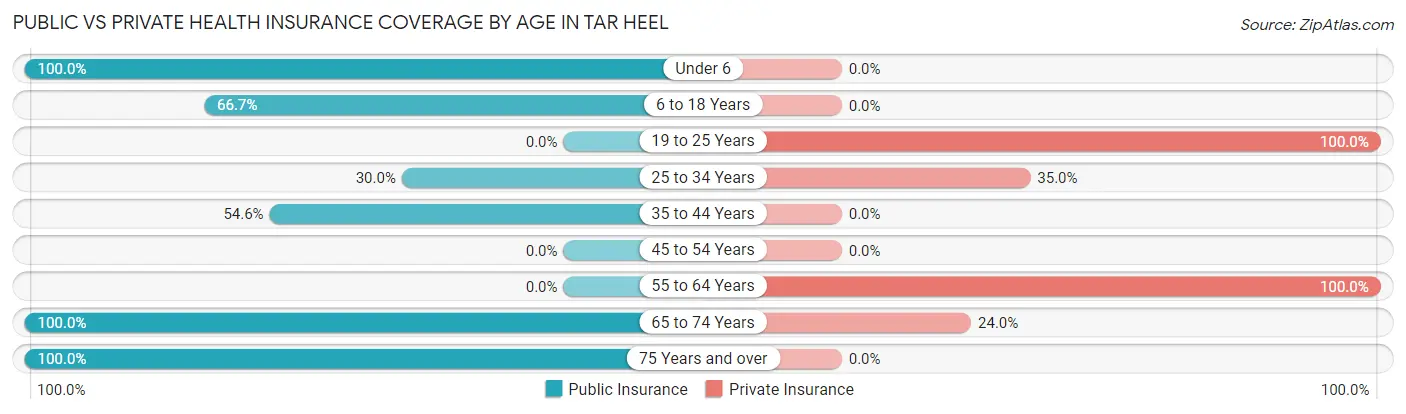
| Age Bracket | Public Insurance | Private Insurance |
| Under 6 | 4 (100.0%) | 0 (0.0%) |
| 6 to 18 Years | 16 (66.7%) | 0 (0.0%) |
| 19 to 25 Years | 0 (0.0%) | 1 (100.0%) |
| 25 to 34 Years | 6 (30.0%) | 7 (35.0%) |
| 35 to 44 Years | 6 (54.5%) | 0 (0.0%) |
| 45 to 54 Years | 0 (0.0%) | 0 (0.0%) |
| 55 to 64 Years | 0 (0.0%) | 7 (100.0%) |
| 65 to 74 Years | 25 (100.0%) | 6 (24.0%) |
| 75 Years and over | 4 (100.0%) | 0 (0.0%) |
| Total | 61 (58.7%) | 21 (20.2%) |
Disability Status by Sex by Age in Tar Heel
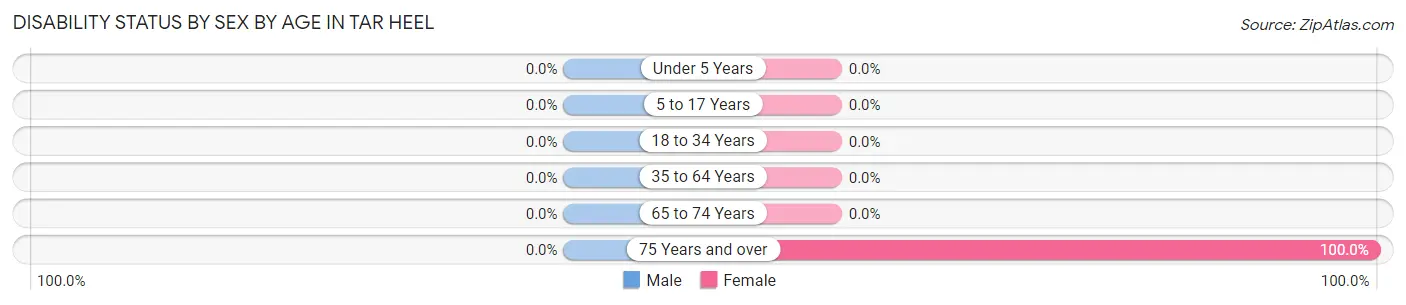
| Age Bracket | Male | Female |
| Under 5 Years | 0 (0.0%) | 0 (0.0%) |
| 5 to 17 Years | 0 (0.0%) | 0 (0.0%) |
| 18 to 34 Years | 0 (0.0%) | 0 (0.0%) |
| 35 to 64 Years | 0 (0.0%) | 0 (0.0%) |
| 65 to 74 Years | 0 (0.0%) | 0 (0.0%) |
| 75 Years and over | 0 (0.0%) | 4 (100.0%) |
Disability Class by Sex by Age in Tar Heel
Disability Class: Hearing Difficulty
| Age Bracket | Male | Female |
| Under 5 Years | 0 (0.0%) | 0 (0.0%) |
| 5 to 17 Years | 0 (0.0%) | 0 (0.0%) |
| 18 to 34 Years | 0 (0.0%) | 0 (0.0%) |
| 35 to 64 Years | 0 (0.0%) | 0 (0.0%) |
| 65 to 74 Years | 0 (0.0%) | 0 (0.0%) |
| 75 Years and over | 0 (0.0%) | 0 (0.0%) |
Disability Class: Vision Difficulty
| Age Bracket | Male | Female |
| Under 5 Years | 0 (0.0%) | 0 (0.0%) |
| 5 to 17 Years | 0 (0.0%) | 0 (0.0%) |
| 18 to 34 Years | 0 (0.0%) | 0 (0.0%) |
| 35 to 64 Years | 0 (0.0%) | 0 (0.0%) |
| 65 to 74 Years | 0 (0.0%) | 0 (0.0%) |
| 75 Years and over | 0 (0.0%) | 0 (0.0%) |
Disability Class: Cognitive Difficulty
| Age Bracket | Male | Female |
| 5 to 17 Years | 0 (0.0%) | 0 (0.0%) |
| 18 to 34 Years | 0 (0.0%) | 0 (0.0%) |
| 35 to 64 Years | 0 (0.0%) | 0 (0.0%) |
| 65 to 74 Years | 0 (0.0%) | 0 (0.0%) |
| 75 Years and over | 0 (0.0%) | 0 (0.0%) |
Disability Class: Ambulatory Difficulty
| Age Bracket | Male | Female |
| 5 to 17 Years | 0 (0.0%) | 0 (0.0%) |
| 18 to 34 Years | 0 (0.0%) | 0 (0.0%) |
| 35 to 64 Years | 0 (0.0%) | 0 (0.0%) |
| 65 to 74 Years | 0 (0.0%) | 0 (0.0%) |
| 75 Years and over | 0 (0.0%) | 4 (100.0%) |
Disability Class: Self-Care Difficulty

| Age Bracket | Male | Female |
| 5 to 17 Years | 0 (0.0%) | 0 (0.0%) |
| 18 to 34 Years | 0 (0.0%) | 0 (0.0%) |
| 35 to 64 Years | 0 (0.0%) | 0 (0.0%) |
| 65 to 74 Years | 0 (0.0%) | 0 (0.0%) |
| 75 Years and over | 0 (0.0%) | 0 (0.0%) |
Technology Access in Tar Heel
Computing Device Access in Tar Heel
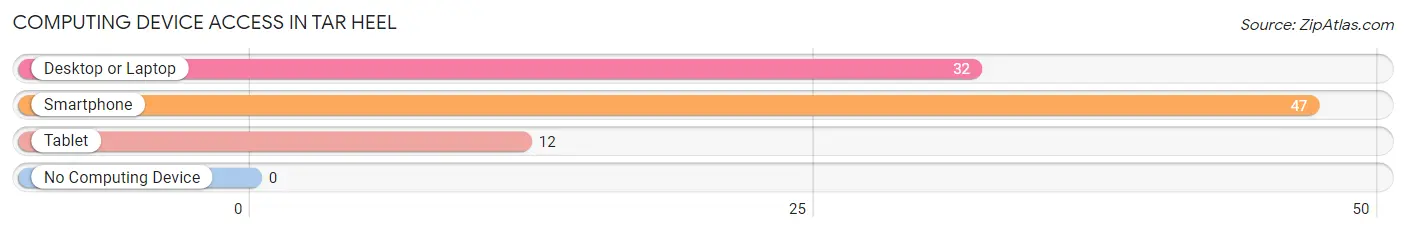
| Device Type | # Households | % Households |
| Desktop or Laptop | 32 | 68.1% |
| Smartphone | 47 | 100.0% |
| Tablet | 12 | 25.5% |
| No Computing Device | 0 | 0.0% |
| Total | 47 | 100.0% |
Internet Access in Tar Heel
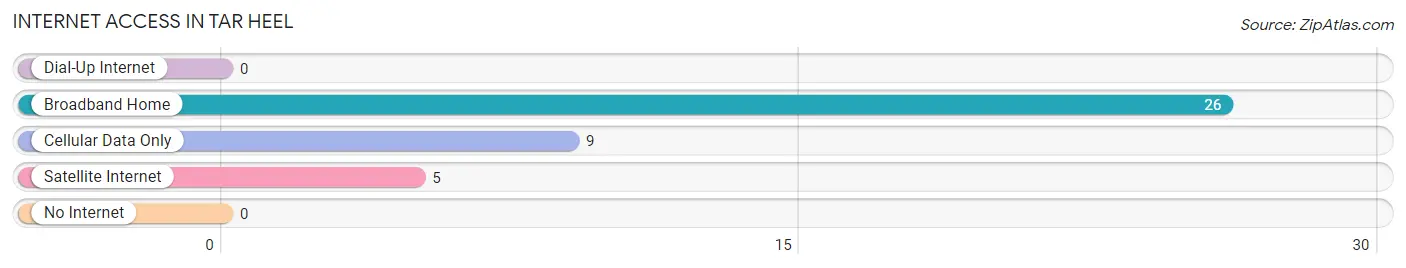
| Internet Type | # Households | % Households |
| Dial-Up Internet | 0 | 0.0% |
| Broadband Home | 26 | 55.3% |
| Cellular Data Only | 9 | 19.2% |
| Satellite Internet | 5 | 10.6% |
| No Internet | 0 | 0.0% |
| Total | 47 | 100.0% |
Tar Heel Summary
History
The history of Tar Heel, North Carolina dates back to the early 1700s when the area was first settled by European settlers. The town was originally known as “Tar Heel” due to the abundance of tar in the area. The tar was used to waterproof ships and was a major industry in the area. The town was officially incorporated in 1817 and was named after the tar industry.
The town grew rapidly in the 19th century due to the growth of the railroad industry. The town was a major hub for the railroad and was home to several major railroads. The town was also home to several factories and mills, which helped to fuel the local economy.
In the early 20th century, the town experienced a period of decline due to the Great Depression and the decline of the railroad industry. However, the town was able to rebound in the 1950s and 1960s due to the growth of the tobacco industry. The town was home to several tobacco warehouses and processing plants, which helped to fuel the local economy.
Geography
Tar Heel is located in Bladen County, North Carolina. The town is situated on the banks of the Cape Fear River and is approximately 30 miles south of Fayetteville. The town is located in the Coastal Plain region of North Carolina and is surrounded by forests and swamps. The town is located at an elevation of approximately 50 feet above sea level.
The climate in Tar Heel is humid subtropical, with hot, humid summers and mild winters. The average annual temperature is around 70 degrees Fahrenheit. The town receives an average of 48 inches of precipitation per year.
Economy
The economy of Tar Heel is largely based on agriculture and manufacturing. The town is home to several large farms, which produce a variety of crops, including corn, soybeans, cotton, and tobacco. The town is also home to several manufacturing plants, which produce a variety of products, including furniture, textiles, and paper products.
The town is also home to several retail stores, restaurants, and other businesses. The town is home to several banks and financial institutions, which provide banking services to the local community.
Demographics
As of the 2010 census, the population of Tar Heel was 1,845. The town has a population density of approximately 545 people per square mile. The median age of the population is 39.7 years. The median household income is $35,945. The town is approximately 75% white, 19% African American, and 6% Hispanic. The town is home to several churches, including Baptist, Methodist, and Presbyterian.
Common Questions
What is Per Capita Income in Tar Heel?
Per Capita income in Tar Heel is $19,714.
What is the Median Family Income in Tar Heel?
Median Family Income in Tar Heel is $57,000.
What is Income or Wage Gap in Tar Heel?
Income or Wage Gap in Tar Heel is 54.8%.
Women in Tar Heel earn 45.2 cents for every dollar earned by a man.
What is Inequality or Gini Index in Tar Heel?
Inequality or Gini Index in Tar Heel is 0.41.
What is the Total Population of Tar Heel?
Total Population of Tar Heel is 104.
What is the Total Male Population of Tar Heel?
Total Male Population of Tar Heel is 58.
What is the Total Female Population of Tar Heel?
Total Female Population of Tar Heel is 46.
What is the Ratio of Males per 100 Females in Tar Heel?
There are 126.09 Males per 100 Females in Tar Heel.
What is the Ratio of Females per 100 Males in Tar Heel?
There are 79.31 Females per 100 Males in Tar Heel.
What is the Median Population Age in Tar Heel?
Median Population Age in Tar Heel is 38.4 Years.
What is the Average Family Size in Tar Heel
Average Family Size in Tar Heel is 2.9 People.
What is the Average Household Size in Tar Heel
Average Household Size in Tar Heel is 2.2 People.
How Large is the Labor Force in Tar Heel?
There are 27 People in the Labor Forcein in Tar Heel.
What is the Percentage of People in the Labor Force in Tar Heel?
35.5% of People are in the Labor Force in Tar Heel.