Fairmont, NC Map & Demographics
Fairmont Map
Fairmont Overview
$20,530
PER CAPITA INCOME
$34,500
AVG FAMILY INCOME
$31,731
AVG HOUSEHOLD INCOME
3.8%
WAGE / INCOME GAP [ % ]
96.2¢/ $1
WAGE / INCOME GAP [ $ ]
$11,307
FAMILY INCOME DEFICIT
0.46
INEQUALITY / GINI INDEX
2,519
TOTAL POPULATION
1,082
MALE POPULATION
1,437
FEMALE POPULATION
75.30
MALES / 100 FEMALES
132.81
FEMALES / 100 MALES
48.1
MEDIAN AGE
3.3
AVG FAMILY SIZE
2.5
AVG HOUSEHOLD SIZE
866
LABOR FORCE [ PEOPLE ]
42.0%
PERCENT IN LABOR FORCE
8.7%
UNEMPLOYMENT RATE
Fairmont Zip Codes
Fairmont Area Codes
Income in Fairmont
Income Overview in Fairmont
Per Capita Income in Fairmont is $20,530, while median incomes of families and households are $34,500 and $31,731 respectively.
| Characteristic | Number | Measure |
| Per Capita Income | 2,519 | $20,530 |
| Median Family Income | 602 | $34,500 |
| Mean Family Income | 602 | $50,645 |
| Median Household Income | 1,002 | $31,731 |
| Mean Household Income | 1,002 | $46,984 |
| Income Deficit | 602 | $11,307 |
| Wage / Income Gap (%) | 2,519 | 3.84% |
| Wage / Income Gap ($) | 2,519 | 96.16¢ per $1 |
| Gini / Inequality Index | 2,519 | 0.46 |
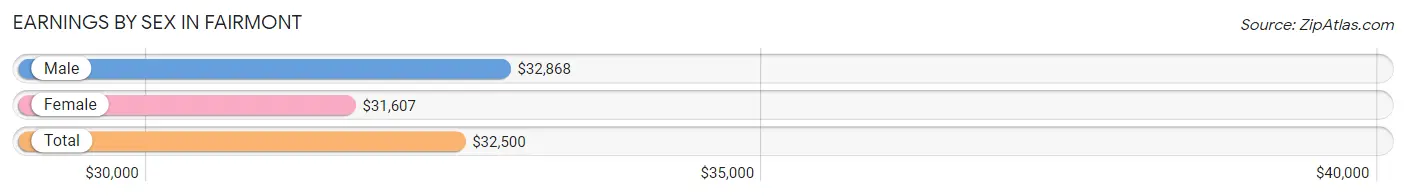
Earnings by Sex in Fairmont
Average Earnings in Fairmont are $32,500, $32,868 for men and $31,607 for women, a difference of 3.8%.
| Sex | Number | Average Earnings |
| Male | 363 (41.2%) | $32,868 |
| Female | 519 (58.8%) | $31,607 |
| Total | 882 (100.0%) | $32,500 |
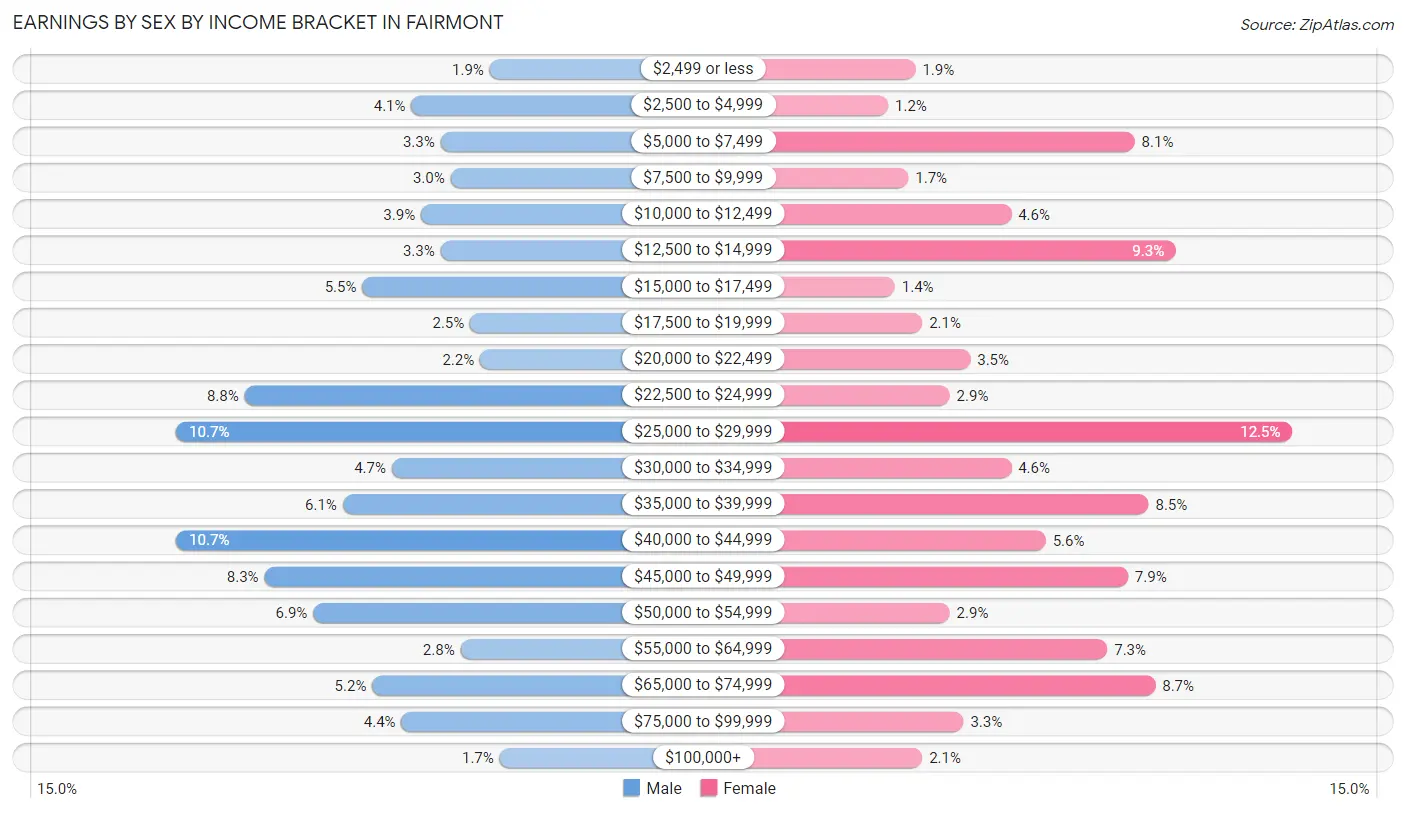
Earnings by Sex by Income Bracket in Fairmont
The most common earnings brackets in Fairmont are $25,000 to $29,999 for men (39 | 10.7%) and $25,000 to $29,999 for women (65 | 12.5%).
| Income | Male | Female |
| $2,499 or less | 7 (1.9%) | 10 (1.9%) |
| $2,500 to $4,999 | 15 (4.1%) | 6 (1.2%) |
| $5,000 to $7,499 | 12 (3.3%) | 42 (8.1%) |
| $7,500 to $9,999 | 11 (3.0%) | 9 (1.7%) |
| $10,000 to $12,499 | 14 (3.9%) | 24 (4.6%) |
| $12,500 to $14,999 | 12 (3.3%) | 48 (9.2%) |
| $15,000 to $17,499 | 20 (5.5%) | 7 (1.3%) |
| $17,500 to $19,999 | 9 (2.5%) | 11 (2.1%) |
| $20,000 to $22,499 | 8 (2.2%) | 18 (3.5%) |
| $22,500 to $24,999 | 32 (8.8%) | 15 (2.9%) |
| $25,000 to $29,999 | 39 (10.7%) | 65 (12.5%) |
| $30,000 to $34,999 | 17 (4.7%) | 24 (4.6%) |
| $35,000 to $39,999 | 22 (6.1%) | 44 (8.5%) |
| $40,000 to $44,999 | 39 (10.7%) | 29 (5.6%) |
| $45,000 to $49,999 | 30 (8.3%) | 41 (7.9%) |
| $50,000 to $54,999 | 25 (6.9%) | 15 (2.9%) |
| $55,000 to $64,999 | 10 (2.8%) | 38 (7.3%) |
| $65,000 to $74,999 | 19 (5.2%) | 45 (8.7%) |
| $75,000 to $99,999 | 16 (4.4%) | 17 (3.3%) |
| $100,000+ | 6 (1.7%) | 11 (2.1%) |
| Total | 363 (100.0%) | 519 (100.0%) |
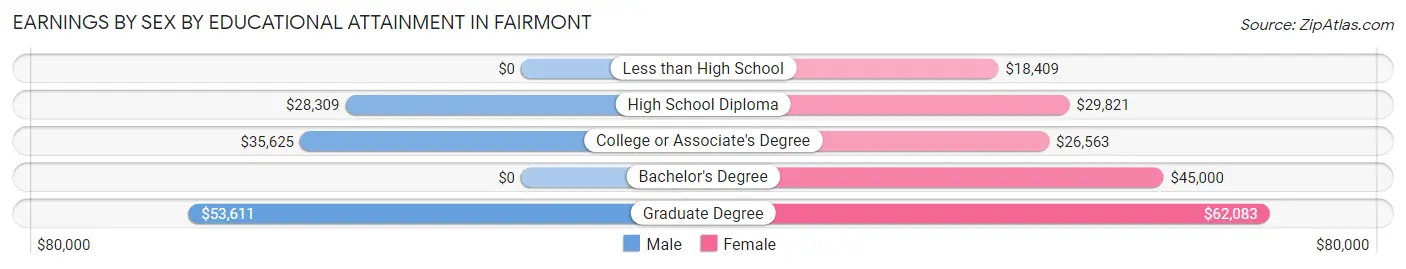
Earnings by Sex by Educational Attainment in Fairmont
Average earnings in Fairmont are $34,632 for men and $33,676 for women, a difference of 2.8%. Men with an educational attainment of graduate degree enjoy the highest average annual earnings of $53,611, while those with high school diploma education earn the least with $28,309. Women with an educational attainment of graduate degree earn the most with the average annual earnings of $62,083, while those with less than high school education have the smallest earnings of $18,409.
| Educational Attainment | Male Income | Female Income |
| Less than High School | - | - |
| High School Diploma | $28,309 | $29,821 |
| College or Associate's Degree | $35,625 | $26,563 |
| Bachelor's Degree | - | - |
| Graduate Degree | $53,611 | $62,083 |
| Total | $34,632 | $33,676 |
Family Income in Fairmont
Family Income Brackets in Fairmont
According to the Fairmont family income data, there are 112 families falling into the $15,000 to $24,999 income range, which is the most common income bracket and makes up 18.6% of all families.
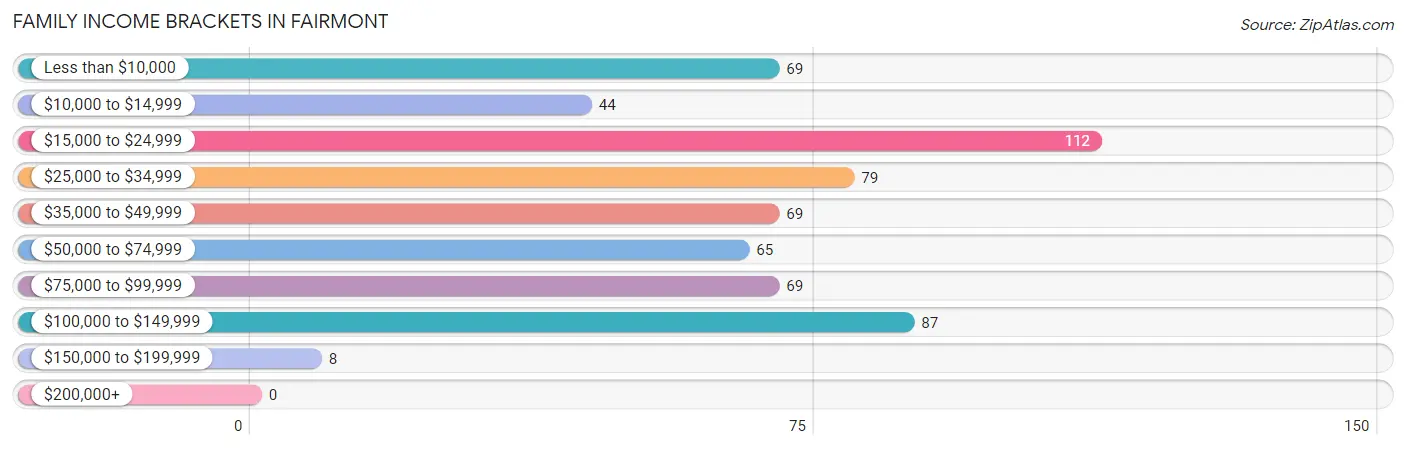
| Income Bracket | # Families | % Families |
| Less than $10,000 | 69 | 11.5% |
| $10,000 to $14,999 | 44 | 7.3% |
| $15,000 to $24,999 | 112 | 18.6% |
| $25,000 to $34,999 | 79 | 13.1% |
| $35,000 to $49,999 | 69 | 11.5% |
| $50,000 to $74,999 | 65 | 10.8% |
| $75,000 to $99,999 | 69 | 11.5% |
| $100,000 to $149,999 | 87 | 14.5% |
| $150,000 to $199,999 | 8 | 1.3% |
| $200,000+ | 0 | 0.0% |
Family Income by Famaliy Size in Fairmont
3-person families (111 | 18.4%) account for the highest median family income in Fairmont with $60,469 per family, while 3-person families (111 | 18.4%) have the highest median income of $20,156 per family member.
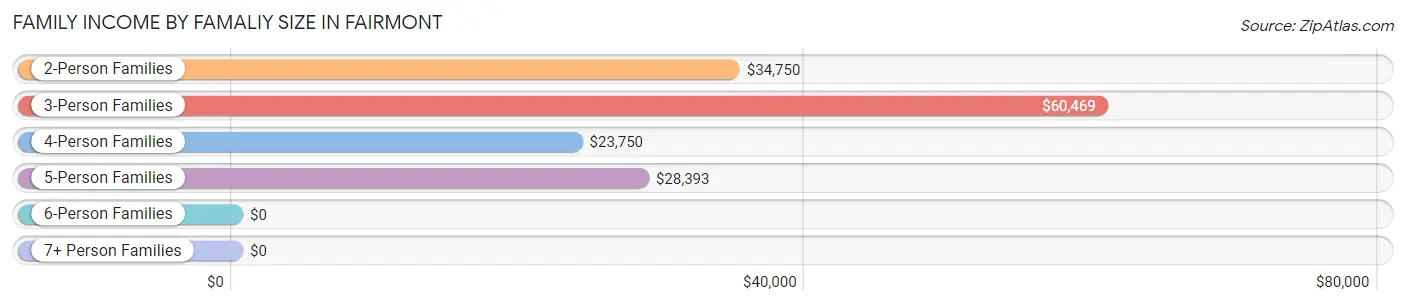
| Income Bracket | # Families | Median Income |
| 2-Person Families | 321 (53.3%) | $34,750 |
| 3-Person Families | 111 (18.4%) | $60,469 |
| 4-Person Families | 143 (23.7%) | $23,750 |
| 5-Person Families | 19 (3.2%) | $28,393 |
| 6-Person Families | 8 (1.3%) | $0 |
| 7+ Person Families | 0 (0.0%) | $0 |
| Total | 602 (100.0%) | $34,500 |
Family Income by Number of Earners in Fairmont
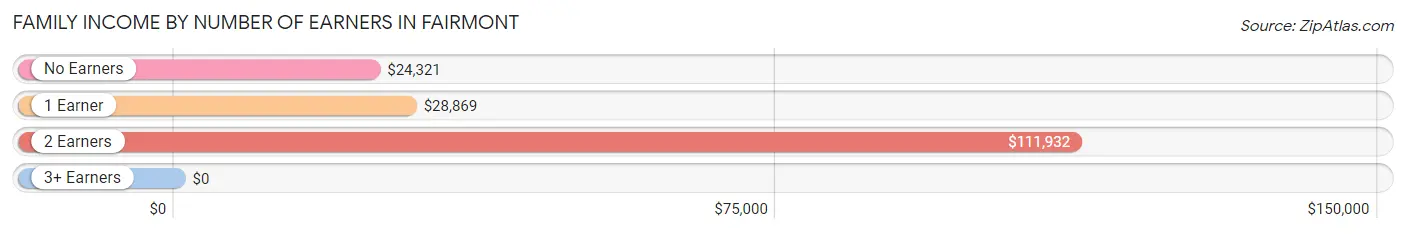
| Number of Earners | # Families | Median Income |
| No Earners | 189 (31.4%) | $24,321 |
| 1 Earner | 281 (46.7%) | $28,869 |
| 2 Earners | 117 (19.4%) | $111,932 |
| 3+ Earners | 15 (2.5%) | $0 |
| Total | 602 (100.0%) | $34,500 |
Household Income in Fairmont
Household Income Brackets in Fairmont
With 160 households falling in the category, the $15,000 to $24,999 income range is the most frequent in Fairmont, accounting for 16.0% of all households. In contrast, only 6 households (0.6%) fall into the $200,000+ income bracket, making it the least populous group.
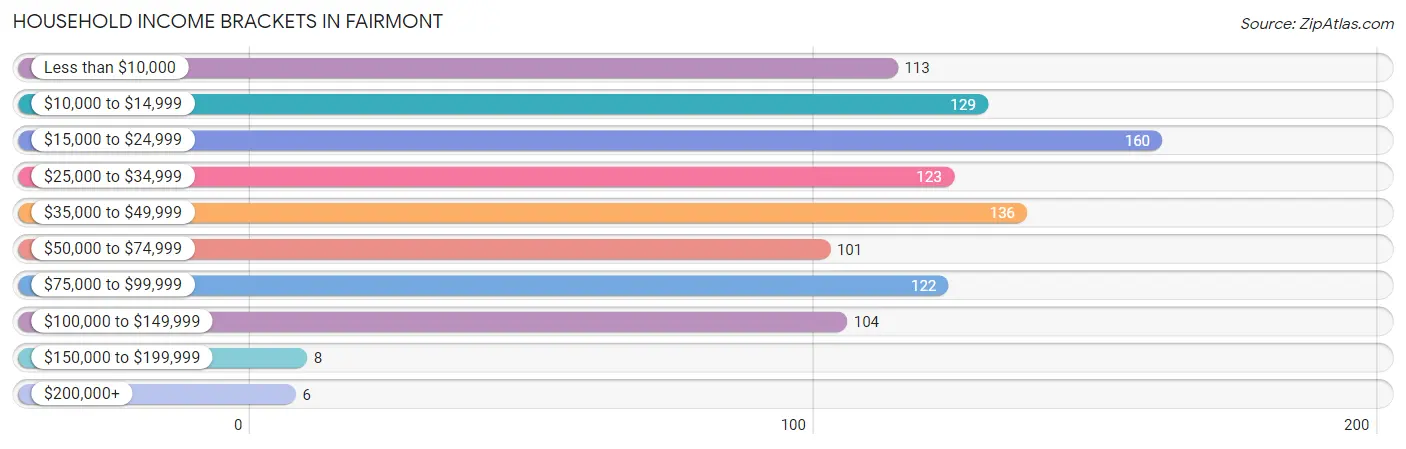
| Income Bracket | # Households | % Households |
| Less than $10,000 | 113 | 11.3% |
| $10,000 to $14,999 | 129 | 12.9% |
| $15,000 to $24,999 | 160 | 16.0% |
| $25,000 to $34,999 | 123 | 12.3% |
| $35,000 to $49,999 | 136 | 13.6% |
| $50,000 to $74,999 | 101 | 10.1% |
| $75,000 to $99,999 | 122 | 12.2% |
| $100,000 to $149,999 | 104 | 10.4% |
| $150,000 to $199,999 | 8 | 0.8% |
| $200,000+ | 6 | 0.6% |
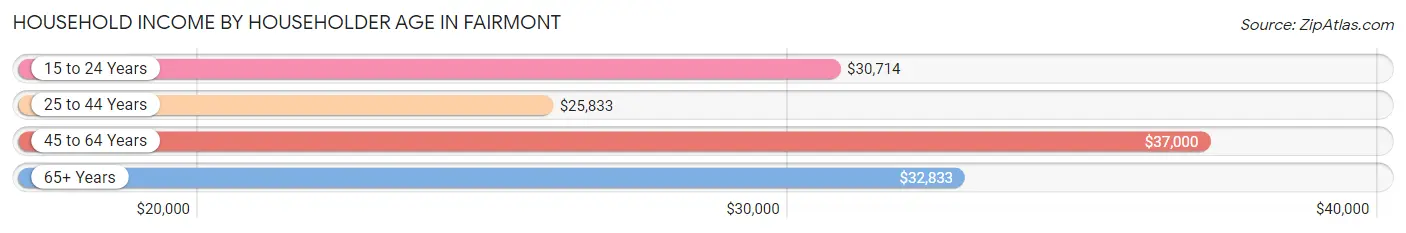
Household Income by Householder Age in Fairmont
The median household income in Fairmont is $31,731, with the highest median household income of $37,000 found in the 45 to 64 years age bracket for the primary householder. A total of 388 households (38.7%) fall into this category. Meanwhile, the 25 to 44 years age bracket for the primary householder has the lowest median household income of $25,833, with 206 households (20.6%) in this group.
| Income Bracket | # Households | Median Income |
| 15 to 24 Years | 34 (3.4%) | $30,714 |
| 25 to 44 Years | 206 (20.6%) | $25,833 |
| 45 to 64 Years | 388 (38.7%) | $37,000 |
| 65+ Years | 374 (37.3%) | $32,833 |
| Total | 1,002 (100.0%) | $31,731 |
Poverty in Fairmont
Income Below Poverty by Sex and Age in Fairmont
With 30.3% poverty level for males and 36.7% for females among the residents of Fairmont, 5 year old males and under 5 year old females are the most vulnerable to poverty, with 8 males (100.0%) and 61 females (82.4%) in their respective age groups living below the poverty level.
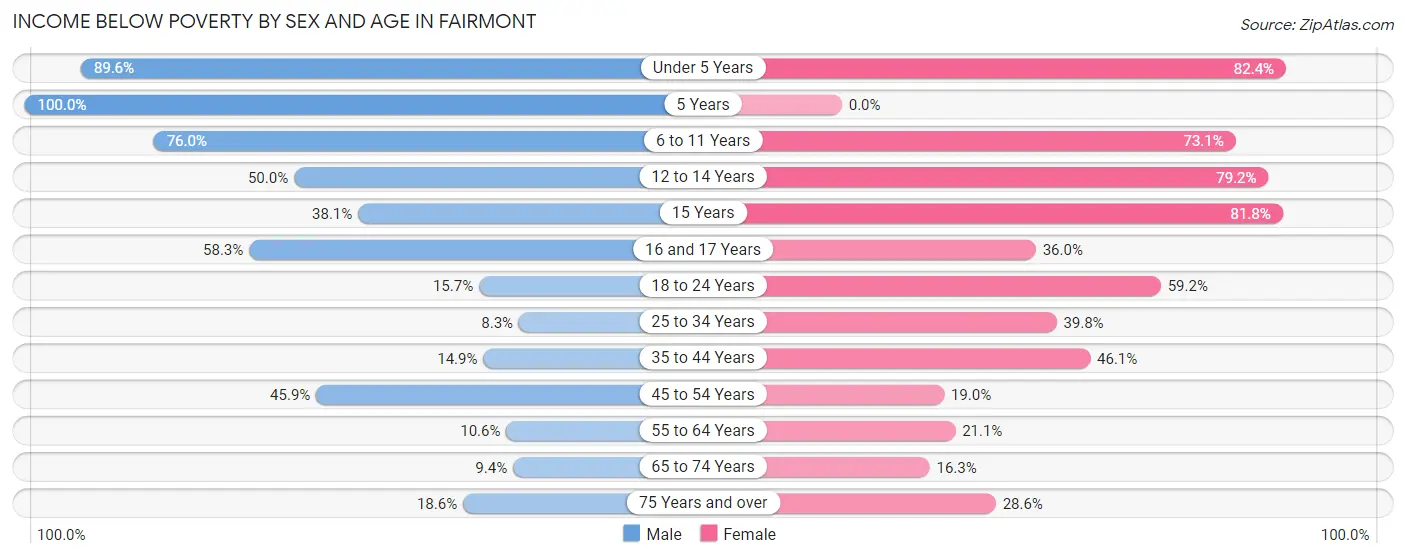
| Age Bracket | Male | Female |
| Under 5 Years | 60 (89.5%) | 61 (82.4%) |
| 5 Years | 8 (100.0%) | 0 (0.0%) |
| 6 to 11 Years | 92 (76.0%) | 57 (73.1%) |
| 12 to 14 Years | 11 (50.0%) | 19 (79.2%) |
| 15 Years | 16 (38.1%) | 18 (81.8%) |
| 16 and 17 Years | 7 (58.3%) | 9 (36.0%) |
| 18 to 24 Years | 26 (15.7%) | 74 (59.2%) |
| 25 to 34 Years | 8 (8.3%) | 49 (39.8%) |
| 35 to 44 Years | 11 (14.9%) | 59 (46.1%) |
| 45 to 54 Years | 39 (45.9%) | 37 (19.0%) |
| 55 to 64 Years | 18 (10.6%) | 52 (21.0%) |
| 65 to 74 Years | 10 (9.3%) | 29 (16.3%) |
| 75 Years and over | 19 (18.6%) | 60 (28.6%) |
| Total | 325 (30.3%) | 524 (36.7%) |
Income Above Poverty by Sex and Age in Fairmont
According to the poverty statistics in Fairmont, males aged 25 to 34 years and females aged 65 to 74 years are the age groups that are most secure financially, with 91.7% of males and 83.7% of females in these age groups living above the poverty line.
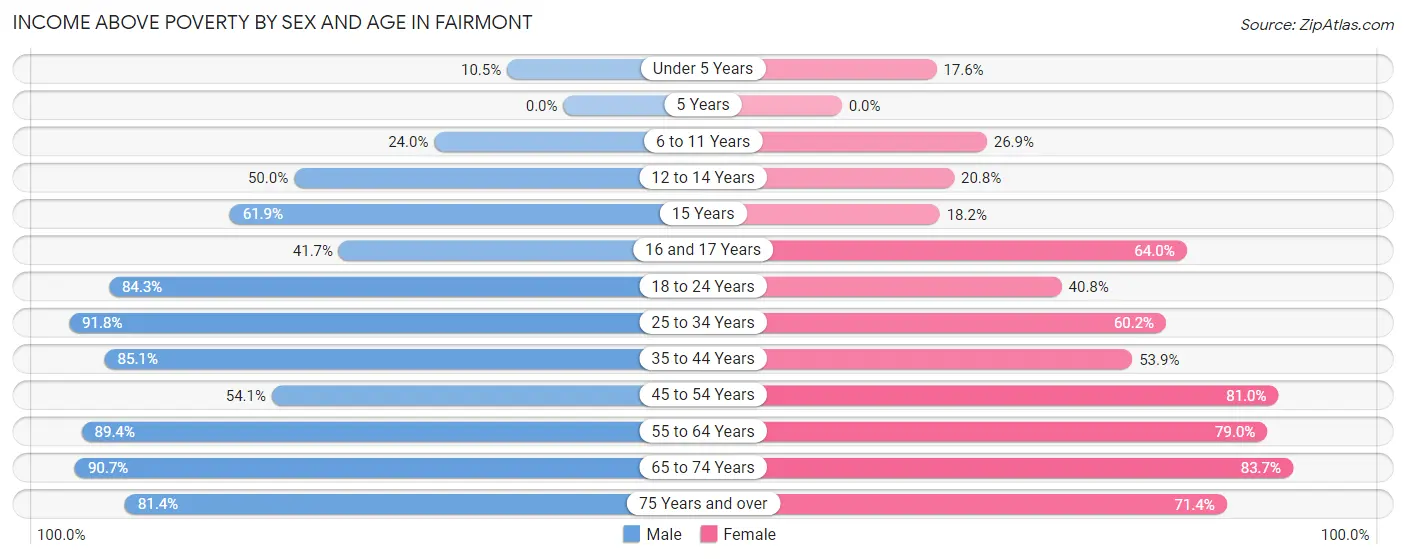
| Age Bracket | Male | Female |
| Under 5 Years | 7 (10.4%) | 13 (17.6%) |
| 5 Years | 0 (0.0%) | 0 (0.0%) |
| 6 to 11 Years | 29 (24.0%) | 21 (26.9%) |
| 12 to 14 Years | 11 (50.0%) | 5 (20.8%) |
| 15 Years | 26 (61.9%) | 4 (18.2%) |
| 16 and 17 Years | 5 (41.7%) | 16 (64.0%) |
| 18 to 24 Years | 140 (84.3%) | 51 (40.8%) |
| 25 to 34 Years | 89 (91.7%) | 74 (60.2%) |
| 35 to 44 Years | 63 (85.1%) | 69 (53.9%) |
| 45 to 54 Years | 46 (54.1%) | 158 (81.0%) |
| 55 to 64 Years | 152 (89.4%) | 195 (78.9%) |
| 65 to 74 Years | 97 (90.6%) | 149 (83.7%) |
| 75 Years and over | 83 (81.4%) | 150 (71.4%) |
| Total | 748 (69.7%) | 905 (63.3%) |
Income Below Poverty Among Married-Couple Families in Fairmont
The poverty statistics for married-couple families in Fairmont show that 7.3% or 18 of the total 245 families live below the poverty line. Families with 1 or 2 children have the highest poverty rate of 19.5%, comprising of 8 families. On the other hand, families with 3 or 4 children have the lowest poverty rate of 0.0%, which includes 0 families.
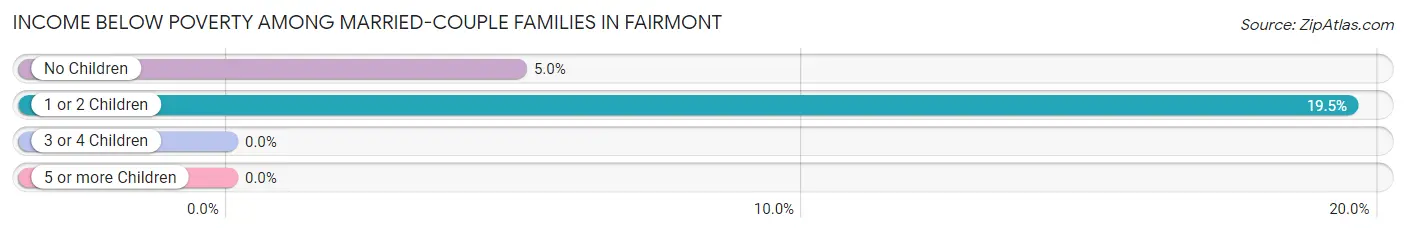
| Children | Above Poverty | Below Poverty |
| No Children | 189 (95.0%) | 10 (5.0%) |
| 1 or 2 Children | 33 (80.5%) | 8 (19.5%) |
| 3 or 4 Children | 5 (100.0%) | 0 (0.0%) |
| 5 or more Children | 0 (0.0%) | 0 (0.0%) |
| Total | 227 (92.6%) | 18 (7.3%) |
Income Below Poverty Among Single-Parent Households in Fairmont
According to the poverty data in Fairmont, 23.2% or 16 single-father households and 49.3% or 142 single-mother households are living below the poverty line. Among single-father households, those with 1 or 2 children have the highest poverty rate, with 11 households (47.8%) experiencing poverty. Likewise, among single-mother households, those with 3 or 4 children have the highest poverty rate, with 61 households (95.3%) falling below the poverty line.
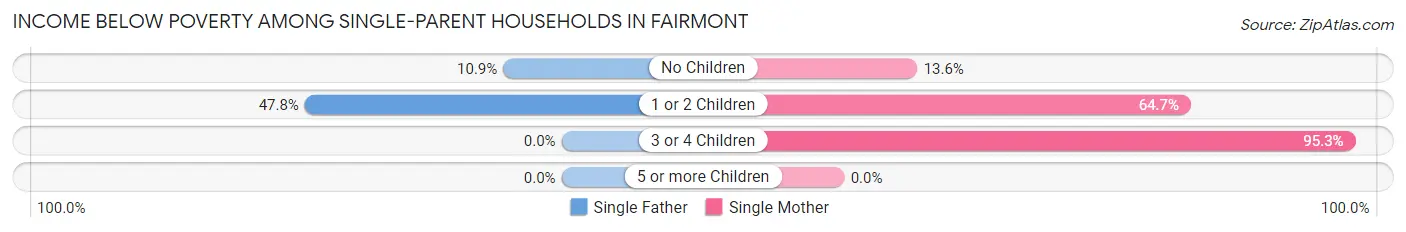
| Children | Single Father | Single Mother |
| No Children | 5 (10.9%) | 17 (13.6%) |
| 1 or 2 Children | 11 (47.8%) | 64 (64.6%) |
| 3 or 4 Children | 0 (0.0%) | 61 (95.3%) |
| 5 or more Children | 0 (0.0%) | 0 (0.0%) |
| Total | 16 (23.2%) | 142 (49.3%) |
Income Below Poverty Among Married-Couple vs Single-Parent Households in Fairmont
The poverty data for Fairmont shows that 18 of the married-couple family households (7.3%) and 158 of the single-parent households (44.3%) are living below the poverty level. Within the married-couple family households, those with 1 or 2 children have the highest poverty rate, with 8 households (19.5%) falling below the poverty line. Among the single-parent households, those with 3 or 4 children have the highest poverty rate, with 61 household (95.3%) living below poverty.
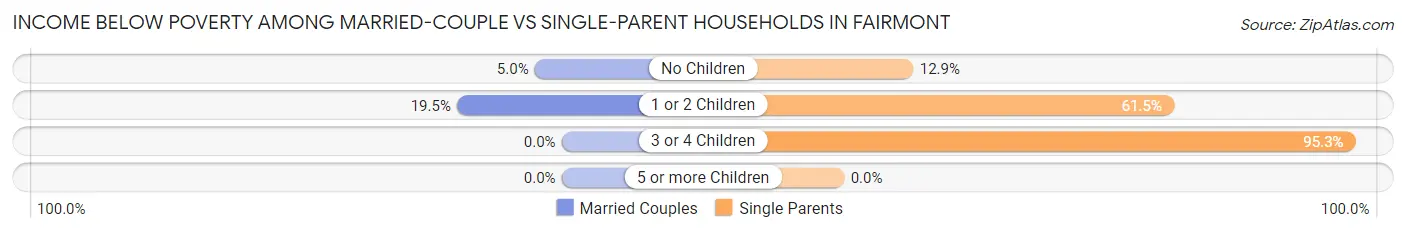
| Children | Married-Couple Families | Single-Parent Households |
| No Children | 10 (5.0%) | 22 (12.9%) |
| 1 or 2 Children | 8 (19.5%) | 75 (61.5%) |
| 3 or 4 Children | 0 (0.0%) | 61 (95.3%) |
| 5 or more Children | 0 (0.0%) | 0 (0.0%) |
| Total | 18 (7.3%) | 158 (44.3%) |
Race in Fairmont
The most populous races in Fairmont are Black / African American (1,346 | 53.4%), White / Caucasian (641 | 25.5%), and Native / Alaskan (508 | 20.2%).
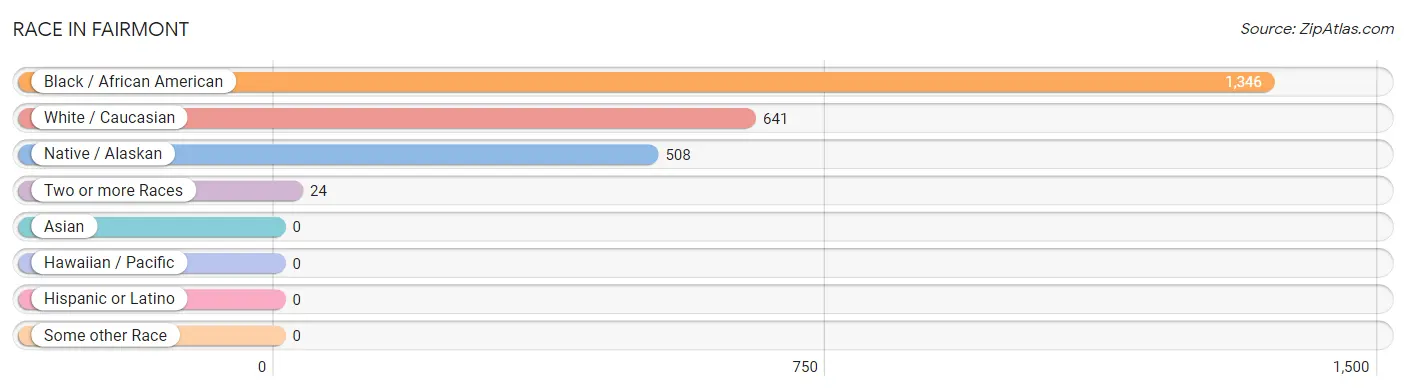
| Race | # Population | % Population |
| Asian | 0 | 0.0% |
| Black / African American | 1,346 | 53.4% |
| Hawaiian / Pacific | 0 | 0.0% |
| Hispanic or Latino | 0 | 0.0% |
| Native / Alaskan | 508 | 20.2% |
| White / Caucasian | 641 | 25.5% |
| Two or more Races | 24 | 0.9% |
| Some other Race | 0 | 0.0% |
| Total | 2,519 | 100.0% |
Ancestry in Fairmont
The most populous ancestries reported in Fairmont are American (901 | 35.8%), Lumbee (391 | 15.5%), English (105 | 4.2%), Scotch-Irish (88 | 3.5%), and Irish (68 | 2.7%), together accounting for 61.7% of all Fairmont residents.
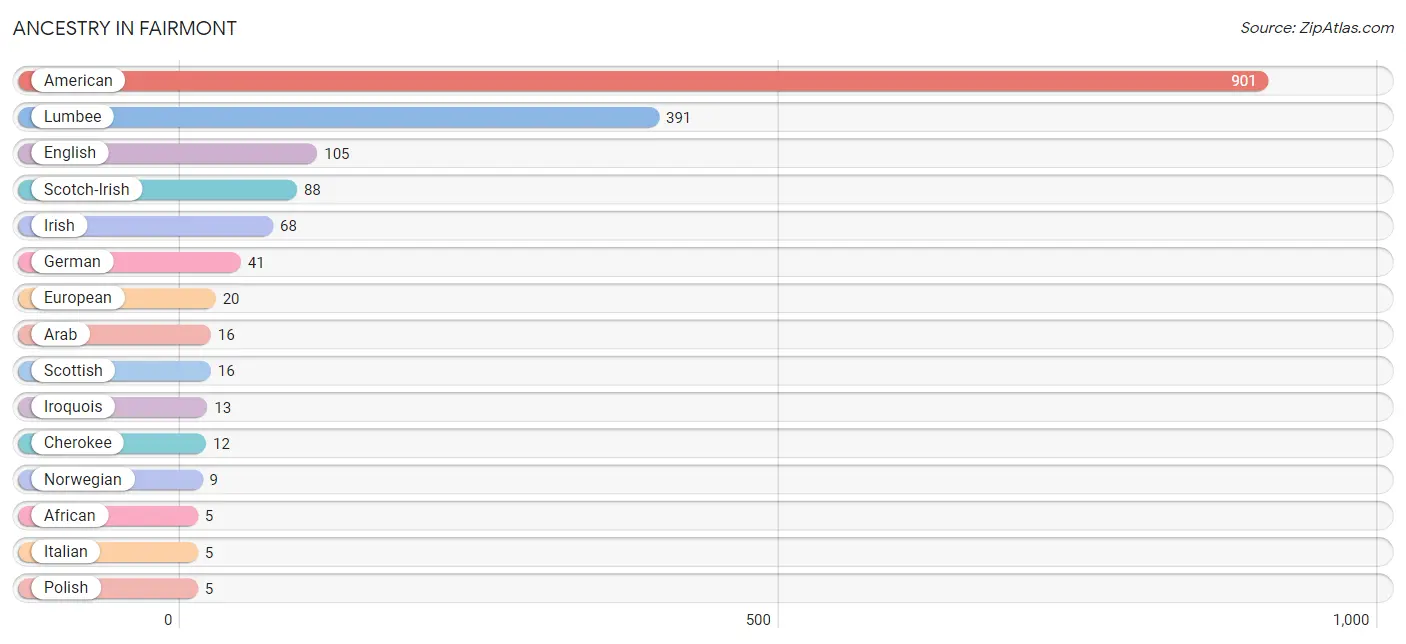
| Ancestry | # Population | % Population |
| African | 5 | 0.2% |
| American | 901 | 35.8% |
| Arab | 16 | 0.6% |
| Cherokee | 12 | 0.5% |
| Dutch | 3 | 0.1% |
| English | 105 | 4.2% |
| European | 20 | 0.8% |
| Finnish | 3 | 0.1% |
| German | 41 | 1.6% |
| Irish | 68 | 2.7% |
| Iroquois | 13 | 0.5% |
| Italian | 5 | 0.2% |
| Lumbee | 391 | 15.5% |
| Norwegian | 9 | 0.4% |
| Polish | 5 | 0.2% |
| Scotch-Irish | 88 | 3.5% |
| Scottish | 16 | 0.6% |
| Subsaharan African | 5 | 0.2% |
| Welsh | 3 | 0.1% | View All 19 Rows |
Immigrants in Fairmont
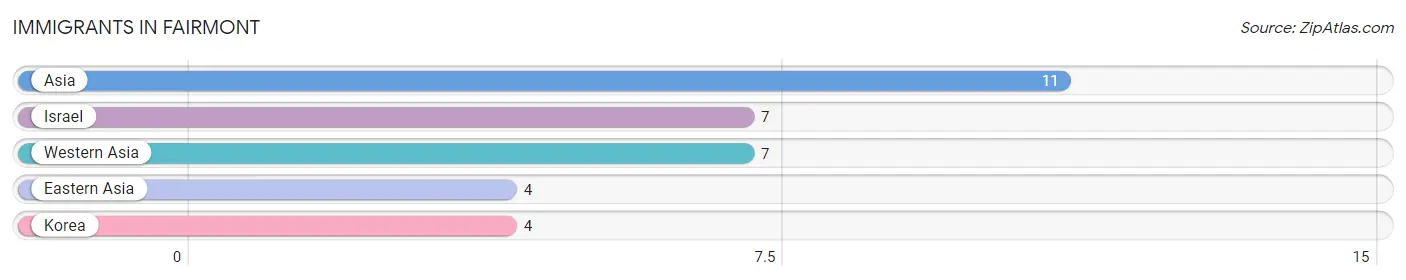
The most numerous immigrant groups reported in Fairmont came from Asia (11 | 0.4%), Israel (7 | 0.3%), Western Asia (7 | 0.3%), Eastern Asia (4 | 0.2%), and Korea (4 | 0.2%), together accounting for 1.3% of all Fairmont residents.
| Immigration Origin | # Population | % Population |
| Asia | 11 | 0.4% |
| Eastern Asia | 4 | 0.2% |
| Israel | 7 | 0.3% |
| Korea | 4 | 0.2% |
| Western Asia | 7 | 0.3% | View All 5 Rows |
Sex and Age in Fairmont
Sex and Age in Fairmont
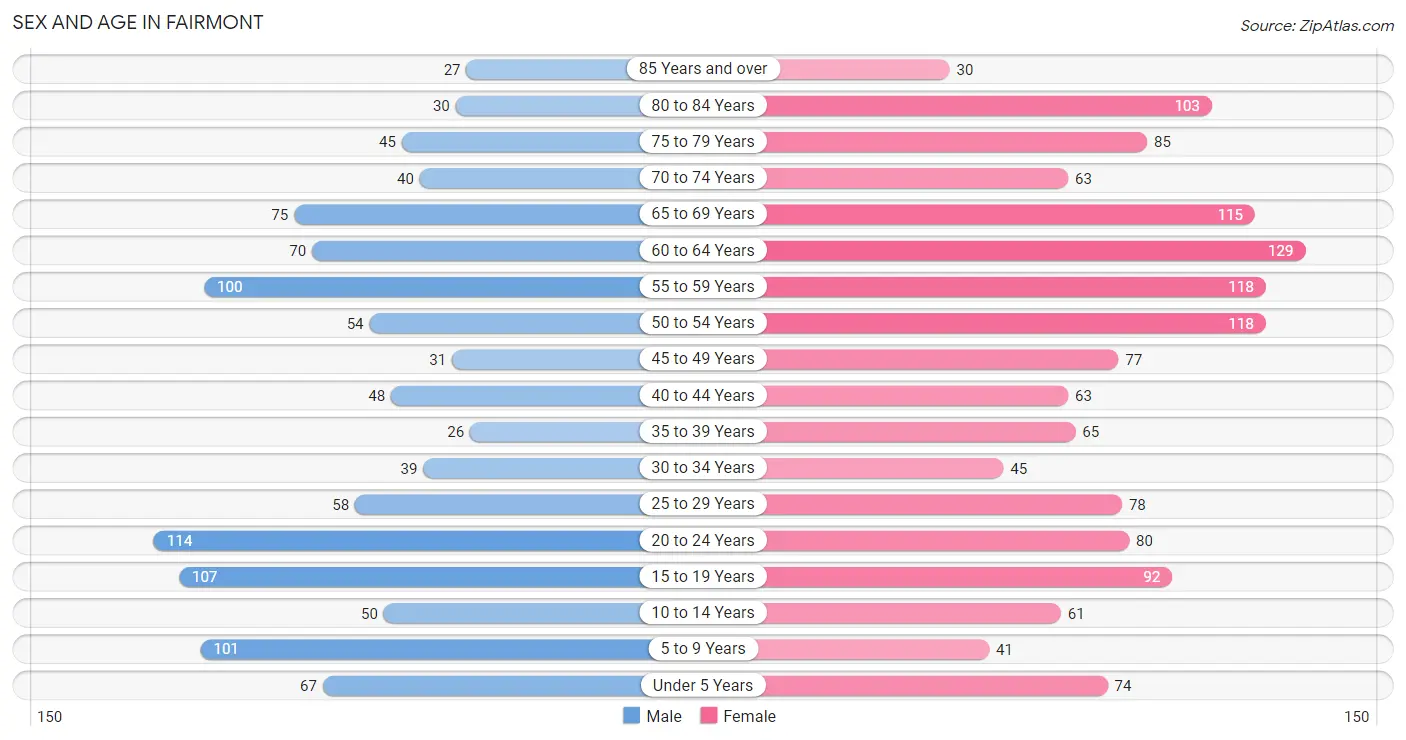
The most populous age groups in Fairmont are 20 to 24 Years (114 | 10.5%) for men and 60 to 64 Years (129 | 9.0%) for women.
| Age Bracket | Male | Female |
| Under 5 Years | 67 (6.2%) | 74 (5.1%) |
| 5 to 9 Years | 101 (9.3%) | 41 (2.9%) |
| 10 to 14 Years | 50 (4.6%) | 61 (4.2%) |
| 15 to 19 Years | 107 (9.9%) | 92 (6.4%) |
| 20 to 24 Years | 114 (10.5%) | 80 (5.6%) |
| 25 to 29 Years | 58 (5.4%) | 78 (5.4%) |
| 30 to 34 Years | 39 (3.6%) | 45 (3.1%) |
| 35 to 39 Years | 26 (2.4%) | 65 (4.5%) |
| 40 to 44 Years | 48 (4.4%) | 63 (4.4%) |
| 45 to 49 Years | 31 (2.9%) | 77 (5.4%) |
| 50 to 54 Years | 54 (5.0%) | 118 (8.2%) |
| 55 to 59 Years | 100 (9.2%) | 118 (8.2%) |
| 60 to 64 Years | 70 (6.5%) | 129 (9.0%) |
| 65 to 69 Years | 75 (6.9%) | 115 (8.0%) |
| 70 to 74 Years | 40 (3.7%) | 63 (4.4%) |
| 75 to 79 Years | 45 (4.2%) | 85 (5.9%) |
| 80 to 84 Years | 30 (2.8%) | 103 (7.2%) |
| 85 Years and over | 27 (2.5%) | 30 (2.1%) |
| Total | 1,082 (100.0%) | 1,437 (100.0%) |
Families and Households in Fairmont
Median Family Size in Fairmont
The median family size in Fairmont is 3.27 persons per family, with single female/mother families (288 | 47.8%) accounting for the largest median family size of 3.61 persons per family. On the other hand, married-couple families (245 | 40.7%) represent the smallest median family size with 2.82 persons per family.
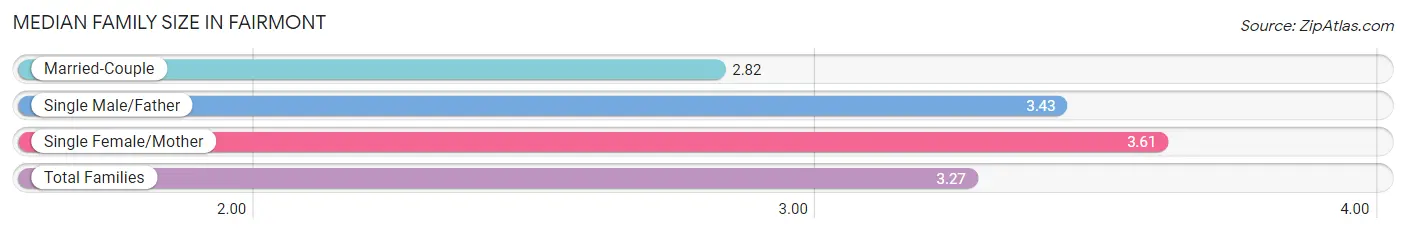
| Family Type | # Families | Family Size |
| Married-Couple | 245 (40.7%) | 2.82 |
| Single Male/Father | 69 (11.5%) | 3.43 |
| Single Female/Mother | 288 (47.8%) | 3.61 |
| Total Families | 602 (100.0%) | 3.27 |
Median Household Size in Fairmont
The median household size in Fairmont is 2.50 persons per household, with single male/father households (69 | 6.9%) accounting for the largest median household size of 4.01 persons per household. non-family households (400 | 39.9%) represent the smallest median household size with 1.14 persons per household.
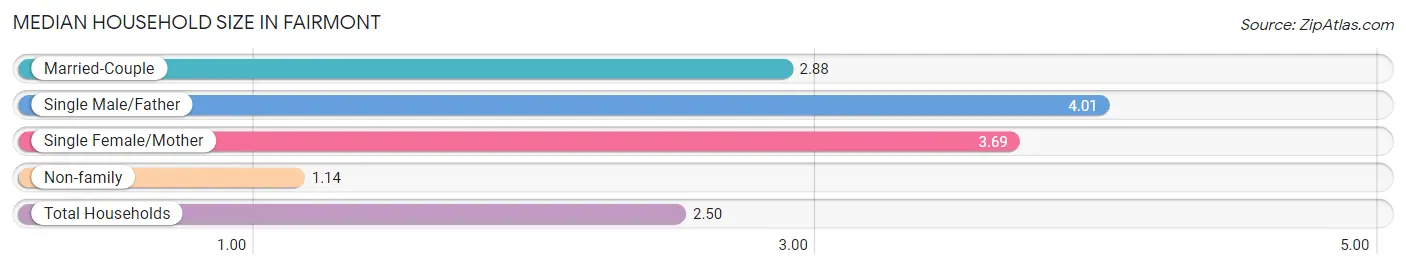
| Household Type | # Households | Household Size |
| Married-Couple | 245 (24.4%) | 2.88 |
| Single Male/Father | 69 (6.9%) | 4.01 |
| Single Female/Mother | 288 (28.7%) | 3.69 |
| Non-family | 400 (39.9%) | 1.14 |
| Total Households | 1,002 (100.0%) | 2.50 |
Household Size by Marriage Status in Fairmont
Out of a total of 1,002 households in Fairmont, 602 (60.1%) are family households, while 400 (39.9%) are nonfamily households. The most numerous type of family households are 2-person households, comprising 270, and the most common type of nonfamily households are 1-person households, comprising 369.
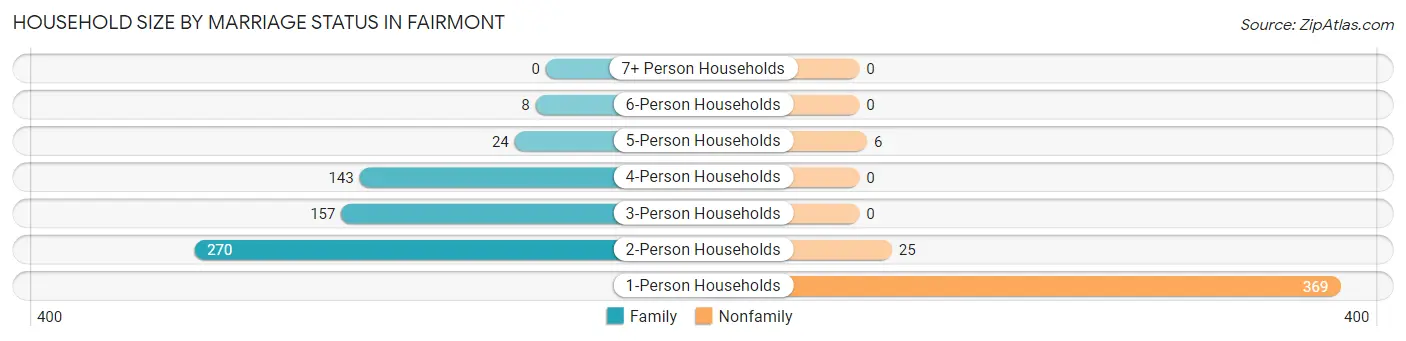
| Household Size | Family Households | Nonfamily Households |
| 1-Person Households | - | 369 (36.8%) |
| 2-Person Households | 270 (27.0%) | 25 (2.5%) |
| 3-Person Households | 157 (15.7%) | 0 (0.0%) |
| 4-Person Households | 143 (14.3%) | 0 (0.0%) |
| 5-Person Households | 24 (2.4%) | 6 (0.6%) |
| 6-Person Households | 8 (0.8%) | 0 (0.0%) |
| 7+ Person Households | 0 (0.0%) | 0 (0.0%) |
| Total | 602 (60.1%) | 400 (39.9%) |
Female Fertility in Fairmont
Fertility by Age in Fairmont
Average fertility rate in Fairmont is 41.0 births per 1,000 women. Women in the age bracket of 20 to 34 years have the highest fertility rate with 54.0 births per 1,000 women. Women in the age bracket of 20 to 34 years acount for 52.4% of all women with births.
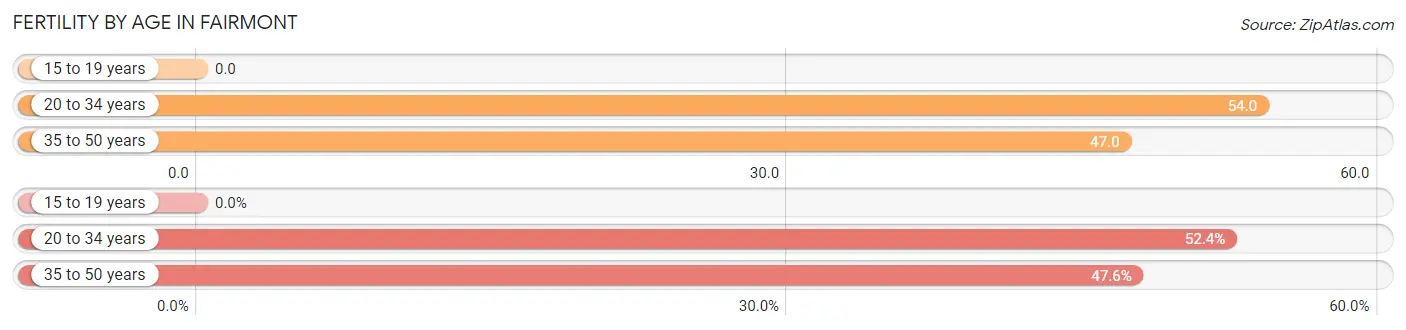
| Age Bracket | Women with Births | Births / 1,000 Women |
| 15 to 19 years | 0 (0.0%) | 0.0 |
| 20 to 34 years | 11 (52.4%) | 54.0 |
| 35 to 50 years | 10 (47.6%) | 47.0 |
| Total | 21 (100.0%) | 41.0 |
Fertility by Age by Marriage Status in Fairmont
19.0% of women with births (21) in Fairmont are married. The highest percentage of unmarried women with births falls into 20 to 34 years age bracket with 100.0% of them unmarried at the time of birth, while the lowest percentage of unmarried women with births belong to 35 to 50 years age bracket with 60.0% of them unmarried.
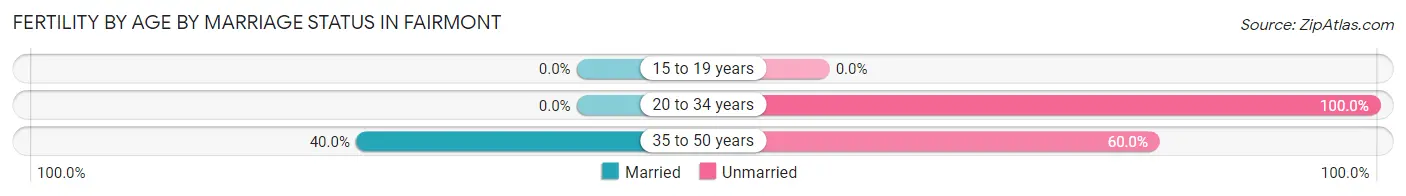
| Age Bracket | Married | Unmarried |
| 15 to 19 years | 0 (0.0%) | 0 (0.0%) |
| 20 to 34 years | 0 (0.0%) | 11 (100.0%) |
| 35 to 50 years | 4 (40.0%) | 6 (60.0%) |
| Total | 4 (19.1%) | 17 (80.9%) |
Fertility by Education in Fairmont
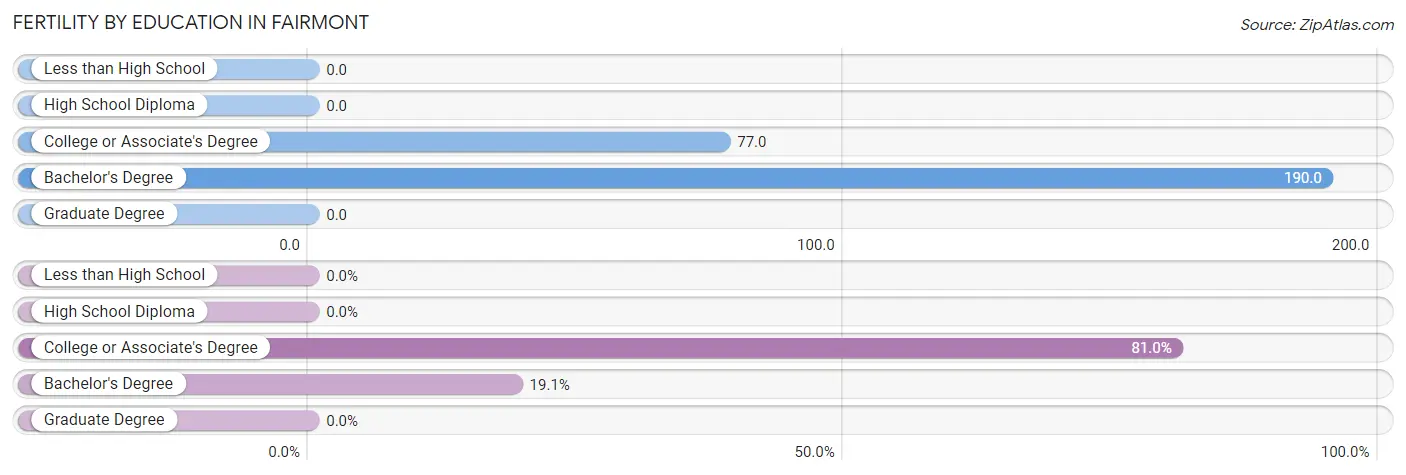
| Educational Attainment | Women with Births | Births / 1,000 Women |
| Less than High School | 0 (0.0%) | 0.0 |
| High School Diploma | 0 (0.0%) | 0.0 |
| College or Associate's Degree | 17 (80.9%) | 77.0 |
| Bachelor's Degree | 4 (19.1%) | 190.0 |
| Graduate Degree | 0 (0.0%) | 0.0 |
| Total | 21 (100.0%) | 41.0 |
Fertility by Education by Marriage Status in Fairmont
80.9% of women with births in Fairmont are unmarried. Women with the educational attainment of bachelor's degree are most likely to be married with 100.0% of them married at childbirth, while women with the educational attainment of college or associate's degree are least likely to be married with 100.0% of them unmarried at childbirth.
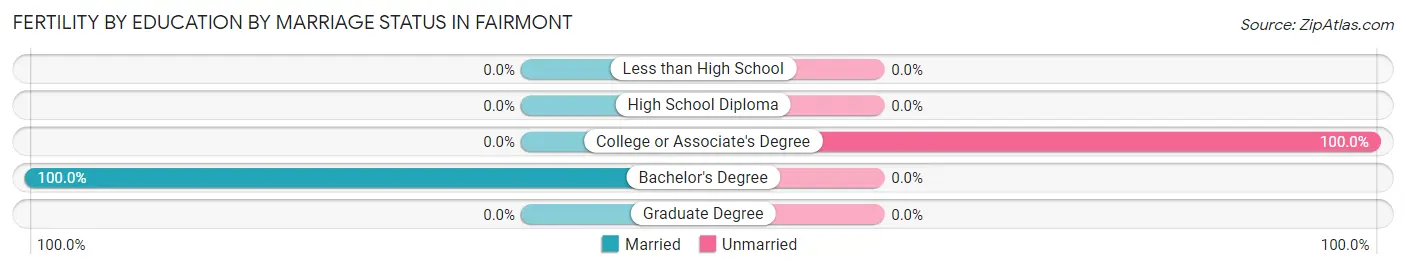
| Educational Attainment | Married | Unmarried |
| Less than High School | 0 (0.0%) | 0 (0.0%) |
| High School Diploma | 0 (0.0%) | 0 (0.0%) |
| College or Associate's Degree | 0 (0.0%) | 17 (100.0%) |
| Bachelor's Degree | 4 (100.0%) | 0 (0.0%) |
| Graduate Degree | 0 (0.0%) | 0 (0.0%) |
| Total | 4 (19.1%) | 17 (80.9%) |
Employment Characteristics in Fairmont
Employment by Class of Employer in Fairmont
Among the 791 employed individuals in Fairmont, private company employees (551 | 69.7%), state government employees (87 | 11.0%), and not-for-profit organizations (58 | 7.3%) make up the most common classes of employment.
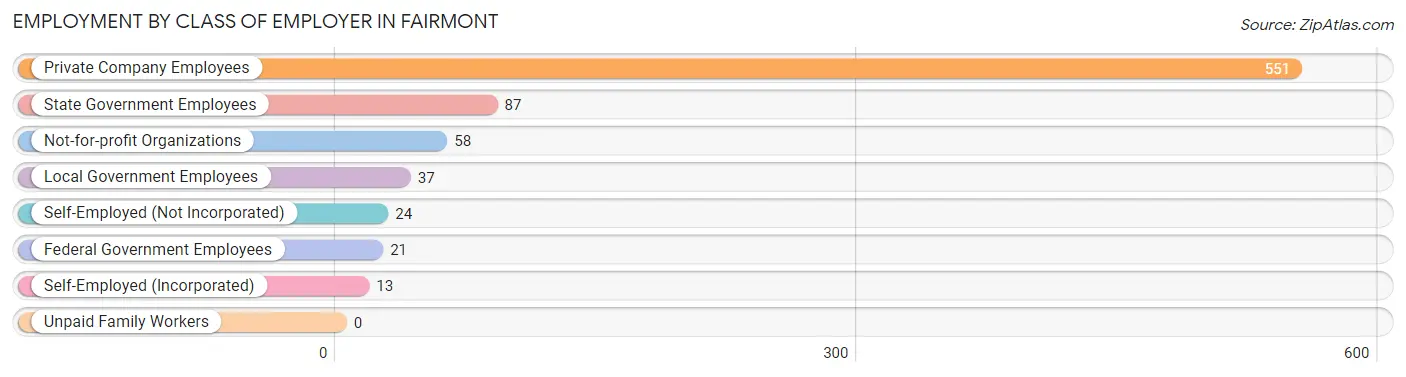
| Employer Class | # Employees | % Employees |
| Private Company Employees | 551 | 69.7% |
| Self-Employed (Incorporated) | 13 | 1.6% |
| Self-Employed (Not Incorporated) | 24 | 3.0% |
| Not-for-profit Organizations | 58 | 7.3% |
| Local Government Employees | 37 | 4.7% |
| State Government Employees | 87 | 11.0% |
| Federal Government Employees | 21 | 2.6% |
| Unpaid Family Workers | 0 | 0.0% |
| Total | 791 | 100.0% |
Employment Status by Age in Fairmont
According to the labor force statistics for Fairmont, out of the total population over 16 years of age (2,061), 42.0% or 866 individuals are in the labor force, with 8.7% or 75 of them unemployed. The age group with the highest labor force participation rate is 35 to 44 years, with 81.2% or 164 individuals in the labor force. Within the labor force, the 16 to 19 years age range has the highest percentage of unemployed individuals, with 52.2% or 24 of them being unemployed.
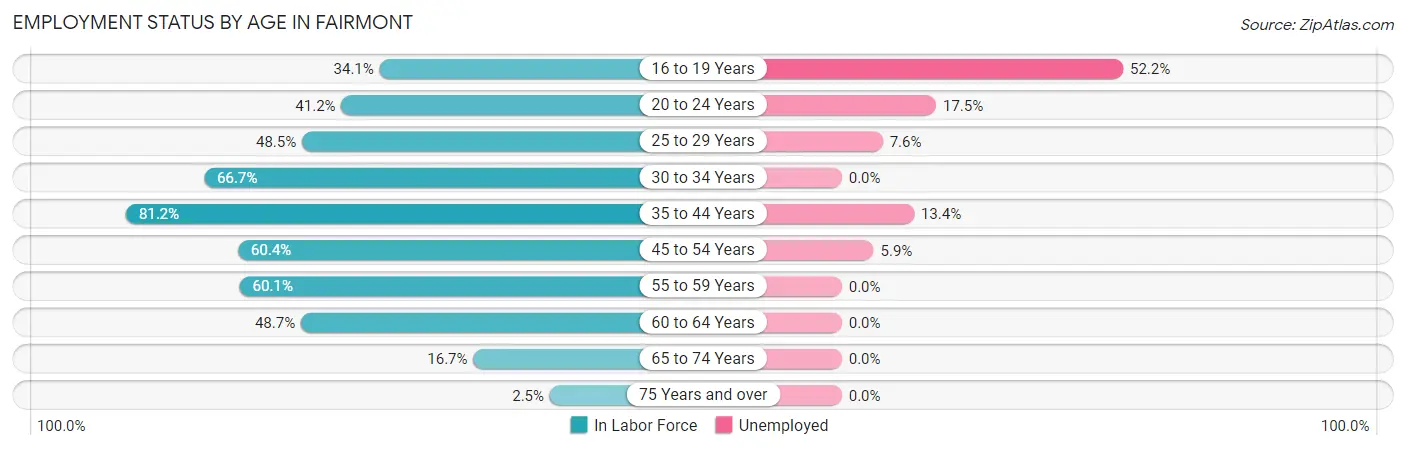
| Age Bracket | In Labor Force | Unemployed |
| 16 to 19 Years | 46 (34.1%) | 24 (52.2%) |
| 20 to 24 Years | 80 (41.2%) | 14 (17.5%) |
| 25 to 29 Years | 66 (48.5%) | 5 (7.6%) |
| 30 to 34 Years | 56 (66.7%) | 0 (0.0%) |
| 35 to 44 Years | 164 (81.2%) | 22 (13.4%) |
| 45 to 54 Years | 169 (60.4%) | 10 (5.9%) |
| 55 to 59 Years | 131 (60.1%) | 0 (0.0%) |
| 60 to 64 Years | 97 (48.7%) | 0 (0.0%) |
| 65 to 74 Years | 49 (16.7%) | 0 (0.0%) |
| 75 Years and over | 8 (2.5%) | 0 (0.0%) |
| Total | 866 (42.0%) | 75 (8.7%) |
Employment Status by Educational Attainment in Fairmont
According to labor force statistics for Fairmont, 61.0% of individuals (683) out of the total population between 25 and 64 years of age (1,119) are in the labor force, with 5.4% or 37 of them being unemployed. The group with the highest labor force participation rate are those with the educational attainment of bachelor's degree or higher, with 81.4% or 149 individuals in the labor force. Within the labor force, individuals with less than high school education have the highest percentage of unemployment, with 24.3% or 9 of them being unemployed.
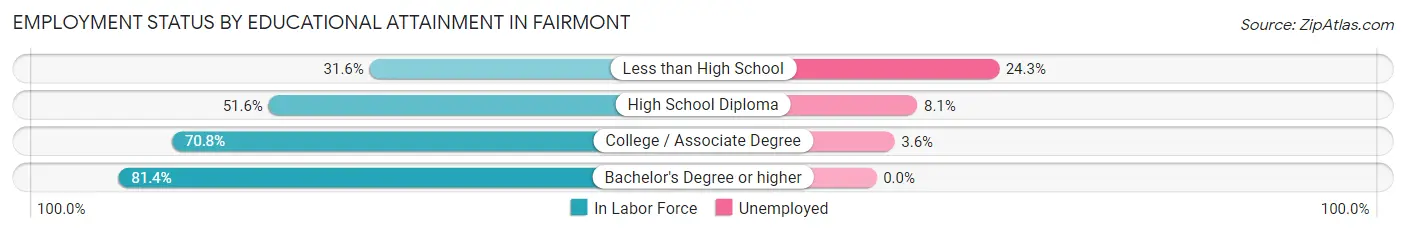
| Educational Attainment | In Labor Force | Unemployed |
| Less than High School | 37 (31.6%) | 28 (24.3%) |
| High School Diploma | 223 (51.6%) | 35 (8.1%) |
| College / Associate Degree | 274 (70.8%) | 14 (3.6%) |
| Bachelor's Degree or higher | 149 (81.4%) | 0 (0.0%) |
| Total | 683 (61.0%) | 60 (5.4%) |
Employment Occupations by Sex in Fairmont
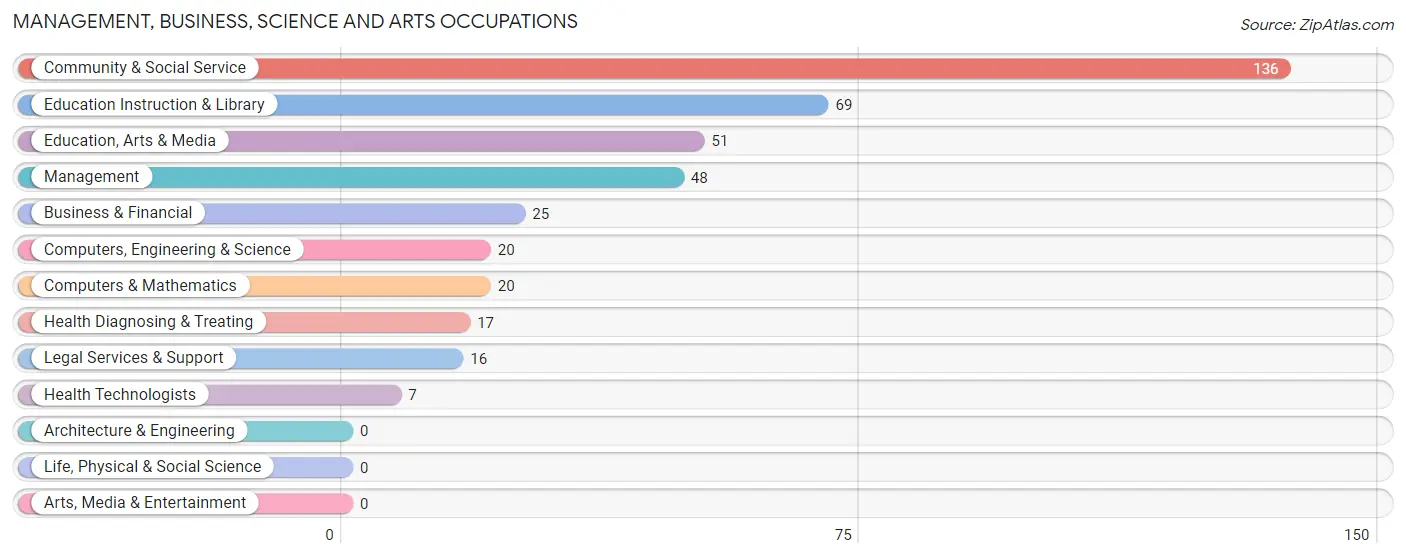
Management, Business, Science and Arts Occupations
The most common Management, Business, Science and Arts occupations in Fairmont are Community & Social Service (136 | 17.2%), Education Instruction & Library (69 | 8.7%), Education, Arts & Media (51 | 6.5%), Management (48 | 6.1%), and Business & Financial (25 | 3.2%).
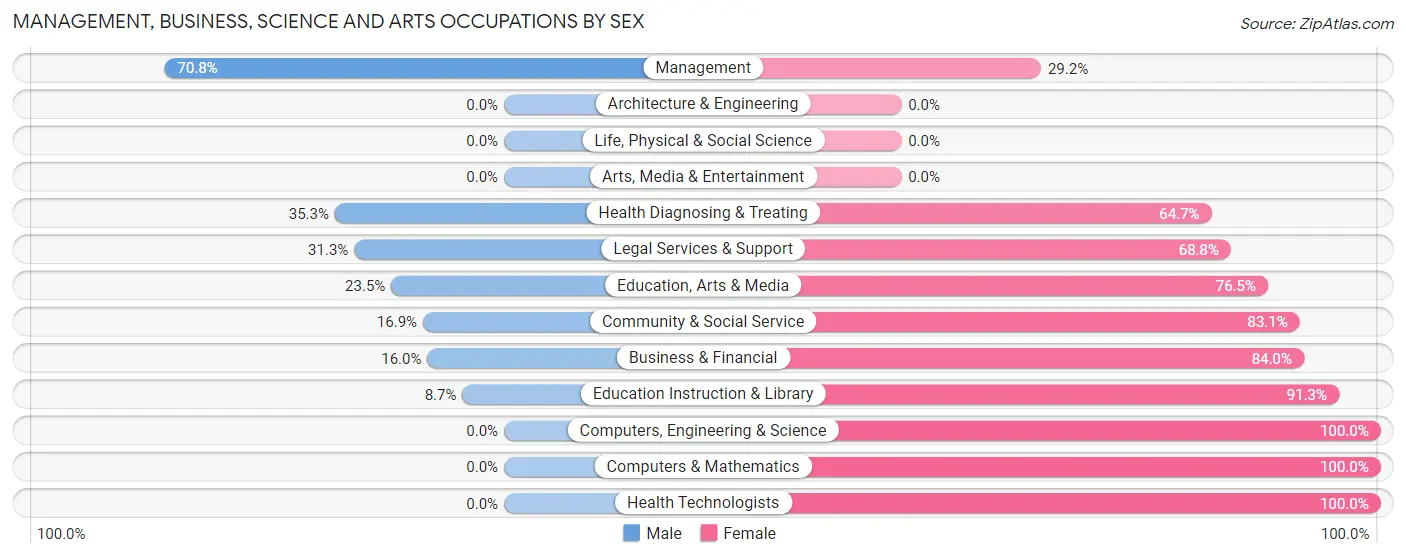
Management, Business, Science and Arts Occupations by Sex
Within the Management, Business, Science and Arts occupations in Fairmont, the most male-oriented occupations are Management (70.8%), Health Diagnosing & Treating (35.3%), and Legal Services & Support (31.2%), while the most female-oriented occupations are Computers, Engineering & Science (100.0%), Computers & Mathematics (100.0%), and Health Technologists (100.0%).
| Occupation | Male | Female |
| Management | 34 (70.8%) | 14 (29.2%) |
| Business & Financial | 4 (16.0%) | 21 (84.0%) |
| Computers, Engineering & Science | 0 (0.0%) | 20 (100.0%) |
| Computers & Mathematics | 0 (0.0%) | 20 (100.0%) |
| Architecture & Engineering | 0 (0.0%) | 0 (0.0%) |
| Life, Physical & Social Science | 0 (0.0%) | 0 (0.0%) |
| Community & Social Service | 23 (16.9%) | 113 (83.1%) |
| Education, Arts & Media | 12 (23.5%) | 39 (76.5%) |
| Legal Services & Support | 5 (31.2%) | 11 (68.8%) |
| Education Instruction & Library | 6 (8.7%) | 63 (91.3%) |
| Arts, Media & Entertainment | 0 (0.0%) | 0 (0.0%) |
| Health Diagnosing & Treating | 6 (35.3%) | 11 (64.7%) |
| Health Technologists | 0 (0.0%) | 7 (100.0%) |
| Total (Category) | 67 (27.2%) | 179 (72.8%) |
| Total (Overall) | 324 (41.0%) | 467 (59.0%) |
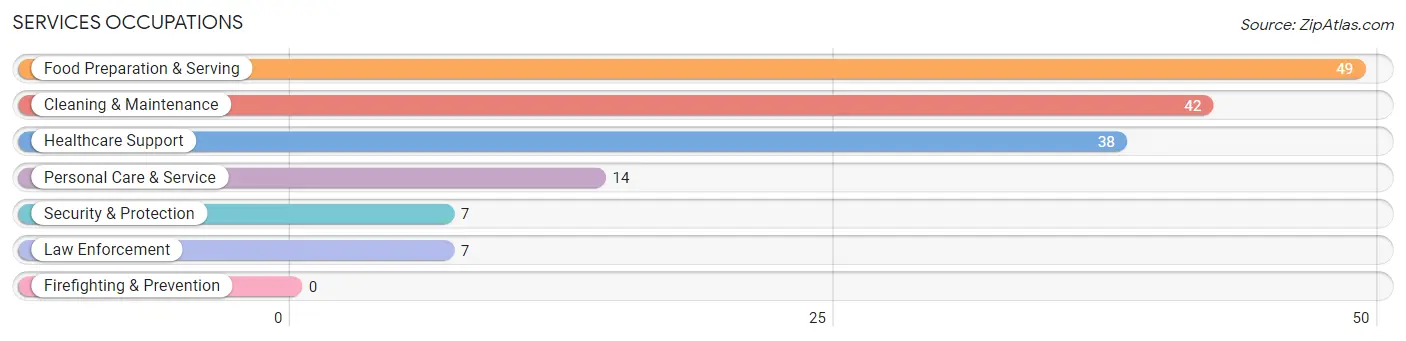
Services Occupations
The most common Services occupations in Fairmont are Food Preparation & Serving (49 | 6.2%), Cleaning & Maintenance (42 | 5.3%), Healthcare Support (38 | 4.8%), Personal Care & Service (14 | 1.8%), and Security & Protection (7 | 0.9%).
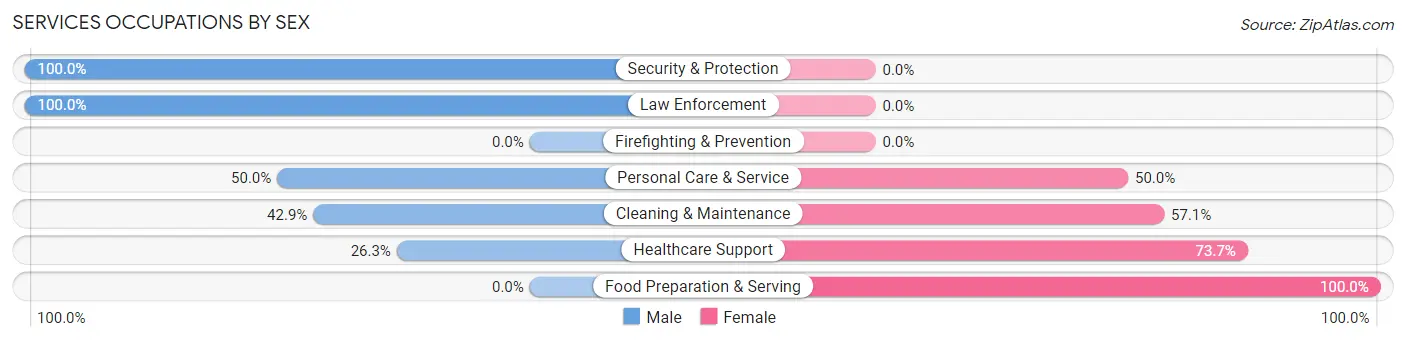
Services Occupations by Sex
Within the Services occupations in Fairmont, the most male-oriented occupations are Security & Protection (100.0%), Law Enforcement (100.0%), and Personal Care & Service (50.0%), while the most female-oriented occupations are Food Preparation & Serving (100.0%), Healthcare Support (73.7%), and Cleaning & Maintenance (57.1%).
| Occupation | Male | Female |
| Healthcare Support | 10 (26.3%) | 28 (73.7%) |
| Security & Protection | 7 (100.0%) | 0 (0.0%) |
| Firefighting & Prevention | 0 (0.0%) | 0 (0.0%) |
| Law Enforcement | 7 (100.0%) | 0 (0.0%) |
| Food Preparation & Serving | 0 (0.0%) | 49 (100.0%) |
| Cleaning & Maintenance | 18 (42.9%) | 24 (57.1%) |
| Personal Care & Service | 7 (50.0%) | 7 (50.0%) |
| Total (Category) | 42 (28.0%) | 108 (72.0%) |
| Total (Overall) | 324 (41.0%) | 467 (59.0%) |
Sales and Office Occupations
The most common Sales and Office occupations in Fairmont are Sales & Related (108 | 13.7%), and Office & Administration (76 | 9.6%).
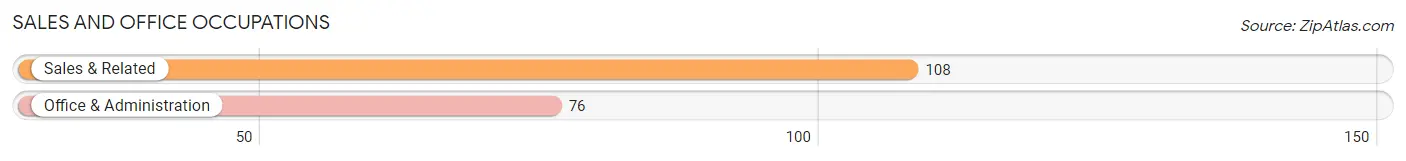
Sales and Office Occupations by Sex
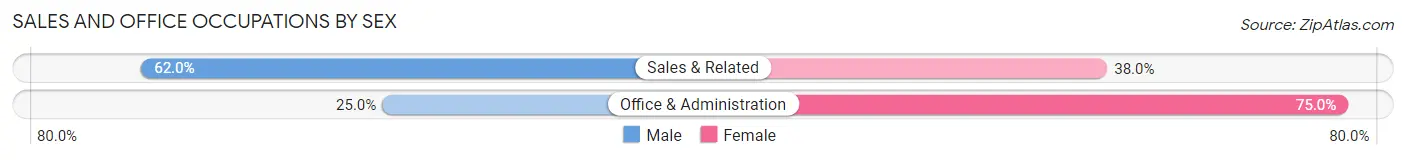
| Occupation | Male | Female |
| Sales & Related | 67 (62.0%) | 41 (38.0%) |
| Office & Administration | 19 (25.0%) | 57 (75.0%) |
| Total (Category) | 86 (46.7%) | 98 (53.3%) |
| Total (Overall) | 324 (41.0%) | 467 (59.0%) |
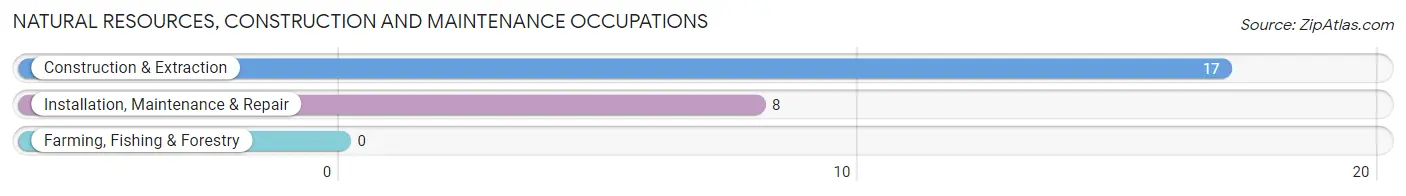
Natural Resources, Construction and Maintenance Occupations
The most common Natural Resources, Construction and Maintenance occupations in Fairmont are Construction & Extraction (17 | 2.1%), and Installation, Maintenance & Repair (8 | 1.0%).
Natural Resources, Construction and Maintenance Occupations by Sex
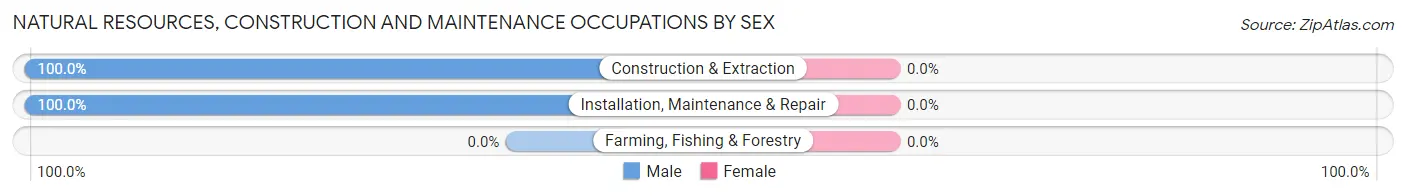
| Occupation | Male | Female |
| Farming, Fishing & Forestry | 0 (0.0%) | 0 (0.0%) |
| Construction & Extraction | 17 (100.0%) | 0 (0.0%) |
| Installation, Maintenance & Repair | 8 (100.0%) | 0 (0.0%) |
| Total (Category) | 25 (100.0%) | 0 (0.0%) |
| Total (Overall) | 324 (41.0%) | 467 (59.0%) |
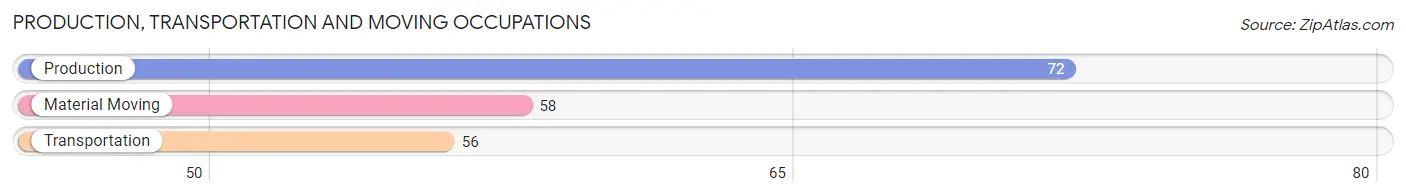
Production, Transportation and Moving Occupations
The most common Production, Transportation and Moving occupations in Fairmont are Production (72 | 9.1%), Material Moving (58 | 7.3%), and Transportation (56 | 7.1%).
Production, Transportation and Moving Occupations by Sex
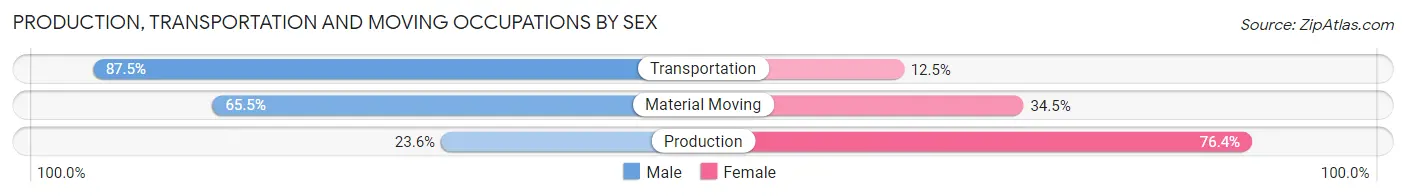
| Occupation | Male | Female |
| Production | 17 (23.6%) | 55 (76.4%) |
| Transportation | 49 (87.5%) | 7 (12.5%) |
| Material Moving | 38 (65.5%) | 20 (34.5%) |
| Total (Category) | 104 (55.9%) | 82 (44.1%) |
| Total (Overall) | 324 (41.0%) | 467 (59.0%) |
Employment Industries by Sex in Fairmont
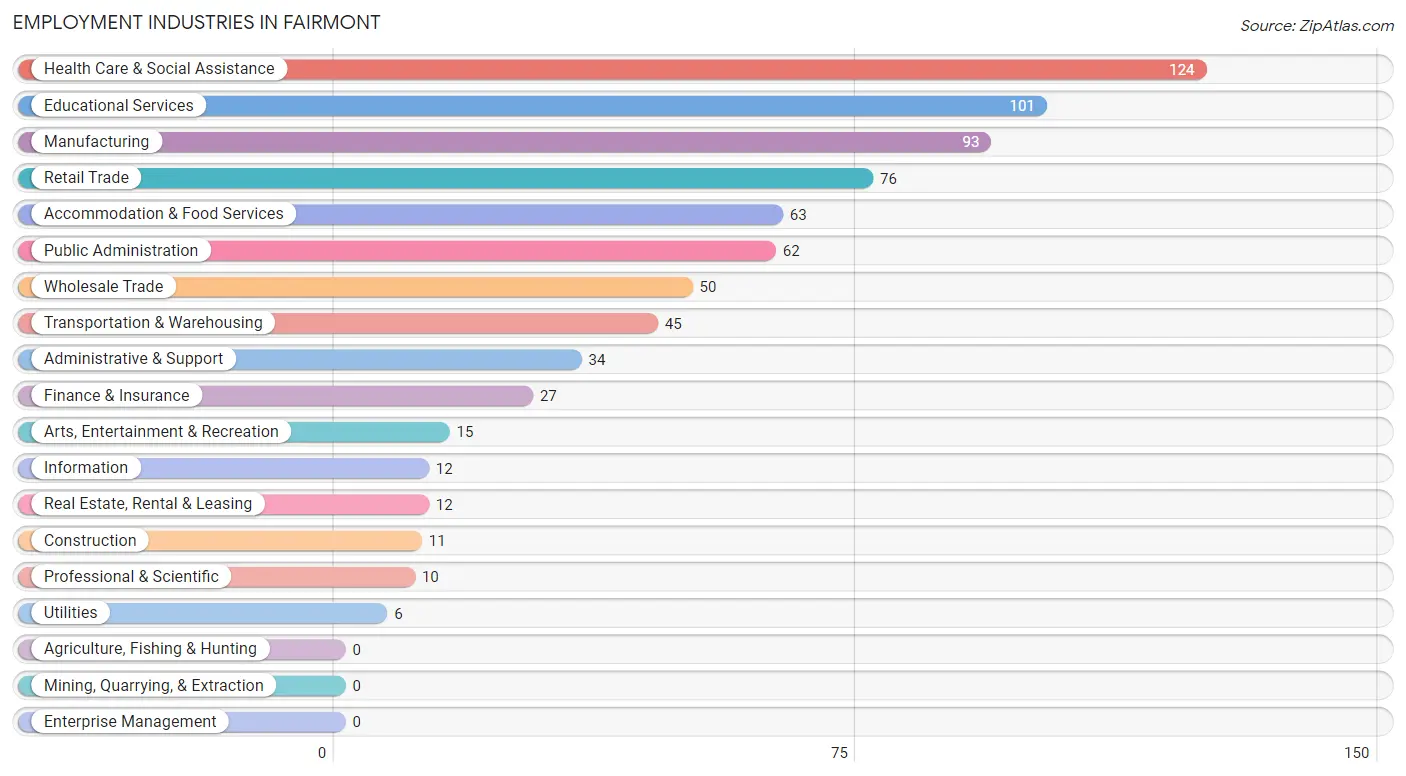
Employment Industries in Fairmont
The major employment industries in Fairmont include Health Care & Social Assistance (124 | 15.7%), Educational Services (101 | 12.8%), Manufacturing (93 | 11.8%), Retail Trade (76 | 9.6%), and Accommodation & Food Services (63 | 8.0%).
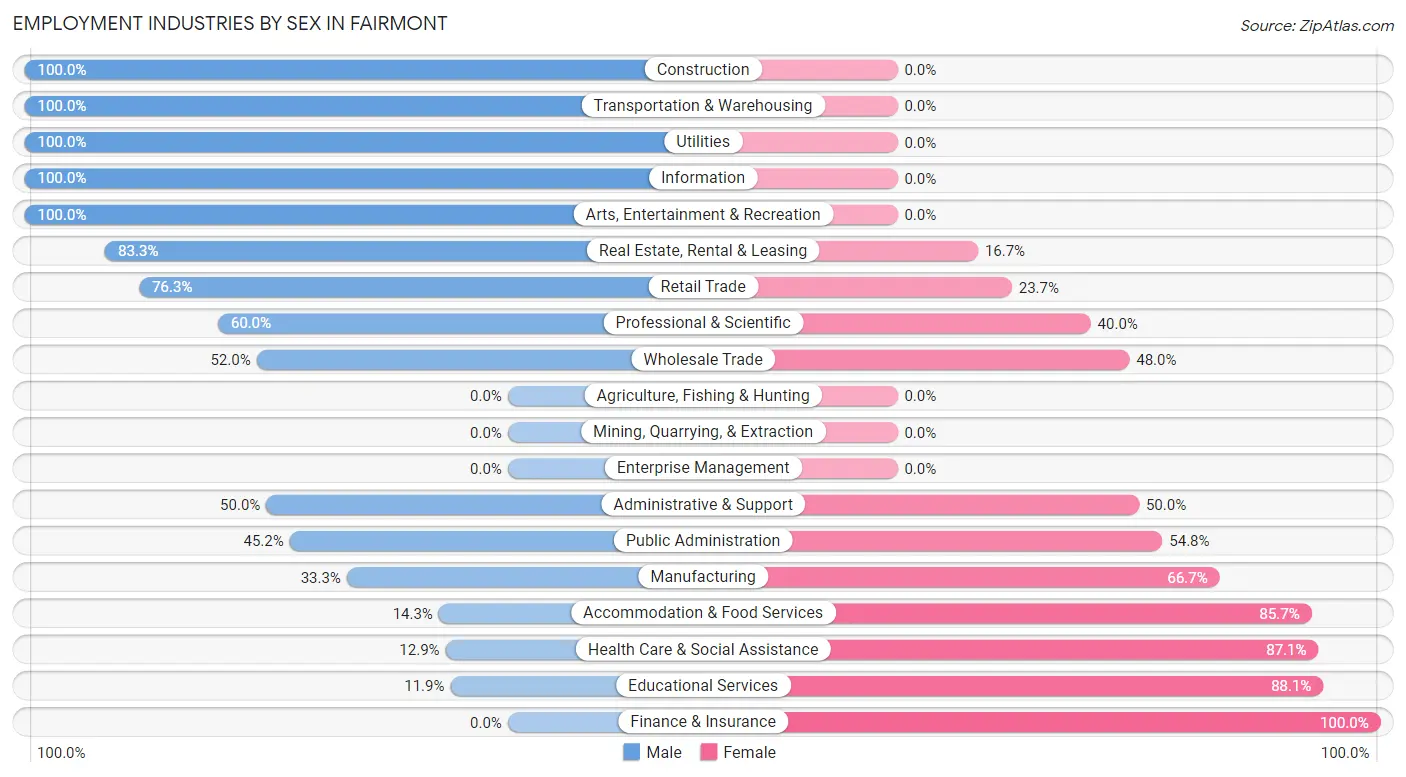
Employment Industries by Sex in Fairmont
The Fairmont industries that see more men than women are Construction (100.0%), Transportation & Warehousing (100.0%), and Utilities (100.0%), whereas the industries that tend to have a higher number of women are Finance & Insurance (100.0%), Educational Services (88.1%), and Health Care & Social Assistance (87.1%).
| Industry | Male | Female |
| Agriculture, Fishing & Hunting | 0 (0.0%) | 0 (0.0%) |
| Mining, Quarrying, & Extraction | 0 (0.0%) | 0 (0.0%) |
| Construction | 11 (100.0%) | 0 (0.0%) |
| Manufacturing | 31 (33.3%) | 62 (66.7%) |
| Wholesale Trade | 26 (52.0%) | 24 (48.0%) |
| Retail Trade | 58 (76.3%) | 18 (23.7%) |
| Transportation & Warehousing | 45 (100.0%) | 0 (0.0%) |
| Utilities | 6 (100.0%) | 0 (0.0%) |
| Information | 12 (100.0%) | 0 (0.0%) |
| Finance & Insurance | 0 (0.0%) | 27 (100.0%) |
| Real Estate, Rental & Leasing | 10 (83.3%) | 2 (16.7%) |
| Professional & Scientific | 6 (60.0%) | 4 (40.0%) |
| Enterprise Management | 0 (0.0%) | 0 (0.0%) |
| Administrative & Support | 17 (50.0%) | 17 (50.0%) |
| Educational Services | 12 (11.9%) | 89 (88.1%) |
| Health Care & Social Assistance | 16 (12.9%) | 108 (87.1%) |
| Arts, Entertainment & Recreation | 15 (100.0%) | 0 (0.0%) |
| Accommodation & Food Services | 9 (14.3%) | 54 (85.7%) |
| Public Administration | 28 (45.2%) | 34 (54.8%) |
| Total | 324 (41.0%) | 467 (59.0%) |
Education in Fairmont
School Enrollment in Fairmont
The most common levels of schooling among the 488 students in Fairmont are high school (133 | 27.3%), elementary school (124 | 25.4%), and middle school (108 | 22.1%).
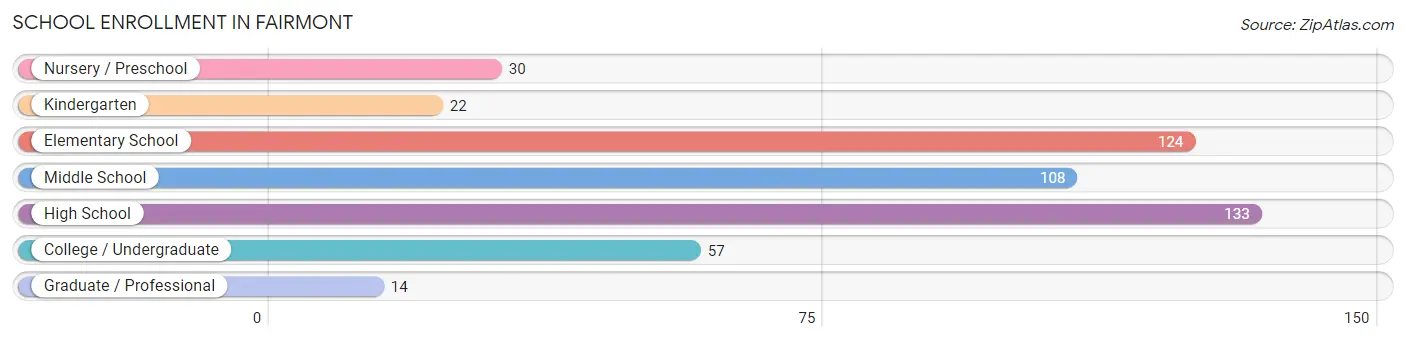
| School Level | # Students | % Students |
| Nursery / Preschool | 30 | 6.1% |
| Kindergarten | 22 | 4.5% |
| Elementary School | 124 | 25.4% |
| Middle School | 108 | 22.1% |
| High School | 133 | 27.3% |
| College / Undergraduate | 57 | 11.7% |
| Graduate / Professional | 14 | 2.9% |
| Total | 488 | 100.0% |
School Enrollment by Age by Funding Source in Fairmont
Out of a total of 488 students who are enrolled in schools in Fairmont, 5 (1.0%) attend a private institution, while the remaining 483 (99.0%) are enrolled in public schools. The age group of 20 to 24 year olds has the highest likelihood of being enrolled in private schools, with 5 (11.1% in the age bracket) enrolled. Conversely, the age group of 3 to 4 year olds has the lowest likelihood of being enrolled in a private school, with 30 (100.0% in the age bracket) attending a public institution.
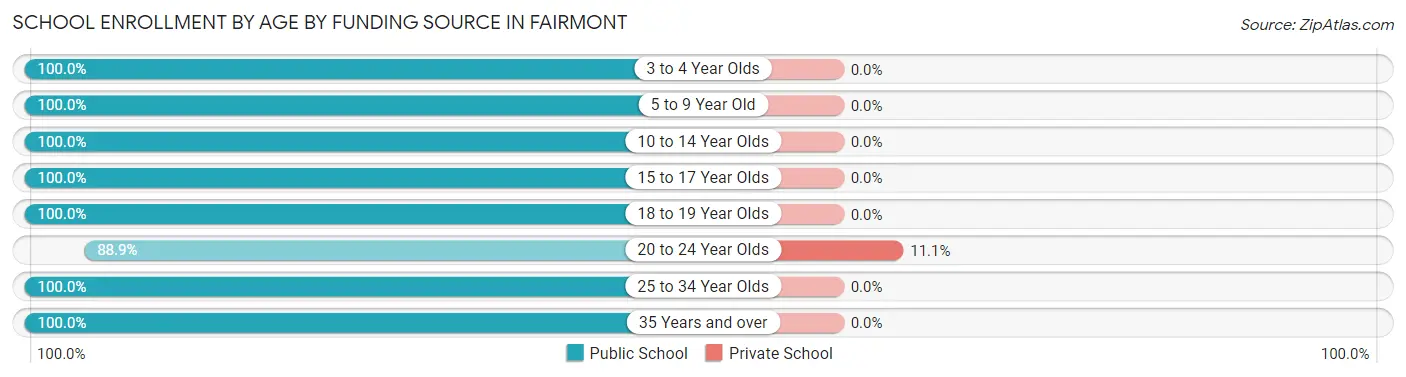
| Age Bracket | Public School | Private School |
| 3 to 4 Year Olds | 30 (100.0%) | 0 (0.0%) |
| 5 to 9 Year Old | 134 (100.0%) | 0 (0.0%) |
| 10 to 14 Year Olds | 111 (100.0%) | 0 (0.0%) |
| 15 to 17 Year Olds | 102 (100.0%) | 0 (0.0%) |
| 18 to 19 Year Olds | 40 (100.0%) | 0 (0.0%) |
| 20 to 24 Year Olds | 40 (88.9%) | 5 (11.1%) |
| 25 to 34 Year Olds | 20 (100.0%) | 0 (0.0%) |
| 35 Years and over | 6 (100.0%) | 0 (0.0%) |
| Total | 483 (99.0%) | 5 (1.0%) |
Educational Attainment by Field of Study in Fairmont
Education (110 | 31.6%), business (46 | 13.2%), liberal arts & history (38 | 10.9%), arts & humanities (33 | 9.5%), and science & technology (31 | 8.9%) are the most common fields of study among 348 individuals in Fairmont who have obtained a bachelor's degree or higher.
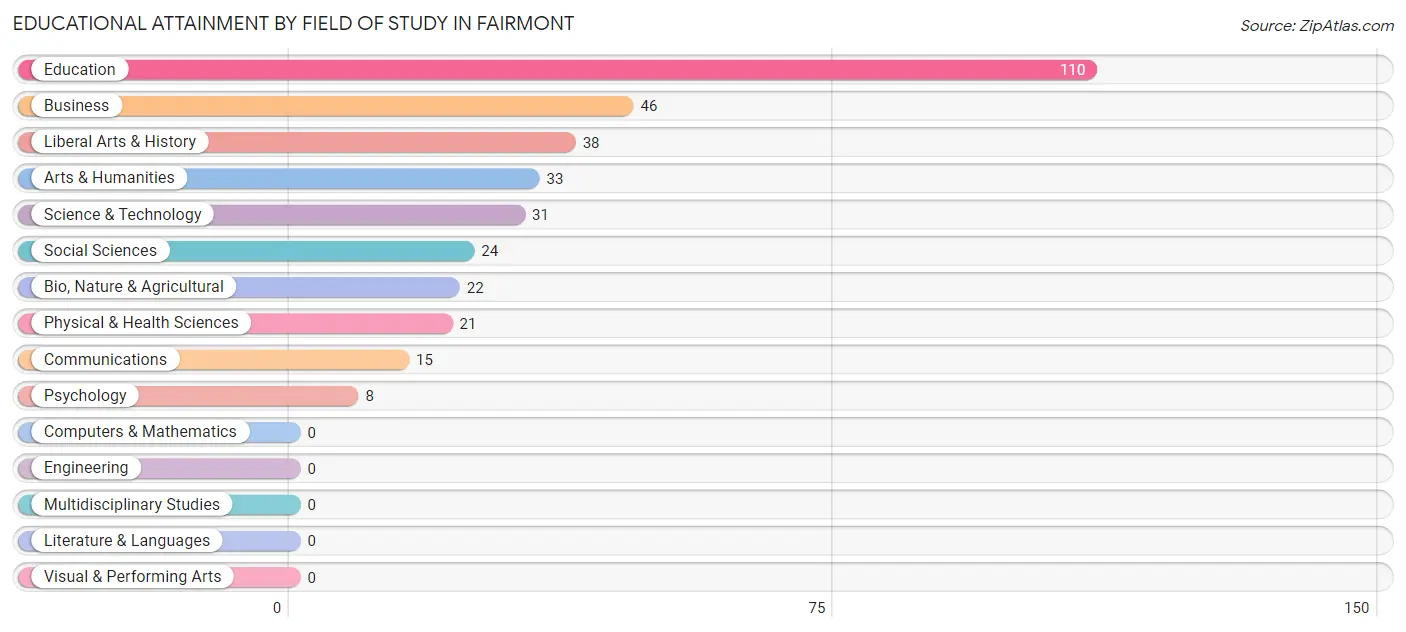
| Field of Study | # Graduates | % Graduates |
| Computers & Mathematics | 0 | 0.0% |
| Bio, Nature & Agricultural | 22 | 6.3% |
| Physical & Health Sciences | 21 | 6.0% |
| Psychology | 8 | 2.3% |
| Social Sciences | 24 | 6.9% |
| Engineering | 0 | 0.0% |
| Multidisciplinary Studies | 0 | 0.0% |
| Science & Technology | 31 | 8.9% |
| Business | 46 | 13.2% |
| Education | 110 | 31.6% |
| Literature & Languages | 0 | 0.0% |
| Liberal Arts & History | 38 | 10.9% |
| Visual & Performing Arts | 0 | 0.0% |
| Communications | 15 | 4.3% |
| Arts & Humanities | 33 | 9.5% |
| Total | 348 | 100.0% |
Transportation & Commute in Fairmont
Vehicle Availability by Sex in Fairmont
The most prevalent vehicle ownership categories in Fairmont are males with 2 vehicles (119, accounting for 36.7%) and females with 2 vehicles (133, making up 25.5%).
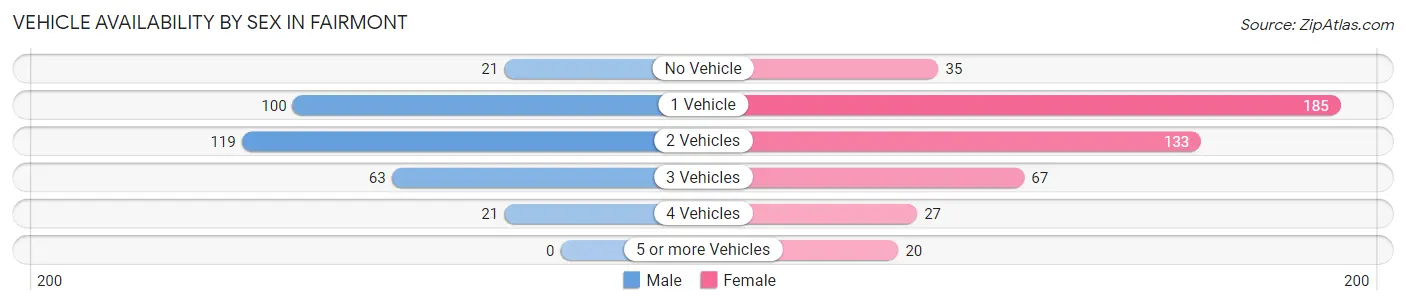
| Vehicles Available | Male | Female |
| No Vehicle | 21 (6.5%) | 35 (7.5%) |
| 1 Vehicle | 100 (30.9%) | 185 (39.6%) |
| 2 Vehicles | 119 (36.7%) | 133 (28.5%) |
| 3 Vehicles | 63 (19.4%) | 67 (14.3%) |
| 4 Vehicles | 21 (6.5%) | 27 (5.8%) |
| 5 or more Vehicles | 0 (0.0%) | 20 (4.3%) |
| Total | 324 (100.0%) | 467 (100.0%) |
Commute Time in Fairmont
The most frequently occuring commute durations in Fairmont are 20 to 24 minutes (171 commuters, 22.0%), 30 to 34 minutes (132 commuters, 17.0%), and 5 to 9 minutes (91 commuters, 11.7%).
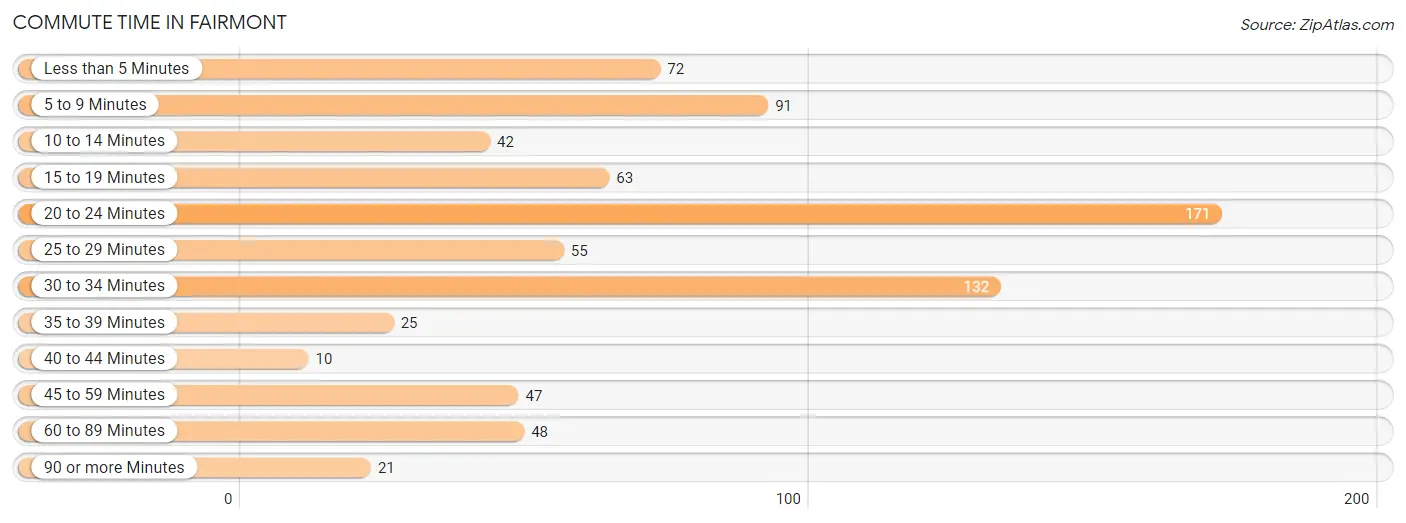
| Commute Time | # Commuters | % Commuters |
| Less than 5 Minutes | 72 | 9.3% |
| 5 to 9 Minutes | 91 | 11.7% |
| 10 to 14 Minutes | 42 | 5.4% |
| 15 to 19 Minutes | 63 | 8.1% |
| 20 to 24 Minutes | 171 | 22.0% |
| 25 to 29 Minutes | 55 | 7.1% |
| 30 to 34 Minutes | 132 | 17.0% |
| 35 to 39 Minutes | 25 | 3.2% |
| 40 to 44 Minutes | 10 | 1.3% |
| 45 to 59 Minutes | 47 | 6.0% |
| 60 to 89 Minutes | 48 | 6.2% |
| 90 or more Minutes | 21 | 2.7% |
Commute Time by Sex in Fairmont
The most common commute times in Fairmont are 5 to 9 minutes (58 commuters, 17.9%) for males and 20 to 24 minutes (123 commuters, 27.2%) for females.
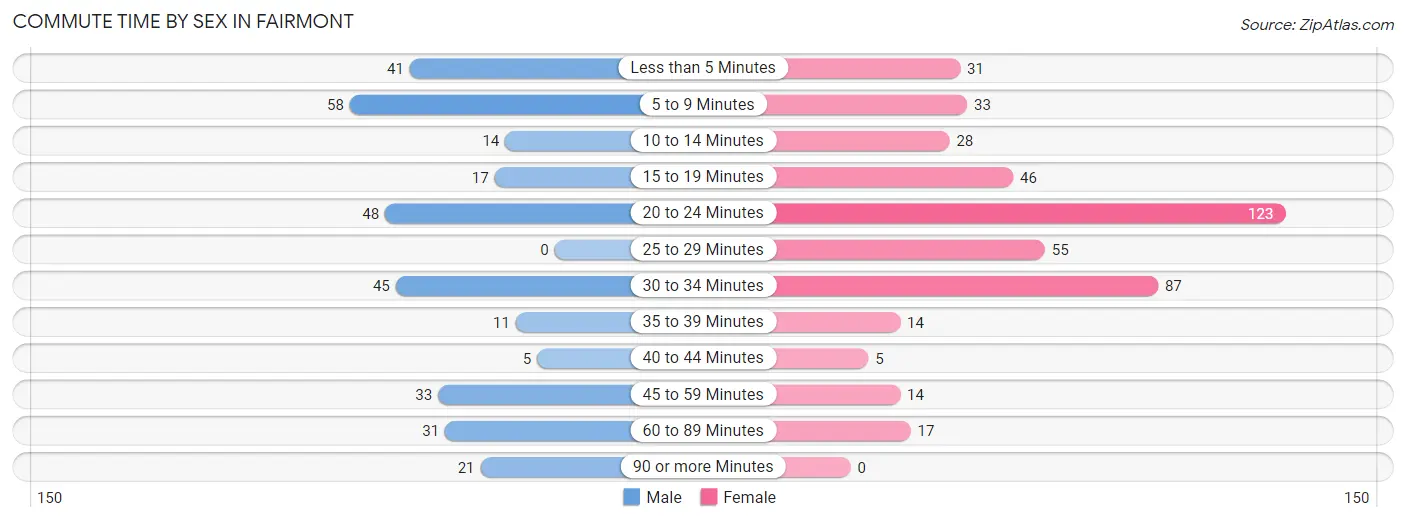
| Commute Time | Male | Female |
| Less than 5 Minutes | 41 (12.7%) | 31 (6.8%) |
| 5 to 9 Minutes | 58 (17.9%) | 33 (7.3%) |
| 10 to 14 Minutes | 14 (4.3%) | 28 (6.2%) |
| 15 to 19 Minutes | 17 (5.2%) | 46 (10.2%) |
| 20 to 24 Minutes | 48 (14.8%) | 123 (27.2%) |
| 25 to 29 Minutes | 0 (0.0%) | 55 (12.1%) |
| 30 to 34 Minutes | 45 (13.9%) | 87 (19.2%) |
| 35 to 39 Minutes | 11 (3.4%) | 14 (3.1%) |
| 40 to 44 Minutes | 5 (1.5%) | 5 (1.1%) |
| 45 to 59 Minutes | 33 (10.2%) | 14 (3.1%) |
| 60 to 89 Minutes | 31 (9.6%) | 17 (3.7%) |
| 90 or more Minutes | 21 (6.5%) | 0 (0.0%) |
Time of Departure to Work by Sex in Fairmont
The most frequent times of departure to work in Fairmont are 8:00 AM to 8:29 AM (54, 16.7%) for males and 7:30 AM to 7:59 AM (109, 24.1%) for females.
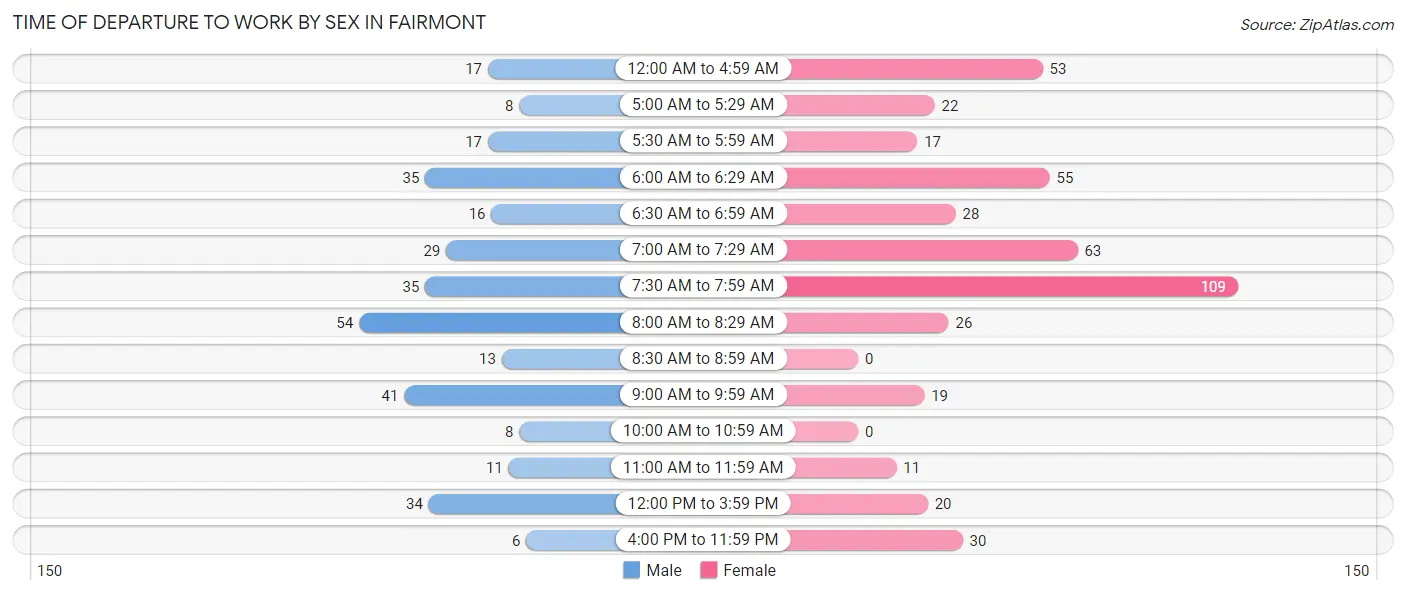
| Time of Departure | Male | Female |
| 12:00 AM to 4:59 AM | 17 (5.2%) | 53 (11.7%) |
| 5:00 AM to 5:29 AM | 8 (2.5%) | 22 (4.9%) |
| 5:30 AM to 5:59 AM | 17 (5.2%) | 17 (3.7%) |
| 6:00 AM to 6:29 AM | 35 (10.8%) | 55 (12.1%) |
| 6:30 AM to 6:59 AM | 16 (4.9%) | 28 (6.2%) |
| 7:00 AM to 7:29 AM | 29 (8.9%) | 63 (13.9%) |
| 7:30 AM to 7:59 AM | 35 (10.8%) | 109 (24.1%) |
| 8:00 AM to 8:29 AM | 54 (16.7%) | 26 (5.7%) |
| 8:30 AM to 8:59 AM | 13 (4.0%) | 0 (0.0%) |
| 9:00 AM to 9:59 AM | 41 (12.7%) | 19 (4.2%) |
| 10:00 AM to 10:59 AM | 8 (2.5%) | 0 (0.0%) |
| 11:00 AM to 11:59 AM | 11 (3.4%) | 11 (2.4%) |
| 12:00 PM to 3:59 PM | 34 (10.5%) | 20 (4.4%) |
| 4:00 PM to 11:59 PM | 6 (1.8%) | 30 (6.6%) |
| Total | 324 (100.0%) | 453 (100.0%) |
Housing Occupancy in Fairmont
Occupancy by Ownership in Fairmont
Of the total 1,002 dwellings in Fairmont, owner-occupied units account for 479 (47.8%), while renter-occupied units make up 523 (52.2%).
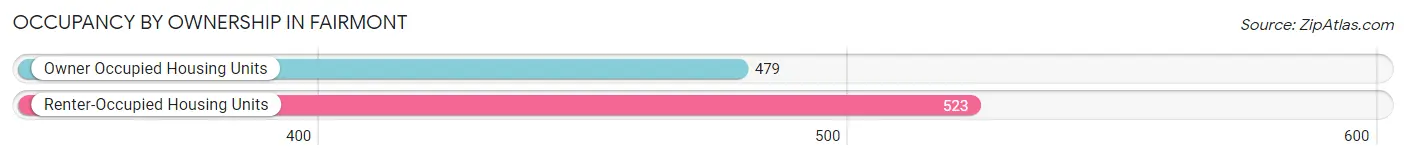
| Occupancy | # Housing Units | % Housing Units |
| Owner Occupied Housing Units | 479 | 47.8% |
| Renter-Occupied Housing Units | 523 | 52.2% |
| Total Occupied Housing Units | 1,002 | 100.0% |
Occupancy by Household Size in Fairmont
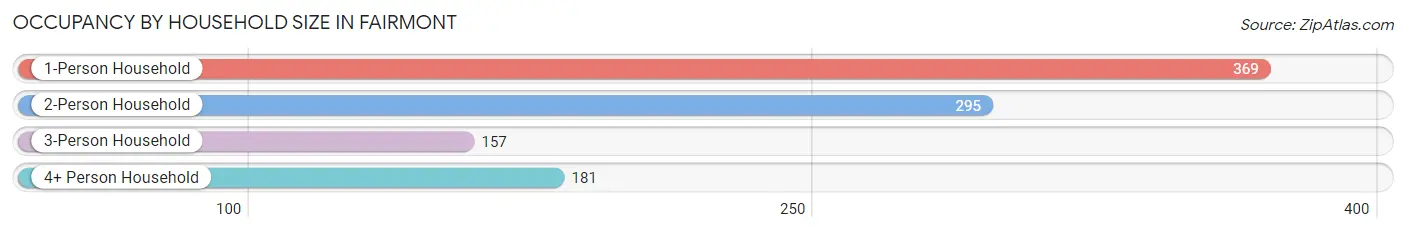
| Household Size | # Housing Units | % Housing Units |
| 1-Person Household | 369 | 36.8% |
| 2-Person Household | 295 | 29.4% |
| 3-Person Household | 157 | 15.7% |
| 4+ Person Household | 181 | 18.1% |
| Total Housing Units | 1,002 | 100.0% |
Occupancy by Ownership by Household Size in Fairmont
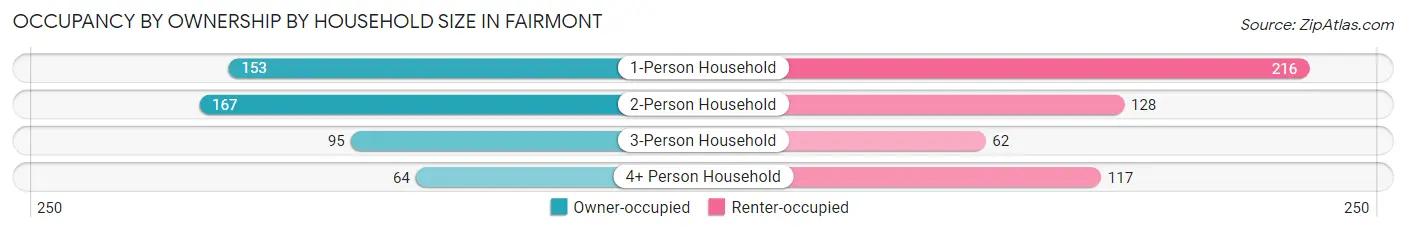
| Household Size | Owner-occupied | Renter-occupied |
| 1-Person Household | 153 (41.5%) | 216 (58.5%) |
| 2-Person Household | 167 (56.6%) | 128 (43.4%) |
| 3-Person Household | 95 (60.5%) | 62 (39.5%) |
| 4+ Person Household | 64 (35.4%) | 117 (64.6%) |
| Total Housing Units | 479 (47.8%) | 523 (52.2%) |
Occupancy by Educational Attainment in Fairmont
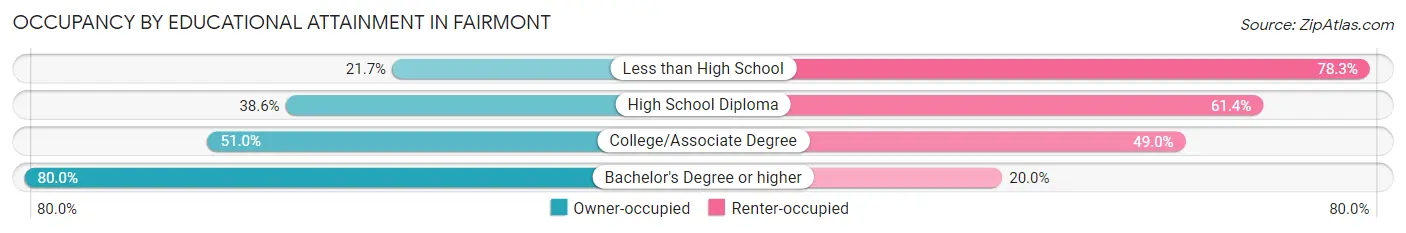
| Household Size | Owner-occupied | Renter-occupied |
| Less than High School | 30 (21.7%) | 108 (78.3%) |
| High School Diploma | 141 (38.6%) | 224 (61.4%) |
| College/Associate Degree | 160 (51.0%) | 154 (49.0%) |
| Bachelor's Degree or higher | 148 (80.0%) | 37 (20.0%) |
Occupancy by Age of Householder in Fairmont
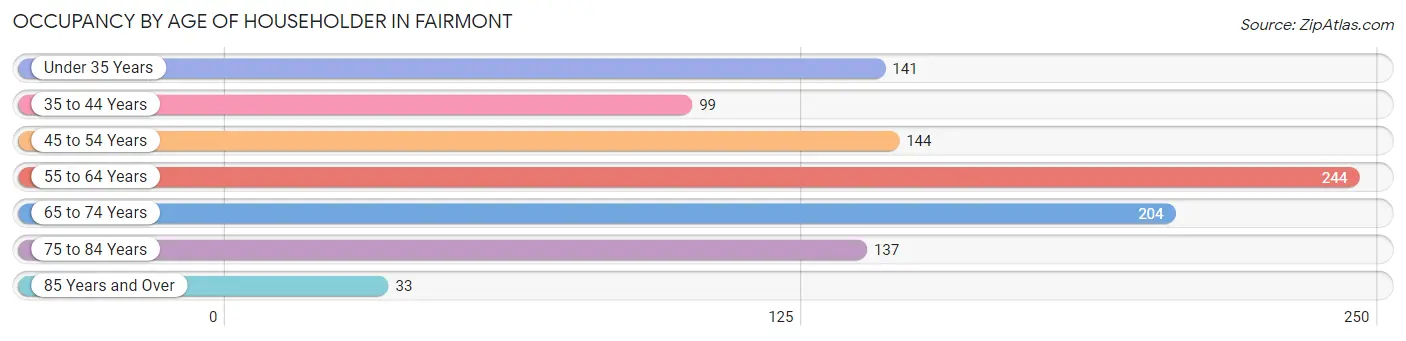
| Age Bracket | # Households | % Households |
| Under 35 Years | 141 | 14.1% |
| 35 to 44 Years | 99 | 9.9% |
| 45 to 54 Years | 144 | 14.4% |
| 55 to 64 Years | 244 | 24.3% |
| 65 to 74 Years | 204 | 20.4% |
| 75 to 84 Years | 137 | 13.7% |
| 85 Years and Over | 33 | 3.3% |
| Total | 1,002 | 100.0% |
Housing Finances in Fairmont
Median Income by Occupancy in Fairmont
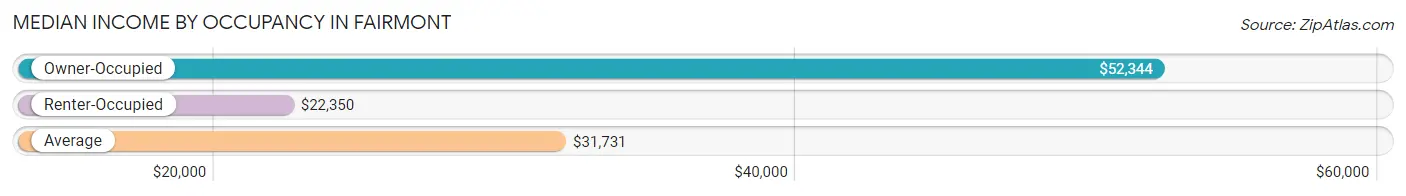
| Occupancy Type | # Households | Median Income |
| Owner-Occupied | 479 (47.8%) | $52,344 |
| Renter-Occupied | 523 (52.2%) | $22,350 |
| Average | 1,002 (100.0%) | $31,731 |
Occupancy by Householder Income Bracket in Fairmont
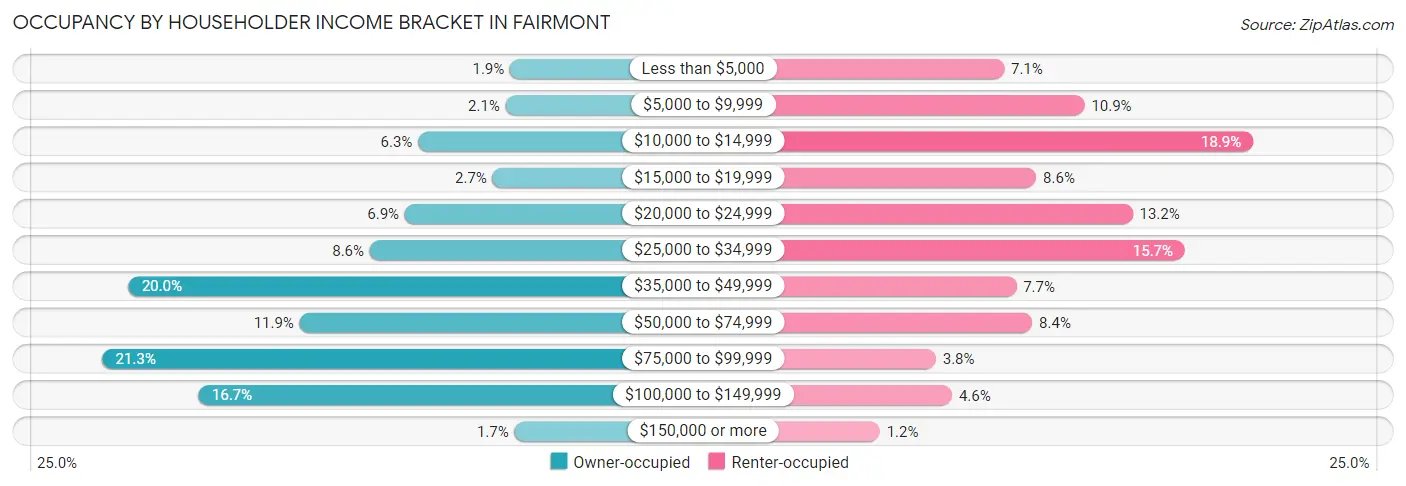
| Income Bracket | Owner-occupied | Renter-occupied |
| Less than $5,000 | 9 (1.9%) | 37 (7.1%) |
| $5,000 to $9,999 | 10 (2.1%) | 57 (10.9%) |
| $10,000 to $14,999 | 30 (6.3%) | 99 (18.9%) |
| $15,000 to $19,999 | 13 (2.7%) | 45 (8.6%) |
| $20,000 to $24,999 | 33 (6.9%) | 69 (13.2%) |
| $25,000 to $34,999 | 41 (8.6%) | 82 (15.7%) |
| $35,000 to $49,999 | 96 (20.0%) | 40 (7.6%) |
| $50,000 to $74,999 | 57 (11.9%) | 44 (8.4%) |
| $75,000 to $99,999 | 102 (21.3%) | 20 (3.8%) |
| $100,000 to $149,999 | 80 (16.7%) | 24 (4.6%) |
| $150,000 or more | 8 (1.7%) | 6 (1.1%) |
| Total | 479 (100.0%) | 523 (100.0%) |
Monthly Housing Cost Tiers in Fairmont
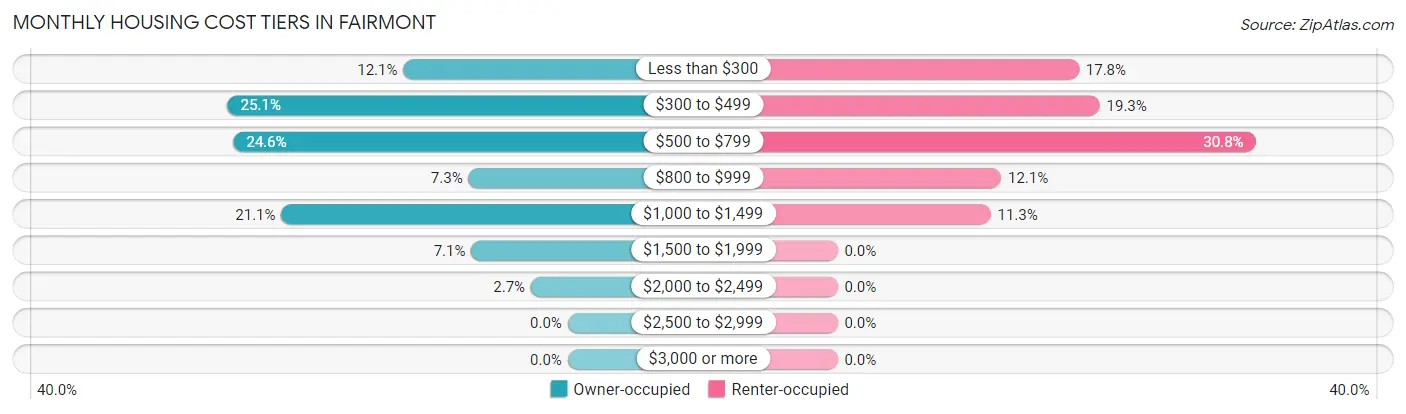
| Monthly Cost | Owner-occupied | Renter-occupied |
| Less than $300 | 58 (12.1%) | 93 (17.8%) |
| $300 to $499 | 120 (25.1%) | 101 (19.3%) |
| $500 to $799 | 118 (24.6%) | 161 (30.8%) |
| $800 to $999 | 35 (7.3%) | 63 (12.0%) |
| $1,000 to $1,499 | 101 (21.1%) | 59 (11.3%) |
| $1,500 to $1,999 | 34 (7.1%) | 0 (0.0%) |
| $2,000 to $2,499 | 13 (2.7%) | 0 (0.0%) |
| $2,500 to $2,999 | 0 (0.0%) | 0 (0.0%) |
| $3,000 or more | 0 (0.0%) | 0 (0.0%) |
| Total | 479 (100.0%) | 523 (100.0%) |
Physical Housing Characteristics in Fairmont
Housing Structures in Fairmont
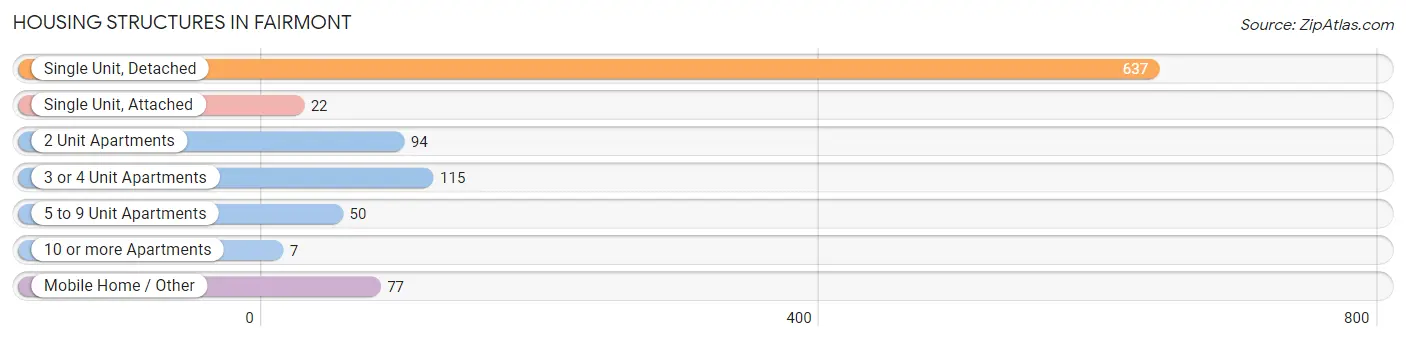
| Structure Type | # Housing Units | % Housing Units |
| Single Unit, Detached | 637 | 63.6% |
| Single Unit, Attached | 22 | 2.2% |
| 2 Unit Apartments | 94 | 9.4% |
| 3 or 4 Unit Apartments | 115 | 11.5% |
| 5 to 9 Unit Apartments | 50 | 5.0% |
| 10 or more Apartments | 7 | 0.7% |
| Mobile Home / Other | 77 | 7.7% |
| Total | 1,002 | 100.0% |
Housing Structures by Occupancy in Fairmont
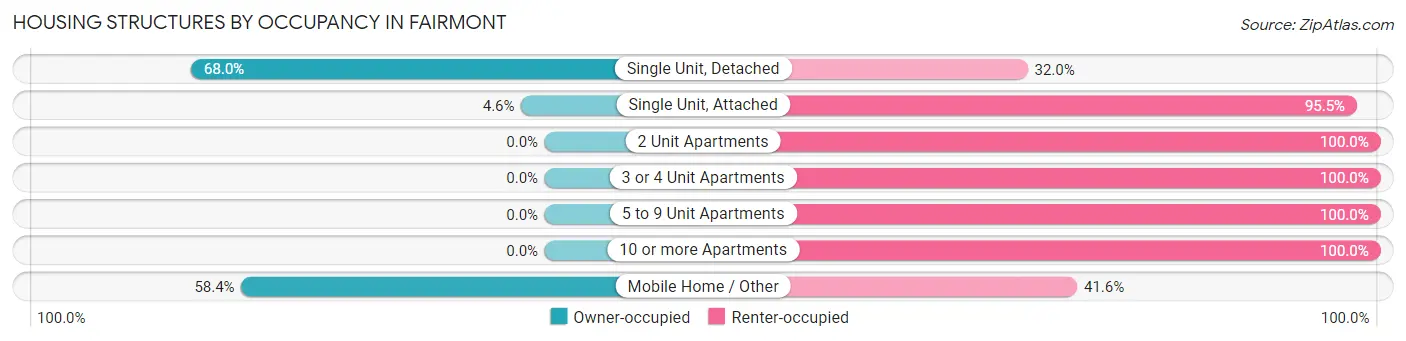
| Structure Type | Owner-occupied | Renter-occupied |
| Single Unit, Detached | 433 (68.0%) | 204 (32.0%) |
| Single Unit, Attached | 1 (4.5%) | 21 (95.5%) |
| 2 Unit Apartments | 0 (0.0%) | 94 (100.0%) |
| 3 or 4 Unit Apartments | 0 (0.0%) | 115 (100.0%) |
| 5 to 9 Unit Apartments | 0 (0.0%) | 50 (100.0%) |
| 10 or more Apartments | 0 (0.0%) | 7 (100.0%) |
| Mobile Home / Other | 45 (58.4%) | 32 (41.6%) |
| Total | 479 (47.8%) | 523 (52.2%) |
Housing Structures by Number of Rooms in Fairmont
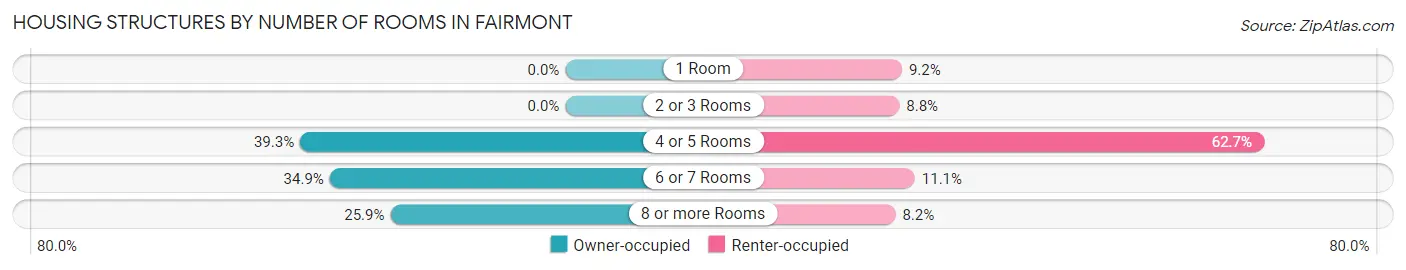
| Number of Rooms | Owner-occupied | Renter-occupied |
| 1 Room | 0 (0.0%) | 48 (9.2%) |
| 2 or 3 Rooms | 0 (0.0%) | 46 (8.8%) |
| 4 or 5 Rooms | 188 (39.3%) | 328 (62.7%) |
| 6 or 7 Rooms | 167 (34.9%) | 58 (11.1%) |
| 8 or more Rooms | 124 (25.9%) | 43 (8.2%) |
| Total | 479 (100.0%) | 523 (100.0%) |
Housing Structure by Heating Type in Fairmont
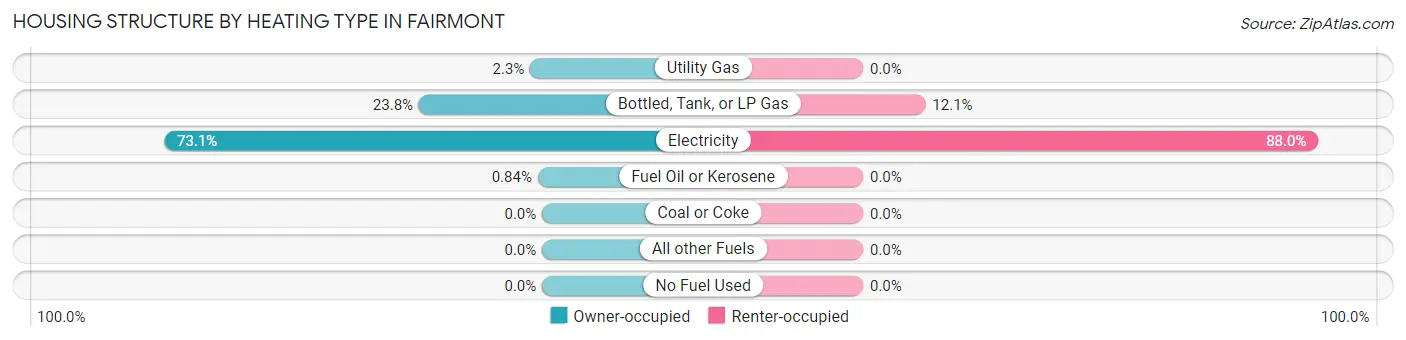
| Heating Type | Owner-occupied | Renter-occupied |
| Utility Gas | 11 (2.3%) | 0 (0.0%) |
| Bottled, Tank, or LP Gas | 114 (23.8%) | 63 (12.0%) |
| Electricity | 350 (73.1%) | 460 (87.9%) |
| Fuel Oil or Kerosene | 4 (0.8%) | 0 (0.0%) |
| Coal or Coke | 0 (0.0%) | 0 (0.0%) |
| All other Fuels | 0 (0.0%) | 0 (0.0%) |
| No Fuel Used | 0 (0.0%) | 0 (0.0%) |
| Total | 479 (100.0%) | 523 (100.0%) |
Household Vehicle Usage in Fairmont
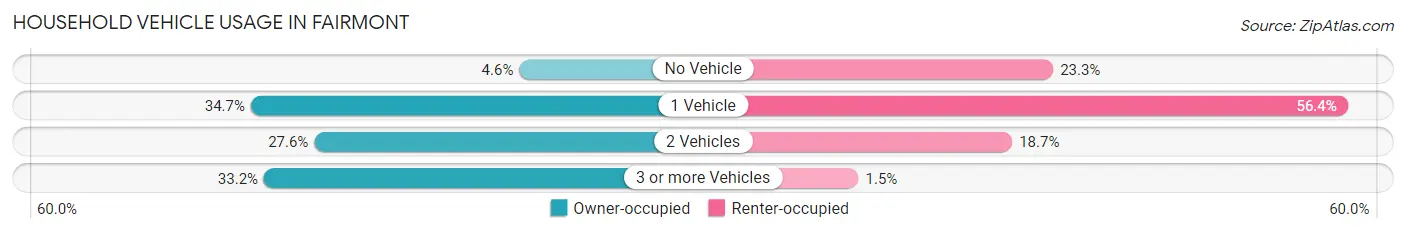
| Vehicles per Household | Owner-occupied | Renter-occupied |
| No Vehicle | 22 (4.6%) | 122 (23.3%) |
| 1 Vehicle | 166 (34.7%) | 295 (56.4%) |
| 2 Vehicles | 132 (27.6%) | 98 (18.7%) |
| 3 or more Vehicles | 159 (33.2%) | 8 (1.5%) |
| Total | 479 (100.0%) | 523 (100.0%) |
Real Estate & Mortgages in Fairmont
Real Estate and Mortgage Overview in Fairmont
| Characteristic | Without Mortgage | With Mortgage |
| Housing Units | 303 | 176 |
| Median Property Value | $76,700 | $120,000 |
| Median Household Income | $47,813 | $4 |
| Monthly Housing Costs | $464 | $0 |
| Real Estate Taxes | $952 | $0 |
Property Value by Mortgage Status in Fairmont
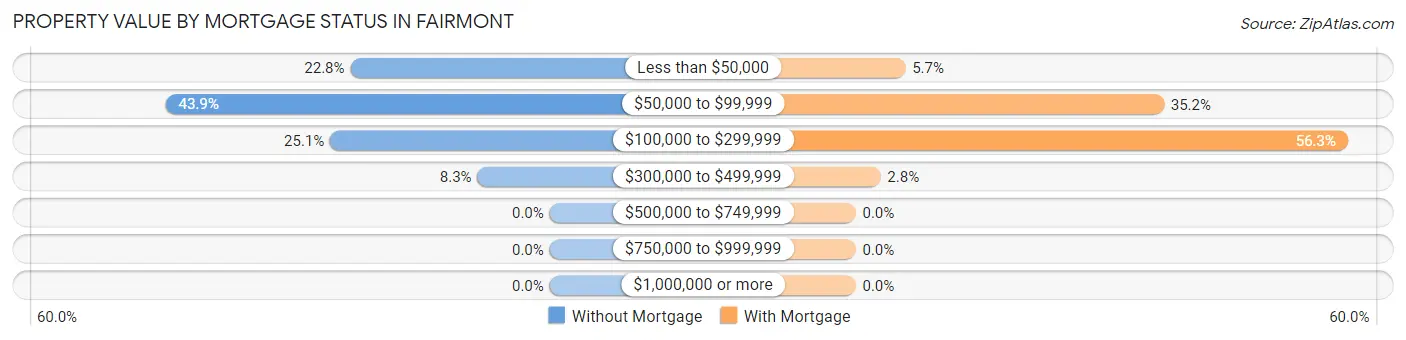
| Property Value | Without Mortgage | With Mortgage |
| Less than $50,000 | 69 (22.8%) | 10 (5.7%) |
| $50,000 to $99,999 | 133 (43.9%) | 62 (35.2%) |
| $100,000 to $299,999 | 76 (25.1%) | 99 (56.2%) |
| $300,000 to $499,999 | 25 (8.3%) | 5 (2.8%) |
| $500,000 to $749,999 | 0 (0.0%) | 0 (0.0%) |
| $750,000 to $999,999 | 0 (0.0%) | 0 (0.0%) |
| $1,000,000 or more | 0 (0.0%) | 0 (0.0%) |
| Total | 303 (100.0%) | 176 (100.0%) |
Household Income by Mortgage Status in Fairmont
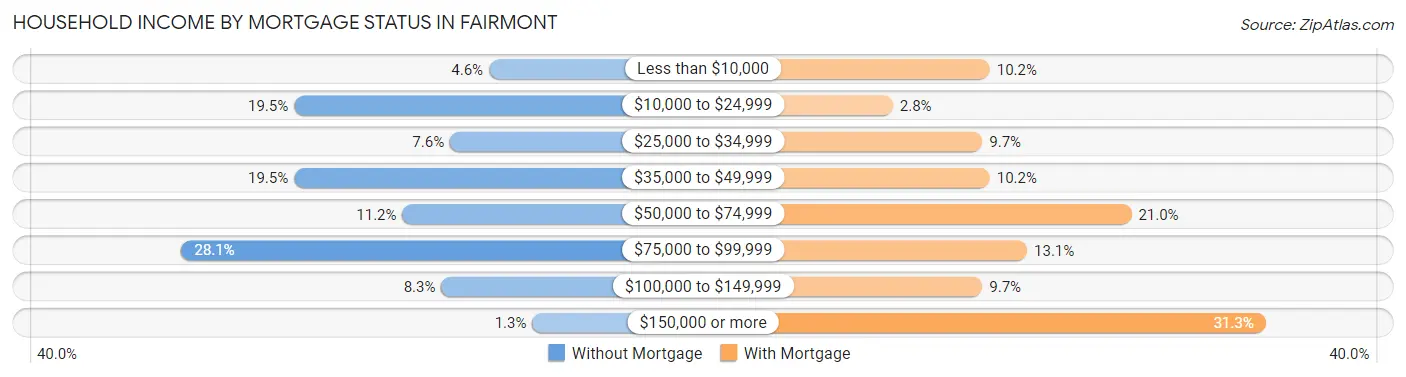
| Household Income | Without Mortgage | With Mortgage |
| Less than $10,000 | 14 (4.6%) | 18 (10.2%) |
| $10,000 to $24,999 | 59 (19.5%) | 5 (2.8%) |
| $25,000 to $34,999 | 23 (7.6%) | 17 (9.7%) |
| $35,000 to $49,999 | 59 (19.5%) | 18 (10.2%) |
| $50,000 to $74,999 | 34 (11.2%) | 37 (21.0%) |
| $75,000 to $99,999 | 85 (28.1%) | 23 (13.1%) |
| $100,000 to $149,999 | 25 (8.3%) | 17 (9.7%) |
| $150,000 or more | 4 (1.3%) | 55 (31.2%) |
| Total | 303 (100.0%) | 176 (100.0%) |
Property Value to Household Income Ratio in Fairmont
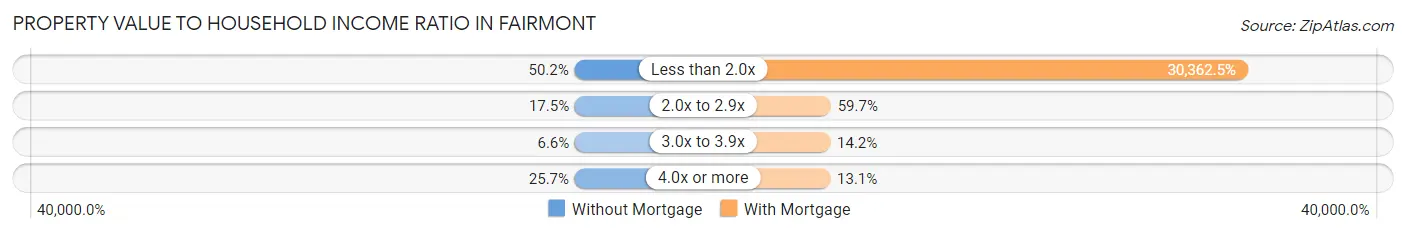
| Value-to-Income Ratio | Without Mortgage | With Mortgage |
| Less than 2.0x | 152 (50.2%) | 53,438 (30,362.5%) |
| 2.0x to 2.9x | 53 (17.5%) | 105 (59.7%) |
| 3.0x to 3.9x | 20 (6.6%) | 25 (14.2%) |
| 4.0x or more | 78 (25.7%) | 23 (13.1%) |
| Total | 303 (100.0%) | 176 (100.0%) |
Real Estate Taxes by Mortgage Status in Fairmont
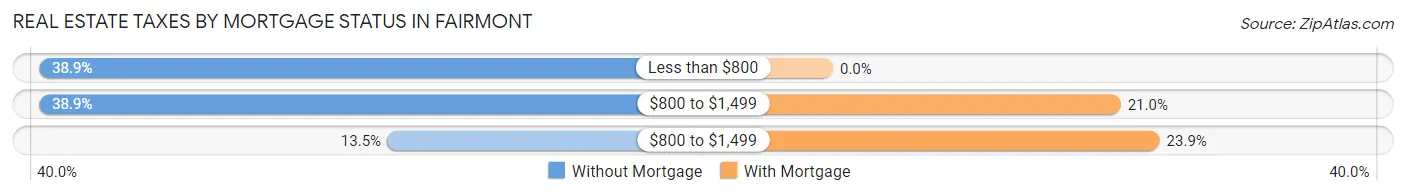
| Property Taxes | Without Mortgage | With Mortgage |
| Less than $800 | 118 (38.9%) | 0 (0.0%) |
| $800 to $1,499 | 118 (38.9%) | 37 (21.0%) |
| $800 to $1,499 | 41 (13.5%) | 42 (23.9%) |
| Total | 303 (100.0%) | 176 (100.0%) |
Health & Disability in Fairmont
Health Insurance Coverage by Age in Fairmont
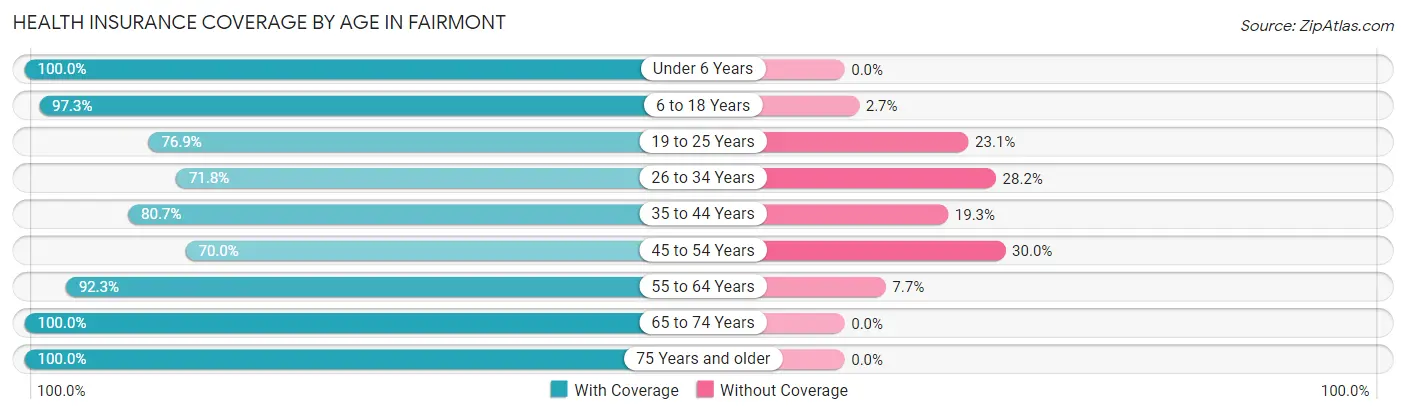
| Age Bracket | With Coverage | Without Coverage |
| Under 6 Years | 149 (100.0%) | 0 (0.0%) |
| 6 to 18 Years | 361 (97.3%) | 10 (2.7%) |
| 19 to 25 Years | 213 (76.9%) | 64 (23.1%) |
| 26 to 34 Years | 150 (71.8%) | 59 (28.2%) |
| 35 to 44 Years | 163 (80.7%) | 39 (19.3%) |
| 45 to 54 Years | 196 (70.0%) | 84 (30.0%) |
| 55 to 64 Years | 385 (92.3%) | 32 (7.7%) |
| 65 to 74 Years | 285 (100.0%) | 0 (0.0%) |
| 75 Years and older | 312 (100.0%) | 0 (0.0%) |
| Total | 2,214 (88.5%) | 288 (11.5%) |
Health Insurance Coverage by Citizenship Status in Fairmont
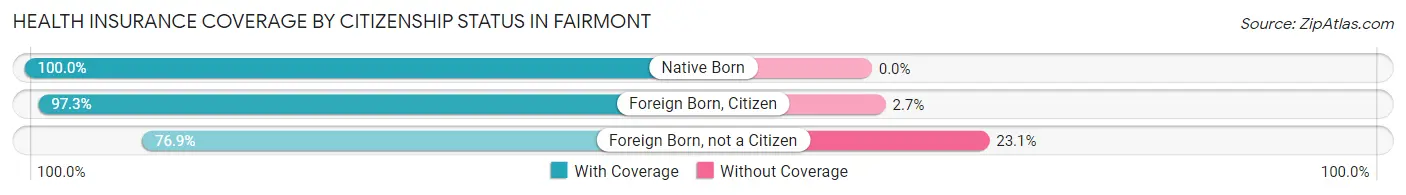
| Citizenship Status | With Coverage | Without Coverage |
| Native Born | 149 (100.0%) | 0 (0.0%) |
| Foreign Born, Citizen | 361 (97.3%) | 10 (2.7%) |
| Foreign Born, not a Citizen | 213 (76.9%) | 64 (23.1%) |
Health Insurance Coverage by Household Income in Fairmont
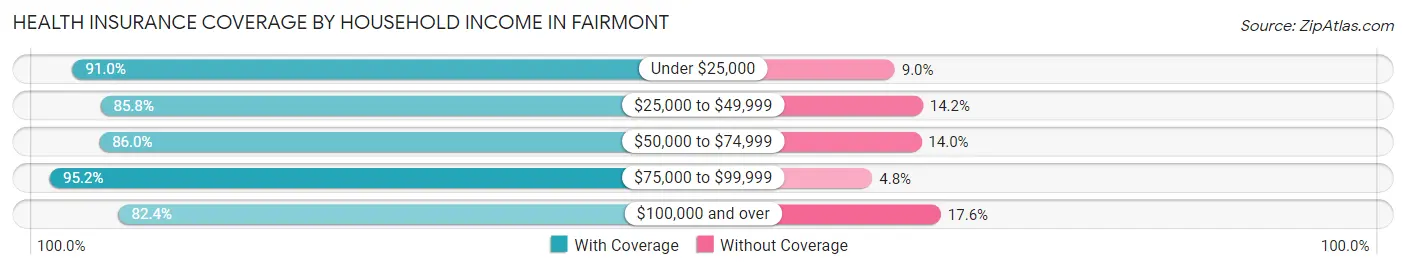
| Household Income | With Coverage | Without Coverage |
| Under $25,000 | 881 (91.0%) | 87 (9.0%) |
| $25,000 to $49,999 | 518 (85.8%) | 86 (14.2%) |
| $50,000 to $74,999 | 203 (86.0%) | 33 (14.0%) |
| $75,000 to $99,999 | 299 (95.2%) | 15 (4.8%) |
| $100,000 and over | 313 (82.4%) | 67 (17.6%) |
Public vs Private Health Insurance Coverage by Age in Fairmont
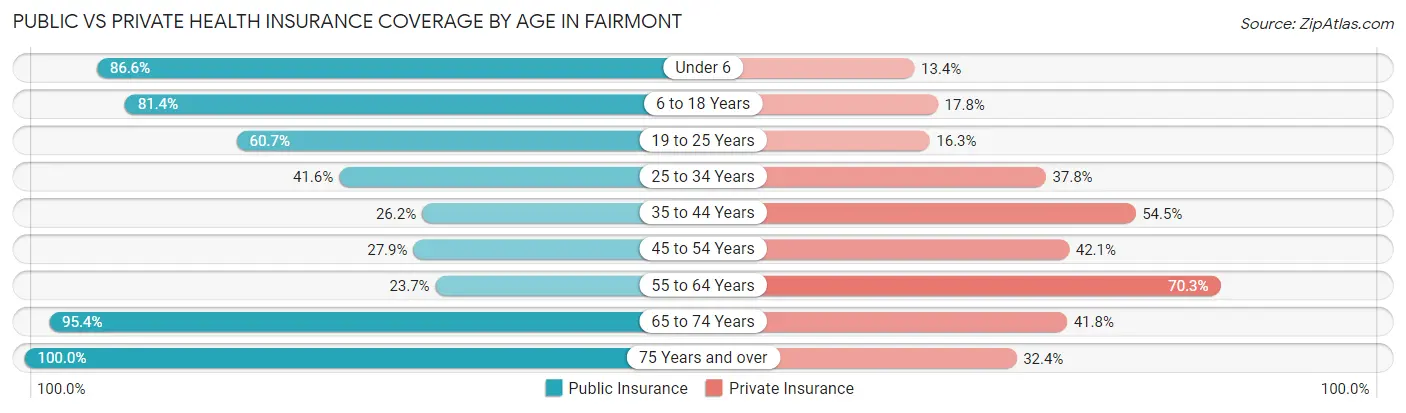
| Age Bracket | Public Insurance | Private Insurance |
| Under 6 | 129 (86.6%) | 20 (13.4%) |
| 6 to 18 Years | 302 (81.4%) | 66 (17.8%) |
| 19 to 25 Years | 168 (60.7%) | 45 (16.3%) |
| 25 to 34 Years | 87 (41.6%) | 79 (37.8%) |
| 35 to 44 Years | 53 (26.2%) | 110 (54.5%) |
| 45 to 54 Years | 78 (27.9%) | 118 (42.1%) |
| 55 to 64 Years | 99 (23.7%) | 293 (70.3%) |
| 65 to 74 Years | 272 (95.4%) | 119 (41.7%) |
| 75 Years and over | 312 (100.0%) | 101 (32.4%) |
| Total | 1,500 (60.0%) | 951 (38.0%) |
Disability Status by Sex by Age in Fairmont
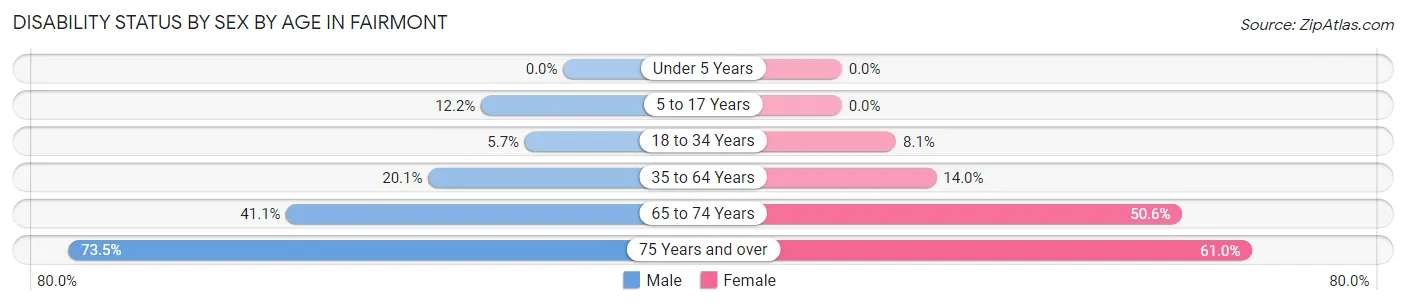
| Age Bracket | Male | Female |
| Under 5 Years | 0 (0.0%) | 0 (0.0%) |
| 5 to 17 Years | 25 (12.2%) | 0 (0.0%) |
| 18 to 34 Years | 15 (5.7%) | 20 (8.1%) |
| 35 to 64 Years | 66 (20.1%) | 80 (14.0%) |
| 65 to 74 Years | 44 (41.1%) | 90 (50.6%) |
| 75 Years and over | 75 (73.5%) | 128 (61.0%) |
Disability Class by Sex by Age in Fairmont
Disability Class: Hearing Difficulty
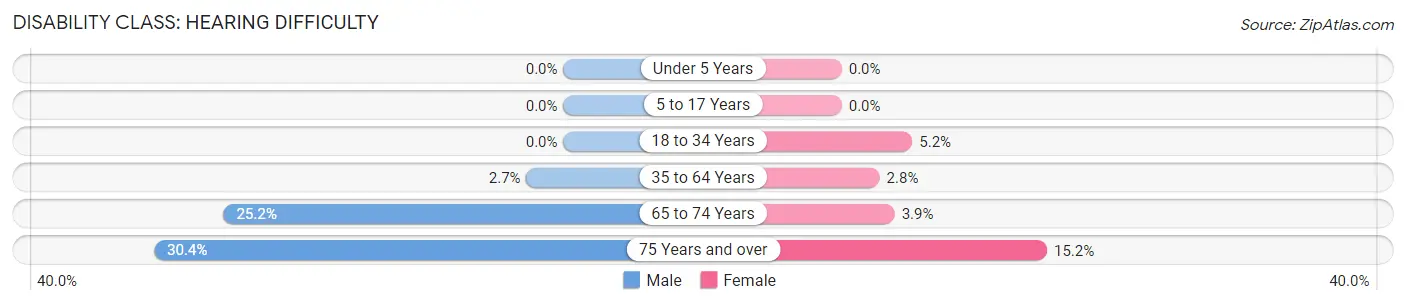
| Age Bracket | Male | Female |
| Under 5 Years | 0 (0.0%) | 0 (0.0%) |
| 5 to 17 Years | 0 (0.0%) | 0 (0.0%) |
| 18 to 34 Years | 0 (0.0%) | 13 (5.2%) |
| 35 to 64 Years | 9 (2.7%) | 16 (2.8%) |
| 65 to 74 Years | 27 (25.2%) | 7 (3.9%) |
| 75 Years and over | 31 (30.4%) | 32 (15.2%) |
Disability Class: Vision Difficulty
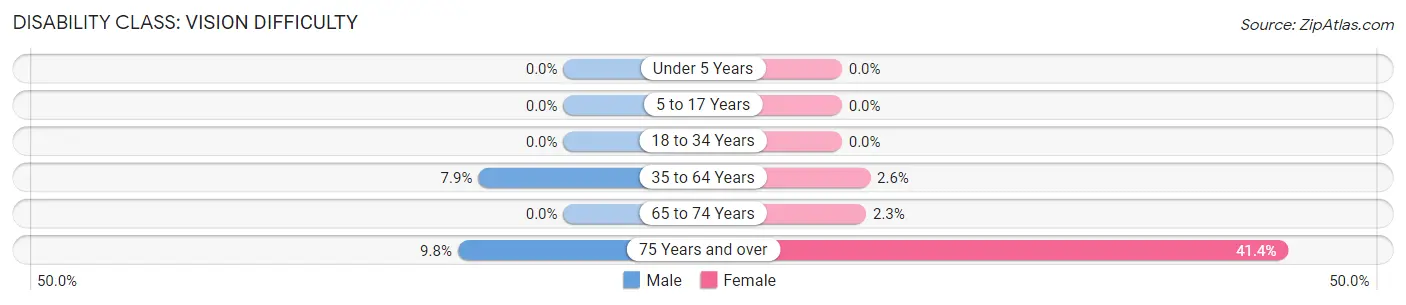
| Age Bracket | Male | Female |
| Under 5 Years | 0 (0.0%) | 0 (0.0%) |
| 5 to 17 Years | 0 (0.0%) | 0 (0.0%) |
| 18 to 34 Years | 0 (0.0%) | 0 (0.0%) |
| 35 to 64 Years | 26 (7.9%) | 15 (2.6%) |
| 65 to 74 Years | 0 (0.0%) | 4 (2.2%) |
| 75 Years and over | 10 (9.8%) | 87 (41.4%) |
Disability Class: Cognitive Difficulty
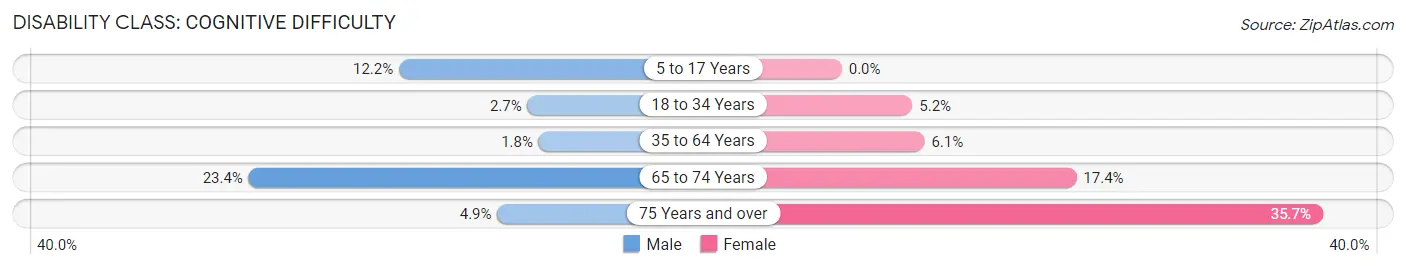
| Age Bracket | Male | Female |
| 5 to 17 Years | 25 (12.2%) | 0 (0.0%) |
| 18 to 34 Years | 7 (2.7%) | 13 (5.2%) |
| 35 to 64 Years | 6 (1.8%) | 35 (6.1%) |
| 65 to 74 Years | 25 (23.4%) | 31 (17.4%) |
| 75 Years and over | 5 (4.9%) | 75 (35.7%) |
Disability Class: Ambulatory Difficulty
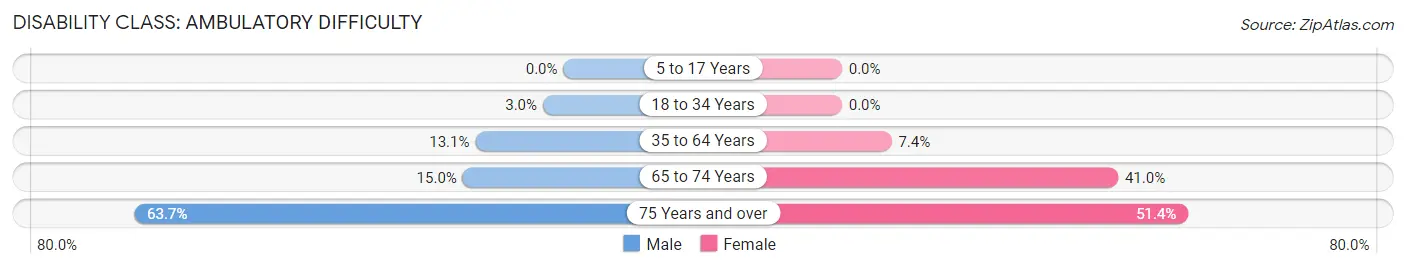
| Age Bracket | Male | Female |
| 5 to 17 Years | 0 (0.0%) | 0 (0.0%) |
| 18 to 34 Years | 8 (3.0%) | 0 (0.0%) |
| 35 to 64 Years | 43 (13.1%) | 42 (7.4%) |
| 65 to 74 Years | 16 (14.9%) | 73 (41.0%) |
| 75 Years and over | 65 (63.7%) | 108 (51.4%) |
Disability Class: Self-Care Difficulty
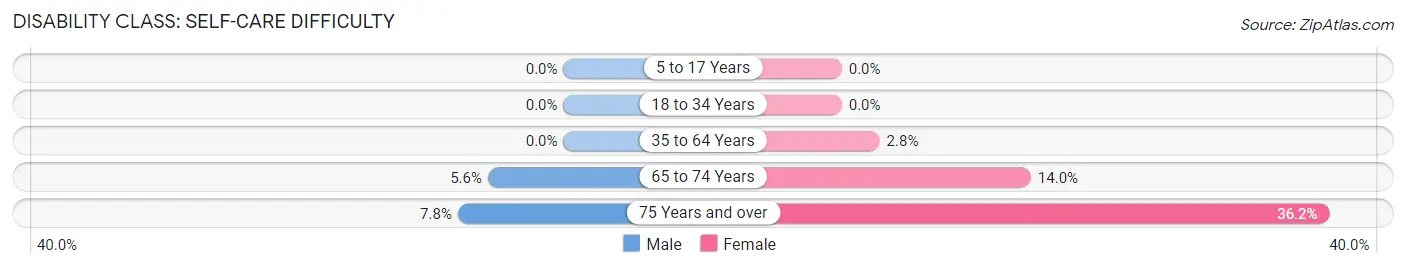
| Age Bracket | Male | Female |
| 5 to 17 Years | 0 (0.0%) | 0 (0.0%) |
| 18 to 34 Years | 0 (0.0%) | 0 (0.0%) |
| 35 to 64 Years | 0 (0.0%) | 16 (2.8%) |
| 65 to 74 Years | 6 (5.6%) | 25 (14.0%) |
| 75 Years and over | 8 (7.8%) | 76 (36.2%) |
Technology Access in Fairmont
Computing Device Access in Fairmont
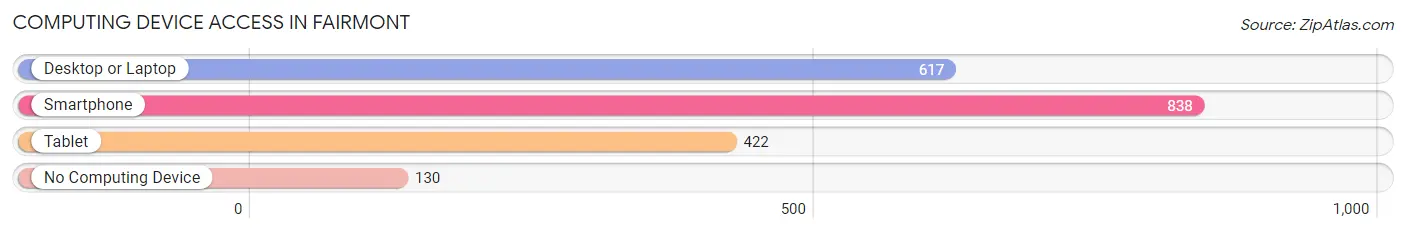
| Device Type | # Households | % Households |
| Desktop or Laptop | 617 | 61.6% |
| Smartphone | 838 | 83.6% |
| Tablet | 422 | 42.1% |
| No Computing Device | 130 | 13.0% |
| Total | 1,002 | 100.0% |
Internet Access in Fairmont
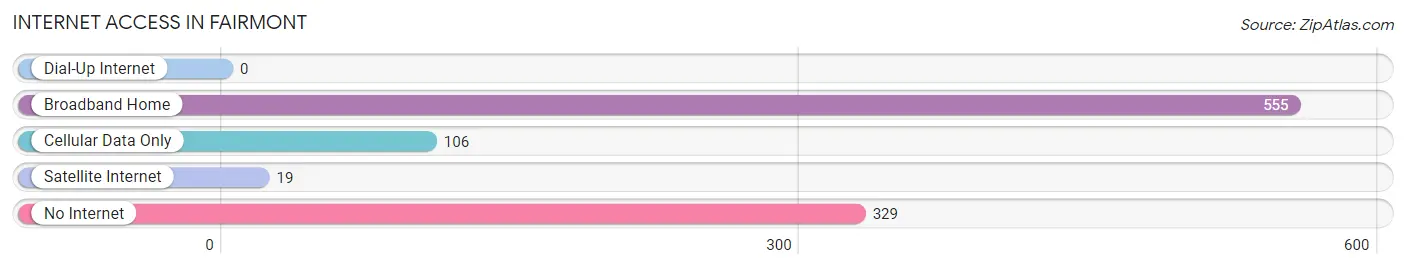
| Internet Type | # Households | % Households |
| Dial-Up Internet | 0 | 0.0% |
| Broadband Home | 555 | 55.4% |
| Cellular Data Only | 106 | 10.6% |
| Satellite Internet | 19 | 1.9% |
| No Internet | 329 | 32.8% |
| Total | 1,002 | 100.0% |
Fairmont Summary
History
The town of Fairmont, North Carolina is located in Robeson County, in the southeastern part of the state. The town was founded in 1887 and was originally known as “Fairmont Station” due to its location on the Wilmington and Weldon Railroad. The town was named after the Fairmont Hotel in San Francisco, California. The town was incorporated in 1891 and has since grown to a population of over 4,000 people.
The town of Fairmont has a rich history that dates back to the early 1700s. The area was originally inhabited by the Lumbee Indians, who were part of the larger Tuscarora tribe. The Lumbee Indians were known for their farming and hunting skills, and they were also known for their resistance to European settlers. The Lumbee Indians were eventually forced to move to the nearby town of Pembroke, where they still reside today.
In the late 1700s, the area was settled by European settlers, mostly of English and Scottish descent. The settlers established farms and plantations, and the town of Fairmont grew around these agricultural endeavors. The town was also home to a number of mills, which provided employment for many of the town’s residents.
In the late 1800s, the town of Fairmont experienced a period of growth and prosperity. The town was home to a number of businesses, including a cotton mill, a sawmill, a gristmill, and a brickyard. The town also had a number of churches, schools, and other civic organizations.
In the early 1900s, the town of Fairmont experienced a period of decline. The cotton mill closed in the 1920s, and the sawmill and gristmill closed in the 1930s. The brickyard closed in the 1940s. The decline of the town’s economy was further exacerbated by the Great Depression and World War II.
In the 1950s, the town of Fairmont experienced a period of revitalization. The town was home to a number of new businesses, including a furniture factory, a textile mill, and a lumber mill. The town also experienced a period of population growth, as many people moved to the area in search of employment.
Geography
Fairmont is located in Robeson County, in the southeastern part of North Carolina. The town is situated on the banks of the Lumber River, which flows through the town. The town is located approximately 30 miles south of Fayetteville and approximately 50 miles north of Wilmington.
The town of Fairmont has a total area of 4.2 square miles, all of which is land. The town is located at an elevation of approximately 100 feet above sea level. The town is located in a humid subtropical climate zone, with hot, humid summers and mild winters.
Economy
The economy of Fairmont is largely based on agriculture and manufacturing. The town is home to a number of farms, which produce a variety of crops, including corn, soybeans, cotton, and tobacco. The town is also home to a number of manufacturing businesses, including a furniture factory, a textile mill, and a lumber mill.
The town of Fairmont is also home to a number of retail businesses, including grocery stores, restaurants, and other retail establishments. The town is also home to a number of service businesses, including banks, insurance companies, and other professional services.
Demographics
As of the 2010 census, the town of Fairmont had a population of 4,082 people. The racial makeup of the town was 73.3% White, 22.2% African American, 0.7% Native American, 0.3% Asian, 0.1% Pacific Islander, and 3.4% from other races. The median household income in the town was $30,938, and the median family income was $37,813. The per capita income in the town was $15,945.
The town of Fairmont is served by the Robeson County School System. The town is home to a number of public schools, including Fairmont Elementary School, Fairmont Middle School, and Fairmont High School. The town is also home to a number of private schools, including St. Mary’s Catholic School and Fairmont Christian Academy.
Common Questions
What is Per Capita Income in Fairmont?
Per Capita income in Fairmont is $20,530.
What is the Median Family Income in Fairmont?
Median Family Income in Fairmont is $34,500.
What is the Median Household income in Fairmont?
Median Household Income in Fairmont is $31,731.
What is Income or Wage Gap in Fairmont?
Income or Wage Gap in Fairmont is 3.8%.
Women in Fairmont earn 96.2 cents for every dollar earned by a man.
What is Family Income Deficit in Fairmont?
Family Income Deficit in Fairmont is $11,307.
Families that are below poverty line in Fairmont earn $11,307 less on average than the poverty threshold level.
What is Inequality or Gini Index in Fairmont?
Inequality or Gini Index in Fairmont is 0.46.
What is the Total Population of Fairmont?
Total Population of Fairmont is 2,519.
What is the Total Male Population of Fairmont?
Total Male Population of Fairmont is 1,082.
What is the Total Female Population of Fairmont?
Total Female Population of Fairmont is 1,437.
What is the Ratio of Males per 100 Females in Fairmont?
There are 75.30 Males per 100 Females in Fairmont.
What is the Ratio of Females per 100 Males in Fairmont?
There are 132.81 Females per 100 Males in Fairmont.
What is the Median Population Age in Fairmont?
Median Population Age in Fairmont is 48.1 Years.
What is the Average Family Size in Fairmont
Average Family Size in Fairmont is 3.3 People.
What is the Average Household Size in Fairmont
Average Household Size in Fairmont is 2.5 People.
How Large is the Labor Force in Fairmont?
There are 866 People in the Labor Forcein in Fairmont.
What is the Percentage of People in the Labor Force in Fairmont?
42.0% of People are in the Labor Force in Fairmont.
What is the Unemployment Rate in Fairmont?
Unemployment Rate in Fairmont is 8.7%.