Garland, NC Map & Demographics
Garland Map
Garland Overview
$15,334
PER CAPITA INCOME
$40,865
AVG FAMILY INCOME
$40,577
AVG HOUSEHOLD INCOME
20.1%
WAGE / INCOME GAP [ % ]
79.9¢/ $1
WAGE / INCOME GAP [ $ ]
0.34
INEQUALITY / GINI INDEX
996
TOTAL POPULATION
448
MALE POPULATION
548
FEMALE POPULATION
81.75
MALES / 100 FEMALES
122.32
FEMALES / 100 MALES
24.1
MEDIAN AGE
4.4
AVG FAMILY SIZE
3.2
AVG HOUSEHOLD SIZE
397
LABOR FORCE [ PEOPLE ]
52.9%
PERCENT IN LABOR FORCE
6.5%
UNEMPLOYMENT RATE
Garland Zip Codes
Garland Area Codes
Income in Garland
Income Overview in Garland
Per Capita Income in Garland is $15,334, while median incomes of families and households are $40,865 and $40,577 respectively.
| Characteristic | Number | Measure |
| Per Capita Income | 996 | $15,334 |
| Median Family Income | 189 | $40,865 |
| Mean Family Income | 189 | $47,872 |
| Median Household Income | 308 | $40,577 |
| Mean Household Income | 308 | $45,499 |
| Income Deficit | 189 | $0 |
| Wage / Income Gap (%) | 996 | 20.10% |
| Wage / Income Gap ($) | 996 | 79.90¢ per $1 |
| Gini / Inequality Index | 996 | 0.34 |
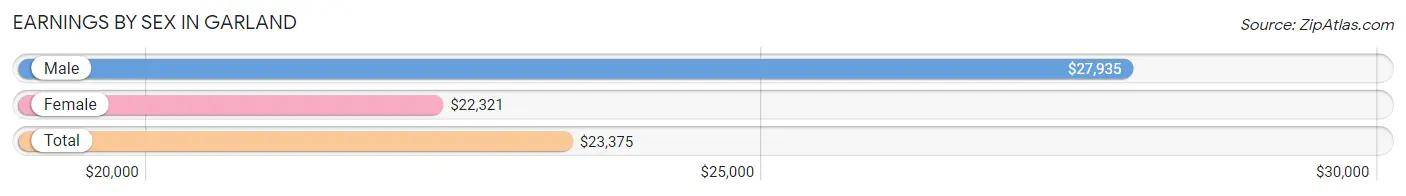
Earnings by Sex in Garland
Average Earnings in Garland are $23,375, $27,935 for men and $22,321 for women, a difference of 20.1%.
| Sex | Number | Average Earnings |
| Male | 152 (37.7%) | $27,935 |
| Female | 251 (62.3%) | $22,321 |
| Total | 403 (100.0%) | $23,375 |
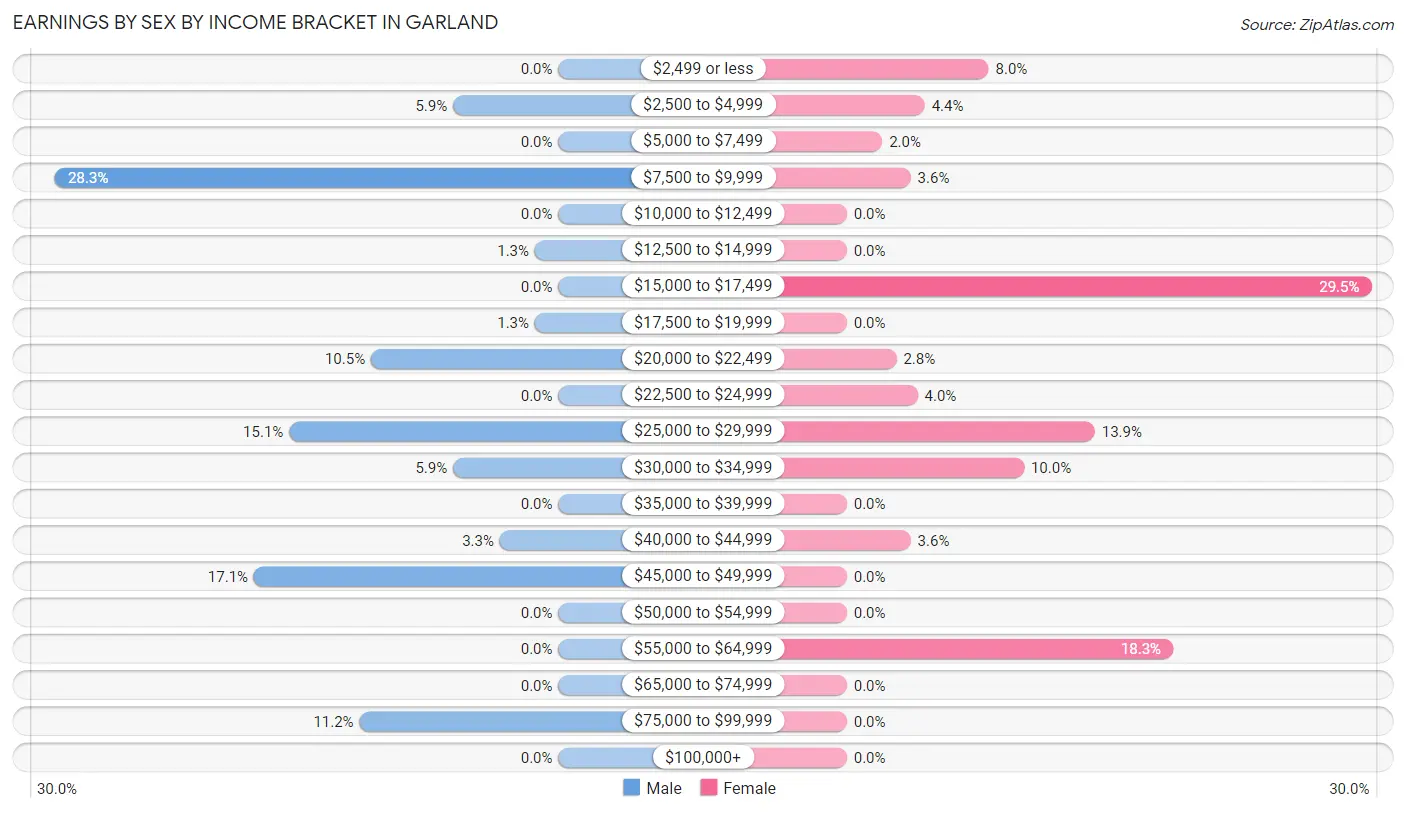
Earnings by Sex by Income Bracket in Garland
The most common earnings brackets in Garland are $7,500 to $9,999 for men (43 | 28.3%) and $15,000 to $17,499 for women (74 | 29.5%).
| Income | Male | Female |
| $2,499 or less | 0 (0.0%) | 20 (8.0%) |
| $2,500 to $4,999 | 9 (5.9%) | 11 (4.4%) |
| $5,000 to $7,499 | 0 (0.0%) | 5 (2.0%) |
| $7,500 to $9,999 | 43 (28.3%) | 9 (3.6%) |
| $10,000 to $12,499 | 0 (0.0%) | 0 (0.0%) |
| $12,500 to $14,999 | 2 (1.3%) | 0 (0.0%) |
| $15,000 to $17,499 | 0 (0.0%) | 74 (29.5%) |
| $17,500 to $19,999 | 2 (1.3%) | 0 (0.0%) |
| $20,000 to $22,499 | 16 (10.5%) | 7 (2.8%) |
| $22,500 to $24,999 | 0 (0.0%) | 10 (4.0%) |
| $25,000 to $29,999 | 23 (15.1%) | 35 (13.9%) |
| $30,000 to $34,999 | 9 (5.9%) | 25 (10.0%) |
| $35,000 to $39,999 | 0 (0.0%) | 0 (0.0%) |
| $40,000 to $44,999 | 5 (3.3%) | 9 (3.6%) |
| $45,000 to $49,999 | 26 (17.1%) | 0 (0.0%) |
| $50,000 to $54,999 | 0 (0.0%) | 0 (0.0%) |
| $55,000 to $64,999 | 0 (0.0%) | 46 (18.3%) |
| $65,000 to $74,999 | 0 (0.0%) | 0 (0.0%) |
| $75,000 to $99,999 | 17 (11.2%) | 0 (0.0%) |
| $100,000+ | 0 (0.0%) | 0 (0.0%) |
| Total | 152 (100.0%) | 251 (100.0%) |
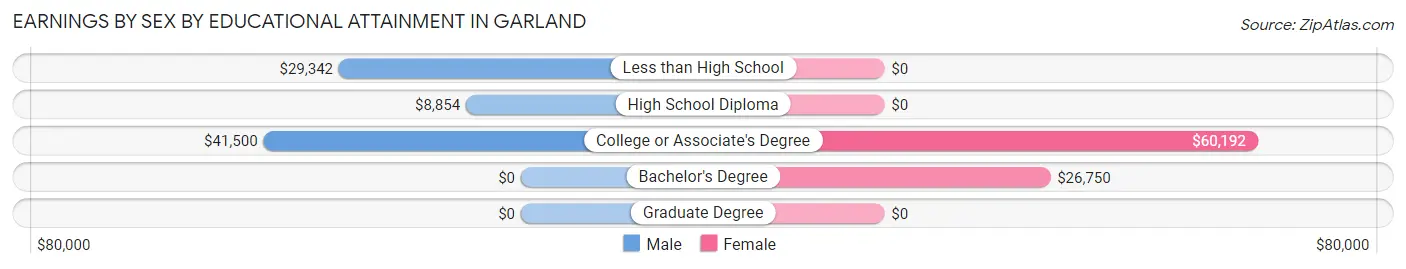
Earnings by Sex by Educational Attainment in Garland
| Educational Attainment | Male Income | Female Income |
| Less than High School | $29,342 | $0 |
| High School Diploma | $8,854 | $0 |
| College or Associate's Degree | $41,500 | $60,192 |
| Bachelor's Degree | - | - |
| Graduate Degree | - | - |
| Total | - | - |
Family Income in Garland
Family Income Brackets in Garland
According to the Garland family income data, there are 57 families falling into the $25,000 to $34,999 income range, which is the most common income bracket and makes up 30.2% of all families.
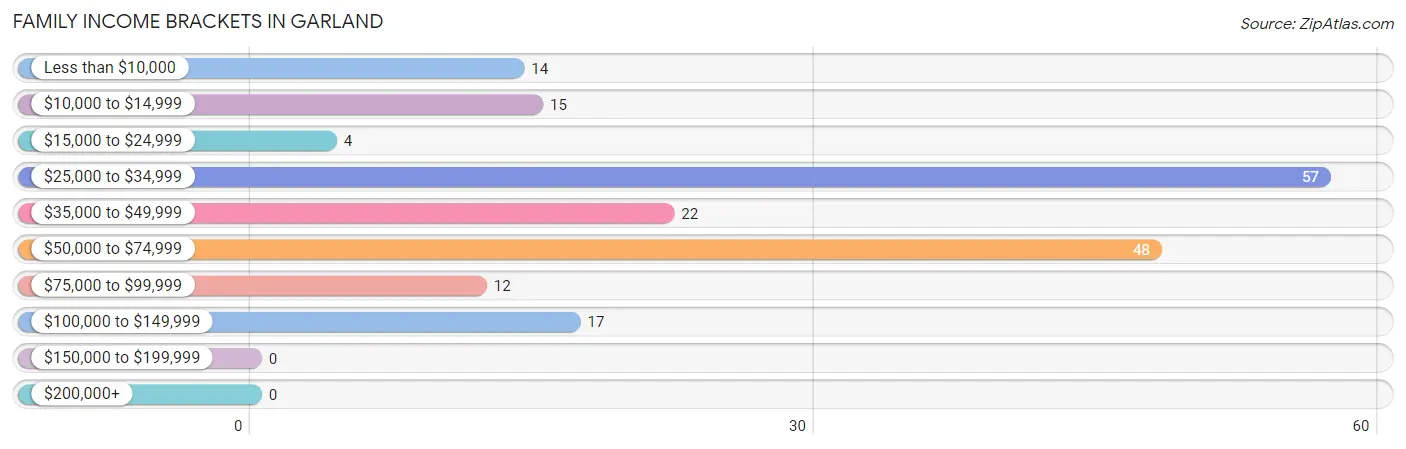
| Income Bracket | # Families | % Families |
| Less than $10,000 | 14 | 7.4% |
| $10,000 to $14,999 | 15 | 7.9% |
| $15,000 to $24,999 | 4 | 2.1% |
| $25,000 to $34,999 | 57 | 30.2% |
| $35,000 to $49,999 | 22 | 11.6% |
| $50,000 to $74,999 | 48 | 25.4% |
| $75,000 to $99,999 | 12 | 6.3% |
| $100,000 to $149,999 | 17 | 9.0% |
| $150,000 to $199,999 | 0 | 0.0% |
| $200,000+ | 0 | 0.0% |
Family Income by Famaliy Size in Garland
3-person families (25 | 13.2%) account for the highest median family income in Garland with $63,047 per family, while 2-person families (65 | 34.4%) have the highest median income of $21,042 per family member.
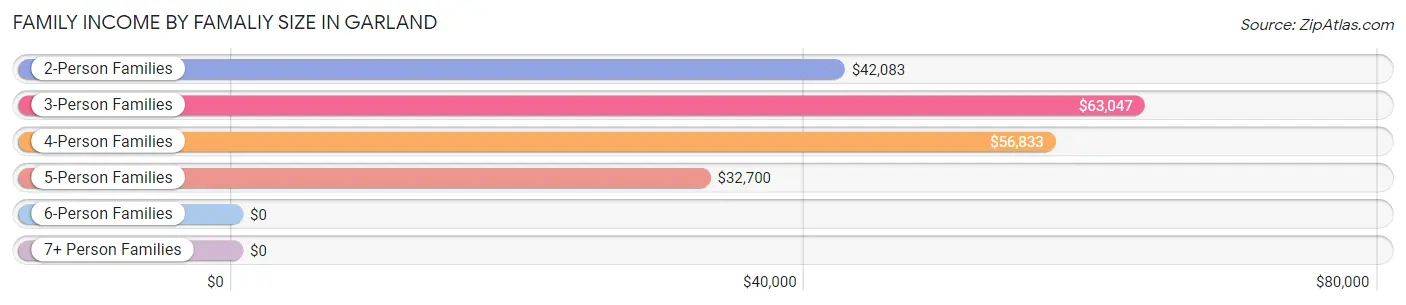
| Income Bracket | # Families | Median Income |
| 2-Person Families | 65 (34.4%) | $42,083 |
| 3-Person Families | 25 (13.2%) | $63,047 |
| 4-Person Families | 46 (24.3%) | $56,833 |
| 5-Person Families | 46 (24.3%) | $32,700 |
| 6-Person Families | 0 (0.0%) | $0 |
| 7+ Person Families | 7 (3.7%) | $0 |
| Total | 189 (100.0%) | $40,865 |
Family Income by Number of Earners in Garland
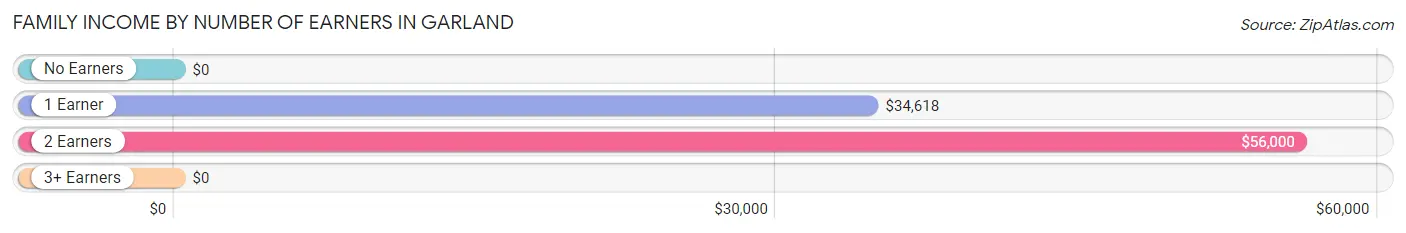
| Number of Earners | # Families | Median Income |
| No Earners | 27 (14.3%) | $0 |
| 1 Earner | 107 (56.6%) | $34,618 |
| 2 Earners | 48 (25.4%) | $56,000 |
| 3+ Earners | 7 (3.7%) | $0 |
| Total | 189 (100.0%) | $40,865 |
Household Income in Garland
Household Income Brackets in Garland
With 99 households falling in the category, the $50,000 to $74,999 income range is the most frequent in Garland, accounting for 32.1% of all households.
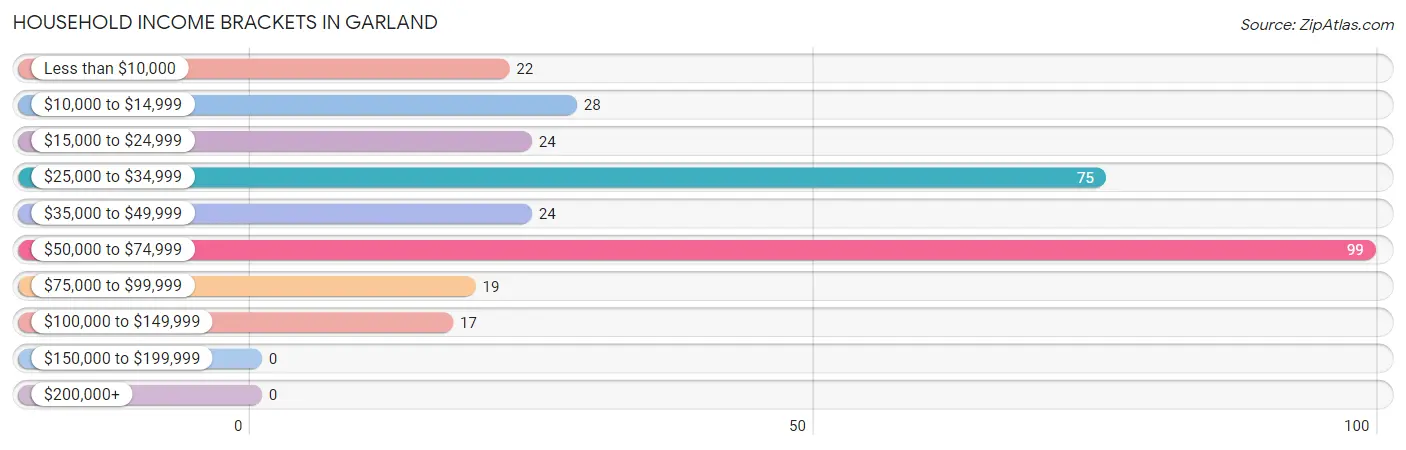
| Income Bracket | # Households | % Households |
| Less than $10,000 | 22 | 7.1% |
| $10,000 to $14,999 | 28 | 9.1% |
| $15,000 to $24,999 | 24 | 7.8% |
| $25,000 to $34,999 | 75 | 24.4% |
| $35,000 to $49,999 | 24 | 7.8% |
| $50,000 to $74,999 | 99 | 32.1% |
| $75,000 to $99,999 | 19 | 6.2% |
| $100,000 to $149,999 | 17 | 5.5% |
| $150,000 to $199,999 | 0 | 0.0% |
| $200,000+ | 0 | 0.0% |
Household Income by Householder Age in Garland
The median household income in Garland is $40,577, with the highest median household income of $60,032 found in the 45 to 64 years age bracket for the primary householder. A total of 143 households (46.4%) fall into this category.
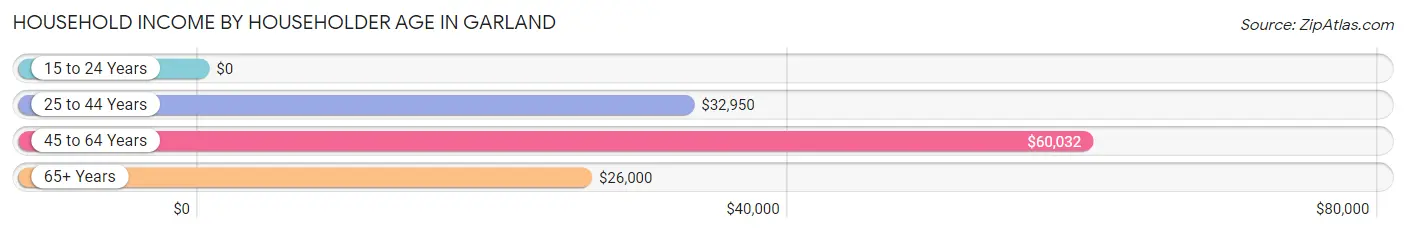
| Income Bracket | # Households | Median Income |
| 15 to 24 Years | 0 (0.0%) | $0 |
| 25 to 44 Years | 89 (28.9%) | $32,950 |
| 45 to 64 Years | 143 (46.4%) | $60,032 |
| 65+ Years | 76 (24.7%) | $26,000 |
| Total | 308 (100.0%) | $40,577 |
Poverty in Garland
Income Below Poverty by Sex and Age in Garland
With 42.6% poverty level for males and 49.6% for females among the residents of Garland, 5 year old males and under 5 year old females are the most vulnerable to poverty, with 8 males (100.0%) and 50 females (100.0%) in their respective age groups living below the poverty level.
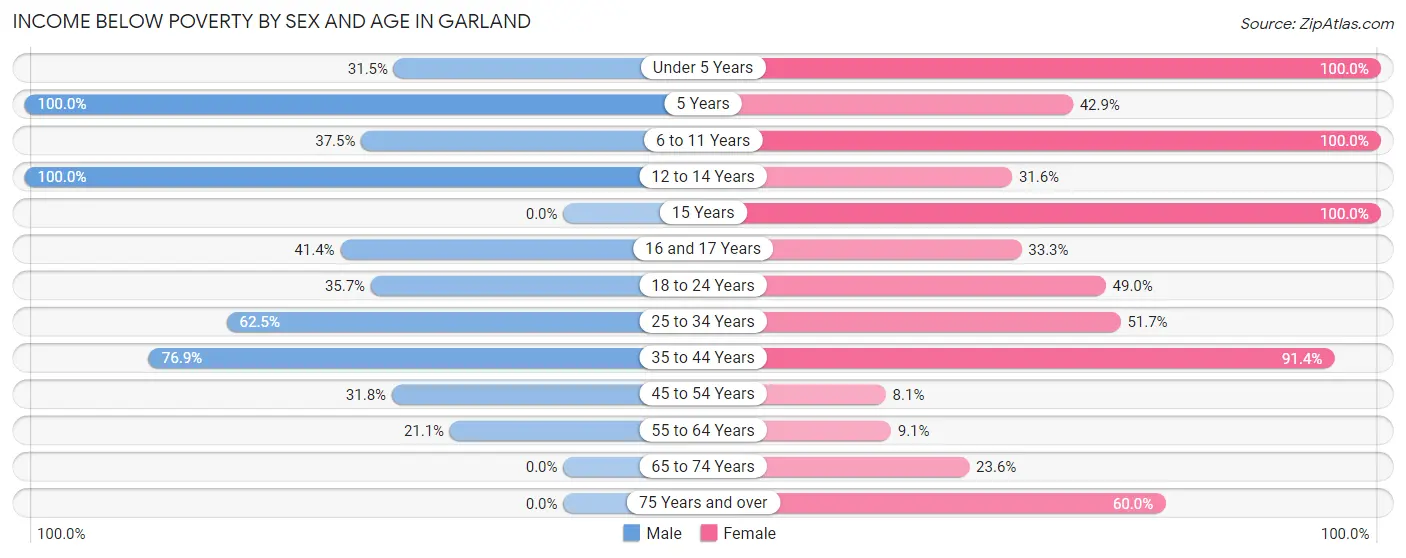
| Age Bracket | Male | Female |
| Under 5 Years | 28 (31.5%) | 50 (100.0%) |
| 5 Years | 8 (100.0%) | 3 (42.9%) |
| 6 to 11 Years | 9 (37.5%) | 27 (100.0%) |
| 12 to 14 Years | 13 (100.0%) | 6 (31.6%) |
| 15 Years | 0 (0.0%) | 6 (100.0%) |
| 16 and 17 Years | 12 (41.4%) | 2 (33.3%) |
| 18 to 24 Years | 40 (35.7%) | 71 (49.0%) |
| 25 to 34 Years | 40 (62.5%) | 15 (51.7%) |
| 35 to 44 Years | 30 (76.9%) | 53 (91.4%) |
| 45 to 54 Years | 7 (31.8%) | 7 (8.1%) |
| 55 to 64 Years | 4 (21.0%) | 3 (9.1%) |
| 65 to 74 Years | 0 (0.0%) | 13 (23.6%) |
| 75 Years and over | 0 (0.0%) | 15 (60.0%) |
| Total | 191 (42.6%) | 271 (49.6%) |
Income Above Poverty by Sex and Age in Garland
According to the poverty statistics in Garland, males aged 65 to 74 years and females aged 45 to 54 years are the age groups that are most secure financially, with 100.0% of males and 91.9% of females in these age groups living above the poverty line.
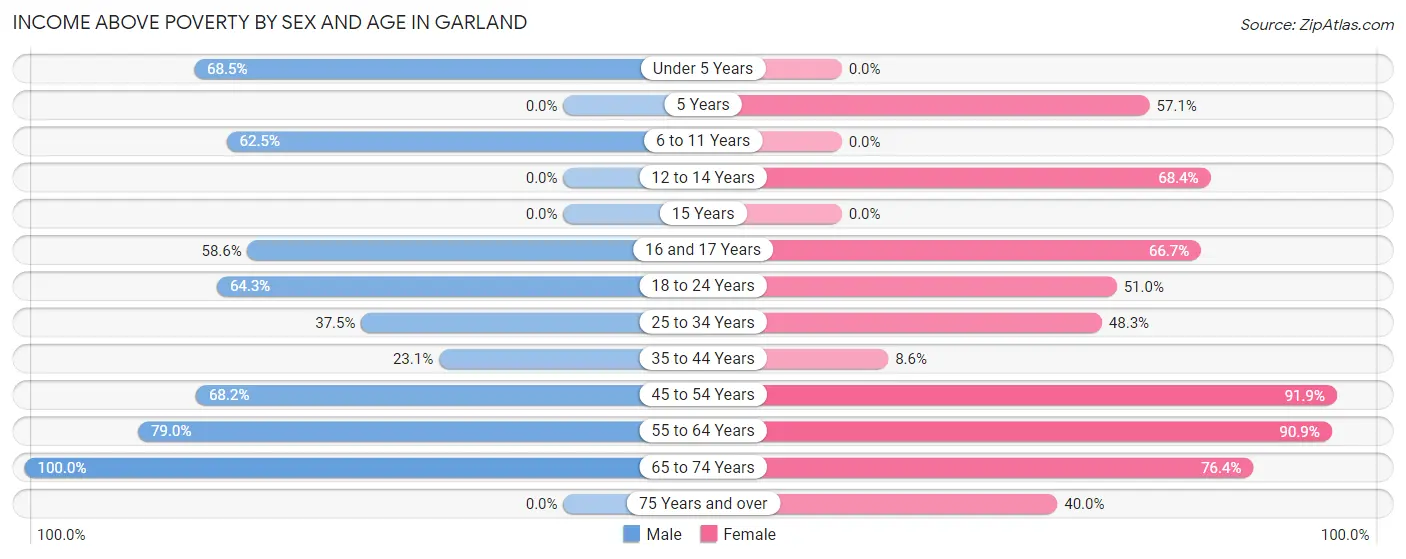
| Age Bracket | Male | Female |
| Under 5 Years | 61 (68.5%) | 0 (0.0%) |
| 5 Years | 0 (0.0%) | 4 (57.1%) |
| 6 to 11 Years | 15 (62.5%) | 0 (0.0%) |
| 12 to 14 Years | 0 (0.0%) | 13 (68.4%) |
| 15 Years | 0 (0.0%) | 0 (0.0%) |
| 16 and 17 Years | 17 (58.6%) | 4 (66.7%) |
| 18 to 24 Years | 72 (64.3%) | 74 (51.0%) |
| 25 to 34 Years | 24 (37.5%) | 14 (48.3%) |
| 35 to 44 Years | 9 (23.1%) | 5 (8.6%) |
| 45 to 54 Years | 15 (68.2%) | 79 (91.9%) |
| 55 to 64 Years | 15 (78.9%) | 30 (90.9%) |
| 65 to 74 Years | 29 (100.0%) | 42 (76.4%) |
| 75 Years and over | 0 (0.0%) | 10 (40.0%) |
| Total | 257 (57.4%) | 275 (50.4%) |
Income Below Poverty Among Married-Couple Families in Garland
The poverty statistics for married-couple families in Garland show that 38.1% or 37 of the total 97 families live below the poverty line. Families with 3 or 4 children have the highest poverty rate of 100.0%, comprising of 2 families. On the other hand, families with 1 or 2 children have the lowest poverty rate of 30.2%, which includes 19 families.
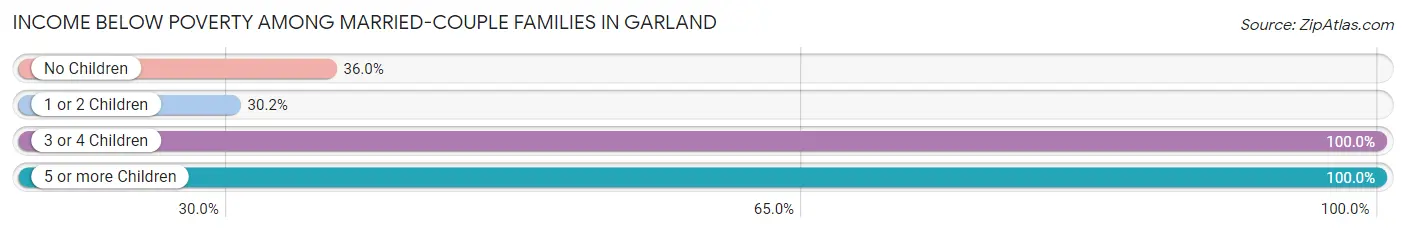
| Children | Above Poverty | Below Poverty |
| No Children | 16 (64.0%) | 9 (36.0%) |
| 1 or 2 Children | 44 (69.8%) | 19 (30.2%) |
| 3 or 4 Children | 0 (0.0%) | 2 (100.0%) |
| 5 or more Children | 0 (0.0%) | 7 (100.0%) |
| Total | 60 (61.9%) | 37 (38.1%) |
Income Below Poverty Among Single-Parent Households in Garland
According to the poverty data in Garland, 20.0% or 2 single-father households and 48.8% or 40 single-mother households are living below the poverty line. Among single-father households, those with 1 or 2 children have the highest poverty rate, with 2 households (28.6%) experiencing poverty. Likewise, among single-mother households, those with 1 or 2 children have the highest poverty rate, with 32 households (88.9%) falling below the poverty line.
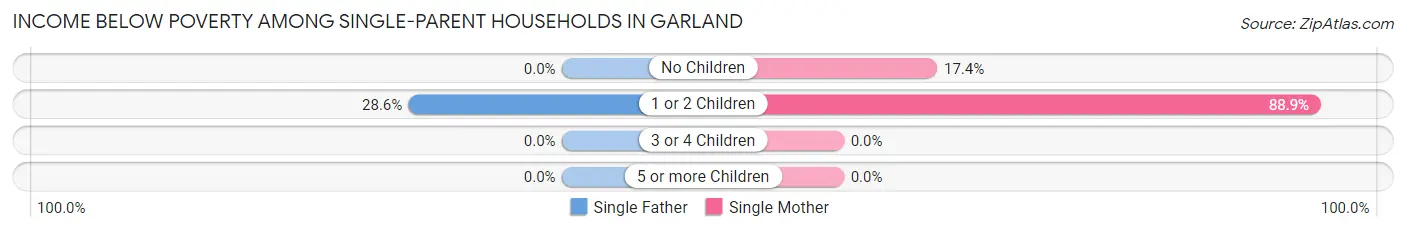
| Children | Single Father | Single Mother |
| No Children | 0 (0.0%) | 8 (17.4%) |
| 1 or 2 Children | 2 (28.6%) | 32 (88.9%) |
| 3 or 4 Children | 0 (0.0%) | 0 (0.0%) |
| 5 or more Children | 0 (0.0%) | 0 (0.0%) |
| Total | 2 (20.0%) | 40 (48.8%) |
Income Below Poverty Among Married-Couple vs Single-Parent Households in Garland
The poverty data for Garland shows that 37 of the married-couple family households (38.1%) and 42 of the single-parent households (45.7%) are living below the poverty level. Within the married-couple family households, those with 3 or 4 children have the highest poverty rate, with 2 households (100.0%) falling below the poverty line. Among the single-parent households, those with 1 or 2 children have the highest poverty rate, with 34 household (79.1%) living below poverty.
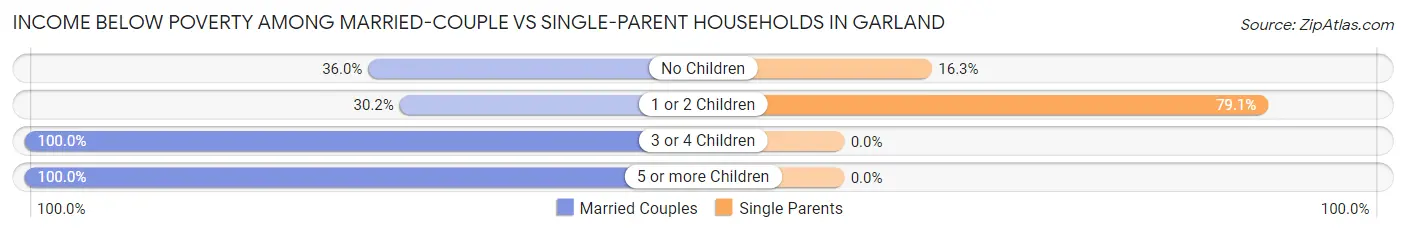
| Children | Married-Couple Families | Single-Parent Households |
| No Children | 9 (36.0%) | 8 (16.3%) |
| 1 or 2 Children | 19 (30.2%) | 34 (79.1%) |
| 3 or 4 Children | 2 (100.0%) | 0 (0.0%) |
| 5 or more Children | 7 (100.0%) | 0 (0.0%) |
| Total | 37 (38.1%) | 42 (45.7%) |
Race in Garland
The most populous races in Garland are Black / African American (488 | 49.0%), White / Caucasian (471 | 47.3%), and Hispanic or Latino (172 | 17.3%).
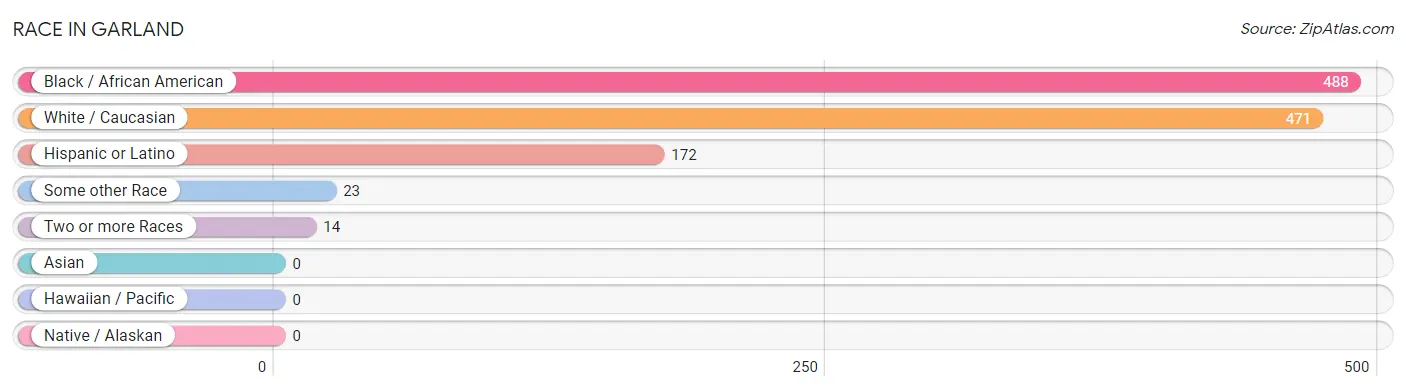
| Race | # Population | % Population |
| Asian | 0 | 0.0% |
| Black / African American | 488 | 49.0% |
| Hawaiian / Pacific | 0 | 0.0% |
| Hispanic or Latino | 172 | 17.3% |
| Native / Alaskan | 0 | 0.0% |
| White / Caucasian | 471 | 47.3% |
| Two or more Races | 14 | 1.4% |
| Some other Race | 23 | 2.3% |
| Total | 996 | 100.0% |
Ancestry in Garland
The most populous ancestries reported in Garland are Mexican (162 | 16.3%), American (67 | 6.7%), English (51 | 5.1%), Trinidadian and Tobagonian (9 | 0.9%), and Irish (6 | 0.6%), together accounting for 29.6% of all Garland residents.
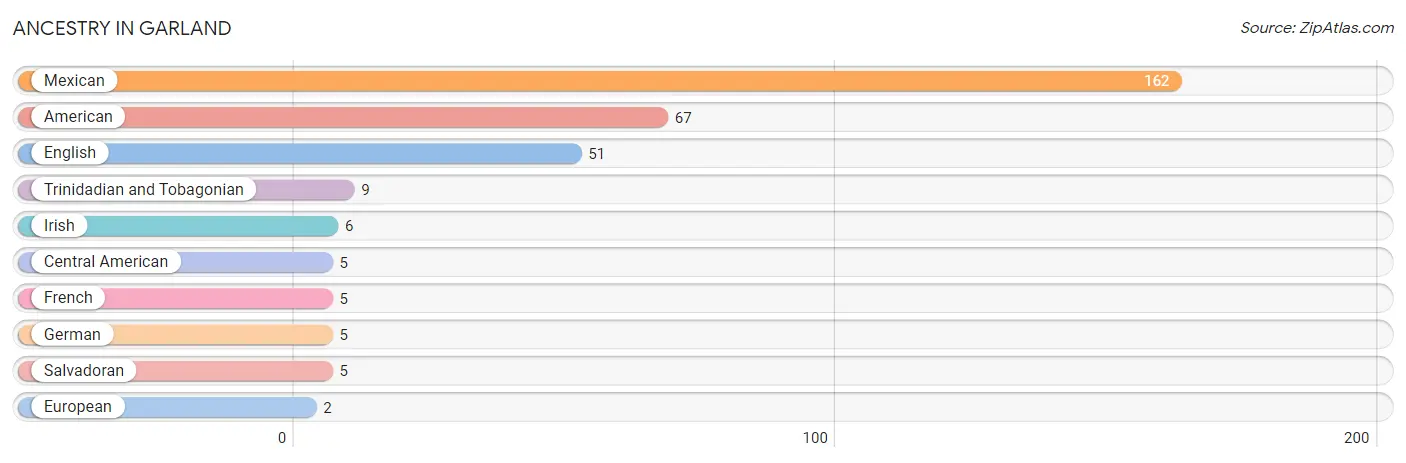
| Ancestry | # Population | % Population |
| American | 67 | 6.7% |
| Central American | 5 | 0.5% |
| English | 51 | 5.1% |
| European | 2 | 0.2% |
| French | 5 | 0.5% |
| German | 5 | 0.5% |
| Irish | 6 | 0.6% |
| Mexican | 162 | 16.3% |
| Salvadoran | 5 | 0.5% |
| Trinidadian and Tobagonian | 9 | 0.9% | View All 10 Rows |
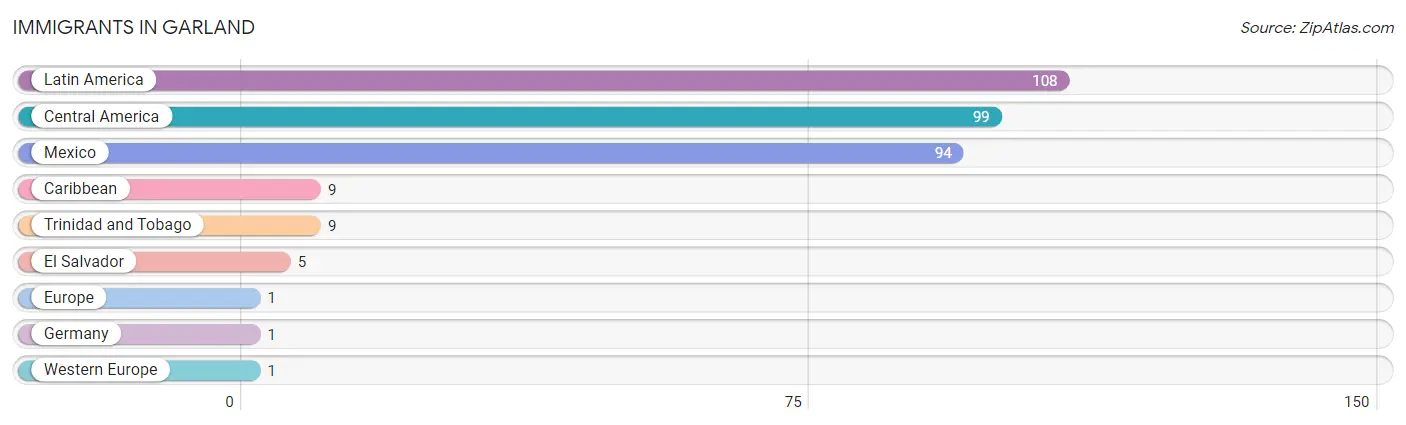
Immigrants in Garland
The most numerous immigrant groups reported in Garland came from Latin America (108 | 10.8%), Central America (99 | 9.9%), Mexico (94 | 9.4%), Caribbean (9 | 0.9%), and Trinidad and Tobago (9 | 0.9%), together accounting for 32.0% of all Garland residents.
| Immigration Origin | # Population | % Population |
| Caribbean | 9 | 0.9% |
| Central America | 99 | 9.9% |
| El Salvador | 5 | 0.5% |
| Europe | 1 | 0.1% |
| Germany | 1 | 0.1% |
| Latin America | 108 | 10.8% |
| Mexico | 94 | 9.4% |
| Trinidad and Tobago | 9 | 0.9% |
| Western Europe | 1 | 0.1% | View All 9 Rows |
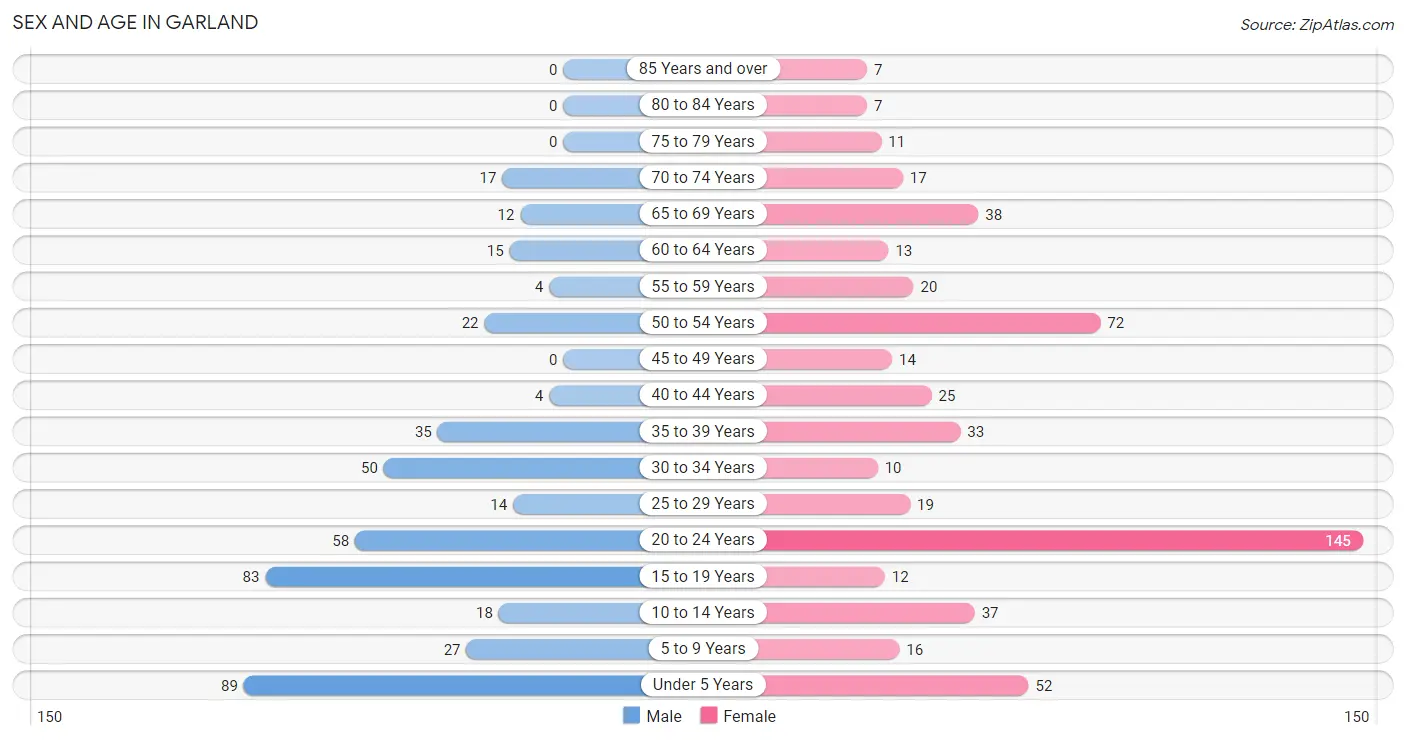
Sex and Age in Garland
Sex and Age in Garland
The most populous age groups in Garland are Under 5 Years (89 | 19.9%) for men and 20 to 24 Years (145 | 26.5%) for women.
| Age Bracket | Male | Female |
| Under 5 Years | 89 (19.9%) | 52 (9.5%) |
| 5 to 9 Years | 27 (6.0%) | 16 (2.9%) |
| 10 to 14 Years | 18 (4.0%) | 37 (6.8%) |
| 15 to 19 Years | 83 (18.5%) | 12 (2.2%) |
| 20 to 24 Years | 58 (13.0%) | 145 (26.5%) |
| 25 to 29 Years | 14 (3.1%) | 19 (3.5%) |
| 30 to 34 Years | 50 (11.2%) | 10 (1.8%) |
| 35 to 39 Years | 35 (7.8%) | 33 (6.0%) |
| 40 to 44 Years | 4 (0.9%) | 25 (4.6%) |
| 45 to 49 Years | 0 (0.0%) | 14 (2.5%) |
| 50 to 54 Years | 22 (4.9%) | 72 (13.1%) |
| 55 to 59 Years | 4 (0.9%) | 20 (3.6%) |
| 60 to 64 Years | 15 (3.4%) | 13 (2.4%) |
| 65 to 69 Years | 12 (2.7%) | 38 (6.9%) |
| 70 to 74 Years | 17 (3.8%) | 17 (3.1%) |
| 75 to 79 Years | 0 (0.0%) | 11 (2.0%) |
| 80 to 84 Years | 0 (0.0%) | 7 (1.3%) |
| 85 Years and over | 0 (0.0%) | 7 (1.3%) |
| Total | 448 (100.0%) | 548 (100.0%) |
Families and Households in Garland
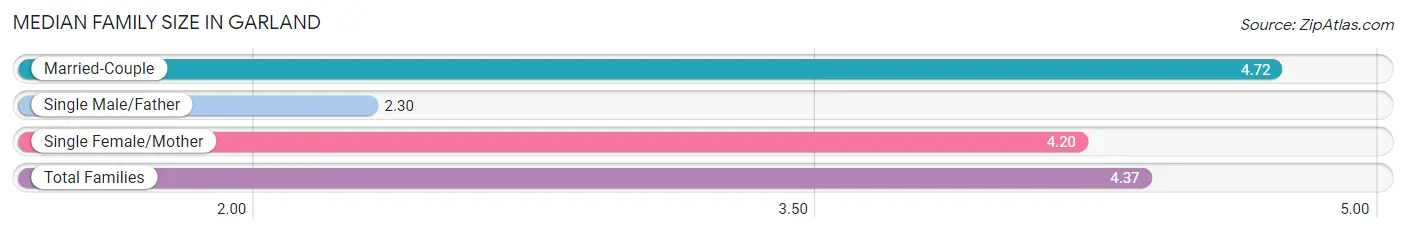
Median Family Size in Garland
The median family size in Garland is 4.37 persons per family, with married-couple families (97 | 51.3%) accounting for the largest median family size of 4.72 persons per family. On the other hand, single male/father families (10 | 5.3%) represent the smallest median family size with 2.30 persons per family.
| Family Type | # Families | Family Size |
| Married-Couple | 97 (51.3%) | 4.72 |
| Single Male/Father | 10 (5.3%) | 2.30 |
| Single Female/Mother | 82 (43.4%) | 4.20 |
| Total Families | 189 (100.0%) | 4.37 |
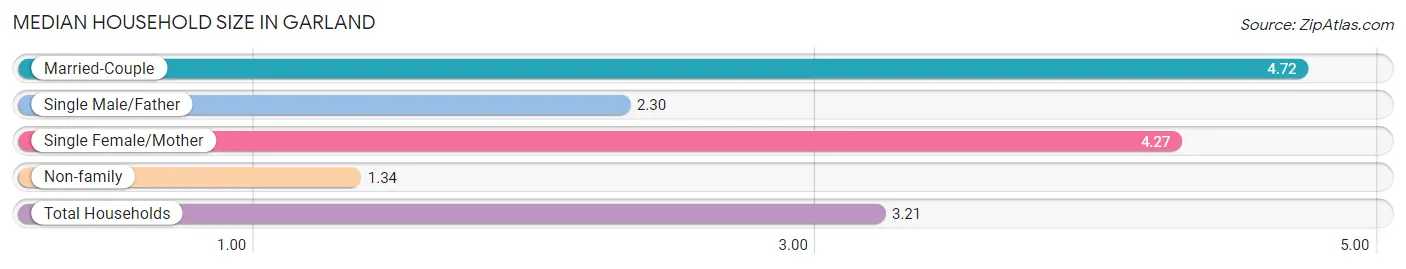
Median Household Size in Garland
The median household size in Garland is 3.21 persons per household, with married-couple households (97 | 31.5%) accounting for the largest median household size of 4.72 persons per household. non-family households (119 | 38.6%) represent the smallest median household size with 1.34 persons per household.
| Household Type | # Households | Household Size |
| Married-Couple | 97 (31.5%) | 4.72 |
| Single Male/Father | 10 (3.3%) | 2.30 |
| Single Female/Mother | 82 (26.6%) | 4.27 |
| Non-family | 119 (38.6%) | 1.34 |
| Total Households | 308 (100.0%) | 3.21 |
Household Size by Marriage Status in Garland
Out of a total of 308 households in Garland, 189 (61.4%) are family households, while 119 (38.6%) are nonfamily households. The most numerous type of family households are 2-person households, comprising 62, and the most common type of nonfamily households are 1-person households, comprising 114.
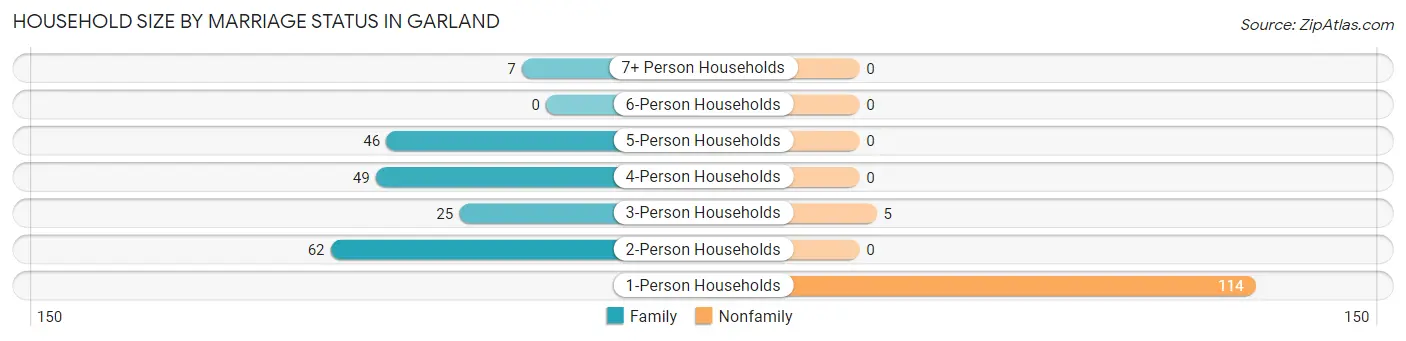
| Household Size | Family Households | Nonfamily Households |
| 1-Person Households | - | 114 (37.0%) |
| 2-Person Households | 62 (20.1%) | 0 (0.0%) |
| 3-Person Households | 25 (8.1%) | 5 (1.6%) |
| 4-Person Households | 49 (15.9%) | 0 (0.0%) |
| 5-Person Households | 46 (14.9%) | 0 (0.0%) |
| 6-Person Households | 0 (0.0%) | 0 (0.0%) |
| 7+ Person Households | 7 (2.3%) | 0 (0.0%) |
| Total | 189 (61.4%) | 119 (38.6%) |
Female Fertility in Garland
Fertility by Age in Garland
Average fertility rate in Garland is 217.0 births per 1,000 women. Women in the age bracket of 20 to 34 years have the highest fertility rate with 322.0 births per 1,000 women. Women in the age bracket of 20 to 34 years acount for 100.0% of all women with births.
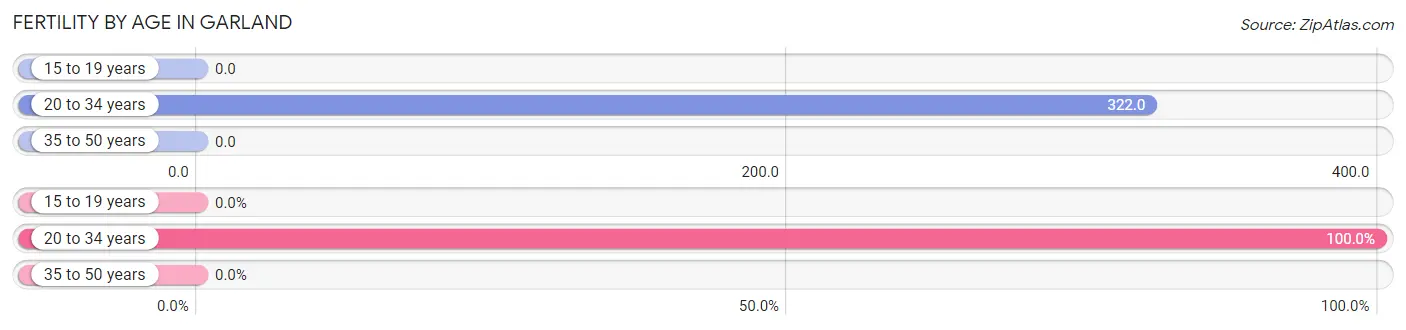
| Age Bracket | Women with Births | Births / 1,000 Women |
| 15 to 19 years | 0 (0.0%) | 0.0 |
| 20 to 34 years | 56 (100.0%) | 322.0 |
| 35 to 50 years | 0 (0.0%) | 0.0 |
| Total | 56 (100.0%) | 217.0 |
Fertility by Age by Marriage Status in Garland
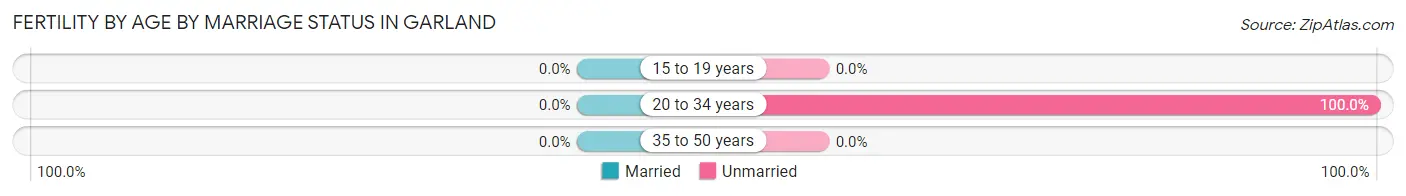
| Age Bracket | Married | Unmarried |
| 15 to 19 years | 0 (0.0%) | 0 (0.0%) |
| 20 to 34 years | 0 (0.0%) | 56 (100.0%) |
| 35 to 50 years | 0 (0.0%) | 0 (0.0%) |
| Total | 0 (0.0%) | 56 (100.0%) |
Fertility by Education in Garland
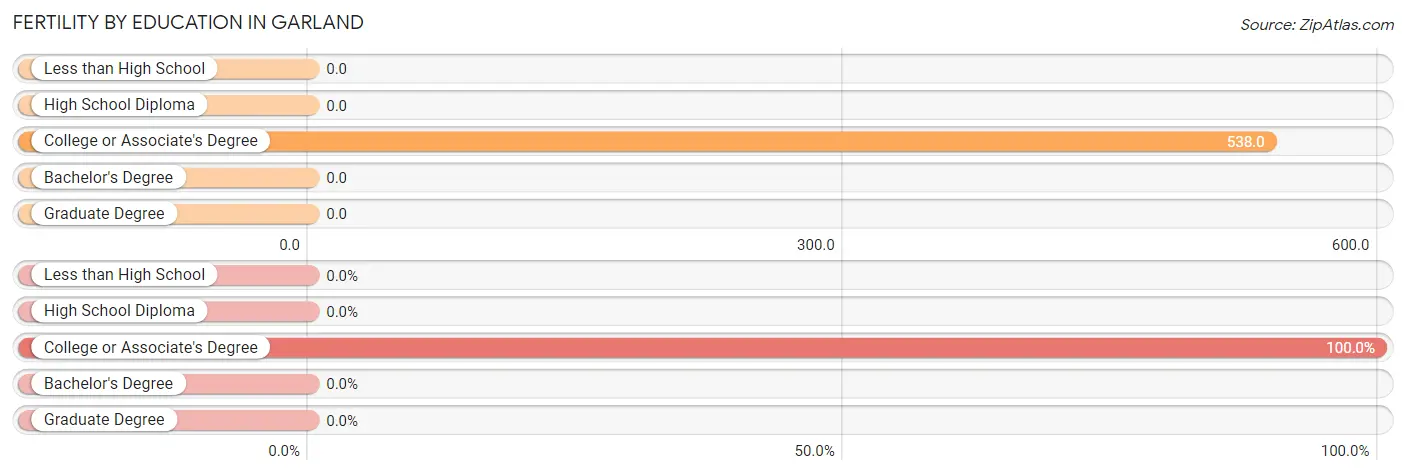
| Educational Attainment | Women with Births | Births / 1,000 Women |
| Less than High School | 0 (0.0%) | 0.0 |
| High School Diploma | 0 (0.0%) | 0.0 |
| College or Associate's Degree | 56 (100.0%) | 538.0 |
| Bachelor's Degree | 0 (0.0%) | 0.0 |
| Graduate Degree | 0 (0.0%) | 0.0 |
| Total | 56 (100.0%) | 217.0 |
Fertility by Education by Marriage Status in Garland
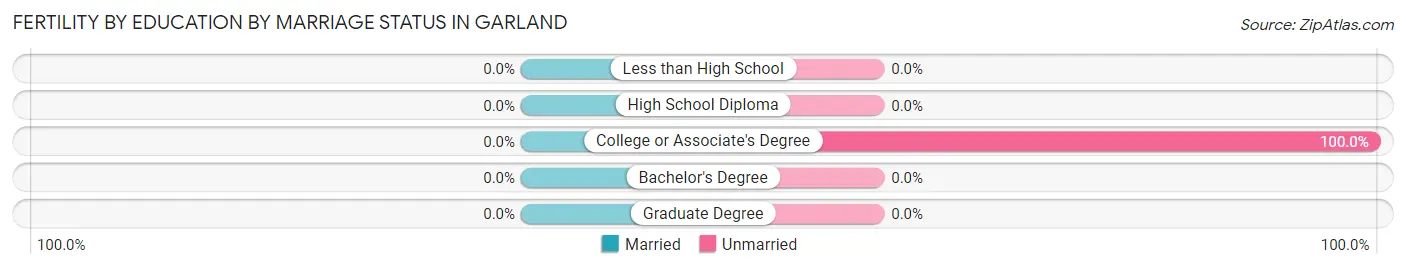
| Educational Attainment | Married | Unmarried |
| Less than High School | 0 (0.0%) | 0 (0.0%) |
| High School Diploma | 0 (0.0%) | 0 (0.0%) |
| College or Associate's Degree | 0 (0.0%) | 56 (100.0%) |
| Bachelor's Degree | 0 (0.0%) | 0 (0.0%) |
| Graduate Degree | 0 (0.0%) | 0 (0.0%) |
| Total | 0 (0.0%) | 56 (100.0%) |
Employment Characteristics in Garland
Employment by Class of Employer in Garland
Among the 371 employed individuals in Garland, private company employees (271 | 73.1%), state government employees (39 | 10.5%), and local government employees (28 | 7.5%) make up the most common classes of employment.
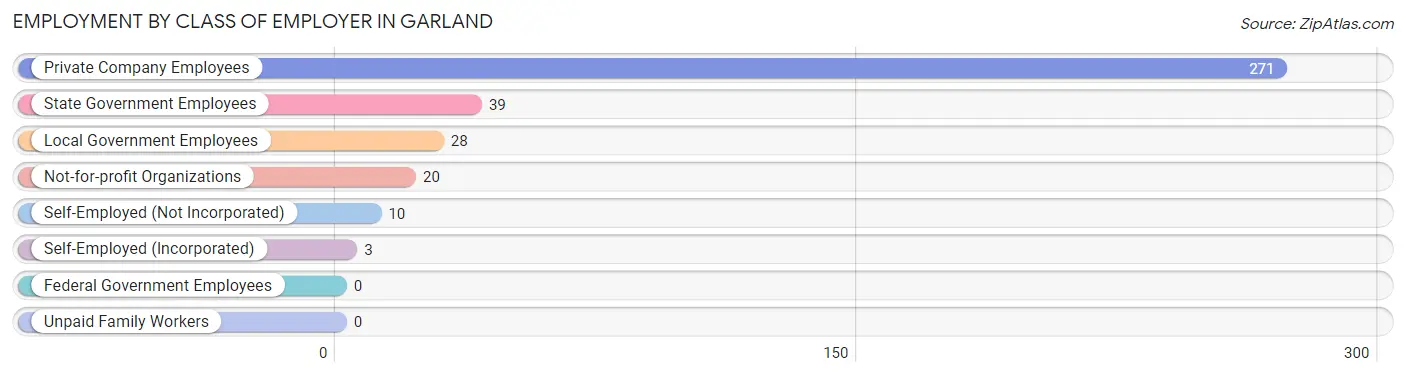
| Employer Class | # Employees | % Employees |
| Private Company Employees | 271 | 73.1% |
| Self-Employed (Incorporated) | 3 | 0.8% |
| Self-Employed (Not Incorporated) | 10 | 2.7% |
| Not-for-profit Organizations | 20 | 5.4% |
| Local Government Employees | 28 | 7.5% |
| State Government Employees | 39 | 10.5% |
| Federal Government Employees | 0 | 0.0% |
| Unpaid Family Workers | 0 | 0.0% |
| Total | 371 | 100.0% |
Employment Status by Age in Garland
According to the labor force statistics for Garland, out of the total population over 16 years of age (751), 52.9% or 397 individuals are in the labor force, with 6.5% or 26 of them unemployed. The age group with the highest labor force participation rate is 30 to 34 years, with 100.0% or 60 individuals in the labor force. Within the labor force, the 16 to 19 years age range has the highest percentage of unemployed individuals, with 76.0% or 19 of them being unemployed.
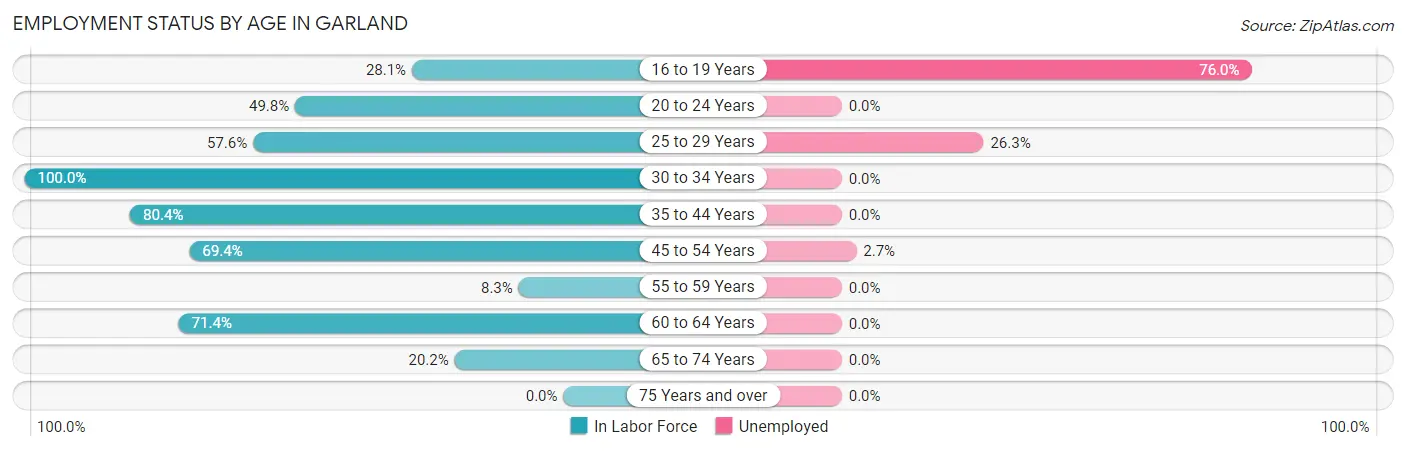
| Age Bracket | In Labor Force | Unemployed |
| 16 to 19 Years | 25 (28.1%) | 19 (76.0%) |
| 20 to 24 Years | 101 (49.8%) | 0 (0.0%) |
| 25 to 29 Years | 19 (57.6%) | 5 (26.3%) |
| 30 to 34 Years | 60 (100.0%) | 0 (0.0%) |
| 35 to 44 Years | 78 (80.4%) | 0 (0.0%) |
| 45 to 54 Years | 75 (69.4%) | 2 (2.7%) |
| 55 to 59 Years | 2 (8.3%) | 0 (0.0%) |
| 60 to 64 Years | 20 (71.4%) | 0 (0.0%) |
| 65 to 74 Years | 17 (20.2%) | 0 (0.0%) |
| 75 Years and over | 0 (0.0%) | 0 (0.0%) |
| Total | 397 (52.9%) | 26 (6.5%) |
Employment Status by Educational Attainment in Garland
According to labor force statistics for Garland, 72.6% of individuals (254) out of the total population between 25 and 64 years of age (350) are in the labor force, with 2.8% or 7 of them being unemployed. The group with the highest labor force participation rate are those with the educational attainment of bachelor's degree or higher, with 100.0% or 21 individuals in the labor force. Within the labor force, individuals with less than high school education have the highest percentage of unemployment, with 17.9% or 5 of them being unemployed.
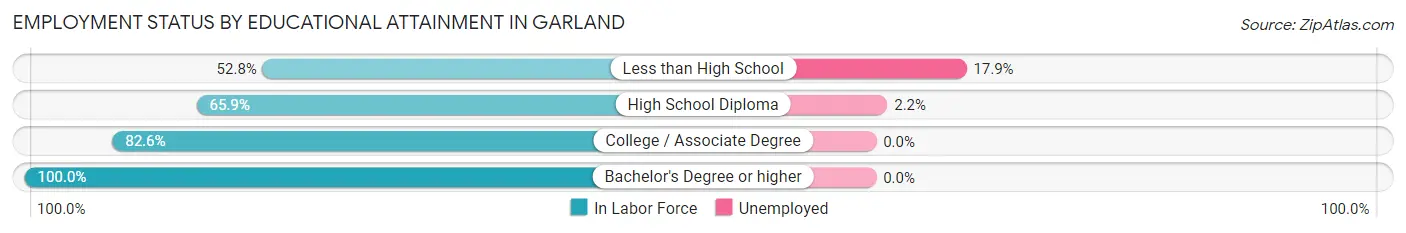
| Educational Attainment | In Labor Force | Unemployed |
| Less than High School | 28 (52.8%) | 9 (17.9%) |
| High School Diploma | 91 (65.9%) | 3 (2.2%) |
| College / Associate Degree | 114 (82.6%) | 0 (0.0%) |
| Bachelor's Degree or higher | 21 (100.0%) | 0 (0.0%) |
| Total | 254 (72.6%) | 10 (2.8%) |
Employment Occupations by Sex in Garland
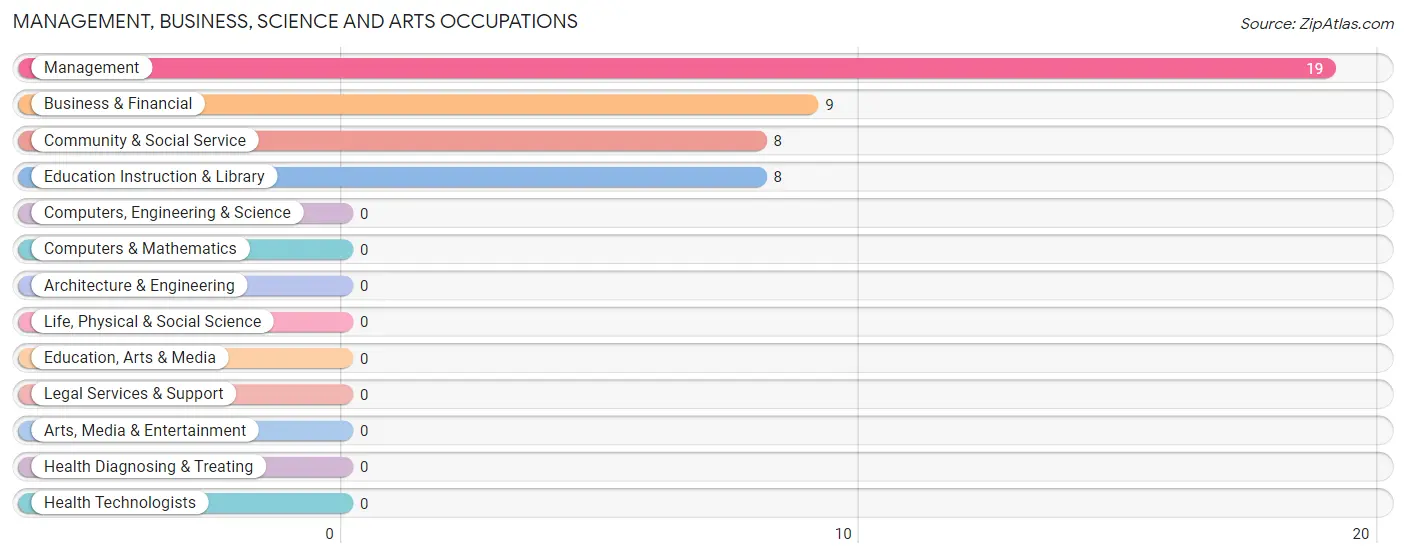
Management, Business, Science and Arts Occupations
The most common Management, Business, Science and Arts occupations in Garland are Management (19 | 5.1%), Business & Financial (9 | 2.4%), Community & Social Service (8 | 2.2%), and Education Instruction & Library (8 | 2.2%).
Management, Business, Science and Arts Occupations by Sex
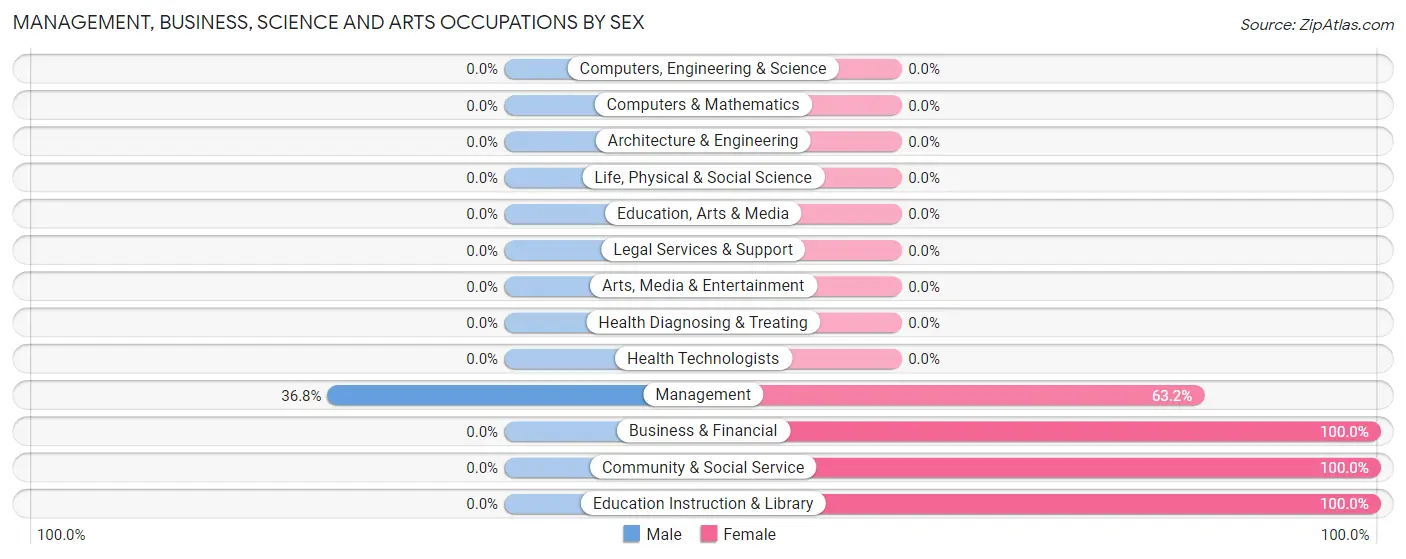
| Occupation | Male | Female |
| Management | 7 (36.8%) | 12 (63.2%) |
| Business & Financial | 0 (0.0%) | 9 (100.0%) |
| Computers, Engineering & Science | 0 (0.0%) | 0 (0.0%) |
| Computers & Mathematics | 0 (0.0%) | 0 (0.0%) |
| Architecture & Engineering | 0 (0.0%) | 0 (0.0%) |
| Life, Physical & Social Science | 0 (0.0%) | 0 (0.0%) |
| Community & Social Service | 0 (0.0%) | 8 (100.0%) |
| Education, Arts & Media | 0 (0.0%) | 0 (0.0%) |
| Legal Services & Support | 0 (0.0%) | 0 (0.0%) |
| Education Instruction & Library | 0 (0.0%) | 8 (100.0%) |
| Arts, Media & Entertainment | 0 (0.0%) | 0 (0.0%) |
| Health Diagnosing & Treating | 0 (0.0%) | 0 (0.0%) |
| Health Technologists | 0 (0.0%) | 0 (0.0%) |
| Total (Category) | 7 (19.4%) | 29 (80.6%) |
| Total (Overall) | 124 (33.4%) | 247 (66.6%) |
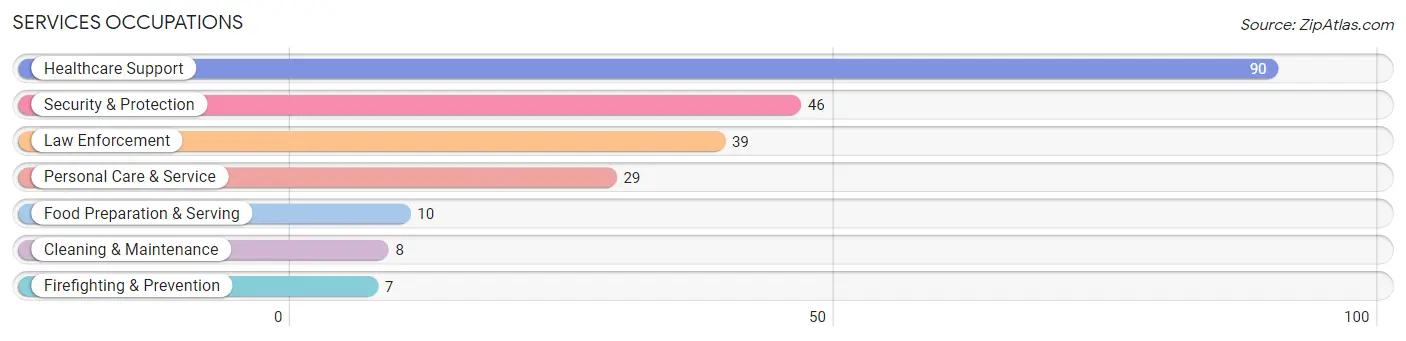
Services Occupations
The most common Services occupations in Garland are Healthcare Support (90 | 24.3%), Security & Protection (46 | 12.4%), Law Enforcement (39 | 10.5%), Personal Care & Service (29 | 7.8%), and Food Preparation & Serving (10 | 2.7%).
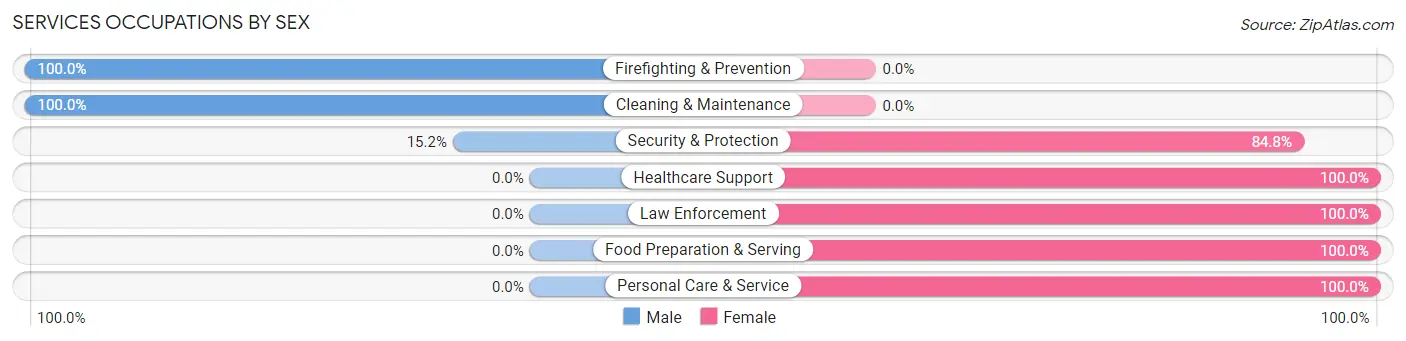
Services Occupations by Sex
Within the Services occupations in Garland, the most male-oriented occupations are Firefighting & Prevention (100.0%), Cleaning & Maintenance (100.0%), and Security & Protection (15.2%), while the most female-oriented occupations are Healthcare Support (100.0%), Law Enforcement (100.0%), and Food Preparation & Serving (100.0%).
| Occupation | Male | Female |
| Healthcare Support | 0 (0.0%) | 90 (100.0%) |
| Security & Protection | 7 (15.2%) | 39 (84.8%) |
| Firefighting & Prevention | 7 (100.0%) | 0 (0.0%) |
| Law Enforcement | 0 (0.0%) | 39 (100.0%) |
| Food Preparation & Serving | 0 (0.0%) | 10 (100.0%) |
| Cleaning & Maintenance | 8 (100.0%) | 0 (0.0%) |
| Personal Care & Service | 0 (0.0%) | 29 (100.0%) |
| Total (Category) | 15 (8.2%) | 168 (91.8%) |
| Total (Overall) | 124 (33.4%) | 247 (66.6%) |
Sales and Office Occupations
The most common Sales and Office occupations in Garland are Sales & Related (41 | 11.1%), and Office & Administration (12 | 3.2%).
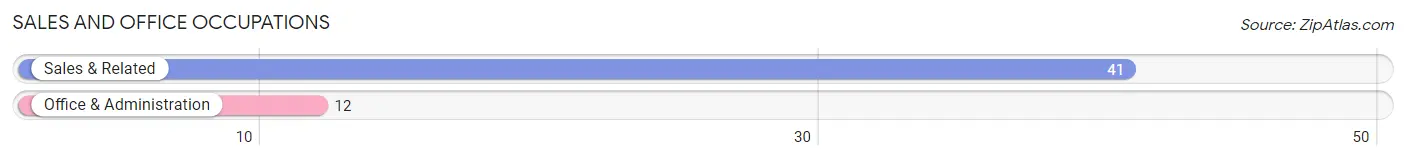
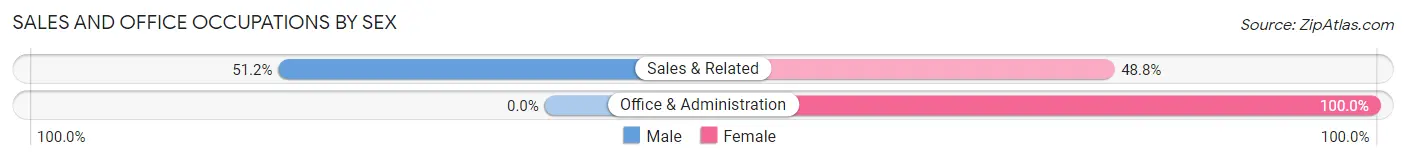
Sales and Office Occupations by Sex
| Occupation | Male | Female |
| Sales & Related | 21 (51.2%) | 20 (48.8%) |
| Office & Administration | 0 (0.0%) | 12 (100.0%) |
| Total (Category) | 21 (39.6%) | 32 (60.4%) |
| Total (Overall) | 124 (33.4%) | 247 (66.6%) |
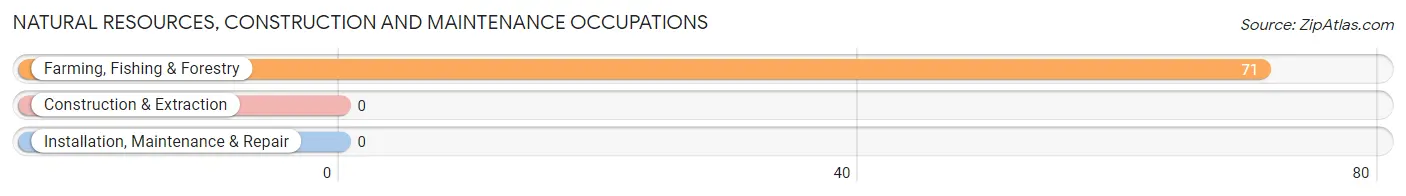
Natural Resources, Construction and Maintenance Occupations
The most common Natural Resources, Construction and Maintenance occupations in Garland are , and Farming, Fishing & Forestry (71 | 19.1%).
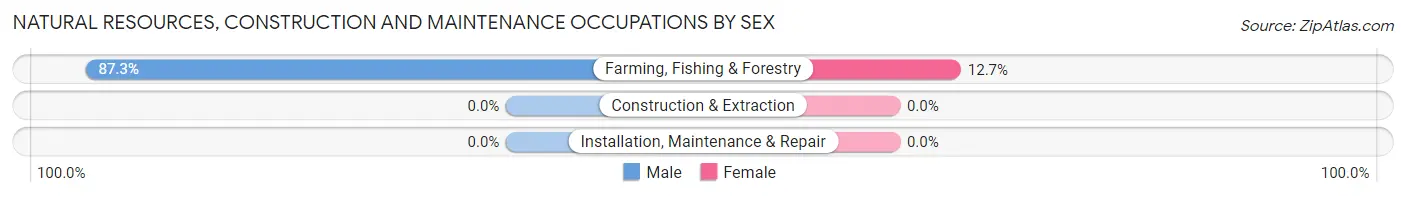
Natural Resources, Construction and Maintenance Occupations by Sex
| Occupation | Male | Female |
| Farming, Fishing & Forestry | 62 (87.3%) | 9 (12.7%) |
| Construction & Extraction | 0 (0.0%) | 0 (0.0%) |
| Installation, Maintenance & Repair | 0 (0.0%) | 0 (0.0%) |
| Total (Category) | 62 (87.3%) | 9 (12.7%) |
| Total (Overall) | 124 (33.4%) | 247 (66.6%) |
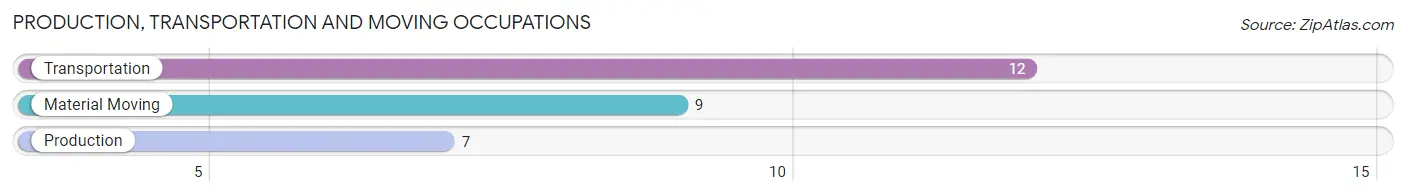
Production, Transportation and Moving Occupations
The most common Production, Transportation and Moving occupations in Garland are Transportation (12 | 3.2%), Material Moving (9 | 2.4%), and Production (7 | 1.9%).
Production, Transportation and Moving Occupations by Sex
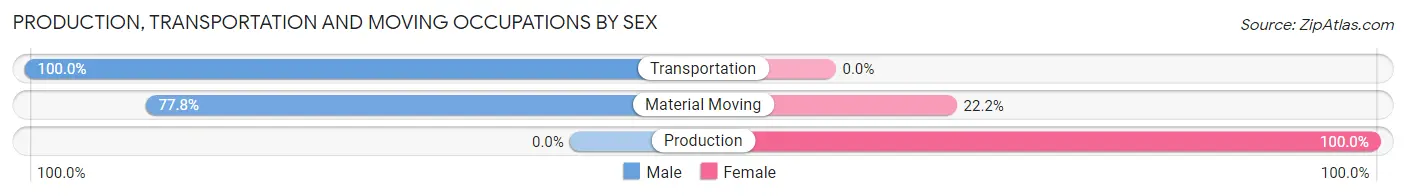
| Occupation | Male | Female |
| Production | 0 (0.0%) | 7 (100.0%) |
| Transportation | 12 (100.0%) | 0 (0.0%) |
| Material Moving | 7 (77.8%) | 2 (22.2%) |
| Total (Category) | 19 (67.9%) | 9 (32.1%) |
| Total (Overall) | 124 (33.4%) | 247 (66.6%) |
Employment Industries by Sex in Garland
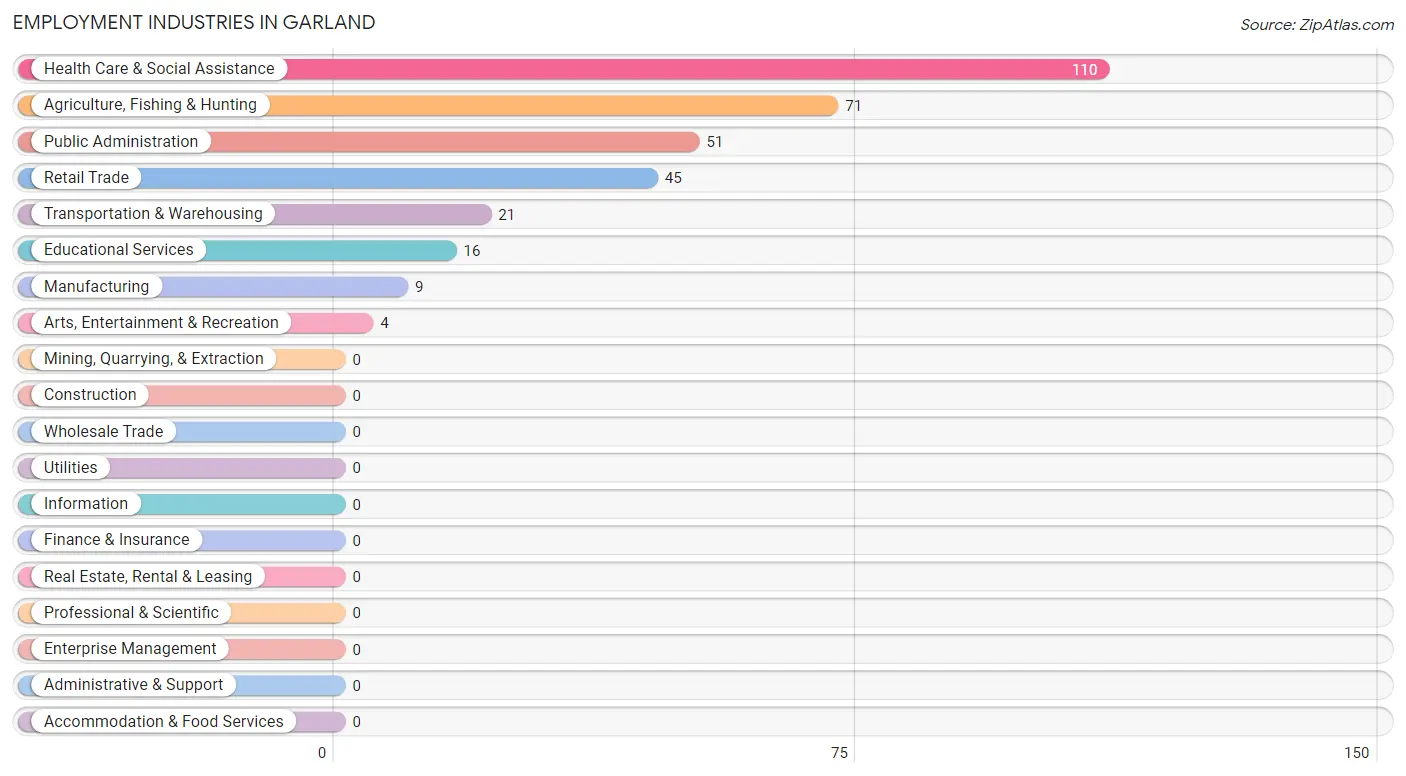
Employment Industries in Garland
The major employment industries in Garland include Health Care & Social Assistance (110 | 29.6%), Agriculture, Fishing & Hunting (71 | 19.1%), Public Administration (51 | 13.8%), Retail Trade (45 | 12.1%), and Transportation & Warehousing (21 | 5.7%).
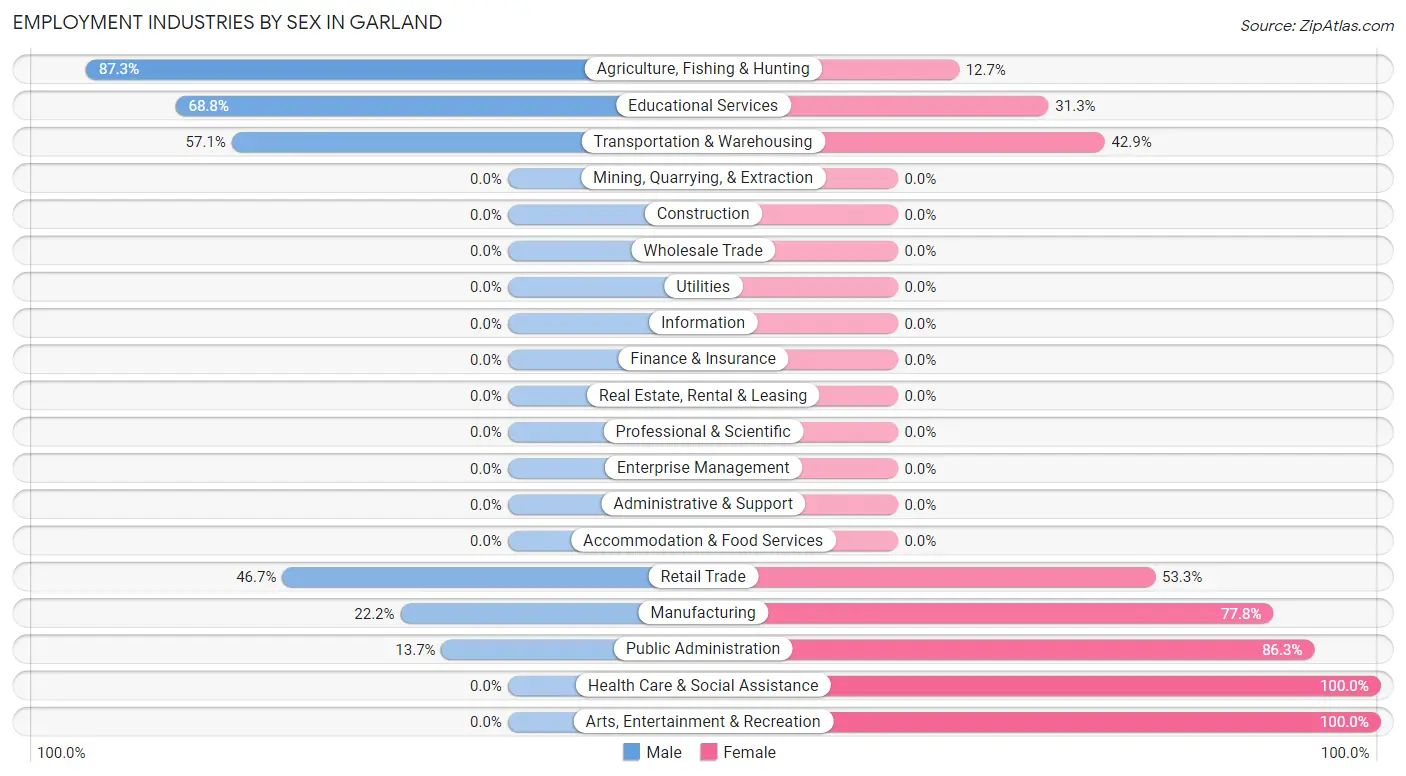
Employment Industries by Sex in Garland
The Garland industries that see more men than women are Agriculture, Fishing & Hunting (87.3%), Educational Services (68.8%), and Transportation & Warehousing (57.1%), whereas the industries that tend to have a higher number of women are Health Care & Social Assistance (100.0%), Arts, Entertainment & Recreation (100.0%), and Public Administration (86.3%).
| Industry | Male | Female |
| Agriculture, Fishing & Hunting | 62 (87.3%) | 9 (12.7%) |
| Mining, Quarrying, & Extraction | 0 (0.0%) | 0 (0.0%) |
| Construction | 0 (0.0%) | 0 (0.0%) |
| Manufacturing | 2 (22.2%) | 7 (77.8%) |
| Wholesale Trade | 0 (0.0%) | 0 (0.0%) |
| Retail Trade | 21 (46.7%) | 24 (53.3%) |
| Transportation & Warehousing | 12 (57.1%) | 9 (42.9%) |
| Utilities | 0 (0.0%) | 0 (0.0%) |
| Information | 0 (0.0%) | 0 (0.0%) |
| Finance & Insurance | 0 (0.0%) | 0 (0.0%) |
| Real Estate, Rental & Leasing | 0 (0.0%) | 0 (0.0%) |
| Professional & Scientific | 0 (0.0%) | 0 (0.0%) |
| Enterprise Management | 0 (0.0%) | 0 (0.0%) |
| Administrative & Support | 0 (0.0%) | 0 (0.0%) |
| Educational Services | 11 (68.8%) | 5 (31.2%) |
| Health Care & Social Assistance | 0 (0.0%) | 110 (100.0%) |
| Arts, Entertainment & Recreation | 0 (0.0%) | 4 (100.0%) |
| Accommodation & Food Services | 0 (0.0%) | 0 (0.0%) |
| Public Administration | 7 (13.7%) | 44 (86.3%) |
| Total | 124 (33.4%) | 247 (66.6%) |
Education in Garland
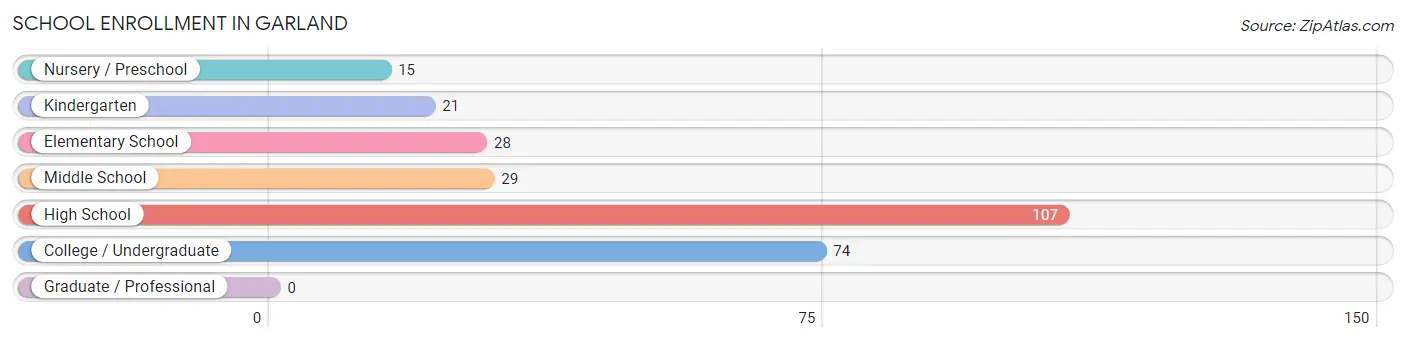
School Enrollment in Garland
The most common levels of schooling among the 274 students in Garland are high school (107 | 39.1%), college / undergraduate (74 | 27.0%), and middle school (29 | 10.6%).
| School Level | # Students | % Students |
| Nursery / Preschool | 15 | 5.5% |
| Kindergarten | 21 | 7.7% |
| Elementary School | 28 | 10.2% |
| Middle School | 29 | 10.6% |
| High School | 107 | 39.1% |
| College / Undergraduate | 74 | 27.0% |
| Graduate / Professional | 0 | 0.0% |
| Total | 274 | 100.0% |
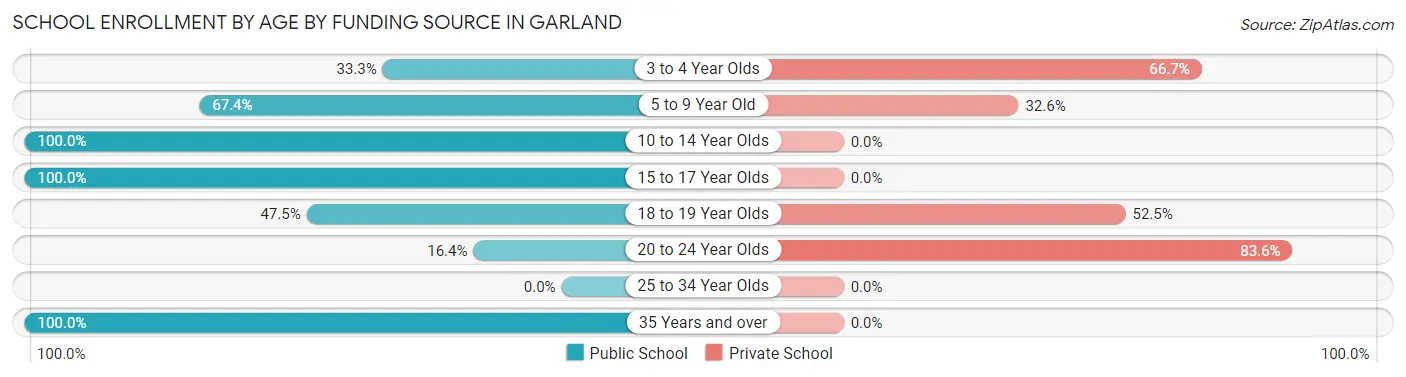
School Enrollment by Age by Funding Source in Garland
Out of a total of 274 students who are enrolled in schools in Garland, 105 (38.3%) attend a private institution, while the remaining 169 (61.7%) are enrolled in public schools. The age group of 20 to 24 year olds has the highest likelihood of being enrolled in private schools, with 56 (83.6% in the age bracket) enrolled. Conversely, the age group of 10 to 14 year olds has the lowest likelihood of being enrolled in a private school, with 55 (100.0% in the age bracket) attending a public institution.
| Age Bracket | Public School | Private School |
| 3 to 4 Year Olds | 7 (33.3%) | 14 (66.7%) |
| 5 to 9 Year Old | 29 (67.4%) | 14 (32.6%) |
| 10 to 14 Year Olds | 55 (100.0%) | 0 (0.0%) |
| 15 to 17 Year Olds | 41 (100.0%) | 0 (0.0%) |
| 18 to 19 Year Olds | 19 (47.5%) | 21 (52.5%) |
| 20 to 24 Year Olds | 11 (16.4%) | 56 (83.6%) |
| 25 to 34 Year Olds | 0 (0.0%) | 0 (0.0%) |
| 35 Years and over | 7 (100.0%) | 0 (0.0%) |
| Total | 169 (61.7%) | 105 (38.3%) |
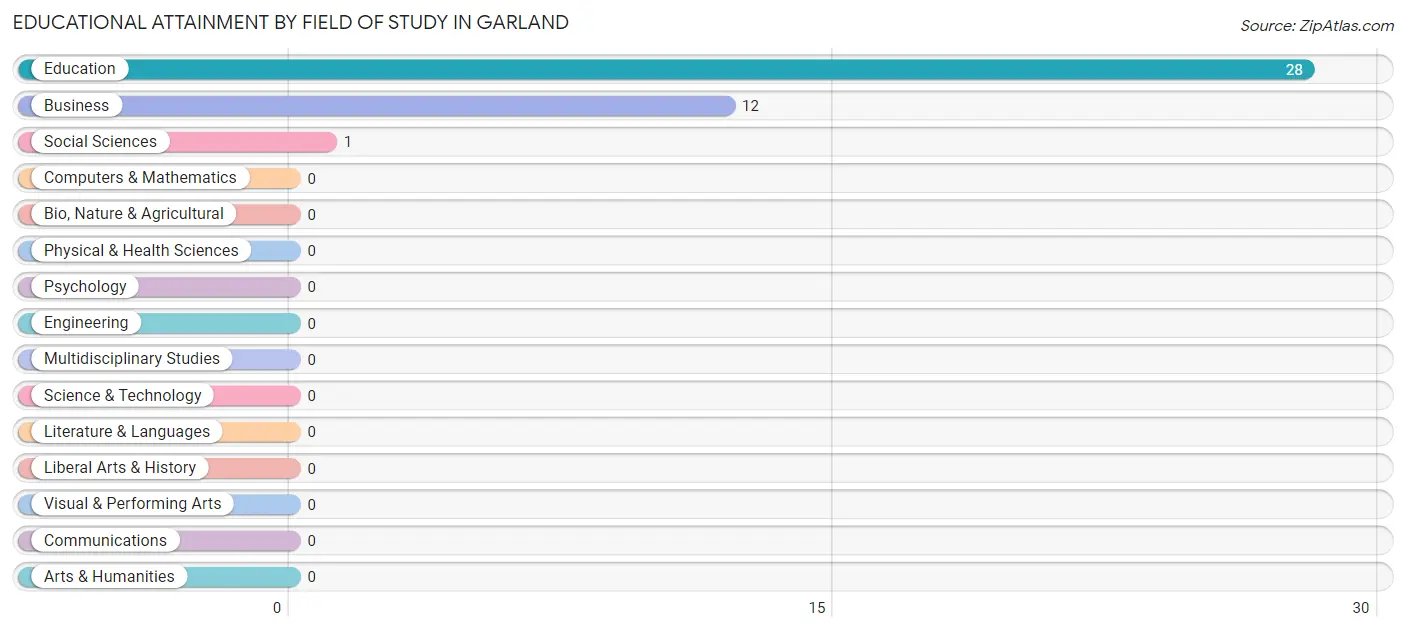
Educational Attainment by Field of Study in Garland
Education (28 | 68.3%), business (12 | 29.3%), and social sciences (1 | 2.4%) are the most common fields of study among 41 individuals in Garland who have obtained a bachelor's degree or higher.
| Field of Study | # Graduates | % Graduates |
| Computers & Mathematics | 0 | 0.0% |
| Bio, Nature & Agricultural | 0 | 0.0% |
| Physical & Health Sciences | 0 | 0.0% |
| Psychology | 0 | 0.0% |
| Social Sciences | 1 | 2.4% |
| Engineering | 0 | 0.0% |
| Multidisciplinary Studies | 0 | 0.0% |
| Science & Technology | 0 | 0.0% |
| Business | 12 | 29.3% |
| Education | 28 | 68.3% |
| Literature & Languages | 0 | 0.0% |
| Liberal Arts & History | 0 | 0.0% |
| Visual & Performing Arts | 0 | 0.0% |
| Communications | 0 | 0.0% |
| Arts & Humanities | 0 | 0.0% |
| Total | 41 | 100.0% |
Transportation & Commute in Garland
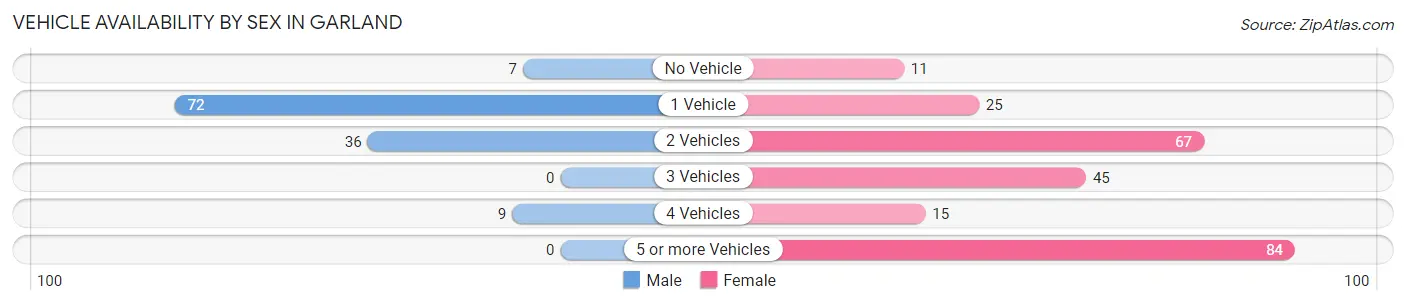
Vehicle Availability by Sex in Garland
The most prevalent vehicle ownership categories in Garland are males with 1 vehicle (72, accounting for 58.1%) and females with 1 vehicle (25, making up 29.1%).
| Vehicles Available | Male | Female |
| No Vehicle | 7 (5.7%) | 11 (4.4%) |
| 1 Vehicle | 72 (58.1%) | 25 (10.1%) |
| 2 Vehicles | 36 (29.0%) | 67 (27.1%) |
| 3 Vehicles | 0 (0.0%) | 45 (18.2%) |
| 4 Vehicles | 9 (7.3%) | 15 (6.1%) |
| 5 or more Vehicles | 0 (0.0%) | 84 (34.0%) |
| Total | 124 (100.0%) | 247 (100.0%) |
Commute Time in Garland
The most frequently occuring commute durations in Garland are 30 to 34 minutes (162 commuters, 45.1%), 40 to 44 minutes (56 commuters, 15.6%), and 5 to 9 minutes (37 commuters, 10.3%).
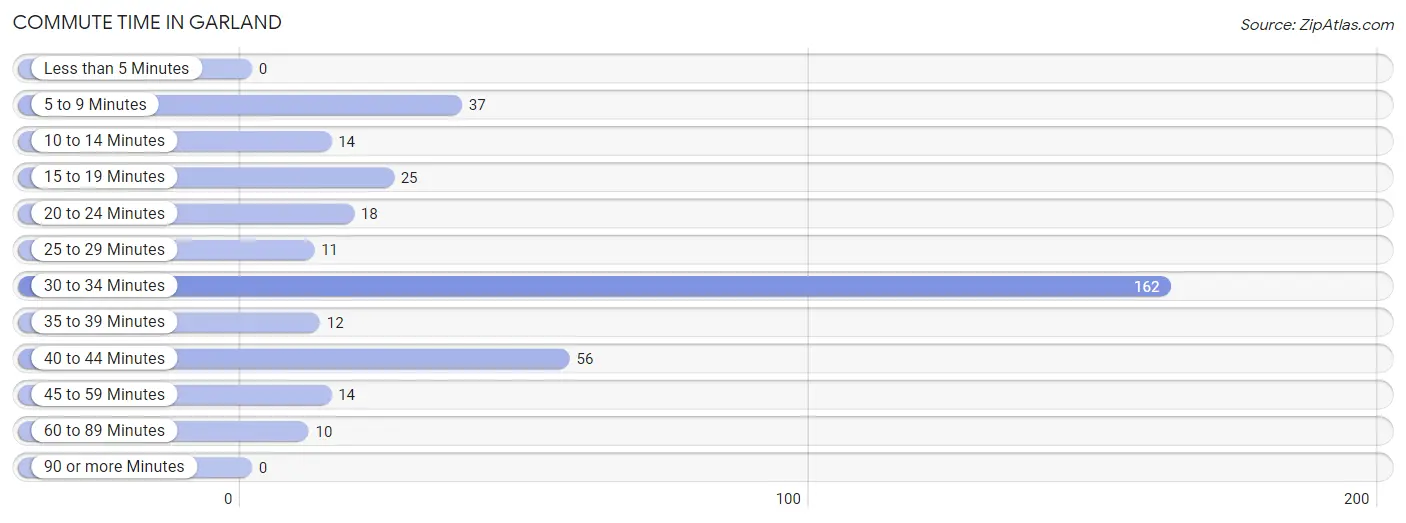
| Commute Time | # Commuters | % Commuters |
| Less than 5 Minutes | 0 | 0.0% |
| 5 to 9 Minutes | 37 | 10.3% |
| 10 to 14 Minutes | 14 | 3.9% |
| 15 to 19 Minutes | 25 | 7.0% |
| 20 to 24 Minutes | 18 | 5.0% |
| 25 to 29 Minutes | 11 | 3.1% |
| 30 to 34 Minutes | 162 | 45.1% |
| 35 to 39 Minutes | 12 | 3.3% |
| 40 to 44 Minutes | 56 | 15.6% |
| 45 to 59 Minutes | 14 | 3.9% |
| 60 to 89 Minutes | 10 | 2.8% |
| 90 or more Minutes | 0 | 0.0% |
Commute Time by Sex in Garland
The most common commute times in Garland are 40 to 44 minutes (36 commuters, 32.1%) for males and 30 to 34 minutes (146 commuters, 59.1%) for females.
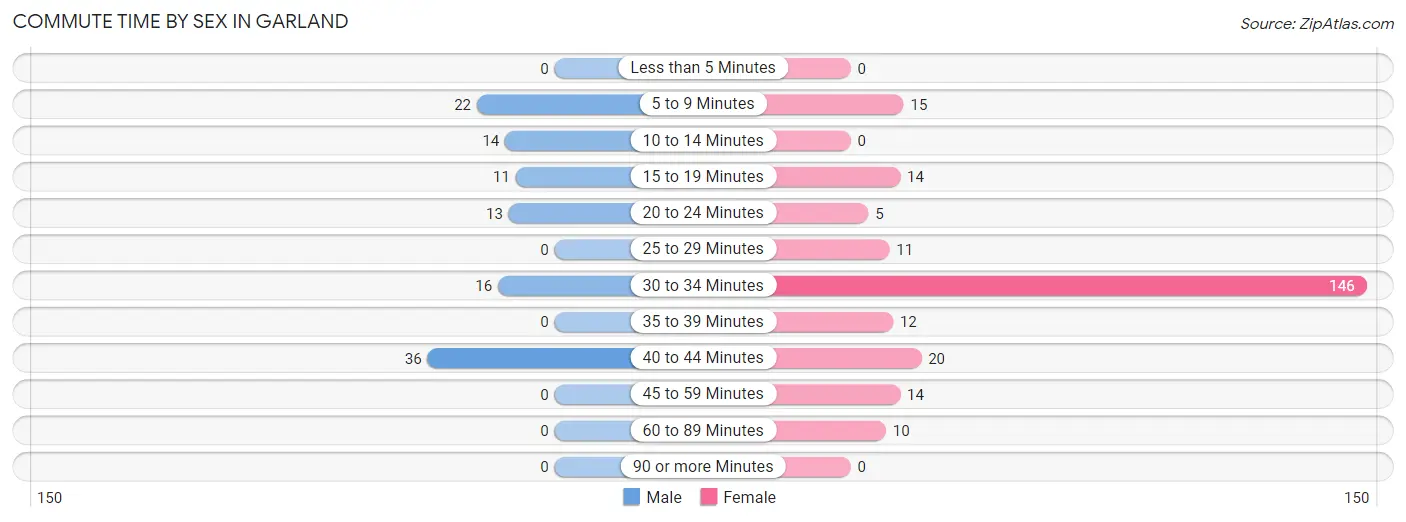
| Commute Time | Male | Female |
| Less than 5 Minutes | 0 (0.0%) | 0 (0.0%) |
| 5 to 9 Minutes | 22 (19.6%) | 15 (6.1%) |
| 10 to 14 Minutes | 14 (12.5%) | 0 (0.0%) |
| 15 to 19 Minutes | 11 (9.8%) | 14 (5.7%) |
| 20 to 24 Minutes | 13 (11.6%) | 5 (2.0%) |
| 25 to 29 Minutes | 0 (0.0%) | 11 (4.4%) |
| 30 to 34 Minutes | 16 (14.3%) | 146 (59.1%) |
| 35 to 39 Minutes | 0 (0.0%) | 12 (4.9%) |
| 40 to 44 Minutes | 36 (32.1%) | 20 (8.1%) |
| 45 to 59 Minutes | 0 (0.0%) | 14 (5.7%) |
| 60 to 89 Minutes | 0 (0.0%) | 10 (4.1%) |
| 90 or more Minutes | 0 (0.0%) | 0 (0.0%) |
Time of Departure to Work by Sex in Garland
The most frequent times of departure to work in Garland are 6:30 AM to 6:59 AM (41, 36.6%) for males and 7:00 AM to 7:29 AM (81, 32.8%) for females.
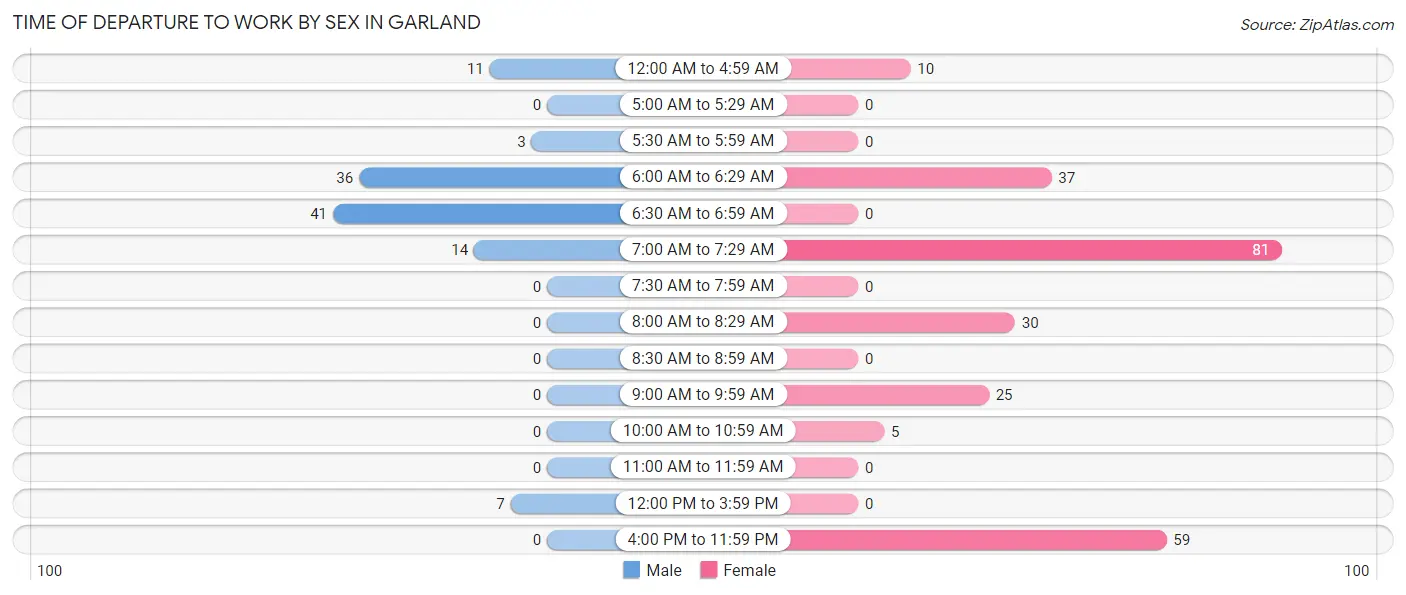
| Time of Departure | Male | Female |
| 12:00 AM to 4:59 AM | 11 (9.8%) | 10 (4.1%) |
| 5:00 AM to 5:29 AM | 0 (0.0%) | 0 (0.0%) |
| 5:30 AM to 5:59 AM | 3 (2.7%) | 0 (0.0%) |
| 6:00 AM to 6:29 AM | 36 (32.1%) | 37 (15.0%) |
| 6:30 AM to 6:59 AM | 41 (36.6%) | 0 (0.0%) |
| 7:00 AM to 7:29 AM | 14 (12.5%) | 81 (32.8%) |
| 7:30 AM to 7:59 AM | 0 (0.0%) | 0 (0.0%) |
| 8:00 AM to 8:29 AM | 0 (0.0%) | 30 (12.1%) |
| 8:30 AM to 8:59 AM | 0 (0.0%) | 0 (0.0%) |
| 9:00 AM to 9:59 AM | 0 (0.0%) | 25 (10.1%) |
| 10:00 AM to 10:59 AM | 0 (0.0%) | 5 (2.0%) |
| 11:00 AM to 11:59 AM | 0 (0.0%) | 0 (0.0%) |
| 12:00 PM to 3:59 PM | 7 (6.2%) | 0 (0.0%) |
| 4:00 PM to 11:59 PM | 0 (0.0%) | 59 (23.9%) |
| Total | 112 (100.0%) | 247 (100.0%) |
Housing Occupancy in Garland
Occupancy by Ownership in Garland
Of the total 308 dwellings in Garland, owner-occupied units account for 194 (63.0%), while renter-occupied units make up 114 (37.0%).
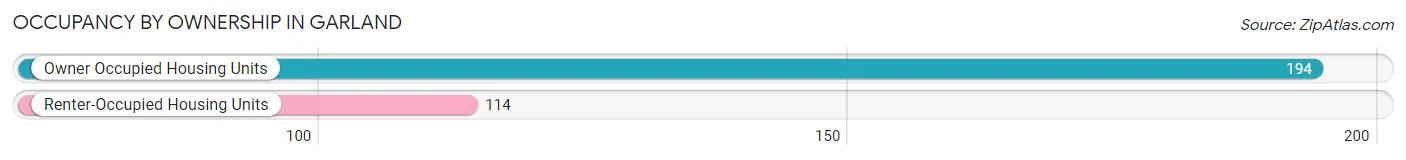
| Occupancy | # Housing Units | % Housing Units |
| Owner Occupied Housing Units | 194 | 63.0% |
| Renter-Occupied Housing Units | 114 | 37.0% |
| Total Occupied Housing Units | 308 | 100.0% |
Occupancy by Household Size in Garland
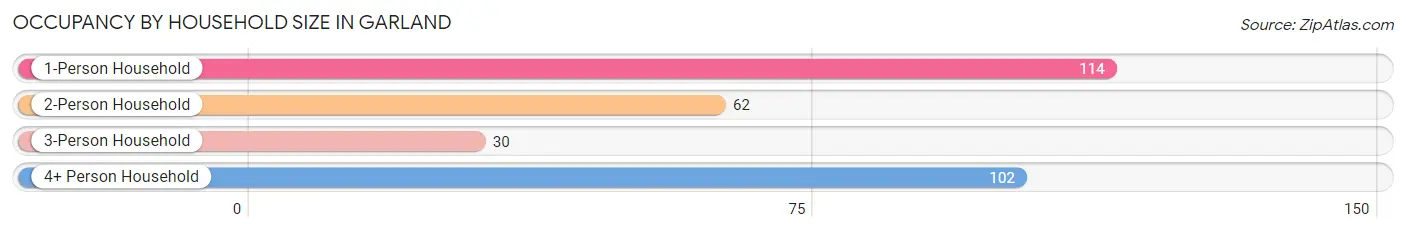
| Household Size | # Housing Units | % Housing Units |
| 1-Person Household | 114 | 37.0% |
| 2-Person Household | 62 | 20.1% |
| 3-Person Household | 30 | 9.7% |
| 4+ Person Household | 102 | 33.1% |
| Total Housing Units | 308 | 100.0% |
Occupancy by Ownership by Household Size in Garland
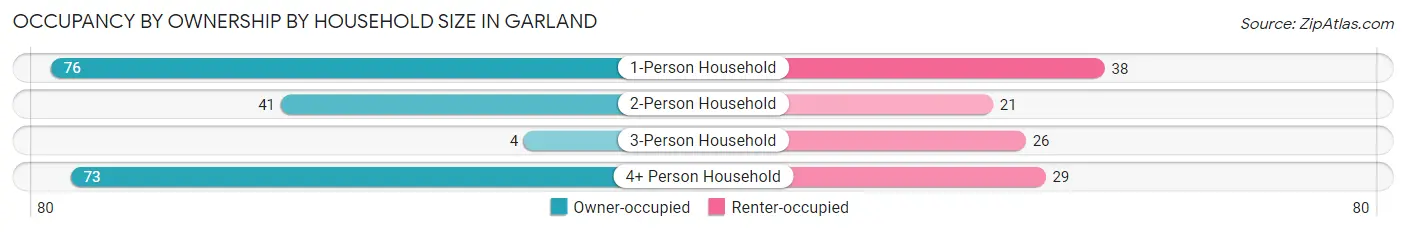
| Household Size | Owner-occupied | Renter-occupied |
| 1-Person Household | 76 (66.7%) | 38 (33.3%) |
| 2-Person Household | 41 (66.1%) | 21 (33.9%) |
| 3-Person Household | 4 (13.3%) | 26 (86.7%) |
| 4+ Person Household | 73 (71.6%) | 29 (28.4%) |
| Total Housing Units | 194 (63.0%) | 114 (37.0%) |
Occupancy by Educational Attainment in Garland
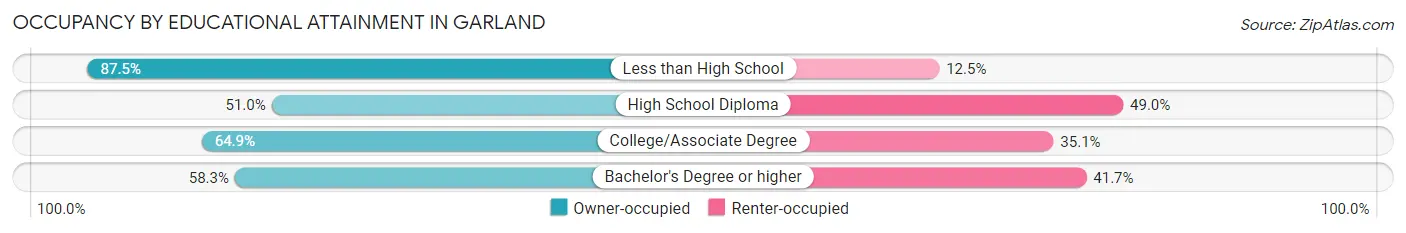
| Household Size | Owner-occupied | Renter-occupied |
| Less than High School | 35 (87.5%) | 5 (12.5%) |
| High School Diploma | 49 (51.0%) | 47 (49.0%) |
| College/Associate Degree | 96 (64.9%) | 52 (35.1%) |
| Bachelor's Degree or higher | 14 (58.3%) | 10 (41.7%) |
Occupancy by Age of Householder in Garland
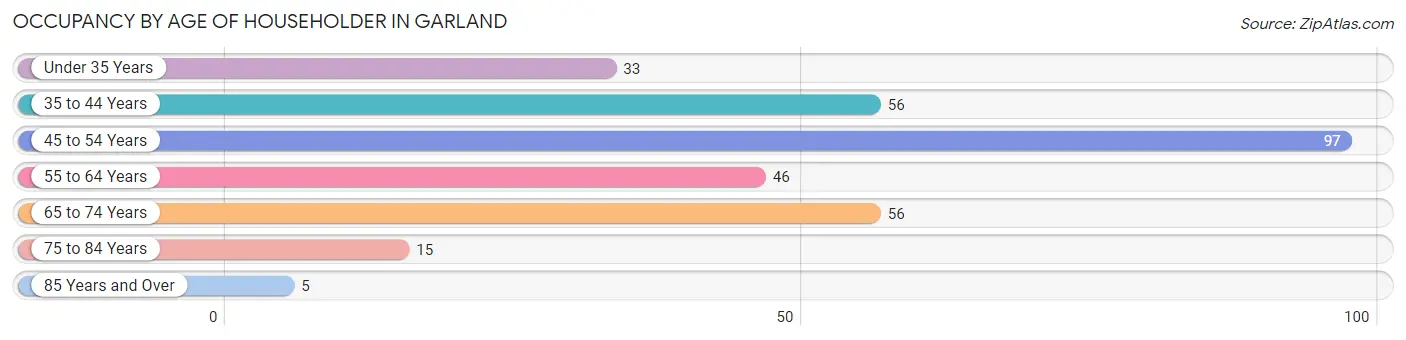
| Age Bracket | # Households | % Households |
| Under 35 Years | 33 | 10.7% |
| 35 to 44 Years | 56 | 18.2% |
| 45 to 54 Years | 97 | 31.5% |
| 55 to 64 Years | 46 | 14.9% |
| 65 to 74 Years | 56 | 18.2% |
| 75 to 84 Years | 15 | 4.9% |
| 85 Years and Over | 5 | 1.6% |
| Total | 308 | 100.0% |
Housing Finances in Garland
Median Income by Occupancy in Garland
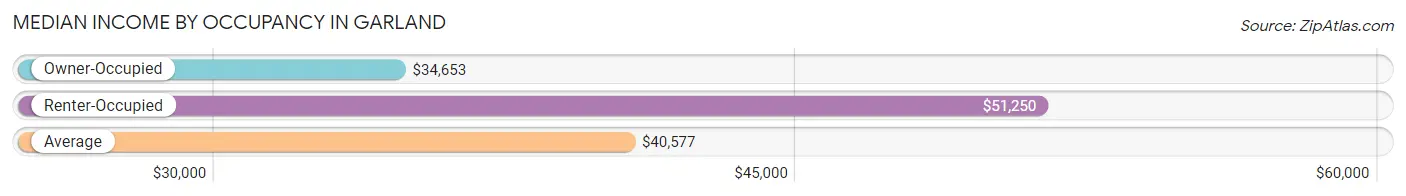
| Occupancy Type | # Households | Median Income |
| Owner-Occupied | 194 (63.0%) | $34,653 |
| Renter-Occupied | 114 (37.0%) | $51,250 |
| Average | 308 (100.0%) | $40,577 |
Occupancy by Householder Income Bracket in Garland
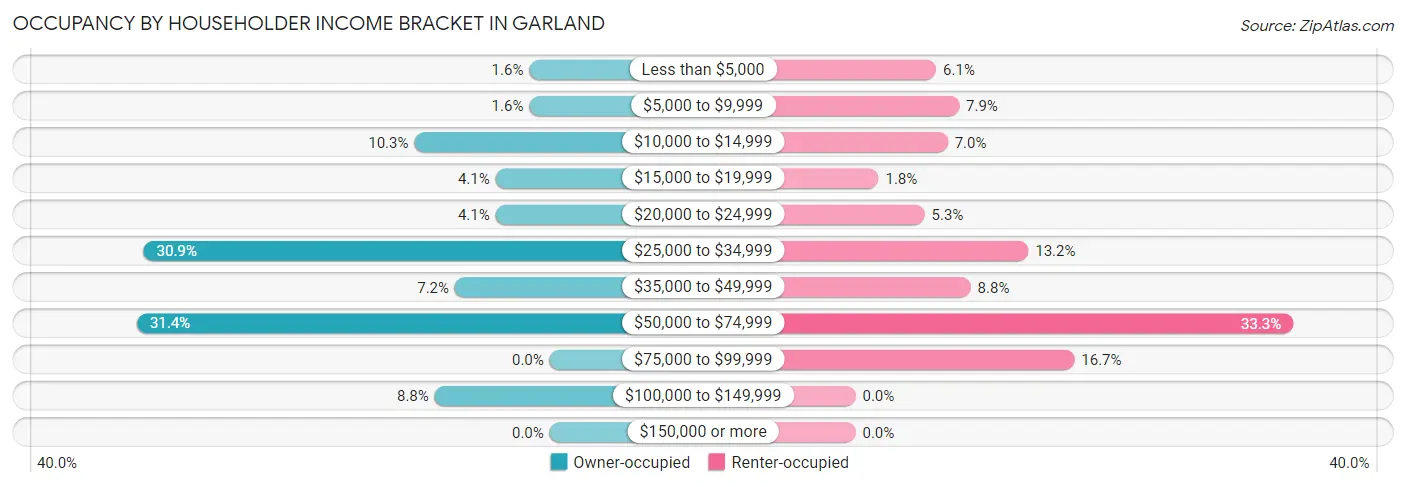
| Income Bracket | Owner-occupied | Renter-occupied |
| Less than $5,000 | 3 (1.5%) | 7 (6.1%) |
| $5,000 to $9,999 | 3 (1.5%) | 9 (7.9%) |
| $10,000 to $14,999 | 20 (10.3%) | 8 (7.0%) |
| $15,000 to $19,999 | 8 (4.1%) | 2 (1.8%) |
| $20,000 to $24,999 | 8 (4.1%) | 6 (5.3%) |
| $25,000 to $34,999 | 60 (30.9%) | 15 (13.2%) |
| $35,000 to $49,999 | 14 (7.2%) | 10 (8.8%) |
| $50,000 to $74,999 | 61 (31.4%) | 38 (33.3%) |
| $75,000 to $99,999 | 0 (0.0%) | 19 (16.7%) |
| $100,000 to $149,999 | 17 (8.8%) | 0 (0.0%) |
| $150,000 or more | 0 (0.0%) | 0 (0.0%) |
| Total | 194 (100.0%) | 114 (100.0%) |
Monthly Housing Cost Tiers in Garland
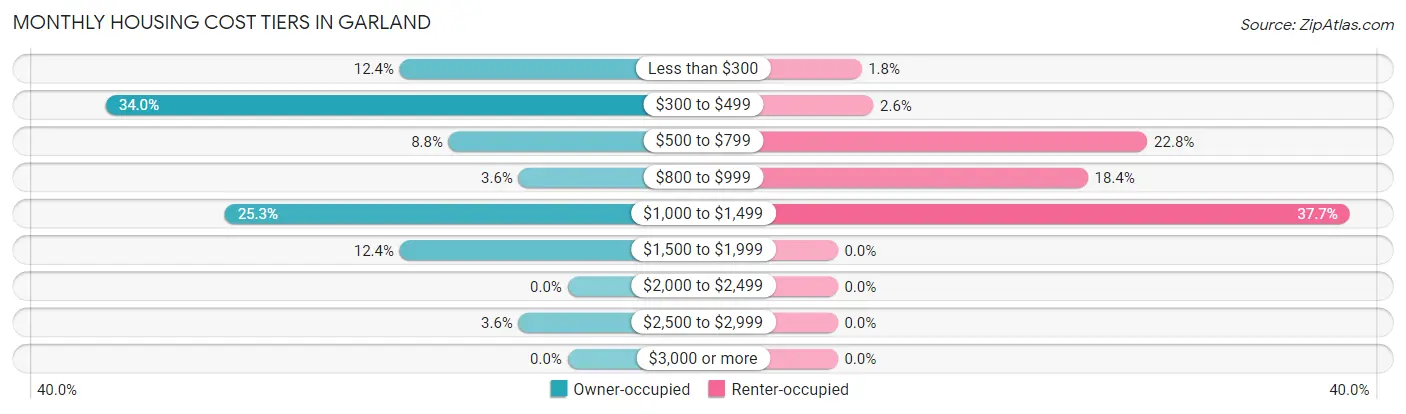
| Monthly Cost | Owner-occupied | Renter-occupied |
| Less than $300 | 24 (12.4%) | 2 (1.8%) |
| $300 to $499 | 66 (34.0%) | 3 (2.6%) |
| $500 to $799 | 17 (8.8%) | 26 (22.8%) |
| $800 to $999 | 7 (3.6%) | 21 (18.4%) |
| $1,000 to $1,499 | 49 (25.3%) | 43 (37.7%) |
| $1,500 to $1,999 | 24 (12.4%) | 0 (0.0%) |
| $2,000 to $2,499 | 0 (0.0%) | 0 (0.0%) |
| $2,500 to $2,999 | 7 (3.6%) | 0 (0.0%) |
| $3,000 or more | 0 (0.0%) | 0 (0.0%) |
| Total | 194 (100.0%) | 114 (100.0%) |
Physical Housing Characteristics in Garland
Housing Structures in Garland
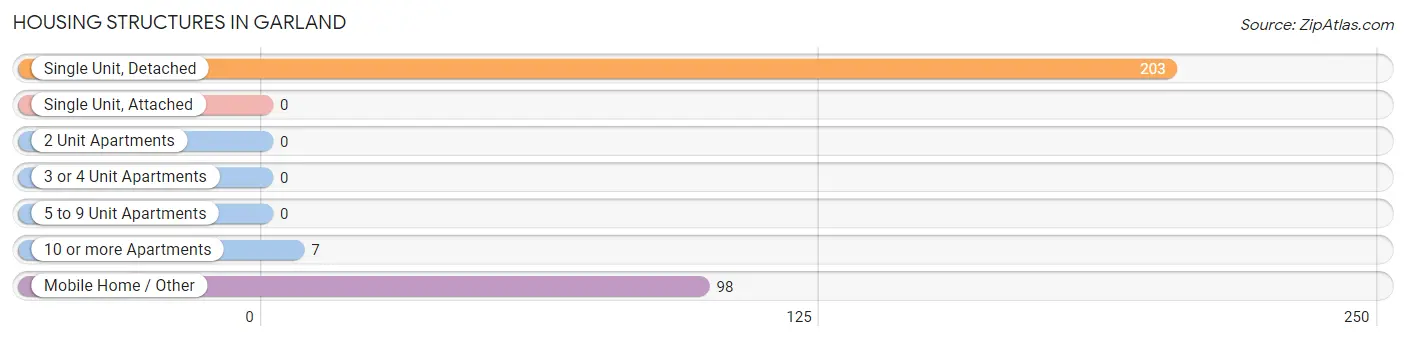
| Structure Type | # Housing Units | % Housing Units |
| Single Unit, Detached | 203 | 65.9% |
| Single Unit, Attached | 0 | 0.0% |
| 2 Unit Apartments | 0 | 0.0% |
| 3 or 4 Unit Apartments | 0 | 0.0% |
| 5 to 9 Unit Apartments | 0 | 0.0% |
| 10 or more Apartments | 7 | 2.3% |
| Mobile Home / Other | 98 | 31.8% |
| Total | 308 | 100.0% |
Housing Structures by Occupancy in Garland
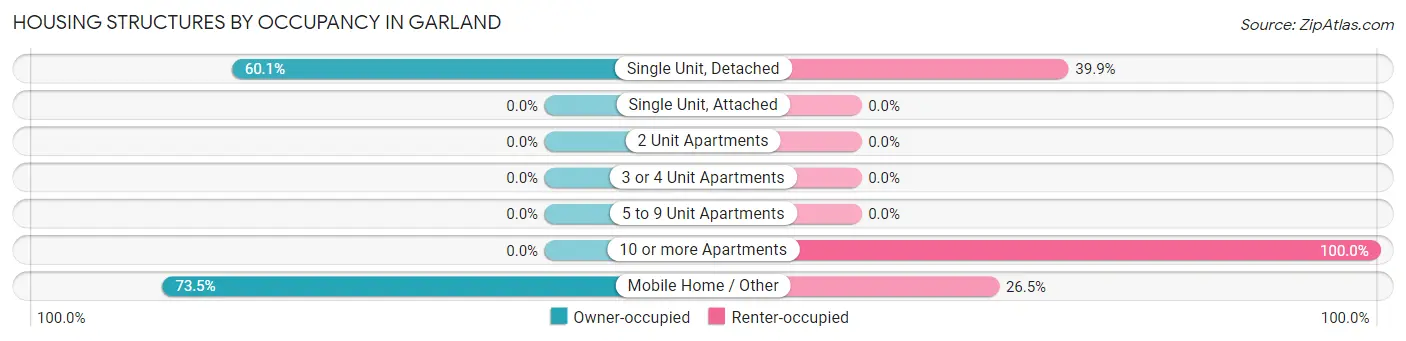
| Structure Type | Owner-occupied | Renter-occupied |
| Single Unit, Detached | 122 (60.1%) | 81 (39.9%) |
| Single Unit, Attached | 0 (0.0%) | 0 (0.0%) |
| 2 Unit Apartments | 0 (0.0%) | 0 (0.0%) |
| 3 or 4 Unit Apartments | 0 (0.0%) | 0 (0.0%) |
| 5 to 9 Unit Apartments | 0 (0.0%) | 0 (0.0%) |
| 10 or more Apartments | 0 (0.0%) | 7 (100.0%) |
| Mobile Home / Other | 72 (73.5%) | 26 (26.5%) |
| Total | 194 (63.0%) | 114 (37.0%) |
Housing Structures by Number of Rooms in Garland
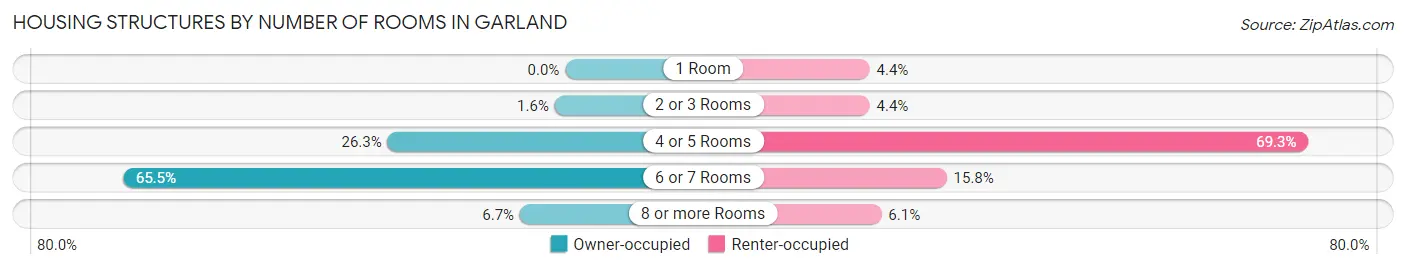
| Number of Rooms | Owner-occupied | Renter-occupied |
| 1 Room | 0 (0.0%) | 5 (4.4%) |
| 2 or 3 Rooms | 3 (1.5%) | 5 (4.4%) |
| 4 or 5 Rooms | 51 (26.3%) | 79 (69.3%) |
| 6 or 7 Rooms | 127 (65.5%) | 18 (15.8%) |
| 8 or more Rooms | 13 (6.7%) | 7 (6.1%) |
| Total | 194 (100.0%) | 114 (100.0%) |
Housing Structure by Heating Type in Garland
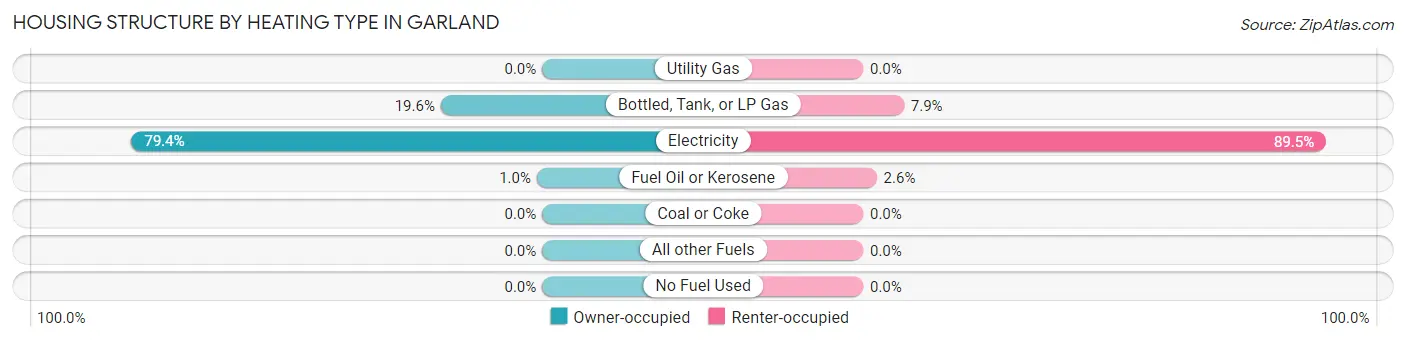
| Heating Type | Owner-occupied | Renter-occupied |
| Utility Gas | 0 (0.0%) | 0 (0.0%) |
| Bottled, Tank, or LP Gas | 38 (19.6%) | 9 (7.9%) |
| Electricity | 154 (79.4%) | 102 (89.5%) |
| Fuel Oil or Kerosene | 2 (1.0%) | 3 (2.6%) |
| Coal or Coke | 0 (0.0%) | 0 (0.0%) |
| All other Fuels | 0 (0.0%) | 0 (0.0%) |
| No Fuel Used | 0 (0.0%) | 0 (0.0%) |
| Total | 194 (100.0%) | 114 (100.0%) |
Household Vehicle Usage in Garland
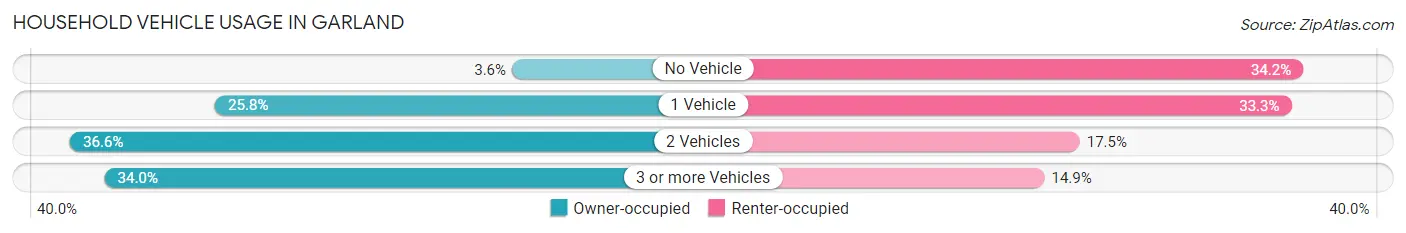
| Vehicles per Household | Owner-occupied | Renter-occupied |
| No Vehicle | 7 (3.6%) | 39 (34.2%) |
| 1 Vehicle | 50 (25.8%) | 38 (33.3%) |
| 2 Vehicles | 71 (36.6%) | 20 (17.5%) |
| 3 or more Vehicles | 66 (34.0%) | 17 (14.9%) |
| Total | 194 (100.0%) | 114 (100.0%) |
Real Estate & Mortgages in Garland
Real Estate and Mortgage Overview in Garland
| Characteristic | Without Mortgage | With Mortgage |
| Housing Units | 119 | 75 |
| Median Property Value | $102,900 | $110,200 |
| Median Household Income | $55,156 | $0 |
| Monthly Housing Costs | $448 | $0 |
| Real Estate Taxes | $720 | $0 |
Property Value by Mortgage Status in Garland
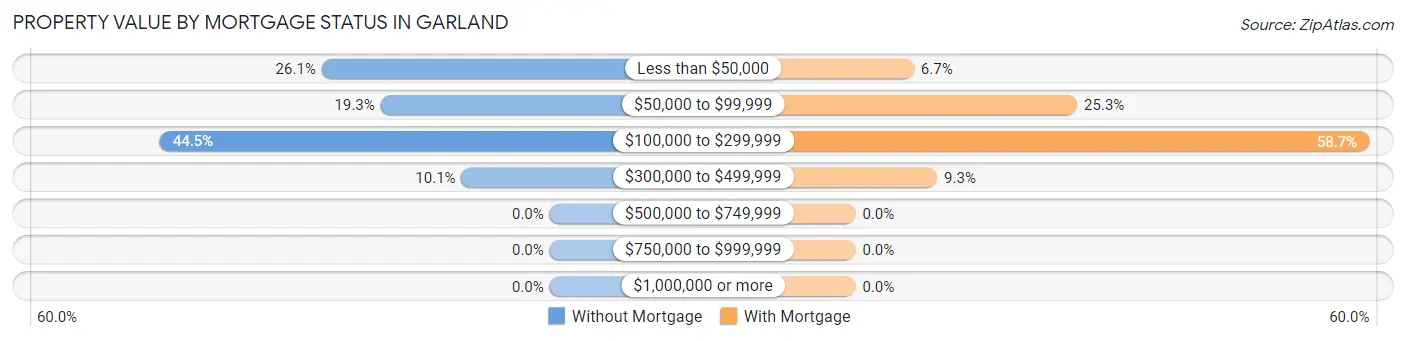
| Property Value | Without Mortgage | With Mortgage |
| Less than $50,000 | 31 (26.1%) | 5 (6.7%) |
| $50,000 to $99,999 | 23 (19.3%) | 19 (25.3%) |
| $100,000 to $299,999 | 53 (44.5%) | 44 (58.7%) |
| $300,000 to $499,999 | 12 (10.1%) | 7 (9.3%) |
| $500,000 to $749,999 | 0 (0.0%) | 0 (0.0%) |
| $750,000 to $999,999 | 0 (0.0%) | 0 (0.0%) |
| $1,000,000 or more | 0 (0.0%) | 0 (0.0%) |
| Total | 119 (100.0%) | 75 (100.0%) |
Household Income by Mortgage Status in Garland
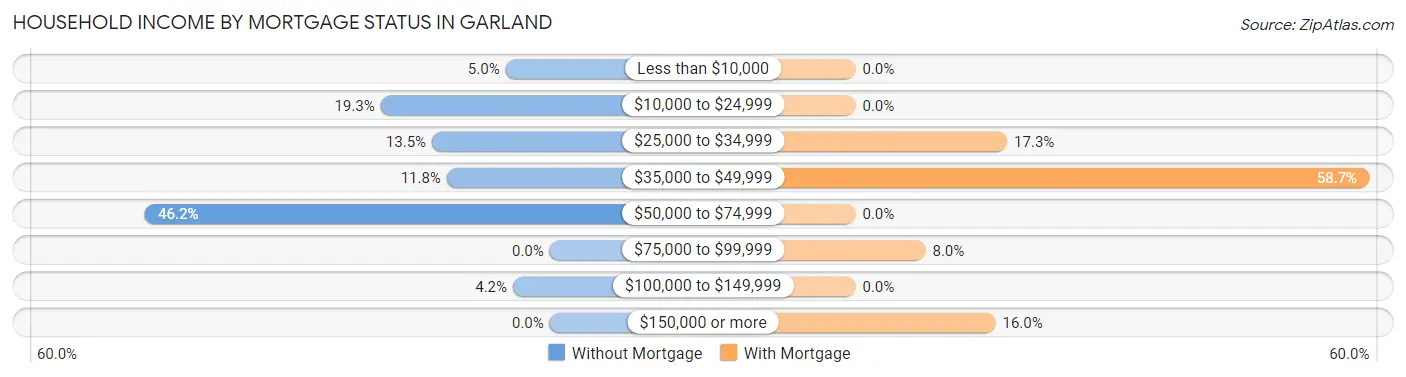
| Household Income | Without Mortgage | With Mortgage |
| Less than $10,000 | 6 (5.0%) | 0 (0.0%) |
| $10,000 to $24,999 | 23 (19.3%) | 0 (0.0%) |
| $25,000 to $34,999 | 16 (13.5%) | 13 (17.3%) |
| $35,000 to $49,999 | 14 (11.8%) | 44 (58.7%) |
| $50,000 to $74,999 | 55 (46.2%) | 0 (0.0%) |
| $75,000 to $99,999 | 0 (0.0%) | 6 (8.0%) |
| $100,000 to $149,999 | 5 (4.2%) | 0 (0.0%) |
| $150,000 or more | 0 (0.0%) | 12 (16.0%) |
| Total | 119 (100.0%) | 75 (100.0%) |
Property Value to Household Income Ratio in Garland
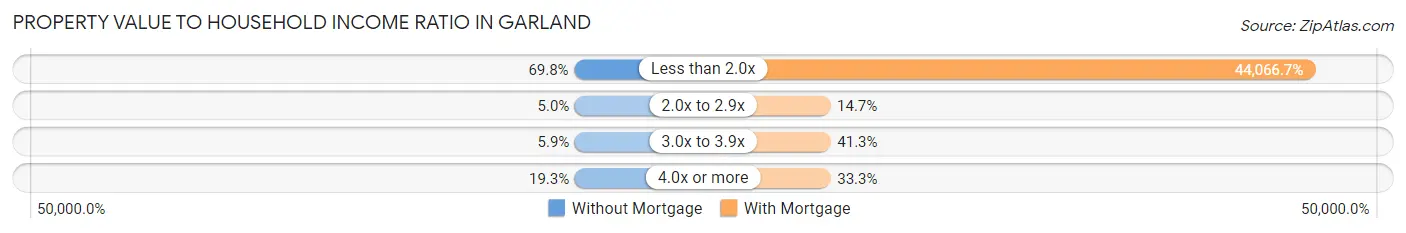
| Value-to-Income Ratio | Without Mortgage | With Mortgage |
| Less than 2.0x | 83 (69.8%) | 33,050 (44,066.7%) |
| 2.0x to 2.9x | 6 (5.0%) | 11 (14.7%) |
| 3.0x to 3.9x | 7 (5.9%) | 31 (41.3%) |
| 4.0x or more | 23 (19.3%) | 25 (33.3%) |
| Total | 119 (100.0%) | 75 (100.0%) |
Real Estate Taxes by Mortgage Status in Garland
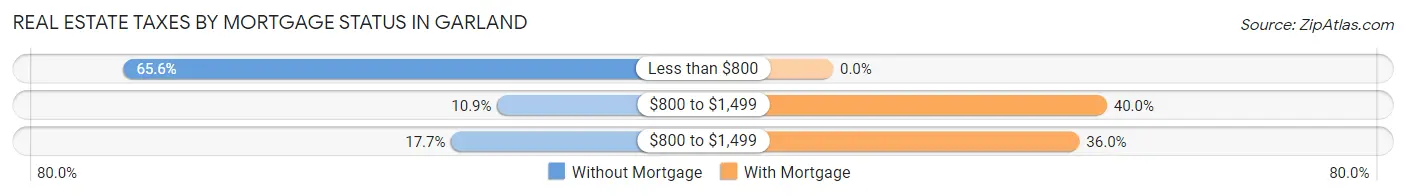
| Property Taxes | Without Mortgage | With Mortgage |
| Less than $800 | 78 (65.5%) | 0 (0.0%) |
| $800 to $1,499 | 13 (10.9%) | 30 (40.0%) |
| $800 to $1,499 | 21 (17.6%) | 27 (36.0%) |
| Total | 119 (100.0%) | 75 (100.0%) |
Health & Disability in Garland
Health Insurance Coverage by Age in Garland
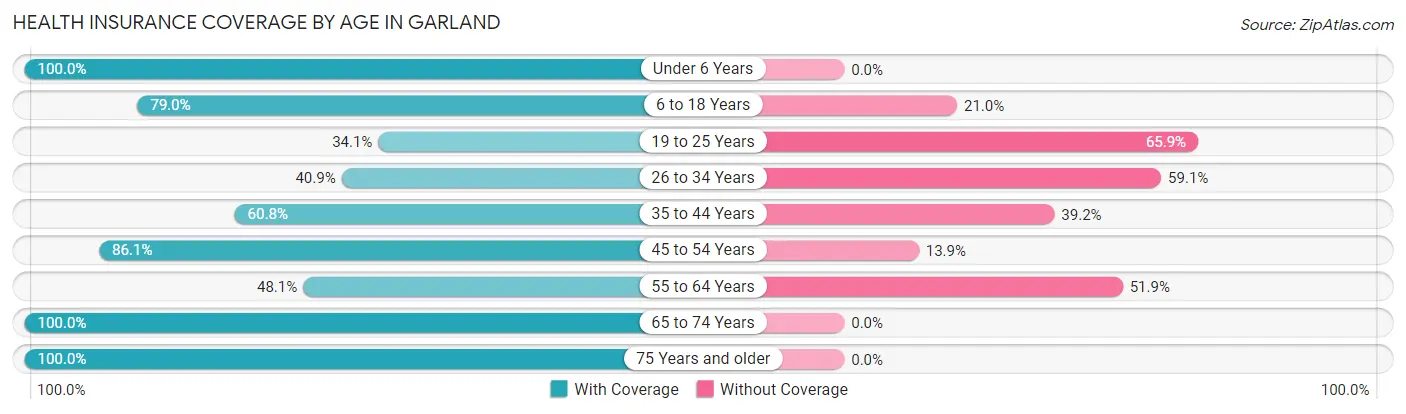
| Age Bracket | With Coverage | Without Coverage |
| Under 6 Years | 156 (100.0%) | 0 (0.0%) |
| 6 to 18 Years | 124 (79.0%) | 33 (21.0%) |
| 19 to 25 Years | 78 (34.1%) | 151 (65.9%) |
| 26 to 34 Years | 36 (40.9%) | 52 (59.1%) |
| 35 to 44 Years | 59 (60.8%) | 38 (39.2%) |
| 45 to 54 Years | 93 (86.1%) | 15 (13.9%) |
| 55 to 64 Years | 25 (48.1%) | 27 (51.9%) |
| 65 to 74 Years | 84 (100.0%) | 0 (0.0%) |
| 75 Years and older | 25 (100.0%) | 0 (0.0%) |
| Total | 680 (68.3%) | 316 (31.7%) |
Health Insurance Coverage by Citizenship Status in Garland
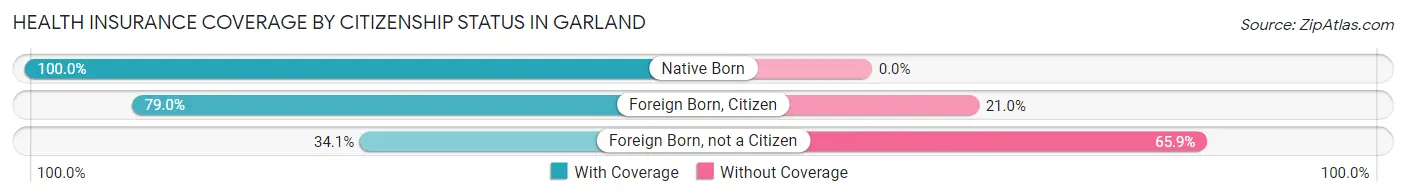
| Citizenship Status | With Coverage | Without Coverage |
| Native Born | 156 (100.0%) | 0 (0.0%) |
| Foreign Born, Citizen | 124 (79.0%) | 33 (21.0%) |
| Foreign Born, not a Citizen | 78 (34.1%) | 151 (65.9%) |
Health Insurance Coverage by Household Income in Garland
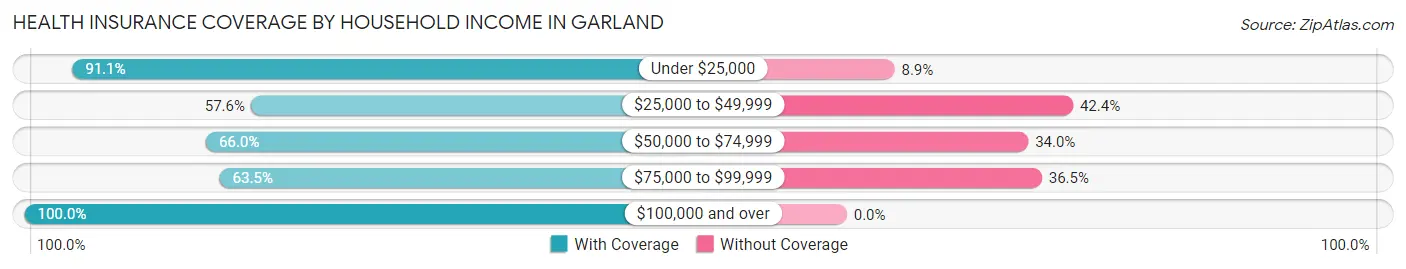
| Household Income | With Coverage | Without Coverage |
| Under $25,000 | 163 (91.1%) | 16 (8.9%) |
| $25,000 to $49,999 | 242 (57.6%) | 178 (42.4%) |
| $50,000 to $74,999 | 200 (66.0%) | 103 (34.0%) |
| $75,000 to $99,999 | 33 (63.5%) | 19 (36.5%) |
| $100,000 and over | 36 (100.0%) | 0 (0.0%) |
Public vs Private Health Insurance Coverage by Age in Garland
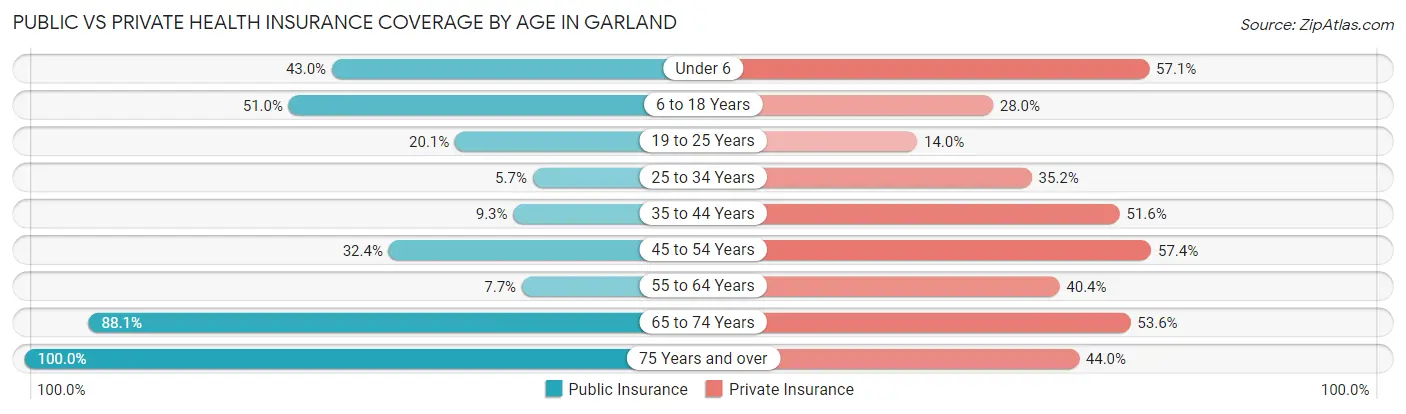
| Age Bracket | Public Insurance | Private Insurance |
| Under 6 | 67 (42.9%) | 89 (57.1%) |
| 6 to 18 Years | 80 (51.0%) | 44 (28.0%) |
| 19 to 25 Years | 46 (20.1%) | 32 (14.0%) |
| 25 to 34 Years | 5 (5.7%) | 31 (35.2%) |
| 35 to 44 Years | 9 (9.3%) | 50 (51.5%) |
| 45 to 54 Years | 35 (32.4%) | 62 (57.4%) |
| 55 to 64 Years | 4 (7.7%) | 21 (40.4%) |
| 65 to 74 Years | 74 (88.1%) | 45 (53.6%) |
| 75 Years and over | 25 (100.0%) | 11 (44.0%) |
| Total | 345 (34.6%) | 385 (38.7%) |
Disability Status by Sex by Age in Garland
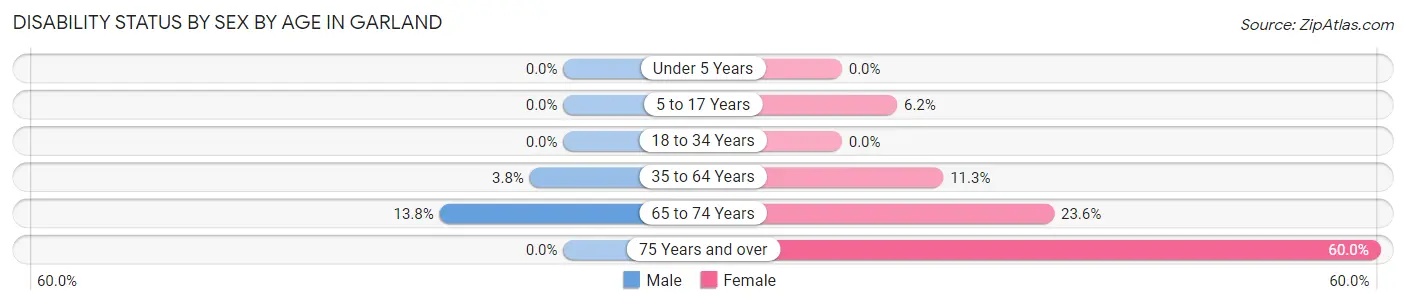
| Age Bracket | Male | Female |
| Under 5 Years | 0 (0.0%) | 0 (0.0%) |
| 5 to 17 Years | 0 (0.0%) | 4 (6.1%) |
| 18 to 34 Years | 0 (0.0%) | 0 (0.0%) |
| 35 to 64 Years | 3 (3.7%) | 20 (11.3%) |
| 65 to 74 Years | 4 (13.8%) | 13 (23.6%) |
| 75 Years and over | 0 (0.0%) | 15 (60.0%) |
Disability Class by Sex by Age in Garland
Disability Class: Hearing Difficulty
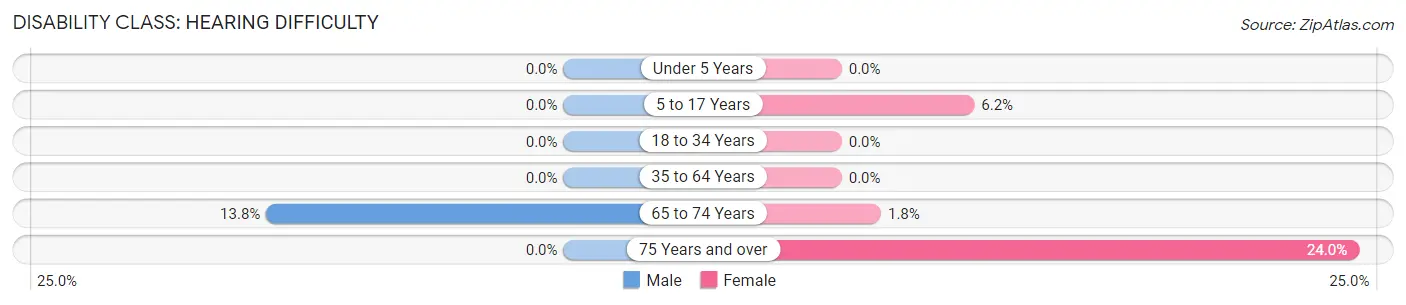
| Age Bracket | Male | Female |
| Under 5 Years | 0 (0.0%) | 0 (0.0%) |
| 5 to 17 Years | 0 (0.0%) | 4 (6.1%) |
| 18 to 34 Years | 0 (0.0%) | 0 (0.0%) |
| 35 to 64 Years | 0 (0.0%) | 0 (0.0%) |
| 65 to 74 Years | 4 (13.8%) | 1 (1.8%) |
| 75 Years and over | 0 (0.0%) | 6 (24.0%) |
Disability Class: Vision Difficulty
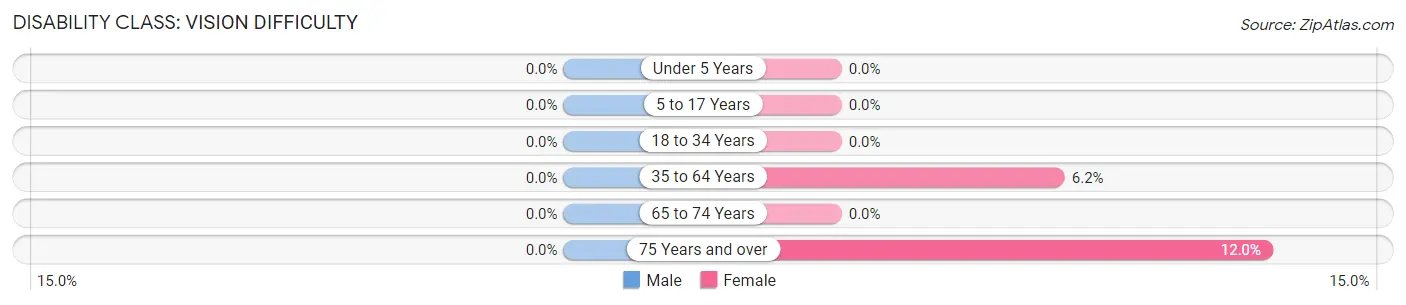
| Age Bracket | Male | Female |
| Under 5 Years | 0 (0.0%) | 0 (0.0%) |
| 5 to 17 Years | 0 (0.0%) | 0 (0.0%) |
| 18 to 34 Years | 0 (0.0%) | 0 (0.0%) |
| 35 to 64 Years | 0 (0.0%) | 11 (6.2%) |
| 65 to 74 Years | 0 (0.0%) | 0 (0.0%) |
| 75 Years and over | 0 (0.0%) | 3 (12.0%) |
Disability Class: Cognitive Difficulty
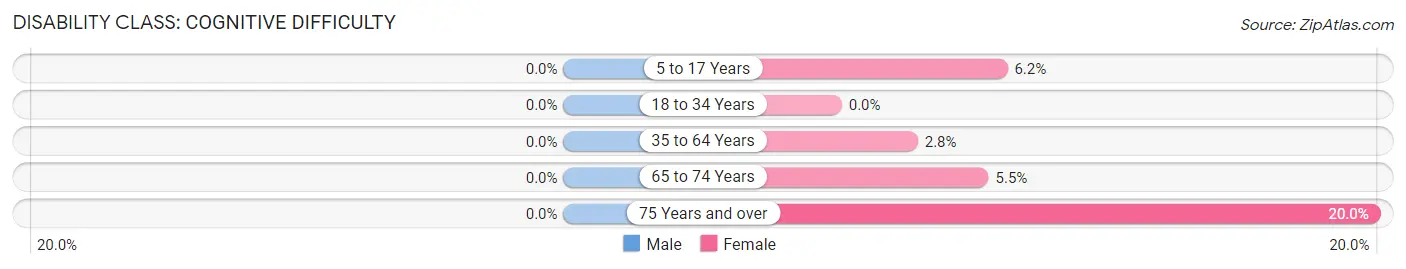
| Age Bracket | Male | Female |
| 5 to 17 Years | 0 (0.0%) | 4 (6.1%) |
| 18 to 34 Years | 0 (0.0%) | 0 (0.0%) |
| 35 to 64 Years | 0 (0.0%) | 5 (2.8%) |
| 65 to 74 Years | 0 (0.0%) | 3 (5.4%) |
| 75 Years and over | 0 (0.0%) | 5 (20.0%) |
Disability Class: Ambulatory Difficulty
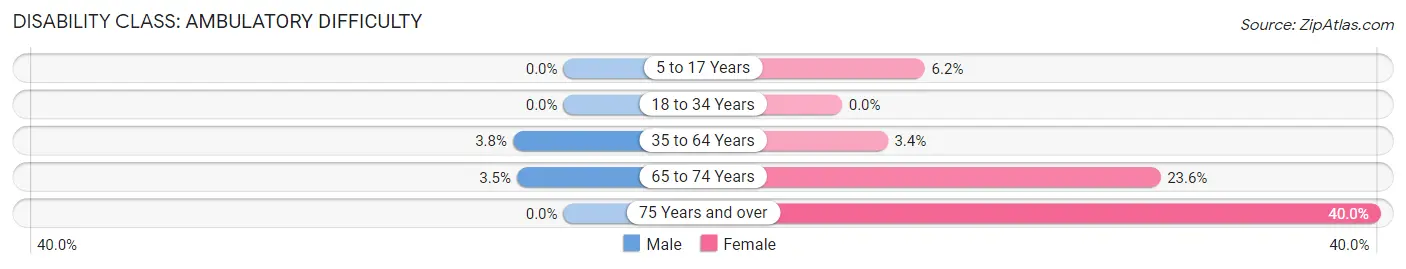
| Age Bracket | Male | Female |
| 5 to 17 Years | 0 (0.0%) | 4 (6.1%) |
| 18 to 34 Years | 0 (0.0%) | 0 (0.0%) |
| 35 to 64 Years | 3 (3.7%) | 6 (3.4%) |
| 65 to 74 Years | 1 (3.5%) | 13 (23.6%) |
| 75 Years and over | 0 (0.0%) | 10 (40.0%) |
Disability Class: Self-Care Difficulty
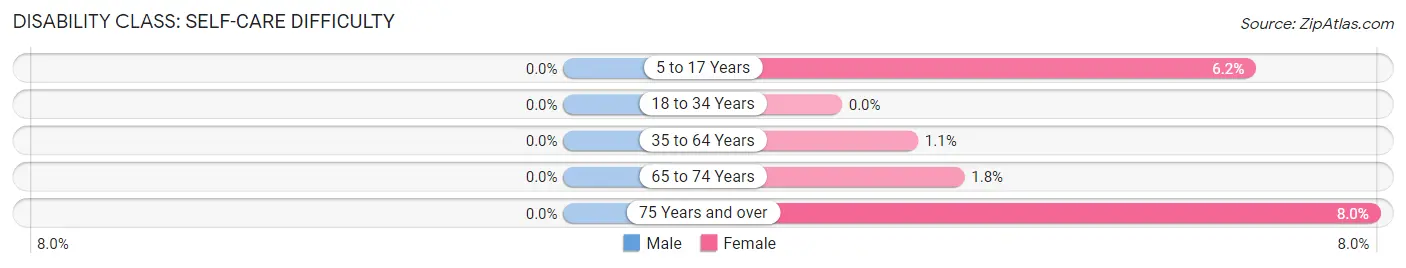
| Age Bracket | Male | Female |
| 5 to 17 Years | 0 (0.0%) | 4 (6.1%) |
| 18 to 34 Years | 0 (0.0%) | 0 (0.0%) |
| 35 to 64 Years | 0 (0.0%) | 2 (1.1%) |
| 65 to 74 Years | 0 (0.0%) | 1 (1.8%) |
| 75 Years and over | 0 (0.0%) | 2 (8.0%) |
Technology Access in Garland
Computing Device Access in Garland
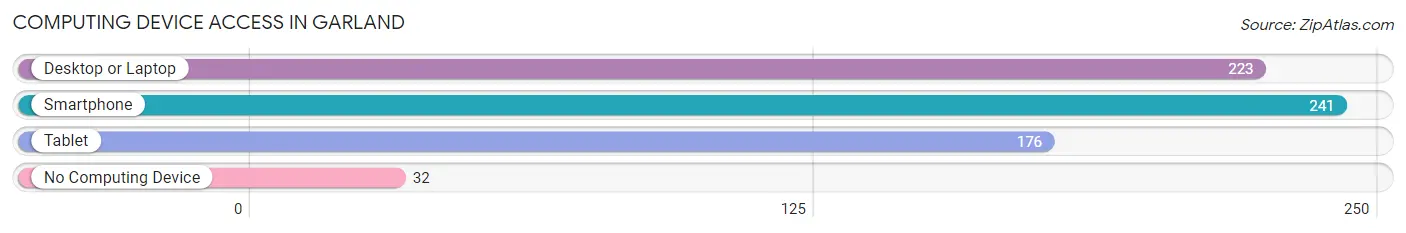
| Device Type | # Households | % Households |
| Desktop or Laptop | 223 | 72.4% |
| Smartphone | 241 | 78.2% |
| Tablet | 176 | 57.1% |
| No Computing Device | 32 | 10.4% |
| Total | 308 | 100.0% |
Internet Access in Garland
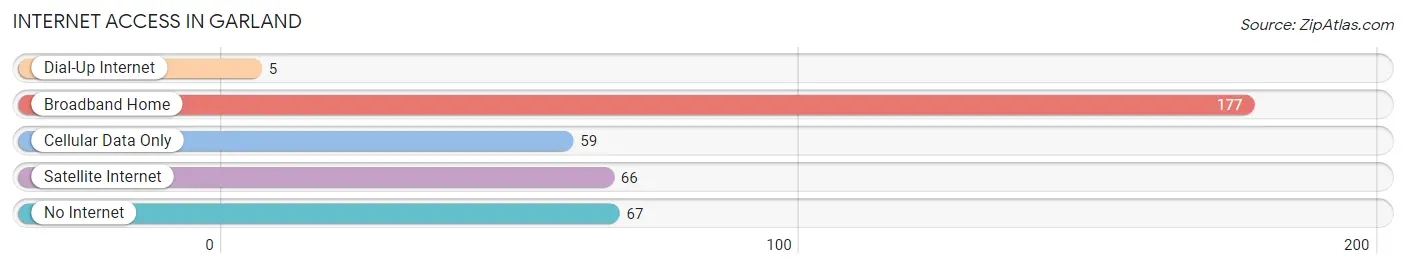
| Internet Type | # Households | % Households |
| Dial-Up Internet | 5 | 1.6% |
| Broadband Home | 177 | 57.5% |
| Cellular Data Only | 59 | 19.2% |
| Satellite Internet | 66 | 21.4% |
| No Internet | 67 | 21.7% |
| Total | 308 | 100.0% |
Garland Summary
Garland, North Carolina is a small town located in Sampson County, in the southeastern part of the state. It is situated on the banks of the Black River, and is home to a population of approximately 1,500 people. The town was founded in 1887, and has a rich history of agriculture, industry, and commerce.
Geography
Garland is located in the Coastal Plain region of North Carolina, and is situated on the banks of the Black River. The town is located approximately 30 miles south of Fayetteville, and is bordered by the towns of Clinton, Autryville, and Roseboro. The town is situated at an elevation of approximately 100 feet above sea level, and has a total area of 1.2 square miles.
Economy
Garland has a diverse economy, with a variety of industries and businesses. The town is home to several manufacturing companies, including a furniture factory, a textile mill, and a plastics plant. The town also has a number of retail stores, restaurants, and other businesses. Agriculture is also an important part of the local economy, with the town being home to several farms and nurseries.
Demographics
As of the 2010 census, the population of Garland was 1,521. The racial makeup of the town was 79.2% White, 17.3% African American, 0.7% Native American, 0.3% Asian, 0.1% Pacific Islander, and 2.4% from other races. The median household income was $30,938, and the median family income was $37,917.
History
Garland was founded in 1887, and was named after the town’s first postmaster, William Garland. The town was originally a farming community, and was home to several cotton and tobacco plantations. In the early 1900s, the town began to experience a period of growth and development, with the establishment of several businesses and industries. The town was also home to a number of churches, schools, and other institutions.
In the late 20th century, Garland experienced a period of decline, as many of the town’s businesses and industries closed. However, in recent years, the town has seen a resurgence, with the establishment of new businesses and industries, as well as the revitalization of the downtown area.
Today, Garland is a small, but vibrant town, with a strong sense of community and a rich history. The town is home to a variety of businesses and industries, as well as a number of churches, schools, and other institutions. The town is also home to a number of parks and recreational areas, making it a great place to live and visit.
Common Questions
What is Per Capita Income in Garland?
Per Capita income in Garland is $15,334.
What is the Median Family Income in Garland?
Median Family Income in Garland is $40,865.
What is the Median Household income in Garland?
Median Household Income in Garland is $40,577.
What is Income or Wage Gap in Garland?
Income or Wage Gap in Garland is 20.1%.
Women in Garland earn 79.9 cents for every dollar earned by a man.
What is Inequality or Gini Index in Garland?
Inequality or Gini Index in Garland is 0.34.
What is the Total Population of Garland?
Total Population of Garland is 996.
What is the Total Male Population of Garland?
Total Male Population of Garland is 448.
What is the Total Female Population of Garland?
Total Female Population of Garland is 548.
What is the Ratio of Males per 100 Females in Garland?
There are 81.75 Males per 100 Females in Garland.
What is the Ratio of Females per 100 Males in Garland?
There are 122.32 Females per 100 Males in Garland.
What is the Median Population Age in Garland?
Median Population Age in Garland is 24.1 Years.
What is the Average Family Size in Garland
Average Family Size in Garland is 4.4 People.
What is the Average Household Size in Garland
Average Household Size in Garland is 3.2 People.
How Large is the Labor Force in Garland?
There are 397 People in the Labor Forcein in Garland.
What is the Percentage of People in the Labor Force in Garland?
52.9% of People are in the Labor Force in Garland.
What is the Unemployment Rate in Garland?
Unemployment Rate in Garland is 6.5%.