Taylorsville, NC Map & Demographics
Taylorsville Map
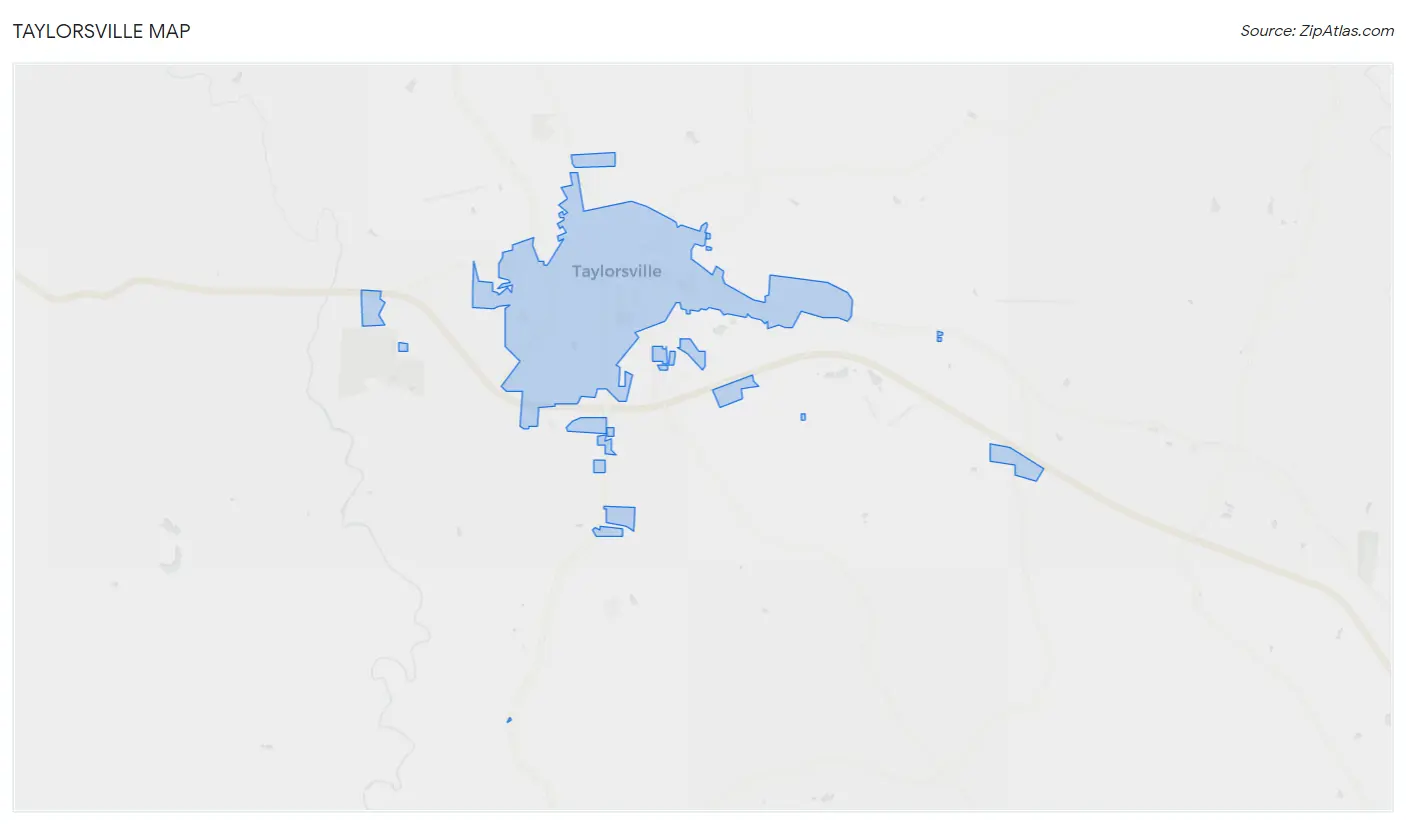
Taylorsville Overview
$24,280
PER CAPITA INCOME
$65,147
AVG FAMILY INCOME
$43,681
AVG HOUSEHOLD INCOME
22.2%
WAGE / INCOME GAP [ % ]
77.8¢/ $1
WAGE / INCOME GAP [ $ ]
0.51
INEQUALITY / GINI INDEX
2,198
TOTAL POPULATION
924
MALE POPULATION
1,274
FEMALE POPULATION
72.53
MALES / 100 FEMALES
137.88
FEMALES / 100 MALES
53.7
MEDIAN AGE
2.8
AVG FAMILY SIZE
2.4
AVG HOUSEHOLD SIZE
787
LABOR FORCE [ PEOPLE ]
39.6%
PERCENT IN LABOR FORCE
0.6%
UNEMPLOYMENT RATE
Taylorsville Zip Codes
Taylorsville Area Codes
Income in Taylorsville
Income Overview in Taylorsville
Per Capita Income in Taylorsville is $24,280, while median incomes of families and households are $65,147 and $43,681 respectively.
| Characteristic | Number | Measure |
| Per Capita Income | 2,198 | $24,280 |
| Median Family Income | 442 | $65,147 |
| Mean Family Income | 442 | $80,547 |
| Median Household Income | 857 | $43,681 |
| Mean Household Income | 857 | $58,198 |
| Income Deficit | 442 | $0 |
| Wage / Income Gap (%) | 2,198 | 22.15% |
| Wage / Income Gap ($) | 2,198 | 77.85¢ per $1 |
| Gini / Inequality Index | 2,198 | 0.51 |
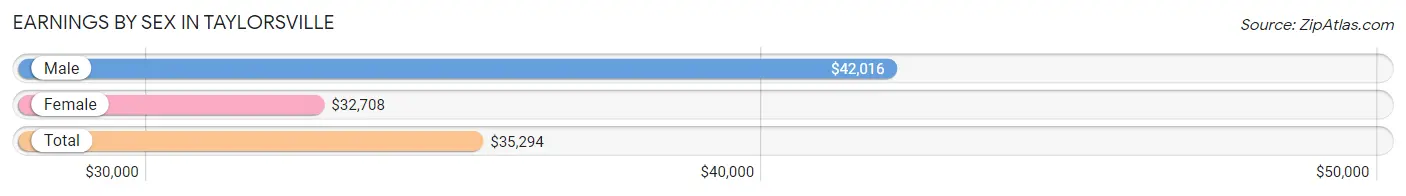
Earnings by Sex in Taylorsville
Average Earnings in Taylorsville are $35,294, $42,016 for men and $32,708 for women, a difference of 22.2%.
| Sex | Number | Average Earnings |
| Male | 470 (52.9%) | $42,016 |
| Female | 418 (47.1%) | $32,708 |
| Total | 888 (100.0%) | $35,294 |
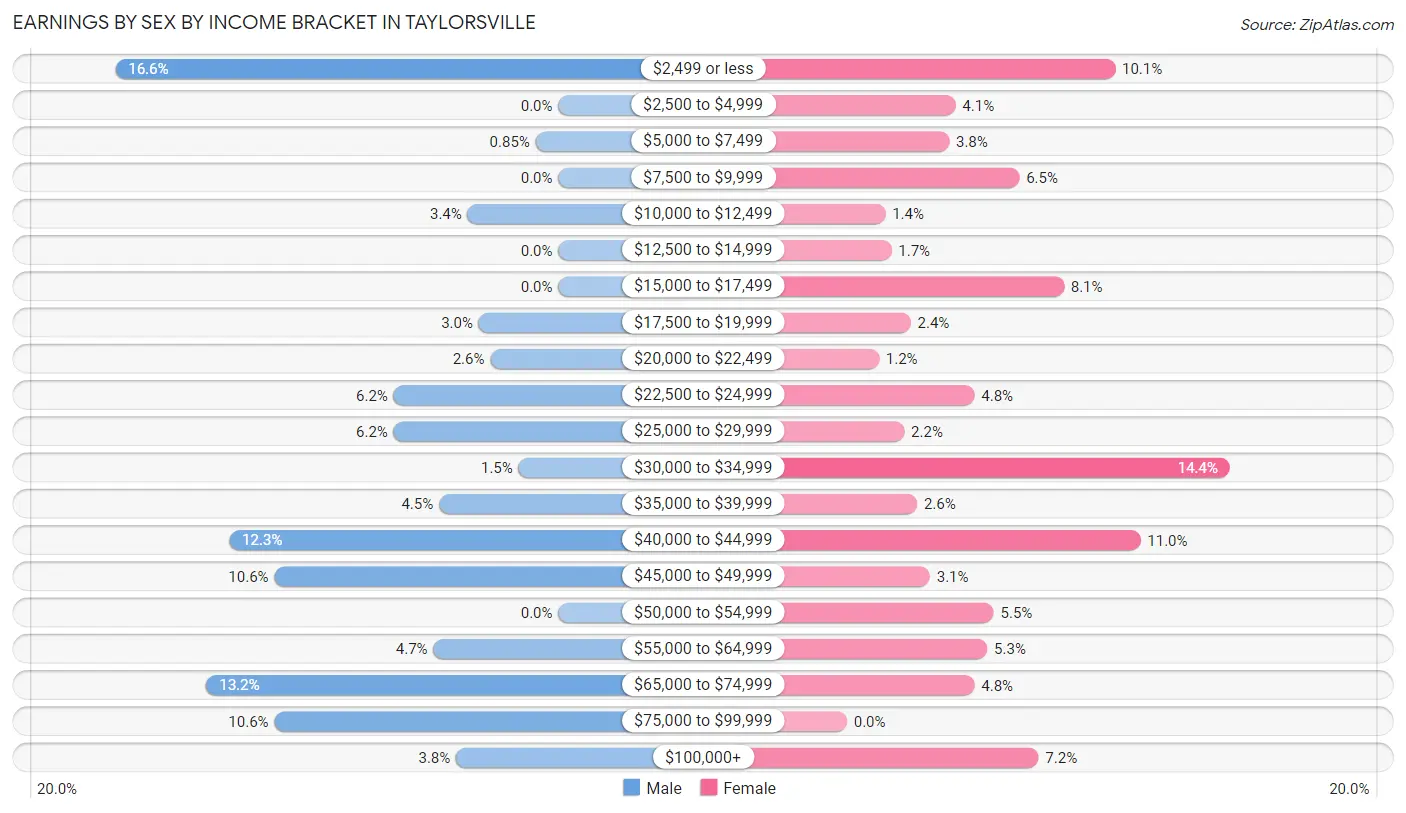
Earnings by Sex by Income Bracket in Taylorsville
The most common earnings brackets in Taylorsville are $2,499 or less for men (78 | 16.6%) and $30,000 to $34,999 for women (60 | 14.3%).
| Income | Male | Female |
| $2,499 or less | 78 (16.6%) | 42 (10.1%) |
| $2,500 to $4,999 | 0 (0.0%) | 17 (4.1%) |
| $5,000 to $7,499 | 4 (0.9%) | 16 (3.8%) |
| $7,500 to $9,999 | 0 (0.0%) | 27 (6.5%) |
| $10,000 to $12,499 | 16 (3.4%) | 6 (1.4%) |
| $12,500 to $14,999 | 0 (0.0%) | 7 (1.7%) |
| $15,000 to $17,499 | 0 (0.0%) | 34 (8.1%) |
| $17,500 to $19,999 | 14 (3.0%) | 10 (2.4%) |
| $20,000 to $22,499 | 12 (2.5%) | 5 (1.2%) |
| $22,500 to $24,999 | 29 (6.2%) | 20 (4.8%) |
| $25,000 to $29,999 | 29 (6.2%) | 9 (2.1%) |
| $30,000 to $34,999 | 7 (1.5%) | 60 (14.3%) |
| $35,000 to $39,999 | 21 (4.5%) | 11 (2.6%) |
| $40,000 to $44,999 | 58 (12.3%) | 46 (11.0%) |
| $45,000 to $49,999 | 50 (10.6%) | 13 (3.1%) |
| $50,000 to $54,999 | 0 (0.0%) | 23 (5.5%) |
| $55,000 to $64,999 | 22 (4.7%) | 22 (5.3%) |
| $65,000 to $74,999 | 62 (13.2%) | 20 (4.8%) |
| $75,000 to $99,999 | 50 (10.6%) | 0 (0.0%) |
| $100,000+ | 18 (3.8%) | 30 (7.2%) |
| Total | 470 (100.0%) | 418 (100.0%) |
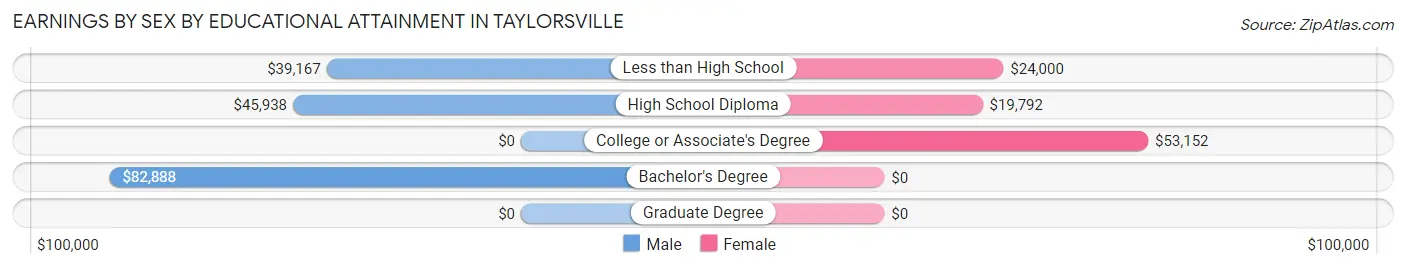
Earnings by Sex by Educational Attainment in Taylorsville
Average earnings in Taylorsville are $42,870 for men and $38,250 for women, a difference of 10.8%. Men with an educational attainment of bachelor's degree enjoy the highest average annual earnings of $82,888, while those with less than high school education earn the least with $39,167. Women with an educational attainment of college or associate's degree earn the most with the average annual earnings of $53,152, while those with high school diploma education have the smallest earnings of $19,792.
| Educational Attainment | Male Income | Female Income |
| Less than High School | $39,167 | $24,000 |
| High School Diploma | $45,938 | $19,792 |
| College or Associate's Degree | - | - |
| Bachelor's Degree | $82,888 | $0 |
| Graduate Degree | - | - |
| Total | $42,870 | $38,250 |
Family Income in Taylorsville
Family Income Brackets in Taylorsville
According to the Taylorsville family income data, there are 102 families falling into the $50,000 to $74,999 income range, which is the most common income bracket and makes up 23.1% of all families. Conversely, the $150,000 to $199,999 income bracket is the least frequent group with only 3 families (0.7%) belonging to this category.
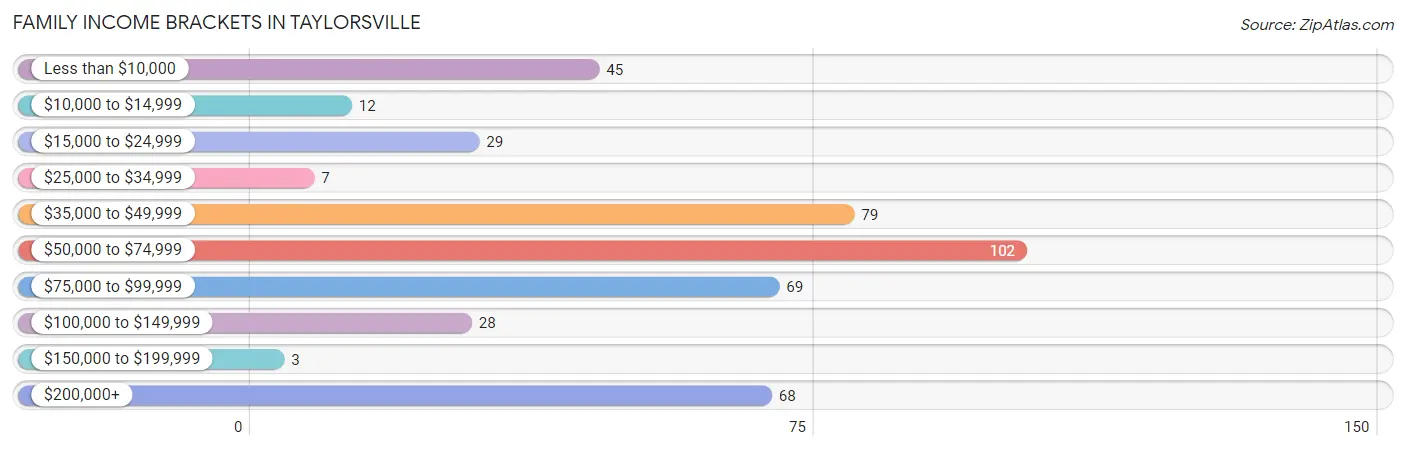
| Income Bracket | # Families | % Families |
| Less than $10,000 | 45 | 10.2% |
| $10,000 to $14,999 | 12 | 2.7% |
| $15,000 to $24,999 | 29 | 6.6% |
| $25,000 to $34,999 | 7 | 1.6% |
| $35,000 to $49,999 | 79 | 17.9% |
| $50,000 to $74,999 | 102 | 23.1% |
| $75,000 to $99,999 | 69 | 15.6% |
| $100,000 to $149,999 | 28 | 6.3% |
| $150,000 to $199,999 | 3 | 0.7% |
| $200,000+ | 68 | 15.4% |
Family Income by Famaliy Size in Taylorsville
4-person families (104 | 23.5%) account for the highest median family income in Taylorsville with $213,389 per family, while 4-person families (104 | 23.5%) have the highest median income of $53,347 per family member.
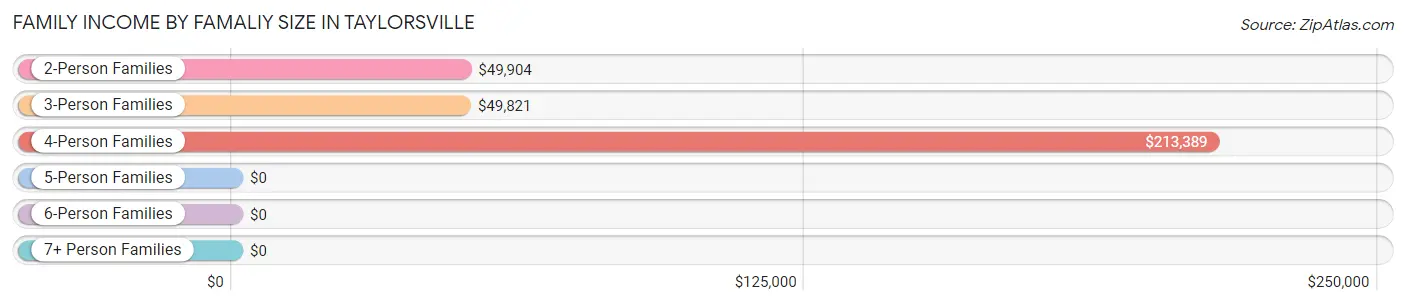
| Income Bracket | # Families | Median Income |
| 2-Person Families | 224 (50.7%) | $49,904 |
| 3-Person Families | 105 (23.8%) | $49,821 |
| 4-Person Families | 104 (23.5%) | $213,389 |
| 5-Person Families | 3 (0.7%) | $0 |
| 6-Person Families | 6 (1.4%) | $0 |
| 7+ Person Families | 0 (0.0%) | $0 |
| Total | 442 (100.0%) | $65,147 |
Family Income by Number of Earners in Taylorsville
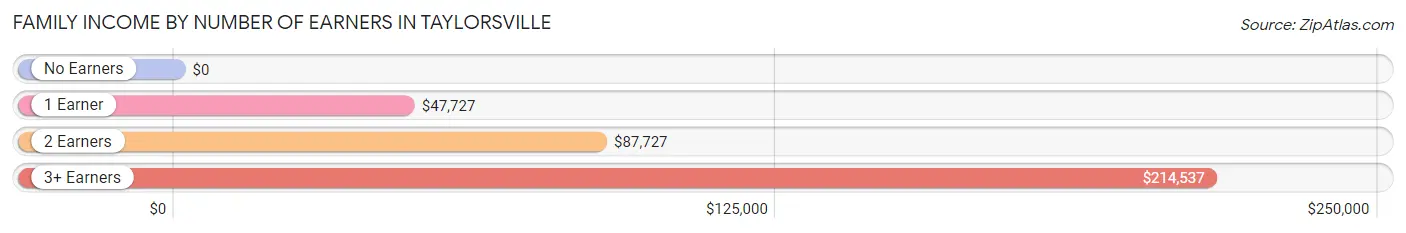
| Number of Earners | # Families | Median Income |
| No Earners | 66 (14.9%) | $0 |
| 1 Earner | 164 (37.1%) | $47,727 |
| 2 Earners | 156 (35.3%) | $87,727 |
| 3+ Earners | 56 (12.7%) | $214,537 |
| Total | 442 (100.0%) | $65,147 |
Household Income in Taylorsville
Household Income Brackets in Taylorsville
With 195 households falling in the category, the $10,000 to $14,999 income range is the most frequent in Taylorsville, accounting for 22.8% of all households. In contrast, only 3 households (0.4%) fall into the $150,000 to $199,999 income bracket, making it the least populous group.
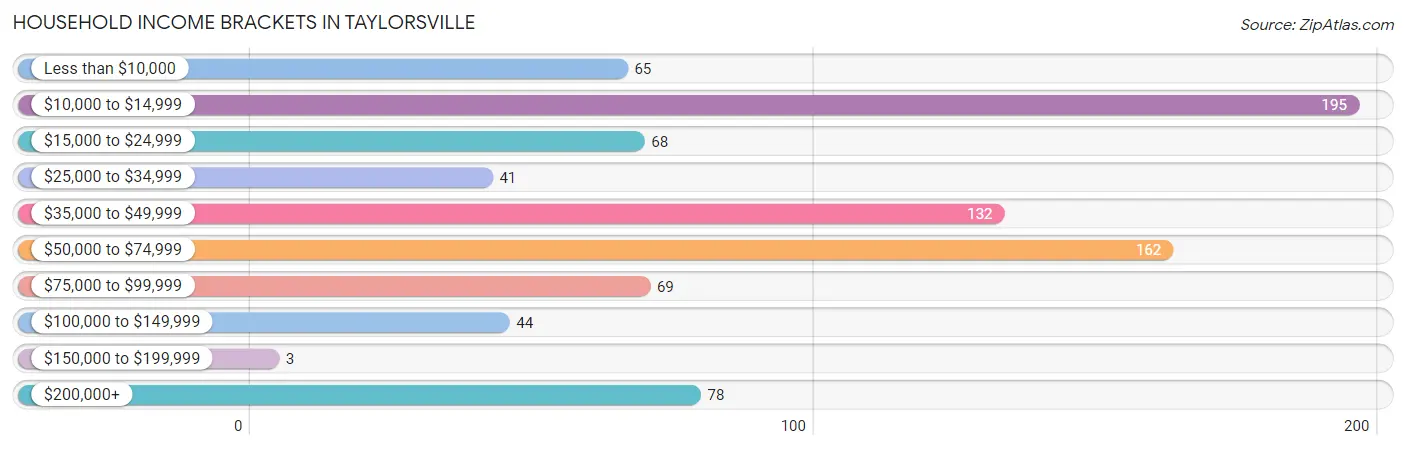
| Income Bracket | # Households | % Households |
| Less than $10,000 | 65 | 7.6% |
| $10,000 to $14,999 | 195 | 22.8% |
| $15,000 to $24,999 | 68 | 7.9% |
| $25,000 to $34,999 | 41 | 4.8% |
| $35,000 to $49,999 | 132 | 15.4% |
| $50,000 to $74,999 | 162 | 18.9% |
| $75,000 to $99,999 | 69 | 8.1% |
| $100,000 to $149,999 | 44 | 5.1% |
| $150,000 to $199,999 | 3 | 0.4% |
| $200,000+ | 78 | 9.1% |
Household Income by Householder Age in Taylorsville
The median household income in Taylorsville is $43,681, with the highest median household income of $73,000 found in the 25 to 44 years age bracket for the primary householder. A total of 192 households (22.4%) fall into this category. Meanwhile, the 15 to 24 years age bracket for the primary householder has the lowest median household income of $0, with 14 households (1.6%) in this group.
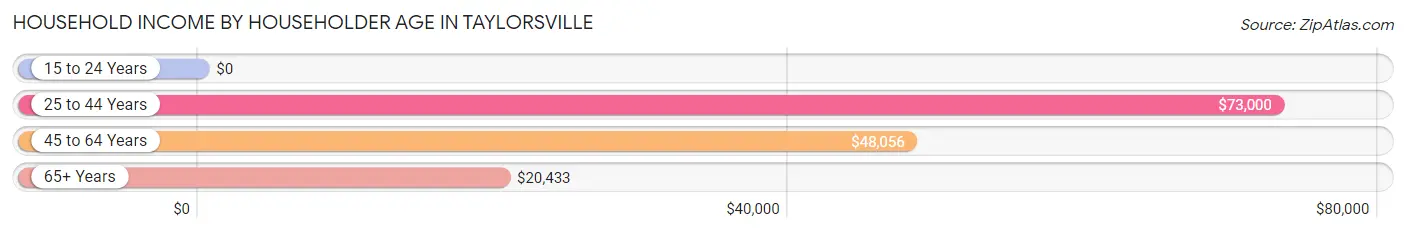
| Income Bracket | # Households | Median Income |
| 15 to 24 Years | 14 (1.6%) | $0 |
| 25 to 44 Years | 192 (22.4%) | $73,000 |
| 45 to 64 Years | 282 (32.9%) | $48,056 |
| 65+ Years | 369 (43.1%) | $20,433 |
| Total | 857 (100.0%) | $43,681 |
Poverty in Taylorsville
Income Below Poverty by Sex and Age in Taylorsville
With 31.3% poverty level for males and 30.0% for females among the residents of Taylorsville, under 5 year old males and 6 to 11 year old females are the most vulnerable to poverty, with 15 males (62.5%) and 21 females (50.0%) in their respective age groups living below the poverty level.
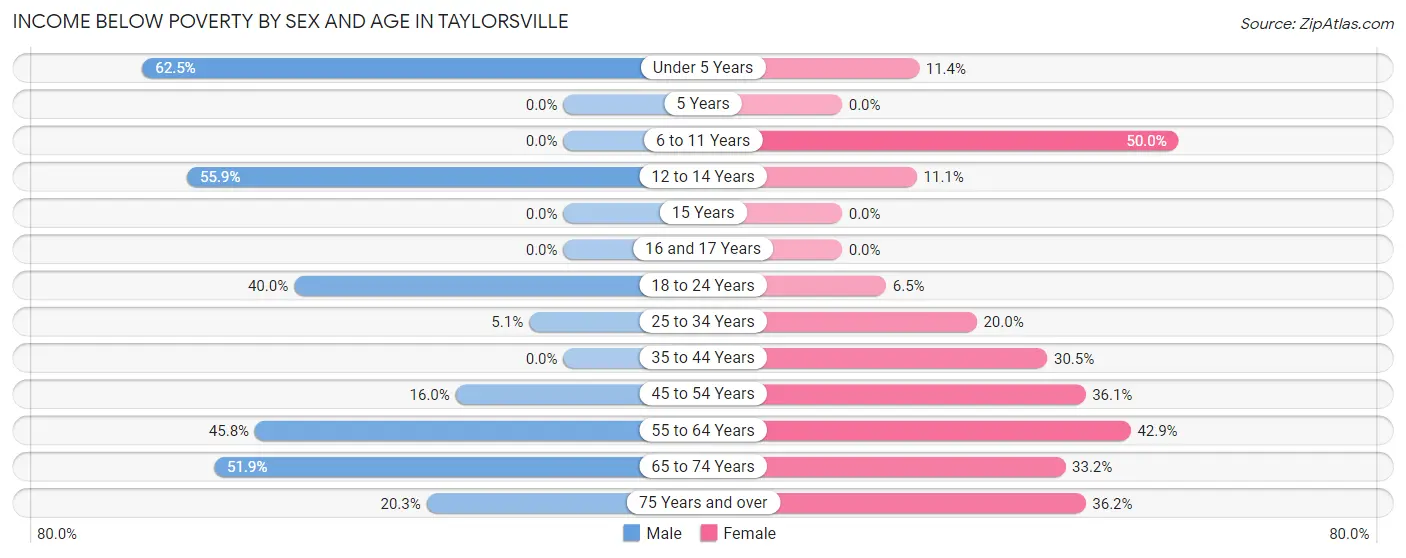
| Age Bracket | Male | Female |
| Under 5 Years | 15 (62.5%) | 4 (11.4%) |
| 5 Years | 0 (0.0%) | 0 (0.0%) |
| 6 to 11 Years | 0 (0.0%) | 21 (50.0%) |
| 12 to 14 Years | 19 (55.9%) | 2 (11.1%) |
| 15 Years | 0 (0.0%) | 0 (0.0%) |
| 16 and 17 Years | 0 (0.0%) | 0 (0.0%) |
| 18 to 24 Years | 46 (40.0%) | 7 (6.5%) |
| 25 to 34 Years | 5 (5.1%) | 22 (20.0%) |
| 35 to 44 Years | 0 (0.0%) | 32 (30.5%) |
| 45 to 54 Years | 16 (16.0%) | 60 (36.1%) |
| 55 to 64 Years | 60 (45.8%) | 51 (42.9%) |
| 65 to 74 Years | 97 (51.9%) | 64 (33.2%) |
| 75 Years and over | 13 (20.3%) | 85 (36.2%) |
| Total | 271 (31.3%) | 348 (30.0%) |
Income Above Poverty by Sex and Age in Taylorsville
According to the poverty statistics in Taylorsville, males aged 5 years and females aged 5 years are the age groups that are most secure financially, with 100.0% of males and 100.0% of females in these age groups living above the poverty line.
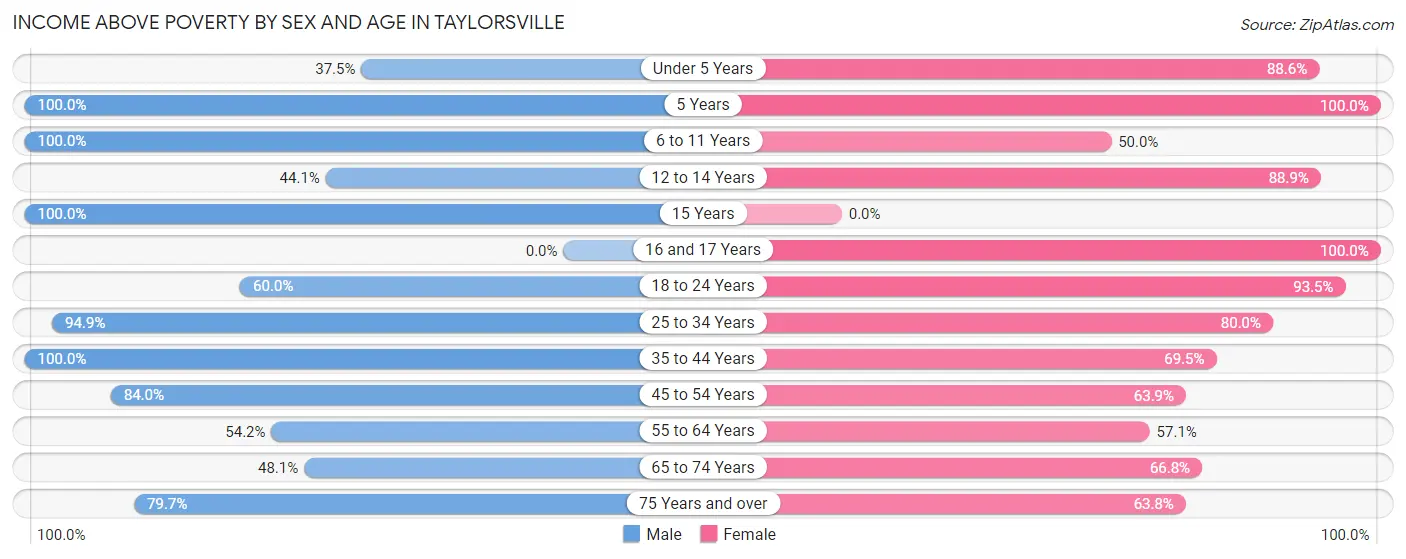
| Age Bracket | Male | Female |
| Under 5 Years | 9 (37.5%) | 31 (88.6%) |
| 5 Years | 10 (100.0%) | 19 (100.0%) |
| 6 to 11 Years | 18 (100.0%) | 21 (50.0%) |
| 12 to 14 Years | 15 (44.1%) | 16 (88.9%) |
| 15 Years | 5 (100.0%) | 0 (0.0%) |
| 16 and 17 Years | 0 (0.0%) | 10 (100.0%) |
| 18 to 24 Years | 69 (60.0%) | 100 (93.5%) |
| 25 to 34 Years | 93 (94.9%) | 88 (80.0%) |
| 35 to 44 Years | 79 (100.0%) | 73 (69.5%) |
| 45 to 54 Years | 84 (84.0%) | 106 (63.9%) |
| 55 to 64 Years | 71 (54.2%) | 68 (57.1%) |
| 65 to 74 Years | 90 (48.1%) | 129 (66.8%) |
| 75 Years and over | 51 (79.7%) | 150 (63.8%) |
| Total | 594 (68.7%) | 811 (70.0%) |
Income Below Poverty Among Married-Couple Families in Taylorsville
The poverty statistics for married-couple families in Taylorsville show that 3.8% or 12 of the total 312 families live below the poverty line. Families with no children have the highest poverty rate of 5.8%, comprising of 12 families. On the other hand, families with 1 or 2 children have the lowest poverty rate of 0.0%, which includes 0 families.
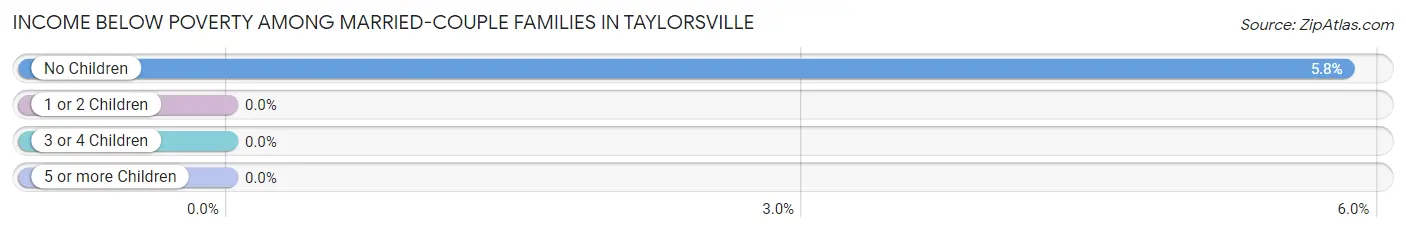
| Children | Above Poverty | Below Poverty |
| No Children | 194 (94.2%) | 12 (5.8%) |
| 1 or 2 Children | 103 (100.0%) | 0 (0.0%) |
| 3 or 4 Children | 3 (100.0%) | 0 (0.0%) |
| 5 or more Children | 0 (0.0%) | 0 (0.0%) |
| Total | 300 (96.2%) | 12 (3.8%) |
Income Below Poverty Among Single-Parent Households in Taylorsville
According to the poverty data in Taylorsville, 28.0% or 7 single-father households and 55.2% or 58 single-mother households are living below the poverty line. Among single-father households, those with 1 or 2 children have the highest poverty rate, with 7 households (100.0%) experiencing poverty. Likewise, among single-mother households, those with 1 or 2 children have the highest poverty rate, with 38 households (100.0%) falling below the poverty line.
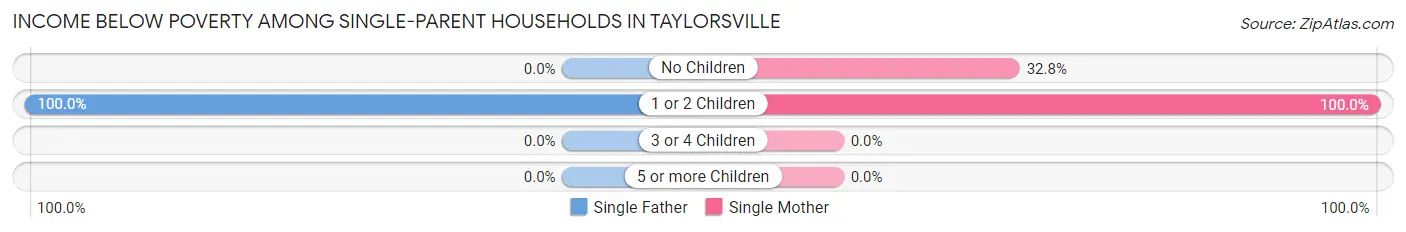
| Children | Single Father | Single Mother |
| No Children | 0 (0.0%) | 20 (32.8%) |
| 1 or 2 Children | 7 (100.0%) | 38 (100.0%) |
| 3 or 4 Children | 0 (0.0%) | 0 (0.0%) |
| 5 or more Children | 0 (0.0%) | 0 (0.0%) |
| Total | 7 (28.0%) | 58 (55.2%) |
Income Below Poverty Among Married-Couple vs Single-Parent Households in Taylorsville
The poverty data for Taylorsville shows that 12 of the married-couple family households (3.8%) and 65 of the single-parent households (50.0%) are living below the poverty level. Within the married-couple family households, those with no children have the highest poverty rate, with 12 households (5.8%) falling below the poverty line. Among the single-parent households, those with 1 or 2 children have the highest poverty rate, with 45 household (100.0%) living below poverty.
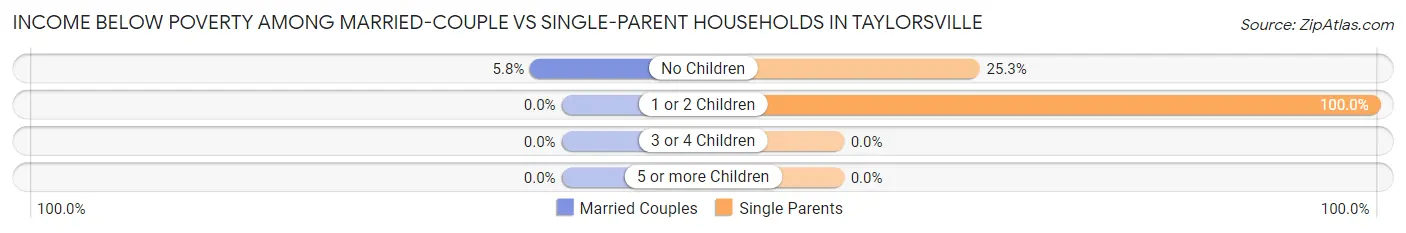
| Children | Married-Couple Families | Single-Parent Households |
| No Children | 12 (5.8%) | 20 (25.3%) |
| 1 or 2 Children | 0 (0.0%) | 45 (100.0%) |
| 3 or 4 Children | 0 (0.0%) | 0 (0.0%) |
| 5 or more Children | 0 (0.0%) | 0 (0.0%) |
| Total | 12 (3.8%) | 65 (50.0%) |
Race in Taylorsville
The most populous races in Taylorsville are White / Caucasian (1,903 | 86.6%), Black / African American (187 | 8.5%), and Hispanic or Latino (71 | 3.2%).
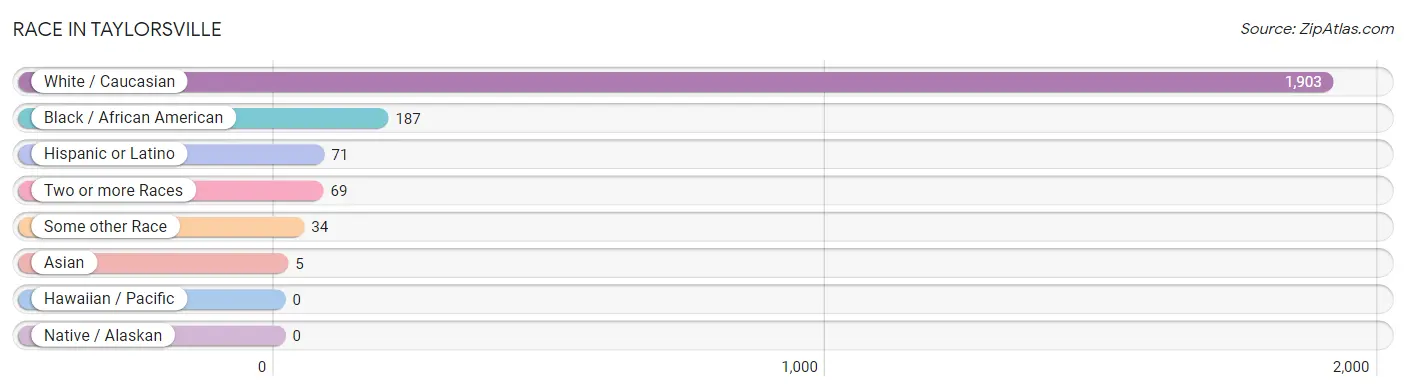
| Race | # Population | % Population |
| Asian | 5 | 0.2% |
| Black / African American | 187 | 8.5% |
| Hawaiian / Pacific | 0 | 0.0% |
| Hispanic or Latino | 71 | 3.2% |
| Native / Alaskan | 0 | 0.0% |
| White / Caucasian | 1,903 | 86.6% |
| Two or more Races | 69 | 3.1% |
| Some other Race | 34 | 1.5% |
| Total | 2,198 | 100.0% |
Ancestry in Taylorsville
The most populous ancestries reported in Taylorsville are American (692 | 31.5%), English (317 | 14.4%), German (189 | 8.6%), Irish (160 | 7.3%), and Italian (102 | 4.6%), together accounting for 66.4% of all Taylorsville residents.
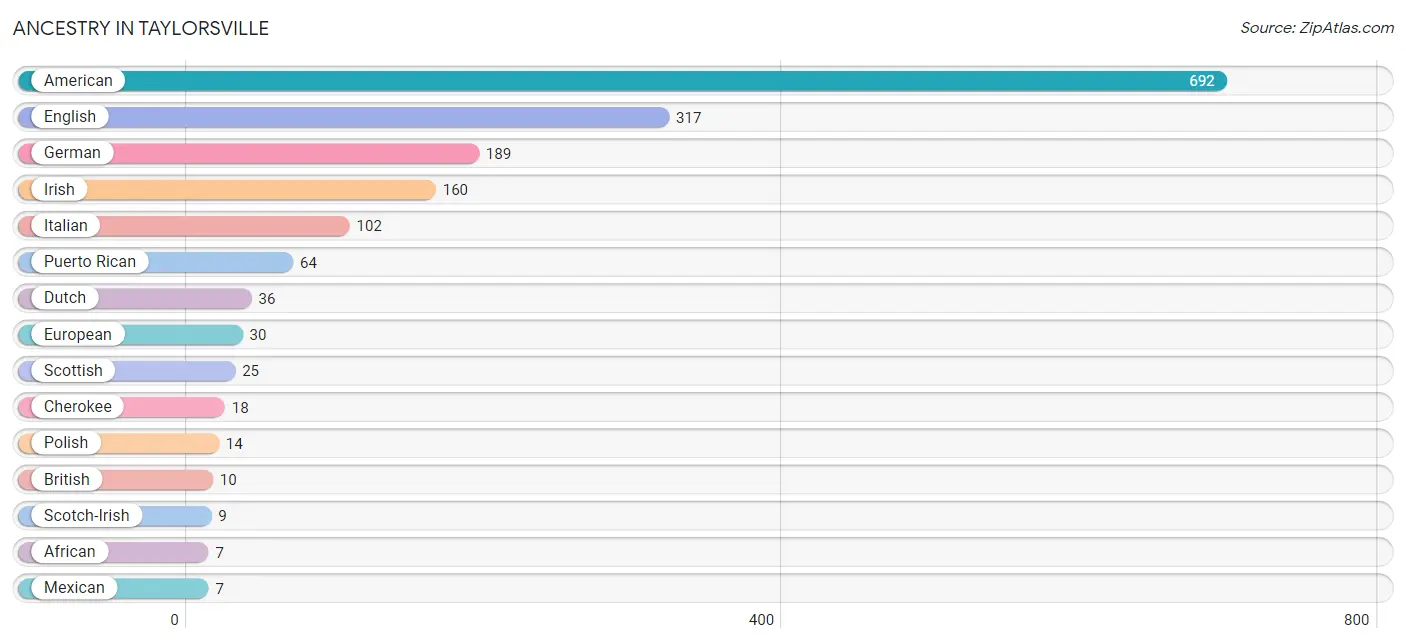
| Ancestry | # Population | % Population |
| African | 7 | 0.3% |
| American | 692 | 31.5% |
| Arab | 4 | 0.2% |
| Australian | 5 | 0.2% |
| British | 10 | 0.4% |
| Cherokee | 18 | 0.8% |
| Dutch | 36 | 1.6% |
| Eastern European | 5 | 0.2% |
| English | 317 | 14.4% |
| European | 30 | 1.4% |
| French Canadian | 5 | 0.2% |
| German | 189 | 8.6% |
| Hungarian | 4 | 0.2% |
| Irish | 160 | 7.3% |
| Italian | 102 | 4.6% |
| Korean | 5 | 0.2% |
| Mexican | 7 | 0.3% |
| Polish | 14 | 0.6% |
| Puerto Rican | 64 | 2.9% |
| Scotch-Irish | 9 | 0.4% |
| Scottish | 25 | 1.1% |
| Slovak | 6 | 0.3% |
| Subsaharan African | 7 | 0.3% | View All 23 Rows |
Immigrants in Taylorsville
The most numerous immigrant groups reported in Taylorsville came from Europe (28 | 1.3%), Germany (22 | 1.0%), Western Europe (22 | 1.0%), Italy (6 | 0.3%), and Southern Europe (6 | 0.3%), together accounting for 3.8% of all Taylorsville residents.
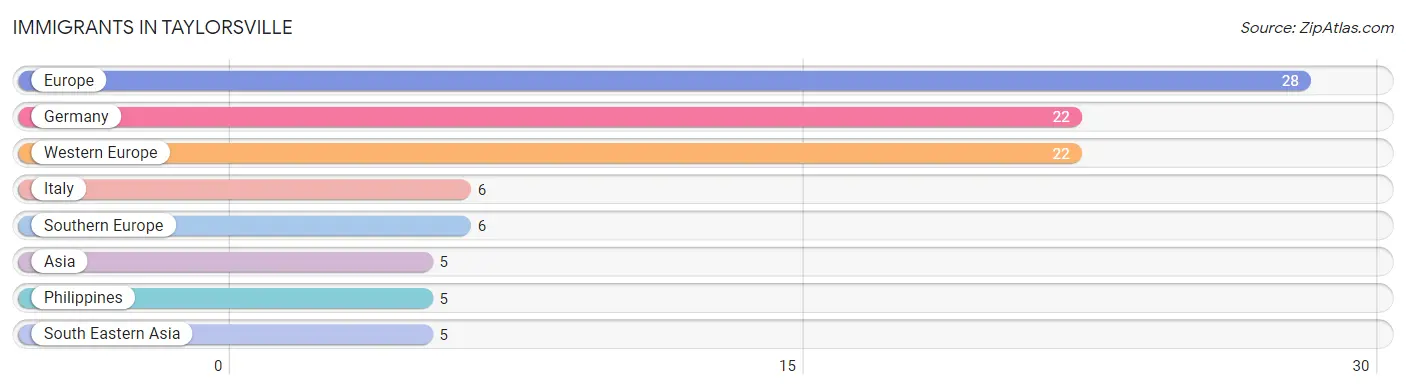
| Immigration Origin | # Population | % Population |
| Asia | 5 | 0.2% |
| Europe | 28 | 1.3% |
| Germany | 22 | 1.0% |
| Italy | 6 | 0.3% |
| Philippines | 5 | 0.2% |
| South Eastern Asia | 5 | 0.2% |
| Southern Europe | 6 | 0.3% |
| Western Europe | 22 | 1.0% | View All 8 Rows |
Sex and Age in Taylorsville
Sex and Age in Taylorsville
The most populous age groups in Taylorsville are 20 to 24 Years (119 | 12.9%) for men and 85 Years and over (183 | 14.4%) for women.
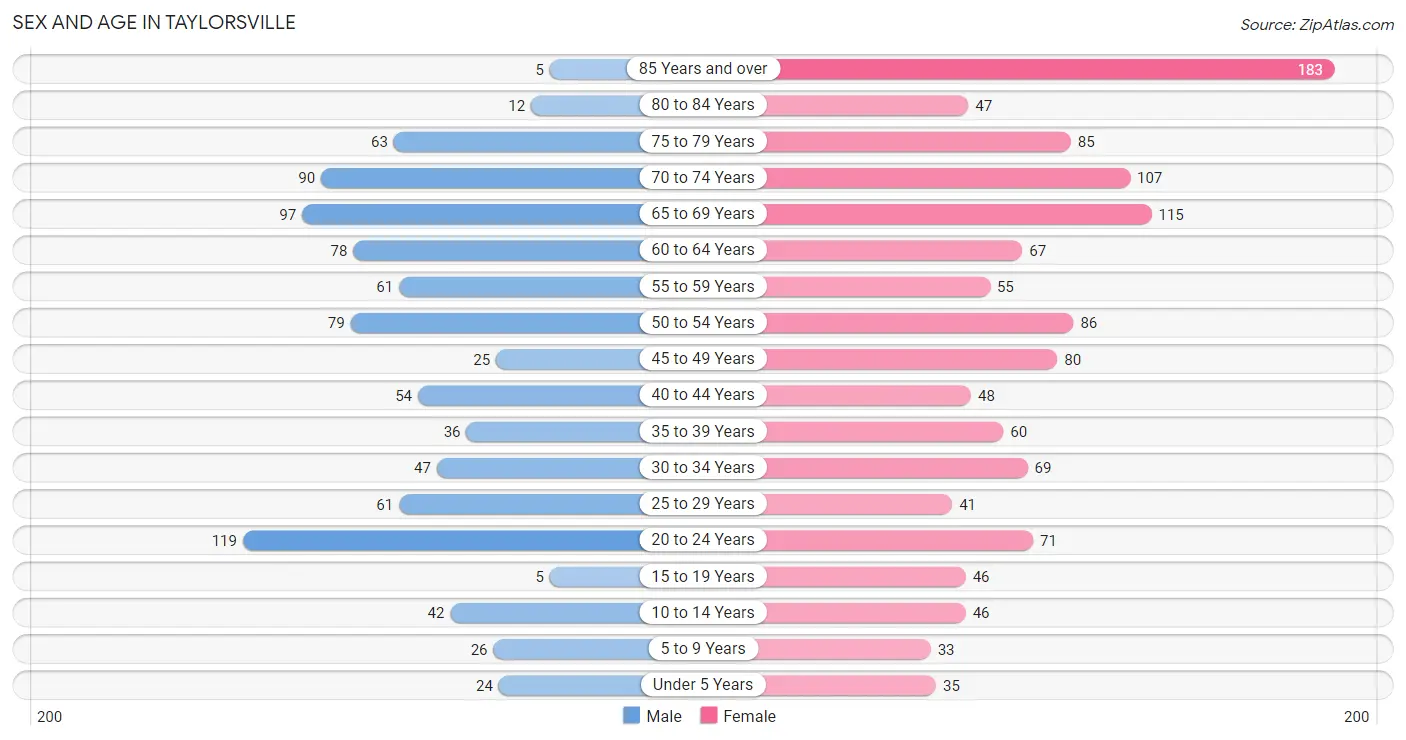
| Age Bracket | Male | Female |
| Under 5 Years | 24 (2.6%) | 35 (2.8%) |
| 5 to 9 Years | 26 (2.8%) | 33 (2.6%) |
| 10 to 14 Years | 42 (4.5%) | 46 (3.6%) |
| 15 to 19 Years | 5 (0.5%) | 46 (3.6%) |
| 20 to 24 Years | 119 (12.9%) | 71 (5.6%) |
| 25 to 29 Years | 61 (6.6%) | 41 (3.2%) |
| 30 to 34 Years | 47 (5.1%) | 69 (5.4%) |
| 35 to 39 Years | 36 (3.9%) | 60 (4.7%) |
| 40 to 44 Years | 54 (5.8%) | 48 (3.8%) |
| 45 to 49 Years | 25 (2.7%) | 80 (6.3%) |
| 50 to 54 Years | 79 (8.6%) | 86 (6.8%) |
| 55 to 59 Years | 61 (6.6%) | 55 (4.3%) |
| 60 to 64 Years | 78 (8.4%) | 67 (5.3%) |
| 65 to 69 Years | 97 (10.5%) | 115 (9.0%) |
| 70 to 74 Years | 90 (9.7%) | 107 (8.4%) |
| 75 to 79 Years | 63 (6.8%) | 85 (6.7%) |
| 80 to 84 Years | 12 (1.3%) | 47 (3.7%) |
| 85 Years and over | 5 (0.5%) | 183 (14.4%) |
| Total | 924 (100.0%) | 1,274 (100.0%) |
Families and Households in Taylorsville
Median Family Size in Taylorsville
The median family size in Taylorsville is 2.81 persons per family, with married-couple families (312 | 70.6%) accounting for the largest median family size of 2.86 persons per family. On the other hand, single male/father families (25 | 5.7%) represent the smallest median family size with 2.24 persons per family.
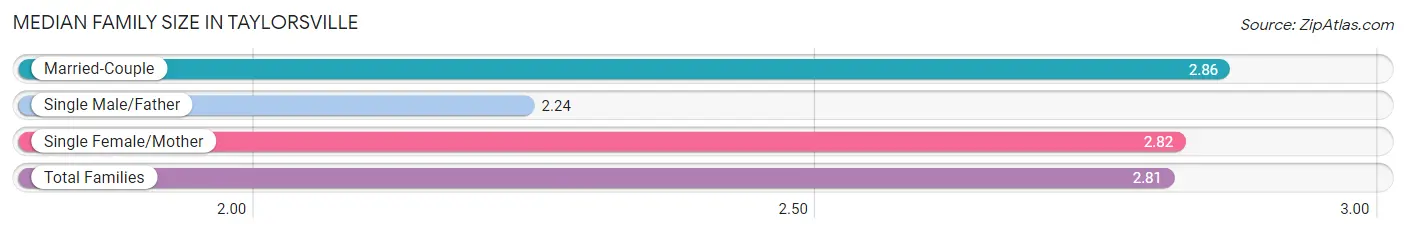
| Family Type | # Families | Family Size |
| Married-Couple | 312 (70.6%) | 2.86 |
| Single Male/Father | 25 (5.7%) | 2.24 |
| Single Female/Mother | 105 (23.8%) | 2.82 |
| Total Families | 442 (100.0%) | 2.81 |
Median Household Size in Taylorsville
The median household size in Taylorsville is 2.35 persons per household, with single female/mother households (105 | 12.2%) accounting for the largest median household size of 3.04 persons per household. non-family households (415 | 48.4%) represent the smallest median household size with 1.79 persons per household.
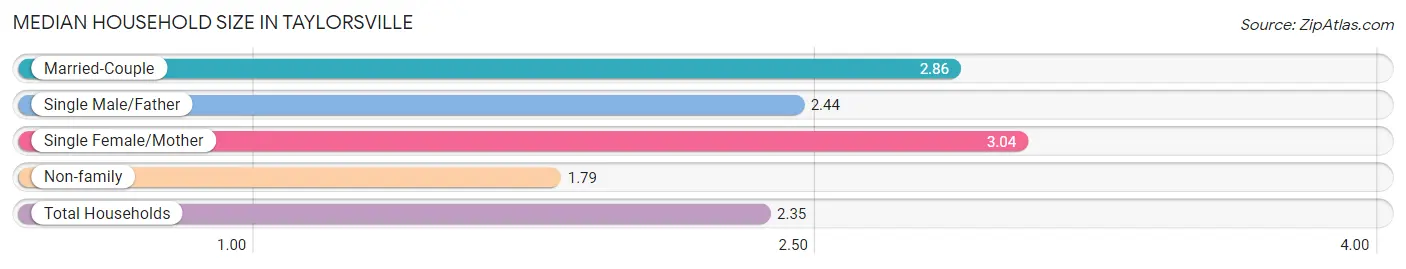
| Household Type | # Households | Household Size |
| Married-Couple | 312 (36.4%) | 2.86 |
| Single Male/Father | 25 (2.9%) | 2.44 |
| Single Female/Mother | 105 (12.2%) | 3.04 |
| Non-family | 415 (48.4%) | 1.79 |
| Total Households | 857 (100.0%) | 2.35 |
Household Size by Marriage Status in Taylorsville
Out of a total of 857 households in Taylorsville, 442 (51.6%) are family households, while 415 (48.4%) are nonfamily households. The most numerous type of family households are 2-person households, comprising 217, and the most common type of nonfamily households are 1-person households, comprising 377.
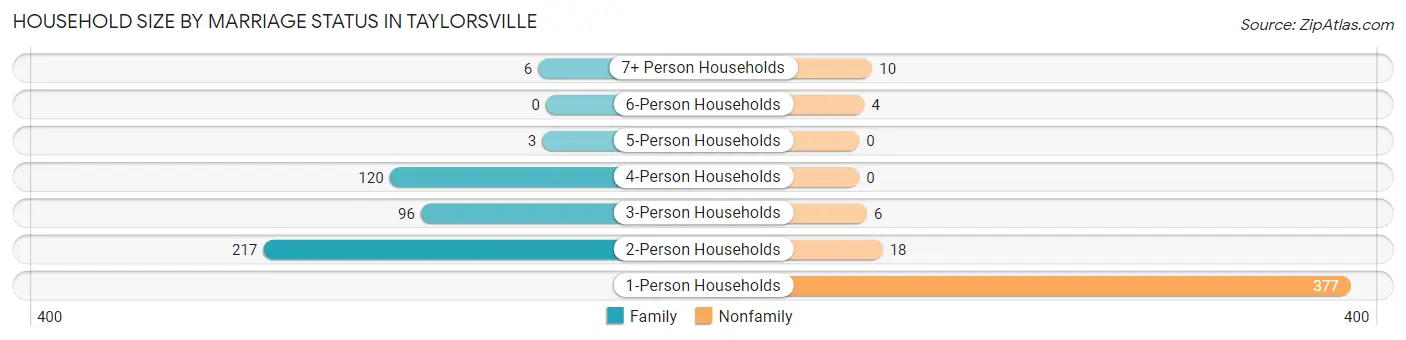
| Household Size | Family Households | Nonfamily Households |
| 1-Person Households | - | 377 (44.0%) |
| 2-Person Households | 217 (25.3%) | 18 (2.1%) |
| 3-Person Households | 96 (11.2%) | 6 (0.7%) |
| 4-Person Households | 120 (14.0%) | 0 (0.0%) |
| 5-Person Households | 3 (0.4%) | 0 (0.0%) |
| 6-Person Households | 0 (0.0%) | 4 (0.5%) |
| 7+ Person Households | 6 (0.7%) | 10 (1.2%) |
| Total | 442 (51.6%) | 415 (48.4%) |
Female Fertility in Taylorsville
Fertility by Age in Taylorsville
Average fertility rate in Taylorsville is 23.0 births per 1,000 women. Women in the age bracket of 20 to 34 years have the highest fertility rate with 55.0 births per 1,000 women. Women in the age bracket of 20 to 34 years acount for 100.0% of all women with births.
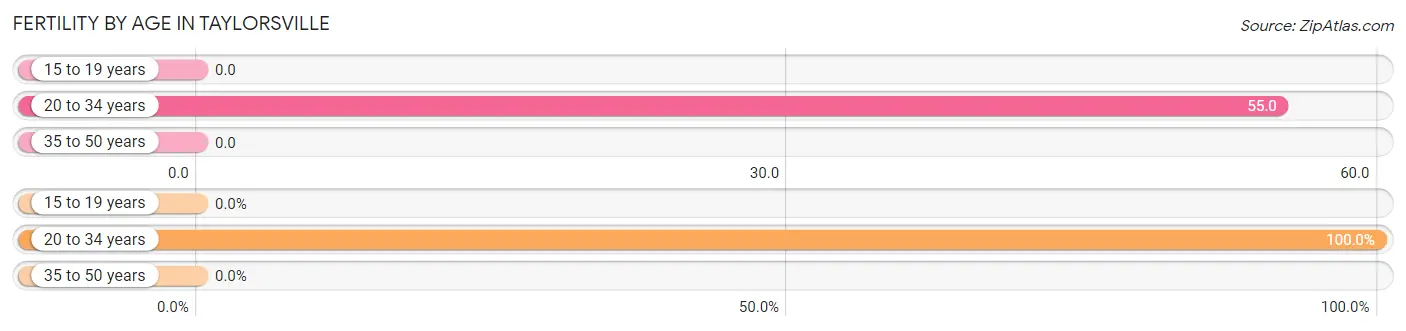
| Age Bracket | Women with Births | Births / 1,000 Women |
| 15 to 19 years | 0 (0.0%) | 0.0 |
| 20 to 34 years | 10 (100.0%) | 55.0 |
| 35 to 50 years | 0 (0.0%) | 0.0 |
| Total | 10 (100.0%) | 23.0 |
Fertility by Age by Marriage Status in Taylorsville
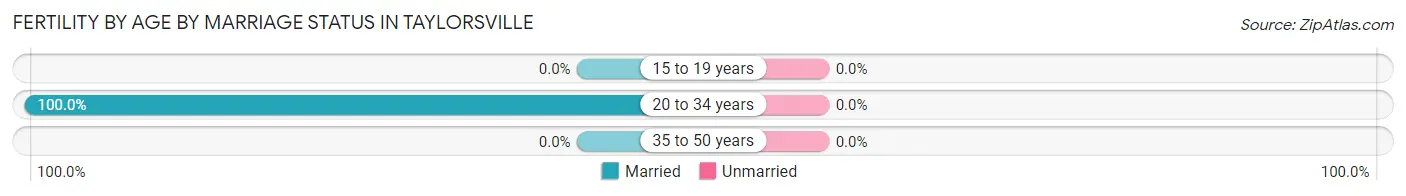
| Age Bracket | Married | Unmarried |
| 15 to 19 years | 0 (0.0%) | 0 (0.0%) |
| 20 to 34 years | 10 (100.0%) | 0 (0.0%) |
| 35 to 50 years | 0 (0.0%) | 0 (0.0%) |
| Total | 10 (100.0%) | 0 (0.0%) |
Fertility by Education in Taylorsville
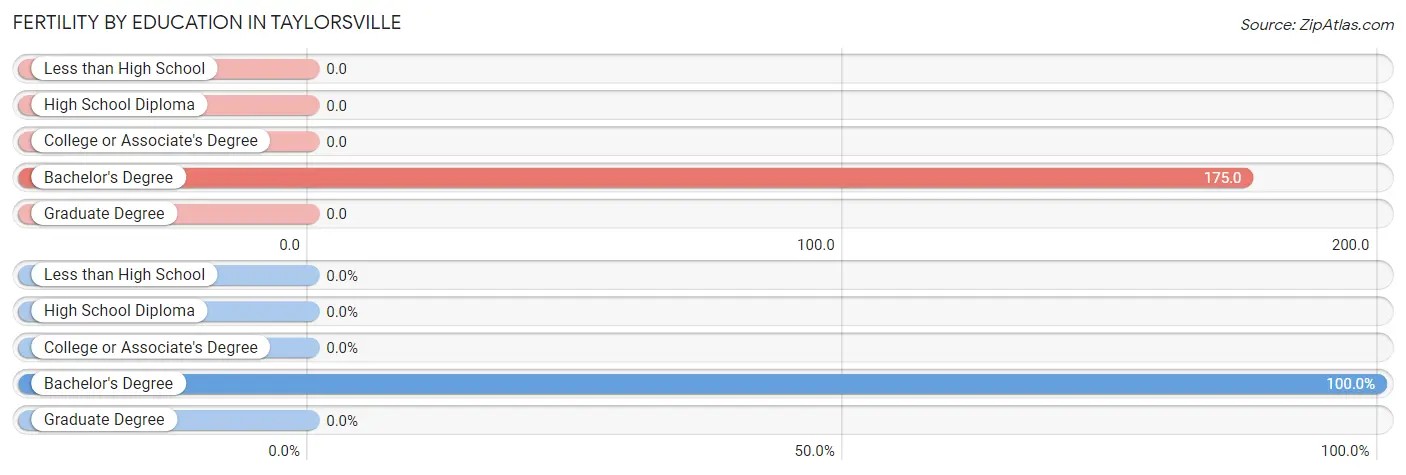
| Educational Attainment | Women with Births | Births / 1,000 Women |
| Less than High School | 0 (0.0%) | 0.0 |
| High School Diploma | 0 (0.0%) | 0.0 |
| College or Associate's Degree | 0 (0.0%) | 0.0 |
| Bachelor's Degree | 10 (100.0%) | 175.0 |
| Graduate Degree | 0 (0.0%) | 0.0 |
| Total | 10 (100.0%) | 23.0 |
Fertility by Education by Marriage Status in Taylorsville
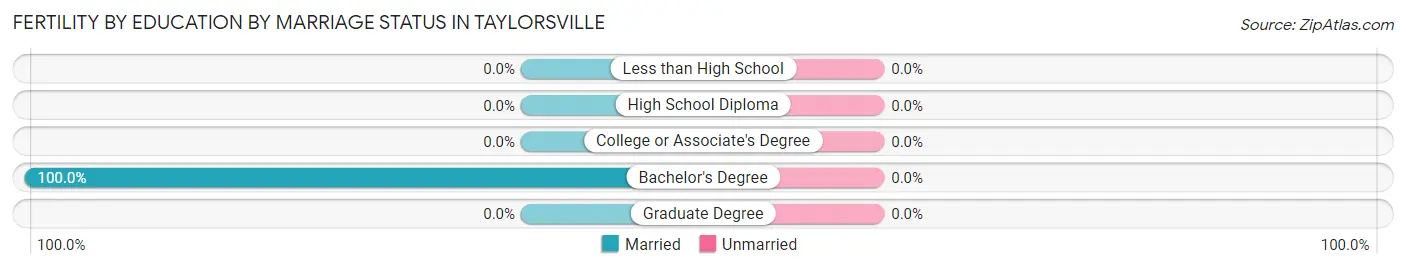
| Educational Attainment | Married | Unmarried |
| Less than High School | 0 (0.0%) | 0 (0.0%) |
| High School Diploma | 0 (0.0%) | 0 (0.0%) |
| College or Associate's Degree | 0 (0.0%) | 0 (0.0%) |
| Bachelor's Degree | 10 (100.0%) | 0 (0.0%) |
| Graduate Degree | 0 (0.0%) | 0 (0.0%) |
| Total | 10 (100.0%) | 0 (0.0%) |
Employment Characteristics in Taylorsville
Employment by Class of Employer in Taylorsville
Among the 782 employed individuals in Taylorsville, private company employees (500 | 63.9%), local government employees (107 | 13.7%), and not-for-profit organizations (98 | 12.5%) make up the most common classes of employment.
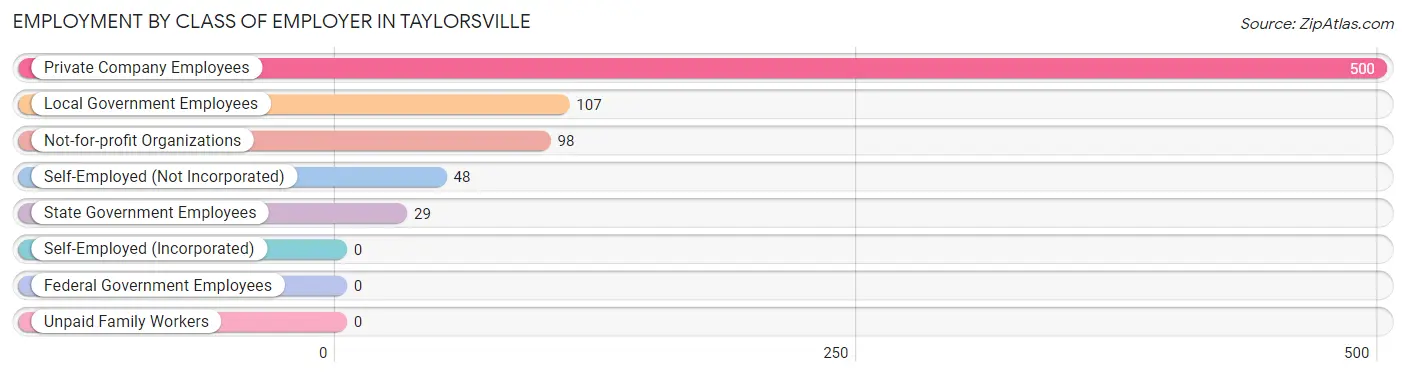
| Employer Class | # Employees | % Employees |
| Private Company Employees | 500 | 63.9% |
| Self-Employed (Incorporated) | 0 | 0.0% |
| Self-Employed (Not Incorporated) | 48 | 6.1% |
| Not-for-profit Organizations | 98 | 12.5% |
| Local Government Employees | 107 | 13.7% |
| State Government Employees | 29 | 3.7% |
| Federal Government Employees | 0 | 0.0% |
| Unpaid Family Workers | 0 | 0.0% |
| Total | 782 | 100.0% |
Employment Status by Age in Taylorsville
According to the labor force statistics for Taylorsville, out of the total population over 16 years of age (1,987), 39.6% or 787 individuals are in the labor force, with 0.6% or 5 of them unemployed. The age group with the highest labor force participation rate is 30 to 34 years, with 84.5% or 98 individuals in the labor force. Within the labor force, the 20 to 24 years age range has the highest percentage of unemployed individuals, with 3.8% or 5 of them being unemployed.
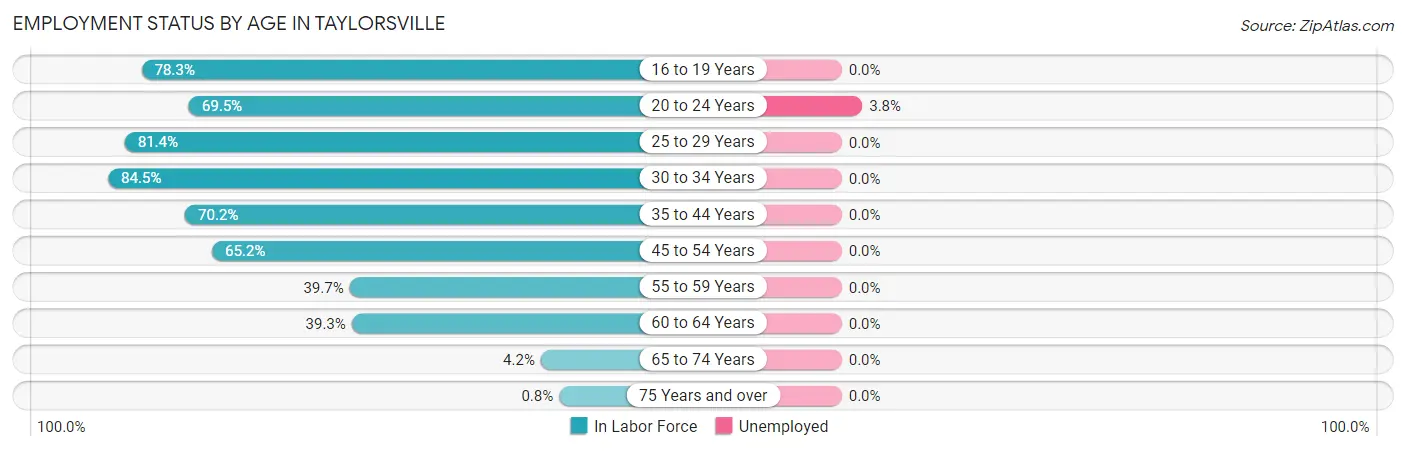
| Age Bracket | In Labor Force | Unemployed |
| 16 to 19 Years | 36 (78.3%) | 0 (0.0%) |
| 20 to 24 Years | 132 (69.5%) | 5 (3.8%) |
| 25 to 29 Years | 83 (81.4%) | 0 (0.0%) |
| 30 to 34 Years | 98 (84.5%) | 0 (0.0%) |
| 35 to 44 Years | 139 (70.2%) | 0 (0.0%) |
| 45 to 54 Years | 176 (65.2%) | 0 (0.0%) |
| 55 to 59 Years | 46 (39.7%) | 0 (0.0%) |
| 60 to 64 Years | 57 (39.3%) | 0 (0.0%) |
| 65 to 74 Years | 17 (4.2%) | 0 (0.0%) |
| 75 Years and over | 3 (0.8%) | 0 (0.0%) |
| Total | 787 (39.6%) | 5 (0.6%) |
Employment Status by Educational Attainment in Taylorsville
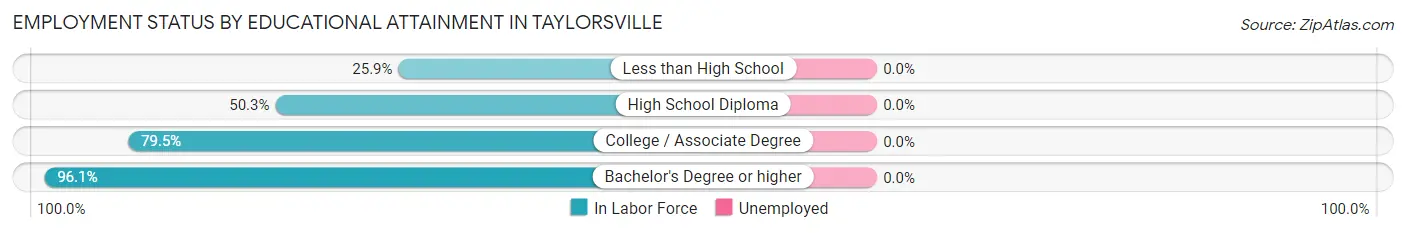
| Educational Attainment | In Labor Force | Unemployed |
| Less than High School | 36 (25.9%) | 0 (0.0%) |
| High School Diploma | 187 (50.3%) | 0 (0.0%) |
| College / Associate Degree | 205 (79.5%) | 0 (0.0%) |
| Bachelor's Degree or higher | 171 (96.1%) | 0 (0.0%) |
| Total | 599 (63.3%) | 0 (0.0%) |
Employment Occupations by Sex in Taylorsville
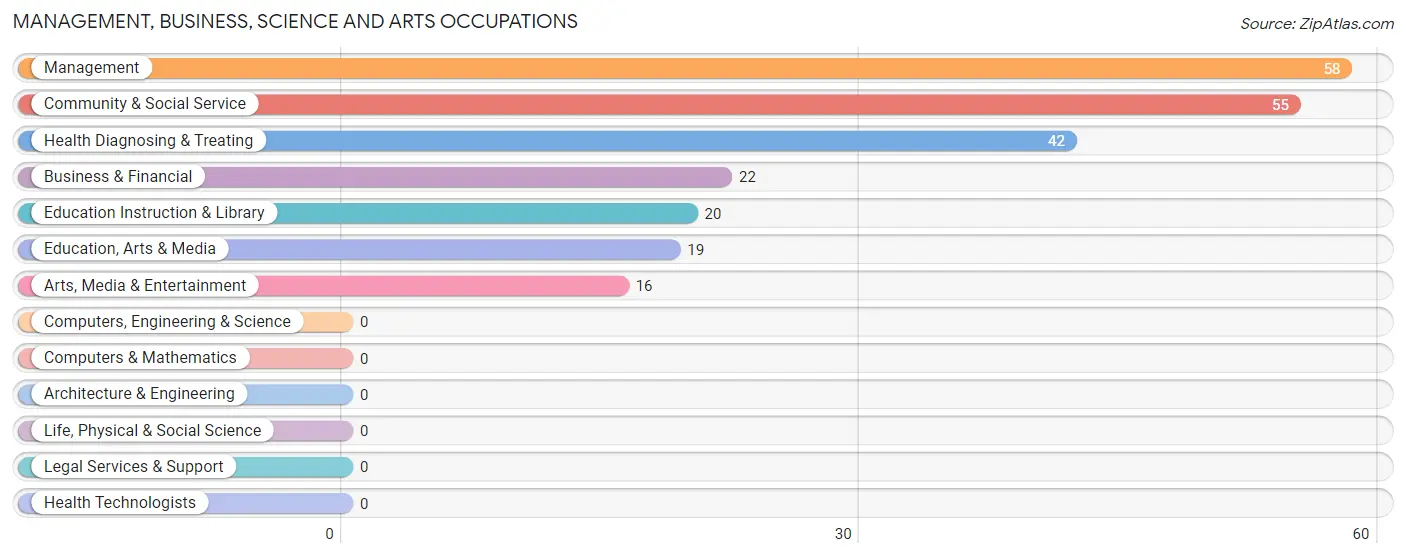
Management, Business, Science and Arts Occupations
The most common Management, Business, Science and Arts occupations in Taylorsville are Management (58 | 7.4%), Community & Social Service (55 | 7.0%), Health Diagnosing & Treating (42 | 5.4%), Business & Financial (22 | 2.8%), and Education Instruction & Library (20 | 2.6%).
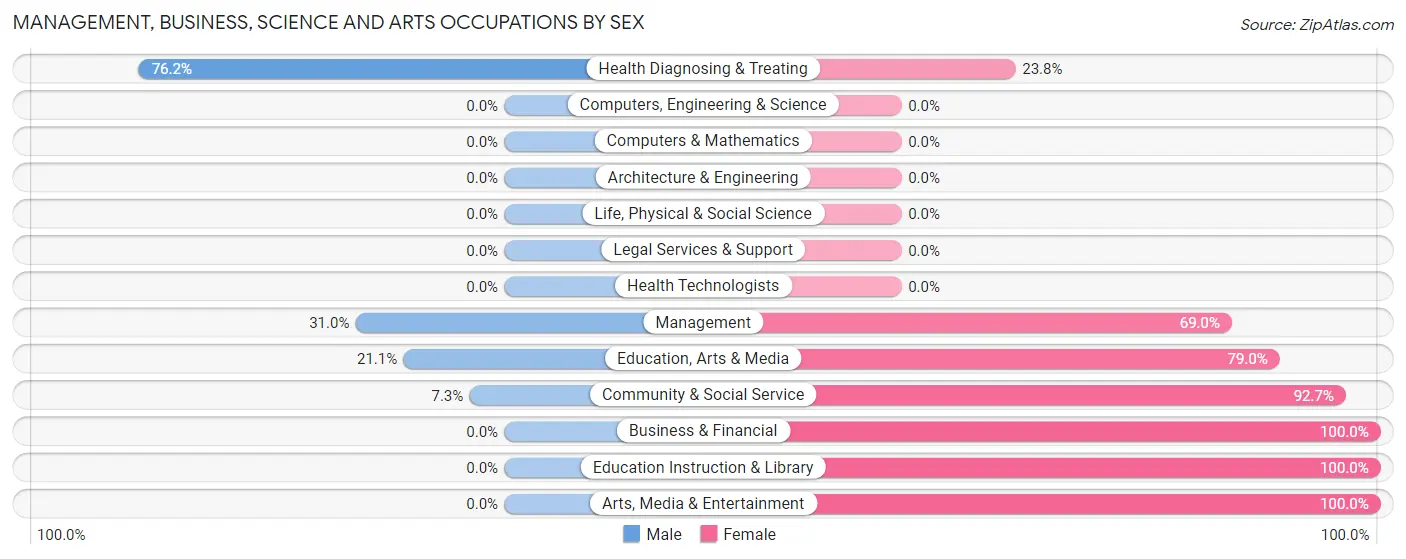
Management, Business, Science and Arts Occupations by Sex
Within the Management, Business, Science and Arts occupations in Taylorsville, the most male-oriented occupations are Health Diagnosing & Treating (76.2%), Management (31.0%), and Education, Arts & Media (21.0%), while the most female-oriented occupations are Business & Financial (100.0%), Education Instruction & Library (100.0%), and Arts, Media & Entertainment (100.0%).
| Occupation | Male | Female |
| Management | 18 (31.0%) | 40 (69.0%) |
| Business & Financial | 0 (0.0%) | 22 (100.0%) |
| Computers, Engineering & Science | 0 (0.0%) | 0 (0.0%) |
| Computers & Mathematics | 0 (0.0%) | 0 (0.0%) |
| Architecture & Engineering | 0 (0.0%) | 0 (0.0%) |
| Life, Physical & Social Science | 0 (0.0%) | 0 (0.0%) |
| Community & Social Service | 4 (7.3%) | 51 (92.7%) |
| Education, Arts & Media | 4 (21.0%) | 15 (78.9%) |
| Legal Services & Support | 0 (0.0%) | 0 (0.0%) |
| Education Instruction & Library | 0 (0.0%) | 20 (100.0%) |
| Arts, Media & Entertainment | 0 (0.0%) | 16 (100.0%) |
| Health Diagnosing & Treating | 32 (76.2%) | 10 (23.8%) |
| Health Technologists | 0 (0.0%) | 0 (0.0%) |
| Total (Category) | 54 (30.5%) | 123 (69.5%) |
| Total (Overall) | 402 (51.4%) | 380 (48.6%) |
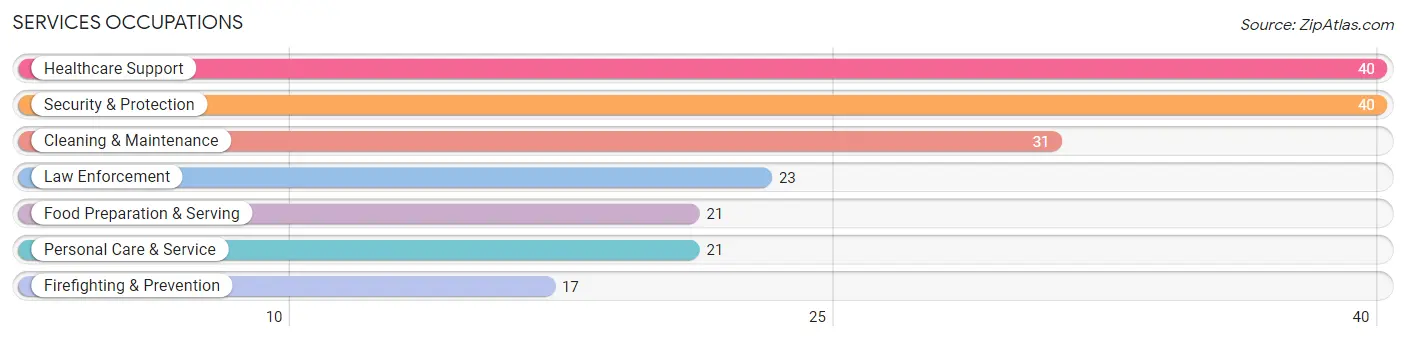
Services Occupations
The most common Services occupations in Taylorsville are Healthcare Support (40 | 5.1%), Security & Protection (40 | 5.1%), Cleaning & Maintenance (31 | 4.0%), Law Enforcement (23 | 2.9%), and Food Preparation & Serving (21 | 2.7%).
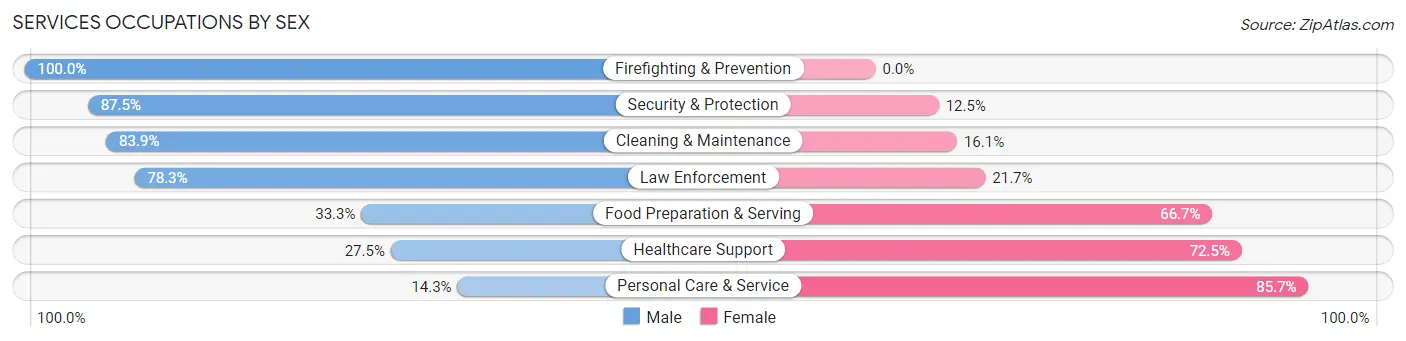
Services Occupations by Sex
Within the Services occupations in Taylorsville, the most male-oriented occupations are Firefighting & Prevention (100.0%), Security & Protection (87.5%), and Cleaning & Maintenance (83.9%), while the most female-oriented occupations are Personal Care & Service (85.7%), Healthcare Support (72.5%), and Food Preparation & Serving (66.7%).
| Occupation | Male | Female |
| Healthcare Support | 11 (27.5%) | 29 (72.5%) |
| Security & Protection | 35 (87.5%) | 5 (12.5%) |
| Firefighting & Prevention | 17 (100.0%) | 0 (0.0%) |
| Law Enforcement | 18 (78.3%) | 5 (21.7%) |
| Food Preparation & Serving | 7 (33.3%) | 14 (66.7%) |
| Cleaning & Maintenance | 26 (83.9%) | 5 (16.1%) |
| Personal Care & Service | 3 (14.3%) | 18 (85.7%) |
| Total (Category) | 82 (53.6%) | 71 (46.4%) |
| Total (Overall) | 402 (51.4%) | 380 (48.6%) |
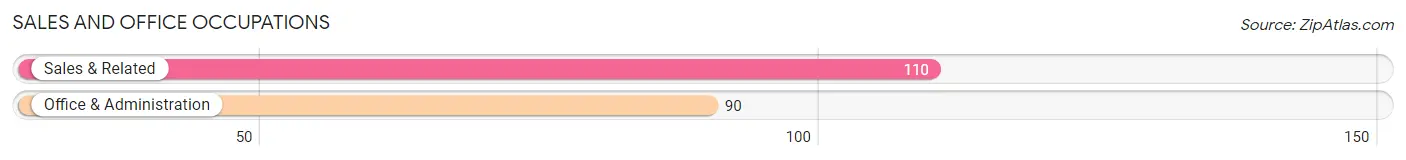
Sales and Office Occupations
The most common Sales and Office occupations in Taylorsville are Sales & Related (110 | 14.1%), and Office & Administration (90 | 11.5%).
Sales and Office Occupations by Sex
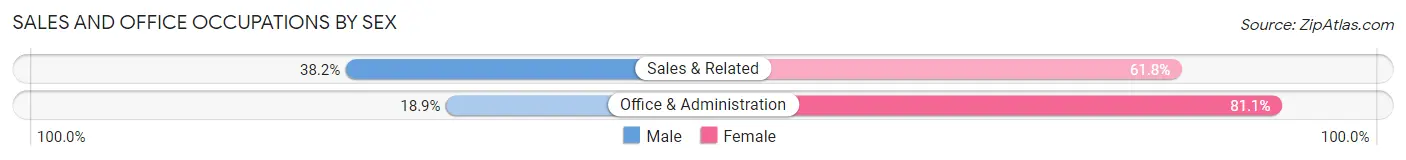
| Occupation | Male | Female |
| Sales & Related | 42 (38.2%) | 68 (61.8%) |
| Office & Administration | 17 (18.9%) | 73 (81.1%) |
| Total (Category) | 59 (29.5%) | 141 (70.5%) |
| Total (Overall) | 402 (51.4%) | 380 (48.6%) |
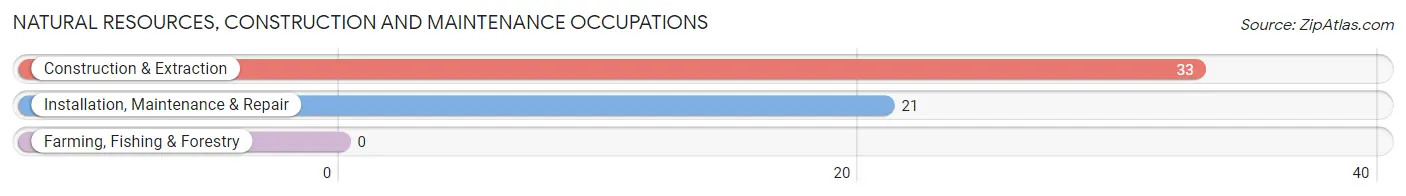
Natural Resources, Construction and Maintenance Occupations
The most common Natural Resources, Construction and Maintenance occupations in Taylorsville are Construction & Extraction (33 | 4.2%), and Installation, Maintenance & Repair (21 | 2.7%).
Natural Resources, Construction and Maintenance Occupations by Sex
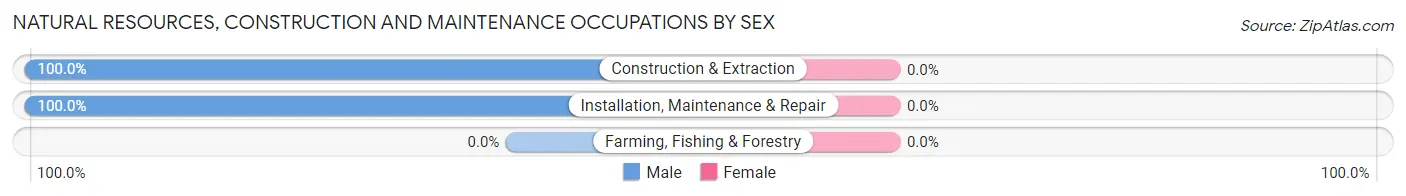
| Occupation | Male | Female |
| Farming, Fishing & Forestry | 0 (0.0%) | 0 (0.0%) |
| Construction & Extraction | 33 (100.0%) | 0 (0.0%) |
| Installation, Maintenance & Repair | 21 (100.0%) | 0 (0.0%) |
| Total (Category) | 54 (100.0%) | 0 (0.0%) |
| Total (Overall) | 402 (51.4%) | 380 (48.6%) |
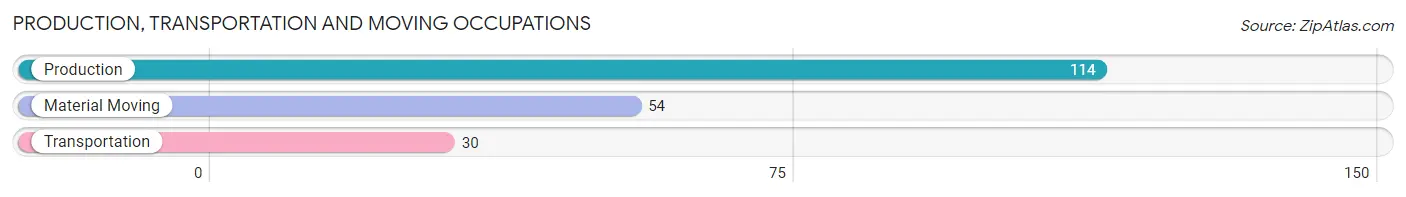
Production, Transportation and Moving Occupations
The most common Production, Transportation and Moving occupations in Taylorsville are Production (114 | 14.6%), Material Moving (54 | 6.9%), and Transportation (30 | 3.8%).
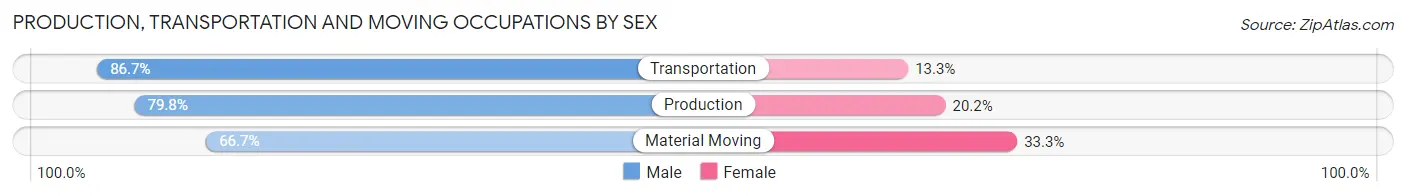
Production, Transportation and Moving Occupations by Sex
| Occupation | Male | Female |
| Production | 91 (79.8%) | 23 (20.2%) |
| Transportation | 26 (86.7%) | 4 (13.3%) |
| Material Moving | 36 (66.7%) | 18 (33.3%) |
| Total (Category) | 153 (77.3%) | 45 (22.7%) |
| Total (Overall) | 402 (51.4%) | 380 (48.6%) |
Employment Industries by Sex in Taylorsville
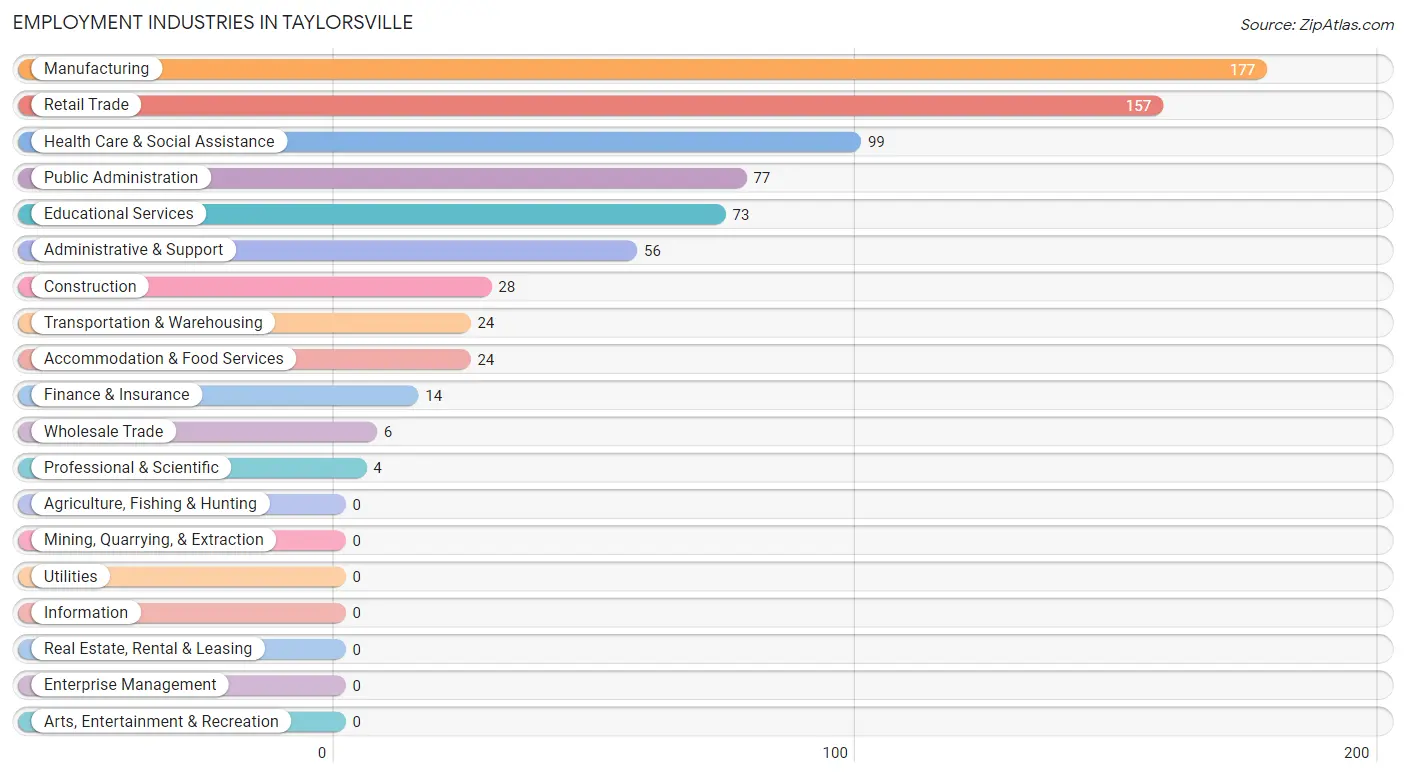
Employment Industries in Taylorsville
The major employment industries in Taylorsville include Manufacturing (177 | 22.6%), Retail Trade (157 | 20.1%), Health Care & Social Assistance (99 | 12.7%), Public Administration (77 | 9.9%), and Educational Services (73 | 9.3%).
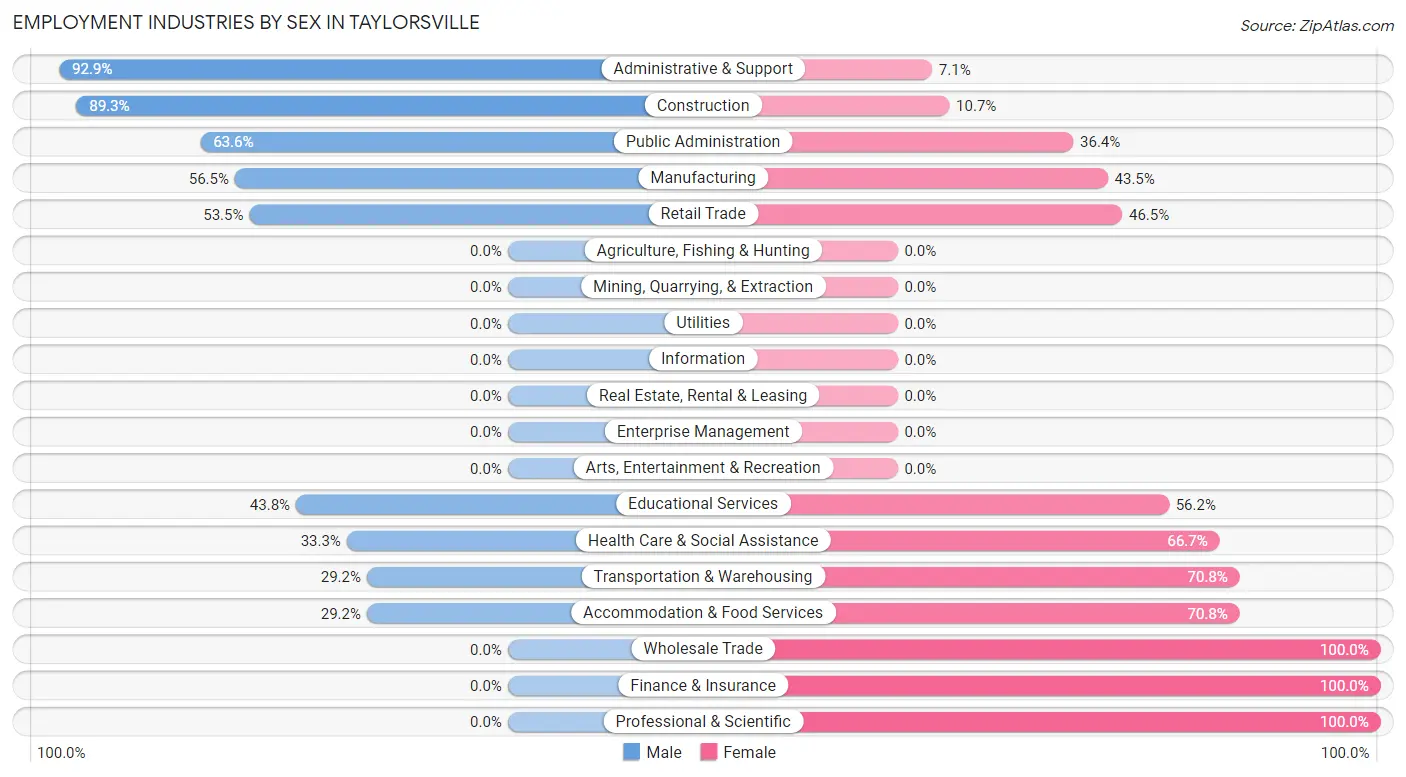
Employment Industries by Sex in Taylorsville
The Taylorsville industries that see more men than women are Administrative & Support (92.9%), Construction (89.3%), and Public Administration (63.6%), whereas the industries that tend to have a higher number of women are Wholesale Trade (100.0%), Finance & Insurance (100.0%), and Professional & Scientific (100.0%).
| Industry | Male | Female |
| Agriculture, Fishing & Hunting | 0 (0.0%) | 0 (0.0%) |
| Mining, Quarrying, & Extraction | 0 (0.0%) | 0 (0.0%) |
| Construction | 25 (89.3%) | 3 (10.7%) |
| Manufacturing | 100 (56.5%) | 77 (43.5%) |
| Wholesale Trade | 0 (0.0%) | 6 (100.0%) |
| Retail Trade | 84 (53.5%) | 73 (46.5%) |
| Transportation & Warehousing | 7 (29.2%) | 17 (70.8%) |
| Utilities | 0 (0.0%) | 0 (0.0%) |
| Information | 0 (0.0%) | 0 (0.0%) |
| Finance & Insurance | 0 (0.0%) | 14 (100.0%) |
| Real Estate, Rental & Leasing | 0 (0.0%) | 0 (0.0%) |
| Professional & Scientific | 0 (0.0%) | 4 (100.0%) |
| Enterprise Management | 0 (0.0%) | 0 (0.0%) |
| Administrative & Support | 52 (92.9%) | 4 (7.1%) |
| Educational Services | 32 (43.8%) | 41 (56.2%) |
| Health Care & Social Assistance | 33 (33.3%) | 66 (66.7%) |
| Arts, Entertainment & Recreation | 0 (0.0%) | 0 (0.0%) |
| Accommodation & Food Services | 7 (29.2%) | 17 (70.8%) |
| Public Administration | 49 (63.6%) | 28 (36.4%) |
| Total | 402 (51.4%) | 380 (48.6%) |
Education in Taylorsville
School Enrollment in Taylorsville
The most common levels of schooling among the 266 students in Taylorsville are college / undergraduate (86 | 32.3%), middle school (61 | 22.9%), and high school (58 | 21.8%).
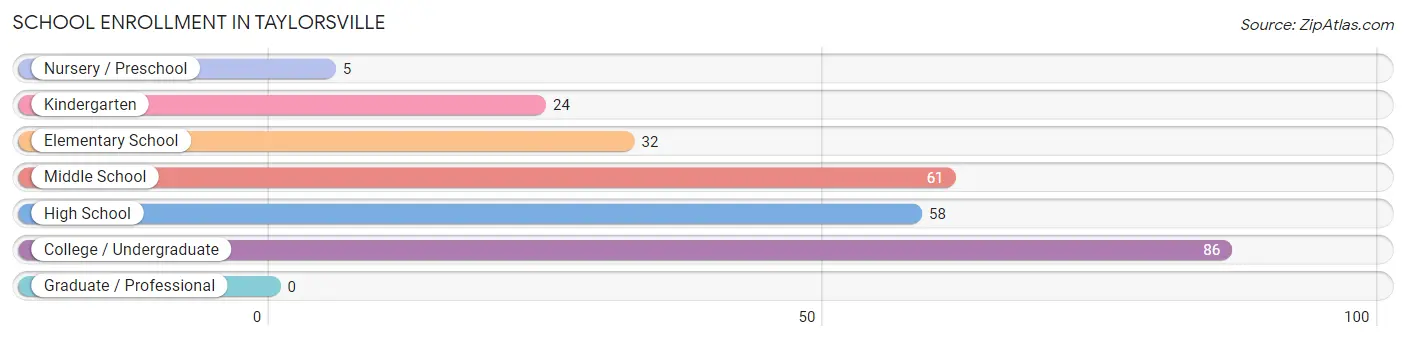
| School Level | # Students | % Students |
| Nursery / Preschool | 5 | 1.9% |
| Kindergarten | 24 | 9.0% |
| Elementary School | 32 | 12.0% |
| Middle School | 61 | 22.9% |
| High School | 58 | 21.8% |
| College / Undergraduate | 86 | 32.3% |
| Graduate / Professional | 0 | 0.0% |
| Total | 266 | 100.0% |
School Enrollment by Age by Funding Source in Taylorsville
Out of a total of 266 students who are enrolled in schools in Taylorsville, 96 (36.1%) attend a private institution, while the remaining 170 (63.9%) are enrolled in public schools. The age group of 20 to 24 year olds has the highest likelihood of being enrolled in private schools, with 72 (90.0% in the age bracket) enrolled. Conversely, the age group of 18 to 19 year olds has the lowest likelihood of being enrolled in a private school, with 24 (100.0% in the age bracket) attending a public institution.
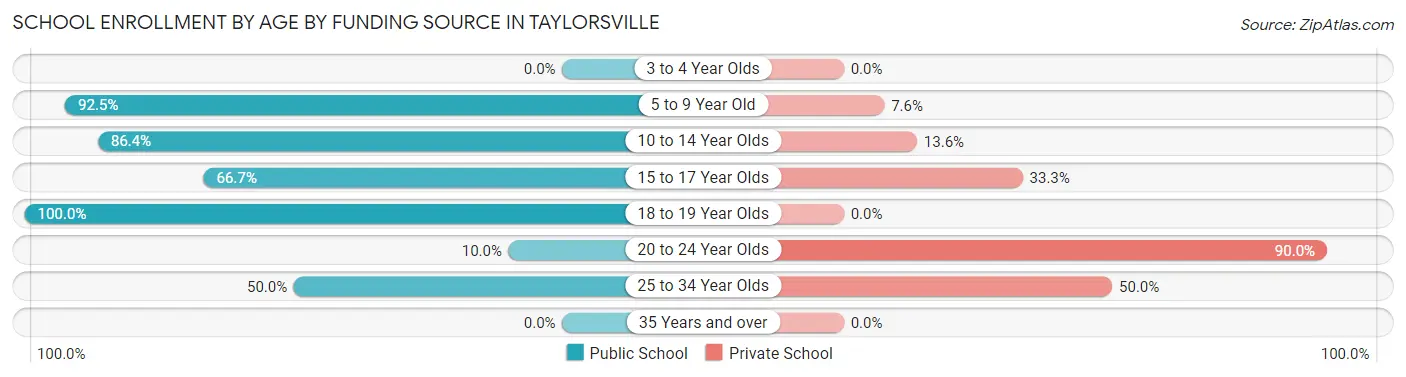
| Age Bracket | Public School | Private School |
| 3 to 4 Year Olds | 0 (0.0%) | 0 (0.0%) |
| 5 to 9 Year Old | 49 (92.4%) | 4 (7.5%) |
| 10 to 14 Year Olds | 76 (86.4%) | 12 (13.6%) |
| 15 to 17 Year Olds | 10 (66.7%) | 5 (33.3%) |
| 18 to 19 Year Olds | 24 (100.0%) | 0 (0.0%) |
| 20 to 24 Year Olds | 8 (10.0%) | 72 (90.0%) |
| 25 to 34 Year Olds | 3 (50.0%) | 3 (50.0%) |
| 35 Years and over | 0 (0.0%) | 0 (0.0%) |
| Total | 170 (63.9%) | 96 (36.1%) |
Educational Attainment by Field of Study in Taylorsville
Education (66 | 26.2%), arts & humanities (57 | 22.6%), science & technology (47 | 18.6%), business (29 | 11.5%), and engineering (14 | 5.6%) are the most common fields of study among 252 individuals in Taylorsville who have obtained a bachelor's degree or higher.
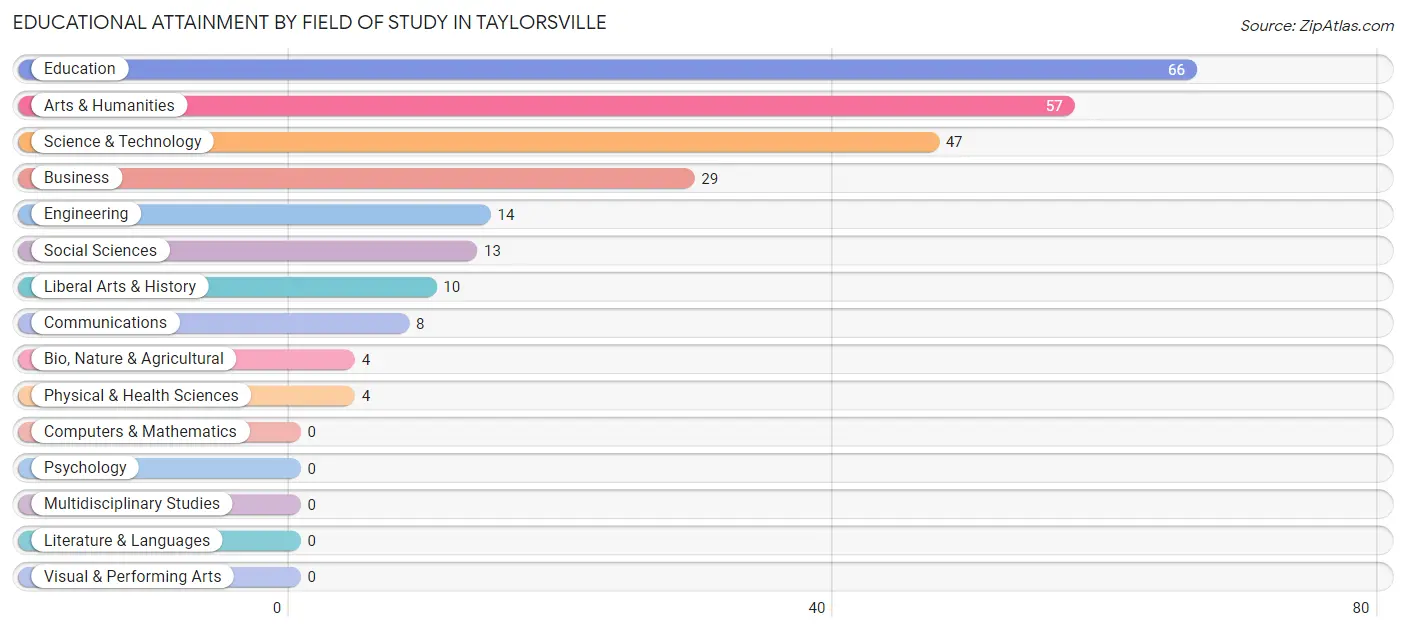
| Field of Study | # Graduates | % Graduates |
| Computers & Mathematics | 0 | 0.0% |
| Bio, Nature & Agricultural | 4 | 1.6% |
| Physical & Health Sciences | 4 | 1.6% |
| Psychology | 0 | 0.0% |
| Social Sciences | 13 | 5.2% |
| Engineering | 14 | 5.6% |
| Multidisciplinary Studies | 0 | 0.0% |
| Science & Technology | 47 | 18.6% |
| Business | 29 | 11.5% |
| Education | 66 | 26.2% |
| Literature & Languages | 0 | 0.0% |
| Liberal Arts & History | 10 | 4.0% |
| Visual & Performing Arts | 0 | 0.0% |
| Communications | 8 | 3.2% |
| Arts & Humanities | 57 | 22.6% |
| Total | 252 | 100.0% |
Transportation & Commute in Taylorsville
Vehicle Availability by Sex in Taylorsville
The most prevalent vehicle ownership categories in Taylorsville are males with 2 vehicles (150, accounting for 37.7%) and females with 2 vehicles (117, making up 39.7%).
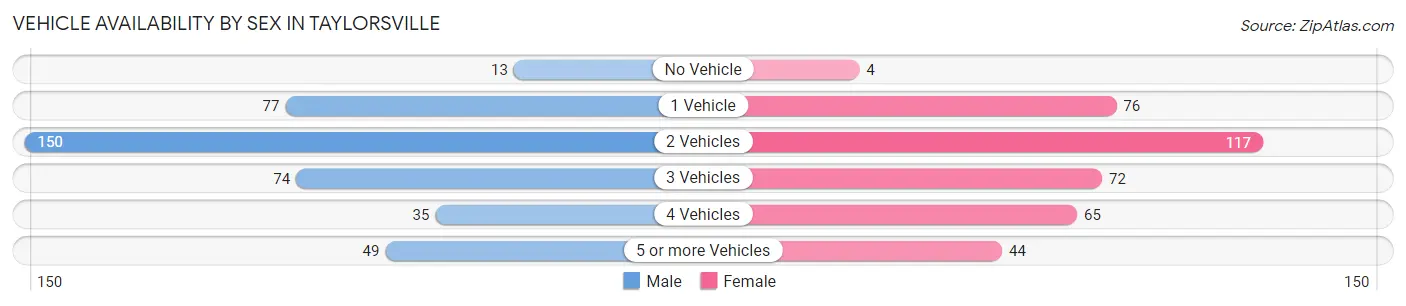
| Vehicles Available | Male | Female |
| No Vehicle | 13 (3.3%) | 4 (1.1%) |
| 1 Vehicle | 77 (19.4%) | 76 (20.1%) |
| 2 Vehicles | 150 (37.7%) | 117 (30.9%) |
| 3 Vehicles | 74 (18.6%) | 72 (19.1%) |
| 4 Vehicles | 35 (8.8%) | 65 (17.2%) |
| 5 or more Vehicles | 49 (12.3%) | 44 (11.6%) |
| Total | 398 (100.0%) | 378 (100.0%) |
Commute Time in Taylorsville
The most frequently occuring commute durations in Taylorsville are 5 to 9 minutes (154 commuters, 19.9%), 15 to 19 minutes (101 commuters, 13.1%), and 30 to 34 minutes (100 commuters, 12.9%).
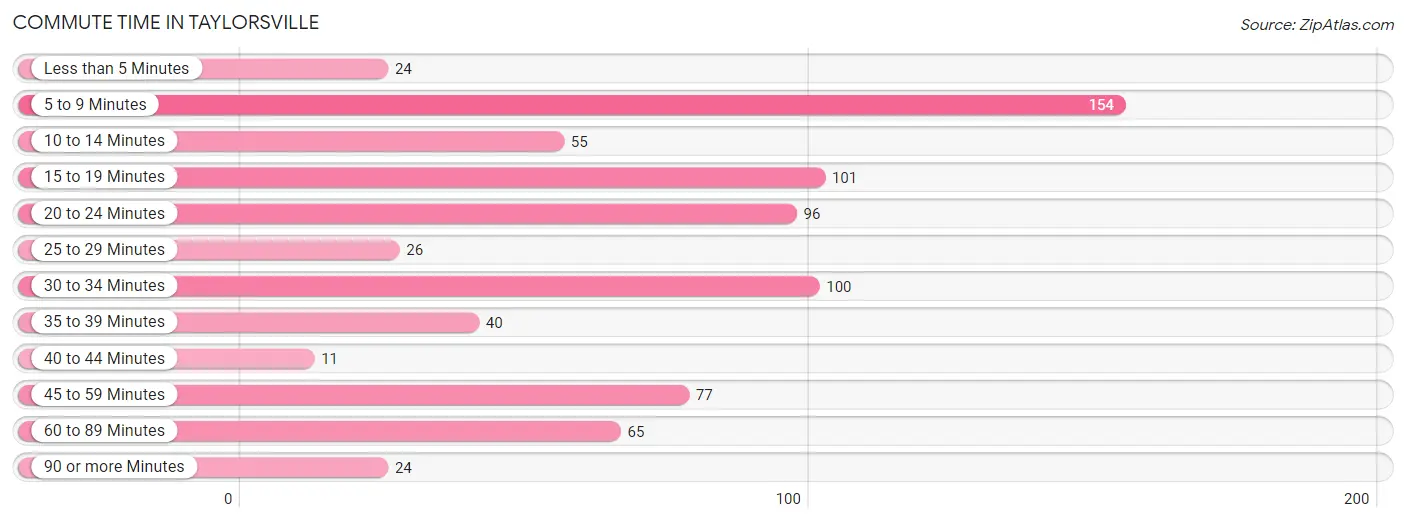
| Commute Time | # Commuters | % Commuters |
| Less than 5 Minutes | 24 | 3.1% |
| 5 to 9 Minutes | 154 | 19.9% |
| 10 to 14 Minutes | 55 | 7.1% |
| 15 to 19 Minutes | 101 | 13.1% |
| 20 to 24 Minutes | 96 | 12.4% |
| 25 to 29 Minutes | 26 | 3.4% |
| 30 to 34 Minutes | 100 | 12.9% |
| 35 to 39 Minutes | 40 | 5.2% |
| 40 to 44 Minutes | 11 | 1.4% |
| 45 to 59 Minutes | 77 | 10.0% |
| 60 to 89 Minutes | 65 | 8.4% |
| 90 or more Minutes | 24 | 3.1% |
Commute Time by Sex in Taylorsville
The most common commute times in Taylorsville are 5 to 9 minutes (90 commuters, 22.4%) for males and 5 to 9 minutes (64 commuters, 17.2%) for females.
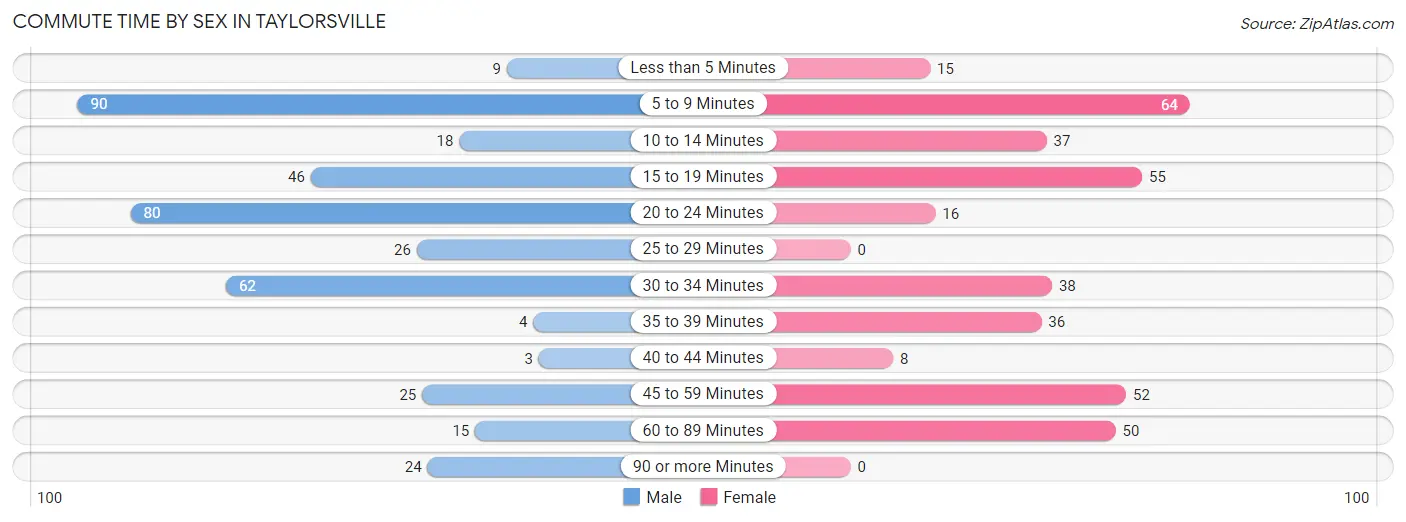
| Commute Time | Male | Female |
| Less than 5 Minutes | 9 (2.2%) | 15 (4.0%) |
| 5 to 9 Minutes | 90 (22.4%) | 64 (17.2%) |
| 10 to 14 Minutes | 18 (4.5%) | 37 (10.0%) |
| 15 to 19 Minutes | 46 (11.4%) | 55 (14.8%) |
| 20 to 24 Minutes | 80 (19.9%) | 16 (4.3%) |
| 25 to 29 Minutes | 26 (6.5%) | 0 (0.0%) |
| 30 to 34 Minutes | 62 (15.4%) | 38 (10.2%) |
| 35 to 39 Minutes | 4 (1.0%) | 36 (9.7%) |
| 40 to 44 Minutes | 3 (0.7%) | 8 (2.2%) |
| 45 to 59 Minutes | 25 (6.2%) | 52 (14.0%) |
| 60 to 89 Minutes | 15 (3.7%) | 50 (13.5%) |
| 90 or more Minutes | 24 (6.0%) | 0 (0.0%) |
Time of Departure to Work by Sex in Taylorsville
The most frequent times of departure to work in Taylorsville are 9:00 AM to 9:59 AM (54, 13.4%) for males and 12:00 PM to 3:59 PM (91, 24.5%) for females.
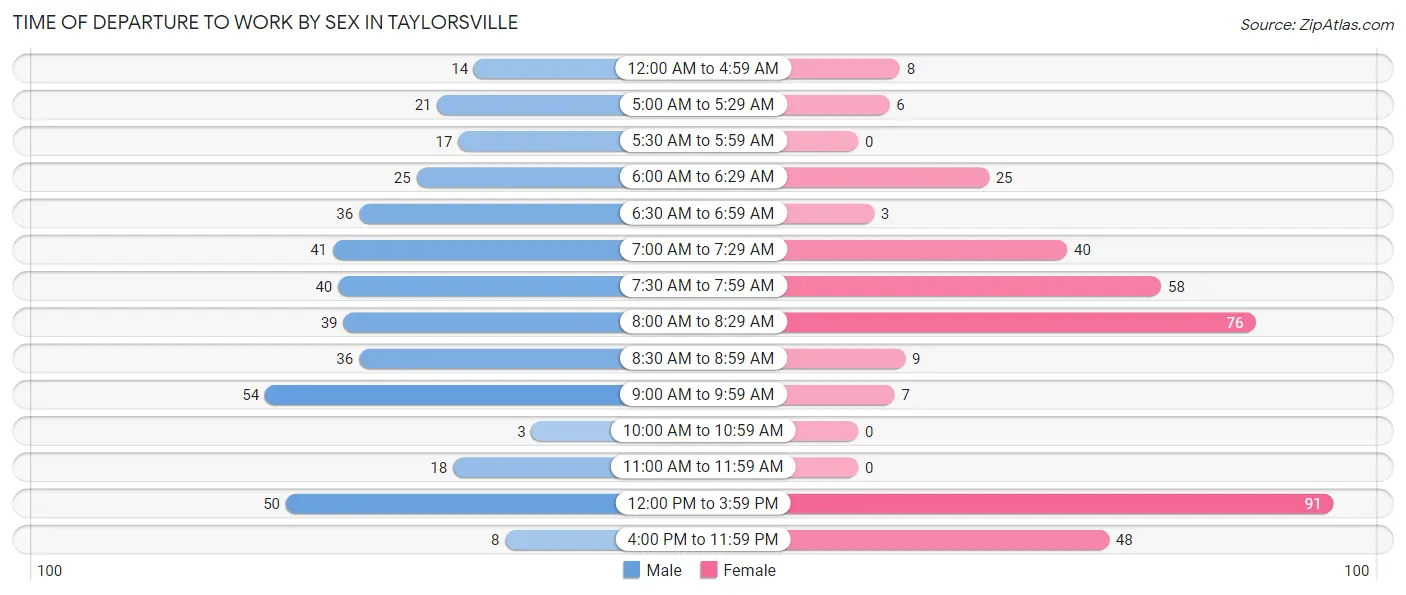
| Time of Departure | Male | Female |
| 12:00 AM to 4:59 AM | 14 (3.5%) | 8 (2.2%) |
| 5:00 AM to 5:29 AM | 21 (5.2%) | 6 (1.6%) |
| 5:30 AM to 5:59 AM | 17 (4.2%) | 0 (0.0%) |
| 6:00 AM to 6:29 AM | 25 (6.2%) | 25 (6.7%) |
| 6:30 AM to 6:59 AM | 36 (9.0%) | 3 (0.8%) |
| 7:00 AM to 7:29 AM | 41 (10.2%) | 40 (10.8%) |
| 7:30 AM to 7:59 AM | 40 (10.0%) | 58 (15.6%) |
| 8:00 AM to 8:29 AM | 39 (9.7%) | 76 (20.5%) |
| 8:30 AM to 8:59 AM | 36 (9.0%) | 9 (2.4%) |
| 9:00 AM to 9:59 AM | 54 (13.4%) | 7 (1.9%) |
| 10:00 AM to 10:59 AM | 3 (0.7%) | 0 (0.0%) |
| 11:00 AM to 11:59 AM | 18 (4.5%) | 0 (0.0%) |
| 12:00 PM to 3:59 PM | 50 (12.4%) | 91 (24.5%) |
| 4:00 PM to 11:59 PM | 8 (2.0%) | 48 (12.9%) |
| Total | 402 (100.0%) | 371 (100.0%) |
Housing Occupancy in Taylorsville
Occupancy by Ownership in Taylorsville
Of the total 857 dwellings in Taylorsville, owner-occupied units account for 499 (58.2%), while renter-occupied units make up 358 (41.8%).
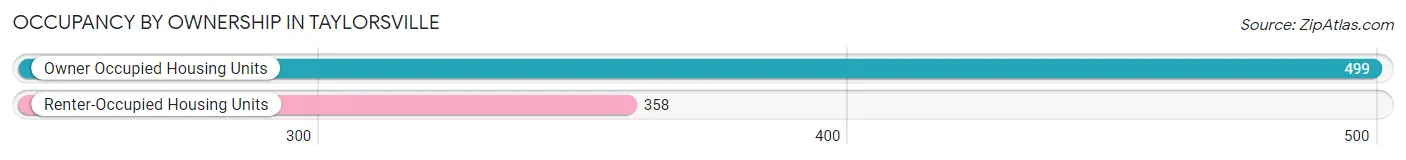
| Occupancy | # Housing Units | % Housing Units |
| Owner Occupied Housing Units | 499 | 58.2% |
| Renter-Occupied Housing Units | 358 | 41.8% |
| Total Occupied Housing Units | 857 | 100.0% |
Occupancy by Household Size in Taylorsville
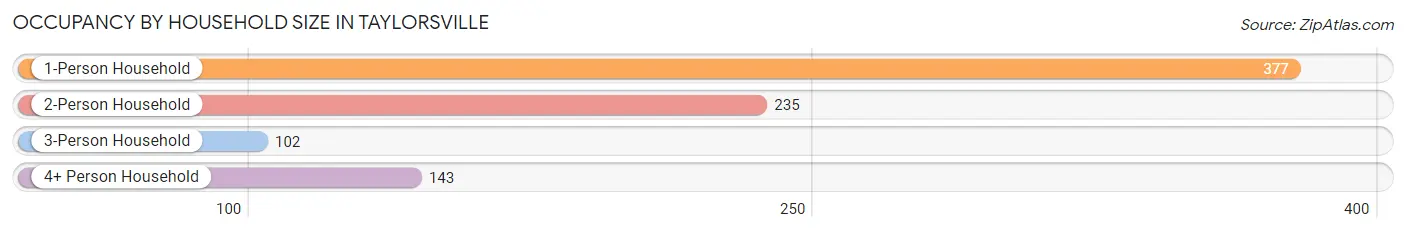
| Household Size | # Housing Units | % Housing Units |
| 1-Person Household | 377 | 44.0% |
| 2-Person Household | 235 | 27.4% |
| 3-Person Household | 102 | 11.9% |
| 4+ Person Household | 143 | 16.7% |
| Total Housing Units | 857 | 100.0% |
Occupancy by Ownership by Household Size in Taylorsville
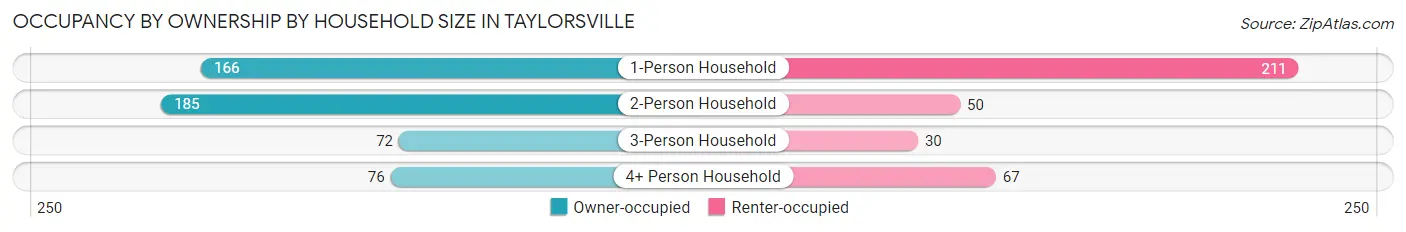
| Household Size | Owner-occupied | Renter-occupied |
| 1-Person Household | 166 (44.0%) | 211 (56.0%) |
| 2-Person Household | 185 (78.7%) | 50 (21.3%) |
| 3-Person Household | 72 (70.6%) | 30 (29.4%) |
| 4+ Person Household | 76 (53.1%) | 67 (46.9%) |
| Total Housing Units | 499 (58.2%) | 358 (41.8%) |
Occupancy by Educational Attainment in Taylorsville
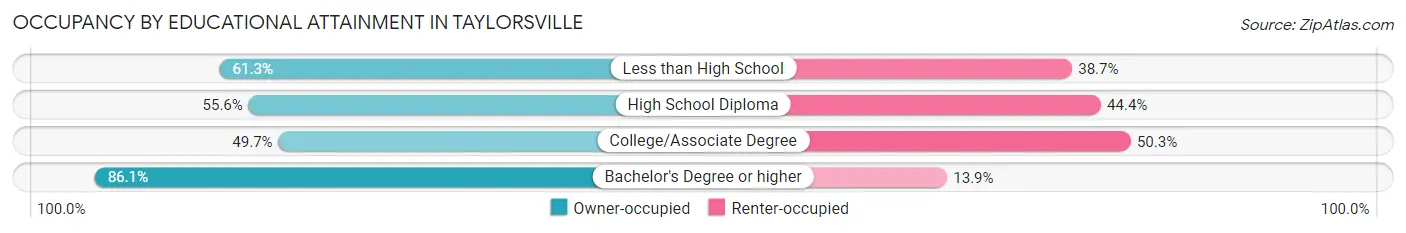
| Household Size | Owner-occupied | Renter-occupied |
| Less than High School | 65 (61.3%) | 41 (38.7%) |
| High School Diploma | 179 (55.6%) | 143 (44.4%) |
| College/Associate Degree | 156 (49.7%) | 158 (50.3%) |
| Bachelor's Degree or higher | 99 (86.1%) | 16 (13.9%) |
Occupancy by Age of Householder in Taylorsville
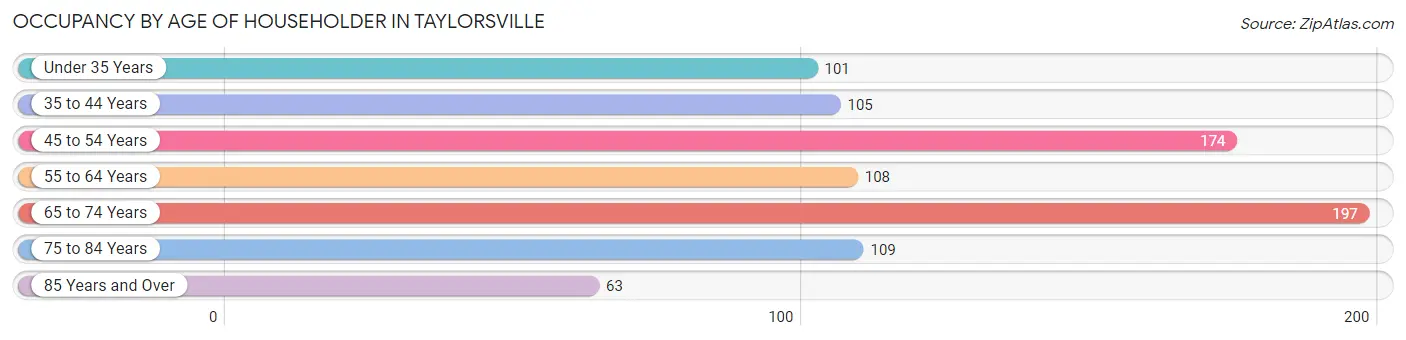
| Age Bracket | # Households | % Households |
| Under 35 Years | 101 | 11.8% |
| 35 to 44 Years | 105 | 12.2% |
| 45 to 54 Years | 174 | 20.3% |
| 55 to 64 Years | 108 | 12.6% |
| 65 to 74 Years | 197 | 23.0% |
| 75 to 84 Years | 109 | 12.7% |
| 85 Years and Over | 63 | 7.3% |
| Total | 857 | 100.0% |
Housing Finances in Taylorsville
Median Income by Occupancy in Taylorsville
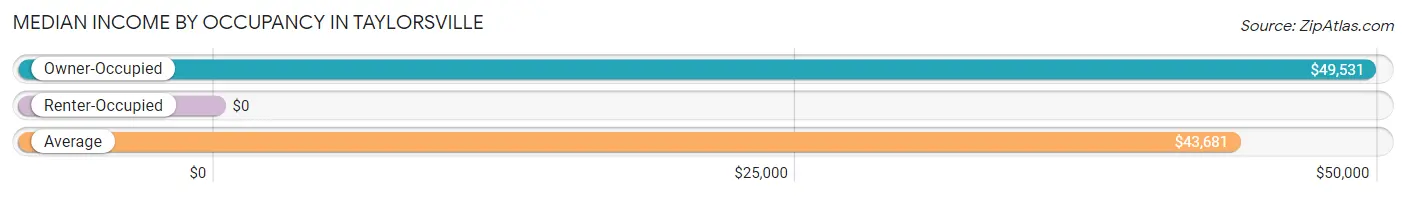
| Occupancy Type | # Households | Median Income |
| Owner-Occupied | 499 (58.2%) | $49,531 |
| Renter-Occupied | 358 (41.8%) | $0 |
| Average | 857 (100.0%) | $43,681 |
Occupancy by Householder Income Bracket in Taylorsville
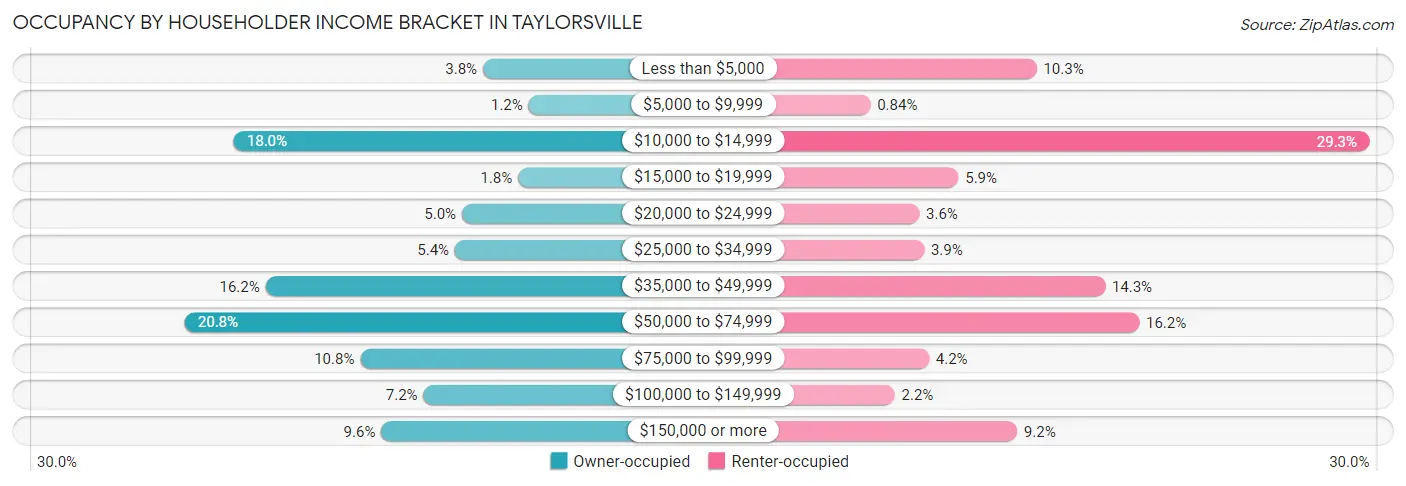
| Income Bracket | Owner-occupied | Renter-occupied |
| Less than $5,000 | 19 (3.8%) | 37 (10.3%) |
| $5,000 to $9,999 | 6 (1.2%) | 3 (0.8%) |
| $10,000 to $14,999 | 90 (18.0%) | 105 (29.3%) |
| $15,000 to $19,999 | 9 (1.8%) | 21 (5.9%) |
| $20,000 to $24,999 | 25 (5.0%) | 13 (3.6%) |
| $25,000 to $34,999 | 27 (5.4%) | 14 (3.9%) |
| $35,000 to $49,999 | 81 (16.2%) | 51 (14.2%) |
| $50,000 to $74,999 | 104 (20.8%) | 58 (16.2%) |
| $75,000 to $99,999 | 54 (10.8%) | 15 (4.2%) |
| $100,000 to $149,999 | 36 (7.2%) | 8 (2.2%) |
| $150,000 or more | 48 (9.6%) | 33 (9.2%) |
| Total | 499 (100.0%) | 358 (100.0%) |
Monthly Housing Cost Tiers in Taylorsville
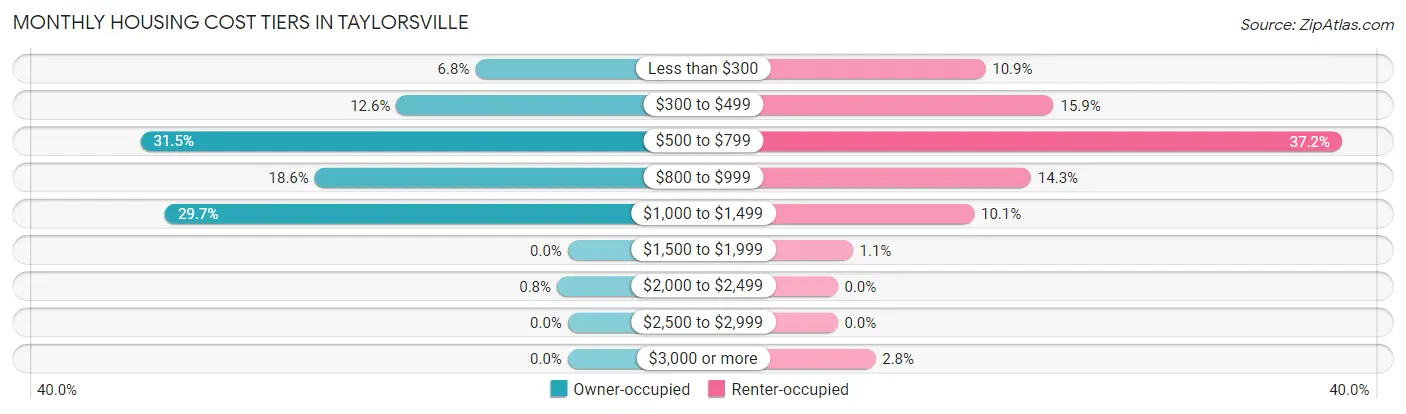
| Monthly Cost | Owner-occupied | Renter-occupied |
| Less than $300 | 34 (6.8%) | 39 (10.9%) |
| $300 to $499 | 63 (12.6%) | 57 (15.9%) |
| $500 to $799 | 157 (31.5%) | 133 (37.1%) |
| $800 to $999 | 93 (18.6%) | 51 (14.2%) |
| $1,000 to $1,499 | 148 (29.7%) | 36 (10.1%) |
| $1,500 to $1,999 | 0 (0.0%) | 4 (1.1%) |
| $2,000 to $2,499 | 4 (0.8%) | 0 (0.0%) |
| $2,500 to $2,999 | 0 (0.0%) | 0 (0.0%) |
| $3,000 or more | 0 (0.0%) | 10 (2.8%) |
| Total | 499 (100.0%) | 358 (100.0%) |
Physical Housing Characteristics in Taylorsville
Housing Structures in Taylorsville
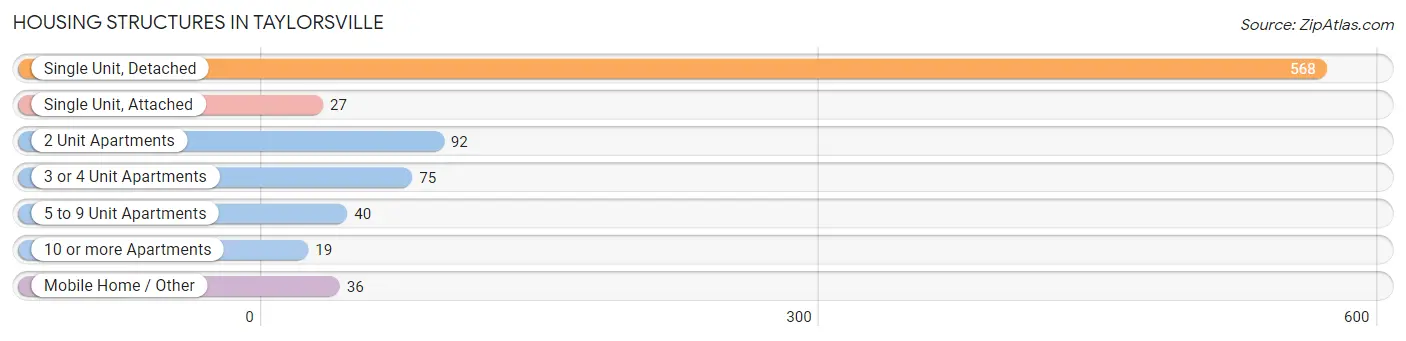
| Structure Type | # Housing Units | % Housing Units |
| Single Unit, Detached | 568 | 66.3% |
| Single Unit, Attached | 27 | 3.2% |
| 2 Unit Apartments | 92 | 10.7% |
| 3 or 4 Unit Apartments | 75 | 8.7% |
| 5 to 9 Unit Apartments | 40 | 4.7% |
| 10 or more Apartments | 19 | 2.2% |
| Mobile Home / Other | 36 | 4.2% |
| Total | 857 | 100.0% |
Housing Structures by Occupancy in Taylorsville
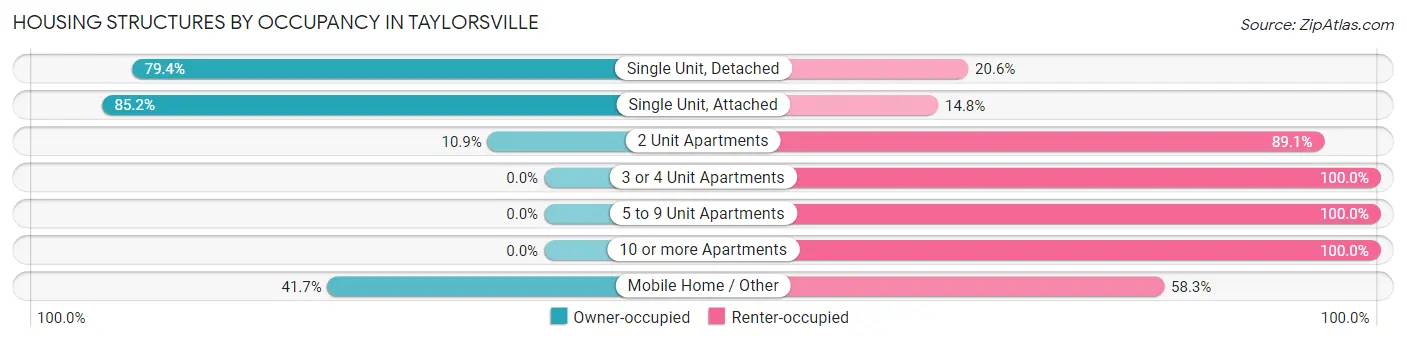
| Structure Type | Owner-occupied | Renter-occupied |
| Single Unit, Detached | 451 (79.4%) | 117 (20.6%) |
| Single Unit, Attached | 23 (85.2%) | 4 (14.8%) |
| 2 Unit Apartments | 10 (10.9%) | 82 (89.1%) |
| 3 or 4 Unit Apartments | 0 (0.0%) | 75 (100.0%) |
| 5 to 9 Unit Apartments | 0 (0.0%) | 40 (100.0%) |
| 10 or more Apartments | 0 (0.0%) | 19 (100.0%) |
| Mobile Home / Other | 15 (41.7%) | 21 (58.3%) |
| Total | 499 (58.2%) | 358 (41.8%) |
Housing Structures by Number of Rooms in Taylorsville
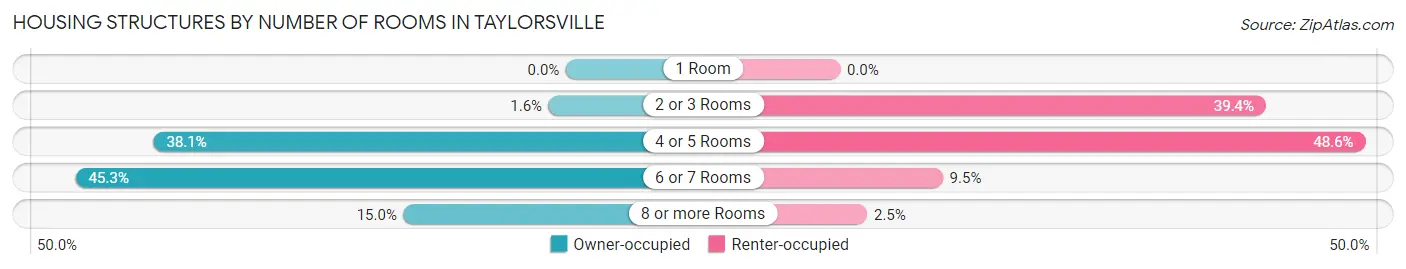
| Number of Rooms | Owner-occupied | Renter-occupied |
| 1 Room | 0 (0.0%) | 0 (0.0%) |
| 2 or 3 Rooms | 8 (1.6%) | 141 (39.4%) |
| 4 or 5 Rooms | 190 (38.1%) | 174 (48.6%) |
| 6 or 7 Rooms | 226 (45.3%) | 34 (9.5%) |
| 8 or more Rooms | 75 (15.0%) | 9 (2.5%) |
| Total | 499 (100.0%) | 358 (100.0%) |
Housing Structure by Heating Type in Taylorsville
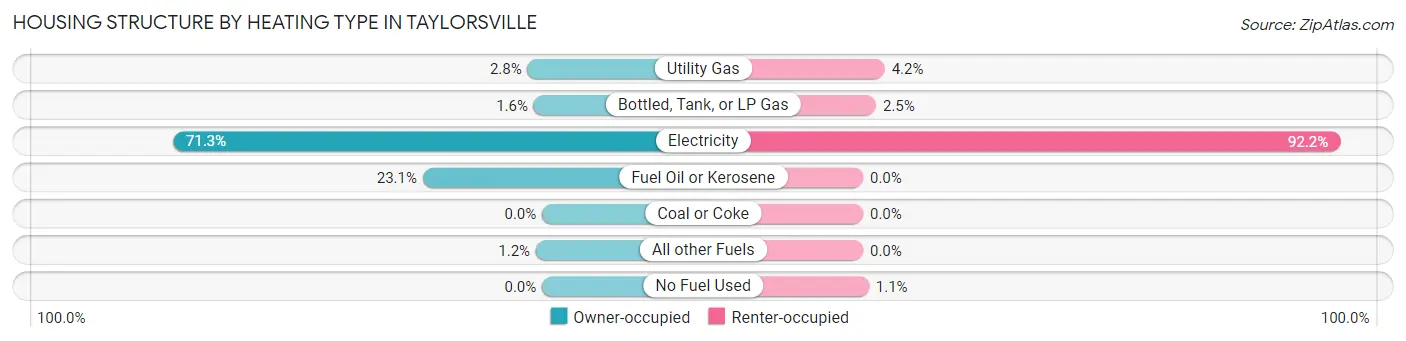
| Heating Type | Owner-occupied | Renter-occupied |
| Utility Gas | 14 (2.8%) | 15 (4.2%) |
| Bottled, Tank, or LP Gas | 8 (1.6%) | 9 (2.5%) |
| Electricity | 356 (71.3%) | 330 (92.2%) |
| Fuel Oil or Kerosene | 115 (23.1%) | 0 (0.0%) |
| Coal or Coke | 0 (0.0%) | 0 (0.0%) |
| All other Fuels | 6 (1.2%) | 0 (0.0%) |
| No Fuel Used | 0 (0.0%) | 4 (1.1%) |
| Total | 499 (100.0%) | 358 (100.0%) |
Household Vehicle Usage in Taylorsville
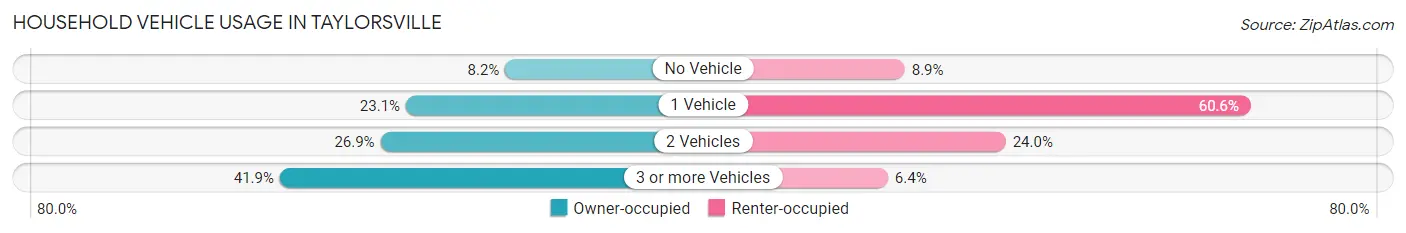
| Vehicles per Household | Owner-occupied | Renter-occupied |
| No Vehicle | 41 (8.2%) | 32 (8.9%) |
| 1 Vehicle | 115 (23.1%) | 217 (60.6%) |
| 2 Vehicles | 134 (26.9%) | 86 (24.0%) |
| 3 or more Vehicles | 209 (41.9%) | 23 (6.4%) |
| Total | 499 (100.0%) | 358 (100.0%) |
Real Estate & Mortgages in Taylorsville
Real Estate and Mortgage Overview in Taylorsville
| Characteristic | Without Mortgage | With Mortgage |
| Housing Units | 237 | 262 |
| Median Property Value | $191,100 | $155,600 |
| Median Household Income | $41,406 | $21 |
| Monthly Housing Costs | $520 | $0 |
| Real Estate Taxes | $1,698 | $0 |
Property Value by Mortgage Status in Taylorsville
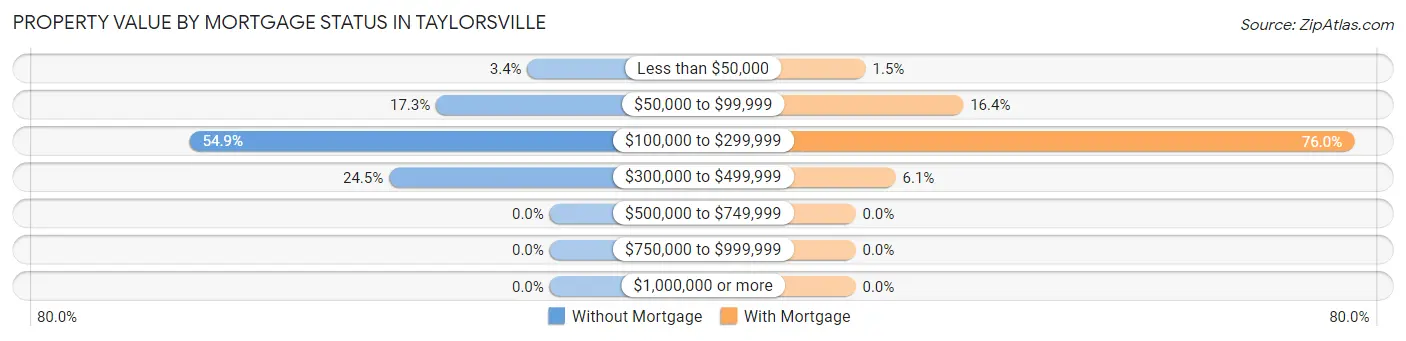
| Property Value | Without Mortgage | With Mortgage |
| Less than $50,000 | 8 (3.4%) | 4 (1.5%) |
| $50,000 to $99,999 | 41 (17.3%) | 43 (16.4%) |
| $100,000 to $299,999 | 130 (54.8%) | 199 (75.9%) |
| $300,000 to $499,999 | 58 (24.5%) | 16 (6.1%) |
| $500,000 to $749,999 | 0 (0.0%) | 0 (0.0%) |
| $750,000 to $999,999 | 0 (0.0%) | 0 (0.0%) |
| $1,000,000 or more | 0 (0.0%) | 0 (0.0%) |
| Total | 237 (100.0%) | 262 (100.0%) |
Household Income by Mortgage Status in Taylorsville
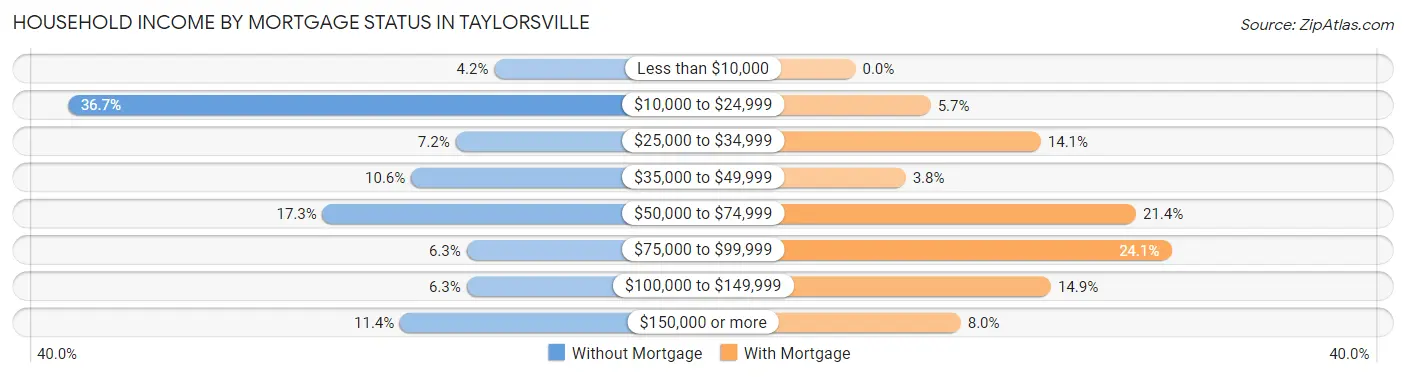
| Household Income | Without Mortgage | With Mortgage |
| Less than $10,000 | 10 (4.2%) | 0 (0.0%) |
| $10,000 to $24,999 | 87 (36.7%) | 15 (5.7%) |
| $25,000 to $34,999 | 17 (7.2%) | 37 (14.1%) |
| $35,000 to $49,999 | 25 (10.5%) | 10 (3.8%) |
| $50,000 to $74,999 | 41 (17.3%) | 56 (21.4%) |
| $75,000 to $99,999 | 15 (6.3%) | 63 (24.0%) |
| $100,000 to $149,999 | 15 (6.3%) | 39 (14.9%) |
| $150,000 or more | 27 (11.4%) | 21 (8.0%) |
| Total | 237 (100.0%) | 262 (100.0%) |
Property Value to Household Income Ratio in Taylorsville
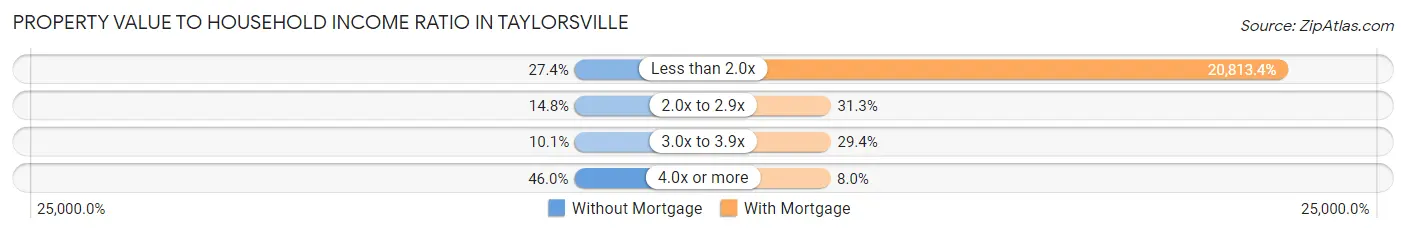
| Value-to-Income Ratio | Without Mortgage | With Mortgage |
| Less than 2.0x | 65 (27.4%) | 54,531 (20,813.4%) |
| 2.0x to 2.9x | 35 (14.8%) | 82 (31.3%) |
| 3.0x to 3.9x | 24 (10.1%) | 77 (29.4%) |
| 4.0x or more | 109 (46.0%) | 21 (8.0%) |
| Total | 237 (100.0%) | 262 (100.0%) |
Real Estate Taxes by Mortgage Status in Taylorsville
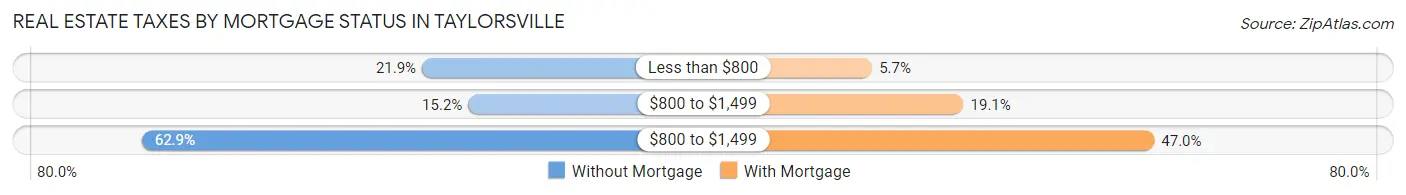
| Property Taxes | Without Mortgage | With Mortgage |
| Less than $800 | 52 (21.9%) | 15 (5.7%) |
| $800 to $1,499 | 36 (15.2%) | 50 (19.1%) |
| $800 to $1,499 | 149 (62.9%) | 123 (46.9%) |
| Total | 237 (100.0%) | 262 (100.0%) |
Health & Disability in Taylorsville
Health Insurance Coverage by Age in Taylorsville
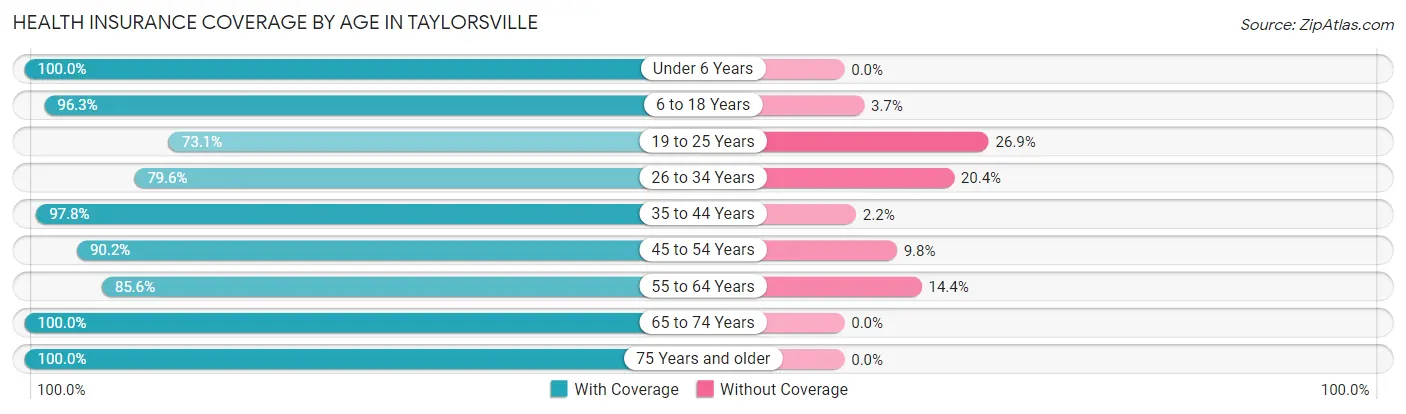
| Age Bracket | With Coverage | Without Coverage |
| Under 6 Years | 88 (100.0%) | 0 (0.0%) |
| 6 to 18 Years | 157 (96.3%) | 6 (3.7%) |
| 19 to 25 Years | 163 (73.1%) | 60 (26.9%) |
| 26 to 34 Years | 144 (79.6%) | 37 (20.4%) |
| 35 to 44 Years | 180 (97.8%) | 4 (2.2%) |
| 45 to 54 Years | 240 (90.2%) | 26 (9.8%) |
| 55 to 64 Years | 214 (85.6%) | 36 (14.4%) |
| 65 to 74 Years | 380 (100.0%) | 0 (0.0%) |
| 75 Years and older | 299 (100.0%) | 0 (0.0%) |
| Total | 1,865 (91.7%) | 169 (8.3%) |
Health Insurance Coverage by Citizenship Status in Taylorsville
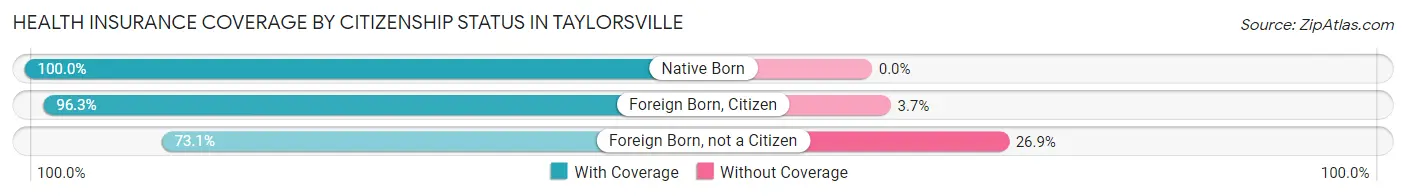
| Citizenship Status | With Coverage | Without Coverage |
| Native Born | 88 (100.0%) | 0 (0.0%) |
| Foreign Born, Citizen | 157 (96.3%) | 6 (3.7%) |
| Foreign Born, not a Citizen | 163 (73.1%) | 60 (26.9%) |
Health Insurance Coverage by Household Income in Taylorsville
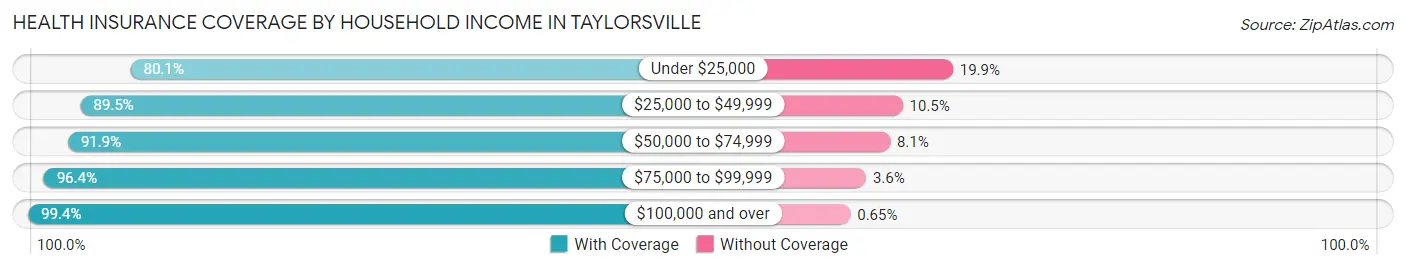
| Household Income | With Coverage | Without Coverage |
| Under $25,000 | 343 (80.1%) | 85 (19.9%) |
| $25,000 to $49,999 | 351 (89.5%) | 41 (10.5%) |
| $50,000 to $74,999 | 375 (91.9%) | 33 (8.1%) |
| $75,000 to $99,999 | 161 (96.4%) | 6 (3.6%) |
| $100,000 and over | 615 (99.4%) | 4 (0.6%) |
Public vs Private Health Insurance Coverage by Age in Taylorsville
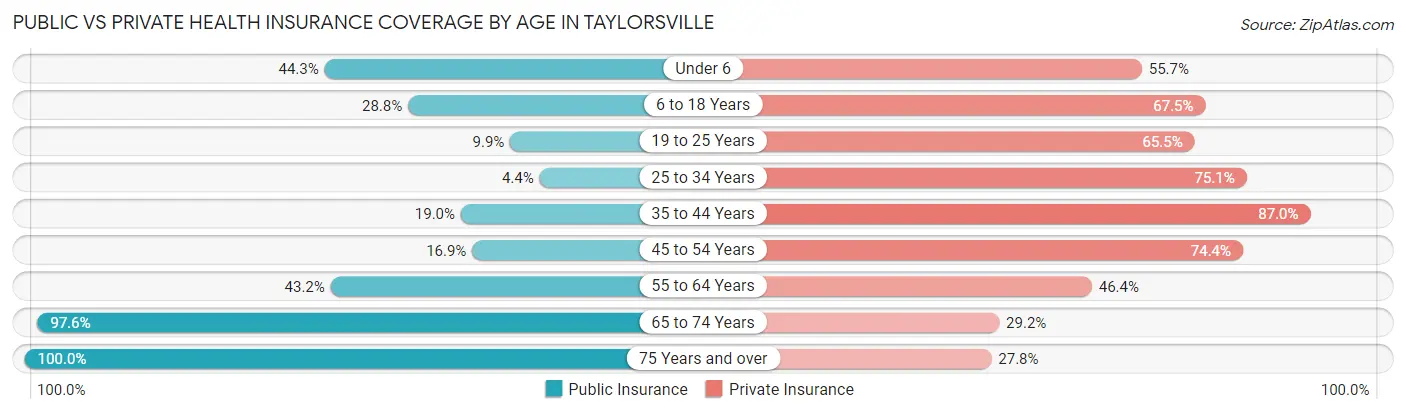
| Age Bracket | Public Insurance | Private Insurance |
| Under 6 | 39 (44.3%) | 49 (55.7%) |
| 6 to 18 Years | 47 (28.8%) | 110 (67.5%) |
| 19 to 25 Years | 22 (9.9%) | 146 (65.5%) |
| 25 to 34 Years | 8 (4.4%) | 136 (75.1%) |
| 35 to 44 Years | 35 (19.0%) | 160 (87.0%) |
| 45 to 54 Years | 45 (16.9%) | 198 (74.4%) |
| 55 to 64 Years | 108 (43.2%) | 116 (46.4%) |
| 65 to 74 Years | 371 (97.6%) | 111 (29.2%) |
| 75 Years and over | 299 (100.0%) | 83 (27.8%) |
| Total | 974 (47.9%) | 1,109 (54.5%) |
Disability Status by Sex by Age in Taylorsville
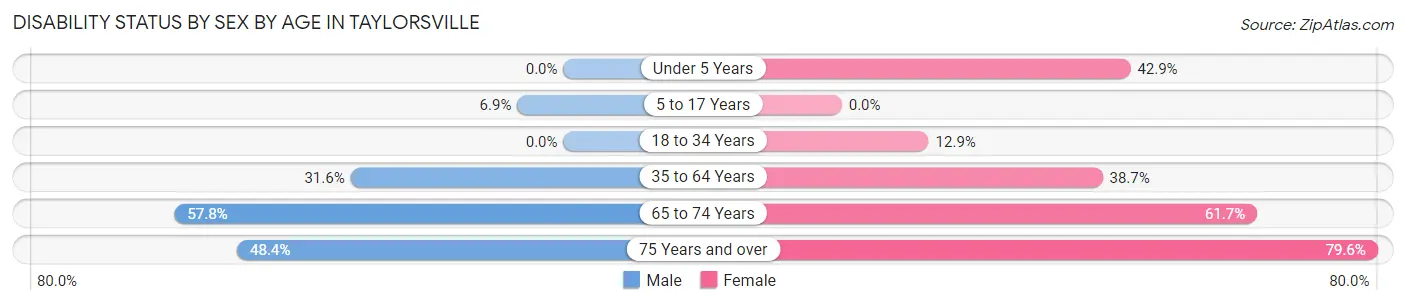
| Age Bracket | Male | Female |
| Under 5 Years | 0 (0.0%) | 15 (42.9%) |
| 5 to 17 Years | 5 (6.9%) | 0 (0.0%) |
| 18 to 34 Years | 0 (0.0%) | 28 (12.9%) |
| 35 to 64 Years | 98 (31.6%) | 151 (38.7%) |
| 65 to 74 Years | 108 (57.8%) | 119 (61.7%) |
| 75 Years and over | 31 (48.4%) | 187 (79.6%) |
Disability Class by Sex by Age in Taylorsville
Disability Class: Hearing Difficulty
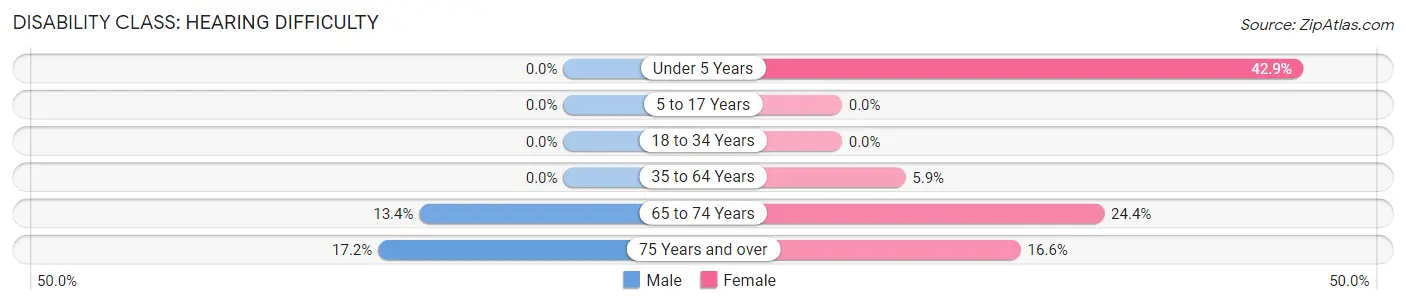
| Age Bracket | Male | Female |
| Under 5 Years | 0 (0.0%) | 15 (42.9%) |
| 5 to 17 Years | 0 (0.0%) | 0 (0.0%) |
| 18 to 34 Years | 0 (0.0%) | 0 (0.0%) |
| 35 to 64 Years | 0 (0.0%) | 23 (5.9%) |
| 65 to 74 Years | 25 (13.4%) | 47 (24.3%) |
| 75 Years and over | 11 (17.2%) | 39 (16.6%) |
Disability Class: Vision Difficulty
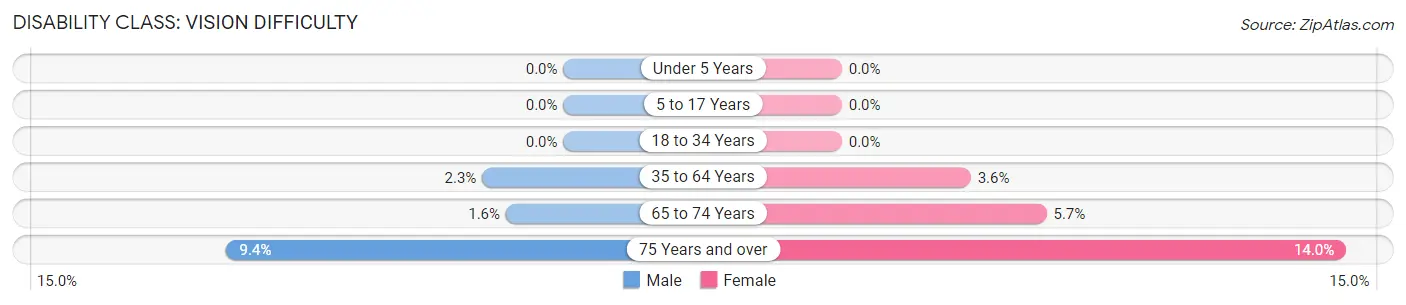
| Age Bracket | Male | Female |
| Under 5 Years | 0 (0.0%) | 0 (0.0%) |
| 5 to 17 Years | 0 (0.0%) | 0 (0.0%) |
| 18 to 34 Years | 0 (0.0%) | 0 (0.0%) |
| 35 to 64 Years | 7 (2.3%) | 14 (3.6%) |
| 65 to 74 Years | 3 (1.6%) | 11 (5.7%) |
| 75 Years and over | 6 (9.4%) | 33 (14.0%) |
Disability Class: Cognitive Difficulty
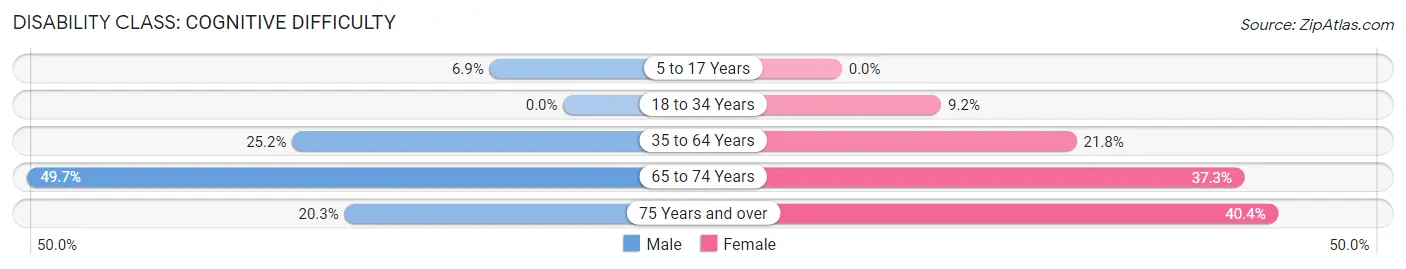
| Age Bracket | Male | Female |
| 5 to 17 Years | 5 (6.9%) | 0 (0.0%) |
| 18 to 34 Years | 0 (0.0%) | 20 (9.2%) |
| 35 to 64 Years | 78 (25.2%) | 85 (21.8%) |
| 65 to 74 Years | 93 (49.7%) | 72 (37.3%) |
| 75 Years and over | 13 (20.3%) | 95 (40.4%) |
Disability Class: Ambulatory Difficulty
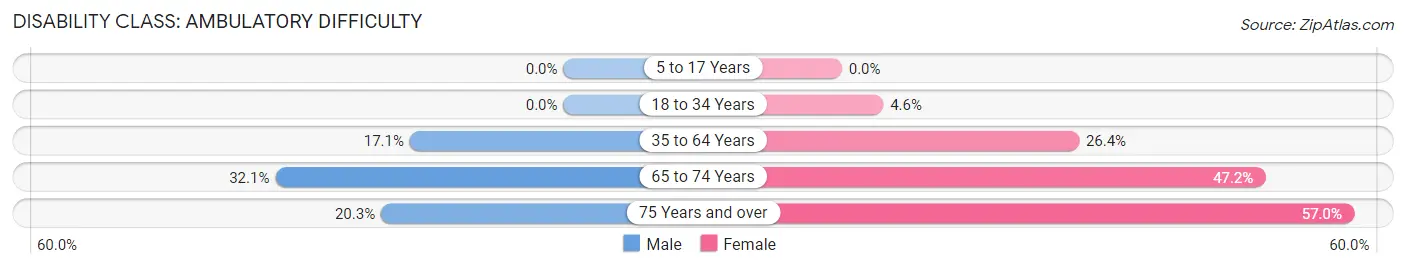
| Age Bracket | Male | Female |
| 5 to 17 Years | 0 (0.0%) | 0 (0.0%) |
| 18 to 34 Years | 0 (0.0%) | 10 (4.6%) |
| 35 to 64 Years | 53 (17.1%) | 103 (26.4%) |
| 65 to 74 Years | 60 (32.1%) | 91 (47.1%) |
| 75 Years and over | 13 (20.3%) | 134 (57.0%) |
Disability Class: Self-Care Difficulty
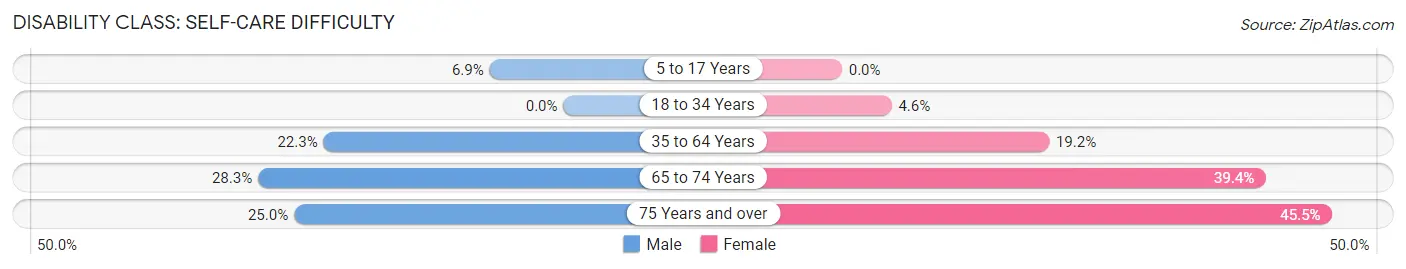
| Age Bracket | Male | Female |
| 5 to 17 Years | 5 (6.9%) | 0 (0.0%) |
| 18 to 34 Years | 0 (0.0%) | 10 (4.6%) |
| 35 to 64 Years | 69 (22.3%) | 75 (19.2%) |
| 65 to 74 Years | 53 (28.3%) | 76 (39.4%) |
| 75 Years and over | 16 (25.0%) | 107 (45.5%) |
Technology Access in Taylorsville
Computing Device Access in Taylorsville
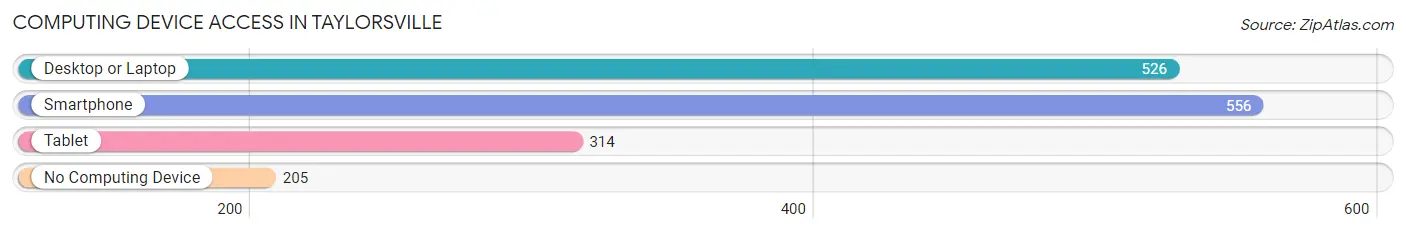
| Device Type | # Households | % Households |
| Desktop or Laptop | 526 | 61.4% |
| Smartphone | 556 | 64.9% |
| Tablet | 314 | 36.6% |
| No Computing Device | 205 | 23.9% |
| Total | 857 | 100.0% |
Internet Access in Taylorsville
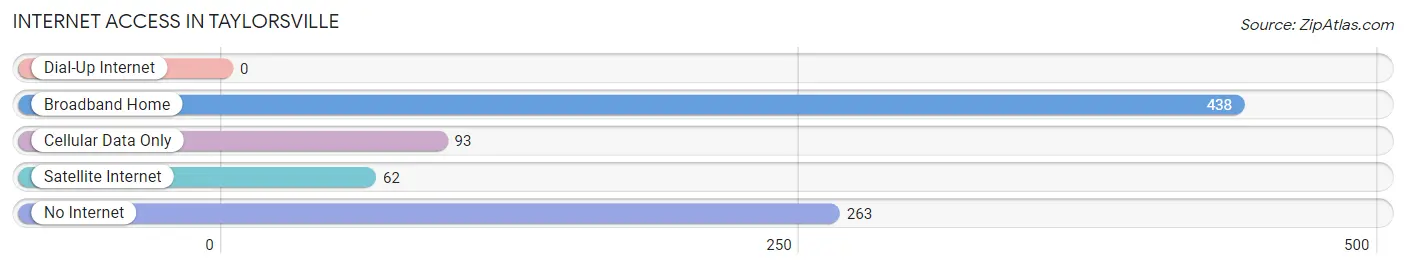
| Internet Type | # Households | % Households |
| Dial-Up Internet | 0 | 0.0% |
| Broadband Home | 438 | 51.1% |
| Cellular Data Only | 93 | 10.8% |
| Satellite Internet | 62 | 7.2% |
| No Internet | 263 | 30.7% |
| Total | 857 | 100.0% |
Taylorsville Summary
Taylorsville is a small town located in Alexander County, North Carolina. It is situated in the foothills of the Blue Ridge Mountains, about an hour and a half northwest of Charlotte. The town was founded in 1847 and named after General Zachary Taylor, the 12th President of the United States. The population of Taylorsville was 2,845 as of the 2010 census.
Geography
Taylorsville is located at the intersection of US Highway 64 and NC Highway 16. It is situated in the foothills of the Blue Ridge Mountains, about an hour and a half northwest of Charlotte. The town is surrounded by rolling hills and is situated on the banks of the South Yadkin River. The town is located in the Piedmont region of North Carolina, which is characterized by rolling hills and valleys. The climate in Taylorsville is mild, with temperatures ranging from the mid-30s in the winter to the mid-80s in the summer.
History
Taylorsville was founded in 1847 and named after General Zachary Taylor, the 12th President of the United States. The town was originally known as Taylorsville Station, as it was a stop on the Western North Carolina Railroad. The town was incorporated in 1891 and has remained relatively unchanged since then.
Economy
Taylorsville’s economy is largely based on agriculture and manufacturing. The town is home to several large farms, including the Alexander County Farm Bureau, which produces corn, soybeans, and wheat. The town is also home to several manufacturing companies, including Alexander County Industries, which produces furniture, and Alexander County Textiles, which produces textiles.
Demographics
As of the 2010 census, the population of Taylorsville was 2,845. The racial makeup of the town was 95.3% White, 2.2% African American, 0.3% Native American, 0.3% Asian, 0.2% from other races, and 1.7% from two or more races. The median household income was $30,938, and the median family income was $37,917. The per capita income was $17,845.
Conclusion
Taylorsville is a small town located in Alexander County, North Carolina. It is situated in the foothills of the Blue Ridge Mountains, about an hour and a half northwest of Charlotte. The town was founded in 1847 and named after General Zachary Taylor, the 12th President of the United States. The population of Taylorsville was 2,845 as of the 2010 census. The town’s economy is largely based on agriculture and manufacturing, and the median household income was $30,938. The racial makeup of the town was 95.3% White, 2.2% African American, 0.3% Native American, 0.3% Asian, 0.2% from other races, and 1.7% from two or more races. Taylorsville is a small town with a rich history and a bright future.
Common Questions
What is Per Capita Income in Taylorsville?
Per Capita income in Taylorsville is $24,280.
What is the Median Family Income in Taylorsville?
Median Family Income in Taylorsville is $65,147.
What is the Median Household income in Taylorsville?
Median Household Income in Taylorsville is $43,681.
What is Income or Wage Gap in Taylorsville?
Income or Wage Gap in Taylorsville is 22.2%.
Women in Taylorsville earn 77.8 cents for every dollar earned by a man.
What is Inequality or Gini Index in Taylorsville?
Inequality or Gini Index in Taylorsville is 0.51.
What is the Total Population of Taylorsville?
Total Population of Taylorsville is 2,198.
What is the Total Male Population of Taylorsville?
Total Male Population of Taylorsville is 924.
What is the Total Female Population of Taylorsville?
Total Female Population of Taylorsville is 1,274.
What is the Ratio of Males per 100 Females in Taylorsville?
There are 72.53 Males per 100 Females in Taylorsville.
What is the Ratio of Females per 100 Males in Taylorsville?
There are 137.88 Females per 100 Males in Taylorsville.
What is the Median Population Age in Taylorsville?
Median Population Age in Taylorsville is 53.7 Years.
What is the Average Family Size in Taylorsville
Average Family Size in Taylorsville is 2.8 People.
What is the Average Household Size in Taylorsville
Average Household Size in Taylorsville is 2.4 People.
How Large is the Labor Force in Taylorsville?
There are 787 People in the Labor Forcein in Taylorsville.
What is the Percentage of People in the Labor Force in Taylorsville?
39.6% of People are in the Labor Force in Taylorsville.
What is the Unemployment Rate in Taylorsville?
Unemployment Rate in Taylorsville is 0.6%.