Yanceyville, NC Map & Demographics
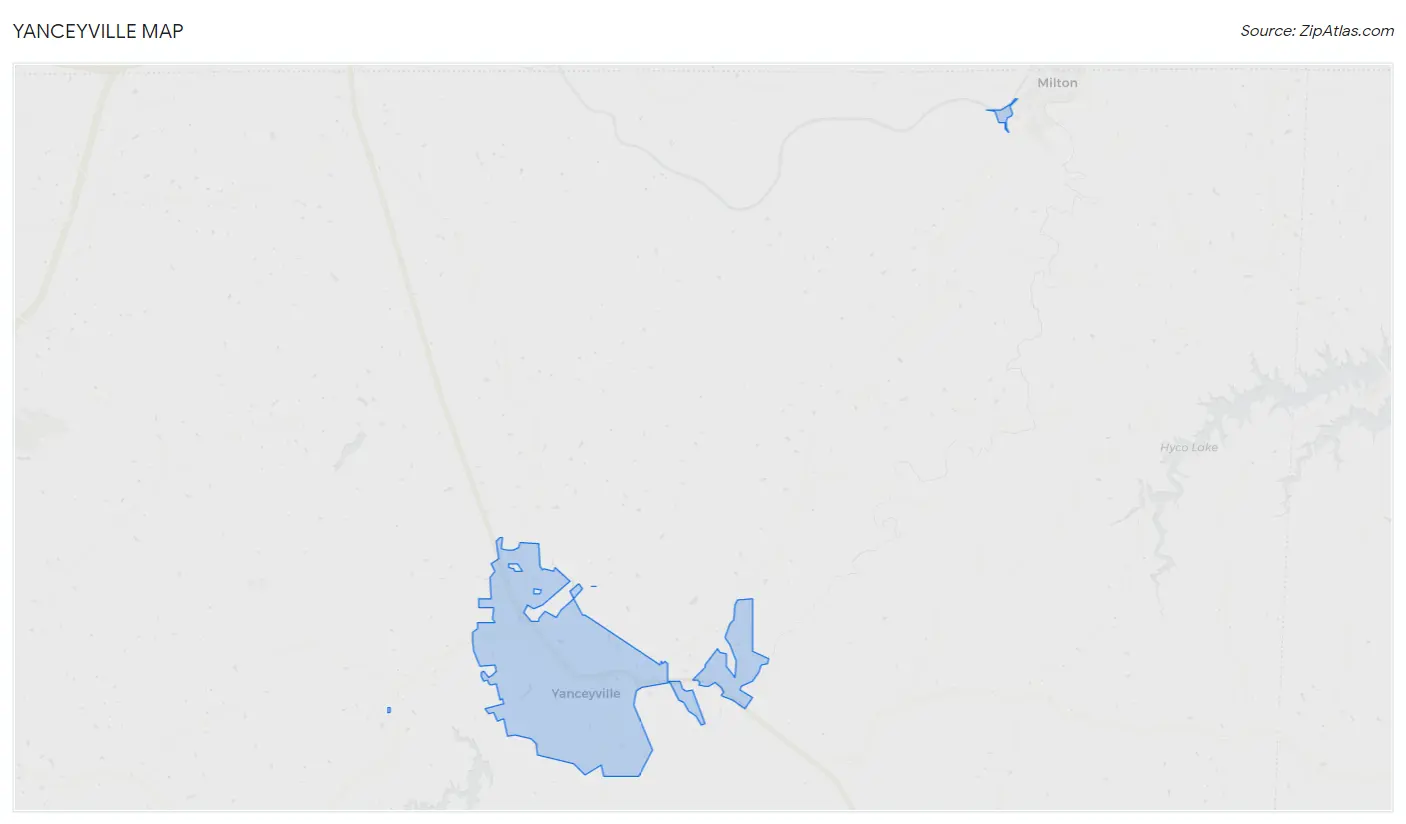
Yanceyville Map
Yanceyville Overview
$15,726
PER CAPITA INCOME
$43,470
AVG FAMILY INCOME
$26,693
AVG HOUSEHOLD INCOME
14.8%
WAGE / INCOME GAP [ % ]
85.2¢/ $1
WAGE / INCOME GAP [ $ ]
0.46
INEQUALITY / GINI INDEX
2,576
TOTAL POPULATION
1,422
MALE POPULATION
1,154
FEMALE POPULATION
123.22
MALES / 100 FEMALES
81.15
FEMALES / 100 MALES
46.0
MEDIAN AGE
2.6
AVG FAMILY SIZE
2.0
AVG HOUSEHOLD SIZE
747
LABOR FORCE [ PEOPLE ]
33.6%
PERCENT IN LABOR FORCE
7.2%
UNEMPLOYMENT RATE
Yanceyville Zip Codes
Yanceyville Area Codes
Income in Yanceyville
Income Overview in Yanceyville
Per Capita Income in Yanceyville is $15,726, while median incomes of families and households are $43,470 and $26,693 respectively.
| Characteristic | Number | Measure |
| Per Capita Income | 2,576 | $15,726 |
| Median Family Income | 572 | $43,470 |
| Mean Family Income | 572 | $48,825 |
| Median Household Income | 994 | $26,693 |
| Mean Household Income | 994 | $38,390 |
| Income Deficit | 572 | $0 |
| Wage / Income Gap (%) | 2,576 | 14.82% |
| Wage / Income Gap ($) | 2,576 | 85.18¢ per $1 |
| Gini / Inequality Index | 2,576 | 0.46 |
Earnings by Sex in Yanceyville
Average Earnings in Yanceyville are $23,805, $27,083 for men and $23,070 for women, a difference of 14.8%.
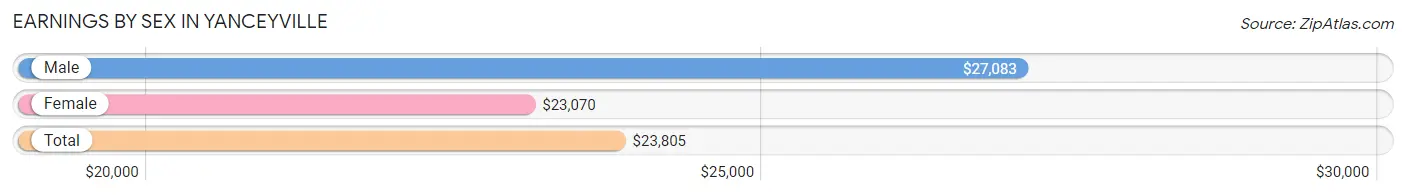
| Sex | Number | Average Earnings |
| Male | 298 (34.8%) | $27,083 |
| Female | 557 (65.1%) | $23,070 |
| Total | 855 (100.0%) | $23,805 |
Earnings by Sex by Income Bracket in Yanceyville
The most common earnings brackets in Yanceyville are $25,000 to $29,999 for men (47 | 15.8%) and $2,499 or less for women (70 | 12.6%).
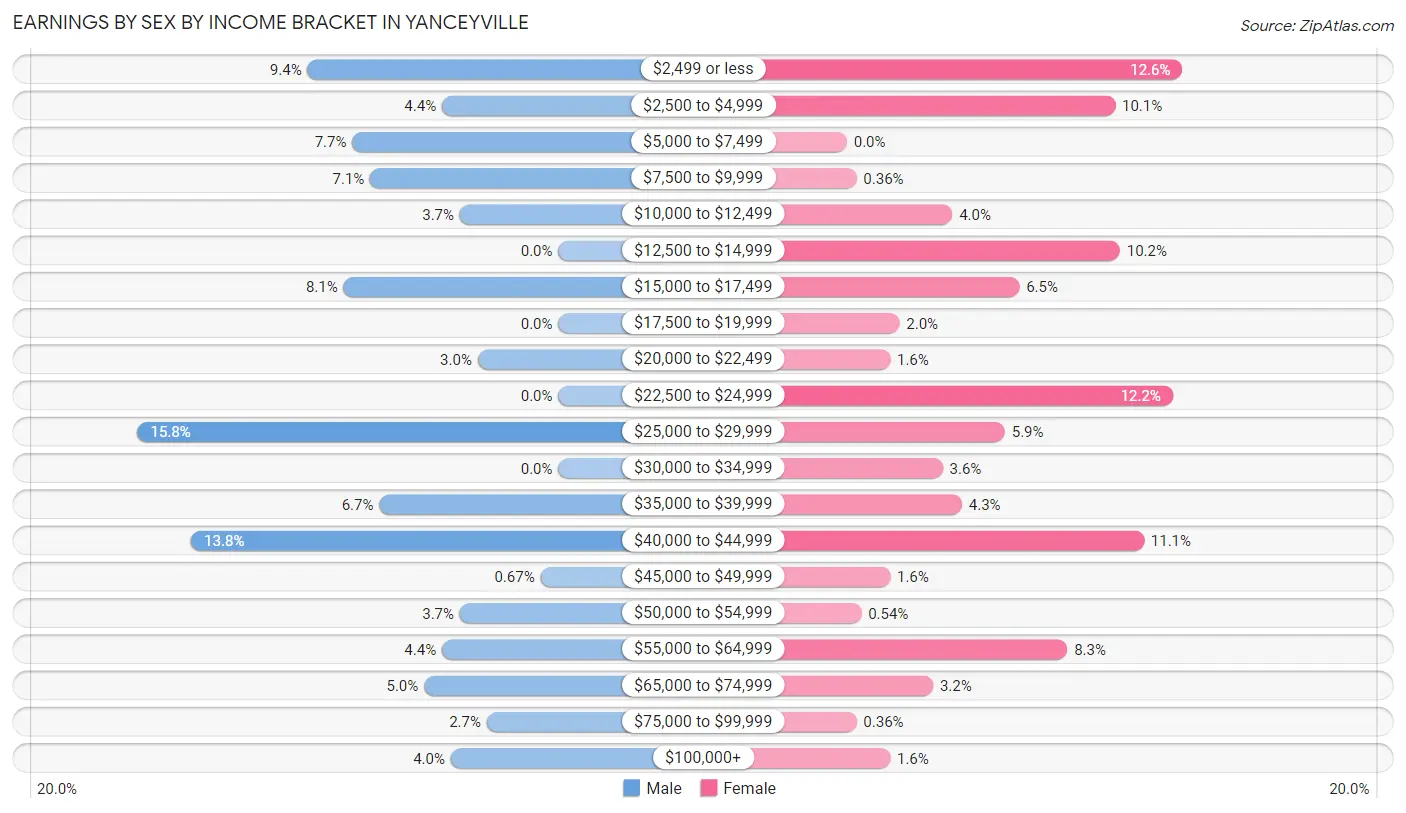
| Income | Male | Female |
| $2,499 or less | 28 (9.4%) | 70 (12.6%) |
| $2,500 to $4,999 | 13 (4.4%) | 56 (10.1%) |
| $5,000 to $7,499 | 23 (7.7%) | 0 (0.0%) |
| $7,500 to $9,999 | 21 (7.0%) | 2 (0.4%) |
| $10,000 to $12,499 | 11 (3.7%) | 22 (4.0%) |
| $12,500 to $14,999 | 0 (0.0%) | 57 (10.2%) |
| $15,000 to $17,499 | 24 (8.1%) | 36 (6.5%) |
| $17,500 to $19,999 | 0 (0.0%) | 11 (2.0%) |
| $20,000 to $22,499 | 9 (3.0%) | 9 (1.6%) |
| $22,500 to $24,999 | 0 (0.0%) | 68 (12.2%) |
| $25,000 to $29,999 | 47 (15.8%) | 33 (5.9%) |
| $30,000 to $34,999 | 0 (0.0%) | 20 (3.6%) |
| $35,000 to $39,999 | 20 (6.7%) | 24 (4.3%) |
| $40,000 to $44,999 | 41 (13.8%) | 62 (11.1%) |
| $45,000 to $49,999 | 2 (0.7%) | 9 (1.6%) |
| $50,000 to $54,999 | 11 (3.7%) | 3 (0.5%) |
| $55,000 to $64,999 | 13 (4.4%) | 46 (8.3%) |
| $65,000 to $74,999 | 15 (5.0%) | 18 (3.2%) |
| $75,000 to $99,999 | 8 (2.7%) | 2 (0.4%) |
| $100,000+ | 12 (4.0%) | 9 (1.6%) |
| Total | 298 (100.0%) | 557 (100.0%) |
Earnings by Sex by Educational Attainment in Yanceyville
Average earnings in Yanceyville are $28,478 for men and $23,889 for women, a difference of 16.1%. Men with an educational attainment of high school diploma enjoy the highest average annual earnings of $28,456, while those with less than high school education earn the least with $11,023. Women with an educational attainment of bachelor's degree earn the most with the average annual earnings of $58,125, while those with college or associate's degree education have the smallest earnings of $15,048.
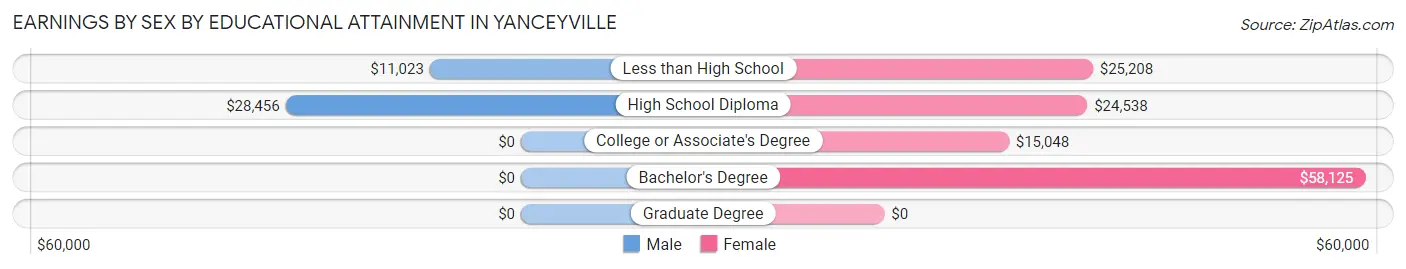
| Educational Attainment | Male Income | Female Income |
| Less than High School | $11,023 | $25,208 |
| High School Diploma | $28,456 | $24,538 |
| College or Associate's Degree | - | - |
| Bachelor's Degree | - | - |
| Graduate Degree | - | - |
| Total | $28,478 | $23,889 |
Family Income in Yanceyville
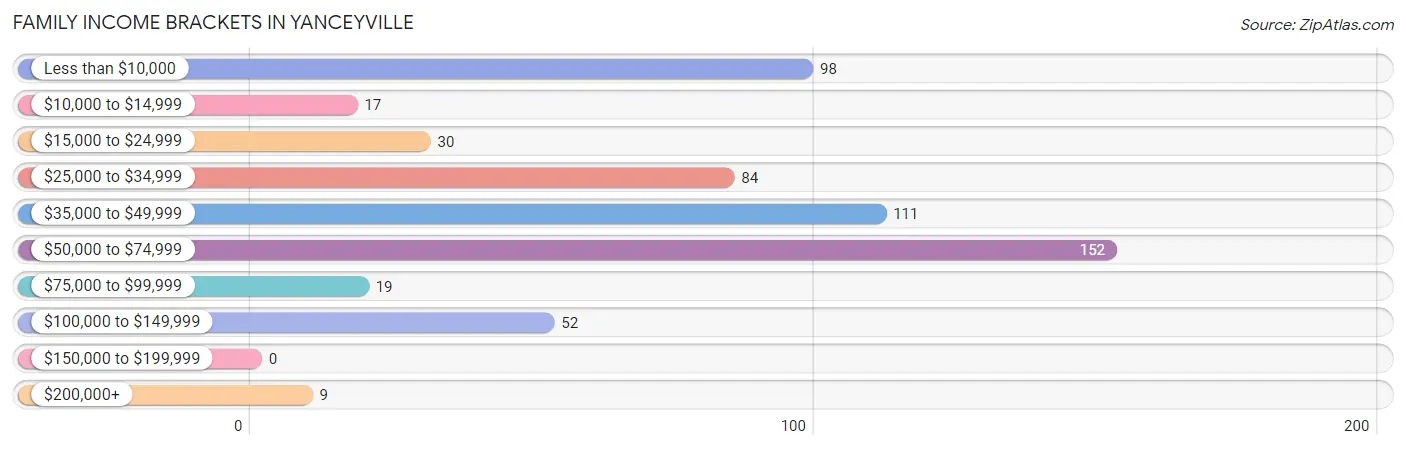
Family Income Brackets in Yanceyville
According to the Yanceyville family income data, there are 152 families falling into the $50,000 to $74,999 income range, which is the most common income bracket and makes up 26.6% of all families.
| Income Bracket | # Families | % Families |
| Less than $10,000 | 98 | 17.1% |
| $10,000 to $14,999 | 17 | 3.0% |
| $15,000 to $24,999 | 30 | 5.2% |
| $25,000 to $34,999 | 84 | 14.7% |
| $35,000 to $49,999 | 111 | 19.4% |
| $50,000 to $74,999 | 152 | 26.6% |
| $75,000 to $99,999 | 19 | 3.3% |
| $100,000 to $149,999 | 52 | 9.1% |
| $150,000 to $199,999 | 0 | 0.0% |
| $200,000+ | 9 | 1.6% |
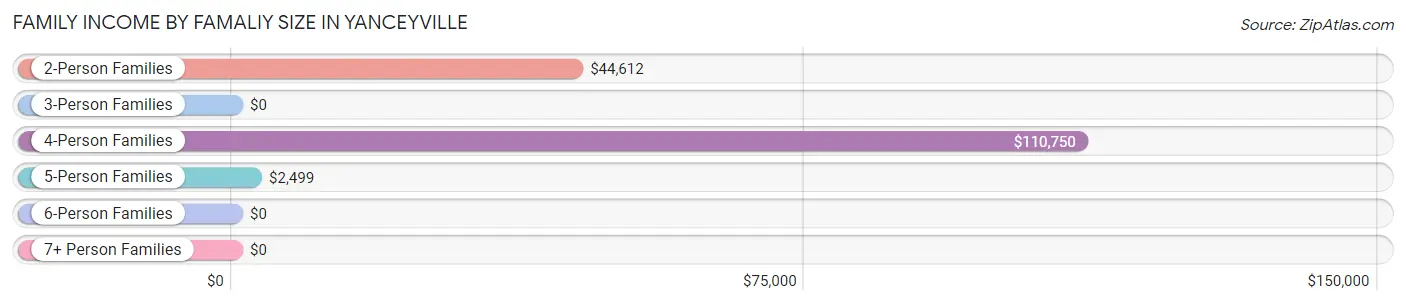
Family Income by Famaliy Size in Yanceyville
4-person families (43 | 7.5%) account for the highest median family income in Yanceyville with $110,750 per family, while 4-person families (43 | 7.5%) have the highest median income of $27,688 per family member.
| Income Bracket | # Families | Median Income |
| 2-Person Families | 388 (67.8%) | $44,612 |
| 3-Person Families | 91 (15.9%) | $0 |
| 4-Person Families | 43 (7.5%) | $110,750 |
| 5-Person Families | 35 (6.1%) | $2,499 |
| 6-Person Families | 15 (2.6%) | $0 |
| 7+ Person Families | 0 (0.0%) | $0 |
| Total | 572 (100.0%) | $43,470 |
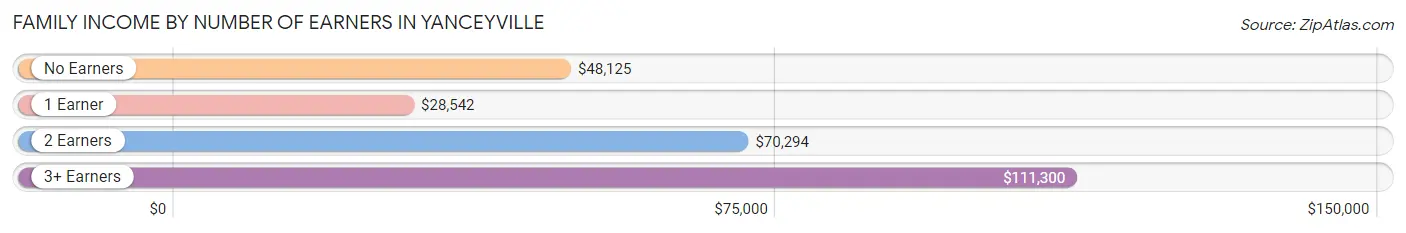
Family Income by Number of Earners in Yanceyville
The median family income in Yanceyville is $43,470, with families comprising 3+ earners (32) having the highest median family income of $111,300, while families with 1 earner (227) have the lowest median family income of $28,542, accounting for 5.6% and 39.7% of families, respectively.
| Number of Earners | # Families | Median Income |
| No Earners | 199 (34.8%) | $48,125 |
| 1 Earner | 227 (39.7%) | $28,542 |
| 2 Earners | 114 (19.9%) | $70,294 |
| 3+ Earners | 32 (5.6%) | $111,300 |
| Total | 572 (100.0%) | $43,470 |
Household Income in Yanceyville
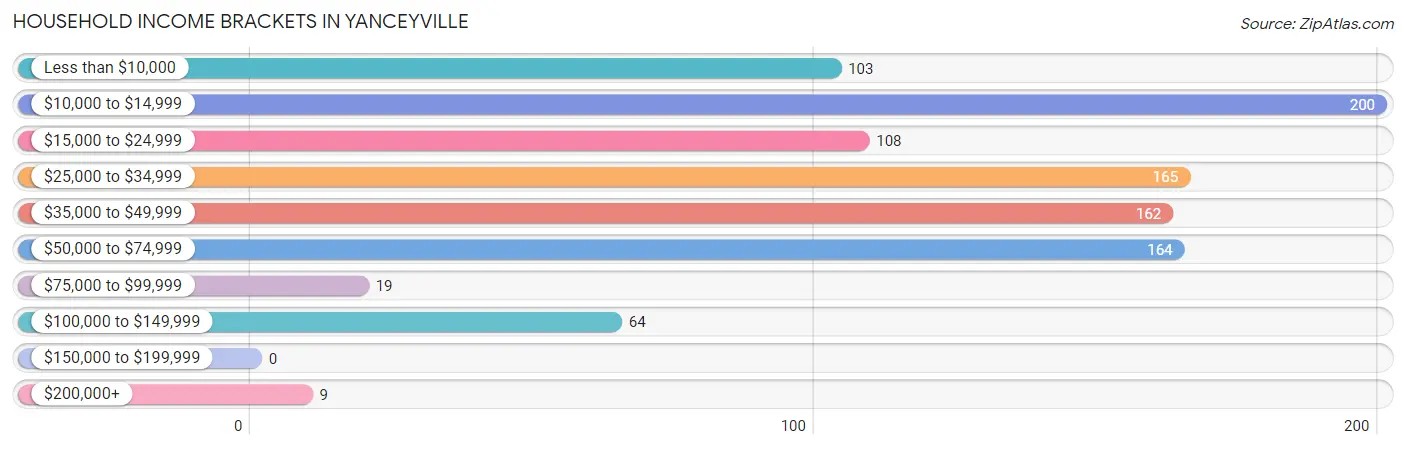
Household Income Brackets in Yanceyville
With 200 households falling in the category, the $10,000 to $14,999 income range is the most frequent in Yanceyville, accounting for 20.1% of all households.
| Income Bracket | # Households | % Households |
| Less than $10,000 | 103 | 10.4% |
| $10,000 to $14,999 | 200 | 20.1% |
| $15,000 to $24,999 | 108 | 10.9% |
| $25,000 to $34,999 | 165 | 16.6% |
| $35,000 to $49,999 | 162 | 16.3% |
| $50,000 to $74,999 | 164 | 16.5% |
| $75,000 to $99,999 | 19 | 1.9% |
| $100,000 to $149,999 | 64 | 6.4% |
| $150,000 to $199,999 | 0 | 0.0% |
| $200,000+ | 9 | 0.9% |
Household Income by Householder Age in Yanceyville
The median household income in Yanceyville is $26,693, with the highest median household income of $30,063 found in the 25 to 44 years age bracket for the primary householder. A total of 209 households (21.0%) fall into this category. Meanwhile, the 15 to 24 years age bracket for the primary householder has the lowest median household income of $0, with 40 households (4.0%) in this group.
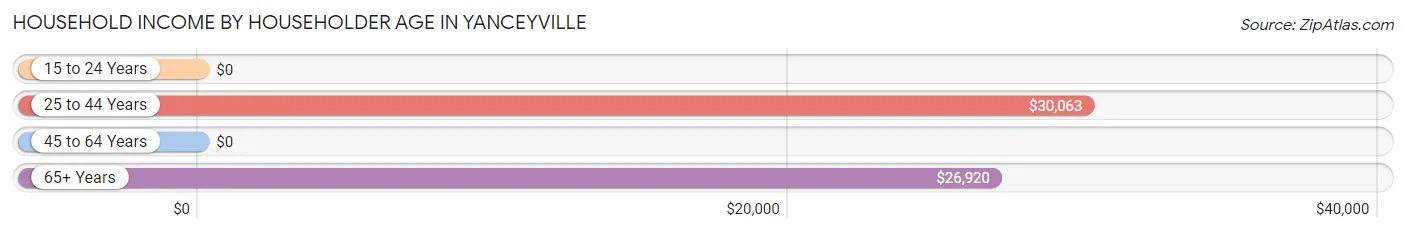
| Income Bracket | # Households | Median Income |
| 15 to 24 Years | 40 (4.0%) | $0 |
| 25 to 44 Years | 209 (21.0%) | $30,063 |
| 45 to 64 Years | 359 (36.1%) | $0 |
| 65+ Years | 386 (38.8%) | $26,920 |
| Total | 994 (100.0%) | $26,693 |
Poverty in Yanceyville
Income Below Poverty by Sex and Age in Yanceyville
With 47.2% poverty level for males and 26.8% for females among the residents of Yanceyville, 15 year old males and 5 year old females are the most vulnerable to poverty, with 21 males (100.0%) and 9 females (100.0%) in their respective age groups living below the poverty level.
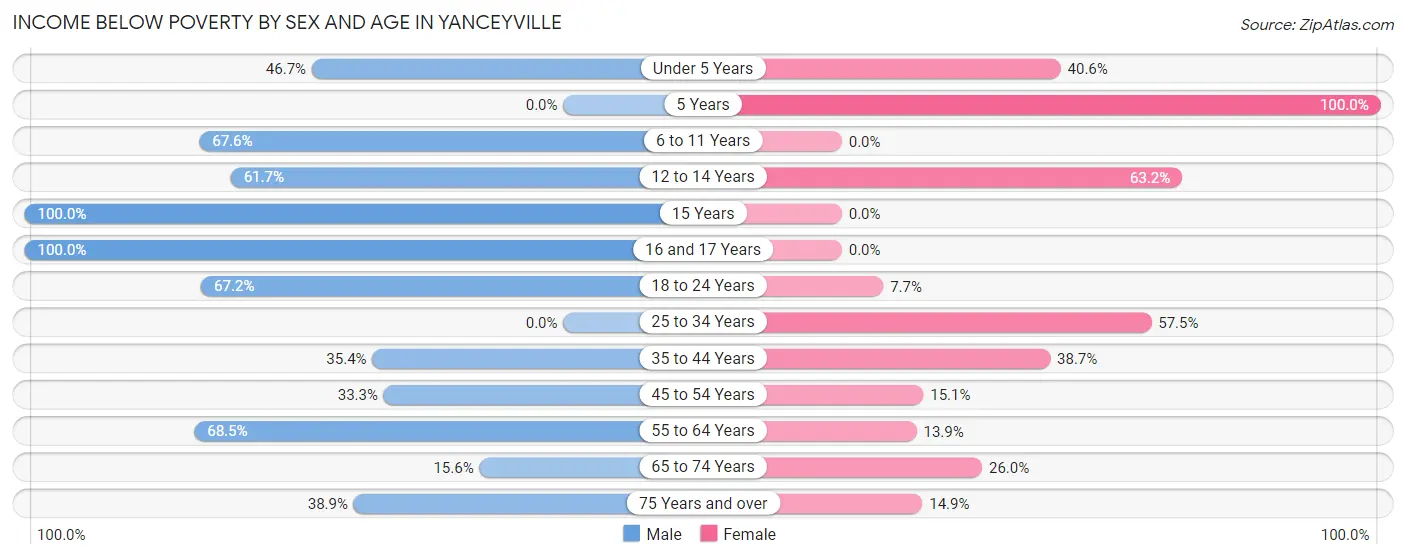
| Age Bracket | Male | Female |
| Under 5 Years | 42 (46.7%) | 26 (40.6%) |
| 5 Years | 0 (0.0%) | 9 (100.0%) |
| 6 to 11 Years | 25 (67.6%) | 0 (0.0%) |
| 12 to 14 Years | 50 (61.7%) | 12 (63.2%) |
| 15 Years | 21 (100.0%) | 0 (0.0%) |
| 16 and 17 Years | 32 (100.0%) | 0 (0.0%) |
| 18 to 24 Years | 80 (67.2%) | 4 (7.7%) |
| 25 to 34 Years | 0 (0.0%) | 81 (57.5%) |
| 35 to 44 Years | 28 (35.4%) | 29 (38.7%) |
| 45 to 54 Years | 20 (33.3%) | 23 (15.1%) |
| 55 to 64 Years | 100 (68.5%) | 24 (13.9%) |
| 65 to 74 Years | 19 (15.6%) | 69 (26.0%) |
| 75 Years and over | 14 (38.9%) | 13 (14.9%) |
| Total | 431 (47.2%) | 290 (26.8%) |
Income Above Poverty by Sex and Age in Yanceyville
According to the poverty statistics in Yanceyville, males aged 5 years and females aged 6 to 11 years are the age groups that are most secure financially, with 100.0% of males and 100.0% of females in these age groups living above the poverty line.
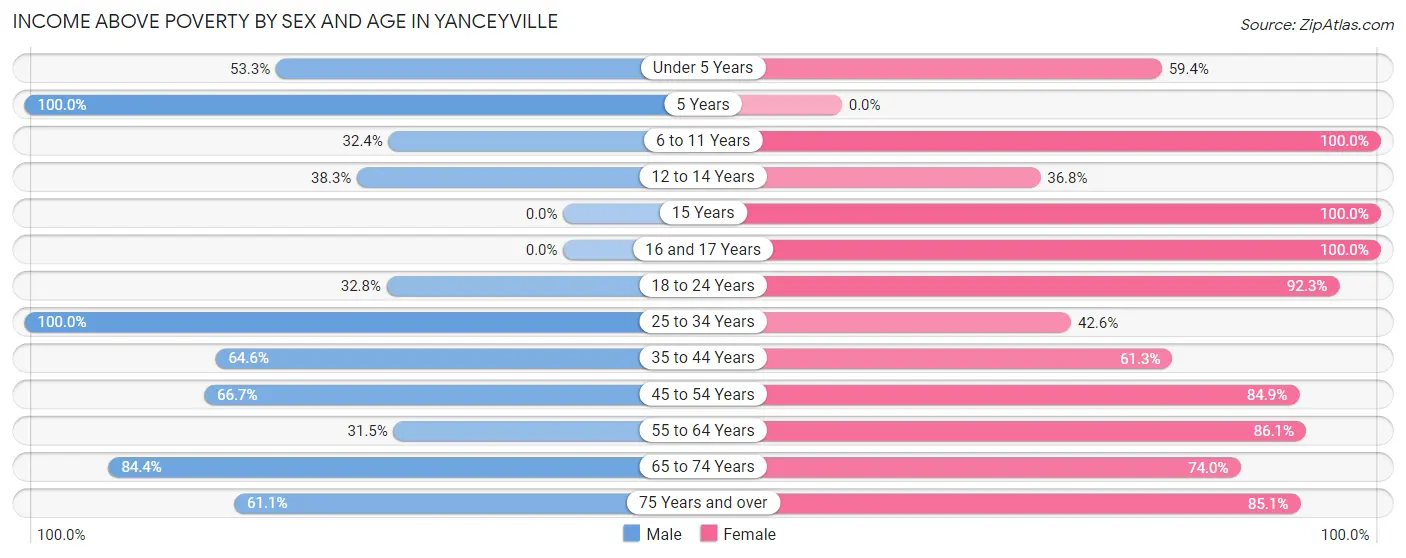
| Age Bracket | Male | Female |
| Under 5 Years | 48 (53.3%) | 38 (59.4%) |
| 5 Years | 4 (100.0%) | 0 (0.0%) |
| 6 to 11 Years | 12 (32.4%) | 9 (100.0%) |
| 12 to 14 Years | 31 (38.3%) | 7 (36.8%) |
| 15 Years | 0 (0.0%) | 15 (100.0%) |
| 16 and 17 Years | 0 (0.0%) | 21 (100.0%) |
| 18 to 24 Years | 39 (32.8%) | 48 (92.3%) |
| 25 to 34 Years | 86 (100.0%) | 60 (42.5%) |
| 35 to 44 Years | 51 (64.6%) | 46 (61.3%) |
| 45 to 54 Years | 40 (66.7%) | 129 (84.9%) |
| 55 to 64 Years | 46 (31.5%) | 149 (86.1%) |
| 65 to 74 Years | 103 (84.4%) | 196 (74.0%) |
| 75 Years and over | 22 (61.1%) | 74 (85.1%) |
| Total | 482 (52.8%) | 792 (73.2%) |
Income Below Poverty Among Married-Couple Families in Yanceyville
The poverty statistics for married-couple families in Yanceyville show that 10.8% or 28 of the total 259 families live below the poverty line. Families with 1 or 2 children have the highest poverty rate of 18.0%, comprising of 9 families. On the other hand, families with no children have the lowest poverty rate of 9.1%, which includes 19 families.
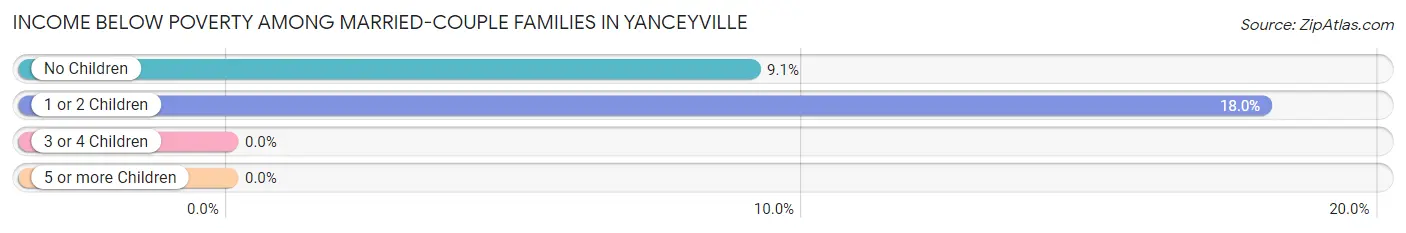
| Children | Above Poverty | Below Poverty |
| No Children | 190 (90.9%) | 19 (9.1%) |
| 1 or 2 Children | 41 (82.0%) | 9 (18.0%) |
| 3 or 4 Children | 0 (0.0%) | 0 (0.0%) |
| 5 or more Children | 0 (0.0%) | 0 (0.0%) |
| Total | 231 (89.2%) | 28 (10.8%) |
Income Below Poverty Among Single-Parent Households in Yanceyville
According to the poverty data in Yanceyville, 40.8% or 20 single-father households and 33.3% or 88 single-mother households are living below the poverty line. Among single-father households, those with no children have the highest poverty rate, with 20 households (95.2%) experiencing poverty. Likewise, among single-mother households, those with 5 or more children have the highest poverty rate, with 15 households (100.0%) falling below the poverty line.
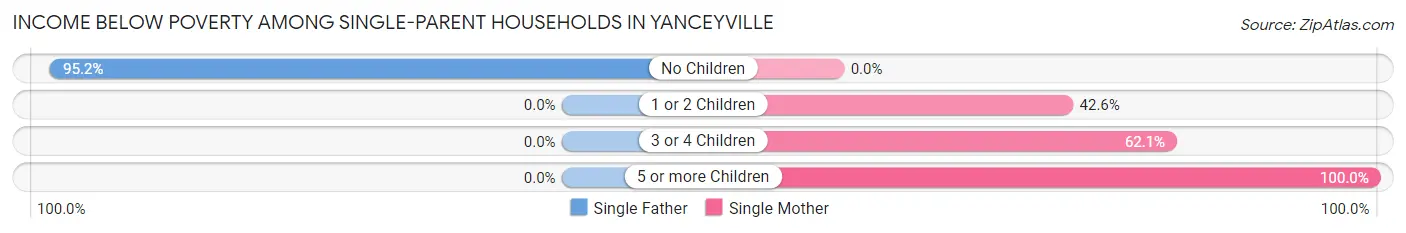
| Children | Single Father | Single Mother |
| No Children | 20 (95.2%) | 0 (0.0%) |
| 1 or 2 Children | 0 (0.0%) | 55 (42.6%) |
| 3 or 4 Children | 0 (0.0%) | 18 (62.1%) |
| 5 or more Children | 0 (0.0%) | 15 (100.0%) |
| Total | 20 (40.8%) | 88 (33.3%) |
Income Below Poverty Among Married-Couple vs Single-Parent Households in Yanceyville
The poverty data for Yanceyville shows that 28 of the married-couple family households (10.8%) and 108 of the single-parent households (34.5%) are living below the poverty level. Within the married-couple family households, those with 1 or 2 children have the highest poverty rate, with 9 households (18.0%) falling below the poverty line. Among the single-parent households, those with 5 or more children have the highest poverty rate, with 15 household (100.0%) living below poverty.
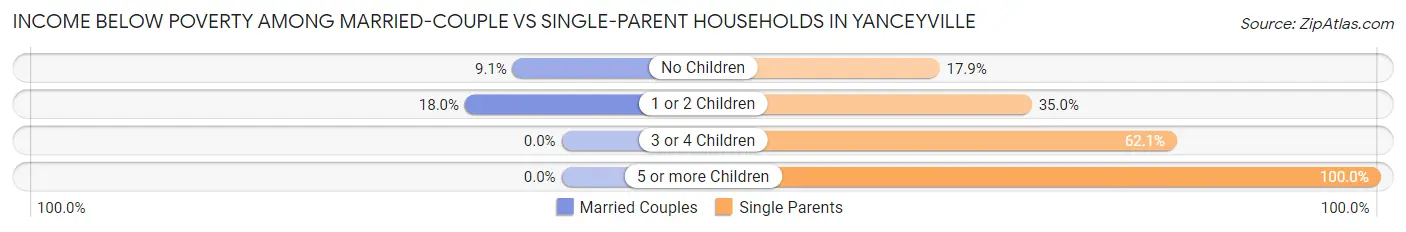
| Children | Married-Couple Families | Single-Parent Households |
| No Children | 19 (9.1%) | 20 (17.9%) |
| 1 or 2 Children | 9 (18.0%) | 55 (35.0%) |
| 3 or 4 Children | 0 (0.0%) | 18 (62.1%) |
| 5 or more Children | 0 (0.0%) | 15 (100.0%) |
| Total | 28 (10.8%) | 108 (34.5%) |
Race in Yanceyville
The most populous races in Yanceyville are Black / African American (1,514 | 58.8%), White / Caucasian (954 | 37.0%), and Two or more Races (66 | 2.6%).
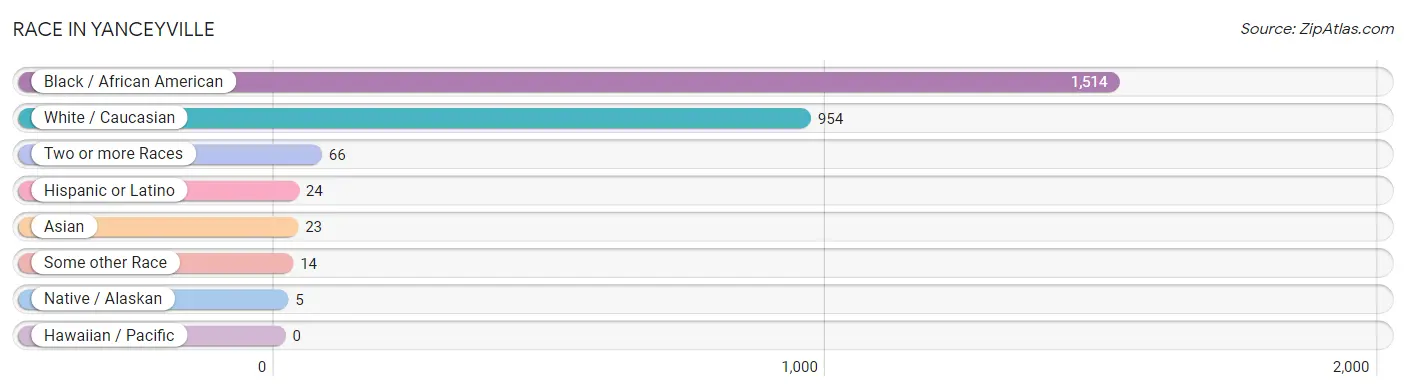
| Race | # Population | % Population |
| Asian | 23 | 0.9% |
| Black / African American | 1,514 | 58.8% |
| Hawaiian / Pacific | 0 | 0.0% |
| Hispanic or Latino | 24 | 0.9% |
| Native / Alaskan | 5 | 0.2% |
| White / Caucasian | 954 | 37.0% |
| Two or more Races | 66 | 2.6% |
| Some other Race | 14 | 0.5% |
| Total | 2,576 | 100.0% |
Ancestry in Yanceyville
The most populous ancestries reported in Yanceyville are American (439 | 17.0%), English (199 | 7.7%), Irish (92 | 3.6%), European (50 | 1.9%), and German (38 | 1.5%), together accounting for 31.8% of all Yanceyville residents.
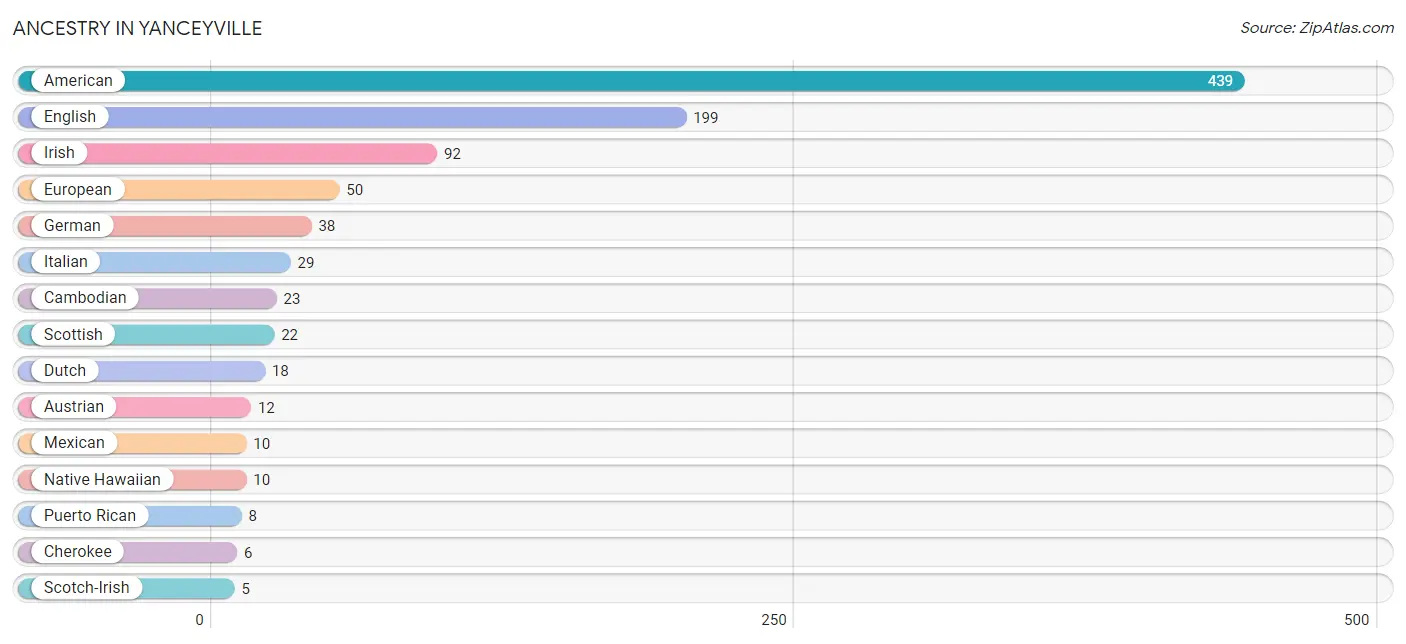
| Ancestry | # Population | % Population |
| American | 439 | 17.0% |
| Austrian | 12 | 0.5% |
| Cambodian | 23 | 0.9% |
| Cherokee | 6 | 0.2% |
| Dutch | 18 | 0.7% |
| English | 199 | 7.7% |
| European | 50 | 1.9% |
| French | 3 | 0.1% |
| German | 38 | 1.5% |
| Irish | 92 | 3.6% |
| Italian | 29 | 1.1% |
| Jamaican | 2 | 0.1% |
| Mexican | 10 | 0.4% |
| Native Hawaiian | 10 | 0.4% |
| Polish | 1 | 0.0% |
| Puerto Rican | 8 | 0.3% |
| Scotch-Irish | 5 | 0.2% |
| Scottish | 22 | 0.9% |
| Spanish | 4 | 0.2% | View All 19 Rows |
Immigrants in Yanceyville
The most numerous immigrant groups reported in Yanceyville came from Asia (23 | 0.9%), Eastern Asia (23 | 0.9%), Europe (4 | 0.2%), Latin America (4 | 0.2%), and Southern Europe (4 | 0.2%), together accounting for 2.3% of all Yanceyville residents.
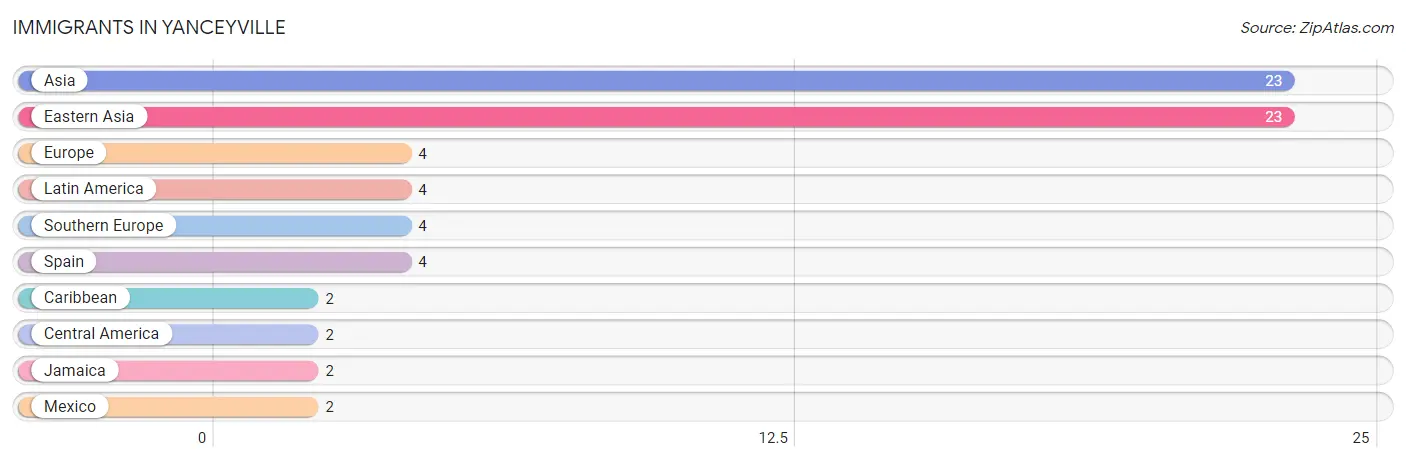
| Immigration Origin | # Population | % Population |
| Asia | 23 | 0.9% |
| Caribbean | 2 | 0.1% |
| Central America | 2 | 0.1% |
| Eastern Asia | 23 | 0.9% |
| Europe | 4 | 0.2% |
| Jamaica | 2 | 0.1% |
| Latin America | 4 | 0.2% |
| Mexico | 2 | 0.1% |
| Southern Europe | 4 | 0.2% |
| Spain | 4 | 0.2% | View All 10 Rows |
Sex and Age in Yanceyville
Sex and Age in Yanceyville
The most populous age groups in Yanceyville are 35 to 39 Years (144 | 10.1%) for men and 65 to 69 Years (141 | 12.2%) for women.
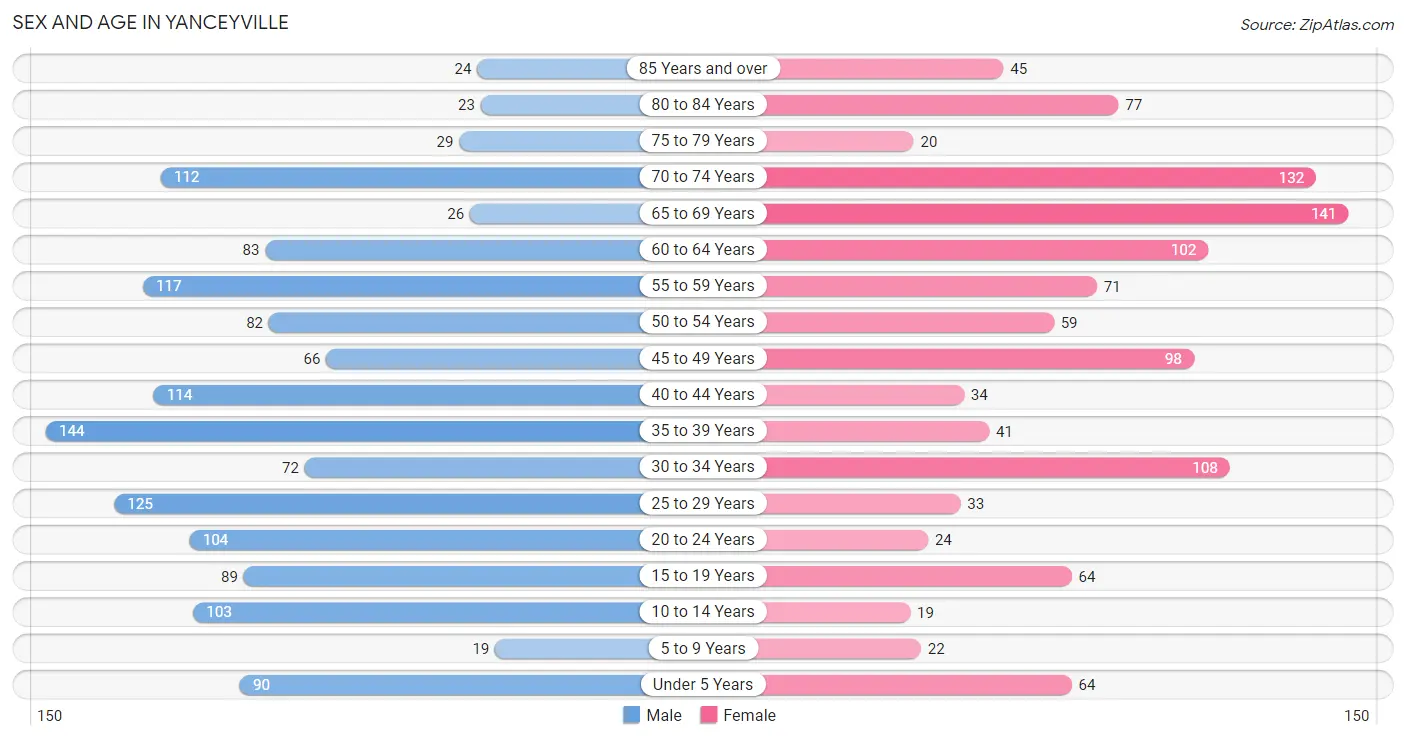
| Age Bracket | Male | Female |
| Under 5 Years | 90 (6.3%) | 64 (5.6%) |
| 5 to 9 Years | 19 (1.3%) | 22 (1.9%) |
| 10 to 14 Years | 103 (7.2%) | 19 (1.7%) |
| 15 to 19 Years | 89 (6.3%) | 64 (5.6%) |
| 20 to 24 Years | 104 (7.3%) | 24 (2.1%) |
| 25 to 29 Years | 125 (8.8%) | 33 (2.9%) |
| 30 to 34 Years | 72 (5.1%) | 108 (9.4%) |
| 35 to 39 Years | 144 (10.1%) | 41 (3.5%) |
| 40 to 44 Years | 114 (8.0%) | 34 (2.9%) |
| 45 to 49 Years | 66 (4.6%) | 98 (8.5%) |
| 50 to 54 Years | 82 (5.8%) | 59 (5.1%) |
| 55 to 59 Years | 117 (8.2%) | 71 (6.1%) |
| 60 to 64 Years | 83 (5.8%) | 102 (8.8%) |
| 65 to 69 Years | 26 (1.8%) | 141 (12.2%) |
| 70 to 74 Years | 112 (7.9%) | 132 (11.4%) |
| 75 to 79 Years | 29 (2.0%) | 20 (1.7%) |
| 80 to 84 Years | 23 (1.6%) | 77 (6.7%) |
| 85 Years and over | 24 (1.7%) | 45 (3.9%) |
| Total | 1,422 (100.0%) | 1,154 (100.0%) |
Families and Households in Yanceyville
Median Family Size in Yanceyville
The median family size in Yanceyville is 2.61 persons per family, with married-couple families (259 | 45.3%) accounting for the largest median family size of 2.69 persons per family. On the other hand, single male/father families (49 | 8.6%) represent the smallest median family size with 2.12 persons per family.
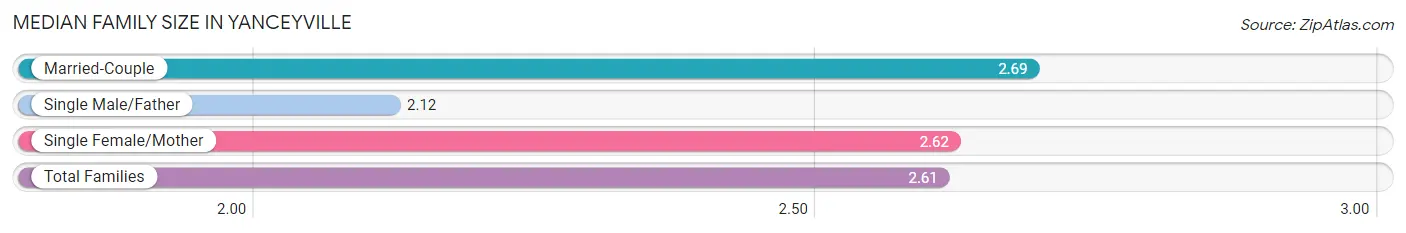
| Family Type | # Families | Family Size |
| Married-Couple | 259 (45.3%) | 2.69 |
| Single Male/Father | 49 (8.6%) | 2.12 |
| Single Female/Mother | 264 (46.2%) | 2.62 |
| Total Families | 572 (100.0%) | 2.61 |
Median Household Size in Yanceyville
The median household size in Yanceyville is 2.01 persons per household, with single female/mother households (264 | 26.6%) accounting for the largest median household size of 2.75 persons per household. non-family households (422 | 42.4%) represent the smallest median household size with 1.05 persons per household.
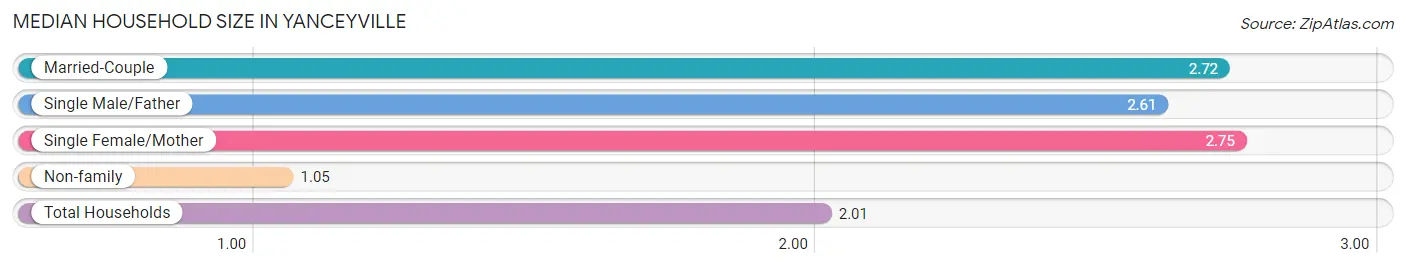
| Household Type | # Households | Household Size |
| Married-Couple | 259 (26.1%) | 2.72 |
| Single Male/Father | 49 (4.9%) | 2.61 |
| Single Female/Mother | 264 (26.6%) | 2.75 |
| Non-family | 422 (42.4%) | 1.05 |
| Total Households | 994 (100.0%) | 2.01 |
Household Size by Marriage Status in Yanceyville
Out of a total of 994 households in Yanceyville, 572 (57.6%) are family households, while 422 (42.4%) are nonfamily households. The most numerous type of family households are 2-person households, comprising 358, and the most common type of nonfamily households are 1-person households, comprising 411.
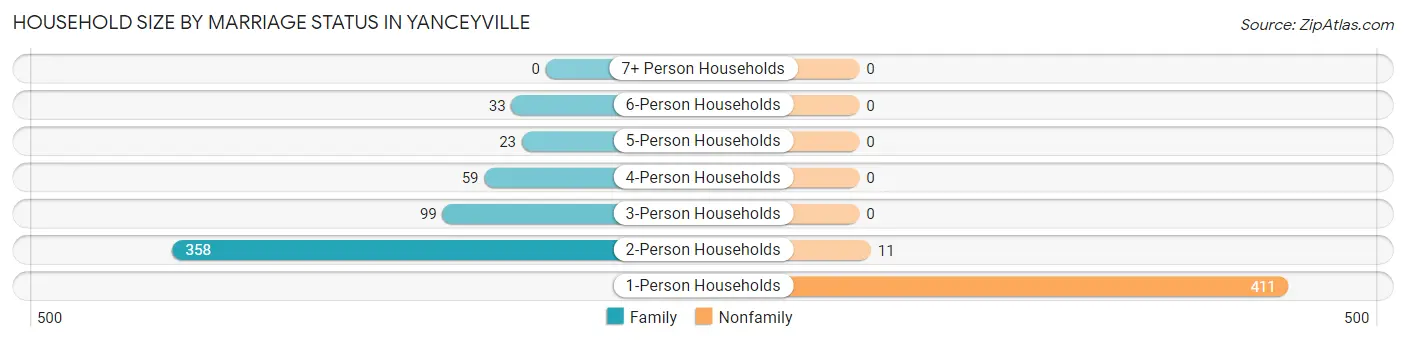
| Household Size | Family Households | Nonfamily Households |
| 1-Person Households | - | 411 (41.3%) |
| 2-Person Households | 358 (36.0%) | 11 (1.1%) |
| 3-Person Households | 99 (10.0%) | 0 (0.0%) |
| 4-Person Households | 59 (5.9%) | 0 (0.0%) |
| 5-Person Households | 23 (2.3%) | 0 (0.0%) |
| 6-Person Households | 33 (3.3%) | 0 (0.0%) |
| 7+ Person Households | 0 (0.0%) | 0 (0.0%) |
| Total | 572 (57.6%) | 422 (42.4%) |
Female Fertility in Yanceyville
Fertility by Age in Yanceyville
Average fertility rate in Yanceyville is 142.0 births per 1,000 women. Women in the age bracket of 20 to 34 years have the highest fertility rate with 321.0 births per 1,000 women. Women in the age bracket of 20 to 34 years acount for 93.0% of all women with births.
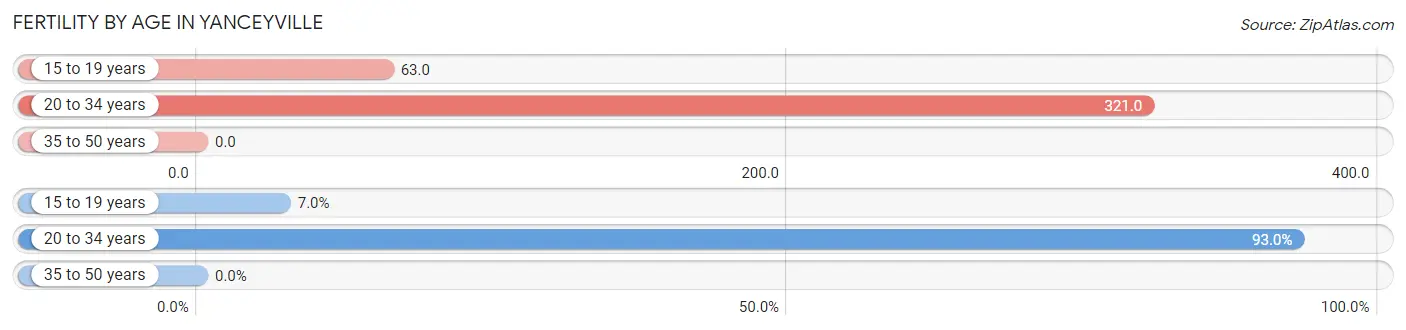
| Age Bracket | Women with Births | Births / 1,000 Women |
| 15 to 19 years | 4 (7.0%) | 63.0 |
| 20 to 34 years | 53 (93.0%) | 321.0 |
| 35 to 50 years | 0 (0.0%) | 0.0 |
| Total | 57 (100.0%) | 142.0 |
Fertility by Age by Marriage Status in Yanceyville
10.5% of women with births (57) in Yanceyville are married. The highest percentage of unmarried women with births falls into 15 to 19 years age bracket with 100.0% of them unmarried at the time of birth, while the lowest percentage of unmarried women with births belong to 20 to 34 years age bracket with 88.7% of them unmarried.
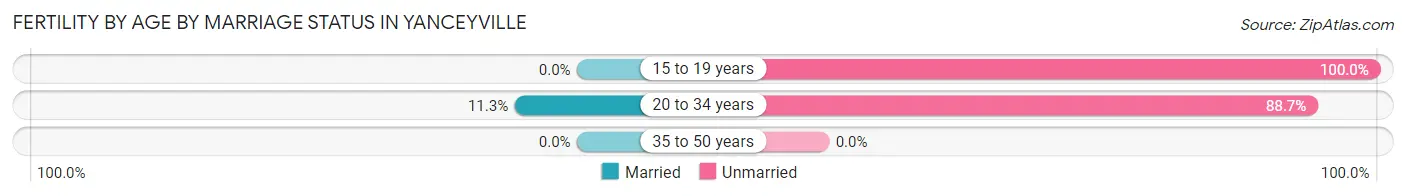
| Age Bracket | Married | Unmarried |
| 15 to 19 years | 0 (0.0%) | 4 (100.0%) |
| 20 to 34 years | 6 (11.3%) | 47 (88.7%) |
| 35 to 50 years | 0 (0.0%) | 0 (0.0%) |
| Total | 6 (10.5%) | 51 (89.5%) |
Fertility by Education in Yanceyville
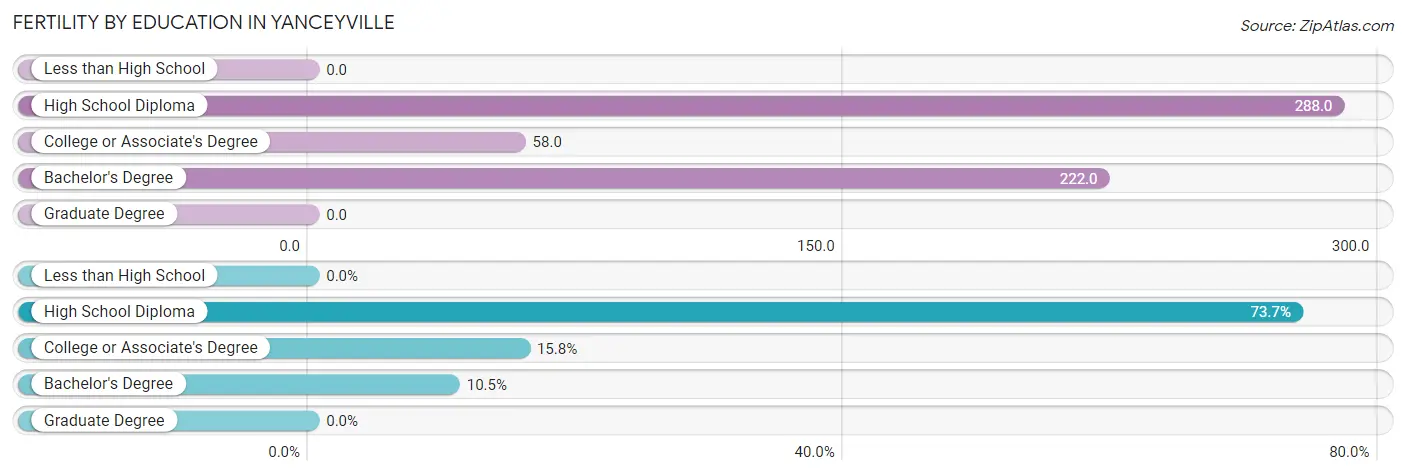
| Educational Attainment | Women with Births | Births / 1,000 Women |
| Less than High School | 0 (0.0%) | 0.0 |
| High School Diploma | 42 (73.7%) | 288.0 |
| College or Associate's Degree | 9 (15.8%) | 58.0 |
| Bachelor's Degree | 6 (10.5%) | 222.0 |
| Graduate Degree | 0 (0.0%) | 0.0 |
| Total | 57 (100.0%) | 142.0 |
Fertility by Education by Marriage Status in Yanceyville
89.5% of women with births in Yanceyville are unmarried. Women with the educational attainment of bachelor's degree are most likely to be married with 100.0% of them married at childbirth, while women with the educational attainment of high school diploma are least likely to be married with 100.0% of them unmarried at childbirth.
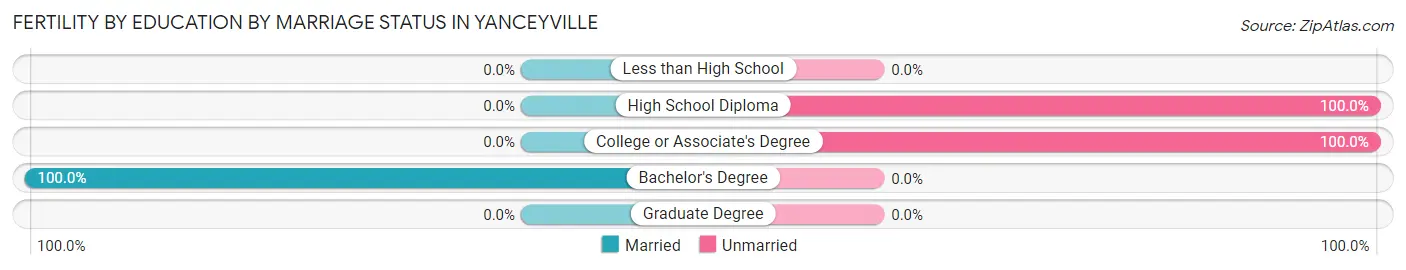
| Educational Attainment | Married | Unmarried |
| Less than High School | 0 (0.0%) | 0 (0.0%) |
| High School Diploma | 0 (0.0%) | 42 (100.0%) |
| College or Associate's Degree | 0 (0.0%) | 9 (100.0%) |
| Bachelor's Degree | 6 (100.0%) | 0 (0.0%) |
| Graduate Degree | 0 (0.0%) | 0 (0.0%) |
| Total | 6 (10.5%) | 51 (89.5%) |
Employment Characteristics in Yanceyville
Employment by Class of Employer in Yanceyville
Among the 675 employed individuals in Yanceyville, private company employees (542 | 80.3%), state government employees (61 | 9.0%), and local government employees (24 | 3.6%) make up the most common classes of employment.
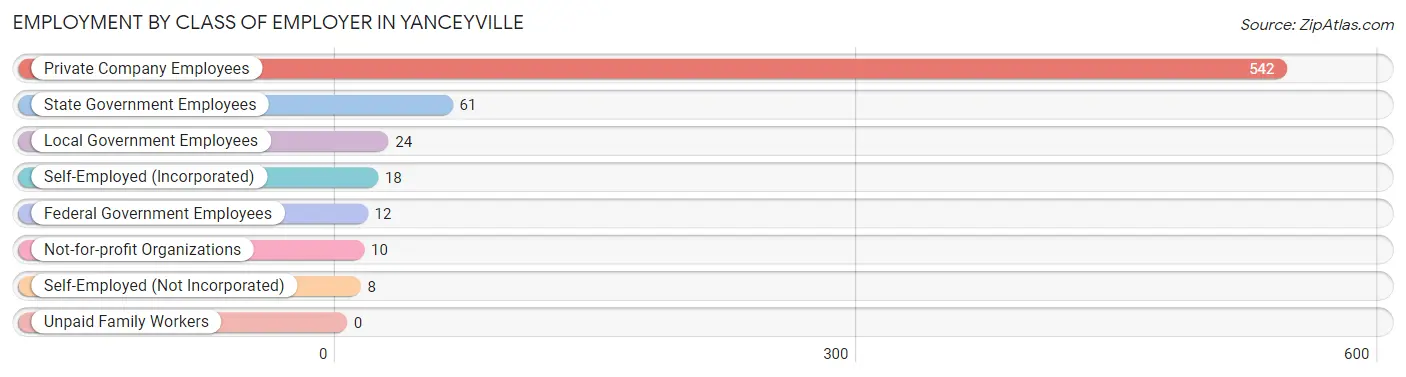
| Employer Class | # Employees | % Employees |
| Private Company Employees | 542 | 80.3% |
| Self-Employed (Incorporated) | 18 | 2.7% |
| Self-Employed (Not Incorporated) | 8 | 1.2% |
| Not-for-profit Organizations | 10 | 1.5% |
| Local Government Employees | 24 | 3.6% |
| State Government Employees | 61 | 9.0% |
| Federal Government Employees | 12 | 1.8% |
| Unpaid Family Workers | 0 | 0.0% |
| Total | 675 | 100.0% |
Employment Status by Age in Yanceyville
According to the labor force statistics for Yanceyville, out of the total population over 16 years of age (2,223), 33.6% or 747 individuals are in the labor force, with 7.2% or 54 of them unemployed. The age group with the highest labor force participation rate is 20 to 24 years, with 64.8% or 83 individuals in the labor force. Within the labor force, the 20 to 24 years age range has the highest percentage of unemployed individuals, with 53.0% or 44 of them being unemployed.
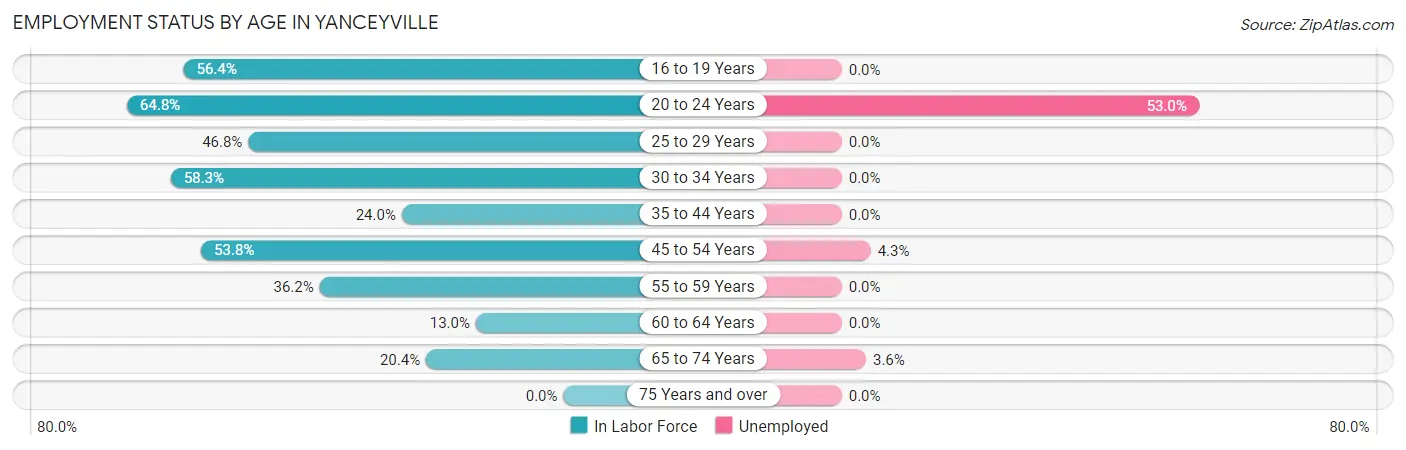
| Age Bracket | In Labor Force | Unemployed |
| 16 to 19 Years | 66 (56.4%) | 0 (0.0%) |
| 20 to 24 Years | 83 (64.8%) | 44 (53.0%) |
| 25 to 29 Years | 74 (46.8%) | 0 (0.0%) |
| 30 to 34 Years | 105 (58.3%) | 0 (0.0%) |
| 35 to 44 Years | 80 (24.0%) | 0 (0.0%) |
| 45 to 54 Years | 164 (53.8%) | 7 (4.3%) |
| 55 to 59 Years | 68 (36.2%) | 0 (0.0%) |
| 60 to 64 Years | 24 (13.0%) | 0 (0.0%) |
| 65 to 74 Years | 84 (20.4%) | 3 (3.6%) |
| 75 Years and over | 0 (0.0%) | 0 (0.0%) |
| Total | 747 (33.6%) | 54 (7.2%) |
Employment Status by Educational Attainment in Yanceyville
According to labor force statistics for Yanceyville, 38.2% of individuals (515) out of the total population between 25 and 64 years of age (1,349) are in the labor force, with 1.4% or 7 of them being unemployed. The group with the highest labor force participation rate are those with the educational attainment of bachelor's degree or higher, with 81.4% or 105 individuals in the labor force. Within the labor force, individuals with less than high school education have the highest percentage of unemployment, with 22.7% or 5 of them being unemployed.
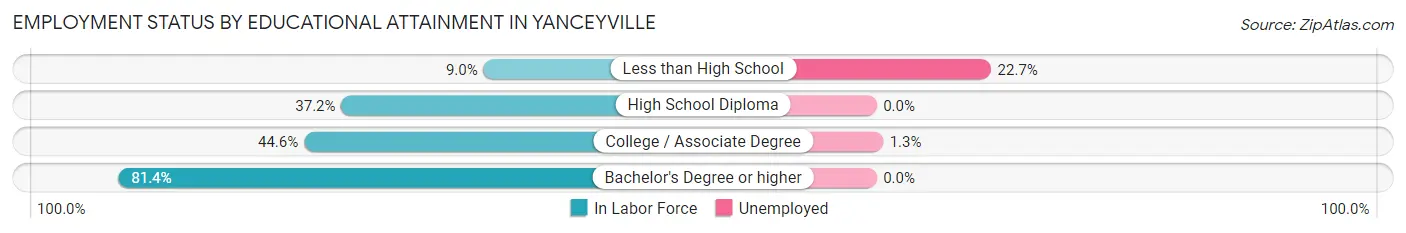
| Educational Attainment | In Labor Force | Unemployed |
| Less than High School | 22 (9.0%) | 55 (22.7%) |
| High School Diploma | 239 (37.2%) | 0 (0.0%) |
| College / Associate Degree | 149 (44.6%) | 4 (1.3%) |
| Bachelor's Degree or higher | 105 (81.4%) | 0 (0.0%) |
| Total | 515 (38.2%) | 19 (1.4%) |
Employment Occupations by Sex in Yanceyville
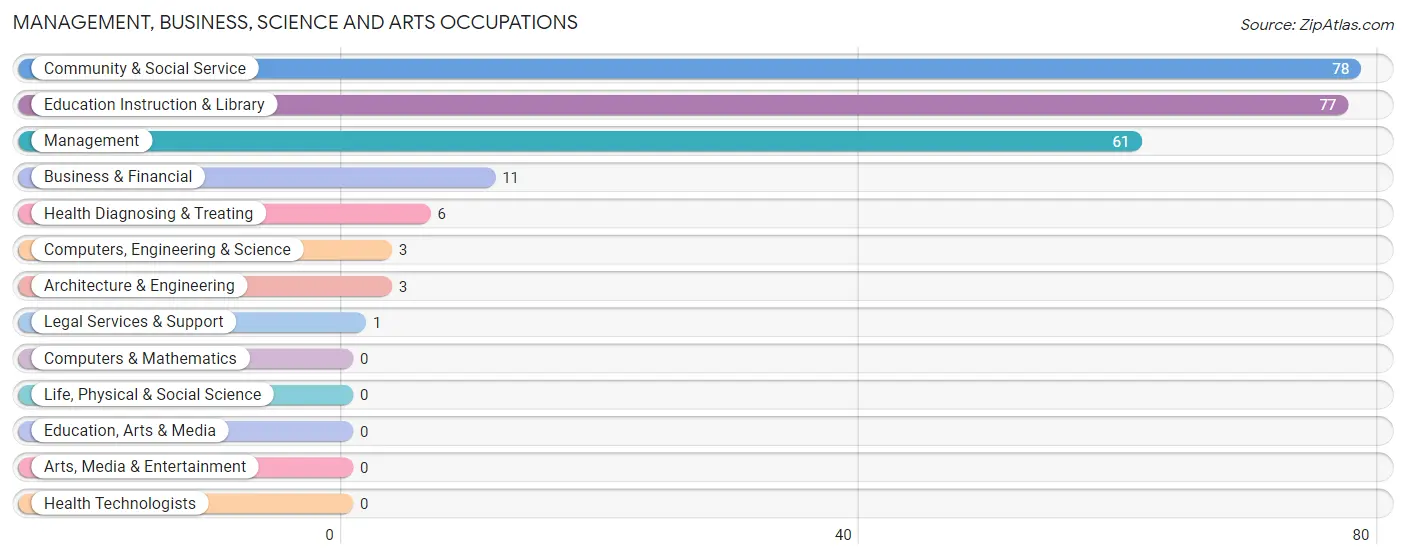
Management, Business, Science and Arts Occupations
The most common Management, Business, Science and Arts occupations in Yanceyville are Community & Social Service (78 | 11.2%), Education Instruction & Library (77 | 11.1%), Management (61 | 8.8%), Business & Financial (11 | 1.6%), and Health Diagnosing & Treating (6 | 0.9%).
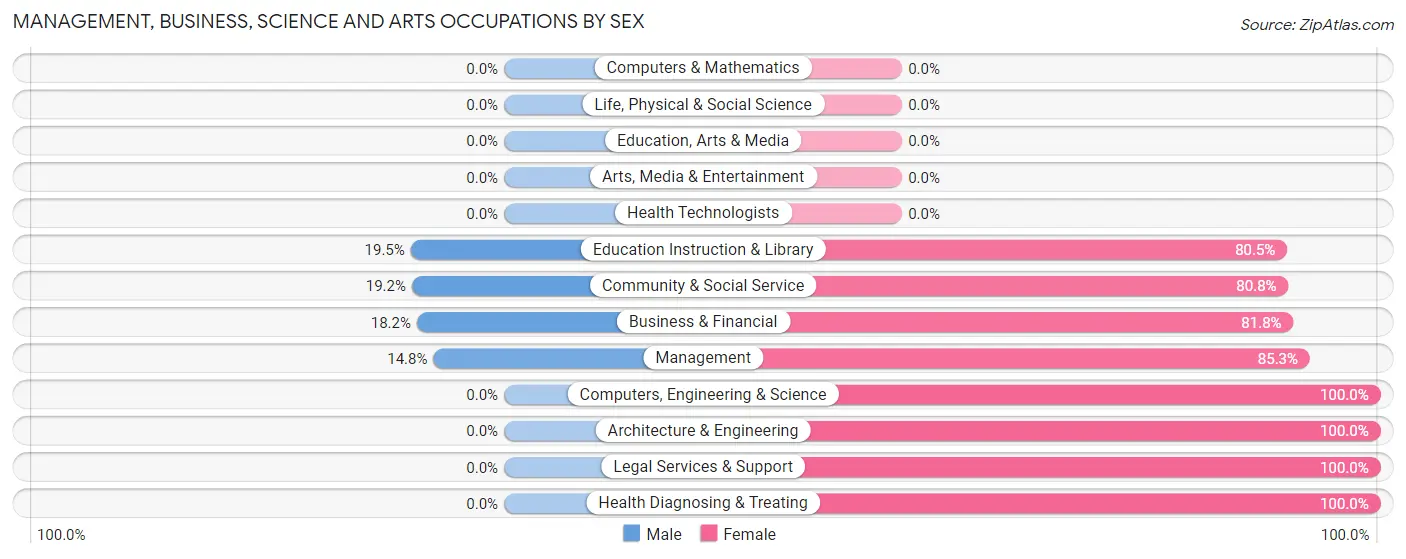
Management, Business, Science and Arts Occupations by Sex
Within the Management, Business, Science and Arts occupations in Yanceyville, the most male-oriented occupations are Education Instruction & Library (19.5%), Community & Social Service (19.2%), and Business & Financial (18.2%), while the most female-oriented occupations are Computers, Engineering & Science (100.0%), Architecture & Engineering (100.0%), and Legal Services & Support (100.0%).
| Occupation | Male | Female |
| Management | 9 (14.7%) | 52 (85.3%) |
| Business & Financial | 2 (18.2%) | 9 (81.8%) |
| Computers, Engineering & Science | 0 (0.0%) | 3 (100.0%) |
| Computers & Mathematics | 0 (0.0%) | 0 (0.0%) |
| Architecture & Engineering | 0 (0.0%) | 3 (100.0%) |
| Life, Physical & Social Science | 0 (0.0%) | 0 (0.0%) |
| Community & Social Service | 15 (19.2%) | 63 (80.8%) |
| Education, Arts & Media | 0 (0.0%) | 0 (0.0%) |
| Legal Services & Support | 0 (0.0%) | 1 (100.0%) |
| Education Instruction & Library | 15 (19.5%) | 62 (80.5%) |
| Arts, Media & Entertainment | 0 (0.0%) | 0 (0.0%) |
| Health Diagnosing & Treating | 0 (0.0%) | 6 (100.0%) |
| Health Technologists | 0 (0.0%) | 0 (0.0%) |
| Total (Category) | 26 (16.4%) | 133 (83.7%) |
| Total (Overall) | 218 (31.4%) | 476 (68.6%) |
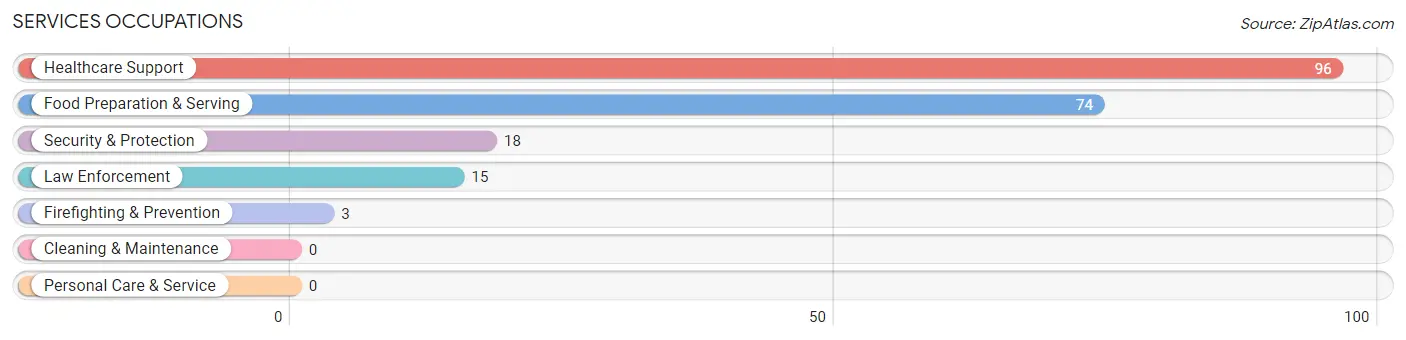
Services Occupations
The most common Services occupations in Yanceyville are Healthcare Support (96 | 13.8%), Food Preparation & Serving (74 | 10.7%), Security & Protection (18 | 2.6%), Law Enforcement (15 | 2.2%), and Firefighting & Prevention (3 | 0.4%).
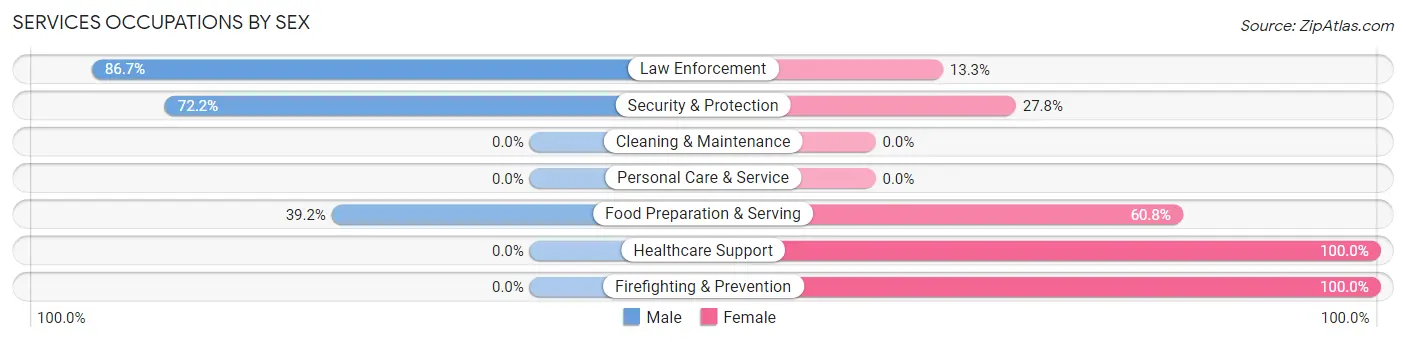
Services Occupations by Sex
Within the Services occupations in Yanceyville, the most male-oriented occupations are Law Enforcement (86.7%), Security & Protection (72.2%), and Food Preparation & Serving (39.2%), while the most female-oriented occupations are Healthcare Support (100.0%), Firefighting & Prevention (100.0%), and Food Preparation & Serving (60.8%).
| Occupation | Male | Female |
| Healthcare Support | 0 (0.0%) | 96 (100.0%) |
| Security & Protection | 13 (72.2%) | 5 (27.8%) |
| Firefighting & Prevention | 0 (0.0%) | 3 (100.0%) |
| Law Enforcement | 13 (86.7%) | 2 (13.3%) |
| Food Preparation & Serving | 29 (39.2%) | 45 (60.8%) |
| Cleaning & Maintenance | 0 (0.0%) | 0 (0.0%) |
| Personal Care & Service | 0 (0.0%) | 0 (0.0%) |
| Total (Category) | 42 (22.3%) | 146 (77.7%) |
| Total (Overall) | 218 (31.4%) | 476 (68.6%) |
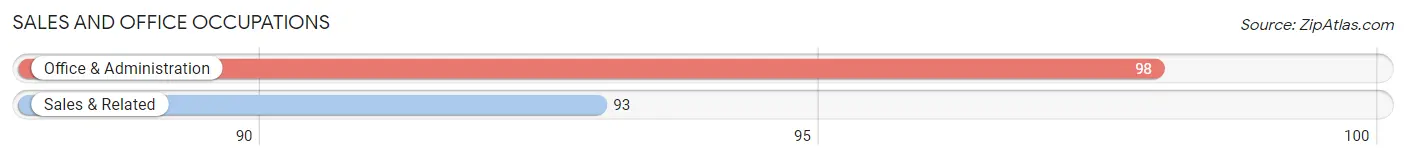
Sales and Office Occupations
The most common Sales and Office occupations in Yanceyville are Office & Administration (98 | 14.1%), and Sales & Related (93 | 13.4%).
Sales and Office Occupations by Sex
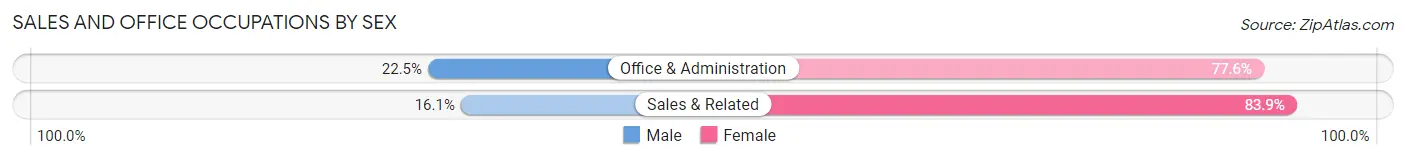
| Occupation | Male | Female |
| Sales & Related | 15 (16.1%) | 78 (83.9%) |
| Office & Administration | 22 (22.5%) | 76 (77.5%) |
| Total (Category) | 37 (19.4%) | 154 (80.6%) |
| Total (Overall) | 218 (31.4%) | 476 (68.6%) |
Natural Resources, Construction and Maintenance Occupations
The most common Natural Resources, Construction and Maintenance occupations in Yanceyville are Installation, Maintenance & Repair (35 | 5.0%), Construction & Extraction (13 | 1.9%), and Farming, Fishing & Forestry (6 | 0.9%).
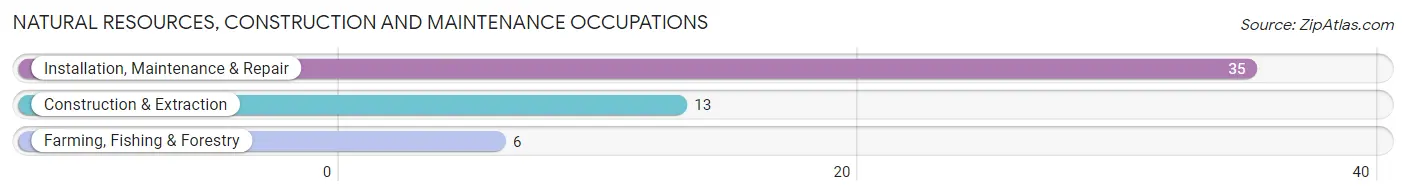
Natural Resources, Construction and Maintenance Occupations by Sex

| Occupation | Male | Female |
| Farming, Fishing & Forestry | 6 (100.0%) | 0 (0.0%) |
| Construction & Extraction | 13 (100.0%) | 0 (0.0%) |
| Installation, Maintenance & Repair | 35 (100.0%) | 0 (0.0%) |
| Total (Category) | 54 (100.0%) | 0 (0.0%) |
| Total (Overall) | 218 (31.4%) | 476 (68.6%) |
Production, Transportation and Moving Occupations
The most common Production, Transportation and Moving occupations in Yanceyville are Material Moving (52 | 7.5%), Production (35 | 5.0%), and Transportation (15 | 2.2%).
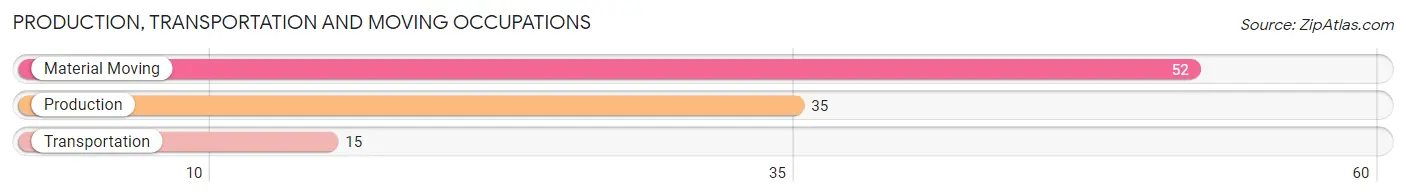
Production, Transportation and Moving Occupations by Sex

| Occupation | Male | Female |
| Production | 9 (25.7%) | 26 (74.3%) |
| Transportation | 15 (100.0%) | 0 (0.0%) |
| Material Moving | 35 (67.3%) | 17 (32.7%) |
| Total (Category) | 59 (57.8%) | 43 (42.2%) |
| Total (Overall) | 218 (31.4%) | 476 (68.6%) |
Employment Industries by Sex in Yanceyville
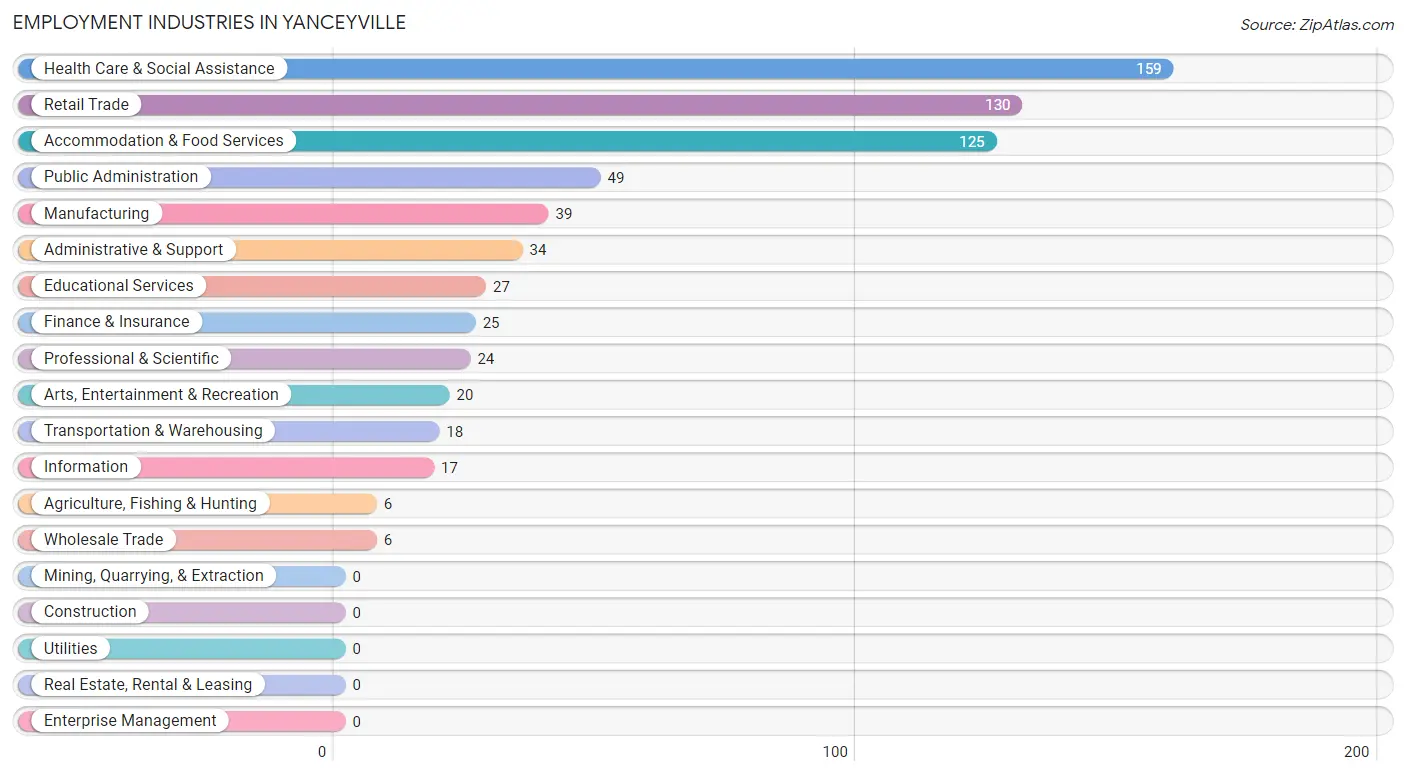
Employment Industries in Yanceyville
The major employment industries in Yanceyville include Health Care & Social Assistance (159 | 22.9%), Retail Trade (130 | 18.7%), Accommodation & Food Services (125 | 18.0%), Public Administration (49 | 7.1%), and Manufacturing (39 | 5.6%).
Employment Industries by Sex in Yanceyville
The Yanceyville industries that see more men than women are Agriculture, Fishing & Hunting (100.0%), Transportation & Warehousing (100.0%), and Arts, Entertainment & Recreation (100.0%), whereas the industries that tend to have a higher number of women are Information (100.0%), Finance & Insurance (100.0%), and Administrative & Support (100.0%).
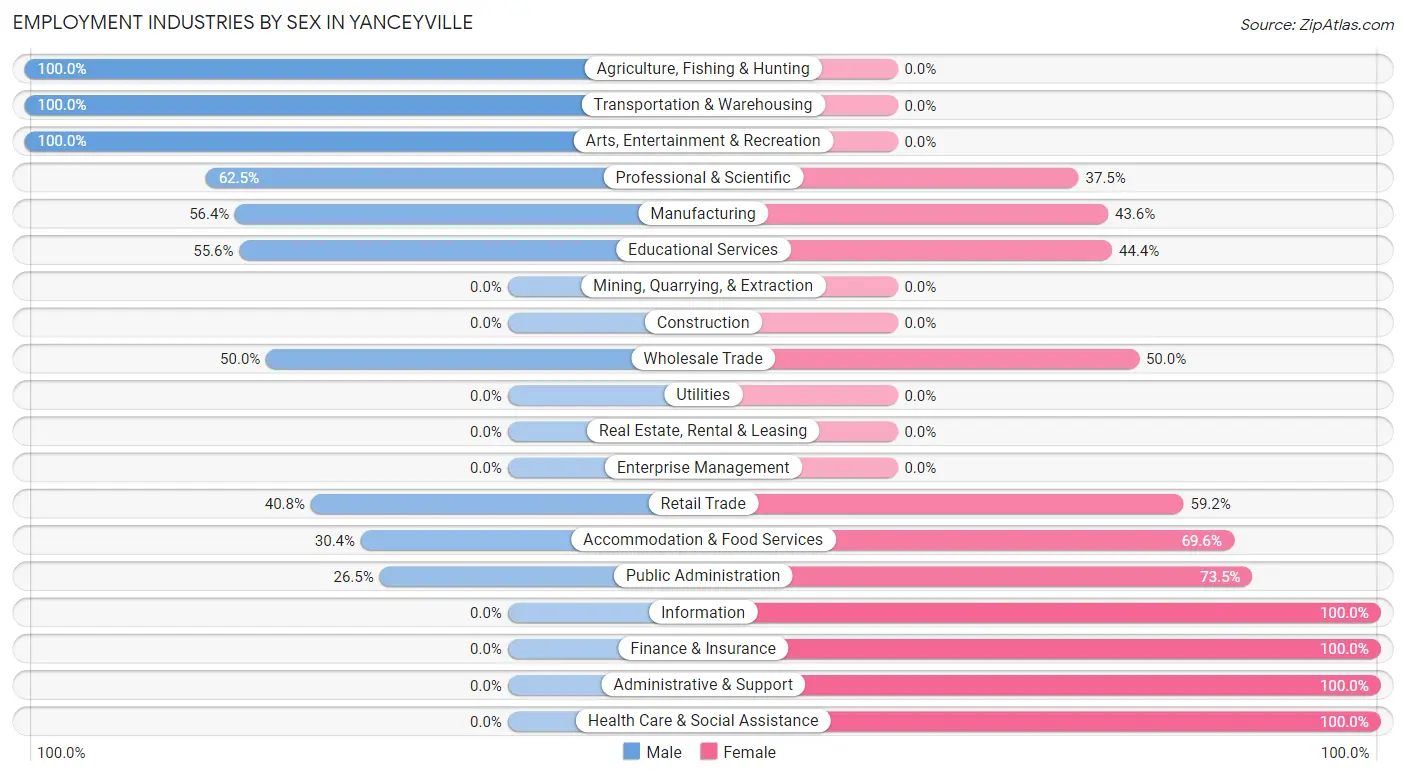
| Industry | Male | Female |
| Agriculture, Fishing & Hunting | 6 (100.0%) | 0 (0.0%) |
| Mining, Quarrying, & Extraction | 0 (0.0%) | 0 (0.0%) |
| Construction | 0 (0.0%) | 0 (0.0%) |
| Manufacturing | 22 (56.4%) | 17 (43.6%) |
| Wholesale Trade | 3 (50.0%) | 3 (50.0%) |
| Retail Trade | 53 (40.8%) | 77 (59.2%) |
| Transportation & Warehousing | 18 (100.0%) | 0 (0.0%) |
| Utilities | 0 (0.0%) | 0 (0.0%) |
| Information | 0 (0.0%) | 17 (100.0%) |
| Finance & Insurance | 0 (0.0%) | 25 (100.0%) |
| Real Estate, Rental & Leasing | 0 (0.0%) | 0 (0.0%) |
| Professional & Scientific | 15 (62.5%) | 9 (37.5%) |
| Enterprise Management | 0 (0.0%) | 0 (0.0%) |
| Administrative & Support | 0 (0.0%) | 34 (100.0%) |
| Educational Services | 15 (55.6%) | 12 (44.4%) |
| Health Care & Social Assistance | 0 (0.0%) | 159 (100.0%) |
| Arts, Entertainment & Recreation | 20 (100.0%) | 0 (0.0%) |
| Accommodation & Food Services | 38 (30.4%) | 87 (69.6%) |
| Public Administration | 13 (26.5%) | 36 (73.5%) |
| Total | 218 (31.4%) | 476 (68.6%) |
Education in Yanceyville
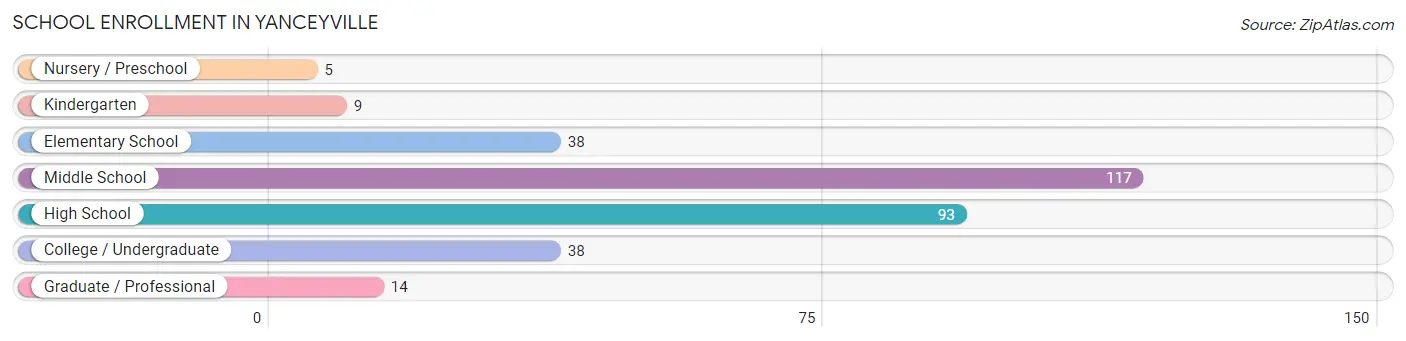
School Enrollment in Yanceyville
The most common levels of schooling among the 314 students in Yanceyville are middle school (117 | 37.3%), high school (93 | 29.6%), and elementary school (38 | 12.1%).
| School Level | # Students | % Students |
| Nursery / Preschool | 5 | 1.6% |
| Kindergarten | 9 | 2.9% |
| Elementary School | 38 | 12.1% |
| Middle School | 117 | 37.3% |
| High School | 93 | 29.6% |
| College / Undergraduate | 38 | 12.1% |
| Graduate / Professional | 14 | 4.5% |
| Total | 314 | 100.0% |
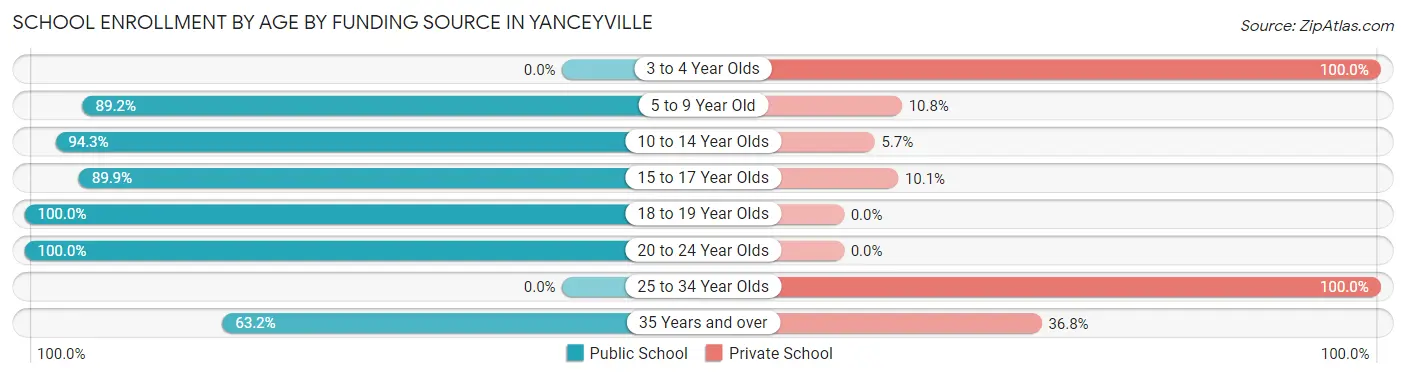
School Enrollment by Age by Funding Source in Yanceyville
Out of a total of 314 students who are enrolled in schools in Yanceyville, 45 (14.3%) attend a private institution, while the remaining 269 (85.7%) are enrolled in public schools. The age group of 3 to 4 year olds has the highest likelihood of being enrolled in private schools, with 5 (100.0% in the age bracket) enrolled. Conversely, the age group of 18 to 19 year olds has the lowest likelihood of being enrolled in a private school, with 27 (100.0% in the age bracket) attending a public institution.
| Age Bracket | Public School | Private School |
| 3 to 4 Year Olds | 0 (0.0%) | 5 (100.0%) |
| 5 to 9 Year Old | 33 (89.2%) | 4 (10.8%) |
| 10 to 14 Year Olds | 115 (94.3%) | 7 (5.7%) |
| 15 to 17 Year Olds | 80 (89.9%) | 9 (10.1%) |
| 18 to 19 Year Olds | 27 (100.0%) | 0 (0.0%) |
| 20 to 24 Year Olds | 2 (100.0%) | 0 (0.0%) |
| 25 to 34 Year Olds | 0 (0.0%) | 13 (100.0%) |
| 35 Years and over | 12 (63.2%) | 7 (36.8%) |
| Total | 269 (85.7%) | 45 (14.3%) |
Educational Attainment by Field of Study in Yanceyville
Business (53 | 29.8%), physical & health sciences (27 | 15.2%), education (22 | 12.4%), bio, nature & agricultural (20 | 11.2%), and literature & languages (18 | 10.1%) are the most common fields of study among 178 individuals in Yanceyville who have obtained a bachelor's degree or higher.
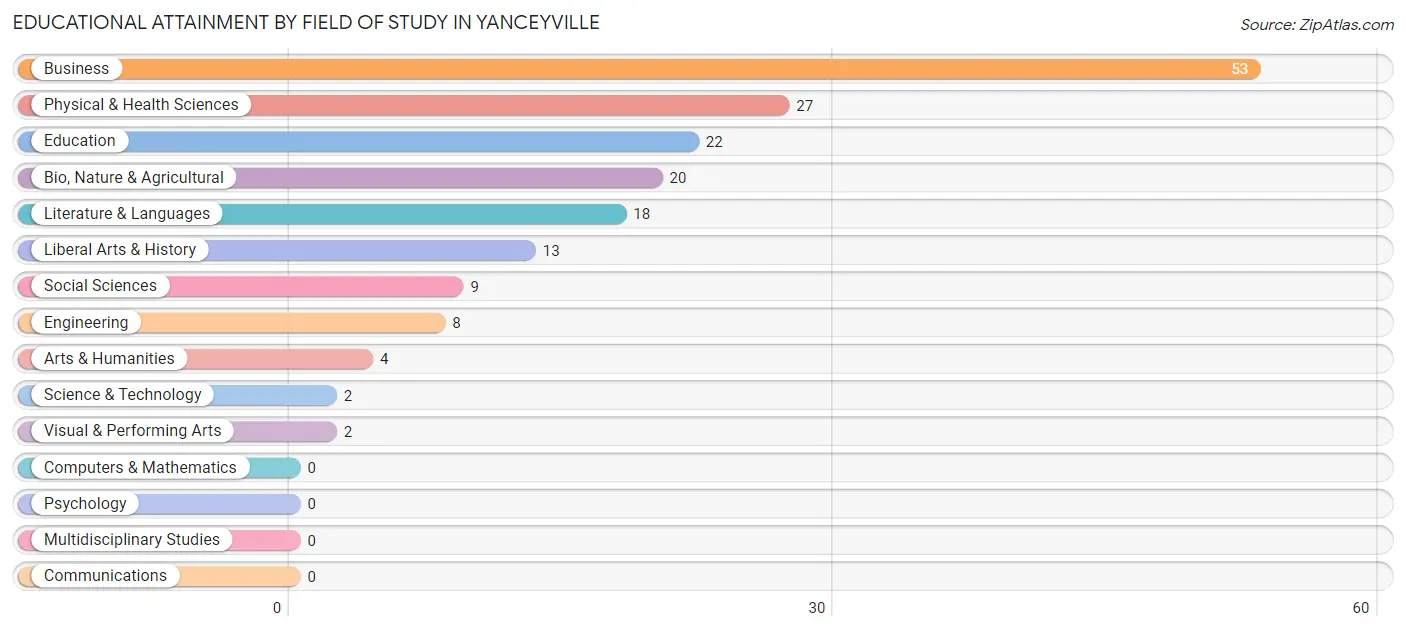
| Field of Study | # Graduates | % Graduates |
| Computers & Mathematics | 0 | 0.0% |
| Bio, Nature & Agricultural | 20 | 11.2% |
| Physical & Health Sciences | 27 | 15.2% |
| Psychology | 0 | 0.0% |
| Social Sciences | 9 | 5.1% |
| Engineering | 8 | 4.5% |
| Multidisciplinary Studies | 0 | 0.0% |
| Science & Technology | 2 | 1.1% |
| Business | 53 | 29.8% |
| Education | 22 | 12.4% |
| Literature & Languages | 18 | 10.1% |
| Liberal Arts & History | 13 | 7.3% |
| Visual & Performing Arts | 2 | 1.1% |
| Communications | 0 | 0.0% |
| Arts & Humanities | 4 | 2.2% |
| Total | 178 | 100.0% |
Transportation & Commute in Yanceyville
Vehicle Availability by Sex in Yanceyville
The most prevalent vehicle ownership categories in Yanceyville are males with 2 vehicles (66, accounting for 32.2%) and females with 2 vehicles (54, making up 14.0%).
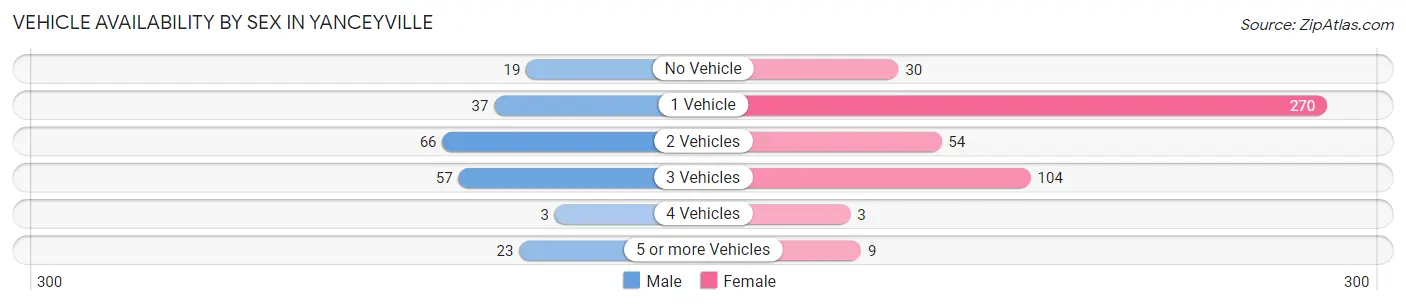
| Vehicles Available | Male | Female |
| No Vehicle | 19 (9.3%) | 30 (6.4%) |
| 1 Vehicle | 37 (18.0%) | 270 (57.5%) |
| 2 Vehicles | 66 (32.2%) | 54 (11.5%) |
| 3 Vehicles | 57 (27.8%) | 104 (22.1%) |
| 4 Vehicles | 3 (1.5%) | 3 (0.6%) |
| 5 or more Vehicles | 23 (11.2%) | 9 (1.9%) |
| Total | 205 (100.0%) | 470 (100.0%) |
Commute Time in Yanceyville
The most frequently occuring commute durations in Yanceyville are 5 to 9 minutes (187 commuters, 28.9%), 45 to 59 minutes (134 commuters, 20.7%), and less than 5 minutes (81 commuters, 12.5%).
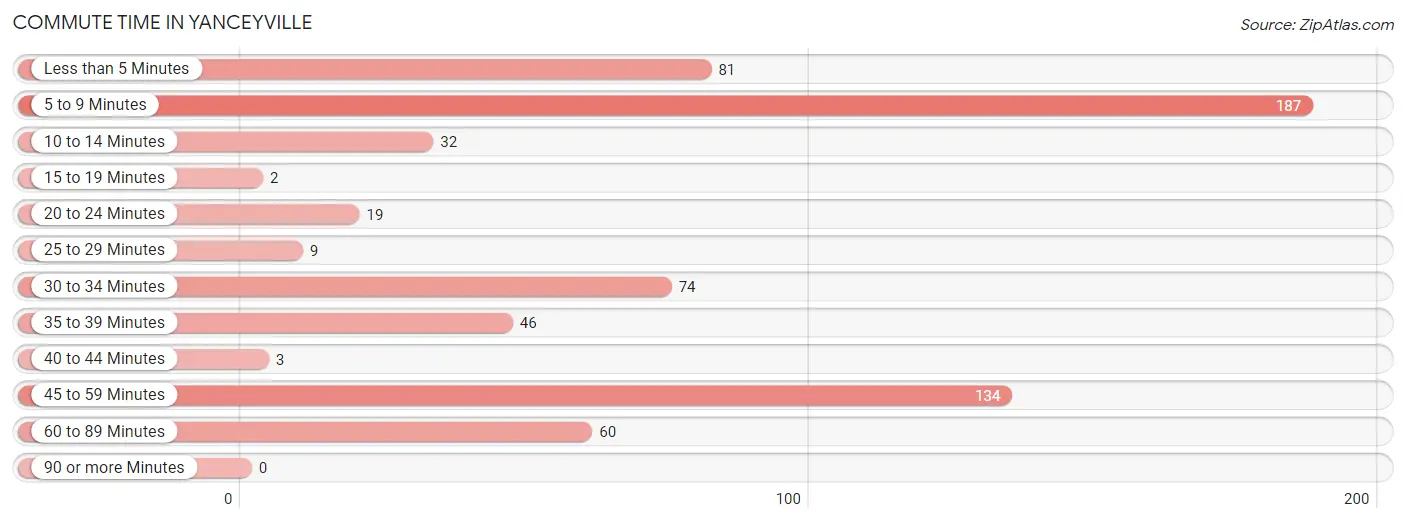
| Commute Time | # Commuters | % Commuters |
| Less than 5 Minutes | 81 | 12.5% |
| 5 to 9 Minutes | 187 | 28.9% |
| 10 to 14 Minutes | 32 | 5.0% |
| 15 to 19 Minutes | 2 | 0.3% |
| 20 to 24 Minutes | 19 | 2.9% |
| 25 to 29 Minutes | 9 | 1.4% |
| 30 to 34 Minutes | 74 | 11.4% |
| 35 to 39 Minutes | 46 | 7.1% |
| 40 to 44 Minutes | 3 | 0.5% |
| 45 to 59 Minutes | 134 | 20.7% |
| 60 to 89 Minutes | 60 | 9.3% |
| 90 or more Minutes | 0 | 0.0% |
Commute Time by Sex in Yanceyville
The most common commute times in Yanceyville are 5 to 9 minutes (76 commuters, 39.0%) for males and 45 to 59 minutes (118 commuters, 26.1%) for females.
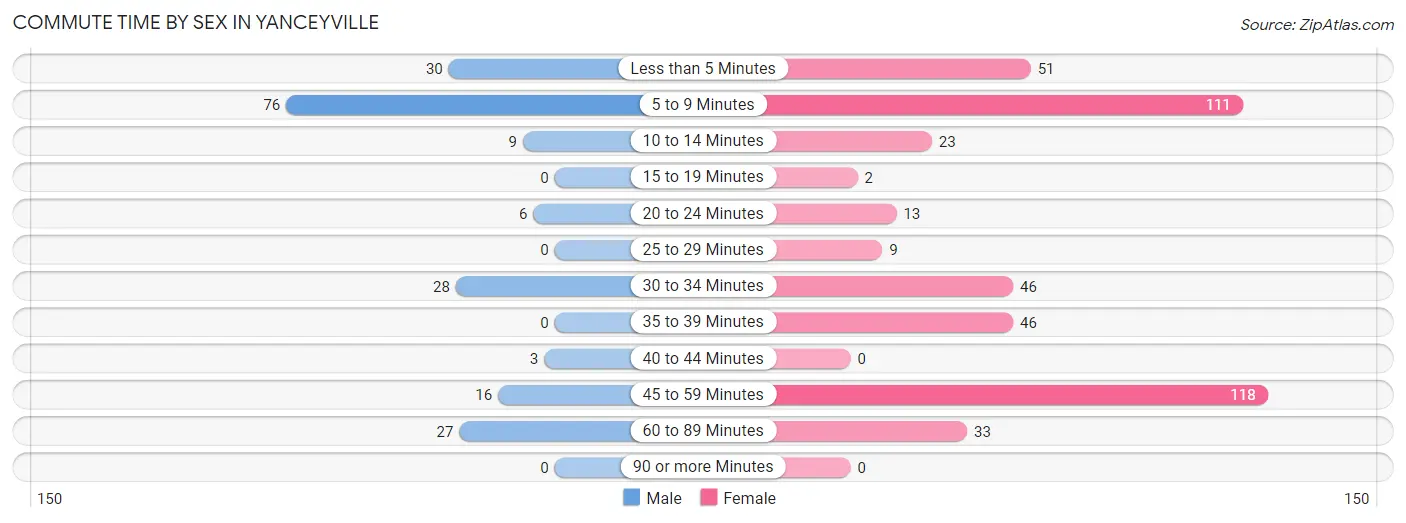
| Commute Time | Male | Female |
| Less than 5 Minutes | 30 (15.4%) | 51 (11.3%) |
| 5 to 9 Minutes | 76 (39.0%) | 111 (24.6%) |
| 10 to 14 Minutes | 9 (4.6%) | 23 (5.1%) |
| 15 to 19 Minutes | 0 (0.0%) | 2 (0.4%) |
| 20 to 24 Minutes | 6 (3.1%) | 13 (2.9%) |
| 25 to 29 Minutes | 0 (0.0%) | 9 (2.0%) |
| 30 to 34 Minutes | 28 (14.4%) | 46 (10.2%) |
| 35 to 39 Minutes | 0 (0.0%) | 46 (10.2%) |
| 40 to 44 Minutes | 3 (1.5%) | 0 (0.0%) |
| 45 to 59 Minutes | 16 (8.2%) | 118 (26.1%) |
| 60 to 89 Minutes | 27 (13.9%) | 33 (7.3%) |
| 90 or more Minutes | 0 (0.0%) | 0 (0.0%) |
Time of Departure to Work by Sex in Yanceyville
The most frequent times of departure to work in Yanceyville are 7:30 AM to 7:59 AM (44, 22.6%) for males and 7:30 AM to 7:59 AM (103, 22.8%) for females.
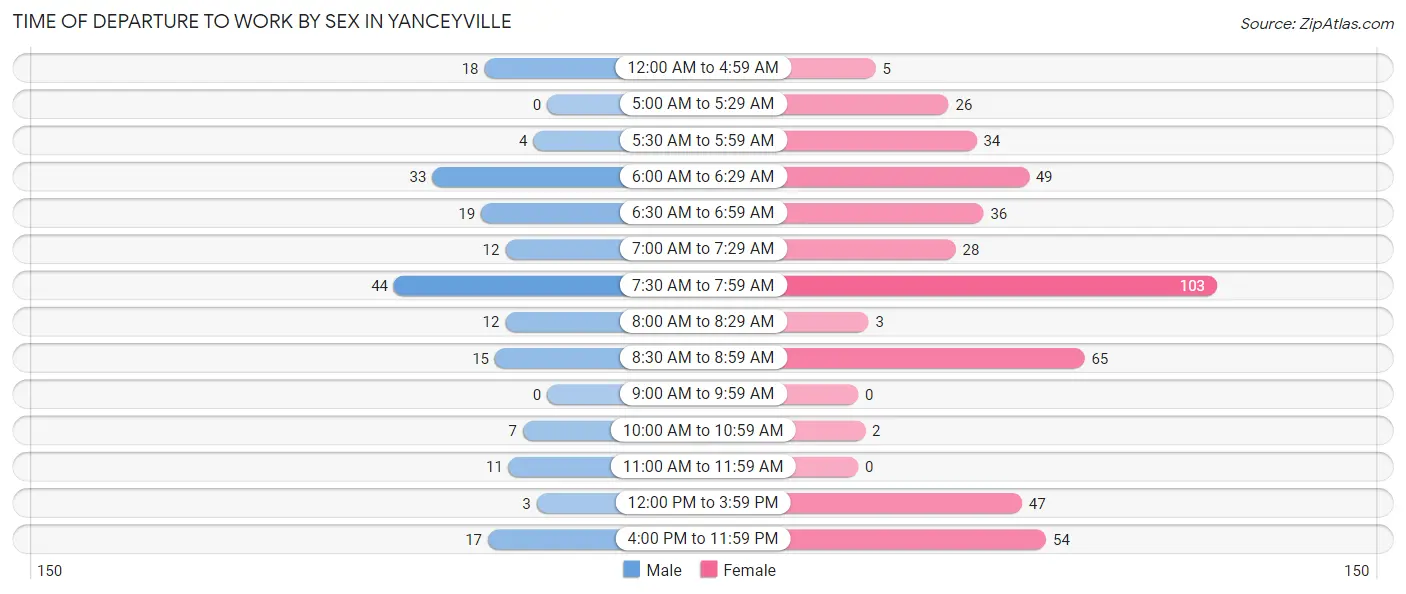
| Time of Departure | Male | Female |
| 12:00 AM to 4:59 AM | 18 (9.2%) | 5 (1.1%) |
| 5:00 AM to 5:29 AM | 0 (0.0%) | 26 (5.8%) |
| 5:30 AM to 5:59 AM | 4 (2.1%) | 34 (7.5%) |
| 6:00 AM to 6:29 AM | 33 (16.9%) | 49 (10.8%) |
| 6:30 AM to 6:59 AM | 19 (9.7%) | 36 (8.0%) |
| 7:00 AM to 7:29 AM | 12 (6.1%) | 28 (6.2%) |
| 7:30 AM to 7:59 AM | 44 (22.6%) | 103 (22.8%) |
| 8:00 AM to 8:29 AM | 12 (6.1%) | 3 (0.7%) |
| 8:30 AM to 8:59 AM | 15 (7.7%) | 65 (14.4%) |
| 9:00 AM to 9:59 AM | 0 (0.0%) | 0 (0.0%) |
| 10:00 AM to 10:59 AM | 7 (3.6%) | 2 (0.4%) |
| 11:00 AM to 11:59 AM | 11 (5.6%) | 0 (0.0%) |
| 12:00 PM to 3:59 PM | 3 (1.5%) | 47 (10.4%) |
| 4:00 PM to 11:59 PM | 17 (8.7%) | 54 (11.9%) |
| Total | 195 (100.0%) | 452 (100.0%) |
Housing Occupancy in Yanceyville
Occupancy by Ownership in Yanceyville
Of the total 994 dwellings in Yanceyville, owner-occupied units account for 364 (36.6%), while renter-occupied units make up 630 (63.4%).
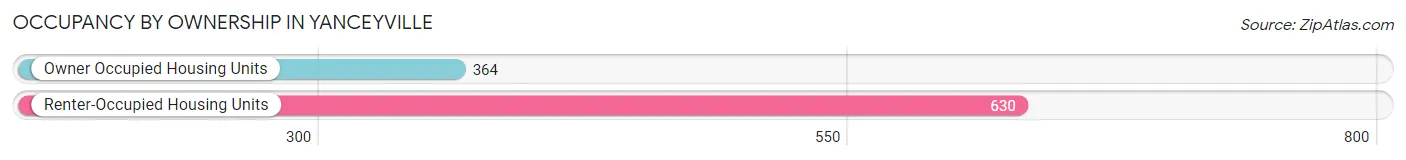
| Occupancy | # Housing Units | % Housing Units |
| Owner Occupied Housing Units | 364 | 36.6% |
| Renter-Occupied Housing Units | 630 | 63.4% |
| Total Occupied Housing Units | 994 | 100.0% |
Occupancy by Household Size in Yanceyville
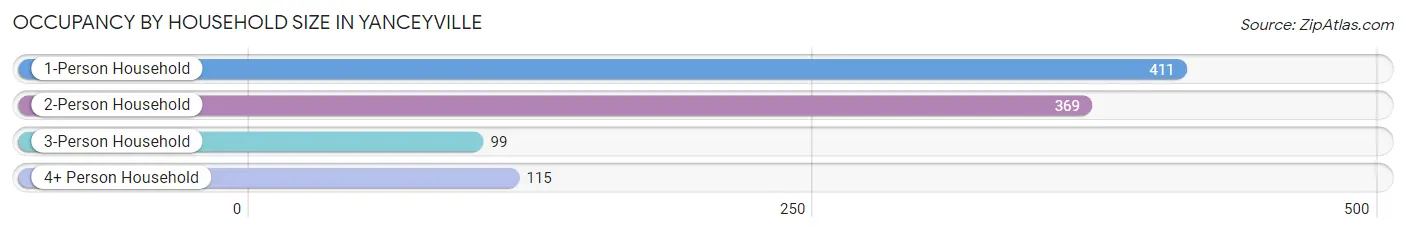
| Household Size | # Housing Units | % Housing Units |
| 1-Person Household | 411 | 41.3% |
| 2-Person Household | 369 | 37.1% |
| 3-Person Household | 99 | 10.0% |
| 4+ Person Household | 115 | 11.6% |
| Total Housing Units | 994 | 100.0% |
Occupancy by Ownership by Household Size in Yanceyville
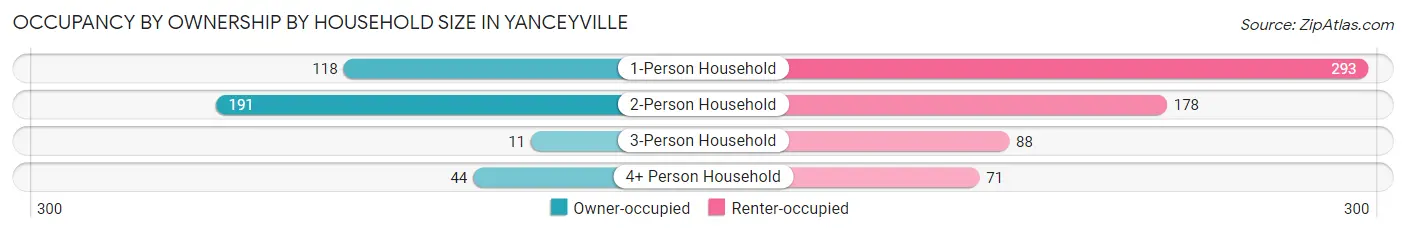
| Household Size | Owner-occupied | Renter-occupied |
| 1-Person Household | 118 (28.7%) | 293 (71.3%) |
| 2-Person Household | 191 (51.8%) | 178 (48.2%) |
| 3-Person Household | 11 (11.1%) | 88 (88.9%) |
| 4+ Person Household | 44 (38.3%) | 71 (61.7%) |
| Total Housing Units | 364 (36.6%) | 630 (63.4%) |
Occupancy by Educational Attainment in Yanceyville
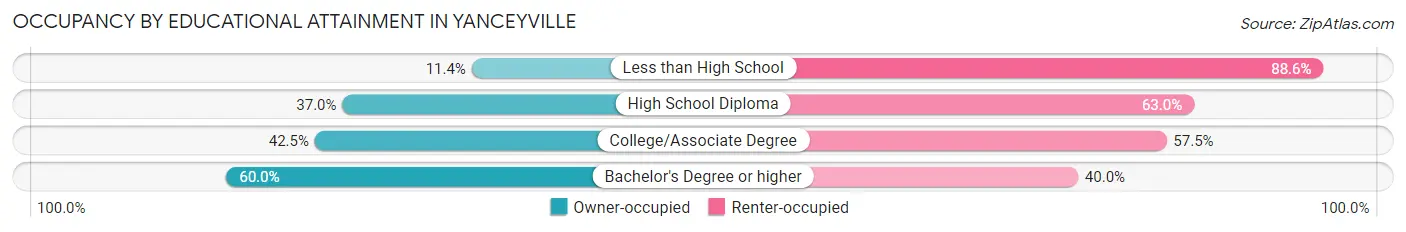
| Household Size | Owner-occupied | Renter-occupied |
| Less than High School | 20 (11.4%) | 156 (88.6%) |
| High School Diploma | 165 (37.0%) | 281 (63.0%) |
| College/Associate Degree | 107 (42.5%) | 145 (57.5%) |
| Bachelor's Degree or higher | 72 (60.0%) | 48 (40.0%) |
Occupancy by Age of Householder in Yanceyville
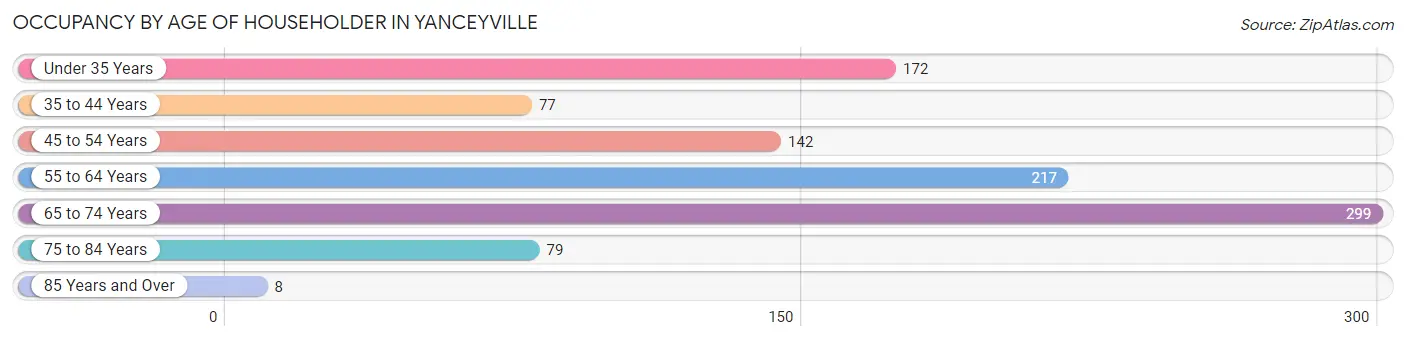
| Age Bracket | # Households | % Households |
| Under 35 Years | 172 | 17.3% |
| 35 to 44 Years | 77 | 7.7% |
| 45 to 54 Years | 142 | 14.3% |
| 55 to 64 Years | 217 | 21.8% |
| 65 to 74 Years | 299 | 30.1% |
| 75 to 84 Years | 79 | 8.0% |
| 85 Years and Over | 8 | 0.8% |
| Total | 994 | 100.0% |
Housing Finances in Yanceyville
Median Income by Occupancy in Yanceyville
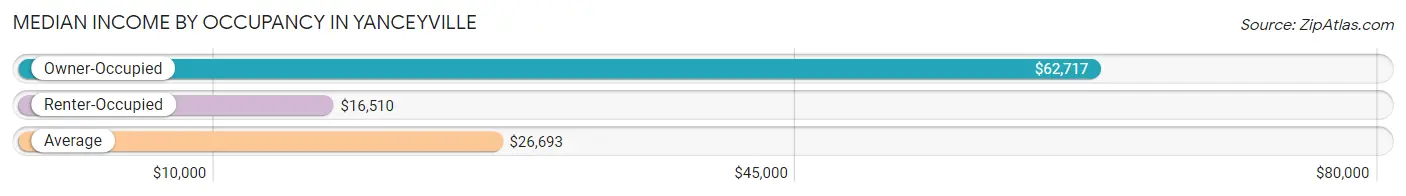
| Occupancy Type | # Households | Median Income |
| Owner-Occupied | 364 (36.6%) | $62,717 |
| Renter-Occupied | 630 (63.4%) | $16,510 |
| Average | 994 (100.0%) | $26,693 |
Occupancy by Householder Income Bracket in Yanceyville
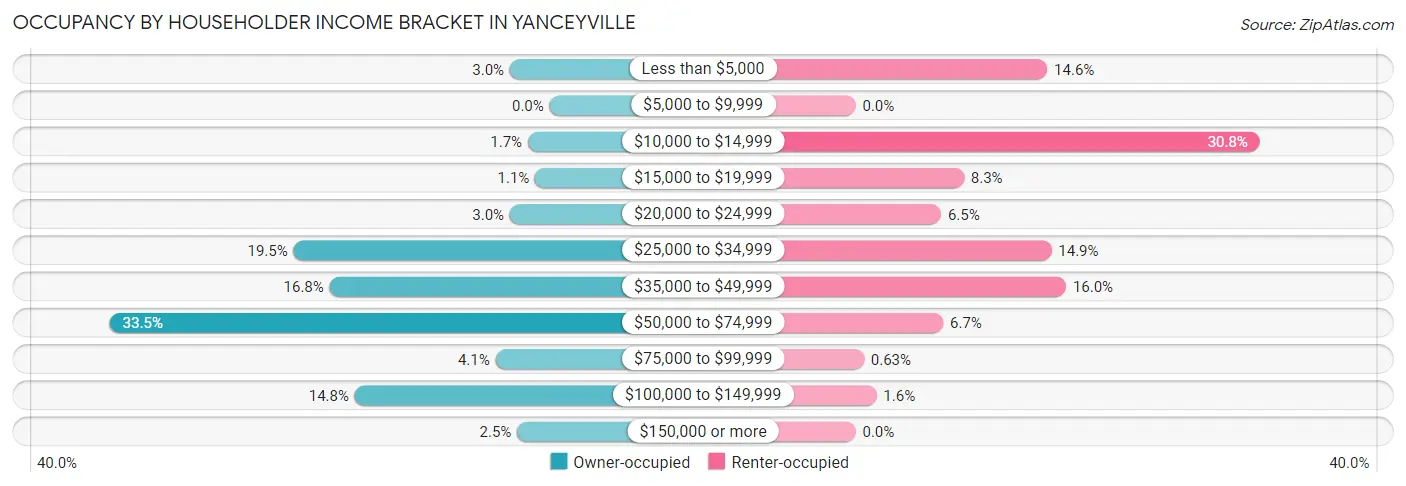
| Income Bracket | Owner-occupied | Renter-occupied |
| Less than $5,000 | 11 (3.0%) | 92 (14.6%) |
| $5,000 to $9,999 | 0 (0.0%) | 0 (0.0%) |
| $10,000 to $14,999 | 6 (1.7%) | 194 (30.8%) |
| $15,000 to $19,999 | 4 (1.1%) | 52 (8.3%) |
| $20,000 to $24,999 | 11 (3.0%) | 41 (6.5%) |
| $25,000 to $34,999 | 71 (19.5%) | 94 (14.9%) |
| $35,000 to $49,999 | 61 (16.8%) | 101 (16.0%) |
| $50,000 to $74,999 | 122 (33.5%) | 42 (6.7%) |
| $75,000 to $99,999 | 15 (4.1%) | 4 (0.6%) |
| $100,000 to $149,999 | 54 (14.8%) | 10 (1.6%) |
| $150,000 or more | 9 (2.5%) | 0 (0.0%) |
| Total | 364 (100.0%) | 630 (100.0%) |
Monthly Housing Cost Tiers in Yanceyville
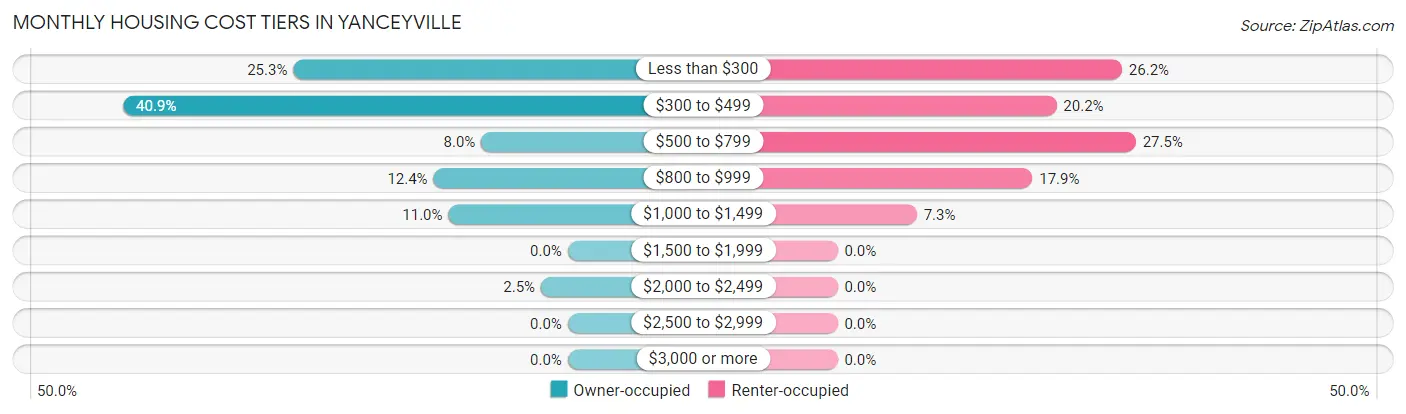
| Monthly Cost | Owner-occupied | Renter-occupied |
| Less than $300 | 92 (25.3%) | 165 (26.2%) |
| $300 to $499 | 149 (40.9%) | 127 (20.2%) |
| $500 to $799 | 29 (8.0%) | 173 (27.5%) |
| $800 to $999 | 45 (12.4%) | 113 (17.9%) |
| $1,000 to $1,499 | 40 (11.0%) | 46 (7.3%) |
| $1,500 to $1,999 | 0 (0.0%) | 0 (0.0%) |
| $2,000 to $2,499 | 9 (2.5%) | 0 (0.0%) |
| $2,500 to $2,999 | 0 (0.0%) | 0 (0.0%) |
| $3,000 or more | 0 (0.0%) | 0 (0.0%) |
| Total | 364 (100.0%) | 630 (100.0%) |
Physical Housing Characteristics in Yanceyville
Housing Structures in Yanceyville
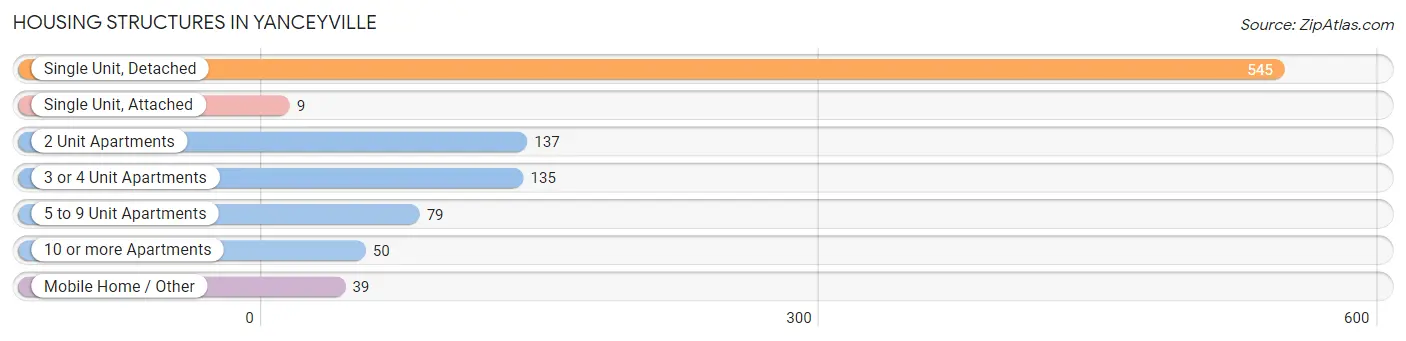
| Structure Type | # Housing Units | % Housing Units |
| Single Unit, Detached | 545 | 54.8% |
| Single Unit, Attached | 9 | 0.9% |
| 2 Unit Apartments | 137 | 13.8% |
| 3 or 4 Unit Apartments | 135 | 13.6% |
| 5 to 9 Unit Apartments | 79 | 8.0% |
| 10 or more Apartments | 50 | 5.0% |
| Mobile Home / Other | 39 | 3.9% |
| Total | 994 | 100.0% |
Housing Structures by Occupancy in Yanceyville
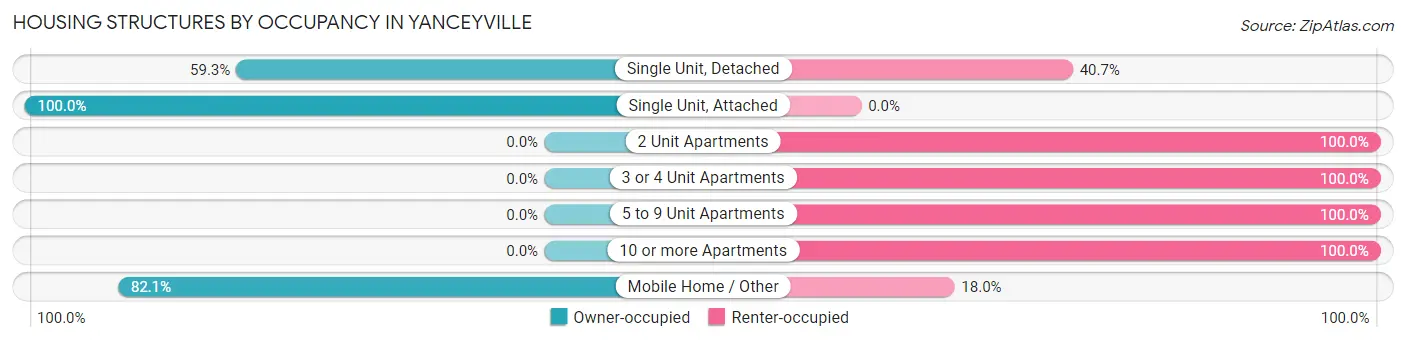
| Structure Type | Owner-occupied | Renter-occupied |
| Single Unit, Detached | 323 (59.3%) | 222 (40.7%) |
| Single Unit, Attached | 9 (100.0%) | 0 (0.0%) |
| 2 Unit Apartments | 0 (0.0%) | 137 (100.0%) |
| 3 or 4 Unit Apartments | 0 (0.0%) | 135 (100.0%) |
| 5 to 9 Unit Apartments | 0 (0.0%) | 79 (100.0%) |
| 10 or more Apartments | 0 (0.0%) | 50 (100.0%) |
| Mobile Home / Other | 32 (82.1%) | 7 (17.9%) |
| Total | 364 (36.6%) | 630 (63.4%) |
Housing Structures by Number of Rooms in Yanceyville
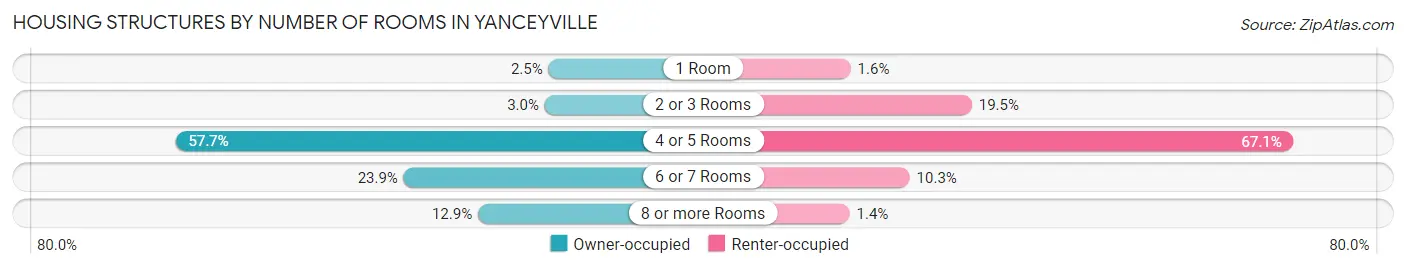
| Number of Rooms | Owner-occupied | Renter-occupied |
| 1 Room | 9 (2.5%) | 10 (1.6%) |
| 2 or 3 Rooms | 11 (3.0%) | 123 (19.5%) |
| 4 or 5 Rooms | 210 (57.7%) | 423 (67.1%) |
| 6 or 7 Rooms | 87 (23.9%) | 65 (10.3%) |
| 8 or more Rooms | 47 (12.9%) | 9 (1.4%) |
| Total | 364 (100.0%) | 630 (100.0%) |
Housing Structure by Heating Type in Yanceyville
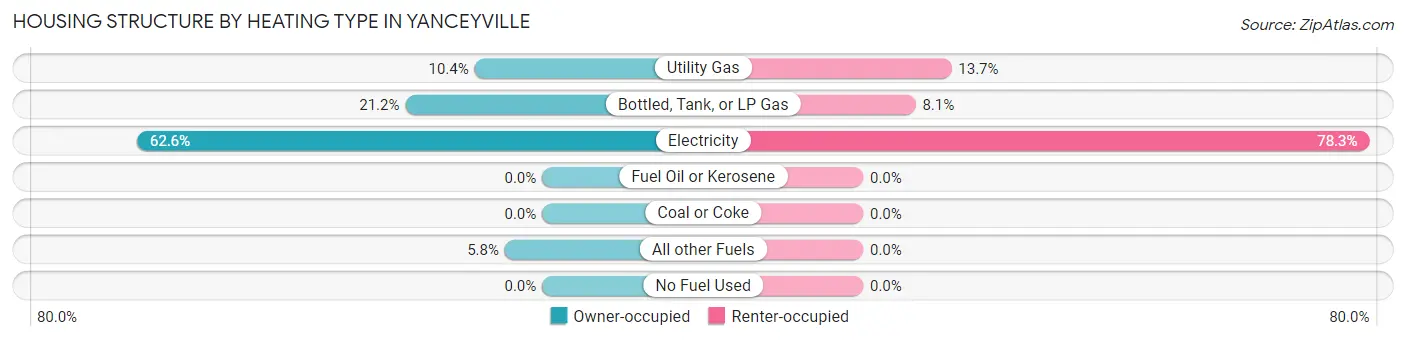
| Heating Type | Owner-occupied | Renter-occupied |
| Utility Gas | 38 (10.4%) | 86 (13.7%) |
| Bottled, Tank, or LP Gas | 77 (21.1%) | 51 (8.1%) |
| Electricity | 228 (62.6%) | 493 (78.2%) |
| Fuel Oil or Kerosene | 0 (0.0%) | 0 (0.0%) |
| Coal or Coke | 0 (0.0%) | 0 (0.0%) |
| All other Fuels | 21 (5.8%) | 0 (0.0%) |
| No Fuel Used | 0 (0.0%) | 0 (0.0%) |
| Total | 364 (100.0%) | 630 (100.0%) |
Household Vehicle Usage in Yanceyville
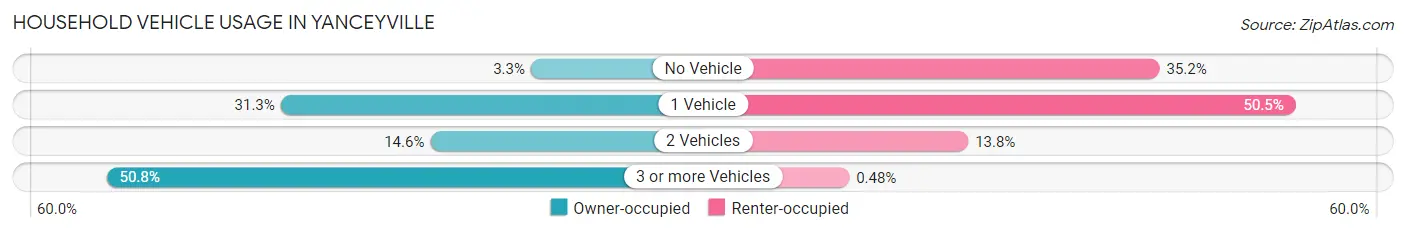
| Vehicles per Household | Owner-occupied | Renter-occupied |
| No Vehicle | 12 (3.3%) | 222 (35.2%) |
| 1 Vehicle | 114 (31.3%) | 318 (50.5%) |
| 2 Vehicles | 53 (14.6%) | 87 (13.8%) |
| 3 or more Vehicles | 185 (50.8%) | 3 (0.5%) |
| Total | 364 (100.0%) | 630 (100.0%) |
Real Estate & Mortgages in Yanceyville
Real Estate and Mortgage Overview in Yanceyville
| Characteristic | Without Mortgage | With Mortgage |
| Housing Units | 265 | 99 |
| Median Property Value | $127,300 | $165,400 |
| Median Household Income | $46,250 | $9 |
| Monthly Housing Costs | $366 | $0 |
| Real Estate Taxes | $805 | $0 |
Property Value by Mortgage Status in Yanceyville
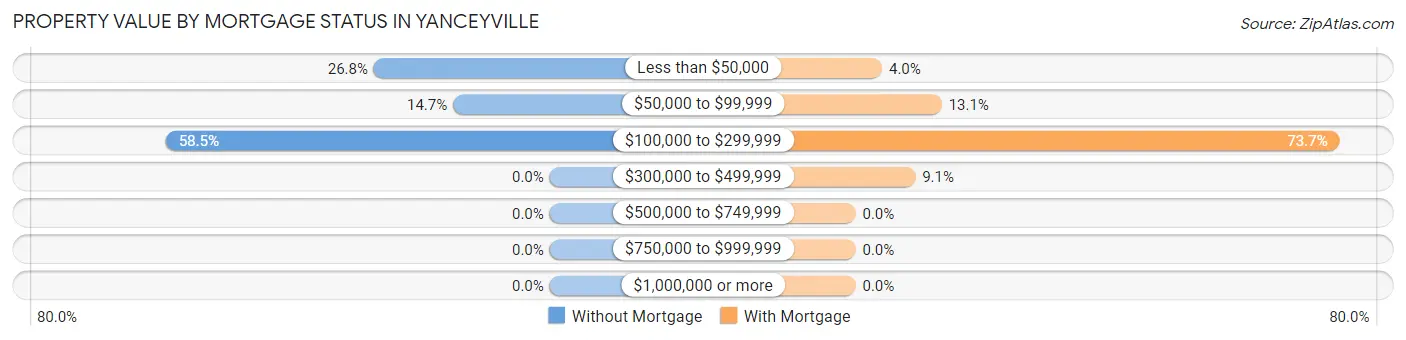
| Property Value | Without Mortgage | With Mortgage |
| Less than $50,000 | 71 (26.8%) | 4 (4.0%) |
| $50,000 to $99,999 | 39 (14.7%) | 13 (13.1%) |
| $100,000 to $299,999 | 155 (58.5%) | 73 (73.7%) |
| $300,000 to $499,999 | 0 (0.0%) | 9 (9.1%) |
| $500,000 to $749,999 | 0 (0.0%) | 0 (0.0%) |
| $750,000 to $999,999 | 0 (0.0%) | 0 (0.0%) |
| $1,000,000 or more | 0 (0.0%) | 0 (0.0%) |
| Total | 265 (100.0%) | 99 (100.0%) |
Household Income by Mortgage Status in Yanceyville
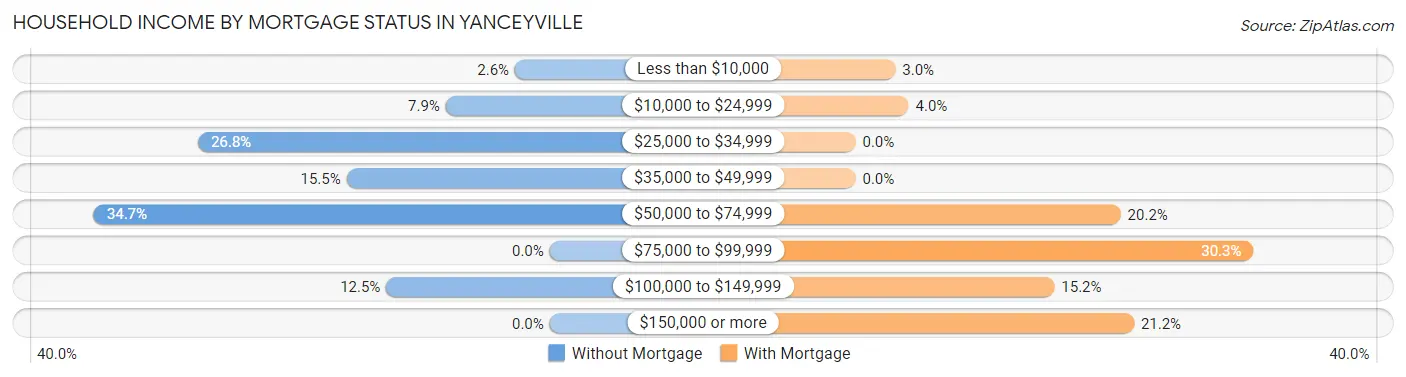
| Household Income | Without Mortgage | With Mortgage |
| Less than $10,000 | 7 (2.6%) | 3 (3.0%) |
| $10,000 to $24,999 | 21 (7.9%) | 4 (4.0%) |
| $25,000 to $34,999 | 71 (26.8%) | 0 (0.0%) |
| $35,000 to $49,999 | 41 (15.5%) | 0 (0.0%) |
| $50,000 to $74,999 | 92 (34.7%) | 20 (20.2%) |
| $75,000 to $99,999 | 0 (0.0%) | 30 (30.3%) |
| $100,000 to $149,999 | 33 (12.4%) | 15 (15.1%) |
| $150,000 or more | 0 (0.0%) | 21 (21.2%) |
| Total | 265 (100.0%) | 99 (100.0%) |
Property Value to Household Income Ratio in Yanceyville
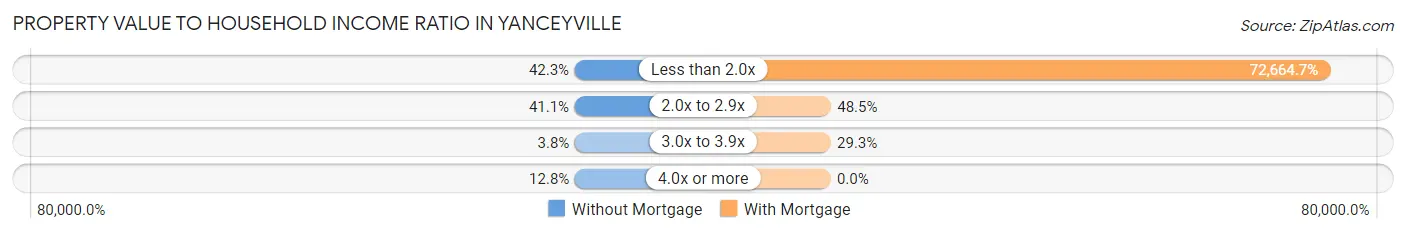
| Value-to-Income Ratio | Without Mortgage | With Mortgage |
| Less than 2.0x | 112 (42.3%) | 71,938 (72,664.6%) |
| 2.0x to 2.9x | 109 (41.1%) | 48 (48.5%) |
| 3.0x to 3.9x | 10 (3.8%) | 29 (29.3%) |
| 4.0x or more | 34 (12.8%) | 0 (0.0%) |
| Total | 265 (100.0%) | 99 (100.0%) |
Real Estate Taxes by Mortgage Status in Yanceyville
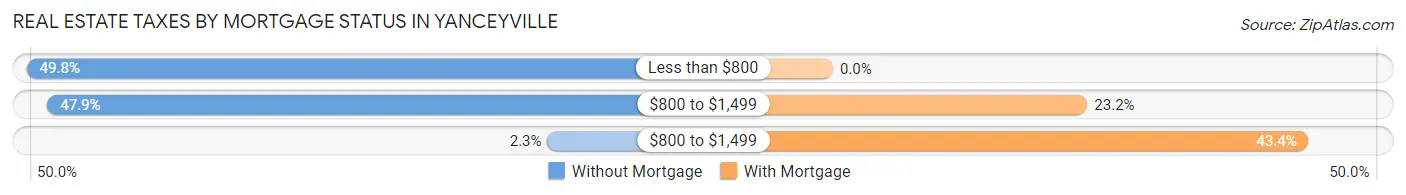
| Property Taxes | Without Mortgage | With Mortgage |
| Less than $800 | 132 (49.8%) | 0 (0.0%) |
| $800 to $1,499 | 127 (47.9%) | 23 (23.2%) |
| $800 to $1,499 | 6 (2.3%) | 43 (43.4%) |
| Total | 265 (100.0%) | 99 (100.0%) |
Health & Disability in Yanceyville
Health Insurance Coverage by Age in Yanceyville
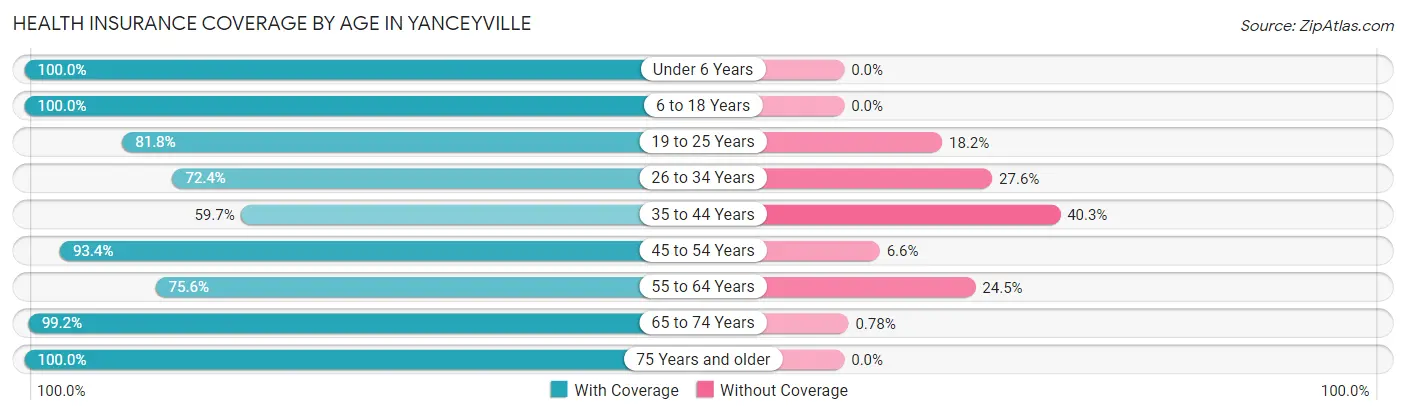
| Age Bracket | With Coverage | Without Coverage |
| Under 6 Years | 167 (100.0%) | 0 (0.0%) |
| 6 to 18 Years | 275 (100.0%) | 0 (0.0%) |
| 19 to 25 Years | 121 (81.8%) | 27 (18.2%) |
| 26 to 34 Years | 155 (72.4%) | 59 (27.6%) |
| 35 to 44 Years | 92 (59.7%) | 62 (40.3%) |
| 45 to 54 Years | 198 (93.4%) | 14 (6.6%) |
| 55 to 64 Years | 241 (75.5%) | 78 (24.4%) |
| 65 to 74 Years | 384 (99.2%) | 3 (0.8%) |
| 75 Years and older | 123 (100.0%) | 0 (0.0%) |
| Total | 1,756 (87.8%) | 243 (12.2%) |
Health Insurance Coverage by Citizenship Status in Yanceyville
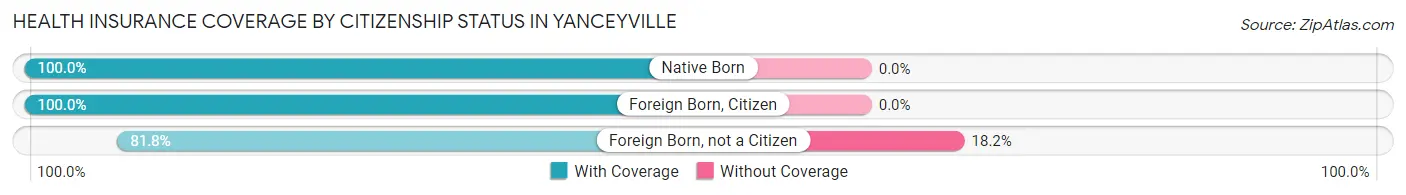
| Citizenship Status | With Coverage | Without Coverage |
| Native Born | 167 (100.0%) | 0 (0.0%) |
| Foreign Born, Citizen | 275 (100.0%) | 0 (0.0%) |
| Foreign Born, not a Citizen | 121 (81.8%) | 27 (18.2%) |
Health Insurance Coverage by Household Income in Yanceyville
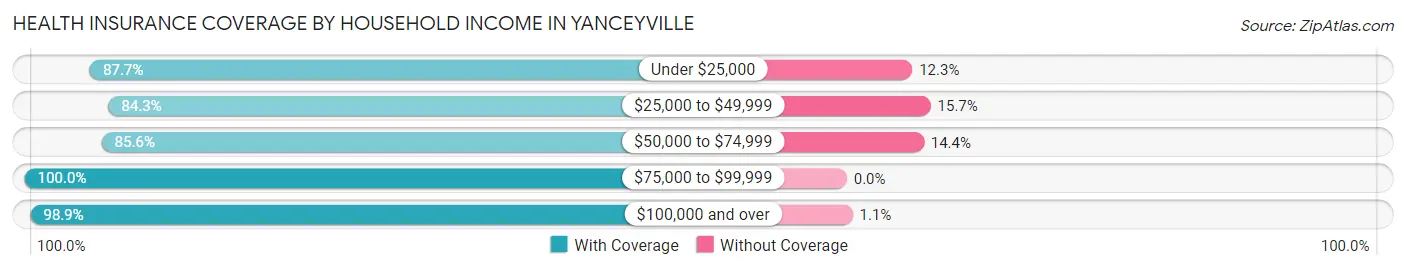
| Household Income | With Coverage | Without Coverage |
| Under $25,000 | 637 (87.7%) | 89 (12.3%) |
| $25,000 to $49,999 | 510 (84.3%) | 95 (15.7%) |
| $50,000 to $74,999 | 338 (85.6%) | 57 (14.4%) |
| $75,000 to $99,999 | 87 (100.0%) | 0 (0.0%) |
| $100,000 and over | 184 (98.9%) | 2 (1.1%) |
Public vs Private Health Insurance Coverage by Age in Yanceyville
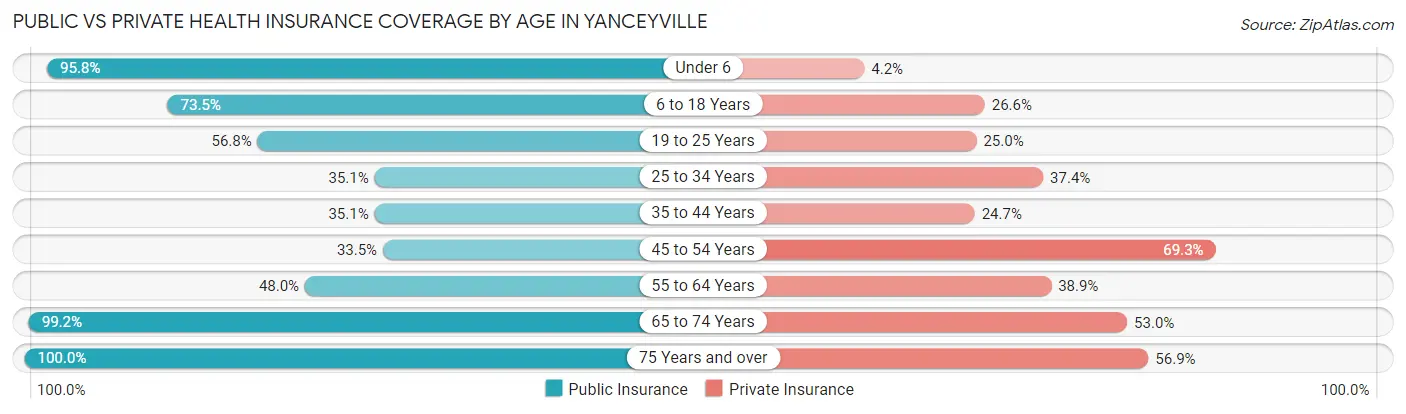
| Age Bracket | Public Insurance | Private Insurance |
| Under 6 | 160 (95.8%) | 7 (4.2%) |
| 6 to 18 Years | 202 (73.5%) | 73 (26.6%) |
| 19 to 25 Years | 84 (56.8%) | 37 (25.0%) |
| 25 to 34 Years | 75 (35.0%) | 80 (37.4%) |
| 35 to 44 Years | 54 (35.1%) | 38 (24.7%) |
| 45 to 54 Years | 71 (33.5%) | 147 (69.3%) |
| 55 to 64 Years | 153 (48.0%) | 124 (38.9%) |
| 65 to 74 Years | 384 (99.2%) | 205 (53.0%) |
| 75 Years and over | 123 (100.0%) | 70 (56.9%) |
| Total | 1,306 (65.3%) | 781 (39.1%) |
Disability Status by Sex by Age in Yanceyville
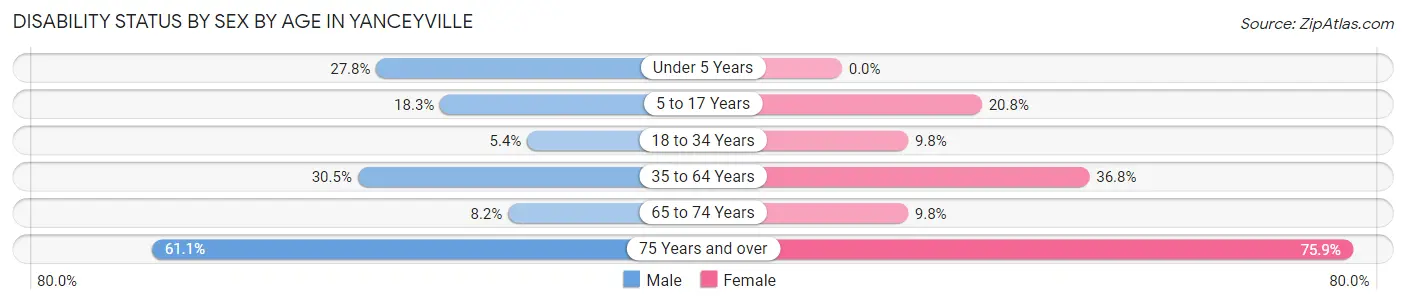
| Age Bracket | Male | Female |
| Under 5 Years | 25 (27.8%) | 0 (0.0%) |
| 5 to 17 Years | 32 (18.3%) | 16 (20.8%) |
| 18 to 34 Years | 11 (5.4%) | 19 (9.8%) |
| 35 to 64 Years | 87 (30.5%) | 147 (36.7%) |
| 65 to 74 Years | 10 (8.2%) | 26 (9.8%) |
| 75 Years and over | 22 (61.1%) | 66 (75.9%) |
Disability Class by Sex by Age in Yanceyville
Disability Class: Hearing Difficulty
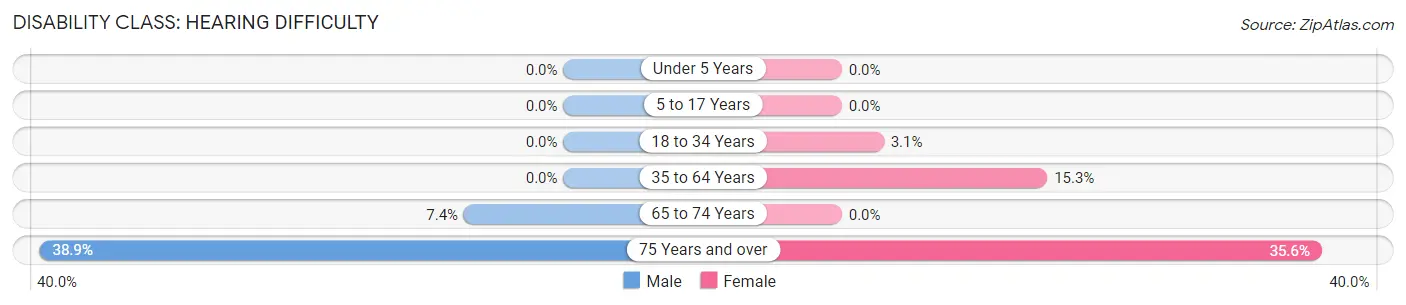
| Age Bracket | Male | Female |
| Under 5 Years | 0 (0.0%) | 0 (0.0%) |
| 5 to 17 Years | 0 (0.0%) | 0 (0.0%) |
| 18 to 34 Years | 0 (0.0%) | 6 (3.1%) |
| 35 to 64 Years | 0 (0.0%) | 61 (15.2%) |
| 65 to 74 Years | 9 (7.4%) | 0 (0.0%) |
| 75 Years and over | 14 (38.9%) | 31 (35.6%) |
Disability Class: Vision Difficulty
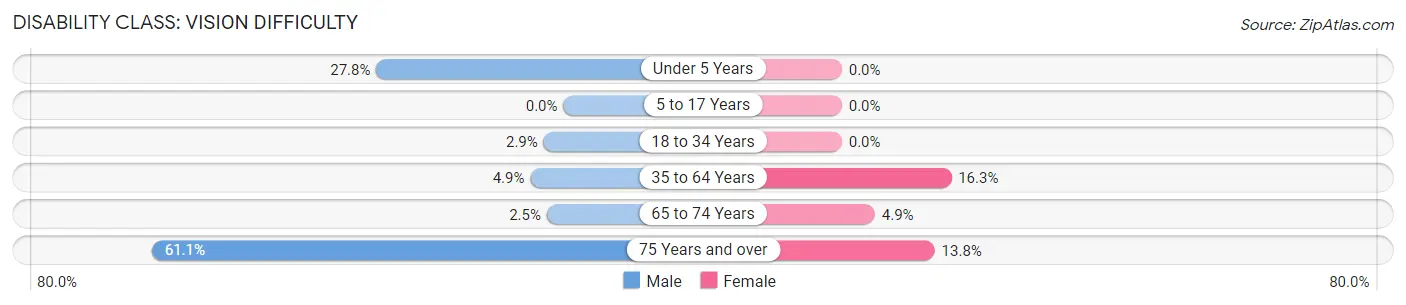
| Age Bracket | Male | Female |
| Under 5 Years | 25 (27.8%) | 0 (0.0%) |
| 5 to 17 Years | 0 (0.0%) | 0 (0.0%) |
| 18 to 34 Years | 6 (2.9%) | 0 (0.0%) |
| 35 to 64 Years | 14 (4.9%) | 65 (16.3%) |
| 65 to 74 Years | 3 (2.5%) | 13 (4.9%) |
| 75 Years and over | 22 (61.1%) | 12 (13.8%) |
Disability Class: Cognitive Difficulty
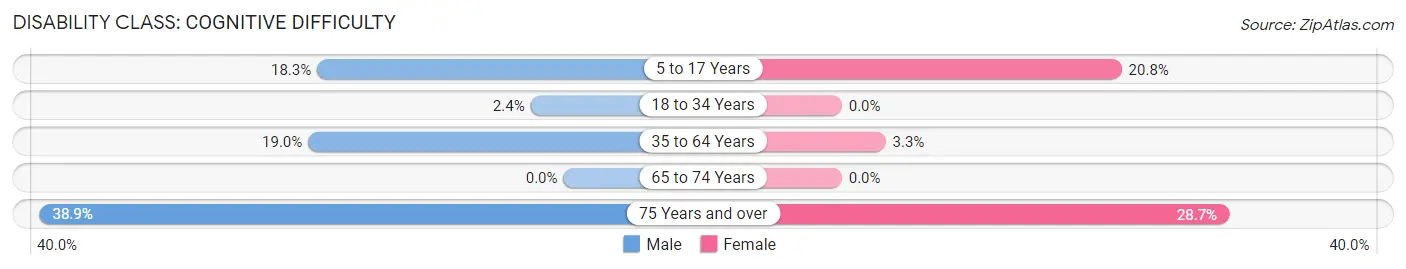
| Age Bracket | Male | Female |
| 5 to 17 Years | 32 (18.3%) | 16 (20.8%) |
| 18 to 34 Years | 5 (2.4%) | 0 (0.0%) |
| 35 to 64 Years | 54 (19.0%) | 13 (3.3%) |
| 65 to 74 Years | 0 (0.0%) | 0 (0.0%) |
| 75 Years and over | 14 (38.9%) | 25 (28.7%) |
Disability Class: Ambulatory Difficulty
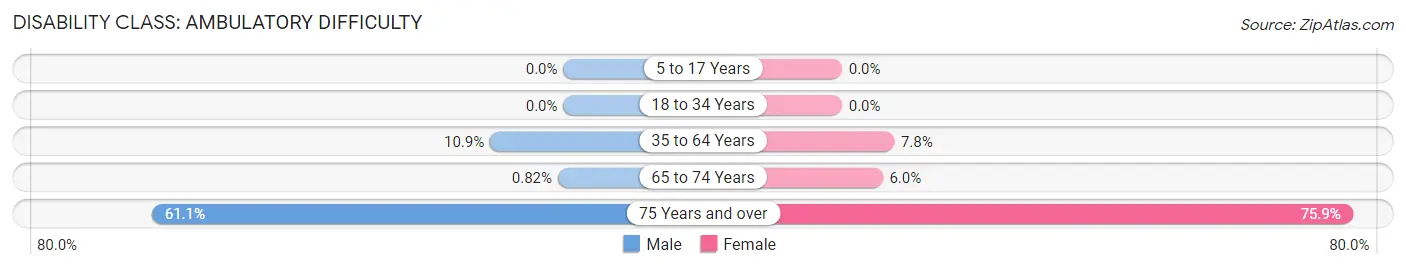
| Age Bracket | Male | Female |
| 5 to 17 Years | 0 (0.0%) | 0 (0.0%) |
| 18 to 34 Years | 0 (0.0%) | 0 (0.0%) |
| 35 to 64 Years | 31 (10.9%) | 31 (7.7%) |
| 65 to 74 Years | 1 (0.8%) | 16 (6.0%) |
| 75 Years and over | 22 (61.1%) | 66 (75.9%) |
Disability Class: Self-Care Difficulty
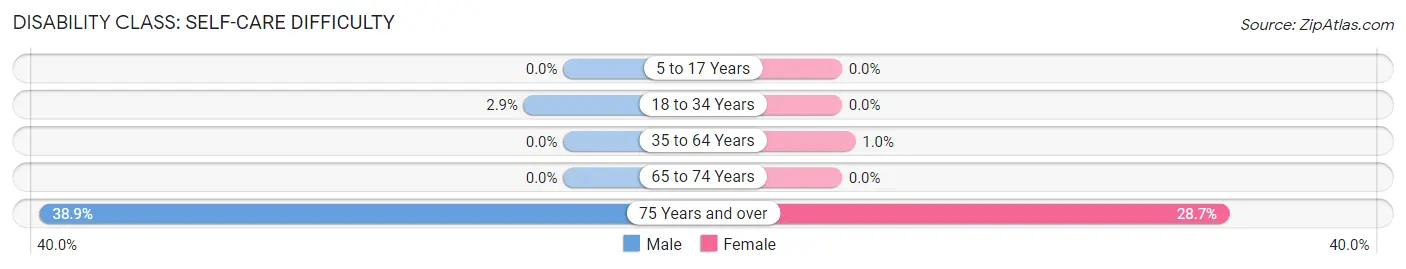
| Age Bracket | Male | Female |
| 5 to 17 Years | 0 (0.0%) | 0 (0.0%) |
| 18 to 34 Years | 6 (2.9%) | 0 (0.0%) |
| 35 to 64 Years | 0 (0.0%) | 4 (1.0%) |
| 65 to 74 Years | 0 (0.0%) | 0 (0.0%) |
| 75 Years and over | 14 (38.9%) | 25 (28.7%) |
Technology Access in Yanceyville
Computing Device Access in Yanceyville
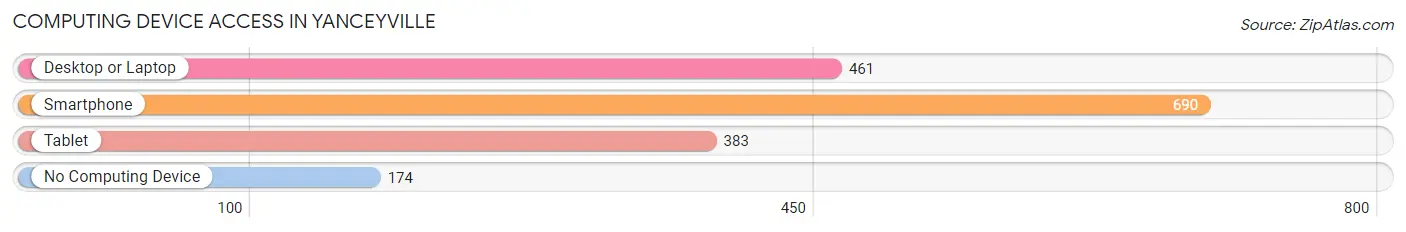
| Device Type | # Households | % Households |
| Desktop or Laptop | 461 | 46.4% |
| Smartphone | 690 | 69.4% |
| Tablet | 383 | 38.5% |
| No Computing Device | 174 | 17.5% |
| Total | 994 | 100.0% |
Internet Access in Yanceyville
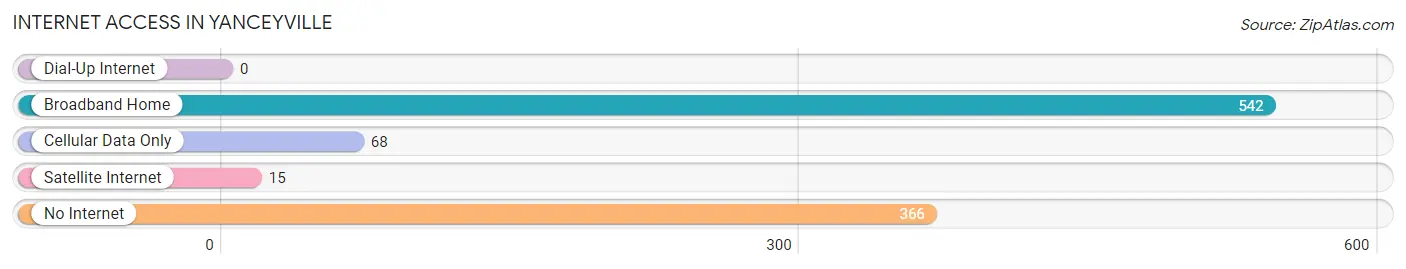
| Internet Type | # Households | % Households |
| Dial-Up Internet | 0 | 0.0% |
| Broadband Home | 542 | 54.5% |
| Cellular Data Only | 68 | 6.8% |
| Satellite Internet | 15 | 1.5% |
| No Internet | 366 | 36.8% |
| Total | 994 | 100.0% |
Yanceyville Summary
Yanceyville is a small town located in Caswell County, North Carolina. It is the county seat of Caswell County and is located in the Piedmont region of the state. The town was founded in 1792 and named after Bartlett Yancey, a prominent North Carolina politician. The population of Yanceyville was 1,817 at the 2010 census.
Geography
Yanceyville is located at 36°25'25" North, 79°25'25" West (36.423, -79.423). It is situated in the Piedmont region of North Carolina, approximately 50 miles northeast of Greensboro and 70 miles west of Raleigh. The town is located in the Dan River watershed and is surrounded by rolling hills and farmland.
Economy
Yanceyville's economy is largely based on agriculture and manufacturing. The town is home to several small businesses, including a furniture factory, a textile mill, and a lumber mill. The town also has a small retail sector, with several stores and restaurants.
Demographics
As of the 2010 census, the population of Yanceyville was 1,817. The racial makeup of the town was 79.3% White, 17.2% African American, 0.3% Native American, 0.3% Asian, 0.1% Pacific Islander, 1.2% from other races, and 1.7% from two or more races. Hispanic or Latino of any race were 2.7% of the population.
The median income for a household in Yanceyville was $30,938, and the median income for a family was $37,917. Males had a median income of $30,000 versus $21,250 for females. The per capita income for the town was $15,945. About 16.2% of families and 19.2% of the population were below the poverty line, including 25.2% of those under age 18 and 16.7% of those age 65 or over.
History
Yanceyville was founded in 1792 and named after Bartlett Yancey, a prominent North Carolina politician. The town was originally a trading post and was the site of a Revolutionary War battle in 1781. In the 19th century, Yanceyville became a center of industry, with several factories and mills being built in the area. The town was also home to several prominent politicians, including former North Carolina Governor Zebulon Vance.
Yanceyville experienced a period of decline in the 20th century, as many of the factories and mills closed. However, the town has seen a resurgence in recent years, with several new businesses opening in the area. The town is also home to several historic sites, including the Yanceyville Historic District, which is listed on the National Register of Historic Places.
Common Questions
What is Per Capita Income in Yanceyville?
Per Capita income in Yanceyville is $15,726.
What is the Median Family Income in Yanceyville?
Median Family Income in Yanceyville is $43,470.
What is the Median Household income in Yanceyville?
Median Household Income in Yanceyville is $26,693.
What is Income or Wage Gap in Yanceyville?
Income or Wage Gap in Yanceyville is 14.8%.
Women in Yanceyville earn 85.2 cents for every dollar earned by a man.
What is Inequality or Gini Index in Yanceyville?
Inequality or Gini Index in Yanceyville is 0.46.
What is the Total Population of Yanceyville?
Total Population of Yanceyville is 2,576.
What is the Total Male Population of Yanceyville?
Total Male Population of Yanceyville is 1,422.
What is the Total Female Population of Yanceyville?
Total Female Population of Yanceyville is 1,154.
What is the Ratio of Males per 100 Females in Yanceyville?
There are 123.22 Males per 100 Females in Yanceyville.
What is the Ratio of Females per 100 Males in Yanceyville?
There are 81.15 Females per 100 Males in Yanceyville.
What is the Median Population Age in Yanceyville?
Median Population Age in Yanceyville is 46.0 Years.
What is the Average Family Size in Yanceyville
Average Family Size in Yanceyville is 2.6 People.
What is the Average Household Size in Yanceyville
Average Household Size in Yanceyville is 2.0 People.
How Large is the Labor Force in Yanceyville?
There are 747 People in the Labor Forcein in Yanceyville.
What is the Percentage of People in the Labor Force in Yanceyville?
33.6% of People are in the Labor Force in Yanceyville.
What is the Unemployment Rate in Yanceyville?
Unemployment Rate in Yanceyville is 7.2%.