Manns Harbor, NC Map & Demographics
Manns Harbor Map
Manns Harbor Overview
$26,620
PER CAPITA INCOME
$52,000
AVG FAMILY INCOME
$49,250
AVG HOUSEHOLD INCOME
51.9%
WAGE / INCOME GAP [ % ]
48.1¢/ $1
WAGE / INCOME GAP [ $ ]
0.39
INEQUALITY / GINI INDEX
673
TOTAL POPULATION
392
MALE POPULATION
281
FEMALE POPULATION
139.50
MALES / 100 FEMALES
71.68
FEMALES / 100 MALES
40.4
MEDIAN AGE
3.1
AVG FAMILY SIZE
1.9
AVG HOUSEHOLD SIZE
356
LABOR FORCE [ PEOPLE ]
73.3%
PERCENT IN LABOR FORCE
Manns Harbor Zip Codes
Manns Harbor Area Codes
Income in Manns Harbor
Income Overview in Manns Harbor
Per Capita Income in Manns Harbor is $26,620, while median incomes of families and households are $52,000 and $49,250 respectively.
| Characteristic | Number | Measure |
| Per Capita Income | 673 | $26,620 |
| Median Family Income | 148 | $52,000 |
| Mean Family Income | 148 | $60,153 |
| Median Household Income | 347 | $49,250 |
| Mean Household Income | 347 | $52,398 |
| Income Deficit | 148 | $0 |
| Wage / Income Gap (%) | 673 | 51.90% |
| Wage / Income Gap ($) | 673 | 48.10¢ per $1 |
| Gini / Inequality Index | 673 | 0.39 |
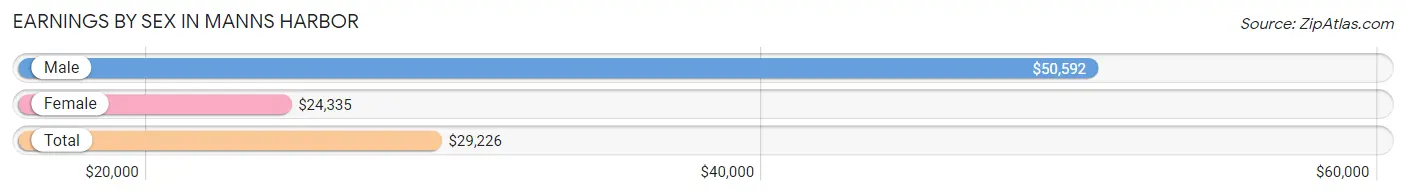
Earnings by Sex in Manns Harbor
Average Earnings in Manns Harbor are $29,226, $50,592 for men and $24,335 for women, a difference of 51.9%.
| Sex | Number | Average Earnings |
| Male | 181 (50.3%) | $50,592 |
| Female | 179 (49.7%) | $24,335 |
| Total | 360 (100.0%) | $29,226 |
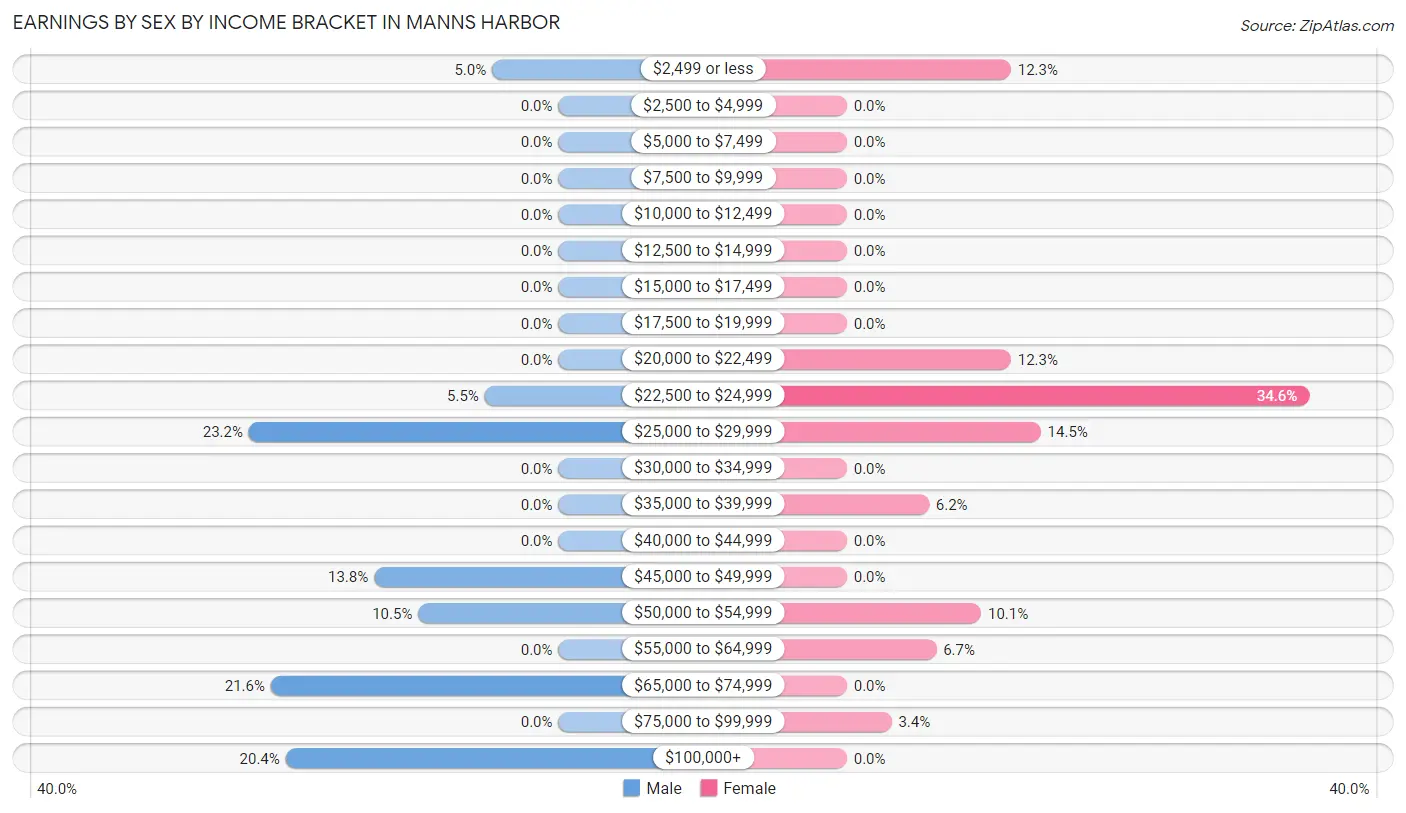
Earnings by Sex by Income Bracket in Manns Harbor
The most common earnings brackets in Manns Harbor are $25,000 to $29,999 for men (42 | 23.2%) and $22,500 to $24,999 for women (62 | 34.6%).
| Income | Male | Female |
| $2,499 or less | 9 (5.0%) | 22 (12.3%) |
| $2,500 to $4,999 | 0 (0.0%) | 0 (0.0%) |
| $5,000 to $7,499 | 0 (0.0%) | 0 (0.0%) |
| $7,500 to $9,999 | 0 (0.0%) | 0 (0.0%) |
| $10,000 to $12,499 | 0 (0.0%) | 0 (0.0%) |
| $12,500 to $14,999 | 0 (0.0%) | 0 (0.0%) |
| $15,000 to $17,499 | 0 (0.0%) | 0 (0.0%) |
| $17,500 to $19,999 | 0 (0.0%) | 0 (0.0%) |
| $20,000 to $22,499 | 0 (0.0%) | 22 (12.3%) |
| $22,500 to $24,999 | 10 (5.5%) | 62 (34.6%) |
| $25,000 to $29,999 | 42 (23.2%) | 26 (14.5%) |
| $30,000 to $34,999 | 0 (0.0%) | 0 (0.0%) |
| $35,000 to $39,999 | 0 (0.0%) | 11 (6.1%) |
| $40,000 to $44,999 | 0 (0.0%) | 0 (0.0%) |
| $45,000 to $49,999 | 25 (13.8%) | 0 (0.0%) |
| $50,000 to $54,999 | 19 (10.5%) | 18 (10.1%) |
| $55,000 to $64,999 | 0 (0.0%) | 12 (6.7%) |
| $65,000 to $74,999 | 39 (21.5%) | 0 (0.0%) |
| $75,000 to $99,999 | 0 (0.0%) | 6 (3.4%) |
| $100,000+ | 37 (20.4%) | 0 (0.0%) |
| Total | 181 (100.0%) | 179 (100.0%) |
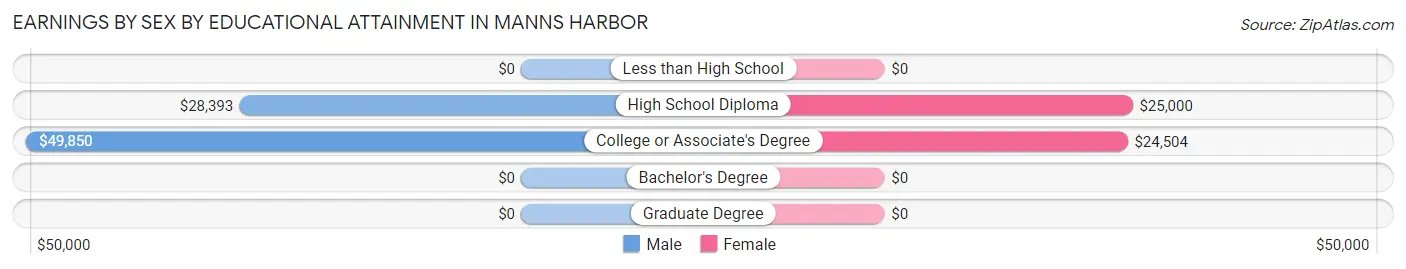
Earnings by Sex by Educational Attainment in Manns Harbor
Average earnings in Manns Harbor are $52,039 for men and $24,335 for women, a difference of 53.2%. Men with an educational attainment of college or associate's degree enjoy the highest average annual earnings of $49,850, while those with high school diploma education earn the least with $28,393. Women with an educational attainment of high school diploma earn the most with the average annual earnings of $25,000, while those with college or associate's degree education have the smallest earnings of $24,504.
| Educational Attainment | Male Income | Female Income |
| Less than High School | - | - |
| High School Diploma | $28,393 | $25,000 |
| College or Associate's Degree | $49,850 | $24,504 |
| Bachelor's Degree | - | - |
| Graduate Degree | - | - |
| Total | $52,039 | $24,335 |
Family Income in Manns Harbor
Family Income Brackets in Manns Harbor
According to the Manns Harbor family income data, there are 47 families falling into the $50,000 to $74,999 income range, which is the most common income bracket and makes up 31.8% of all families.
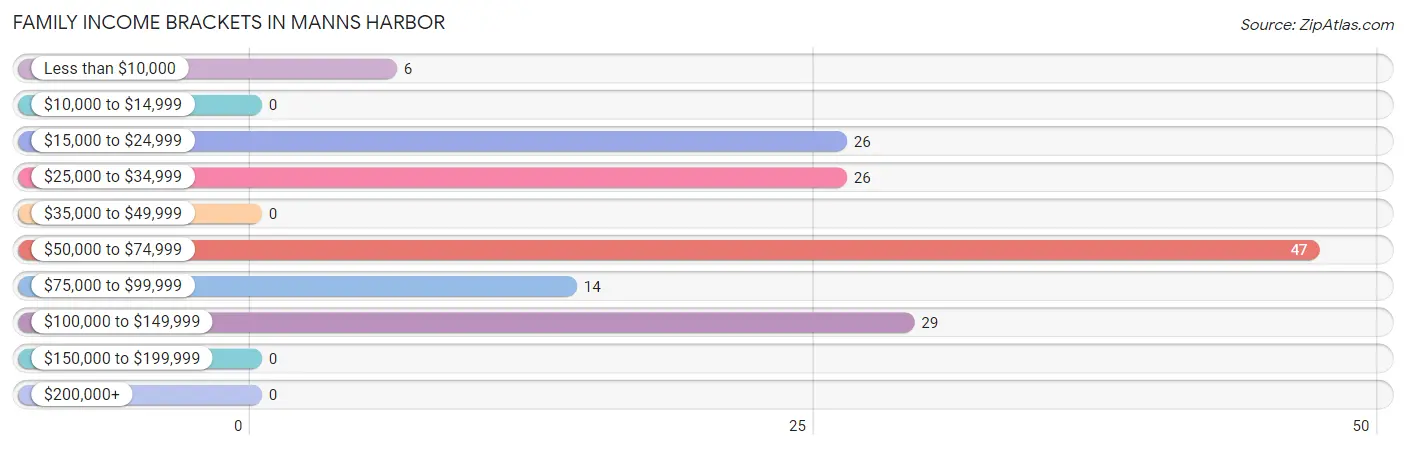
| Income Bracket | # Families | % Families |
| Less than $10,000 | 6 | 4.1% |
| $10,000 to $14,999 | 0 | 0.0% |
| $15,000 to $24,999 | 26 | 17.6% |
| $25,000 to $34,999 | 26 | 17.6% |
| $35,000 to $49,999 | 0 | 0.0% |
| $50,000 to $74,999 | 47 | 31.8% |
| $75,000 to $99,999 | 14 | 9.5% |
| $100,000 to $149,999 | 29 | 19.6% |
| $150,000 to $199,999 | 0 | 0.0% |
| $200,000+ | 0 | 0.0% |
Family Income by Famaliy Size in Manns Harbor
2-person families (62 | 41.9%) account for the highest median family income in Manns Harbor with $55,595 per family, while 2-person families (62 | 41.9%) have the highest median income of $27,798 per family member.
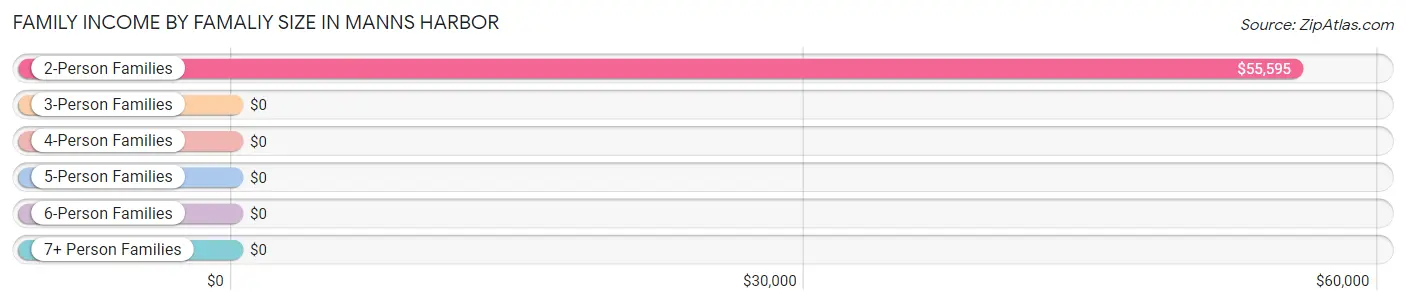
| Income Bracket | # Families | Median Income |
| 2-Person Families | 62 (41.9%) | $55,595 |
| 3-Person Families | 42 (28.4%) | $0 |
| 4-Person Families | 18 (12.2%) | $0 |
| 5-Person Families | 26 (17.6%) | $0 |
| 6-Person Families | 0 (0.0%) | $0 |
| 7+ Person Families | 0 (0.0%) | $0 |
| Total | 148 (100.0%) | $52,000 |
Family Income by Number of Earners in Manns Harbor
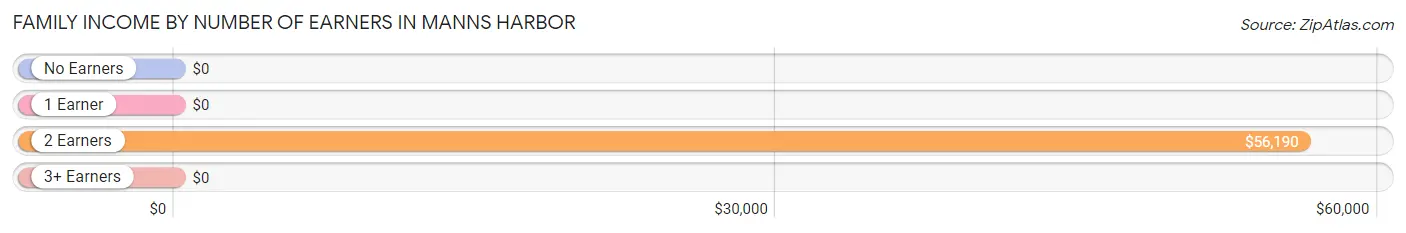
| Number of Earners | # Families | Median Income |
| No Earners | 0 (0.0%) | $0 |
| 1 Earner | 58 (39.2%) | $0 |
| 2 Earners | 72 (48.6%) | $56,190 |
| 3+ Earners | 18 (12.2%) | $0 |
| Total | 148 (100.0%) | $52,000 |
Household Income in Manns Harbor
Household Income Brackets in Manns Harbor
With 105 households falling in the category, the $15,000 to $24,999 income range is the most frequent in Manns Harbor, accounting for 30.3% of all households.
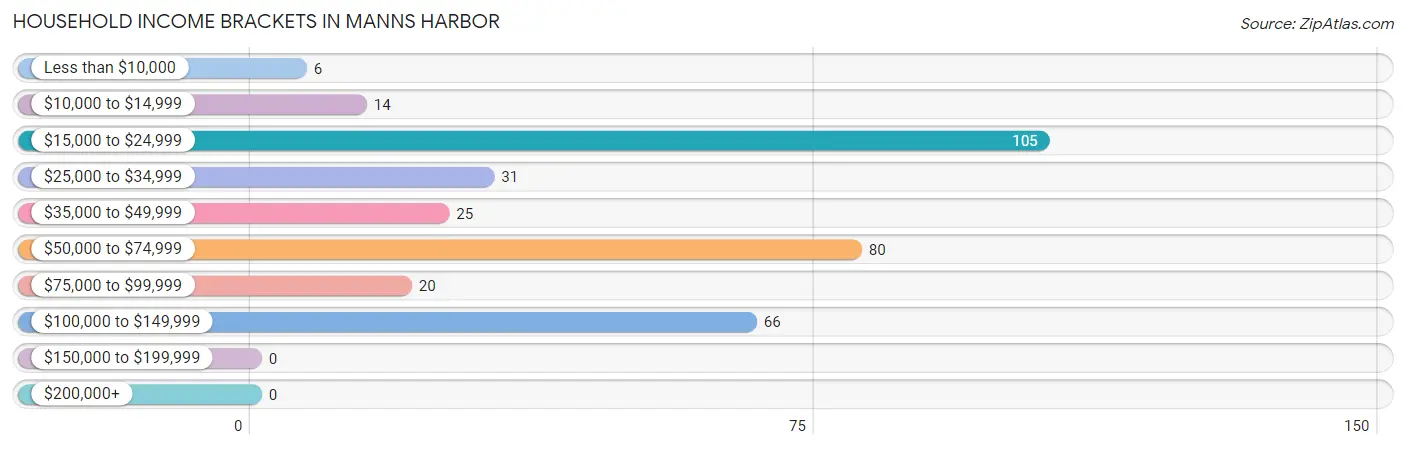
| Income Bracket | # Households | % Households |
| Less than $10,000 | 6 | 1.7% |
| $10,000 to $14,999 | 14 | 4.0% |
| $15,000 to $24,999 | 105 | 30.3% |
| $25,000 to $34,999 | 31 | 8.9% |
| $35,000 to $49,999 | 25 | 7.2% |
| $50,000 to $74,999 | 80 | 23.1% |
| $75,000 to $99,999 | 20 | 5.8% |
| $100,000 to $149,999 | 66 | 19.0% |
| $150,000 to $199,999 | 0 | 0.0% |
| $200,000+ | 0 | 0.0% |
Household Income by Householder Age in Manns Harbor
The median household income in Manns Harbor is $49,250, with the highest median household income of $102,736 found in the 45 to 64 years age bracket for the primary householder. A total of 125 households (36.0%) fall into this category. Meanwhile, the 15 to 24 years age bracket for the primary householder has the lowest median household income of $0, with 6 households (1.7%) in this group.
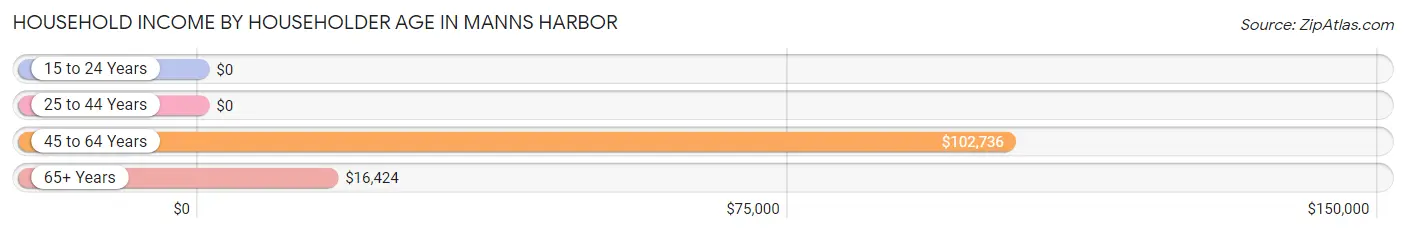
| Income Bracket | # Households | Median Income |
| 15 to 24 Years | 6 (1.7%) | $0 |
| 25 to 44 Years | 98 (28.2%) | $0 |
| 45 to 64 Years | 125 (36.0%) | $102,736 |
| 65+ Years | 118 (34.0%) | $16,424 |
| Total | 347 (100.0%) | $49,250 |
Poverty in Manns Harbor
Income Below Poverty by Sex and Age in Manns Harbor
With 25.3% poverty level for males and 40.6% for females among the residents of Manns Harbor, 16 and 17 year old males and 6 to 11 year old females are the most vulnerable to poverty, with 9 males (100.0%) and 46 females (100.0%) in their respective age groups living below the poverty level.
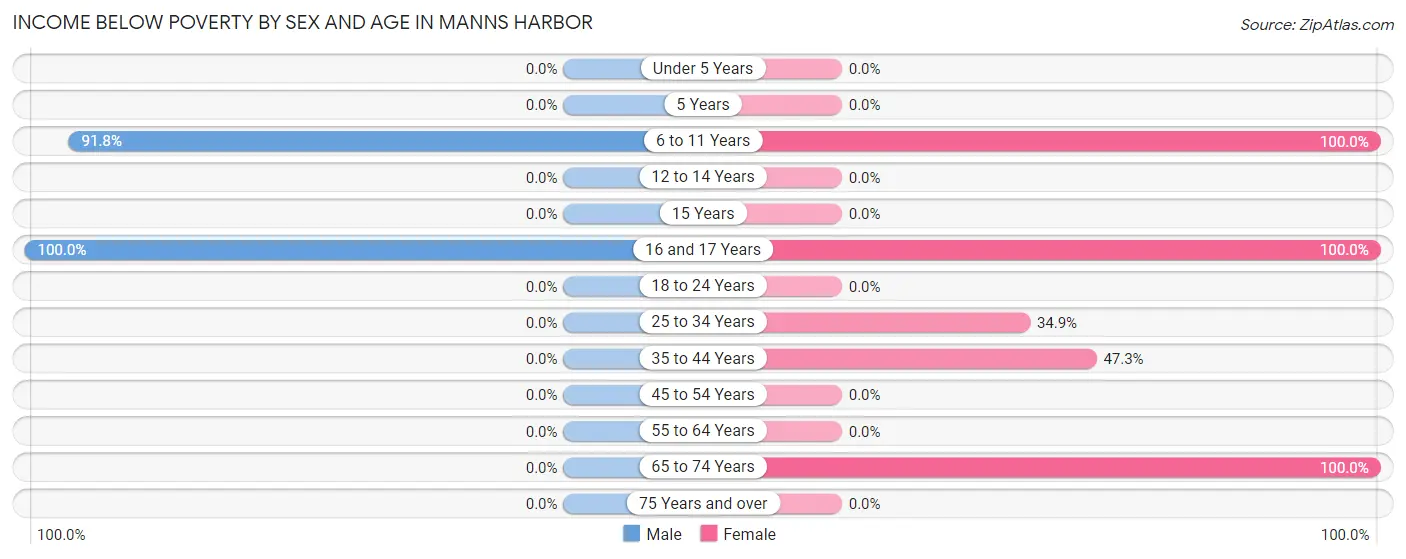
| Age Bracket | Male | Female |
| Under 5 Years | 0 (0.0%) | 0 (0.0%) |
| 5 Years | 0 (0.0%) | 0 (0.0%) |
| 6 to 11 Years | 90 (91.8%) | 46 (100.0%) |
| 12 to 14 Years | 0 (0.0%) | 0 (0.0%) |
| 15 Years | 0 (0.0%) | 0 (0.0%) |
| 16 and 17 Years | 9 (100.0%) | 6 (100.0%) |
| 18 to 24 Years | 0 (0.0%) | 0 (0.0%) |
| 25 to 34 Years | 0 (0.0%) | 22 (34.9%) |
| 35 to 44 Years | 0 (0.0%) | 26 (47.3%) |
| 45 to 54 Years | 0 (0.0%) | 0 (0.0%) |
| 55 to 64 Years | 0 (0.0%) | 0 (0.0%) |
| 65 to 74 Years | 0 (0.0%) | 14 (100.0%) |
| 75 Years and over | 0 (0.0%) | 0 (0.0%) |
| Total | 99 (25.3%) | 114 (40.6%) |
Income Above Poverty by Sex and Age in Manns Harbor
According to the poverty statistics in Manns Harbor, males aged under 5 years and females aged under 5 years are the age groups that are most secure financially, with 100.0% of males and 100.0% of females in these age groups living above the poverty line.
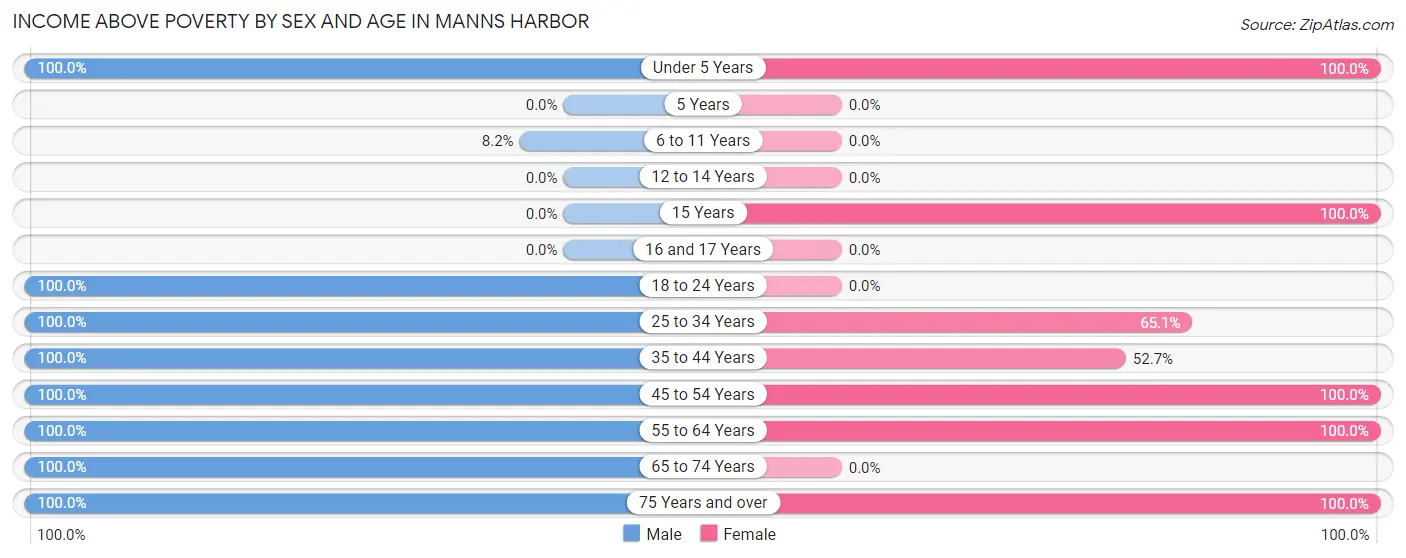
| Age Bracket | Male | Female |
| Under 5 Years | 12 (100.0%) | 13 (100.0%) |
| 5 Years | 0 (0.0%) | 0 (0.0%) |
| 6 to 11 Years | 8 (8.2%) | 0 (0.0%) |
| 12 to 14 Years | 0 (0.0%) | 0 (0.0%) |
| 15 Years | 0 (0.0%) | 18 (100.0%) |
| 16 and 17 Years | 0 (0.0%) | 0 (0.0%) |
| 18 to 24 Years | 13 (100.0%) | 0 (0.0%) |
| 25 to 34 Years | 10 (100.0%) | 41 (65.1%) |
| 35 to 44 Years | 31 (100.0%) | 29 (52.7%) |
| 45 to 54 Years | 86 (100.0%) | 6 (100.0%) |
| 55 to 64 Years | 23 (100.0%) | 55 (100.0%) |
| 65 to 74 Years | 11 (100.0%) | 0 (0.0%) |
| 75 Years and over | 99 (100.0%) | 5 (100.0%) |
| Total | 293 (74.7%) | 167 (59.4%) |
Income Below Poverty Among Married-Couple Families in Manns Harbor
The poverty statistics for married-couple families in Manns Harbor show that 6.2% or 6 of the total 96 families live below the poverty line. Families with no children have the highest poverty rate of 9.7%, comprising of 6 families. On the other hand, families with 1 or 2 children have the lowest poverty rate of 0.0%, which includes 0 families.
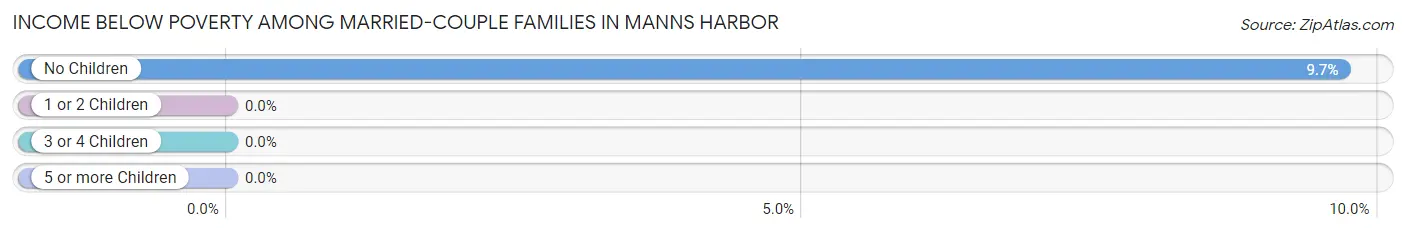
| Children | Above Poverty | Below Poverty |
| No Children | 56 (90.3%) | 6 (9.7%) |
| 1 or 2 Children | 34 (100.0%) | 0 (0.0%) |
| 3 or 4 Children | 0 (0.0%) | 0 (0.0%) |
| 5 or more Children | 0 (0.0%) | 0 (0.0%) |
| Total | 90 (93.8%) | 6 (6.2%) |
Income Below Poverty Among Single-Parent Households in Manns Harbor
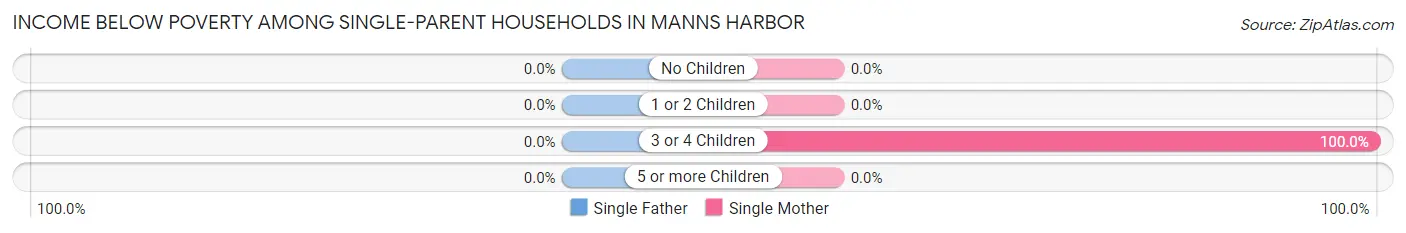
| Children | Single Father | Single Mother |
| No Children | 0 (0.0%) | 0 (0.0%) |
| 1 or 2 Children | 0 (0.0%) | 0 (0.0%) |
| 3 or 4 Children | 0 (0.0%) | 26 (100.0%) |
| 5 or more Children | 0 (0.0%) | 0 (0.0%) |
| Total | 0 (0.0%) | 26 (50.0%) |
Income Below Poverty Among Married-Couple vs Single-Parent Households in Manns Harbor
The poverty data for Manns Harbor shows that 6 of the married-couple family households (6.2%) and 26 of the single-parent households (50.0%) are living below the poverty level. Within the married-couple family households, those with no children have the highest poverty rate, with 6 households (9.7%) falling below the poverty line. Among the single-parent households, those with 3 or 4 children have the highest poverty rate, with 26 household (100.0%) living below poverty.
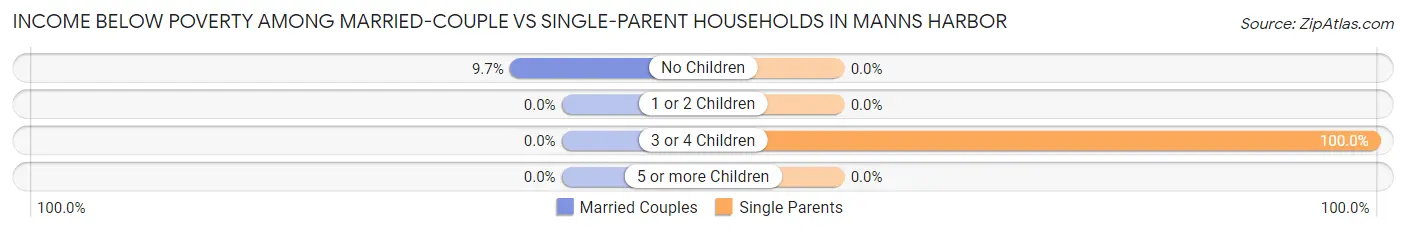
| Children | Married-Couple Families | Single-Parent Households |
| No Children | 6 (9.7%) | 0 (0.0%) |
| 1 or 2 Children | 0 (0.0%) | 0 (0.0%) |
| 3 or 4 Children | 0 (0.0%) | 26 (100.0%) |
| 5 or more Children | 0 (0.0%) | 0 (0.0%) |
| Total | 6 (6.2%) | 26 (50.0%) |
Race in Manns Harbor
The most populous races in Manns Harbor are White / Caucasian (455 | 67.6%), Hispanic or Latino (218 | 32.4%), and Two or more Races (218 | 32.4%).
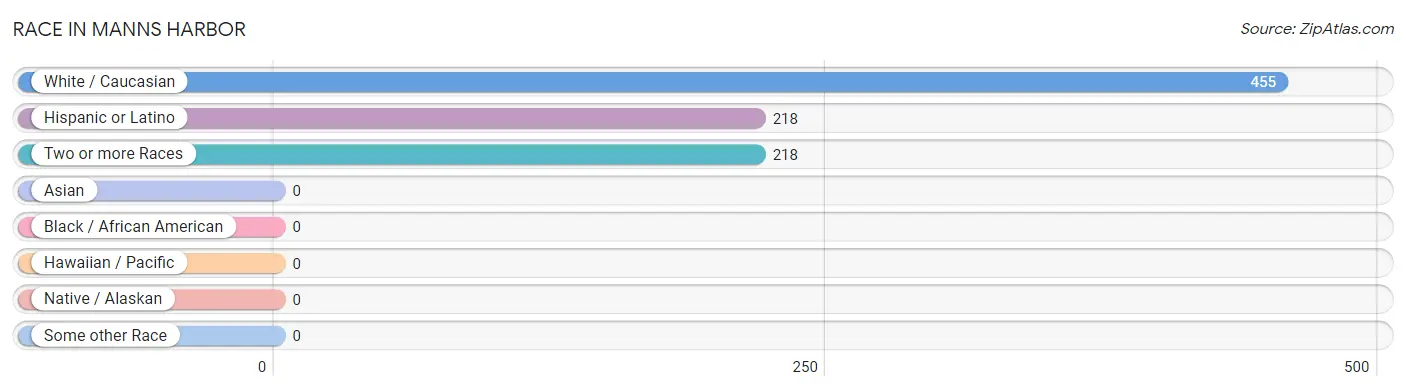
| Race | # Population | % Population |
| Asian | 0 | 0.0% |
| Black / African American | 0 | 0.0% |
| Hawaiian / Pacific | 0 | 0.0% |
| Hispanic or Latino | 218 | 32.4% |
| Native / Alaskan | 0 | 0.0% |
| White / Caucasian | 455 | 67.6% |
| Two or more Races | 218 | 32.4% |
| Some other Race | 0 | 0.0% |
| Total | 673 | 100.0% |
Ancestry in Manns Harbor
The most populous ancestries reported in Manns Harbor are Central American (184 | 27.3%), Honduran (184 | 27.3%), English (88 | 13.1%), American (61 | 9.1%), and German (46 | 6.8%), together accounting for 83.7% of all Manns Harbor residents.
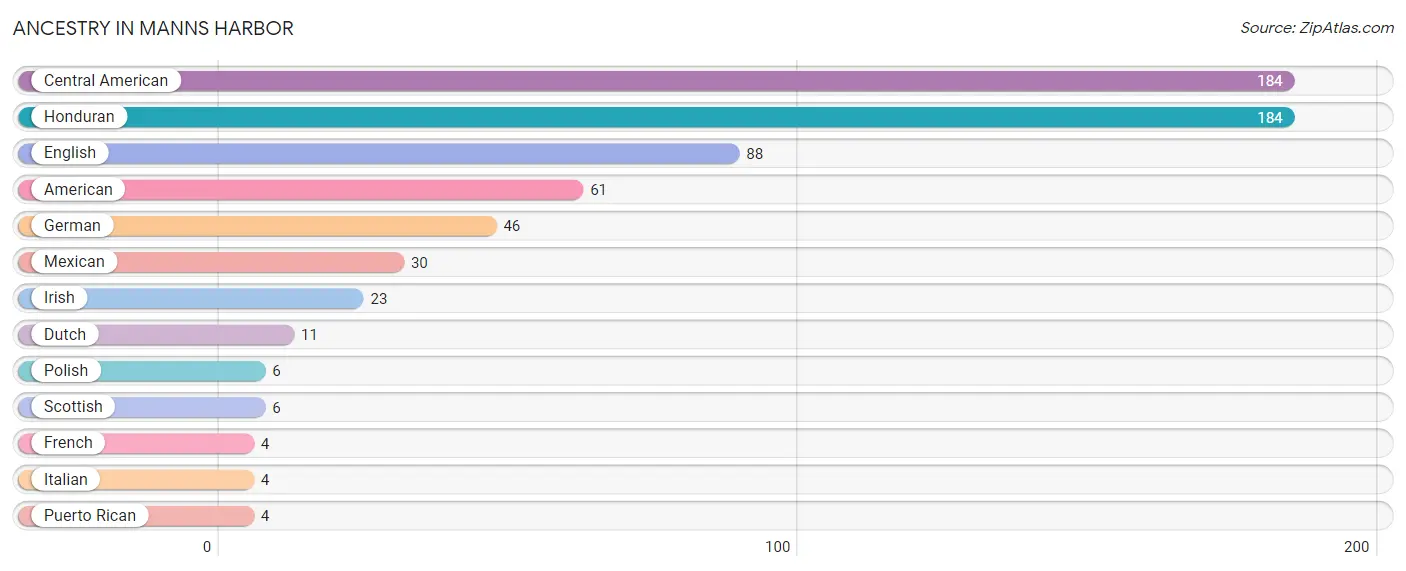
| Ancestry | # Population | % Population |
| American | 61 | 9.1% |
| Central American | 184 | 27.3% |
| Dutch | 11 | 1.6% |
| English | 88 | 13.1% |
| French | 4 | 0.6% |
| German | 46 | 6.8% |
| Honduran | 184 | 27.3% |
| Irish | 23 | 3.4% |
| Italian | 4 | 0.6% |
| Mexican | 30 | 4.5% |
| Polish | 6 | 0.9% |
| Puerto Rican | 4 | 0.6% |
| Scottish | 6 | 0.9% | View All 13 Rows |
Immigrants in Manns Harbor
The most numerous immigrant groups reported in Manns Harbor came from Central America (201 | 29.9%), Latin America (201 | 29.9%), Honduras (184 | 27.3%), and Mexico (17 | 2.5%), together accounting for 89.6% of all Manns Harbor residents.
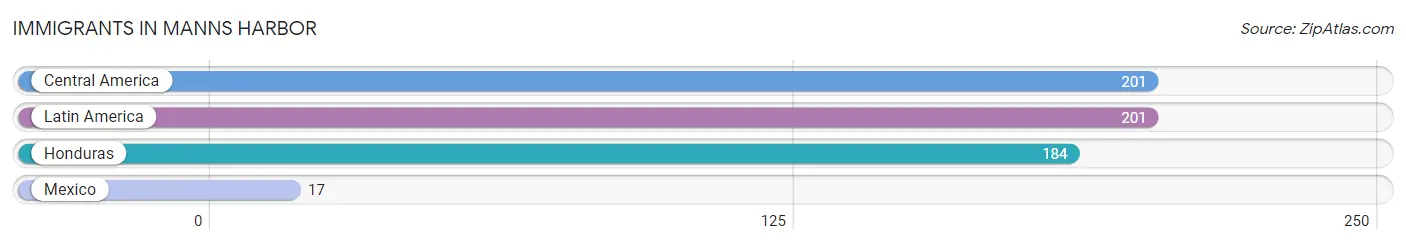
| Immigration Origin | # Population | % Population |
| Central America | 201 | 29.9% |
| Honduras | 184 | 27.3% |
| Latin America | 201 | 29.9% |
| Mexico | 17 | 2.5% | View All 4 Rows |
Sex and Age in Manns Harbor
Sex and Age in Manns Harbor
The most populous age groups in Manns Harbor are 5 to 9 Years (92 | 23.5%) for men and 40 to 44 Years (55 | 19.6%) for women.
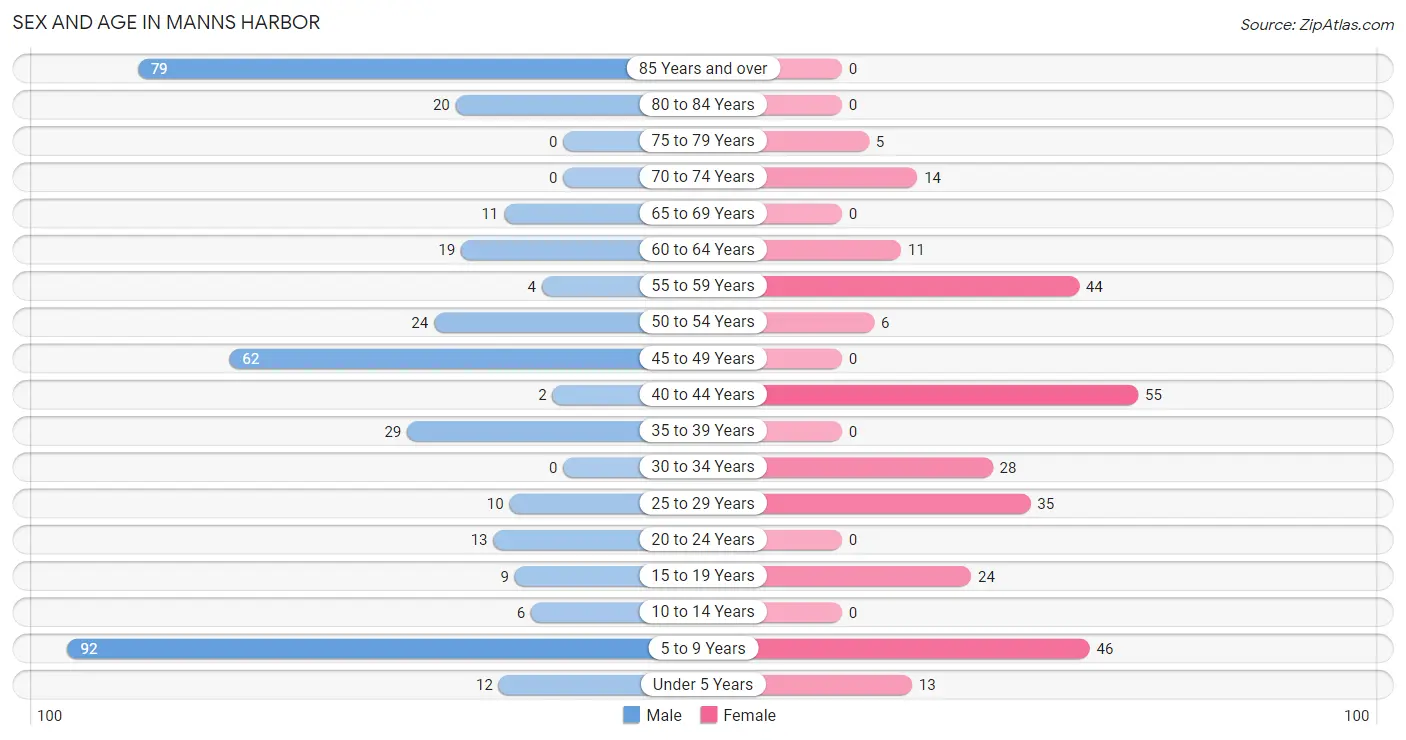
| Age Bracket | Male | Female |
| Under 5 Years | 12 (3.1%) | 13 (4.6%) |
| 5 to 9 Years | 92 (23.5%) | 46 (16.4%) |
| 10 to 14 Years | 6 (1.5%) | 0 (0.0%) |
| 15 to 19 Years | 9 (2.3%) | 24 (8.5%) |
| 20 to 24 Years | 13 (3.3%) | 0 (0.0%) |
| 25 to 29 Years | 10 (2.5%) | 35 (12.5%) |
| 30 to 34 Years | 0 (0.0%) | 28 (10.0%) |
| 35 to 39 Years | 29 (7.4%) | 0 (0.0%) |
| 40 to 44 Years | 2 (0.5%) | 55 (19.6%) |
| 45 to 49 Years | 62 (15.8%) | 0 (0.0%) |
| 50 to 54 Years | 24 (6.1%) | 6 (2.1%) |
| 55 to 59 Years | 4 (1.0%) | 44 (15.7%) |
| 60 to 64 Years | 19 (4.9%) | 11 (3.9%) |
| 65 to 69 Years | 11 (2.8%) | 0 (0.0%) |
| 70 to 74 Years | 0 (0.0%) | 14 (5.0%) |
| 75 to 79 Years | 0 (0.0%) | 5 (1.8%) |
| 80 to 84 Years | 20 (5.1%) | 0 (0.0%) |
| 85 Years and over | 79 (20.2%) | 0 (0.0%) |
| Total | 392 (100.0%) | 281 (100.0%) |
Families and Households in Manns Harbor
Median Family Size in Manns Harbor
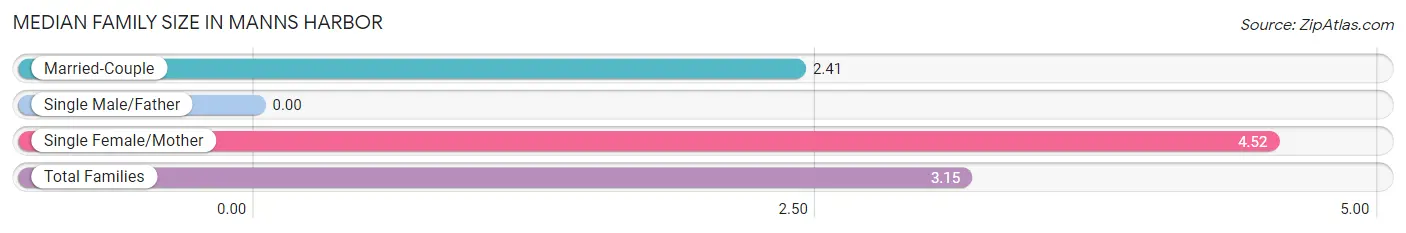
| Family Type | # Families | Family Size |
| Married-Couple | 96 (64.9%) | 2.41 |
| Single Male/Father | 0 (0.0%) | - |
| Single Female/Mother | 52 (35.1%) | 4.52 |
| Total Families | 148 (100.0%) | 3.15 |
Median Household Size in Manns Harbor
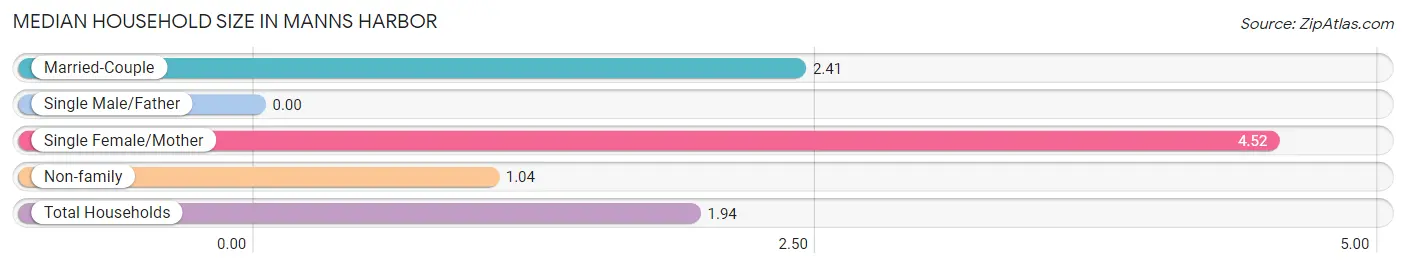
| Household Type | # Households | Household Size |
| Married-Couple | 96 (27.7%) | 2.41 |
| Single Male/Father | 0 (0.0%) | - |
| Single Female/Mother | 52 (15.0%) | 4.52 |
| Non-family | 199 (57.4%) | 1.04 |
| Total Households | 347 (100.0%) | 1.94 |
Household Size by Marriage Status in Manns Harbor
Out of a total of 347 households in Manns Harbor, 148 (42.6%) are family households, while 199 (57.4%) are nonfamily households. The most numerous type of family households are 2-person households, comprising 62, and the most common type of nonfamily households are 1-person households, comprising 190.
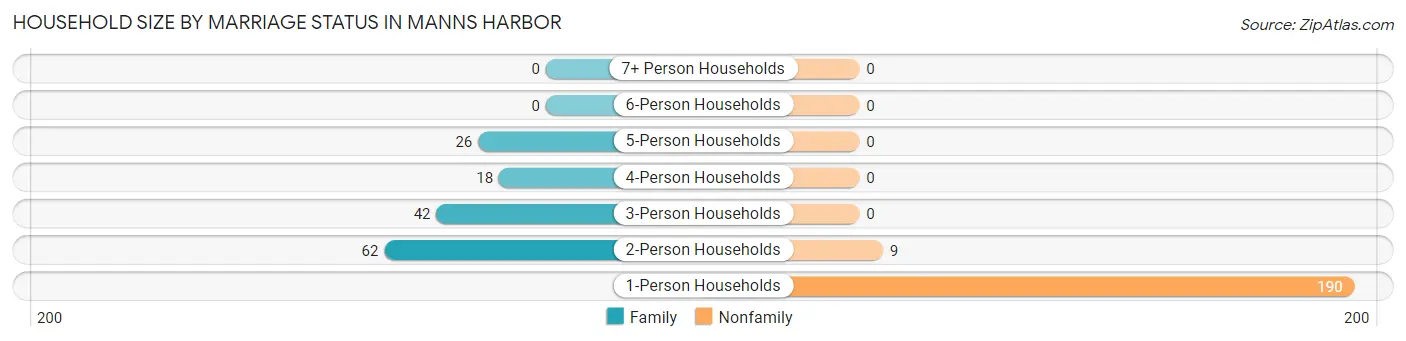
| Household Size | Family Households | Nonfamily Households |
| 1-Person Households | - | 190 (54.8%) |
| 2-Person Households | 62 (17.9%) | 9 (2.6%) |
| 3-Person Households | 42 (12.1%) | 0 (0.0%) |
| 4-Person Households | 18 (5.2%) | 0 (0.0%) |
| 5-Person Households | 26 (7.5%) | 0 (0.0%) |
| 6-Person Households | 0 (0.0%) | 0 (0.0%) |
| 7+ Person Households | 0 (0.0%) | 0 (0.0%) |
| Total | 148 (42.6%) | 199 (57.4%) |
Female Fertility in Manns Harbor
Fertility by Age in Manns Harbor
| Age Bracket | Women with Births | Births / 1,000 Women |
| 15 to 19 years | 0 (0.0%) | 0.0 |
| 20 to 34 years | 0 (0.0%) | 0.0 |
| 35 to 50 years | 0 (0.0%) | 0.0 |
| Total | 0 (0.0%) | 0.0 |
Fertility by Age by Marriage Status in Manns Harbor
| Age Bracket | Married | Unmarried |
| 15 to 19 years | 0 (0.0%) | 0 (0.0%) |
| 20 to 34 years | 0 (0.0%) | 0 (0.0%) |
| 35 to 50 years | 0 (0.0%) | 0 (0.0%) |
| Total | 0 (0.0%) | 0 (0.0%) |
Fertility by Education in Manns Harbor
| Educational Attainment | Women with Births | Births / 1,000 Women |
| Less than High School | 0 (0.0%) | 0.0 |
| High School Diploma | 0 (0.0%) | 0.0 |
| College or Associate's Degree | 0 (0.0%) | 0.0 |
| Bachelor's Degree | 0 (0.0%) | 0.0 |
| Graduate Degree | 0 (0.0%) | 0.0 |
| Total | 0 (0.0%) | 0.0 |
Fertility by Education by Marriage Status in Manns Harbor
| Educational Attainment | Married | Unmarried |
| Less than High School | 0 (0.0%) | 0 (0.0%) |
| High School Diploma | 0 (0.0%) | 0 (0.0%) |
| College or Associate's Degree | 0 (0.0%) | 0 (0.0%) |
| Bachelor's Degree | 0 (0.0%) | 0 (0.0%) |
| Graduate Degree | 0 (0.0%) | 0 (0.0%) |
| Total | 0 (0.0%) | 0 (0.0%) |
Employment Characteristics in Manns Harbor
Employment by Class of Employer in Manns Harbor
Among the 333 employed individuals in Manns Harbor, private company employees (199 | 59.8%), federal government employees (37 | 11.1%), and self-employed (not incorporated) (35 | 10.5%) make up the most common classes of employment.
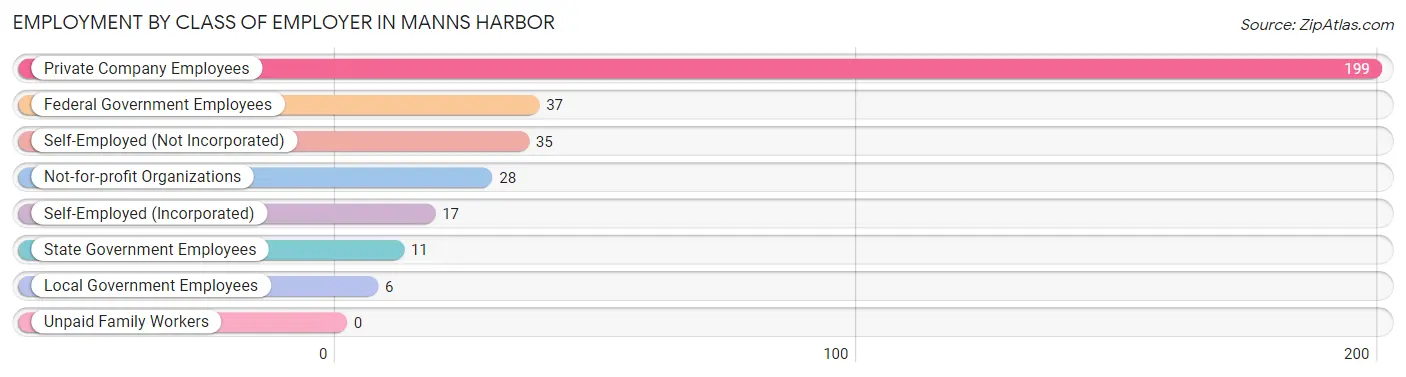
| Employer Class | # Employees | % Employees |
| Private Company Employees | 199 | 59.8% |
| Self-Employed (Incorporated) | 17 | 5.1% |
| Self-Employed (Not Incorporated) | 35 | 10.5% |
| Not-for-profit Organizations | 28 | 8.4% |
| Local Government Employees | 6 | 1.8% |
| State Government Employees | 11 | 3.3% |
| Federal Government Employees | 37 | 11.1% |
| Unpaid Family Workers | 0 | 0.0% |
| Total | 333 | 100.0% |
Employment Status by Age in Manns Harbor
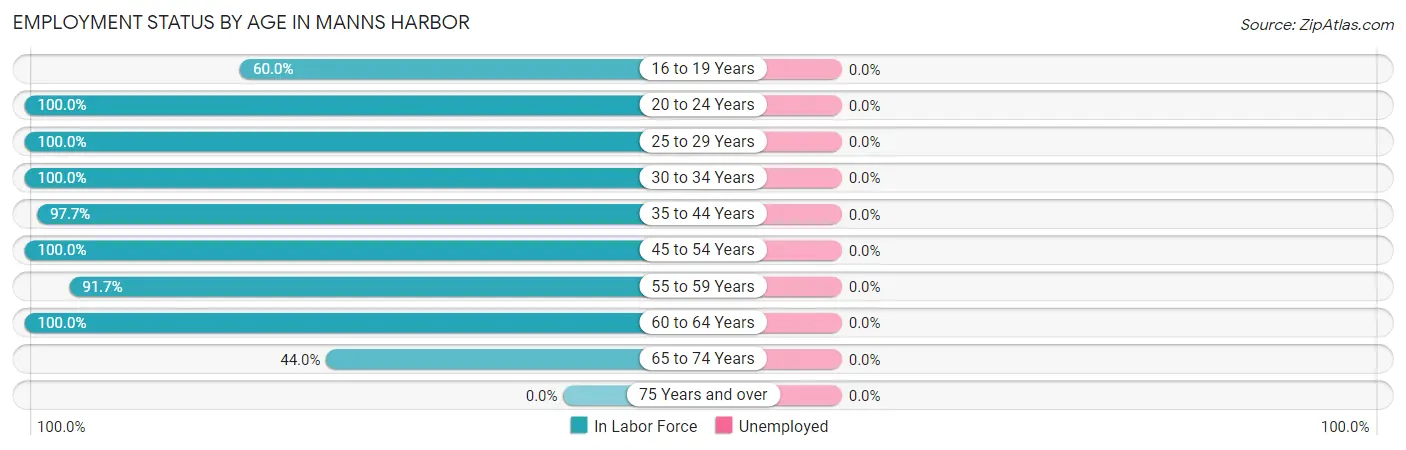
| Age Bracket | In Labor Force | Unemployed |
| 16 to 19 Years | 9 (60.0%) | 0 (0.0%) |
| 20 to 24 Years | 13 (100.0%) | 0 (0.0%) |
| 25 to 29 Years | 45 (100.0%) | 0 (0.0%) |
| 30 to 34 Years | 28 (100.0%) | 0 (0.0%) |
| 35 to 44 Years | 84 (97.7%) | 0 (0.0%) |
| 45 to 54 Years | 92 (100.0%) | 0 (0.0%) |
| 55 to 59 Years | 44 (91.7%) | 0 (0.0%) |
| 60 to 64 Years | 30 (100.0%) | 0 (0.0%) |
| 65 to 74 Years | 11 (44.0%) | 0 (0.0%) |
| 75 Years and over | 0 (0.0%) | 0 (0.0%) |
| Total | 356 (73.3%) | 0 (0.0%) |
Employment Status by Educational Attainment in Manns Harbor
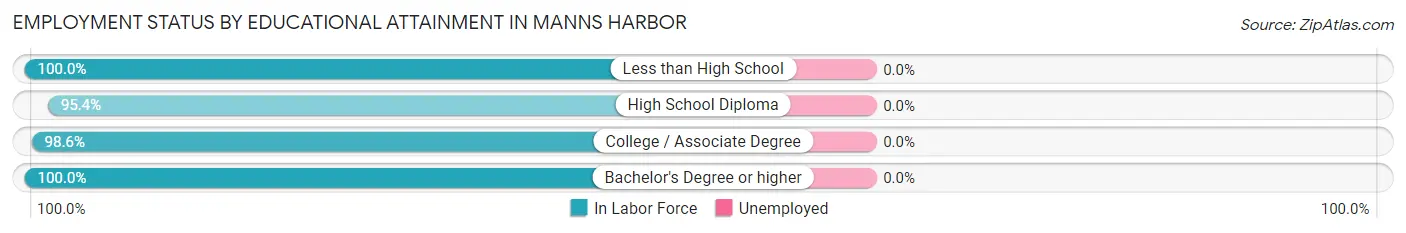
| Educational Attainment | In Labor Force | Unemployed |
| Less than High School | 22 (100.0%) | 0 (0.0%) |
| High School Diploma | 83 (95.4%) | 0 (0.0%) |
| College / Associate Degree | 145 (98.6%) | 0 (0.0%) |
| Bachelor's Degree or higher | 73 (100.0%) | 0 (0.0%) |
| Total | 323 (98.2%) | 0 (0.0%) |
Employment Occupations by Sex in Manns Harbor
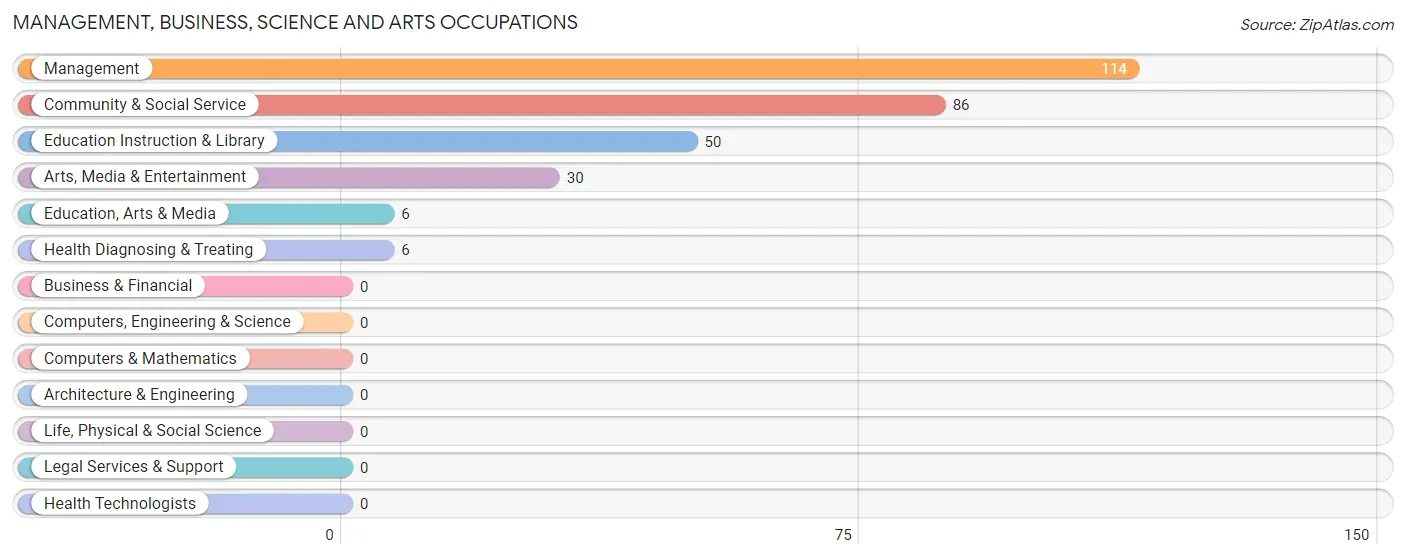
Management, Business, Science and Arts Occupations
The most common Management, Business, Science and Arts occupations in Manns Harbor are Management (114 | 32.0%), Community & Social Service (86 | 24.2%), Education Instruction & Library (50 | 14.0%), Arts, Media & Entertainment (30 | 8.4%), and Education, Arts & Media (6 | 1.7%).
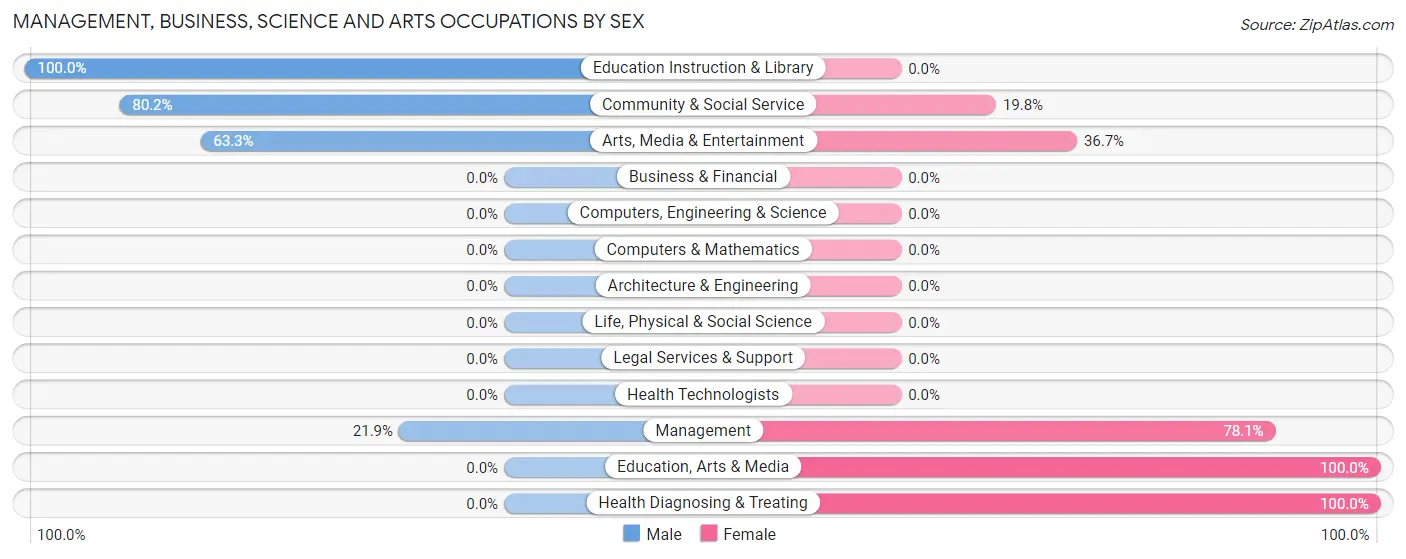
Management, Business, Science and Arts Occupations by Sex
Within the Management, Business, Science and Arts occupations in Manns Harbor, the most male-oriented occupations are Education Instruction & Library (100.0%), Community & Social Service (80.2%), and Arts, Media & Entertainment (63.3%), while the most female-oriented occupations are Education, Arts & Media (100.0%), Health Diagnosing & Treating (100.0%), and Management (78.1%).
| Occupation | Male | Female |
| Management | 25 (21.9%) | 89 (78.1%) |
| Business & Financial | 0 (0.0%) | 0 (0.0%) |
| Computers, Engineering & Science | 0 (0.0%) | 0 (0.0%) |
| Computers & Mathematics | 0 (0.0%) | 0 (0.0%) |
| Architecture & Engineering | 0 (0.0%) | 0 (0.0%) |
| Life, Physical & Social Science | 0 (0.0%) | 0 (0.0%) |
| Community & Social Service | 69 (80.2%) | 17 (19.8%) |
| Education, Arts & Media | 0 (0.0%) | 6 (100.0%) |
| Legal Services & Support | 0 (0.0%) | 0 (0.0%) |
| Education Instruction & Library | 50 (100.0%) | 0 (0.0%) |
| Arts, Media & Entertainment | 19 (63.3%) | 11 (36.7%) |
| Health Diagnosing & Treating | 0 (0.0%) | 6 (100.0%) |
| Health Technologists | 0 (0.0%) | 0 (0.0%) |
| Total (Category) | 94 (45.6%) | 112 (54.4%) |
| Total (Overall) | 181 (50.8%) | 175 (49.2%) |
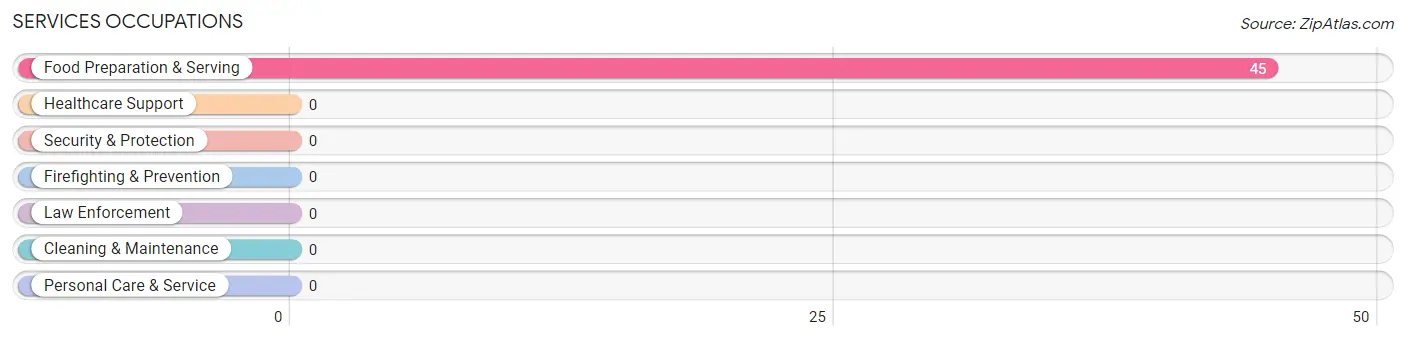
Services Occupations
The most common Services occupations in Manns Harbor are , and Food Preparation & Serving (45 | 12.6%).
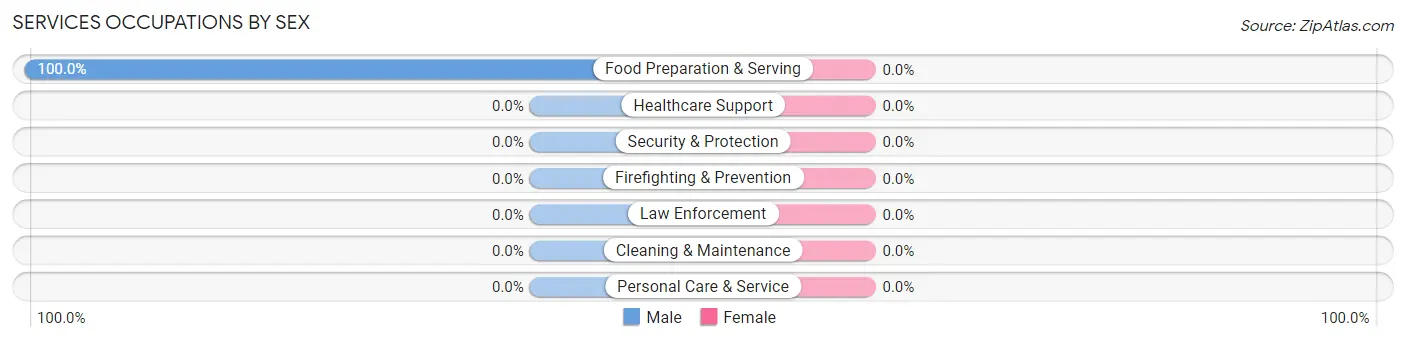
Services Occupations by Sex
| Occupation | Male | Female |
| Healthcare Support | 0 (0.0%) | 0 (0.0%) |
| Security & Protection | 0 (0.0%) | 0 (0.0%) |
| Firefighting & Prevention | 0 (0.0%) | 0 (0.0%) |
| Law Enforcement | 0 (0.0%) | 0 (0.0%) |
| Food Preparation & Serving | 45 (100.0%) | 0 (0.0%) |
| Cleaning & Maintenance | 0 (0.0%) | 0 (0.0%) |
| Personal Care & Service | 0 (0.0%) | 0 (0.0%) |
| Total (Category) | 45 (100.0%) | 0 (0.0%) |
| Total (Overall) | 181 (50.8%) | 175 (49.2%) |
Sales and Office Occupations
The most common Sales and Office occupations in Manns Harbor are Office & Administration (9 | 2.5%), and Sales & Related (6 | 1.7%).
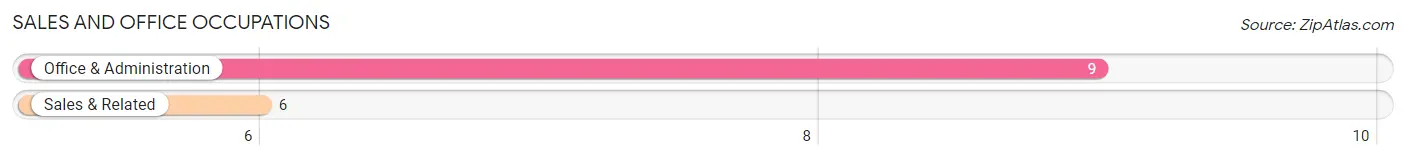
Sales and Office Occupations by Sex
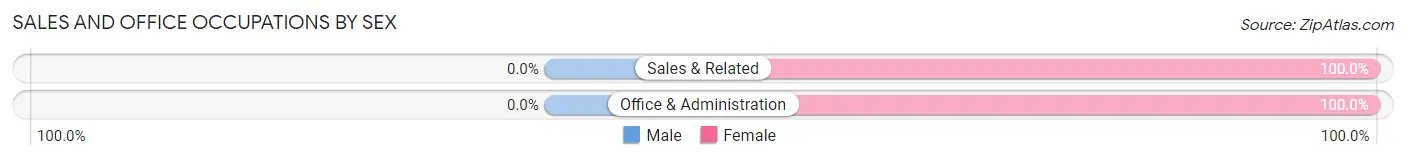
| Occupation | Male | Female |
| Sales & Related | 0 (0.0%) | 6 (100.0%) |
| Office & Administration | 0 (0.0%) | 9 (100.0%) |
| Total (Category) | 0 (0.0%) | 15 (100.0%) |
| Total (Overall) | 181 (50.8%) | 175 (49.2%) |
Natural Resources, Construction and Maintenance Occupations
The most common Natural Resources, Construction and Maintenance occupations in Manns Harbor are Construction & Extraction (48 | 13.5%), Installation, Maintenance & Repair (25 | 7.0%), and Farming, Fishing & Forestry (9 | 2.5%).
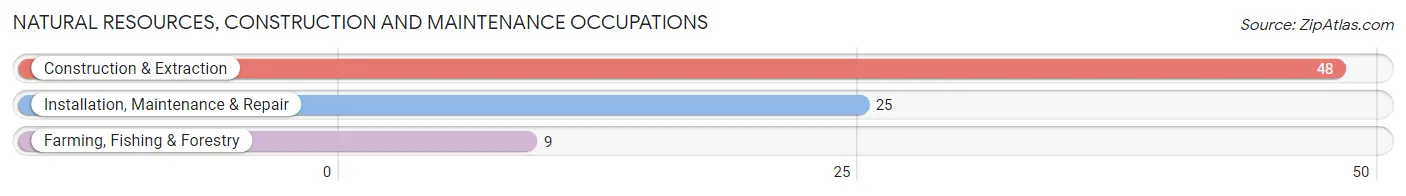
Natural Resources, Construction and Maintenance Occupations by Sex
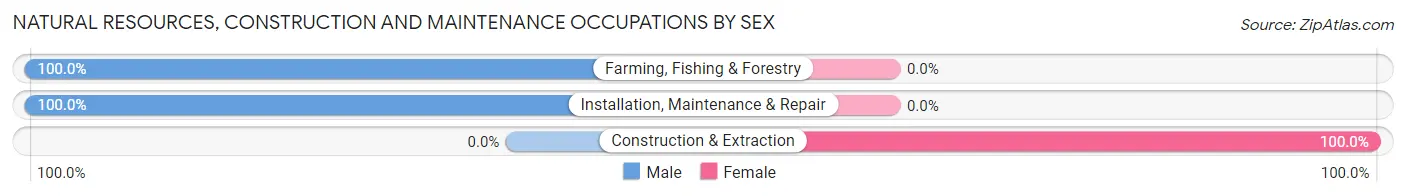
| Occupation | Male | Female |
| Farming, Fishing & Forestry | 9 (100.0%) | 0 (0.0%) |
| Construction & Extraction | 0 (0.0%) | 48 (100.0%) |
| Installation, Maintenance & Repair | 25 (100.0%) | 0 (0.0%) |
| Total (Category) | 34 (41.5%) | 48 (58.5%) |
| Total (Overall) | 181 (50.8%) | 175 (49.2%) |
Production, Transportation and Moving Occupations
The most common Production, Transportation and Moving occupations in Manns Harbor are , and Material Moving (8 | 2.2%).
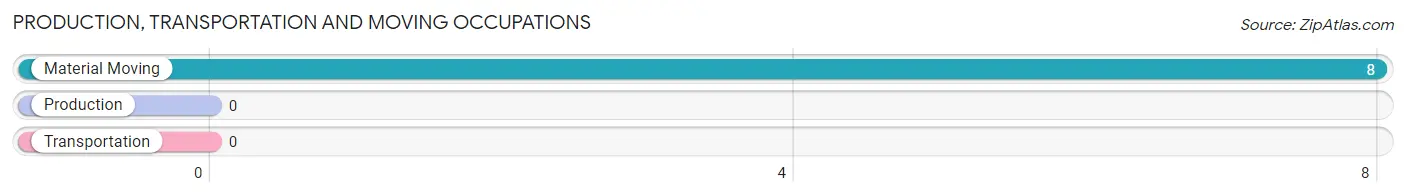
Production, Transportation and Moving Occupations by Sex
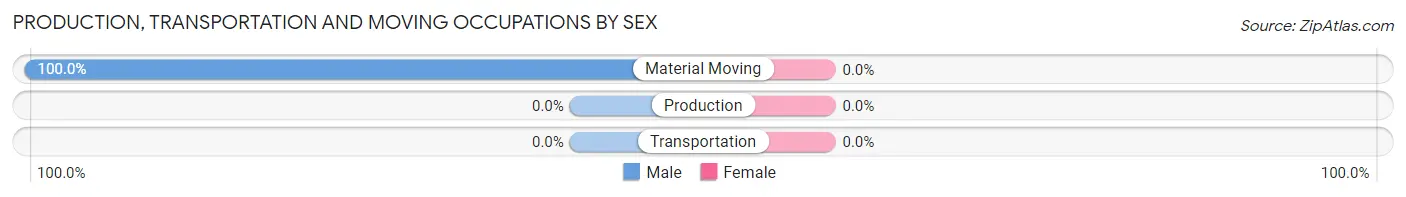
| Occupation | Male | Female |
| Production | 0 (0.0%) | 0 (0.0%) |
| Transportation | 0 (0.0%) | 0 (0.0%) |
| Material Moving | 8 (100.0%) | 0 (0.0%) |
| Total (Category) | 8 (100.0%) | 0 (0.0%) |
| Total (Overall) | 181 (50.8%) | 175 (49.2%) |
Employment Industries by Sex in Manns Harbor
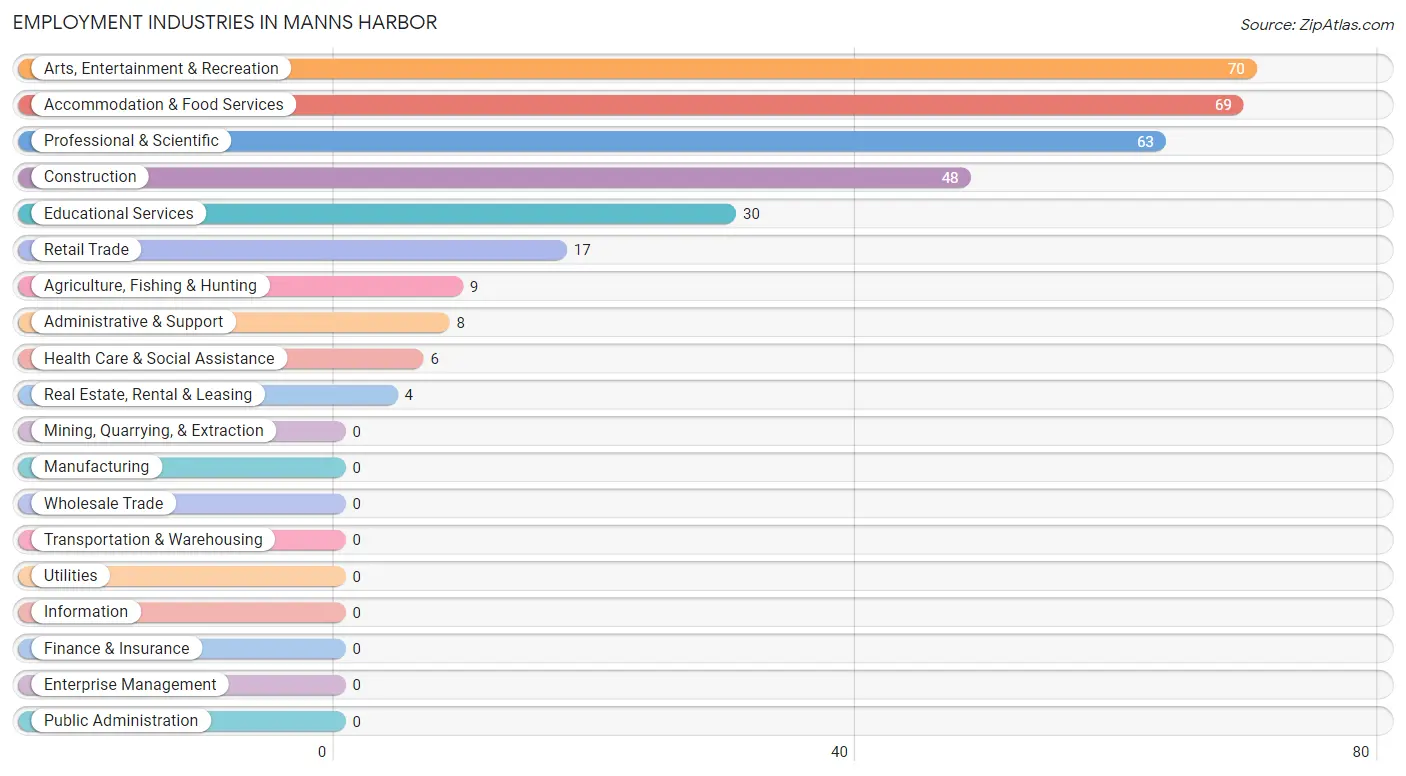
Employment Industries in Manns Harbor
The major employment industries in Manns Harbor include Arts, Entertainment & Recreation (70 | 19.7%), Accommodation & Food Services (69 | 19.4%), Professional & Scientific (63 | 17.7%), Construction (48 | 13.5%), and Educational Services (30 | 8.4%).
Employment Industries by Sex in Manns Harbor
The Manns Harbor industries that see more men than women are Agriculture, Fishing & Hunting (100.0%), Real Estate, Rental & Leasing (100.0%), and Administrative & Support (100.0%), whereas the industries that tend to have a higher number of women are Construction (100.0%), Health Care & Social Assistance (100.0%), and Arts, Entertainment & Recreation (54.3%).
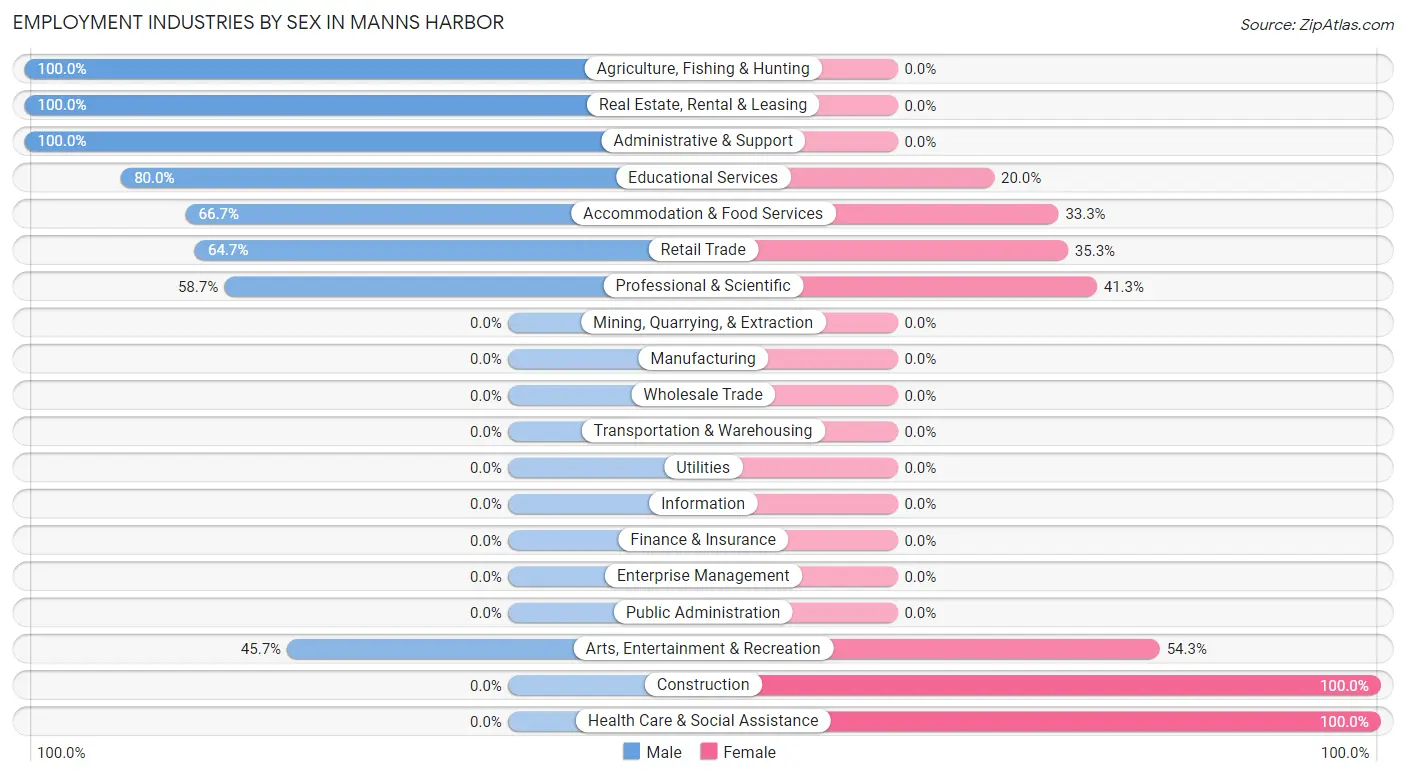
| Industry | Male | Female |
| Agriculture, Fishing & Hunting | 9 (100.0%) | 0 (0.0%) |
| Mining, Quarrying, & Extraction | 0 (0.0%) | 0 (0.0%) |
| Construction | 0 (0.0%) | 48 (100.0%) |
| Manufacturing | 0 (0.0%) | 0 (0.0%) |
| Wholesale Trade | 0 (0.0%) | 0 (0.0%) |
| Retail Trade | 11 (64.7%) | 6 (35.3%) |
| Transportation & Warehousing | 0 (0.0%) | 0 (0.0%) |
| Utilities | 0 (0.0%) | 0 (0.0%) |
| Information | 0 (0.0%) | 0 (0.0%) |
| Finance & Insurance | 0 (0.0%) | 0 (0.0%) |
| Real Estate, Rental & Leasing | 4 (100.0%) | 0 (0.0%) |
| Professional & Scientific | 37 (58.7%) | 26 (41.3%) |
| Enterprise Management | 0 (0.0%) | 0 (0.0%) |
| Administrative & Support | 8 (100.0%) | 0 (0.0%) |
| Educational Services | 24 (80.0%) | 6 (20.0%) |
| Health Care & Social Assistance | 0 (0.0%) | 6 (100.0%) |
| Arts, Entertainment & Recreation | 32 (45.7%) | 38 (54.3%) |
| Accommodation & Food Services | 46 (66.7%) | 23 (33.3%) |
| Public Administration | 0 (0.0%) | 0 (0.0%) |
| Total | 181 (50.8%) | 175 (49.2%) |
Education in Manns Harbor
School Enrollment in Manns Harbor
The most common levels of schooling among the 175 students in Manns Harbor are elementary school (138 | 78.9%), high school (18 | 10.3%), and nursery / preschool (13 | 7.4%).
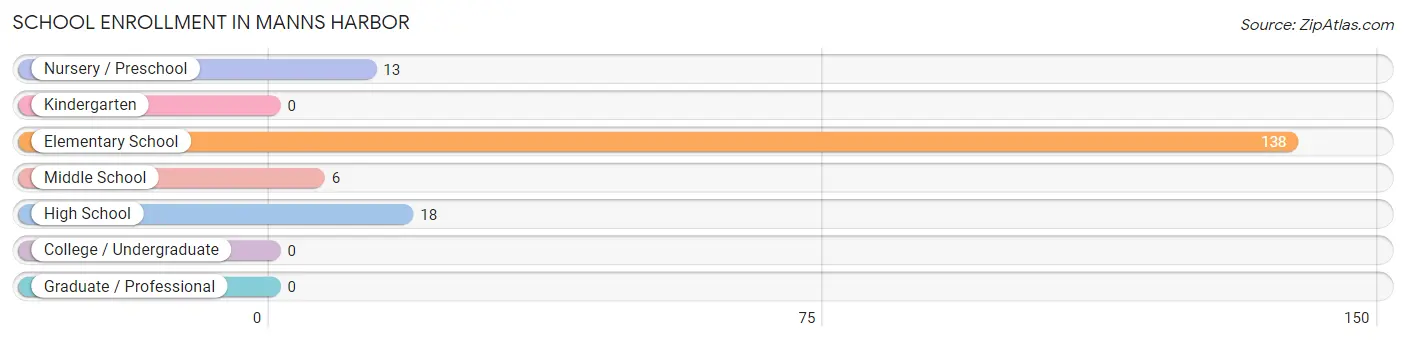
| School Level | # Students | % Students |
| Nursery / Preschool | 13 | 7.4% |
| Kindergarten | 0 | 0.0% |
| Elementary School | 138 | 78.9% |
| Middle School | 6 | 3.4% |
| High School | 18 | 10.3% |
| College / Undergraduate | 0 | 0.0% |
| Graduate / Professional | 0 | 0.0% |
| Total | 175 | 100.0% |
School Enrollment by Age by Funding Source in Manns Harbor
Out of a total of 175 students who are enrolled in schools in Manns Harbor, 31 (17.7%) attend a private institution, while the remaining 144 (82.3%) are enrolled in public schools. The age group of 3 to 4 year olds has the highest likelihood of being enrolled in private schools, with 13 (100.0% in the age bracket) enrolled. Conversely, the age group of 5 to 9 year old has the lowest likelihood of being enrolled in a private school, with 138 (100.0% in the age bracket) attending a public institution.
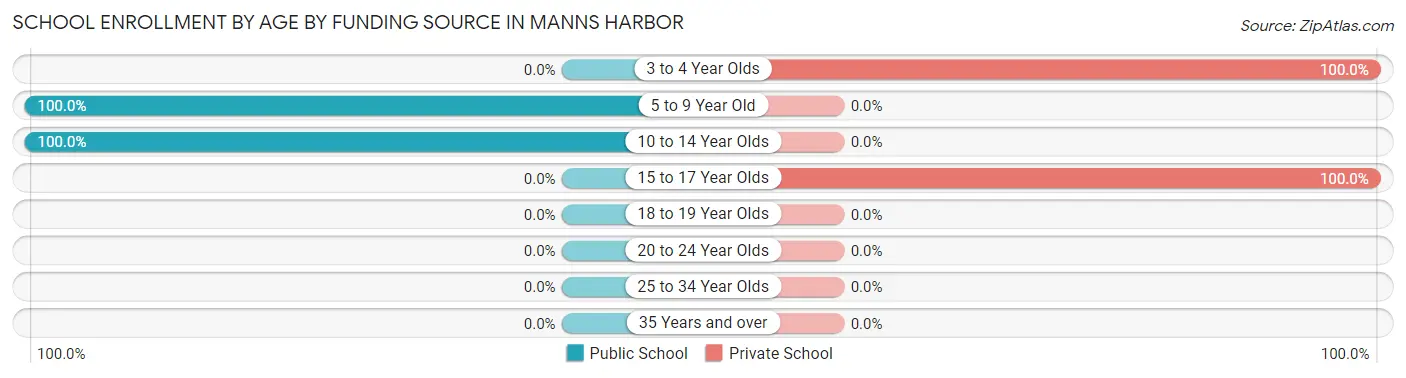
| Age Bracket | Public School | Private School |
| 3 to 4 Year Olds | 0 (0.0%) | 13 (100.0%) |
| 5 to 9 Year Old | 138 (100.0%) | 0 (0.0%) |
| 10 to 14 Year Olds | 6 (100.0%) | 0 (0.0%) |
| 15 to 17 Year Olds | 0 (0.0%) | 18 (100.0%) |
| 18 to 19 Year Olds | 0 (0.0%) | 0 (0.0%) |
| 20 to 24 Year Olds | 0 (0.0%) | 0 (0.0%) |
| 25 to 34 Year Olds | 0 (0.0%) | 0 (0.0%) |
| 35 Years and over | 0 (0.0%) | 0 (0.0%) |
| Total | 144 (82.3%) | 31 (17.7%) |
Educational Attainment by Field of Study in Manns Harbor
Arts & humanities (67 | 91.8%), and visual & performing arts (6 | 8.2%) are the most common fields of study among 73 individuals in Manns Harbor who have obtained a bachelor's degree or higher.
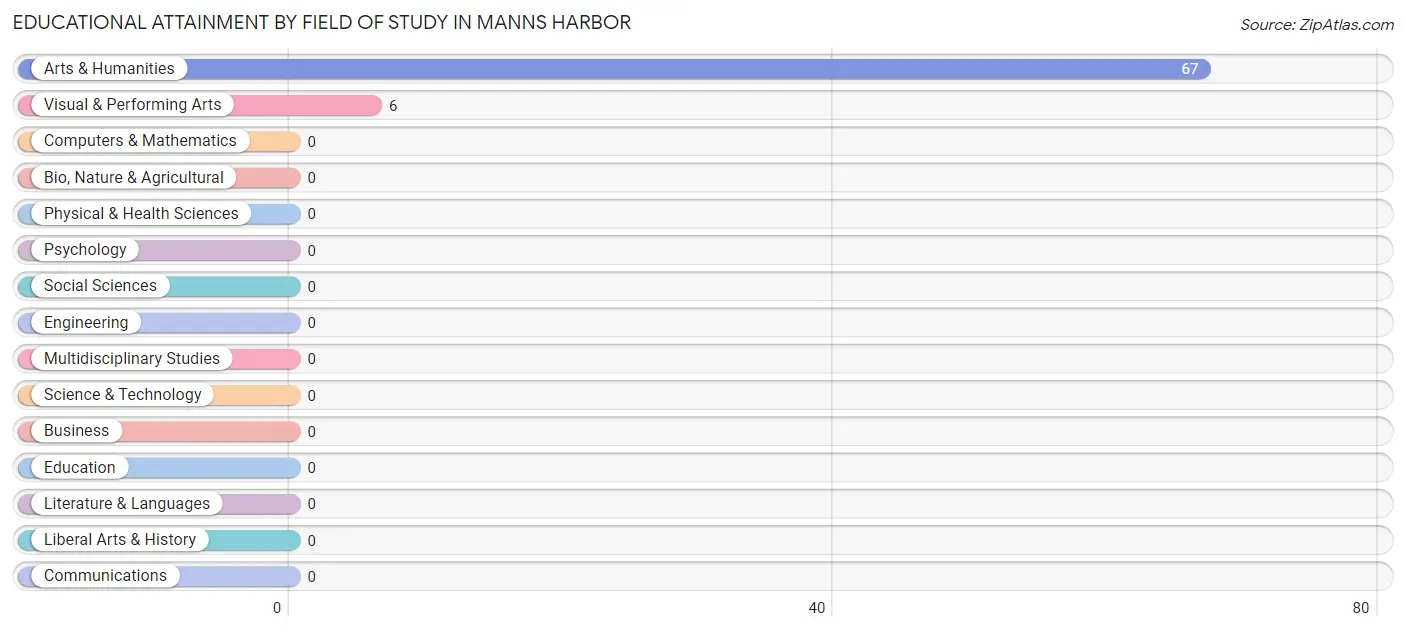
| Field of Study | # Graduates | % Graduates |
| Computers & Mathematics | 0 | 0.0% |
| Bio, Nature & Agricultural | 0 | 0.0% |
| Physical & Health Sciences | 0 | 0.0% |
| Psychology | 0 | 0.0% |
| Social Sciences | 0 | 0.0% |
| Engineering | 0 | 0.0% |
| Multidisciplinary Studies | 0 | 0.0% |
| Science & Technology | 0 | 0.0% |
| Business | 0 | 0.0% |
| Education | 0 | 0.0% |
| Literature & Languages | 0 | 0.0% |
| Liberal Arts & History | 0 | 0.0% |
| Visual & Performing Arts | 6 | 8.2% |
| Communications | 0 | 0.0% |
| Arts & Humanities | 67 | 91.8% |
| Total | 73 | 100.0% |
Transportation & Commute in Manns Harbor
Vehicle Availability by Sex in Manns Harbor
The most prevalent vehicle ownership categories in Manns Harbor are males with 2 vehicles (116, accounting for 64.1%) and females with 2 vehicles (54, making up 76.3%).
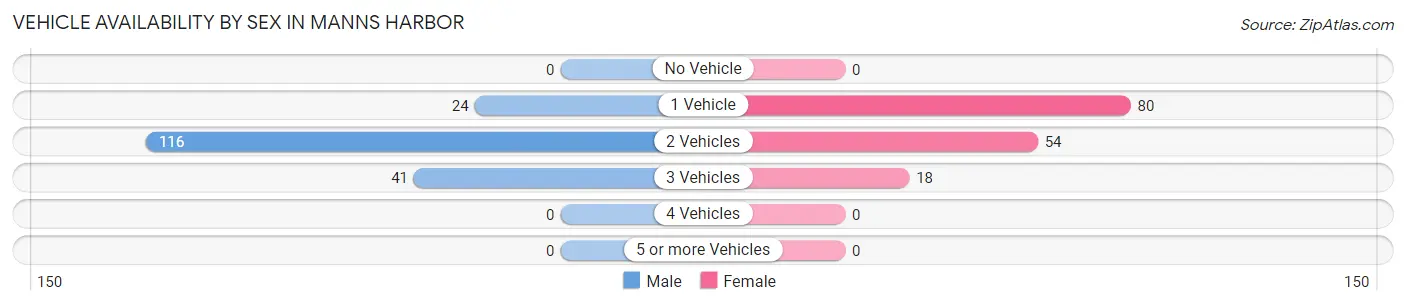
| Vehicles Available | Male | Female |
| No Vehicle | 0 (0.0%) | 0 (0.0%) |
| 1 Vehicle | 24 (13.3%) | 80 (52.6%) |
| 2 Vehicles | 116 (64.1%) | 54 (35.5%) |
| 3 Vehicles | 41 (22.7%) | 18 (11.8%) |
| 4 Vehicles | 0 (0.0%) | 0 (0.0%) |
| 5 or more Vehicles | 0 (0.0%) | 0 (0.0%) |
| Total | 181 (100.0%) | 152 (100.0%) |
Commute Time in Manns Harbor
The most frequently occuring commute durations in Manns Harbor are 20 to 24 minutes (77 commuters, 26.0%), 10 to 14 minutes (73 commuters, 24.7%), and 15 to 19 minutes (50 commuters, 16.9%).
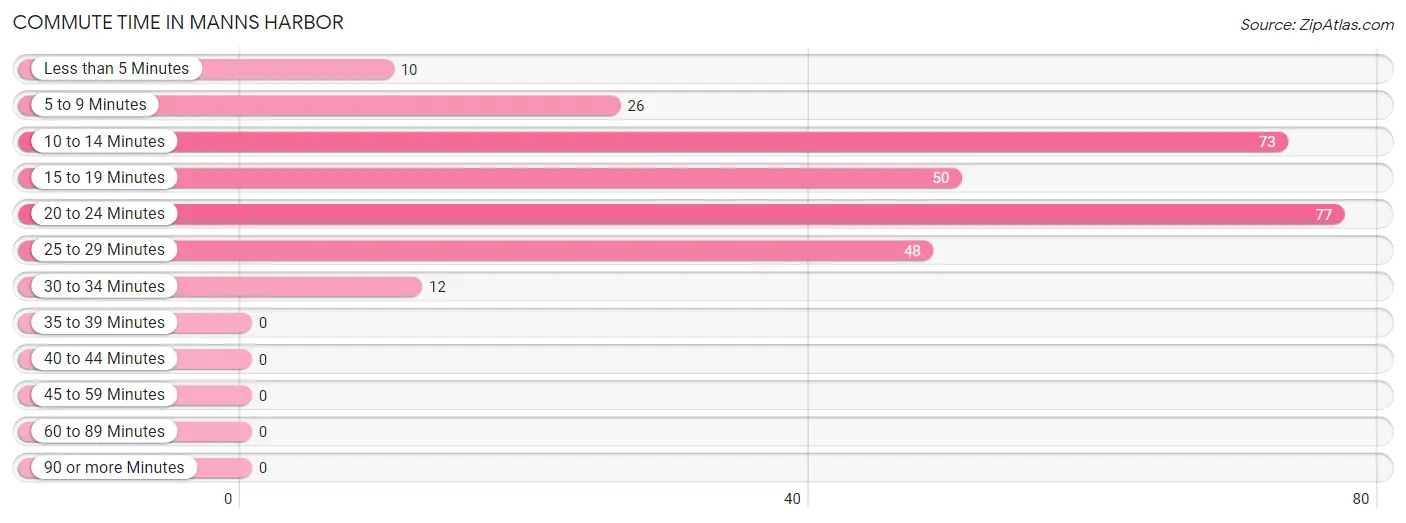
| Commute Time | # Commuters | % Commuters |
| Less than 5 Minutes | 10 | 3.4% |
| 5 to 9 Minutes | 26 | 8.8% |
| 10 to 14 Minutes | 73 | 24.7% |
| 15 to 19 Minutes | 50 | 16.9% |
| 20 to 24 Minutes | 77 | 26.0% |
| 25 to 29 Minutes | 48 | 16.2% |
| 30 to 34 Minutes | 12 | 4.1% |
| 35 to 39 Minutes | 0 | 0.0% |
| 40 to 44 Minutes | 0 | 0.0% |
| 45 to 59 Minutes | 0 | 0.0% |
| 60 to 89 Minutes | 0 | 0.0% |
| 90 or more Minutes | 0 | 0.0% |
Commute Time by Sex in Manns Harbor
The most common commute times in Manns Harbor are 10 to 14 minutes (44 commuters, 30.6%) for males and 20 to 24 minutes (44 commuters, 28.9%) for females.
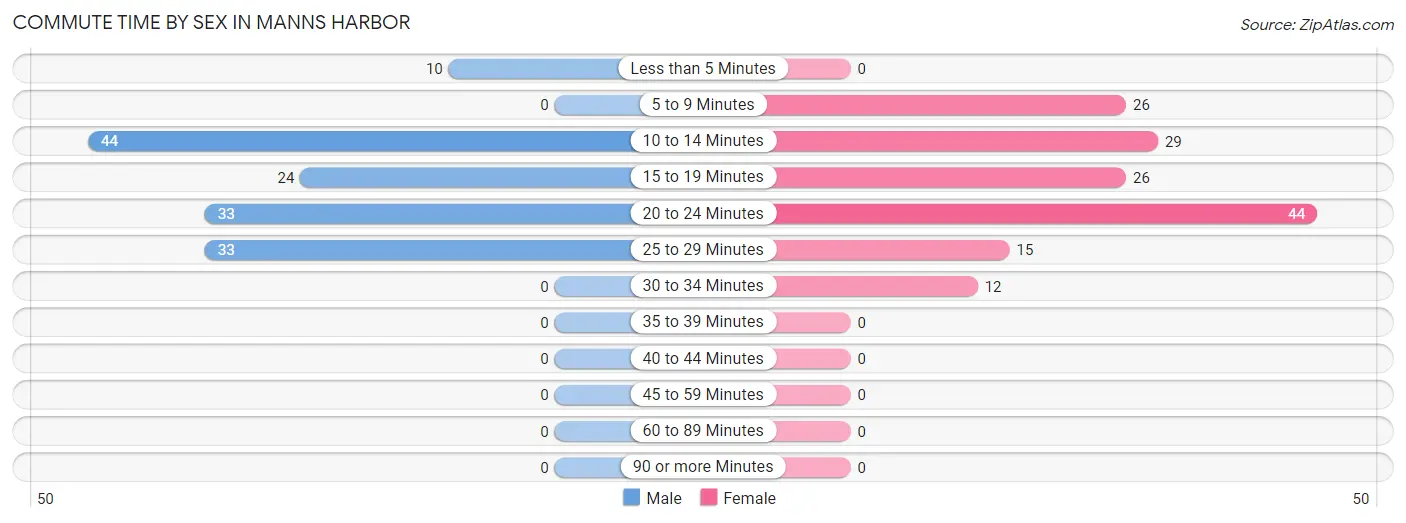
| Commute Time | Male | Female |
| Less than 5 Minutes | 10 (6.9%) | 0 (0.0%) |
| 5 to 9 Minutes | 0 (0.0%) | 26 (17.1%) |
| 10 to 14 Minutes | 44 (30.6%) | 29 (19.1%) |
| 15 to 19 Minutes | 24 (16.7%) | 26 (17.1%) |
| 20 to 24 Minutes | 33 (22.9%) | 44 (28.9%) |
| 25 to 29 Minutes | 33 (22.9%) | 15 (9.9%) |
| 30 to 34 Minutes | 0 (0.0%) | 12 (7.9%) |
| 35 to 39 Minutes | 0 (0.0%) | 0 (0.0%) |
| 40 to 44 Minutes | 0 (0.0%) | 0 (0.0%) |
| 45 to 59 Minutes | 0 (0.0%) | 0 (0.0%) |
| 60 to 89 Minutes | 0 (0.0%) | 0 (0.0%) |
| 90 or more Minutes | 0 (0.0%) | 0 (0.0%) |
Time of Departure to Work by Sex in Manns Harbor
The most frequent times of departure to work in Manns Harbor are 11:00 AM to 11:59 AM (33, 22.9%) for males and 7:30 AM to 7:59 AM (33, 21.7%) for females.
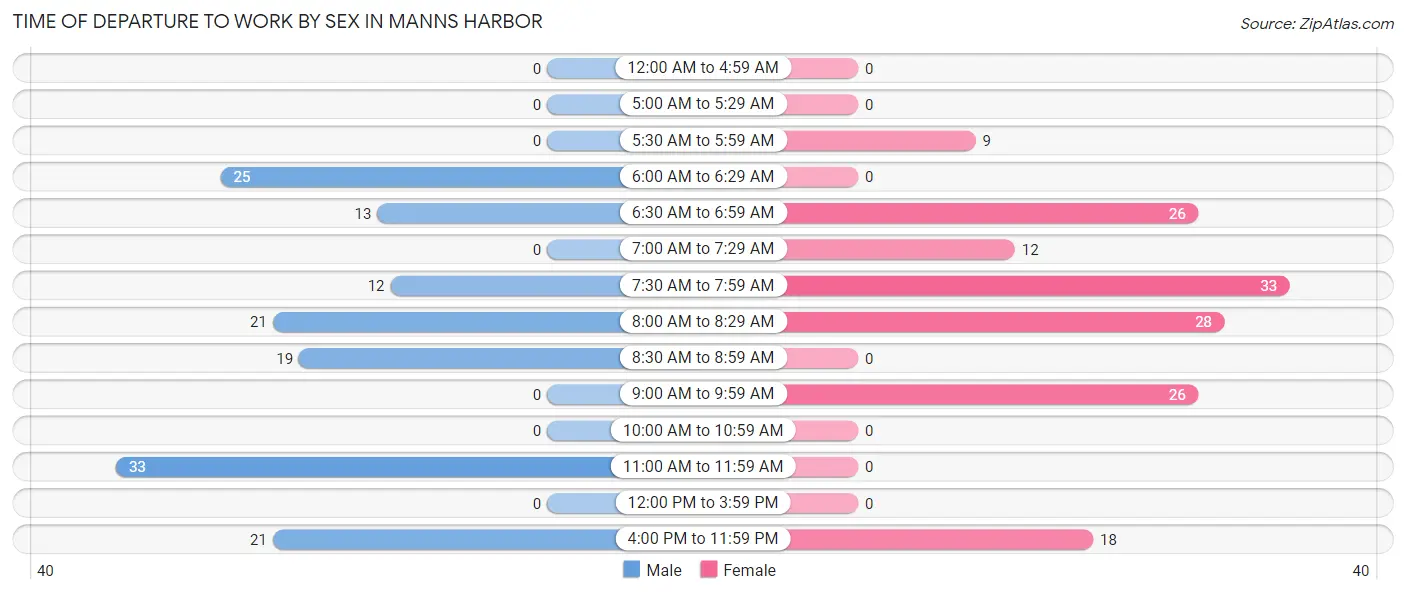
| Time of Departure | Male | Female |
| 12:00 AM to 4:59 AM | 0 (0.0%) | 0 (0.0%) |
| 5:00 AM to 5:29 AM | 0 (0.0%) | 0 (0.0%) |
| 5:30 AM to 5:59 AM | 0 (0.0%) | 9 (5.9%) |
| 6:00 AM to 6:29 AM | 25 (17.4%) | 0 (0.0%) |
| 6:30 AM to 6:59 AM | 13 (9.0%) | 26 (17.1%) |
| 7:00 AM to 7:29 AM | 0 (0.0%) | 12 (7.9%) |
| 7:30 AM to 7:59 AM | 12 (8.3%) | 33 (21.7%) |
| 8:00 AM to 8:29 AM | 21 (14.6%) | 28 (18.4%) |
| 8:30 AM to 8:59 AM | 19 (13.2%) | 0 (0.0%) |
| 9:00 AM to 9:59 AM | 0 (0.0%) | 26 (17.1%) |
| 10:00 AM to 10:59 AM | 0 (0.0%) | 0 (0.0%) |
| 11:00 AM to 11:59 AM | 33 (22.9%) | 0 (0.0%) |
| 12:00 PM to 3:59 PM | 0 (0.0%) | 0 (0.0%) |
| 4:00 PM to 11:59 PM | 21 (14.6%) | 18 (11.8%) |
| Total | 144 (100.0%) | 152 (100.0%) |
Housing Occupancy in Manns Harbor
Occupancy by Ownership in Manns Harbor
Of the total 347 dwellings in Manns Harbor, owner-occupied units account for 209 (60.2%), while renter-occupied units make up 138 (39.8%).
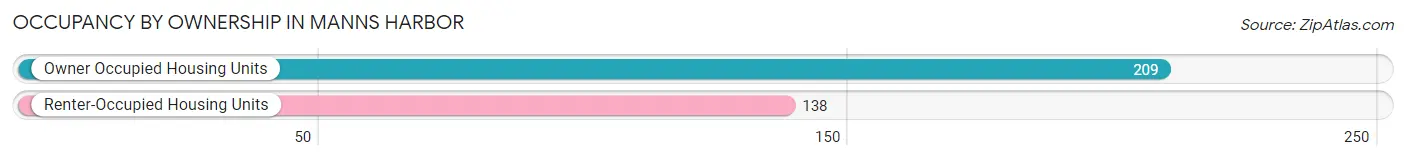
| Occupancy | # Housing Units | % Housing Units |
| Owner Occupied Housing Units | 209 | 60.2% |
| Renter-Occupied Housing Units | 138 | 39.8% |
| Total Occupied Housing Units | 347 | 100.0% |
Occupancy by Household Size in Manns Harbor
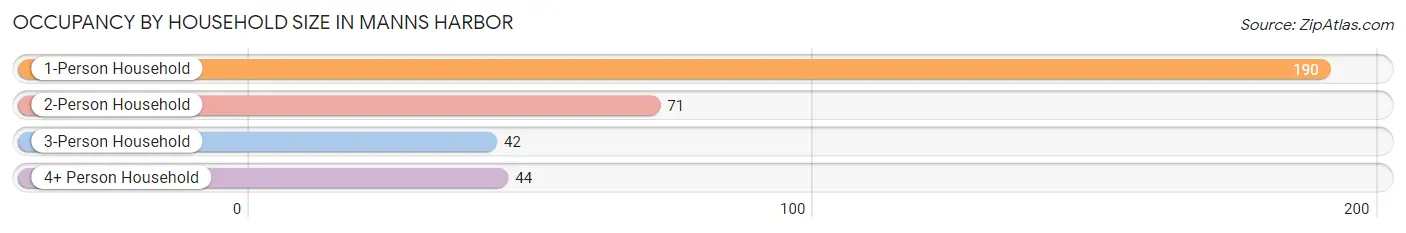
| Household Size | # Housing Units | % Housing Units |
| 1-Person Household | 190 | 54.8% |
| 2-Person Household | 71 | 20.5% |
| 3-Person Household | 42 | 12.1% |
| 4+ Person Household | 44 | 12.7% |
| Total Housing Units | 347 | 100.0% |
Occupancy by Ownership by Household Size in Manns Harbor
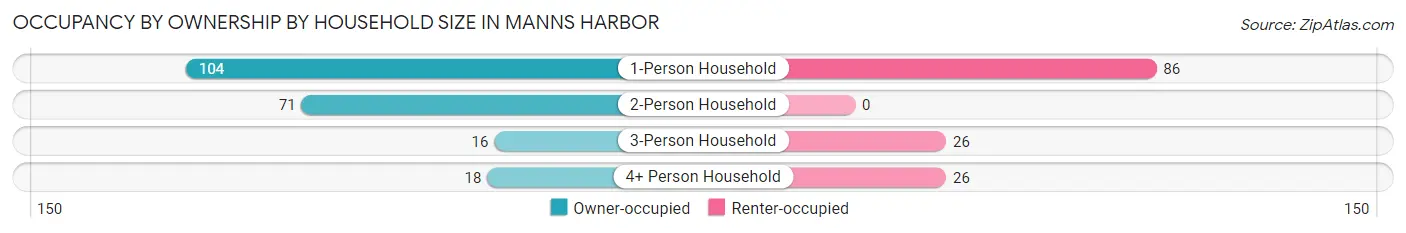
| Household Size | Owner-occupied | Renter-occupied |
| 1-Person Household | 104 (54.7%) | 86 (45.3%) |
| 2-Person Household | 71 (100.0%) | 0 (0.0%) |
| 3-Person Household | 16 (38.1%) | 26 (61.9%) |
| 4+ Person Household | 18 (40.9%) | 26 (59.1%) |
| Total Housing Units | 209 (60.2%) | 138 (39.8%) |
Occupancy by Educational Attainment in Manns Harbor
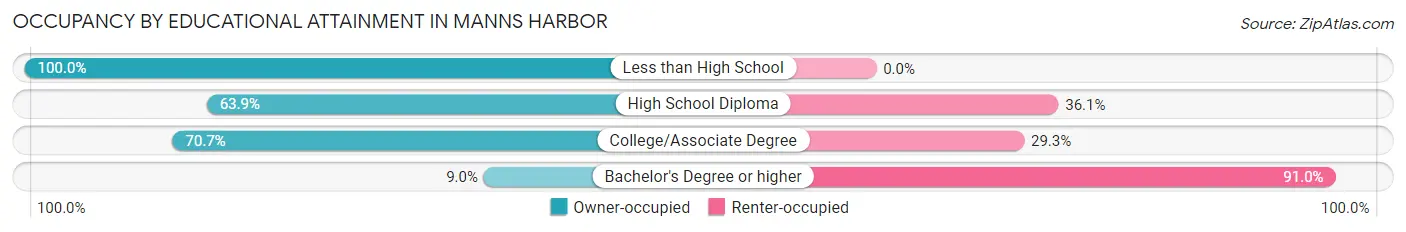
| Household Size | Owner-occupied | Renter-occupied |
| Less than High School | 34 (100.0%) | 0 (0.0%) |
| High School Diploma | 46 (63.9%) | 26 (36.1%) |
| College/Associate Degree | 123 (70.7%) | 51 (29.3%) |
| Bachelor's Degree or higher | 6 (9.0%) | 61 (91.0%) |
Occupancy by Age of Householder in Manns Harbor
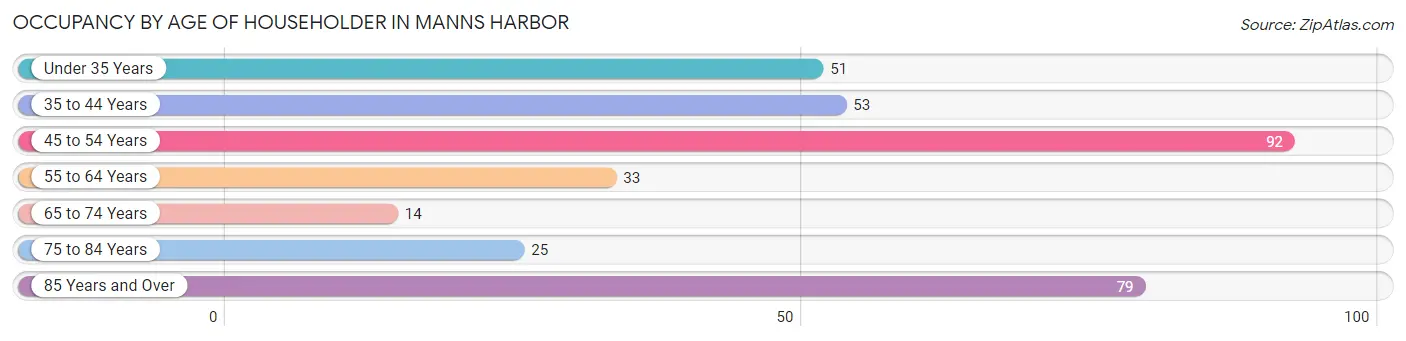
| Age Bracket | # Households | % Households |
| Under 35 Years | 51 | 14.7% |
| 35 to 44 Years | 53 | 15.3% |
| 45 to 54 Years | 92 | 26.5% |
| 55 to 64 Years | 33 | 9.5% |
| 65 to 74 Years | 14 | 4.0% |
| 75 to 84 Years | 25 | 7.2% |
| 85 Years and Over | 79 | 22.8% |
| Total | 347 | 100.0% |
Housing Finances in Manns Harbor
Median Income by Occupancy in Manns Harbor
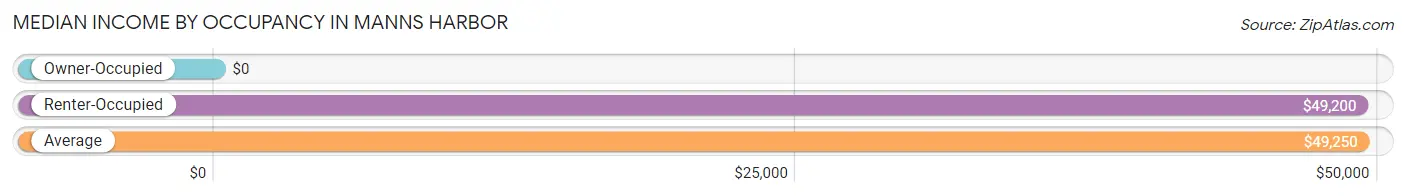
| Occupancy Type | # Households | Median Income |
| Owner-Occupied | 209 (60.2%) | $0 |
| Renter-Occupied | 138 (39.8%) | $49,200 |
| Average | 347 (100.0%) | $49,250 |
Occupancy by Householder Income Bracket in Manns Harbor
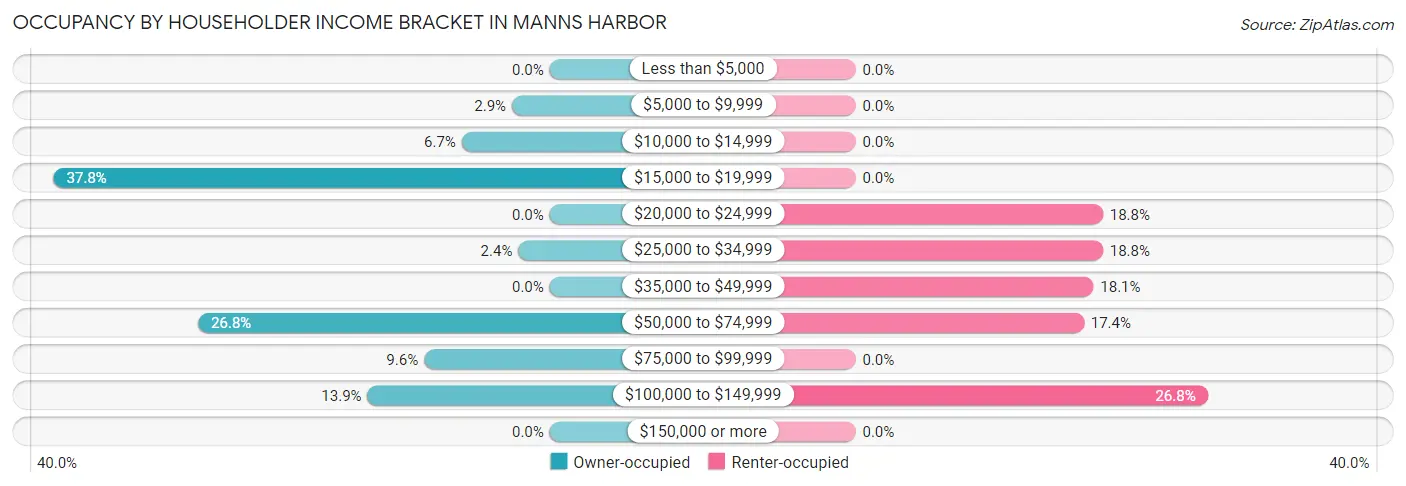
| Income Bracket | Owner-occupied | Renter-occupied |
| Less than $5,000 | 0 (0.0%) | 0 (0.0%) |
| $5,000 to $9,999 | 6 (2.9%) | 0 (0.0%) |
| $10,000 to $14,999 | 14 (6.7%) | 0 (0.0%) |
| $15,000 to $19,999 | 79 (37.8%) | 0 (0.0%) |
| $20,000 to $24,999 | 0 (0.0%) | 26 (18.8%) |
| $25,000 to $34,999 | 5 (2.4%) | 26 (18.8%) |
| $35,000 to $49,999 | 0 (0.0%) | 25 (18.1%) |
| $50,000 to $74,999 | 56 (26.8%) | 24 (17.4%) |
| $75,000 to $99,999 | 20 (9.6%) | 0 (0.0%) |
| $100,000 to $149,999 | 29 (13.9%) | 37 (26.8%) |
| $150,000 or more | 0 (0.0%) | 0 (0.0%) |
| Total | 209 (100.0%) | 138 (100.0%) |
Monthly Housing Cost Tiers in Manns Harbor
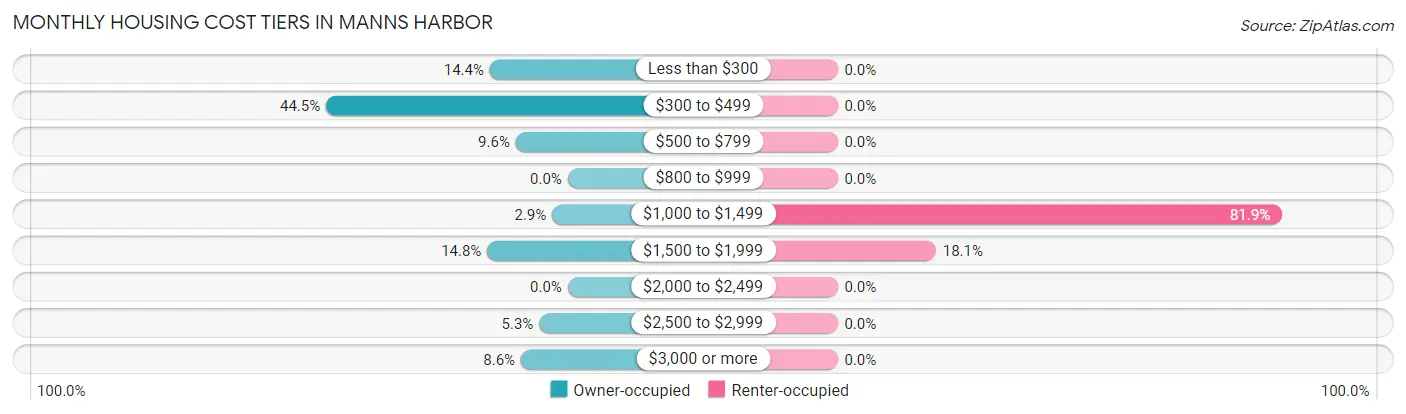
| Monthly Cost | Owner-occupied | Renter-occupied |
| Less than $300 | 30 (14.3%) | 0 (0.0%) |
| $300 to $499 | 93 (44.5%) | 0 (0.0%) |
| $500 to $799 | 20 (9.6%) | 0 (0.0%) |
| $800 to $999 | 0 (0.0%) | 0 (0.0%) |
| $1,000 to $1,499 | 6 (2.9%) | 113 (81.9%) |
| $1,500 to $1,999 | 31 (14.8%) | 25 (18.1%) |
| $2,000 to $2,499 | 0 (0.0%) | 0 (0.0%) |
| $2,500 to $2,999 | 11 (5.3%) | 0 (0.0%) |
| $3,000 or more | 18 (8.6%) | 0 (0.0%) |
| Total | 209 (100.0%) | 138 (100.0%) |
Physical Housing Characteristics in Manns Harbor
Housing Structures in Manns Harbor
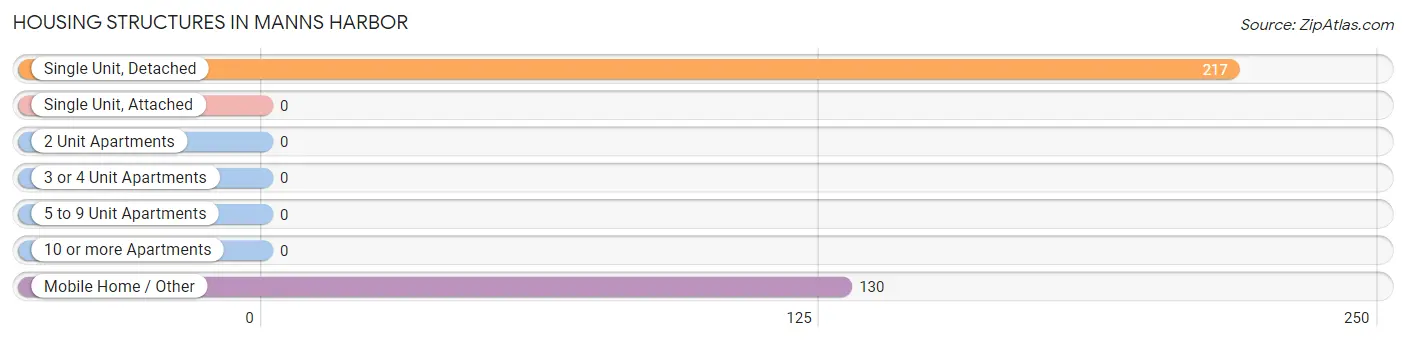
| Structure Type | # Housing Units | % Housing Units |
| Single Unit, Detached | 217 | 62.5% |
| Single Unit, Attached | 0 | 0.0% |
| 2 Unit Apartments | 0 | 0.0% |
| 3 or 4 Unit Apartments | 0 | 0.0% |
| 5 to 9 Unit Apartments | 0 | 0.0% |
| 10 or more Apartments | 0 | 0.0% |
| Mobile Home / Other | 130 | 37.5% |
| Total | 347 | 100.0% |
Housing Structures by Occupancy in Manns Harbor
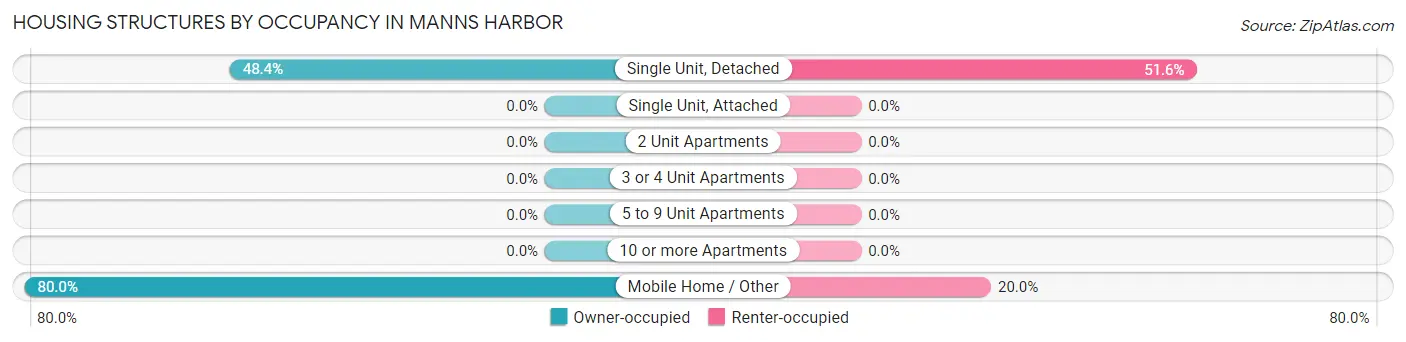
| Structure Type | Owner-occupied | Renter-occupied |
| Single Unit, Detached | 105 (48.4%) | 112 (51.6%) |
| Single Unit, Attached | 0 (0.0%) | 0 (0.0%) |
| 2 Unit Apartments | 0 (0.0%) | 0 (0.0%) |
| 3 or 4 Unit Apartments | 0 (0.0%) | 0 (0.0%) |
| 5 to 9 Unit Apartments | 0 (0.0%) | 0 (0.0%) |
| 10 or more Apartments | 0 (0.0%) | 0 (0.0%) |
| Mobile Home / Other | 104 (80.0%) | 26 (20.0%) |
| Total | 209 (60.2%) | 138 (39.8%) |
Housing Structures by Number of Rooms in Manns Harbor
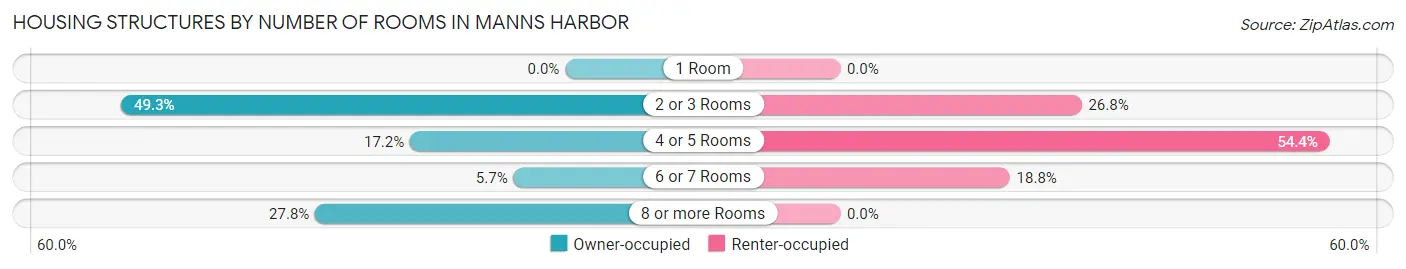
| Number of Rooms | Owner-occupied | Renter-occupied |
| 1 Room | 0 (0.0%) | 0 (0.0%) |
| 2 or 3 Rooms | 103 (49.3%) | 37 (26.8%) |
| 4 or 5 Rooms | 36 (17.2%) | 75 (54.3%) |
| 6 or 7 Rooms | 12 (5.7%) | 26 (18.8%) |
| 8 or more Rooms | 58 (27.8%) | 0 (0.0%) |
| Total | 209 (100.0%) | 138 (100.0%) |
Housing Structure by Heating Type in Manns Harbor
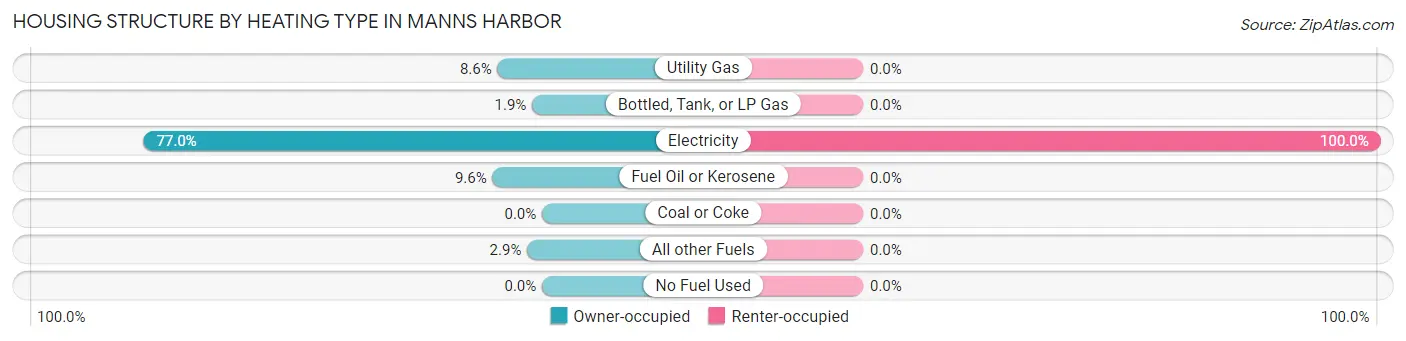
| Heating Type | Owner-occupied | Renter-occupied |
| Utility Gas | 18 (8.6%) | 0 (0.0%) |
| Bottled, Tank, or LP Gas | 4 (1.9%) | 0 (0.0%) |
| Electricity | 161 (77.0%) | 138 (100.0%) |
| Fuel Oil or Kerosene | 20 (9.6%) | 0 (0.0%) |
| Coal or Coke | 0 (0.0%) | 0 (0.0%) |
| All other Fuels | 6 (2.9%) | 0 (0.0%) |
| No Fuel Used | 0 (0.0%) | 0 (0.0%) |
| Total | 209 (100.0%) | 138 (100.0%) |
Household Vehicle Usage in Manns Harbor
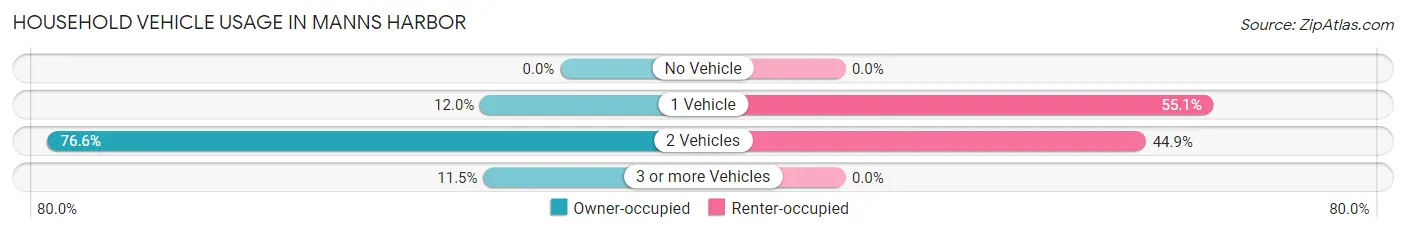
| Vehicles per Household | Owner-occupied | Renter-occupied |
| No Vehicle | 0 (0.0%) | 0 (0.0%) |
| 1 Vehicle | 25 (12.0%) | 76 (55.1%) |
| 2 Vehicles | 160 (76.6%) | 62 (44.9%) |
| 3 or more Vehicles | 24 (11.5%) | 0 (0.0%) |
| Total | 209 (100.0%) | 138 (100.0%) |
Real Estate & Mortgages in Manns Harbor
Real Estate and Mortgage Overview in Manns Harbor
| Characteristic | Without Mortgage | With Mortgage |
| Housing Units | 123 | 86 |
| Median Property Value | $9,999 | $333,300 |
| Median Household Income | $16,503 | $0 |
| Monthly Housing Costs | $440 | $18 |
| Real Estate Taxes | $199 | $0 |
Property Value by Mortgage Status in Manns Harbor
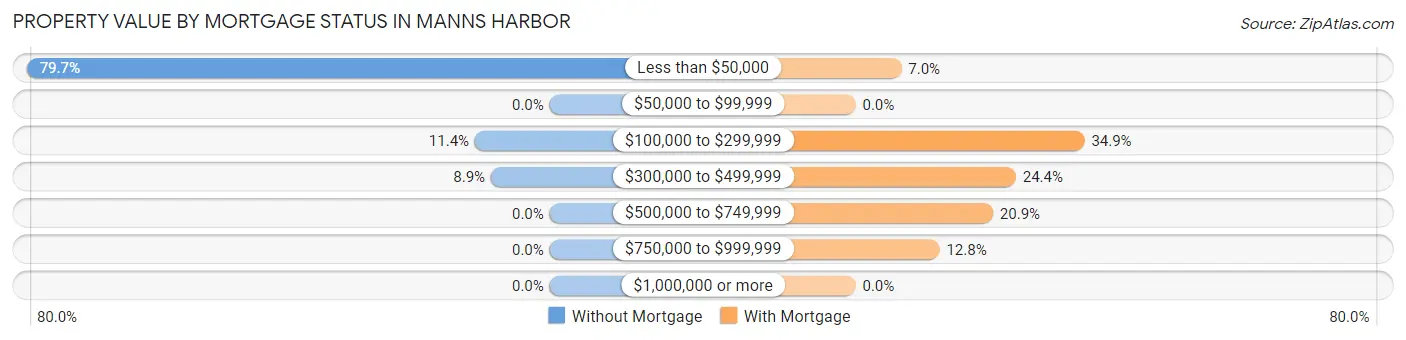
| Property Value | Without Mortgage | With Mortgage |
| Less than $50,000 | 98 (79.7%) | 6 (7.0%) |
| $50,000 to $99,999 | 0 (0.0%) | 0 (0.0%) |
| $100,000 to $299,999 | 14 (11.4%) | 30 (34.9%) |
| $300,000 to $499,999 | 11 (8.9%) | 21 (24.4%) |
| $500,000 to $749,999 | 0 (0.0%) | 18 (20.9%) |
| $750,000 to $999,999 | 0 (0.0%) | 11 (12.8%) |
| $1,000,000 or more | 0 (0.0%) | 0 (0.0%) |
| Total | 123 (100.0%) | 86 (100.0%) |
Household Income by Mortgage Status in Manns Harbor
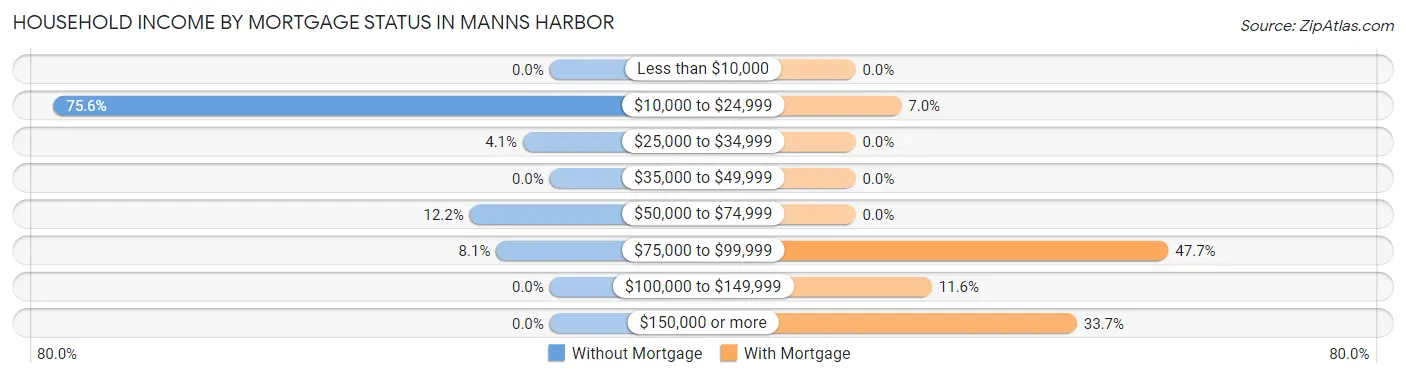
| Household Income | Without Mortgage | With Mortgage |
| Less than $10,000 | 0 (0.0%) | 0 (0.0%) |
| $10,000 to $24,999 | 93 (75.6%) | 6 (7.0%) |
| $25,000 to $34,999 | 5 (4.1%) | 0 (0.0%) |
| $35,000 to $49,999 | 0 (0.0%) | 0 (0.0%) |
| $50,000 to $74,999 | 15 (12.2%) | 0 (0.0%) |
| $75,000 to $99,999 | 10 (8.1%) | 41 (47.7%) |
| $100,000 to $149,999 | 0 (0.0%) | 10 (11.6%) |
| $150,000 or more | 0 (0.0%) | 29 (33.7%) |
| Total | 123 (100.0%) | 86 (100.0%) |
Property Value to Household Income Ratio in Manns Harbor
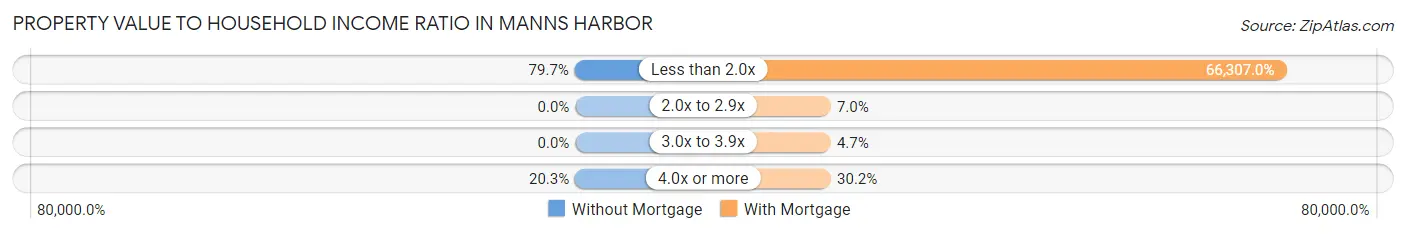
| Value-to-Income Ratio | Without Mortgage | With Mortgage |
| Less than 2.0x | 98 (79.7%) | 57,024 (66,307.0%) |
| 2.0x to 2.9x | 0 (0.0%) | 6 (7.0%) |
| 3.0x to 3.9x | 0 (0.0%) | 4 (4.6%) |
| 4.0x or more | 25 (20.3%) | 26 (30.2%) |
| Total | 123 (100.0%) | 86 (100.0%) |
Real Estate Taxes by Mortgage Status in Manns Harbor
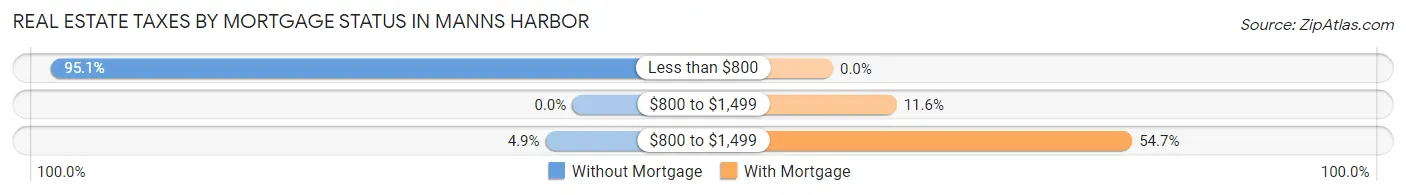
| Property Taxes | Without Mortgage | With Mortgage |
| Less than $800 | 117 (95.1%) | 0 (0.0%) |
| $800 to $1,499 | 0 (0.0%) | 10 (11.6%) |
| $800 to $1,499 | 6 (4.9%) | 47 (54.6%) |
| Total | 123 (100.0%) | 86 (100.0%) |
Health & Disability in Manns Harbor
Health Insurance Coverage by Age in Manns Harbor
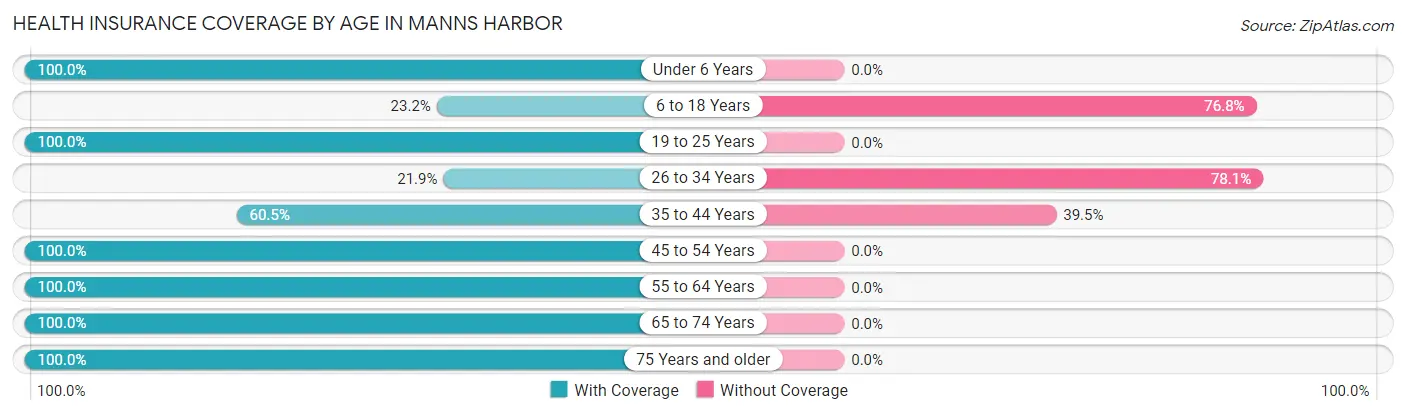
| Age Bracket | With Coverage | Without Coverage |
| Under 6 Years | 25 (100.0%) | 0 (0.0%) |
| 6 to 18 Years | 41 (23.2%) | 136 (76.8%) |
| 19 to 25 Years | 13 (100.0%) | 0 (0.0%) |
| 26 to 34 Years | 16 (21.9%) | 57 (78.1%) |
| 35 to 44 Years | 52 (60.5%) | 34 (39.5%) |
| 45 to 54 Years | 92 (100.0%) | 0 (0.0%) |
| 55 to 64 Years | 78 (100.0%) | 0 (0.0%) |
| 65 to 74 Years | 25 (100.0%) | 0 (0.0%) |
| 75 Years and older | 104 (100.0%) | 0 (0.0%) |
| Total | 446 (66.3%) | 227 (33.7%) |
Health Insurance Coverage by Citizenship Status in Manns Harbor
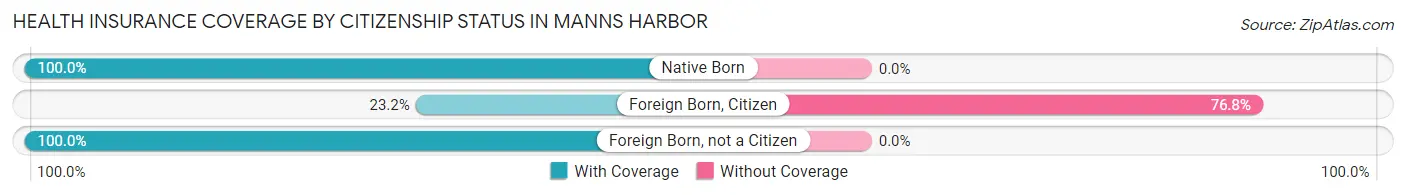
| Citizenship Status | With Coverage | Without Coverage |
| Native Born | 25 (100.0%) | 0 (0.0%) |
| Foreign Born, Citizen | 41 (23.2%) | 136 (76.8%) |
| Foreign Born, not a Citizen | 13 (100.0%) | 0 (0.0%) |
Health Insurance Coverage by Household Income in Manns Harbor
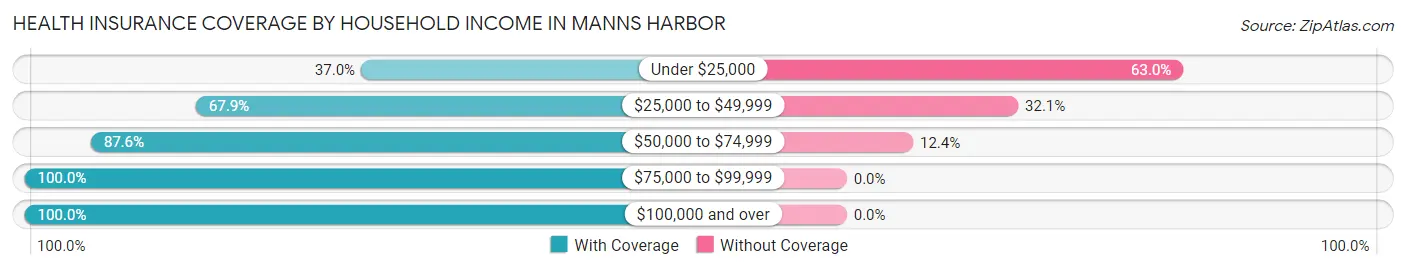
| Household Income | With Coverage | Without Coverage |
| Under $25,000 | 108 (37.0%) | 184 (63.0%) |
| $25,000 to $49,999 | 55 (67.9%) | 26 (32.1%) |
| $50,000 to $74,999 | 120 (87.6%) | 17 (12.4%) |
| $75,000 to $99,999 | 36 (100.0%) | 0 (0.0%) |
| $100,000 and over | 127 (100.0%) | 0 (0.0%) |
Public vs Private Health Insurance Coverage by Age in Manns Harbor
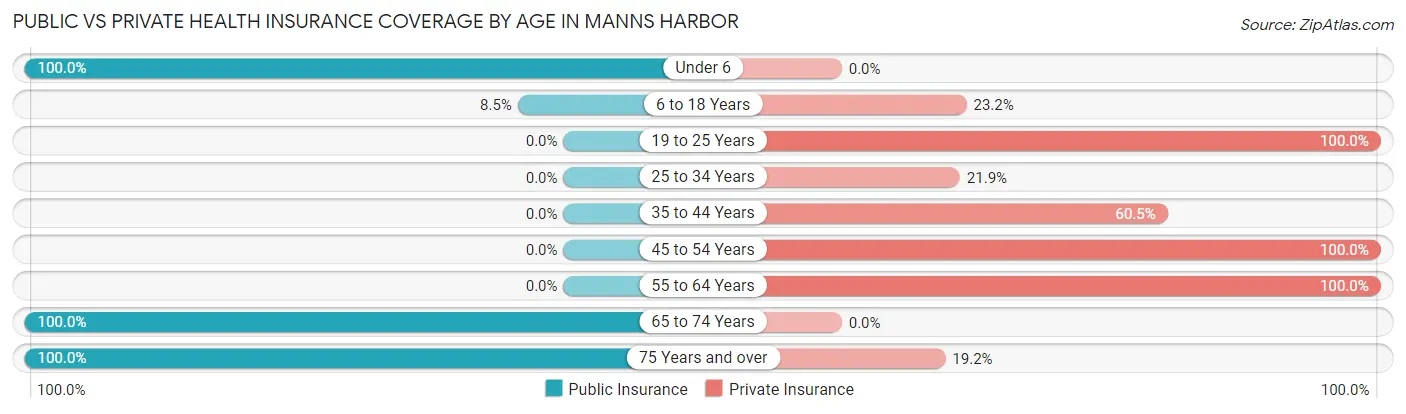
| Age Bracket | Public Insurance | Private Insurance |
| Under 6 | 25 (100.0%) | 0 (0.0%) |
| 6 to 18 Years | 15 (8.5%) | 41 (23.2%) |
| 19 to 25 Years | 0 (0.0%) | 13 (100.0%) |
| 25 to 34 Years | 0 (0.0%) | 16 (21.9%) |
| 35 to 44 Years | 0 (0.0%) | 52 (60.5%) |
| 45 to 54 Years | 0 (0.0%) | 92 (100.0%) |
| 55 to 64 Years | 0 (0.0%) | 78 (100.0%) |
| 65 to 74 Years | 25 (100.0%) | 0 (0.0%) |
| 75 Years and over | 104 (100.0%) | 20 (19.2%) |
| Total | 169 (25.1%) | 312 (46.4%) |
Disability Status by Sex by Age in Manns Harbor
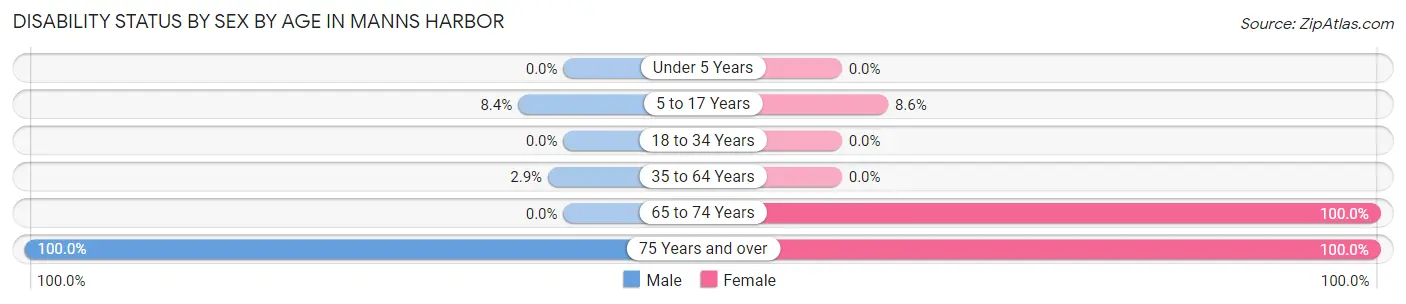
| Age Bracket | Male | Female |
| Under 5 Years | 0 (0.0%) | 0 (0.0%) |
| 5 to 17 Years | 9 (8.4%) | 6 (8.6%) |
| 18 to 34 Years | 0 (0.0%) | 0 (0.0%) |
| 35 to 64 Years | 4 (2.9%) | 0 (0.0%) |
| 65 to 74 Years | 0 (0.0%) | 14 (100.0%) |
| 75 Years and over | 99 (100.0%) | 5 (100.0%) |
Disability Class by Sex by Age in Manns Harbor
Disability Class: Hearing Difficulty
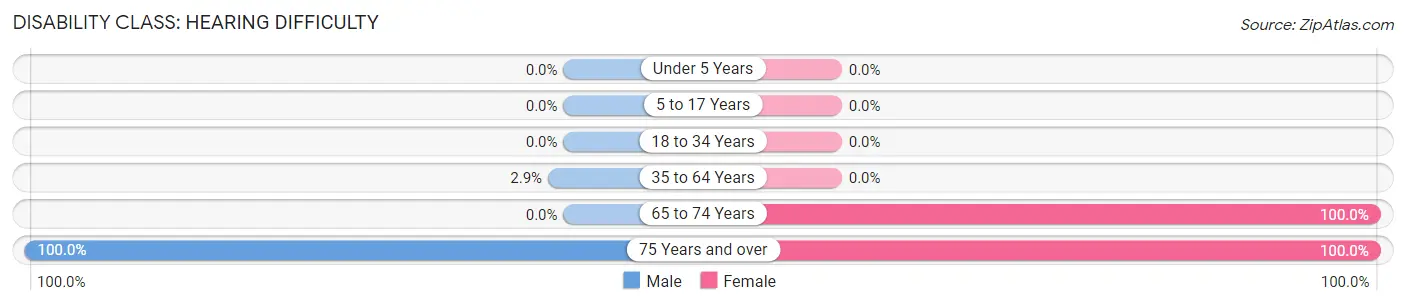
| Age Bracket | Male | Female |
| Under 5 Years | 0 (0.0%) | 0 (0.0%) |
| 5 to 17 Years | 0 (0.0%) | 0 (0.0%) |
| 18 to 34 Years | 0 (0.0%) | 0 (0.0%) |
| 35 to 64 Years | 4 (2.9%) | 0 (0.0%) |
| 65 to 74 Years | 0 (0.0%) | 14 (100.0%) |
| 75 Years and over | 99 (100.0%) | 5 (100.0%) |
Disability Class: Vision Difficulty
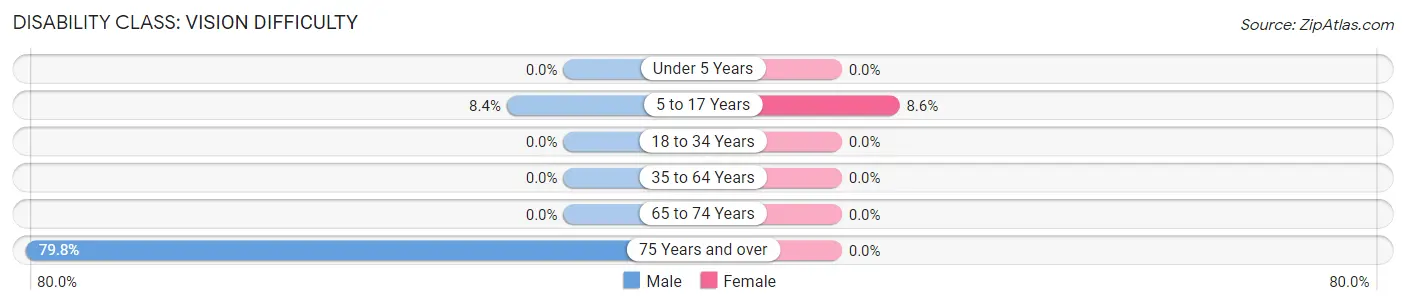
| Age Bracket | Male | Female |
| Under 5 Years | 0 (0.0%) | 0 (0.0%) |
| 5 to 17 Years | 9 (8.4%) | 6 (8.6%) |
| 18 to 34 Years | 0 (0.0%) | 0 (0.0%) |
| 35 to 64 Years | 0 (0.0%) | 0 (0.0%) |
| 65 to 74 Years | 0 (0.0%) | 0 (0.0%) |
| 75 Years and over | 79 (79.8%) | 0 (0.0%) |
Disability Class: Cognitive Difficulty
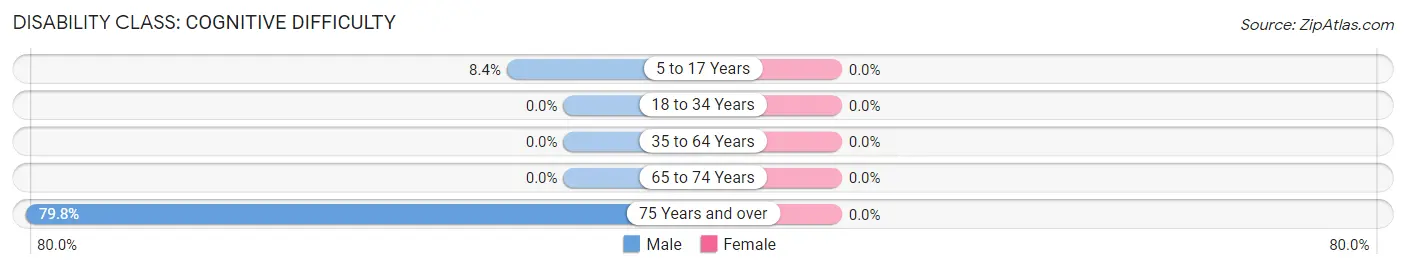
| Age Bracket | Male | Female |
| 5 to 17 Years | 9 (8.4%) | 0 (0.0%) |
| 18 to 34 Years | 0 (0.0%) | 0 (0.0%) |
| 35 to 64 Years | 0 (0.0%) | 0 (0.0%) |
| 65 to 74 Years | 0 (0.0%) | 0 (0.0%) |
| 75 Years and over | 79 (79.8%) | 0 (0.0%) |
Disability Class: Ambulatory Difficulty
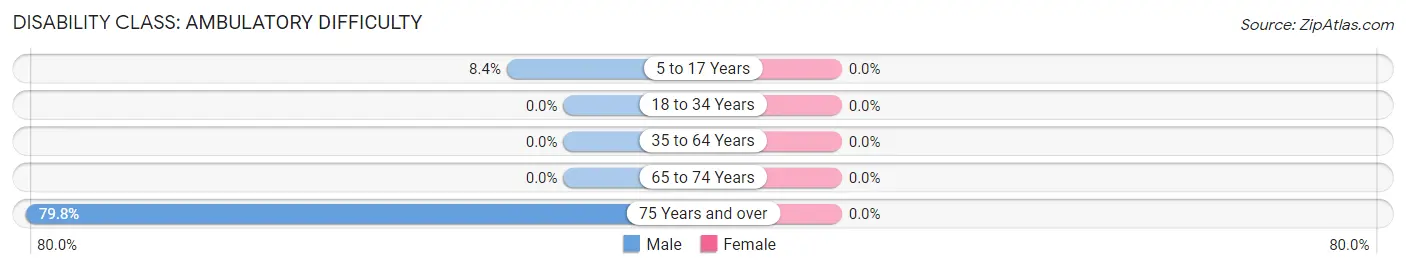
| Age Bracket | Male | Female |
| 5 to 17 Years | 9 (8.4%) | 0 (0.0%) |
| 18 to 34 Years | 0 (0.0%) | 0 (0.0%) |
| 35 to 64 Years | 0 (0.0%) | 0 (0.0%) |
| 65 to 74 Years | 0 (0.0%) | 0 (0.0%) |
| 75 Years and over | 79 (79.8%) | 0 (0.0%) |
Disability Class: Self-Care Difficulty
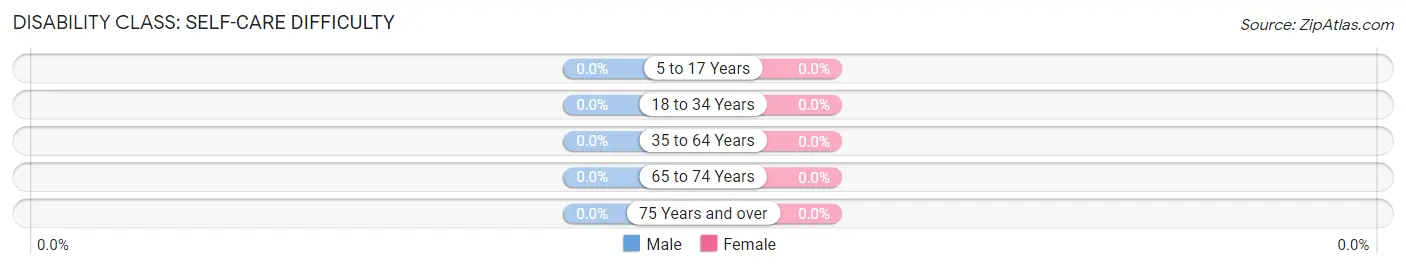
| Age Bracket | Male | Female |
| 5 to 17 Years | 0 (0.0%) | 0 (0.0%) |
| 18 to 34 Years | 0 (0.0%) | 0 (0.0%) |
| 35 to 64 Years | 0 (0.0%) | 0 (0.0%) |
| 65 to 74 Years | 0 (0.0%) | 0 (0.0%) |
| 75 Years and over | 0 (0.0%) | 0 (0.0%) |
Technology Access in Manns Harbor
Computing Device Access in Manns Harbor
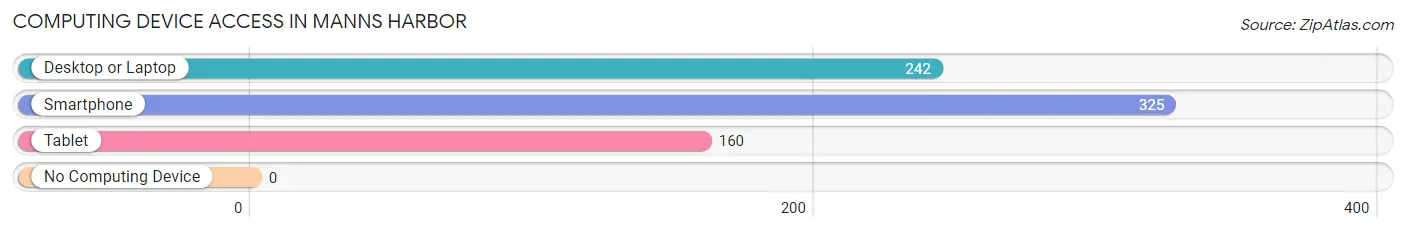
| Device Type | # Households | % Households |
| Desktop or Laptop | 242 | 69.7% |
| Smartphone | 325 | 93.7% |
| Tablet | 160 | 46.1% |
| No Computing Device | 0 | 0.0% |
| Total | 347 | 100.0% |
Internet Access in Manns Harbor
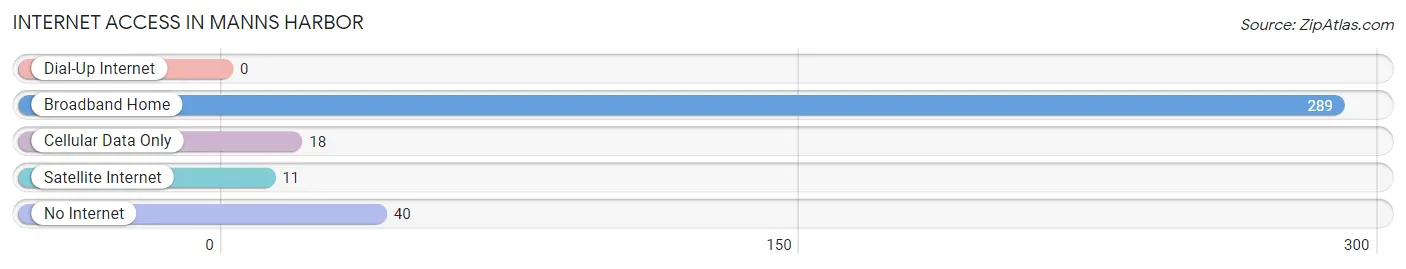
| Internet Type | # Households | % Households |
| Dial-Up Internet | 0 | 0.0% |
| Broadband Home | 289 | 83.3% |
| Cellular Data Only | 18 | 5.2% |
| Satellite Internet | 11 | 3.2% |
| No Internet | 40 | 11.5% |
| Total | 347 | 100.0% |
Manns Harbor Summary
Manns Harbor is a small unincorporated community located in Dare County, North Carolina. It is situated on the mainland of the Outer Banks, just north of the town of Manteo. The community is named after the Mann family, who were among the first settlers in the area.
History
Manns Harbor was first settled in the late 1700s by the Mann family, who were among the first settlers in the area. The Manns were originally from England and had come to the area to take advantage of the abundant fishing and hunting opportunities. The Manns built a small fishing village on the harbor, which eventually grew into the community of Manns Harbor.
In the early 1900s, the Manns Harbor area was a popular destination for tourists, who came to enjoy the area’s natural beauty and abundant wildlife. The area was also home to a thriving fishing industry, with many of the local fishermen selling their catches to the nearby towns of Manteo and Nags Head.
In the 1950s, the Manns Harbor area began to experience a decline in its fishing industry, as the area’s fish stocks began to dwindle. This led to a decrease in the number of fishermen in the area, and the local economy began to suffer.
In the late 1970s, the Manns Harbor area began to experience a resurgence in its economy, as the area began to attract more tourists. The area’s natural beauty and abundant wildlife began to draw more visitors, and the local economy began to improve.
Today, Manns Harbor is a popular destination for tourists, who come to enjoy the area’s natural beauty and abundant wildlife. The area is also home to a thriving fishing industry, with many of the local fishermen selling their catches to the nearby towns of Manteo and Nags Head.
Geography
Manns Harbor is located in Dare County, North Carolina, on the mainland of the Outer Banks. The community is situated on the western shore of Croatan Sound, just north of the town of Manteo. The area is surrounded by the Croatan National Forest, which provides a beautiful backdrop for the community.
The climate in Manns Harbor is humid subtropical, with hot, humid summers and mild winters. The average temperature in the summer is around 80 degrees Fahrenheit, while the average temperature in the winter is around 50 degrees Fahrenheit.
Economy
The economy of Manns Harbor is largely based on tourism and fishing. The area is a popular destination for tourists, who come to enjoy the area’s natural beauty and abundant wildlife. The area is also home to a thriving fishing industry, with many of the local fishermen selling their catches to the nearby towns of Manteo and Nags Head.
In addition to tourism and fishing, Manns Harbor is also home to a number of small businesses, including restaurants, shops, and marinas. The area is also home to a number of boat builders, who specialize in building custom boats for the local fishing industry.
Demographics
As of the 2010 census, the population of Manns Harbor was 1,093. The racial makeup of the community was 94.3% White, 2.2% African American, 0.7% Native American, 0.7% Asian, 0.2% Pacific Islander, and 1.9% from other races. The median household income in Manns Harbor was $41,250, and the median family income was $45,000.
Conclusion
Manns Harbor is a small unincorporated community located in Dare County, North Carolina. It is situated on the mainland of the Outer Banks, just north of the town of Manteo. The community is named after the Mann family, who were among the first settlers in the area. The economy of Manns Harbor is largely based on tourism and fishing, and the area is a popular destination for tourists, who come to enjoy the area’s natural beauty and abundant wildlife. The population of Manns Harbor was 1,093 as of the 2010 census, and the median household income was $41,250.
Common Questions
What is Per Capita Income in Manns Harbor?
Per Capita income in Manns Harbor is $26,620.
What is the Median Family Income in Manns Harbor?
Median Family Income in Manns Harbor is $52,000.
What is the Median Household income in Manns Harbor?
Median Household Income in Manns Harbor is $49,250.
What is Income or Wage Gap in Manns Harbor?
Income or Wage Gap in Manns Harbor is 51.9%.
Women in Manns Harbor earn 48.1 cents for every dollar earned by a man.
What is Inequality or Gini Index in Manns Harbor?
Inequality or Gini Index in Manns Harbor is 0.39.
What is the Total Population of Manns Harbor?
Total Population of Manns Harbor is 673.
What is the Total Male Population of Manns Harbor?
Total Male Population of Manns Harbor is 392.
What is the Total Female Population of Manns Harbor?
Total Female Population of Manns Harbor is 281.
What is the Ratio of Males per 100 Females in Manns Harbor?
There are 139.50 Males per 100 Females in Manns Harbor.
What is the Ratio of Females per 100 Males in Manns Harbor?
There are 71.68 Females per 100 Males in Manns Harbor.
What is the Median Population Age in Manns Harbor?
Median Population Age in Manns Harbor is 40.4 Years.
What is the Average Family Size in Manns Harbor
Average Family Size in Manns Harbor is 3.1 People.
What is the Average Household Size in Manns Harbor
Average Household Size in Manns Harbor is 1.9 People.
How Large is the Labor Force in Manns Harbor?
There are 356 People in the Labor Forcein in Manns Harbor.
What is the Percentage of People in the Labor Force in Manns Harbor?
73.3% of People are in the Labor Force in Manns Harbor.