Forest City, NC Map & Demographics
Forest City Map
Forest City Overview
$21,671
PER CAPITA INCOME
$43,710
AVG FAMILY INCOME
$35,232
AVG HOUSEHOLD INCOME
20.2%
WAGE / INCOME GAP [ % ]
79.8¢/ $1
WAGE / INCOME GAP [ $ ]
0.50
INEQUALITY / GINI INDEX
7,357
TOTAL POPULATION
3,266
MALE POPULATION
4,091
FEMALE POPULATION
79.83
MALES / 100 FEMALES
125.26
FEMALES / 100 MALES
32.8
MEDIAN AGE
3.6
AVG FAMILY SIZE
2.7
AVG HOUSEHOLD SIZE
2,901
LABOR FORCE [ PEOPLE ]
53.9%
PERCENT IN LABOR FORCE
10.1%
UNEMPLOYMENT RATE
Forest City Zip Codes
Forest City Area Codes
Income in Forest City
Income Overview in Forest City
Per Capita Income in Forest City is $21,671, while median incomes of families and households are $43,710 and $35,232 respectively.
| Characteristic | Number | Measure |
| Per Capita Income | 7,357 | $21,671 |
| Median Family Income | 1,549 | $43,710 |
| Mean Family Income | 1,549 | $57,989 |
| Median Household Income | 2,691 | $35,232 |
| Mean Household Income | 2,691 | $55,542 |
| Income Deficit | 1,549 | $0 |
| Wage / Income Gap (%) | 7,357 | 20.15% |
| Wage / Income Gap ($) | 7,357 | 79.85¢ per $1 |
| Gini / Inequality Index | 7,357 | 0.50 |
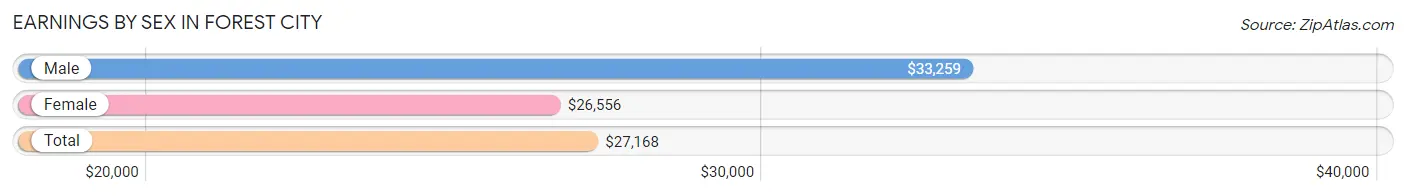
Earnings by Sex in Forest City
Average Earnings in Forest City are $27,168, $33,259 for men and $26,556 for women, a difference of 20.2%.
| Sex | Number | Average Earnings |
| Male | 1,406 (47.7%) | $33,259 |
| Female | 1,543 (52.3%) | $26,556 |
| Total | 2,949 (100.0%) | $27,168 |
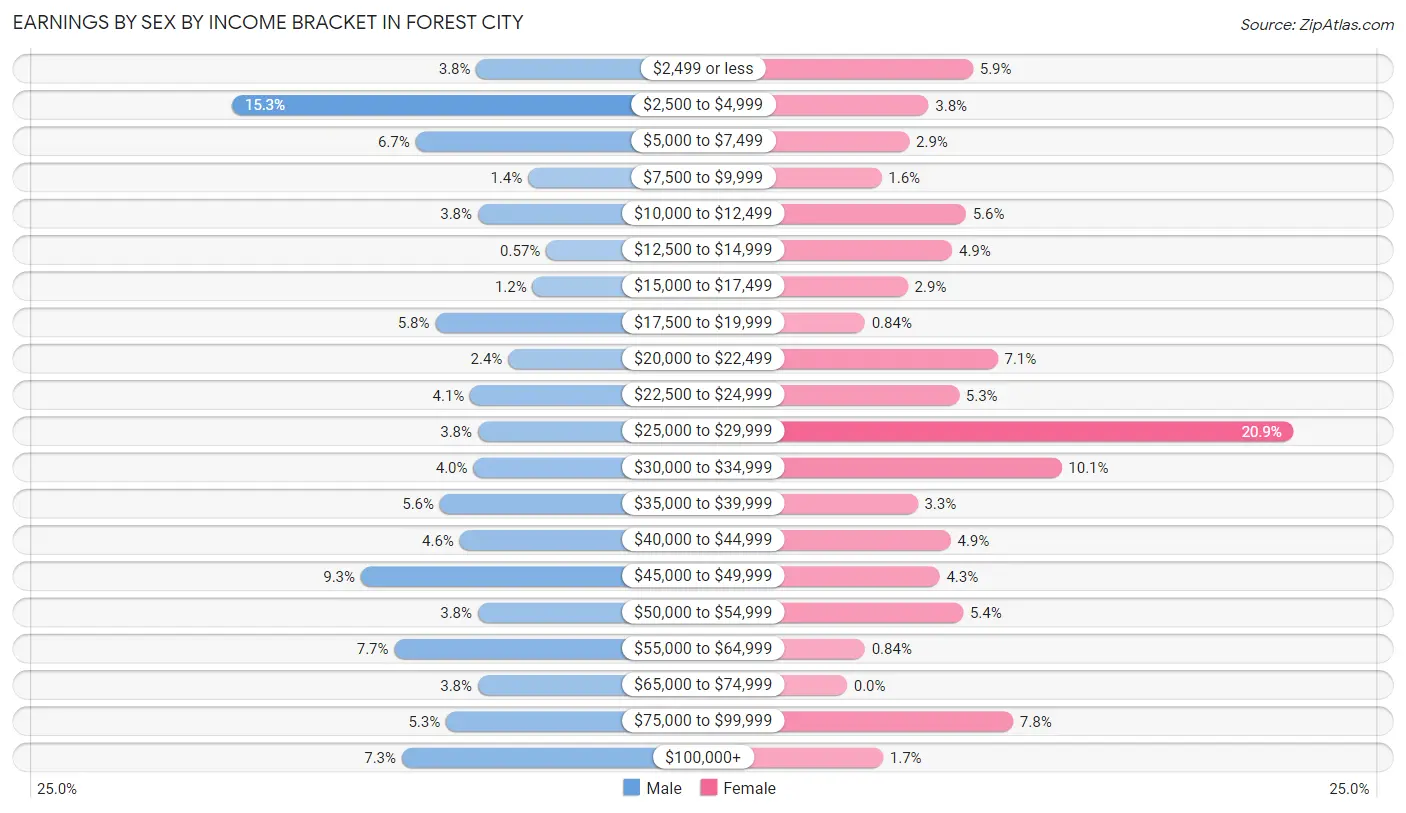
Earnings by Sex by Income Bracket in Forest City
The most common earnings brackets in Forest City are $2,500 to $4,999 for men (215 | 15.3%) and $25,000 to $29,999 for women (323 | 20.9%).
| Income | Male | Female |
| $2,499 or less | 54 (3.8%) | 91 (5.9%) |
| $2,500 to $4,999 | 215 (15.3%) | 59 (3.8%) |
| $5,000 to $7,499 | 94 (6.7%) | 45 (2.9%) |
| $7,500 to $9,999 | 20 (1.4%) | 25 (1.6%) |
| $10,000 to $12,499 | 53 (3.8%) | 86 (5.6%) |
| $12,500 to $14,999 | 8 (0.6%) | 76 (4.9%) |
| $15,000 to $17,499 | 17 (1.2%) | 44 (2.9%) |
| $17,500 to $19,999 | 81 (5.8%) | 13 (0.8%) |
| $20,000 to $22,499 | 33 (2.4%) | 109 (7.1%) |
| $22,500 to $24,999 | 58 (4.1%) | 81 (5.2%) |
| $25,000 to $29,999 | 53 (3.8%) | 323 (20.9%) |
| $30,000 to $34,999 | 56 (4.0%) | 155 (10.1%) |
| $35,000 to $39,999 | 78 (5.6%) | 51 (3.3%) |
| $40,000 to $44,999 | 65 (4.6%) | 75 (4.9%) |
| $45,000 to $49,999 | 130 (9.2%) | 67 (4.3%) |
| $50,000 to $54,999 | 53 (3.8%) | 84 (5.4%) |
| $55,000 to $64,999 | 108 (7.7%) | 13 (0.8%) |
| $65,000 to $74,999 | 53 (3.8%) | 0 (0.0%) |
| $75,000 to $99,999 | 74 (5.3%) | 120 (7.8%) |
| $100,000+ | 103 (7.3%) | 26 (1.7%) |
| Total | 1,406 (100.0%) | 1,543 (100.0%) |
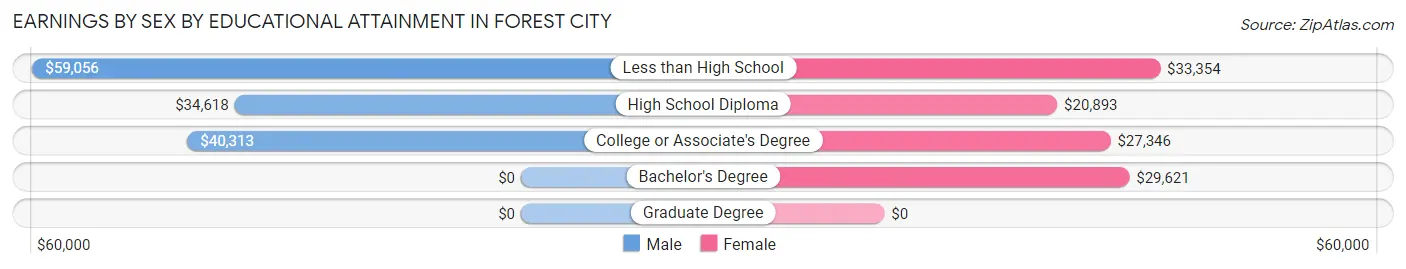
Earnings by Sex by Educational Attainment in Forest City
Average earnings in Forest City are $41,442 for men and $27,208 for women, a difference of 34.4%. Men with an educational attainment of less than high school enjoy the highest average annual earnings of $59,056, while those with high school diploma education earn the least with $34,618. Women with an educational attainment of less than high school earn the most with the average annual earnings of $33,354, while those with high school diploma education have the smallest earnings of $20,893.
| Educational Attainment | Male Income | Female Income |
| Less than High School | $59,056 | $33,354 |
| High School Diploma | $34,618 | $20,893 |
| College or Associate's Degree | $40,313 | $27,346 |
| Bachelor's Degree | - | - |
| Graduate Degree | - | - |
| Total | $41,442 | $27,208 |
Family Income in Forest City
Family Income Brackets in Forest City
According to the Forest City family income data, there are 316 families falling into the $35,000 to $49,999 income range, which is the most common income bracket and makes up 20.4% of all families. Conversely, the $200,000+ income bracket is the least frequent group with only 23 families (1.5%) belonging to this category.
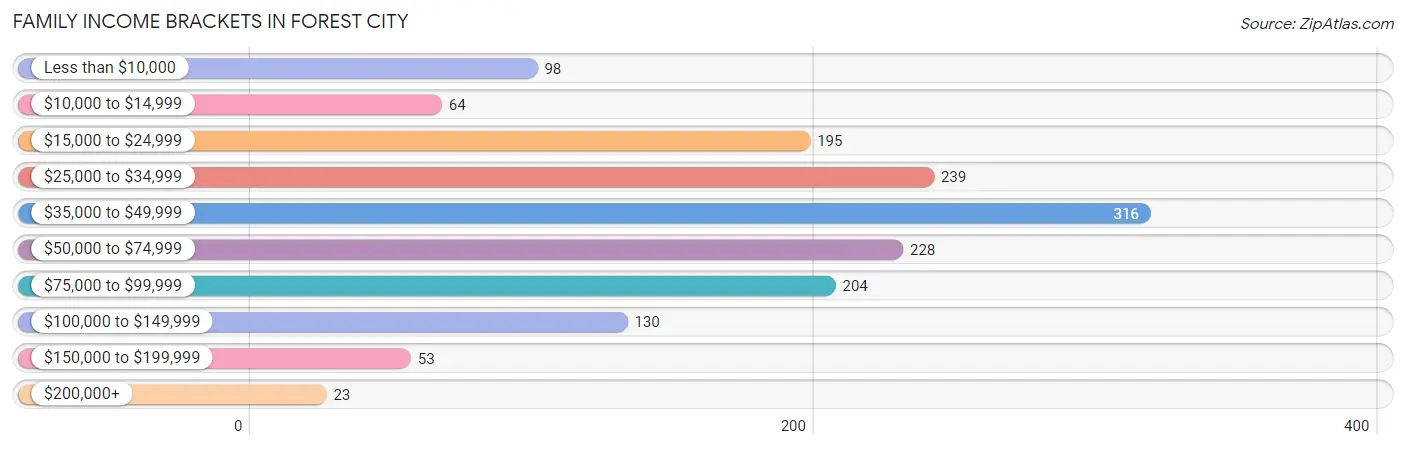
| Income Bracket | # Families | % Families |
| Less than $10,000 | 98 | 6.3% |
| $10,000 to $14,999 | 64 | 4.1% |
| $15,000 to $24,999 | 195 | 12.6% |
| $25,000 to $34,999 | 239 | 15.4% |
| $35,000 to $49,999 | 316 | 20.4% |
| $50,000 to $74,999 | 228 | 14.7% |
| $75,000 to $99,999 | 204 | 13.2% |
| $100,000 to $149,999 | 130 | 8.4% |
| $150,000 to $199,999 | 53 | 3.4% |
| $200,000+ | 23 | 1.5% |
Family Income by Famaliy Size in Forest City
6-person families (86 | 5.6%) account for the highest median family income in Forest City with $78,162 per family, while 3-person families (394 | 25.4%) have the highest median income of $24,225 per family member.
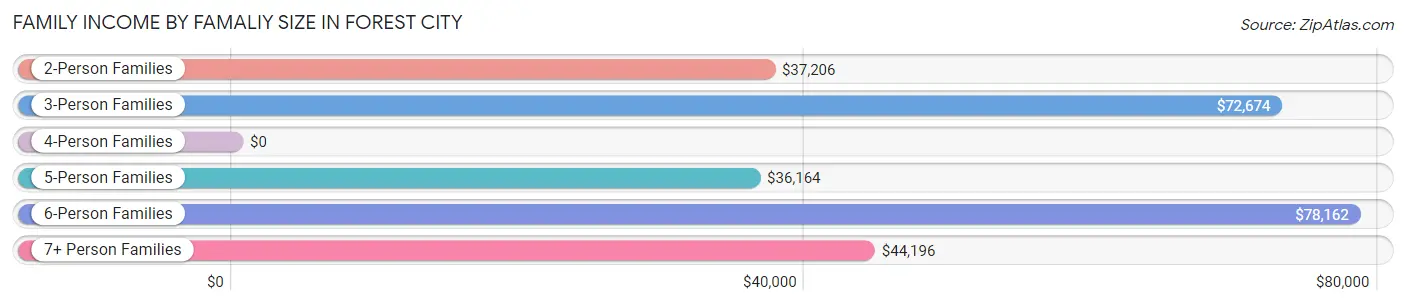
| Income Bracket | # Families | Median Income |
| 2-Person Families | 628 (40.5%) | $37,206 |
| 3-Person Families | 394 (25.4%) | $72,674 |
| 4-Person Families | 238 (15.4%) | $0 |
| 5-Person Families | 89 (5.8%) | $36,164 |
| 6-Person Families | 86 (5.6%) | $78,162 |
| 7+ Person Families | 114 (7.4%) | $44,196 |
| Total | 1,549 (100.0%) | $43,710 |
Family Income by Number of Earners in Forest City
The median family income in Forest City is $43,710, with families comprising 3+ earners (144) having the highest median family income of $138,125, while families with no earners (328) have the lowest median family income of $23,177, accounting for 9.3% and 21.2% of families, respectively.
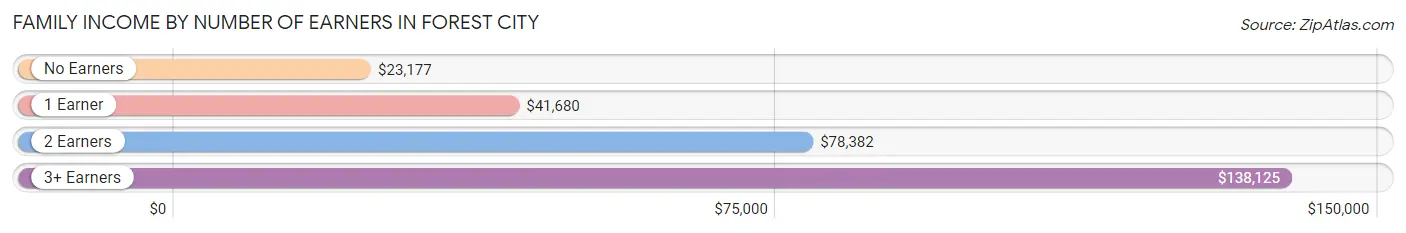
| Number of Earners | # Families | Median Income |
| No Earners | 328 (21.2%) | $23,177 |
| 1 Earner | 635 (41.0%) | $41,680 |
| 2 Earners | 442 (28.5%) | $78,382 |
| 3+ Earners | 144 (9.3%) | $138,125 |
| Total | 1,549 (100.0%) | $43,710 |
Household Income in Forest City
Household Income Brackets in Forest City
With 428 households falling in the category, the $15,000 to $24,999 income range is the most frequent in Forest City, accounting for 15.9% of all households. In contrast, only 51 households (1.9%) fall into the $150,000 to $199,999 income bracket, making it the least populous group.
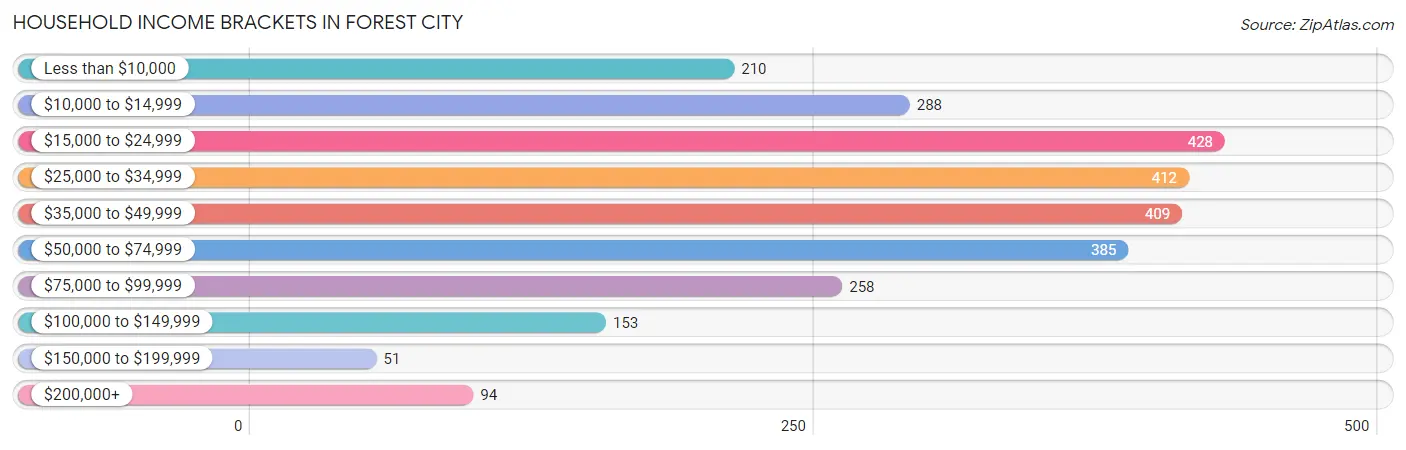
| Income Bracket | # Households | % Households |
| Less than $10,000 | 210 | 7.8% |
| $10,000 to $14,999 | 288 | 10.7% |
| $15,000 to $24,999 | 428 | 15.9% |
| $25,000 to $34,999 | 412 | 15.3% |
| $35,000 to $49,999 | 409 | 15.2% |
| $50,000 to $74,999 | 385 | 14.3% |
| $75,000 to $99,999 | 258 | 9.6% |
| $100,000 to $149,999 | 153 | 5.7% |
| $150,000 to $199,999 | 51 | 1.9% |
| $200,000+ | 94 | 3.5% |
Household Income by Householder Age in Forest City
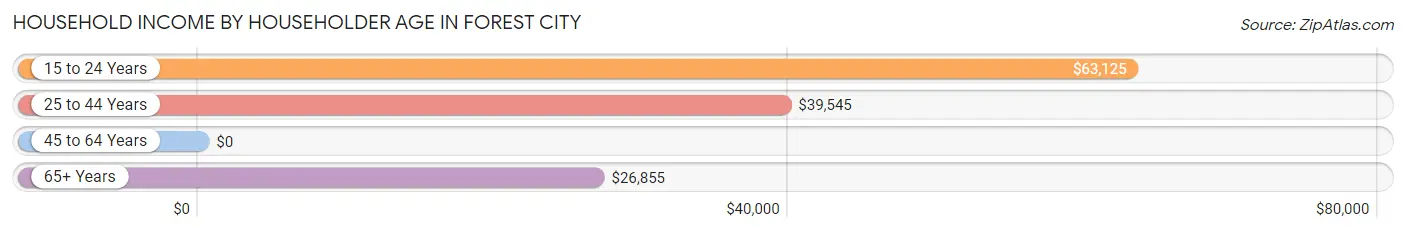
The median household income in Forest City is $35,232, with the highest median household income of $63,125 found in the 15 to 24 years age bracket for the primary householder. A total of 60 households (2.2%) fall into this category. Meanwhile, the 45 to 64 years age bracket for the primary householder has the lowest median household income of $0, with 977 households (36.3%) in this group.
| Income Bracket | # Households | Median Income |
| 15 to 24 Years | 60 (2.2%) | $63,125 |
| 25 to 44 Years | 854 (31.7%) | $39,545 |
| 45 to 64 Years | 977 (36.3%) | $0 |
| 65+ Years | 800 (29.7%) | $26,855 |
| Total | 2,691 (100.0%) | $35,232 |
Poverty in Forest City
Income Below Poverty by Sex and Age in Forest City
With 34.7% poverty level for males and 42.3% for females among the residents of Forest City, 5 year old males and 5 year old females are the most vulnerable to poverty, with 14 males (100.0%) and 22 females (73.3%) in their respective age groups living below the poverty level.
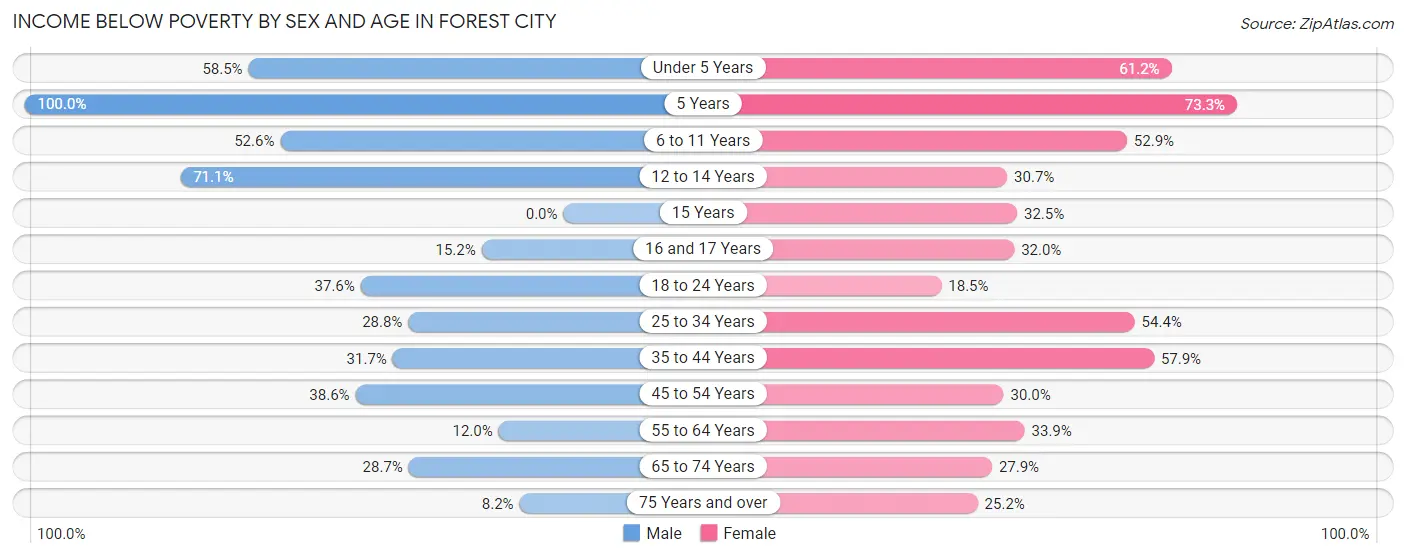
| Age Bracket | Male | Female |
| Under 5 Years | 204 (58.5%) | 186 (61.2%) |
| 5 Years | 14 (100.0%) | 22 (73.3%) |
| 6 to 11 Years | 216 (52.5%) | 254 (52.9%) |
| 12 to 14 Years | 64 (71.1%) | 31 (30.7%) |
| 15 Years | 0 (0.0%) | 27 (32.5%) |
| 16 and 17 Years | 29 (15.2%) | 16 (32.0%) |
| 18 to 24 Years | 149 (37.6%) | 34 (18.5%) |
| 25 to 34 Years | 110 (28.8%) | 399 (54.4%) |
| 35 to 44 Years | 64 (31.7%) | 259 (57.9%) |
| 45 to 54 Years | 132 (38.6%) | 136 (30.0%) |
| 55 to 64 Years | 32 (12.0%) | 171 (33.9%) |
| 65 to 74 Years | 87 (28.7%) | 102 (27.9%) |
| 75 Years and over | 15 (8.2%) | 85 (25.2%) |
| Total | 1,116 (34.7%) | 1,722 (42.3%) |
Income Above Poverty by Sex and Age in Forest City
According to the poverty statistics in Forest City, males aged 15 years and females aged 18 to 24 years are the age groups that are most secure financially, with 100.0% of males and 81.5% of females in these age groups living above the poverty line.
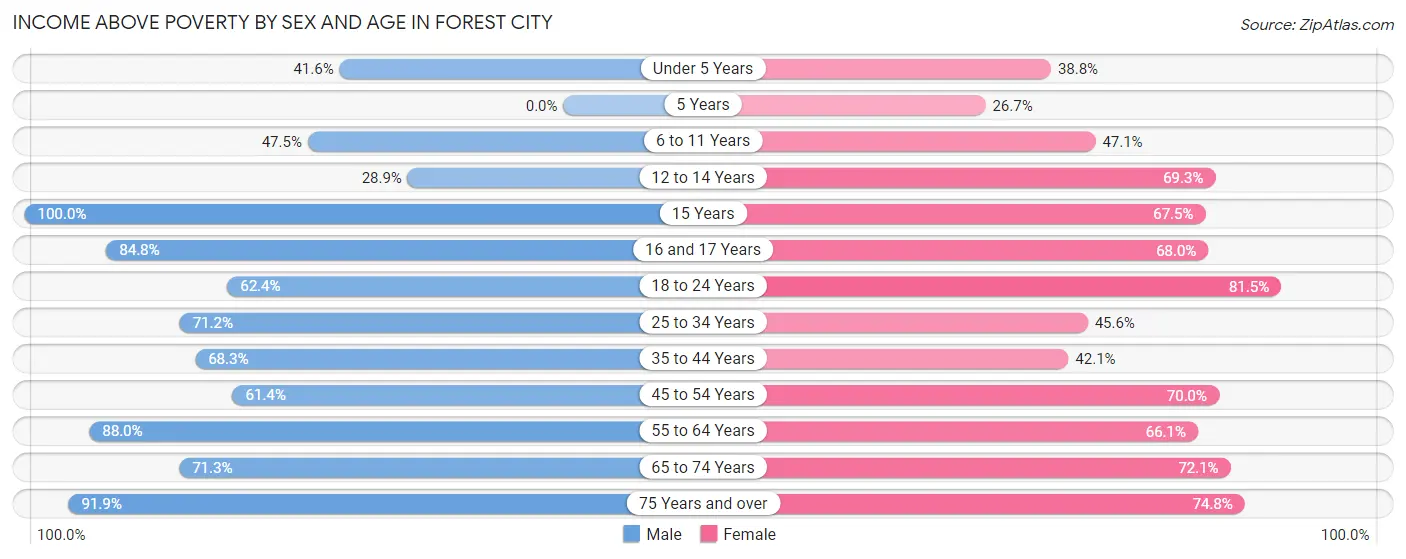
| Age Bracket | Male | Female |
| Under 5 Years | 145 (41.5%) | 118 (38.8%) |
| 5 Years | 0 (0.0%) | 8 (26.7%) |
| 6 to 11 Years | 195 (47.4%) | 226 (47.1%) |
| 12 to 14 Years | 26 (28.9%) | 70 (69.3%) |
| 15 Years | 87 (100.0%) | 56 (67.5%) |
| 16 and 17 Years | 162 (84.8%) | 34 (68.0%) |
| 18 to 24 Years | 247 (62.4%) | 150 (81.5%) |
| 25 to 34 Years | 272 (71.2%) | 335 (45.6%) |
| 35 to 44 Years | 138 (68.3%) | 188 (42.1%) |
| 45 to 54 Years | 210 (61.4%) | 317 (70.0%) |
| 55 to 64 Years | 234 (88.0%) | 333 (66.1%) |
| 65 to 74 Years | 216 (71.3%) | 264 (72.1%) |
| 75 Years and over | 169 (91.8%) | 252 (74.8%) |
| Total | 2,101 (65.3%) | 2,351 (57.7%) |
Income Below Poverty Among Married-Couple Families in Forest City
The poverty statistics for married-couple families in Forest City show that 15.0% or 93 of the total 620 families live below the poverty line. Families with 5 or more children have the highest poverty rate of 100.0%, comprising of 23 families. On the other hand, families with no children have the lowest poverty rate of 4.3%, which includes 15 families.
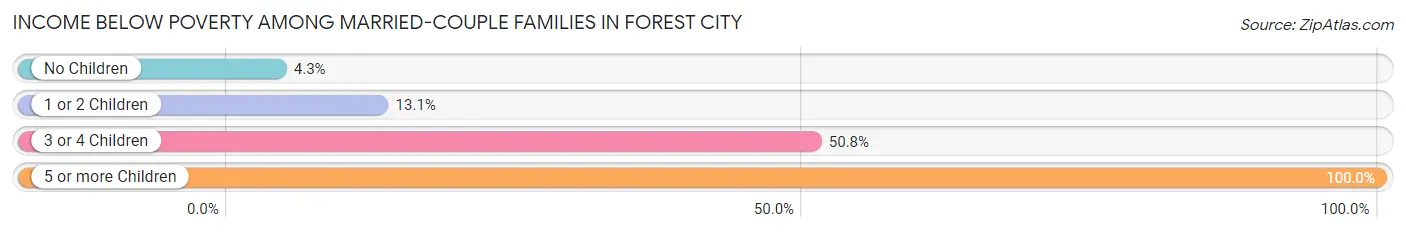
| Children | Above Poverty | Below Poverty |
| No Children | 338 (95.8%) | 15 (4.3%) |
| 1 or 2 Children | 159 (86.9%) | 24 (13.1%) |
| 3 or 4 Children | 30 (49.2%) | 31 (50.8%) |
| 5 or more Children | 0 (0.0%) | 23 (100.0%) |
| Total | 527 (85.0%) | 93 (15.0%) |
Income Below Poverty Among Single-Parent Households in Forest City
According to the poverty data in Forest City, 10.0% or 21 single-father households and 46.2% or 332 single-mother households are living below the poverty line. Among single-father households, those with no children have the highest poverty rate, with 21 households (38.9%) experiencing poverty. Likewise, among single-mother households, those with 5 or more children have the highest poverty rate, with 110 households (100.0%) falling below the poverty line.
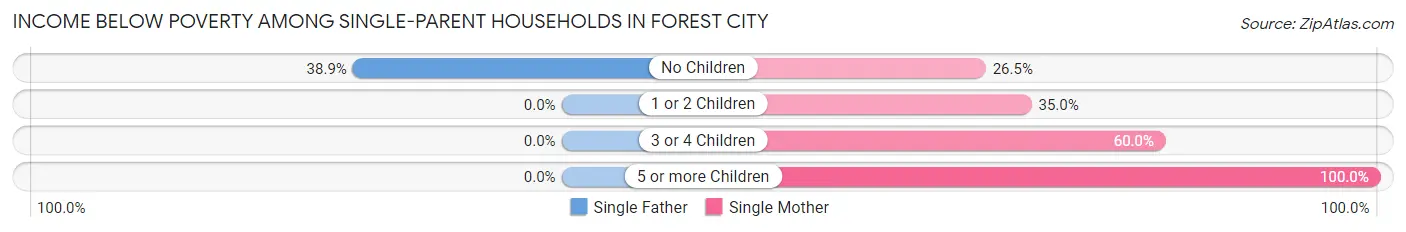
| Children | Single Father | Single Mother |
| No Children | 21 (38.9%) | 50 (26.5%) |
| 1 or 2 Children | 0 (0.0%) | 112 (35.0%) |
| 3 or 4 Children | 0 (0.0%) | 60 (60.0%) |
| 5 or more Children | 0 (0.0%) | 110 (100.0%) |
| Total | 21 (10.0%) | 332 (46.2%) |
Income Below Poverty Among Married-Couple vs Single-Parent Households in Forest City
The poverty data for Forest City shows that 93 of the married-couple family households (15.0%) and 353 of the single-parent households (38.0%) are living below the poverty level. Within the married-couple family households, those with 5 or more children have the highest poverty rate, with 23 households (100.0%) falling below the poverty line. Among the single-parent households, those with 5 or more children have the highest poverty rate, with 110 household (93.2%) living below poverty.
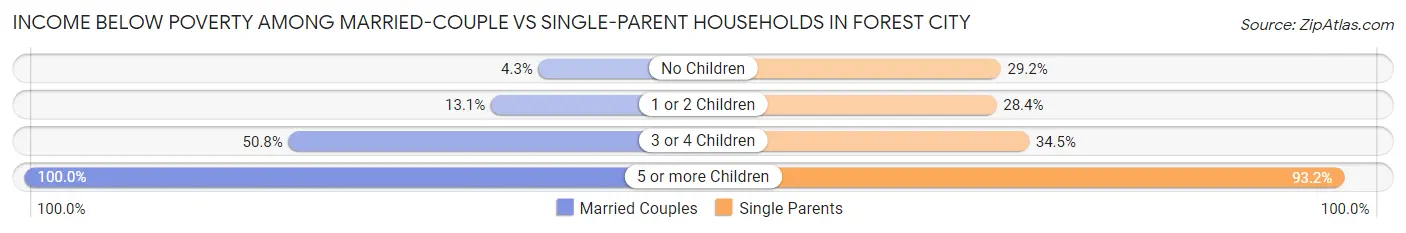
| Children | Married-Couple Families | Single-Parent Households |
| No Children | 15 (4.3%) | 71 (29.2%) |
| 1 or 2 Children | 24 (13.1%) | 112 (28.4%) |
| 3 or 4 Children | 31 (50.8%) | 60 (34.5%) |
| 5 or more Children | 23 (100.0%) | 110 (93.2%) |
| Total | 93 (15.0%) | 353 (38.0%) |
Race in Forest City
The most populous races in Forest City are White / Caucasian (4,431 | 60.2%), Black / African American (2,091 | 28.4%), and Hispanic or Latino (566 | 7.7%).
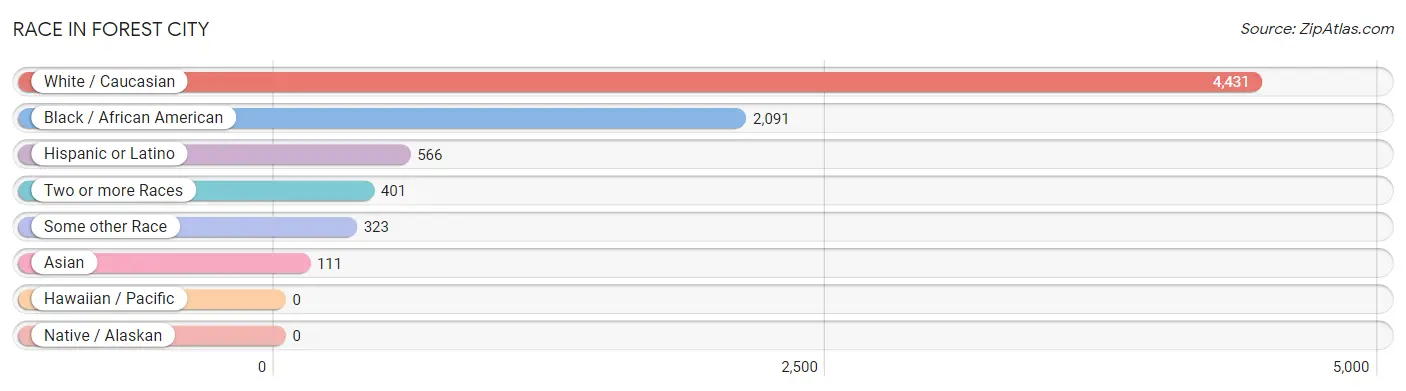
| Race | # Population | % Population |
| Asian | 111 | 1.5% |
| Black / African American | 2,091 | 28.4% |
| Hawaiian / Pacific | 0 | 0.0% |
| Hispanic or Latino | 566 | 7.7% |
| Native / Alaskan | 0 | 0.0% |
| White / Caucasian | 4,431 | 60.2% |
| Two or more Races | 401 | 5.4% |
| Some other Race | 323 | 4.4% |
| Total | 7,357 | 100.0% |
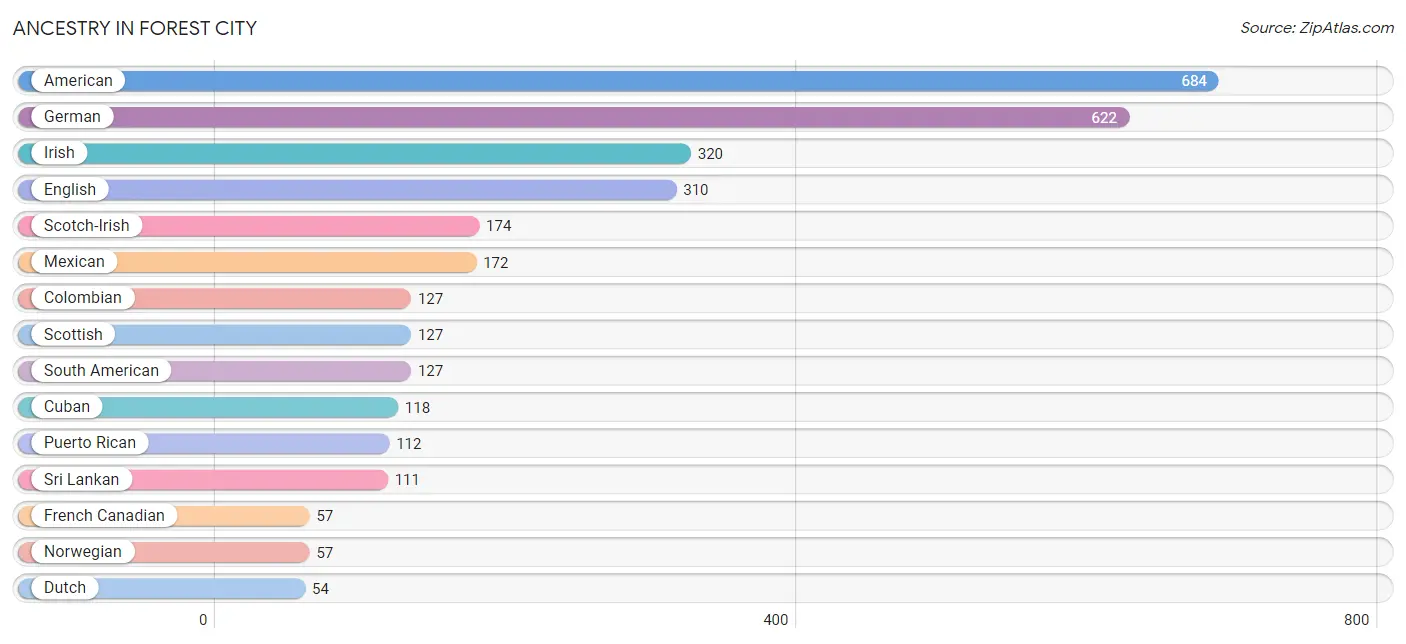
Ancestry in Forest City
The most populous ancestries reported in Forest City are American (684 | 9.3%), German (622 | 8.5%), Irish (320 | 4.3%), English (310 | 4.2%), and Scotch-Irish (174 | 2.4%), together accounting for 28.7% of all Forest City residents.
| Ancestry | # Population | % Population |
| African | 41 | 0.6% |
| American | 684 | 9.3% |
| Armenian | 9 | 0.1% |
| Bhutanese | 18 | 0.2% |
| Blackfeet | 4 | 0.1% |
| British | 40 | 0.5% |
| Cherokee | 35 | 0.5% |
| Colombian | 127 | 1.7% |
| Cuban | 118 | 1.6% |
| Czech | 31 | 0.4% |
| Dutch | 54 | 0.7% |
| Eastern European | 10 | 0.1% |
| English | 310 | 4.2% |
| Estonian | 7 | 0.1% |
| European | 44 | 0.6% |
| French | 22 | 0.3% |
| French Canadian | 57 | 0.8% |
| German | 622 | 8.5% |
| Greek | 9 | 0.1% |
| Irish | 320 | 4.3% |
| Italian | 47 | 0.6% |
| Mexican | 172 | 2.3% |
| Norwegian | 57 | 0.8% |
| Pakistani | 8 | 0.1% |
| Polish | 9 | 0.1% |
| Puerto Rican | 112 | 1.5% |
| Russian | 42 | 0.6% |
| Scandinavian | 35 | 0.5% |
| Scotch-Irish | 174 | 2.4% |
| Scottish | 127 | 1.7% |
| South American | 127 | 1.7% |
| Spaniard | 37 | 0.5% |
| Sri Lankan | 111 | 1.5% |
| Subsaharan African | 41 | 0.6% |
| Trinidadian and Tobagonian | 10 | 0.1% |
| Welsh | 12 | 0.2% | View All 36 Rows |
Immigrants in Forest City
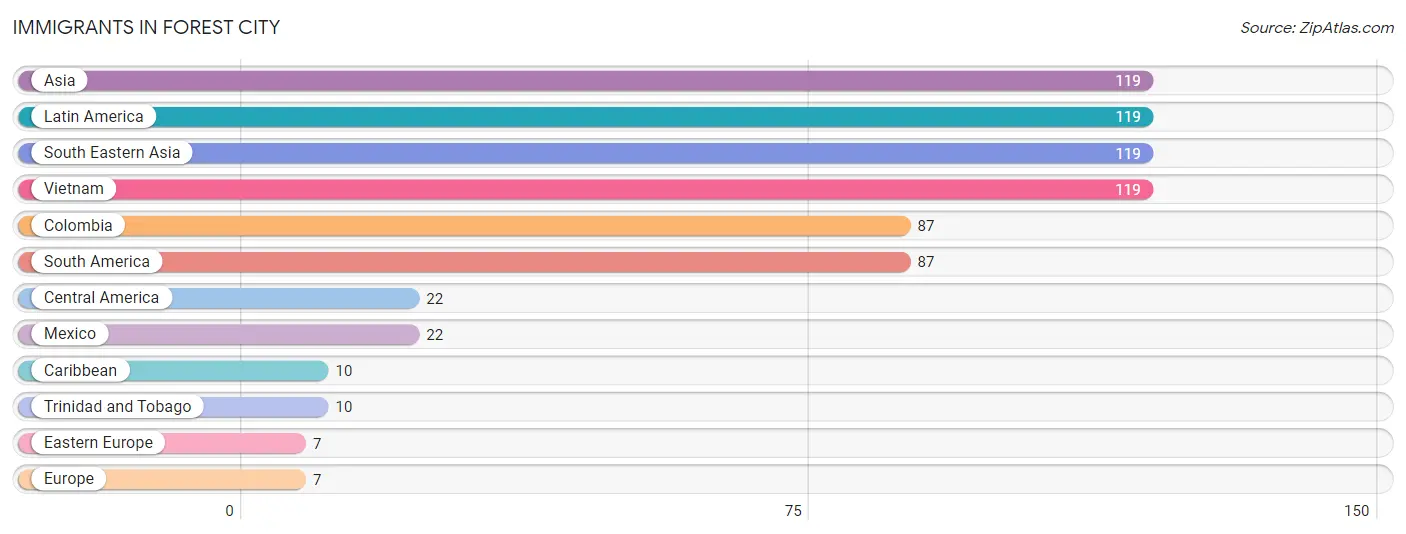
The most numerous immigrant groups reported in Forest City came from Asia (119 | 1.6%), Latin America (119 | 1.6%), South Eastern Asia (119 | 1.6%), Vietnam (119 | 1.6%), and Colombia (87 | 1.2%), together accounting for 7.7% of all Forest City residents.
| Immigration Origin | # Population | % Population |
| Asia | 119 | 1.6% |
| Caribbean | 10 | 0.1% |
| Central America | 22 | 0.3% |
| Colombia | 87 | 1.2% |
| Eastern Europe | 7 | 0.1% |
| Europe | 7 | 0.1% |
| Latin America | 119 | 1.6% |
| Mexico | 22 | 0.3% |
| South America | 87 | 1.2% |
| South Eastern Asia | 119 | 1.6% |
| Trinidad and Tobago | 10 | 0.1% |
| Vietnam | 119 | 1.6% | View All 12 Rows |
Sex and Age in Forest City
Sex and Age in Forest City
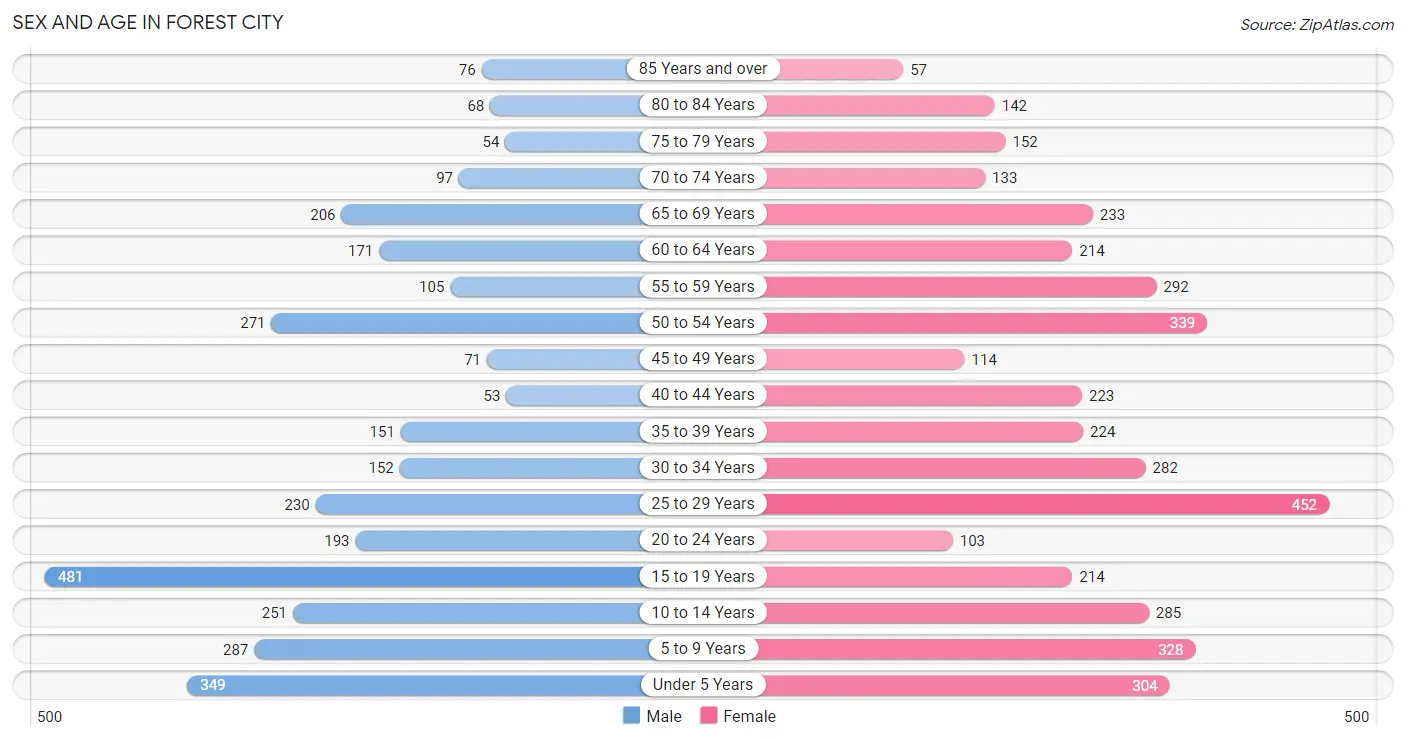
The most populous age groups in Forest City are 15 to 19 Years (481 | 14.7%) for men and 25 to 29 Years (452 | 11.1%) for women.
| Age Bracket | Male | Female |
| Under 5 Years | 349 (10.7%) | 304 (7.4%) |
| 5 to 9 Years | 287 (8.8%) | 328 (8.0%) |
| 10 to 14 Years | 251 (7.7%) | 285 (7.0%) |
| 15 to 19 Years | 481 (14.7%) | 214 (5.2%) |
| 20 to 24 Years | 193 (5.9%) | 103 (2.5%) |
| 25 to 29 Years | 230 (7.0%) | 452 (11.1%) |
| 30 to 34 Years | 152 (4.6%) | 282 (6.9%) |
| 35 to 39 Years | 151 (4.6%) | 224 (5.5%) |
| 40 to 44 Years | 53 (1.6%) | 223 (5.4%) |
| 45 to 49 Years | 71 (2.2%) | 114 (2.8%) |
| 50 to 54 Years | 271 (8.3%) | 339 (8.3%) |
| 55 to 59 Years | 105 (3.2%) | 292 (7.1%) |
| 60 to 64 Years | 171 (5.2%) | 214 (5.2%) |
| 65 to 69 Years | 206 (6.3%) | 233 (5.7%) |
| 70 to 74 Years | 97 (3.0%) | 133 (3.3%) |
| 75 to 79 Years | 54 (1.7%) | 152 (3.7%) |
| 80 to 84 Years | 68 (2.1%) | 142 (3.5%) |
| 85 Years and over | 76 (2.3%) | 57 (1.4%) |
| Total | 3,266 (100.0%) | 4,091 (100.0%) |
Families and Households in Forest City
Median Family Size in Forest City
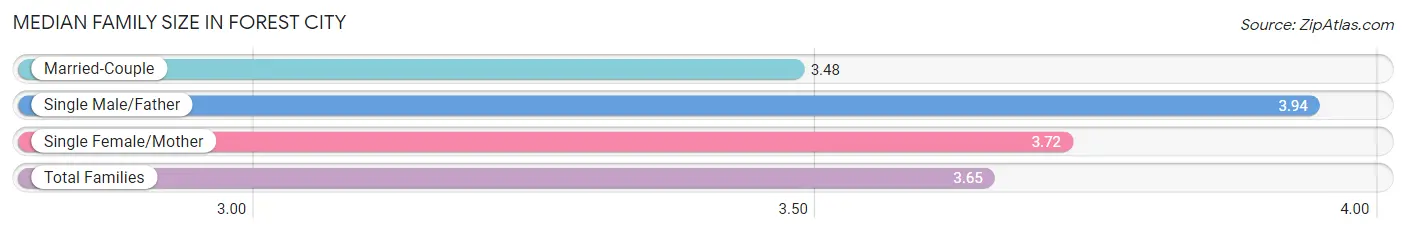
The median family size in Forest City is 3.65 persons per family, with single male/father families (210 | 13.6%) accounting for the largest median family size of 3.94 persons per family. On the other hand, married-couple families (620 | 40.0%) represent the smallest median family size with 3.48 persons per family.
| Family Type | # Families | Family Size |
| Married-Couple | 620 (40.0%) | 3.48 |
| Single Male/Father | 210 (13.6%) | 3.94 |
| Single Female/Mother | 719 (46.4%) | 3.72 |
| Total Families | 1,549 (100.0%) | 3.65 |
Median Household Size in Forest City
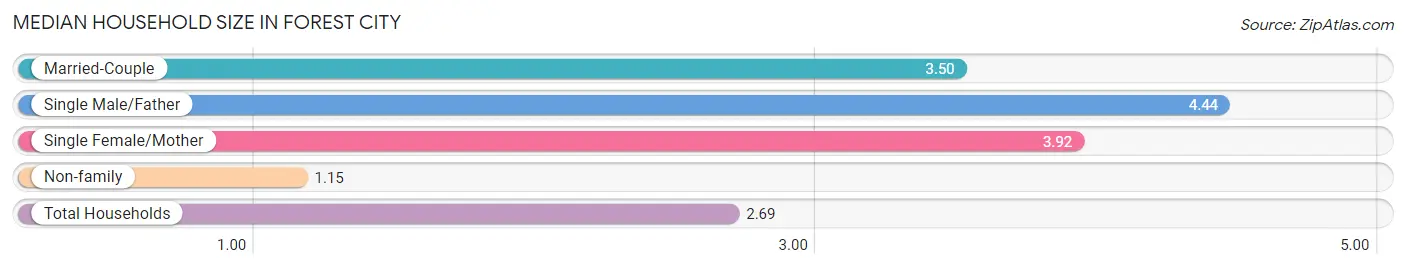
The median household size in Forest City is 2.69 persons per household, with single male/father households (210 | 7.8%) accounting for the largest median household size of 4.44 persons per household. non-family households (1,142 | 42.4%) represent the smallest median household size with 1.15 persons per household.
| Household Type | # Households | Household Size |
| Married-Couple | 620 (23.0%) | 3.50 |
| Single Male/Father | 210 (7.8%) | 4.44 |
| Single Female/Mother | 719 (26.7%) | 3.92 |
| Non-family | 1,142 (42.4%) | 1.15 |
| Total Households | 2,691 (100.0%) | 2.69 |
Household Size by Marriage Status in Forest City
Out of a total of 2,691 households in Forest City, 1,549 (57.6%) are family households, while 1,142 (42.4%) are nonfamily households. The most numerous type of family households are 2-person households, comprising 584, and the most common type of nonfamily households are 1-person households, comprising 986.
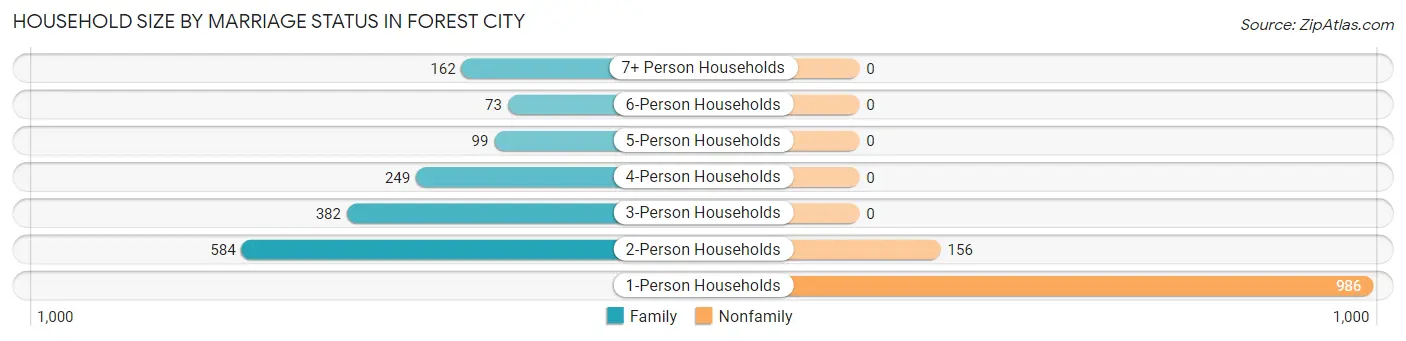
| Household Size | Family Households | Nonfamily Households |
| 1-Person Households | - | 986 (36.6%) |
| 2-Person Households | 584 (21.7%) | 156 (5.8%) |
| 3-Person Households | 382 (14.2%) | 0 (0.0%) |
| 4-Person Households | 249 (9.2%) | 0 (0.0%) |
| 5-Person Households | 99 (3.7%) | 0 (0.0%) |
| 6-Person Households | 73 (2.7%) | 0 (0.0%) |
| 7+ Person Households | 162 (6.0%) | 0 (0.0%) |
| Total | 1,549 (57.6%) | 1,142 (42.4%) |
Female Fertility in Forest City
Fertility by Age in Forest City
Average fertility rate in Forest City is 177.0 births per 1,000 women. Women in the age bracket of 20 to 34 years have the highest fertility rate with 362.0 births per 1,000 women. Women in the age bracket of 20 to 34 years acount for 94.7% of all women with births.
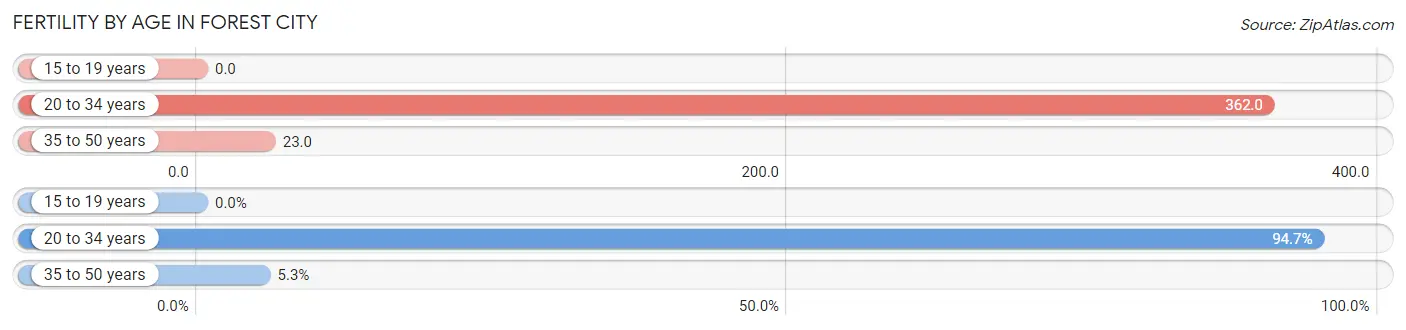
| Age Bracket | Women with Births | Births / 1,000 Women |
| 15 to 19 years | 0 (0.0%) | 0.0 |
| 20 to 34 years | 303 (94.7%) | 362.0 |
| 35 to 50 years | 17 (5.3%) | 23.0 |
| Total | 320 (100.0%) | 177.0 |
Fertility by Age by Marriage Status in Forest City
9.1% of women with births (320) in Forest City are married. The highest percentage of unmarried women with births falls into 20 to 34 years age bracket with 93.7% of them unmarried at the time of birth, while the lowest percentage of unmarried women with births belong to 35 to 50 years age bracket with 41.2% of them unmarried.
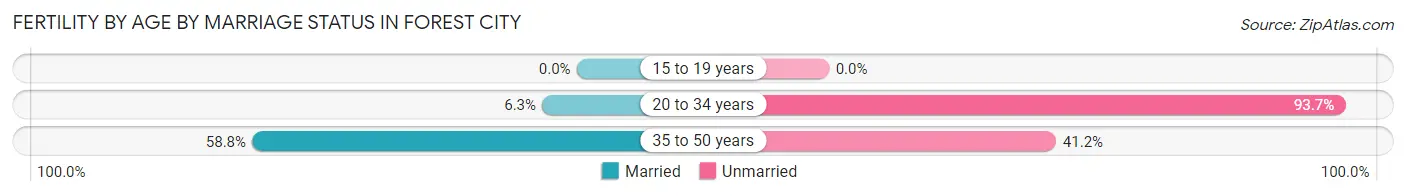
| Age Bracket | Married | Unmarried |
| 15 to 19 years | 0 (0.0%) | 0 (0.0%) |
| 20 to 34 years | 19 (6.3%) | 284 (93.7%) |
| 35 to 50 years | 10 (58.8%) | 7 (41.2%) |
| Total | 29 (9.1%) | 291 (90.9%) |
Fertility by Education in Forest City
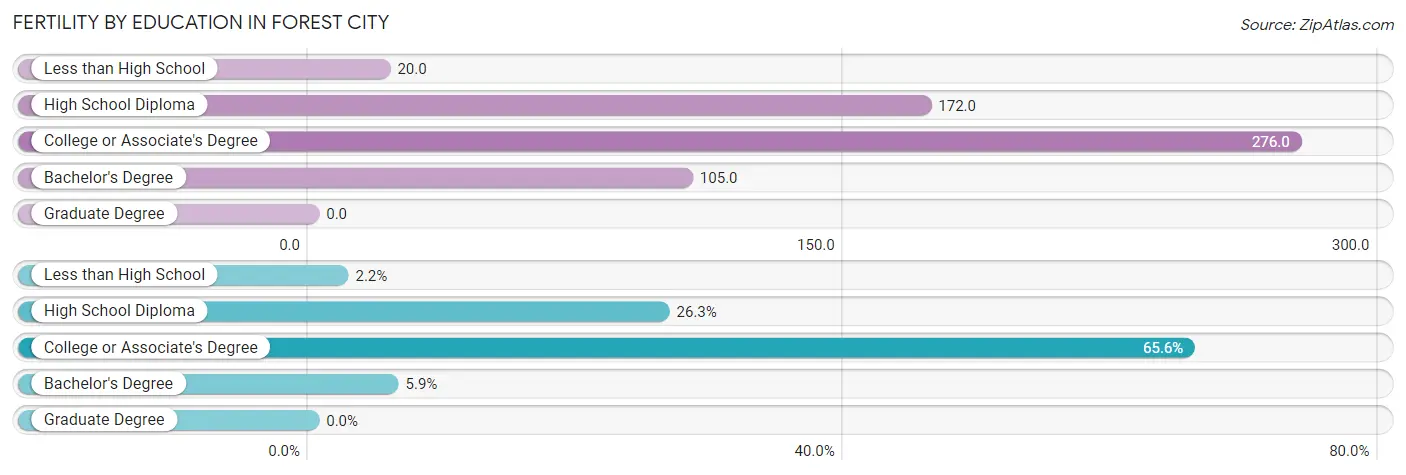
| Educational Attainment | Women with Births | Births / 1,000 Women |
| Less than High School | 7 (2.2%) | 20.0 |
| High School Diploma | 84 (26.3%) | 172.0 |
| College or Associate's Degree | 210 (65.6%) | 276.0 |
| Bachelor's Degree | 19 (5.9%) | 105.0 |
| Graduate Degree | 0 (0.0%) | 0.0 |
| Total | 320 (100.0%) | 177.0 |
Fertility by Education by Marriage Status in Forest City
90.9% of women with births in Forest City are unmarried. Women with the educational attainment of bachelor's degree are most likely to be married with 100.0% of them married at childbirth, while women with the educational attainment of less than high school are least likely to be married with 100.0% of them unmarried at childbirth.
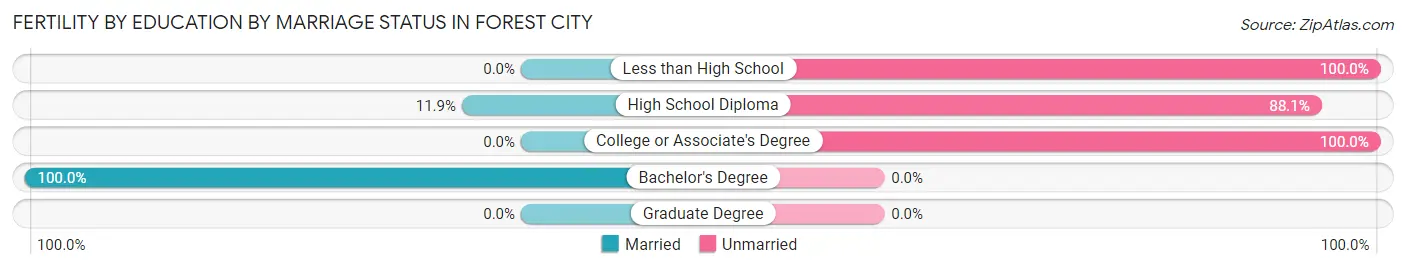
| Educational Attainment | Married | Unmarried |
| Less than High School | 0 (0.0%) | 7 (100.0%) |
| High School Diploma | 10 (11.9%) | 74 (88.1%) |
| College or Associate's Degree | 0 (0.0%) | 210 (100.0%) |
| Bachelor's Degree | 19 (100.0%) | 0 (0.0%) |
| Graduate Degree | 0 (0.0%) | 0 (0.0%) |
| Total | 29 (9.1%) | 291 (90.9%) |
Employment Characteristics in Forest City
Employment by Class of Employer in Forest City
Among the 2,544 employed individuals in Forest City, private company employees (1,778 | 69.9%), self-employed (not incorporated) (233 | 9.2%), and local government employees (156 | 6.1%) make up the most common classes of employment.
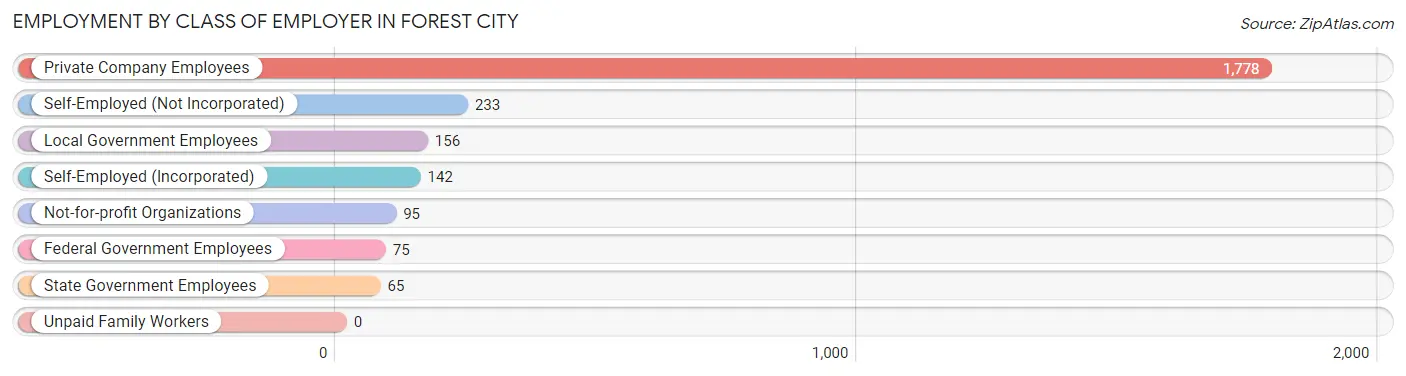
| Employer Class | # Employees | % Employees |
| Private Company Employees | 1,778 | 69.9% |
| Self-Employed (Incorporated) | 142 | 5.6% |
| Self-Employed (Not Incorporated) | 233 | 9.2% |
| Not-for-profit Organizations | 95 | 3.7% |
| Local Government Employees | 156 | 6.1% |
| State Government Employees | 65 | 2.6% |
| Federal Government Employees | 75 | 2.9% |
| Unpaid Family Workers | 0 | 0.0% |
| Total | 2,544 | 100.0% |
Employment Status by Age in Forest City
According to the labor force statistics for Forest City, out of the total population over 16 years of age (5,383), 53.9% or 2,901 individuals are in the labor force, with 10.1% or 293 of them unemployed. The age group with the highest labor force participation rate is 30 to 34 years, with 82.5% or 358 individuals in the labor force. Within the labor force, the 16 to 19 years age range has the highest percentage of unemployed individuals, with 39.9% or 131 of them being unemployed.
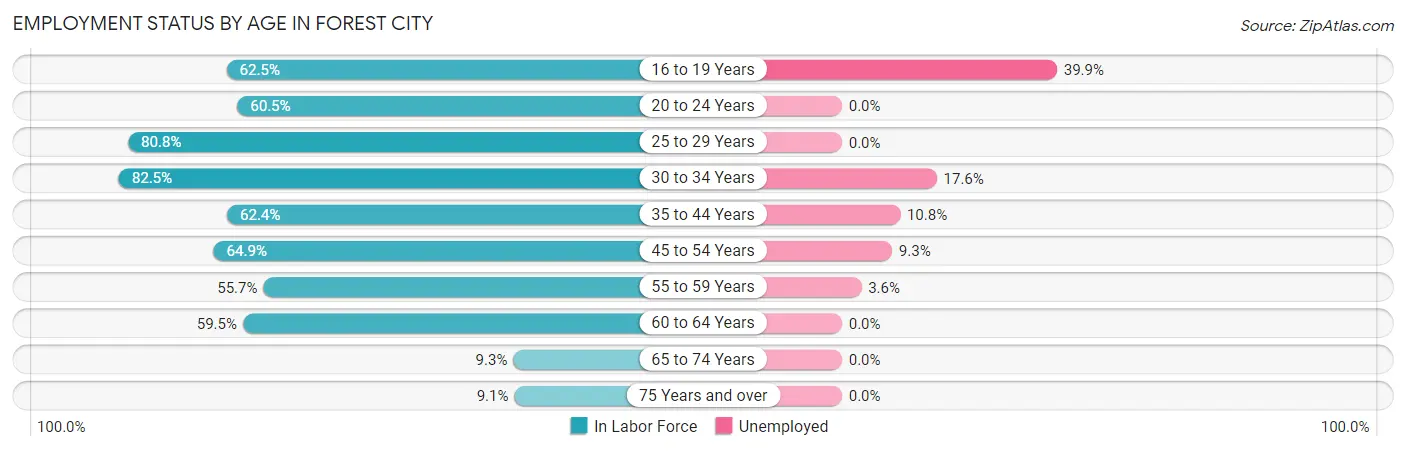
| Age Bracket | In Labor Force | Unemployed |
| 16 to 19 Years | 328 (62.5%) | 131 (39.9%) |
| 20 to 24 Years | 179 (60.5%) | 0 (0.0%) |
| 25 to 29 Years | 551 (80.8%) | 0 (0.0%) |
| 30 to 34 Years | 358 (82.5%) | 63 (17.6%) |
| 35 to 44 Years | 406 (62.4%) | 44 (10.8%) |
| 45 to 54 Years | 516 (64.9%) | 48 (9.3%) |
| 55 to 59 Years | 221 (55.7%) | 8 (3.6%) |
| 60 to 64 Years | 229 (59.5%) | 0 (0.0%) |
| 65 to 74 Years | 62 (9.3%) | 0 (0.0%) |
| 75 Years and over | 50 (9.1%) | 0 (0.0%) |
| Total | 2,901 (53.9%) | 293 (10.1%) |
Employment Status by Educational Attainment in Forest City
According to labor force statistics for Forest City, 68.2% of individuals (2,281) out of the total population between 25 and 64 years of age (3,344) are in the labor force, with 7.1% or 162 of them being unemployed. The group with the highest labor force participation rate are those with the educational attainment of less than high school, with 79.7% or 185 individuals in the labor force. Within the labor force, individuals with high school diploma education have the highest percentage of unemployment, with 21.3% or 141 of them being unemployed.
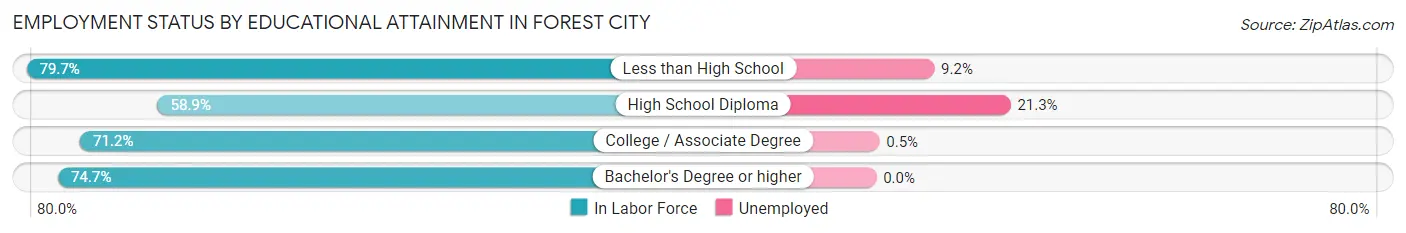
| Educational Attainment | In Labor Force | Unemployed |
| Less than High School | 185 (79.7%) | 21 (9.2%) |
| High School Diploma | 663 (58.9%) | 240 (21.3%) |
| College / Associate Degree | 1,052 (71.2%) | 7 (0.5%) |
| Bachelor's Degree or higher | 380 (74.7%) | 0 (0.0%) |
| Total | 2,281 (68.2%) | 237 (7.1%) |
Employment Occupations by Sex in Forest City
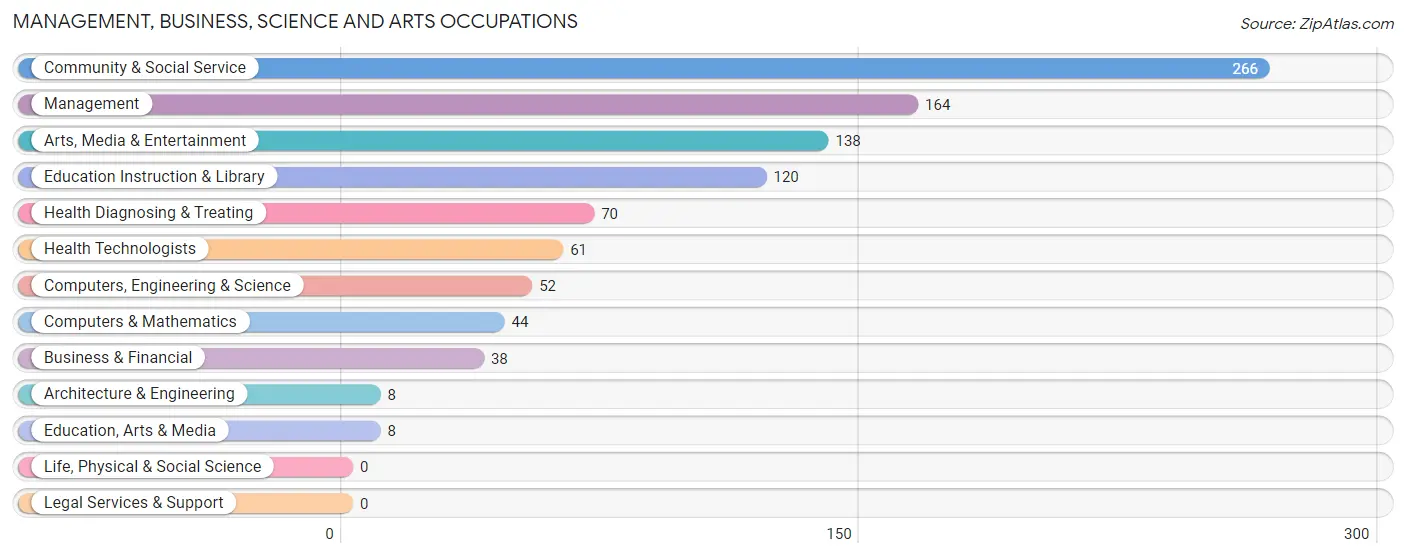
Management, Business, Science and Arts Occupations
The most common Management, Business, Science and Arts occupations in Forest City are Community & Social Service (266 | 10.2%), Management (164 | 6.3%), Arts, Media & Entertainment (138 | 5.3%), Education Instruction & Library (120 | 4.6%), and Health Diagnosing & Treating (70 | 2.7%).
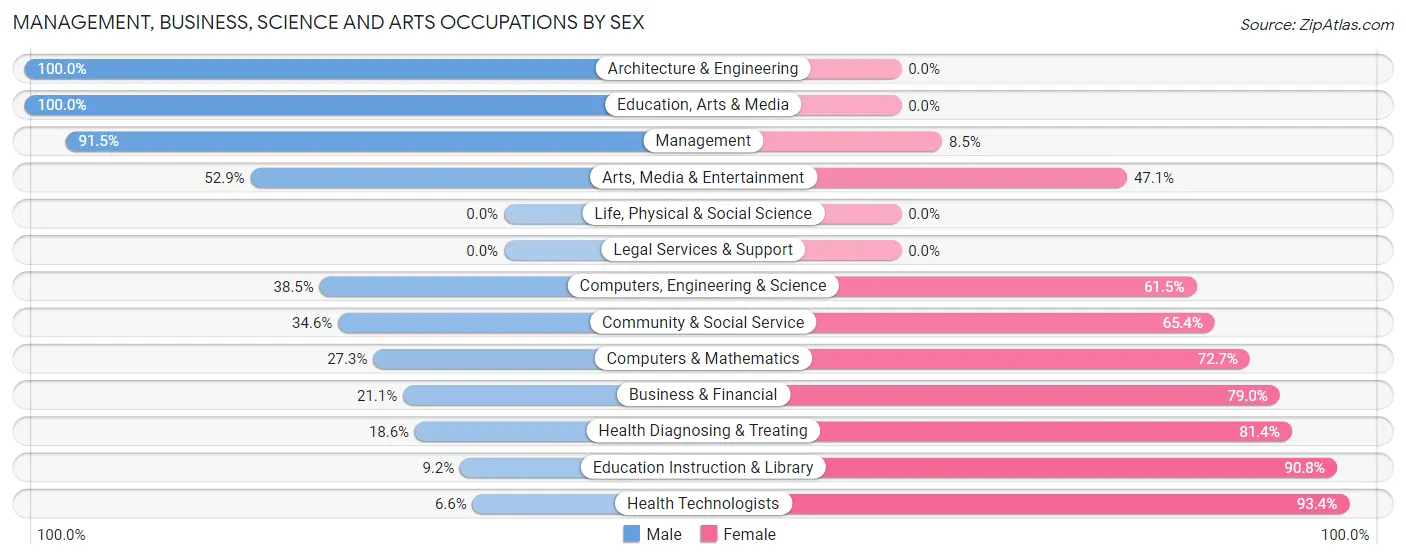
Management, Business, Science and Arts Occupations by Sex
Within the Management, Business, Science and Arts occupations in Forest City, the most male-oriented occupations are Architecture & Engineering (100.0%), Education, Arts & Media (100.0%), and Management (91.5%), while the most female-oriented occupations are Health Technologists (93.4%), Education Instruction & Library (90.8%), and Health Diagnosing & Treating (81.4%).
| Occupation | Male | Female |
| Management | 150 (91.5%) | 14 (8.5%) |
| Business & Financial | 8 (21.0%) | 30 (78.9%) |
| Computers, Engineering & Science | 20 (38.5%) | 32 (61.5%) |
| Computers & Mathematics | 12 (27.3%) | 32 (72.7%) |
| Architecture & Engineering | 8 (100.0%) | 0 (0.0%) |
| Life, Physical & Social Science | 0 (0.0%) | 0 (0.0%) |
| Community & Social Service | 92 (34.6%) | 174 (65.4%) |
| Education, Arts & Media | 8 (100.0%) | 0 (0.0%) |
| Legal Services & Support | 0 (0.0%) | 0 (0.0%) |
| Education Instruction & Library | 11 (9.2%) | 109 (90.8%) |
| Arts, Media & Entertainment | 73 (52.9%) | 65 (47.1%) |
| Health Diagnosing & Treating | 13 (18.6%) | 57 (81.4%) |
| Health Technologists | 4 (6.6%) | 57 (93.4%) |
| Total (Category) | 283 (48.0%) | 307 (52.0%) |
| Total (Overall) | 1,190 (45.7%) | 1,416 (54.3%) |
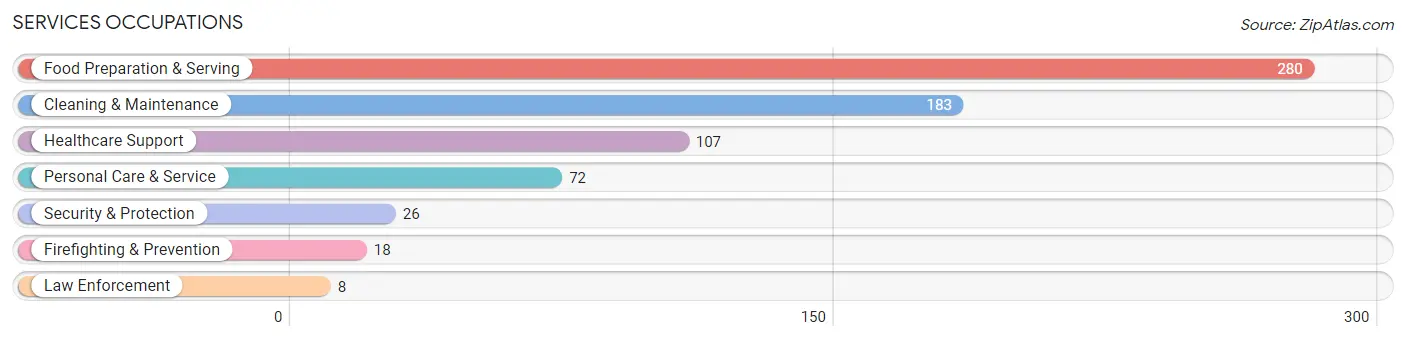
Services Occupations
The most common Services occupations in Forest City are Food Preparation & Serving (280 | 10.7%), Cleaning & Maintenance (183 | 7.0%), Healthcare Support (107 | 4.1%), Personal Care & Service (72 | 2.8%), and Security & Protection (26 | 1.0%).
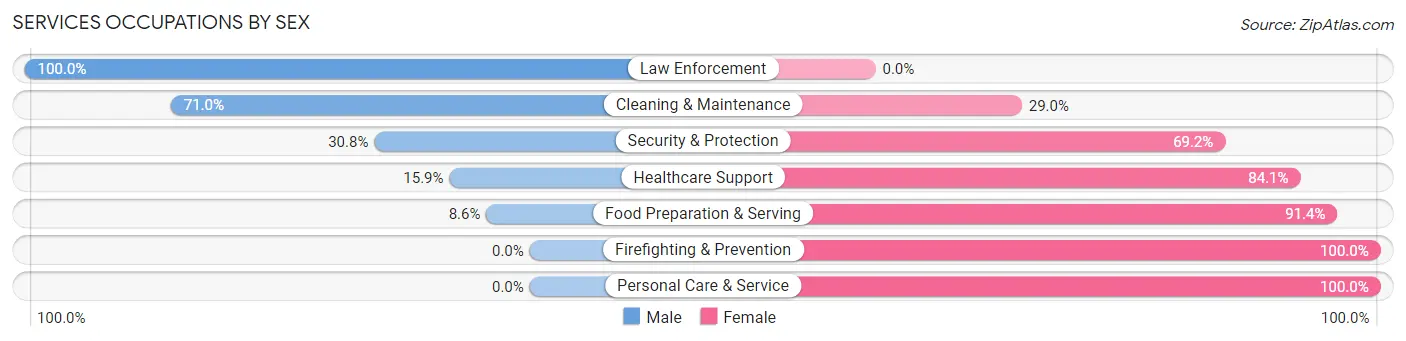
Services Occupations by Sex
Within the Services occupations in Forest City, the most male-oriented occupations are Law Enforcement (100.0%), Cleaning & Maintenance (71.0%), and Security & Protection (30.8%), while the most female-oriented occupations are Firefighting & Prevention (100.0%), Personal Care & Service (100.0%), and Food Preparation & Serving (91.4%).
| Occupation | Male | Female |
| Healthcare Support | 17 (15.9%) | 90 (84.1%) |
| Security & Protection | 8 (30.8%) | 18 (69.2%) |
| Firefighting & Prevention | 0 (0.0%) | 18 (100.0%) |
| Law Enforcement | 8 (100.0%) | 0 (0.0%) |
| Food Preparation & Serving | 24 (8.6%) | 256 (91.4%) |
| Cleaning & Maintenance | 130 (71.0%) | 53 (29.0%) |
| Personal Care & Service | 0 (0.0%) | 72 (100.0%) |
| Total (Category) | 179 (26.8%) | 489 (73.2%) |
| Total (Overall) | 1,190 (45.7%) | 1,416 (54.3%) |
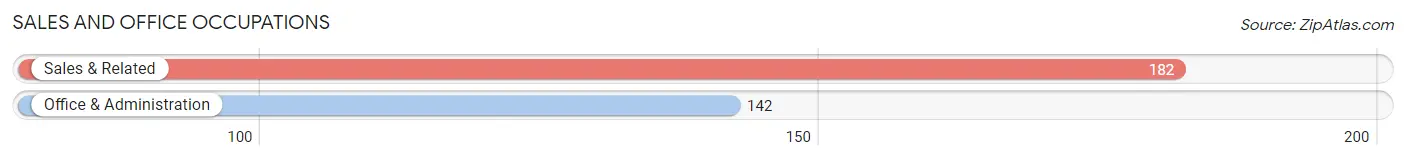
Sales and Office Occupations
The most common Sales and Office occupations in Forest City are Sales & Related (182 | 7.0%), and Office & Administration (142 | 5.4%).
Sales and Office Occupations by Sex
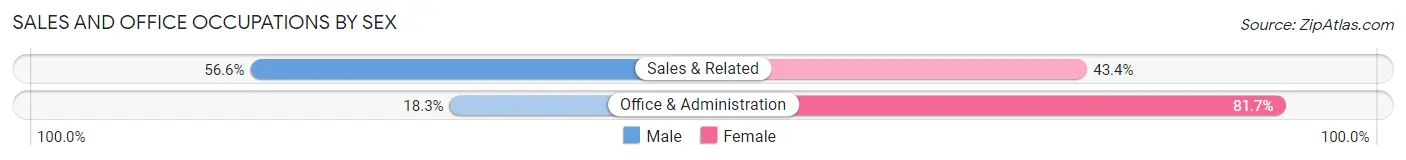
| Occupation | Male | Female |
| Sales & Related | 103 (56.6%) | 79 (43.4%) |
| Office & Administration | 26 (18.3%) | 116 (81.7%) |
| Total (Category) | 129 (39.8%) | 195 (60.2%) |
| Total (Overall) | 1,190 (45.7%) | 1,416 (54.3%) |
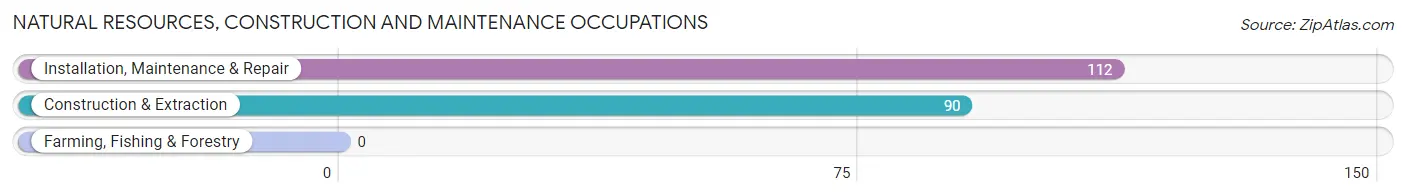
Natural Resources, Construction and Maintenance Occupations
The most common Natural Resources, Construction and Maintenance occupations in Forest City are Installation, Maintenance & Repair (112 | 4.3%), and Construction & Extraction (90 | 3.5%).
Natural Resources, Construction and Maintenance Occupations by Sex
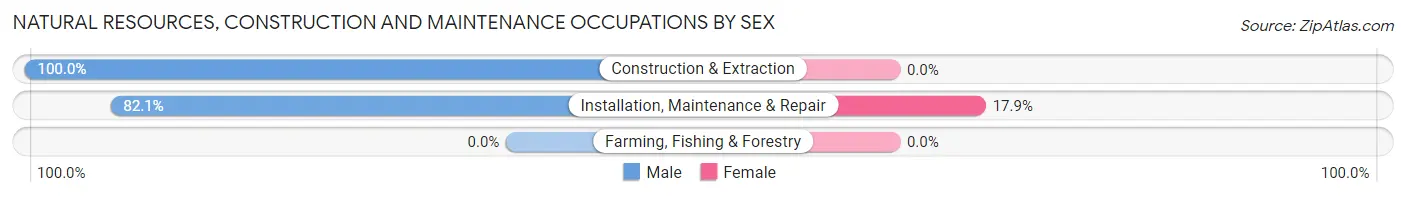
| Occupation | Male | Female |
| Farming, Fishing & Forestry | 0 (0.0%) | 0 (0.0%) |
| Construction & Extraction | 90 (100.0%) | 0 (0.0%) |
| Installation, Maintenance & Repair | 92 (82.1%) | 20 (17.9%) |
| Total (Category) | 182 (90.1%) | 20 (9.9%) |
| Total (Overall) | 1,190 (45.7%) | 1,416 (54.3%) |
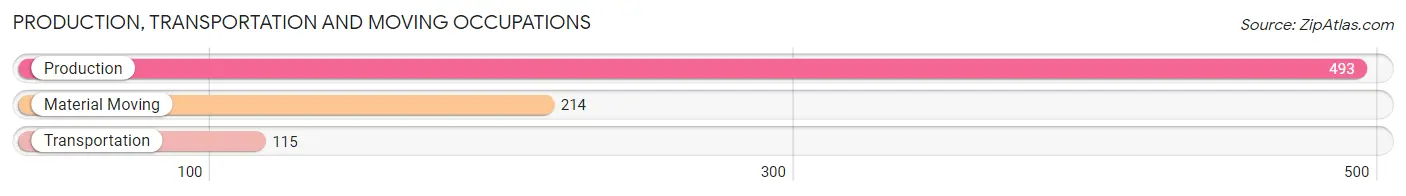
Production, Transportation and Moving Occupations
The most common Production, Transportation and Moving occupations in Forest City are Production (493 | 18.9%), Material Moving (214 | 8.2%), and Transportation (115 | 4.4%).
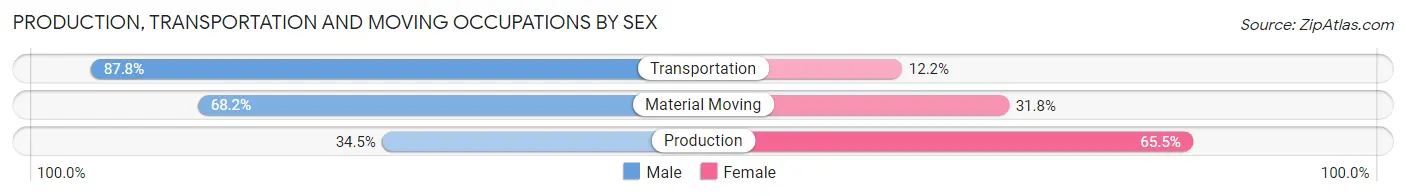
Production, Transportation and Moving Occupations by Sex
| Occupation | Male | Female |
| Production | 170 (34.5%) | 323 (65.5%) |
| Transportation | 101 (87.8%) | 14 (12.2%) |
| Material Moving | 146 (68.2%) | 68 (31.8%) |
| Total (Category) | 417 (50.7%) | 405 (49.3%) |
| Total (Overall) | 1,190 (45.7%) | 1,416 (54.3%) |
Employment Industries by Sex in Forest City
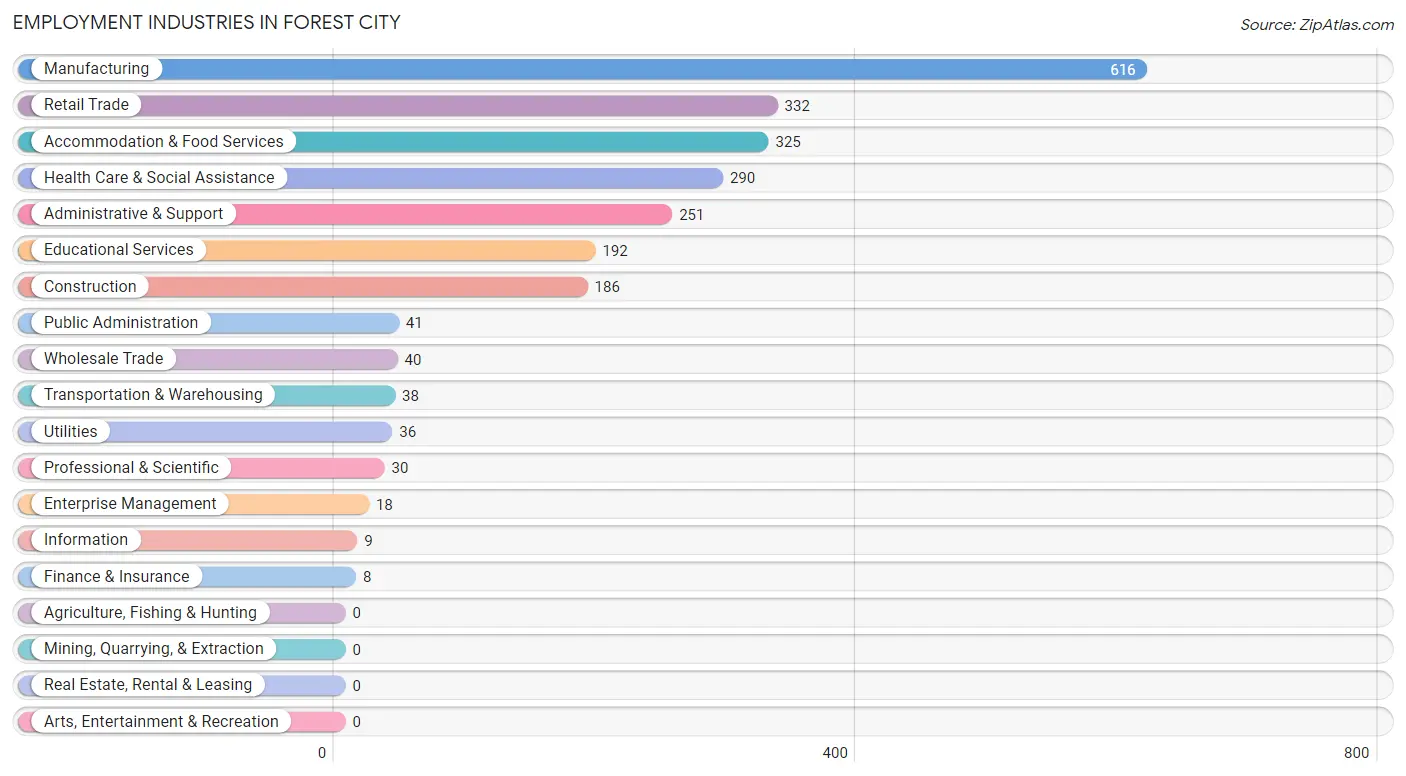
Employment Industries in Forest City
The major employment industries in Forest City include Manufacturing (616 | 23.6%), Retail Trade (332 | 12.7%), Accommodation & Food Services (325 | 12.5%), Health Care & Social Assistance (290 | 11.1%), and Administrative & Support (251 | 9.6%).
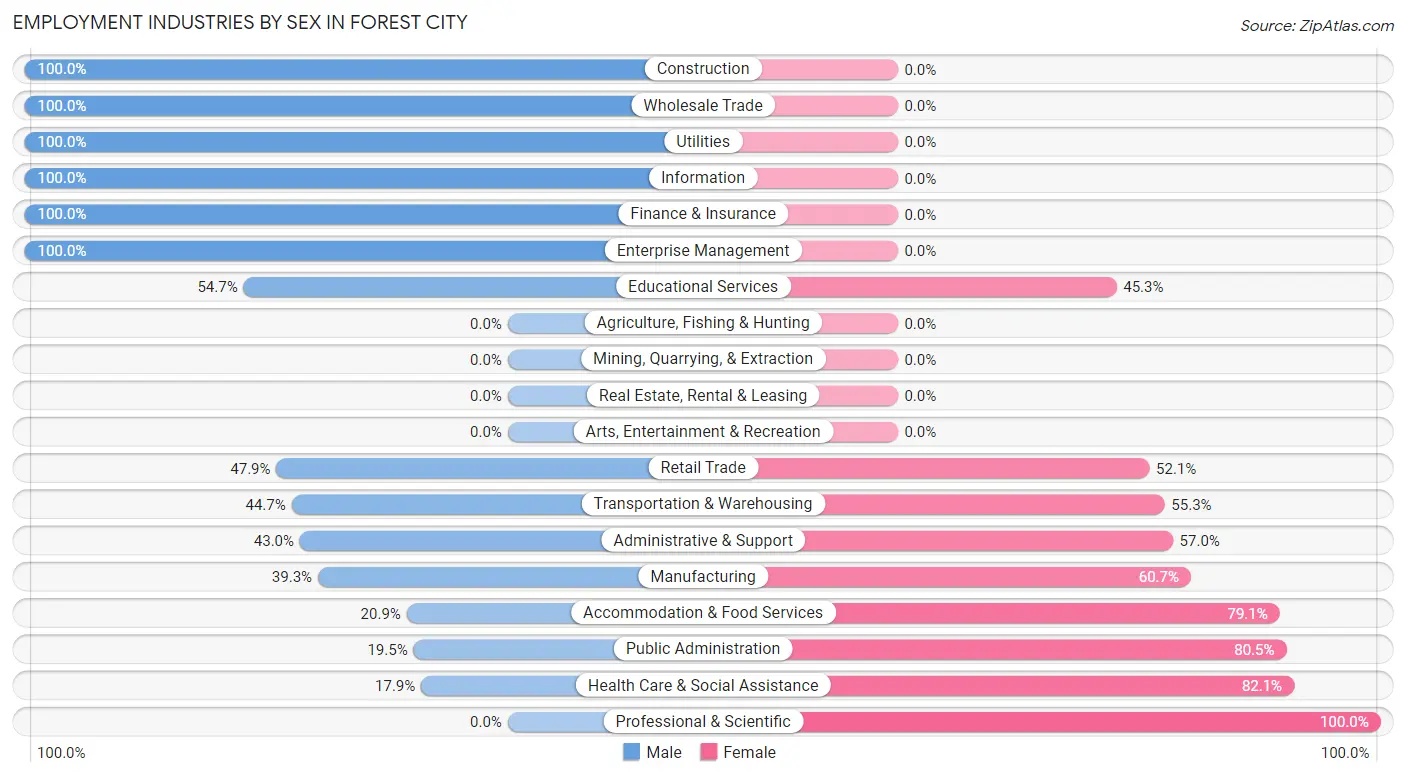
Employment Industries by Sex in Forest City
The Forest City industries that see more men than women are Construction (100.0%), Wholesale Trade (100.0%), and Utilities (100.0%), whereas the industries that tend to have a higher number of women are Professional & Scientific (100.0%), Health Care & Social Assistance (82.1%), and Public Administration (80.5%).
| Industry | Male | Female |
| Agriculture, Fishing & Hunting | 0 (0.0%) | 0 (0.0%) |
| Mining, Quarrying, & Extraction | 0 (0.0%) | 0 (0.0%) |
| Construction | 186 (100.0%) | 0 (0.0%) |
| Manufacturing | 242 (39.3%) | 374 (60.7%) |
| Wholesale Trade | 40 (100.0%) | 0 (0.0%) |
| Retail Trade | 159 (47.9%) | 173 (52.1%) |
| Transportation & Warehousing | 17 (44.7%) | 21 (55.3%) |
| Utilities | 36 (100.0%) | 0 (0.0%) |
| Information | 9 (100.0%) | 0 (0.0%) |
| Finance & Insurance | 8 (100.0%) | 0 (0.0%) |
| Real Estate, Rental & Leasing | 0 (0.0%) | 0 (0.0%) |
| Professional & Scientific | 0 (0.0%) | 30 (100.0%) |
| Enterprise Management | 18 (100.0%) | 0 (0.0%) |
| Administrative & Support | 108 (43.0%) | 143 (57.0%) |
| Educational Services | 105 (54.7%) | 87 (45.3%) |
| Health Care & Social Assistance | 52 (17.9%) | 238 (82.1%) |
| Arts, Entertainment & Recreation | 0 (0.0%) | 0 (0.0%) |
| Accommodation & Food Services | 68 (20.9%) | 257 (79.1%) |
| Public Administration | 8 (19.5%) | 33 (80.5%) |
| Total | 1,190 (45.7%) | 1,416 (54.3%) |
Education in Forest City
School Enrollment in Forest City
The most common levels of schooling among the 1,998 students in Forest City are elementary school (563 | 28.2%), high school (550 | 27.5%), and middle school (387 | 19.4%).
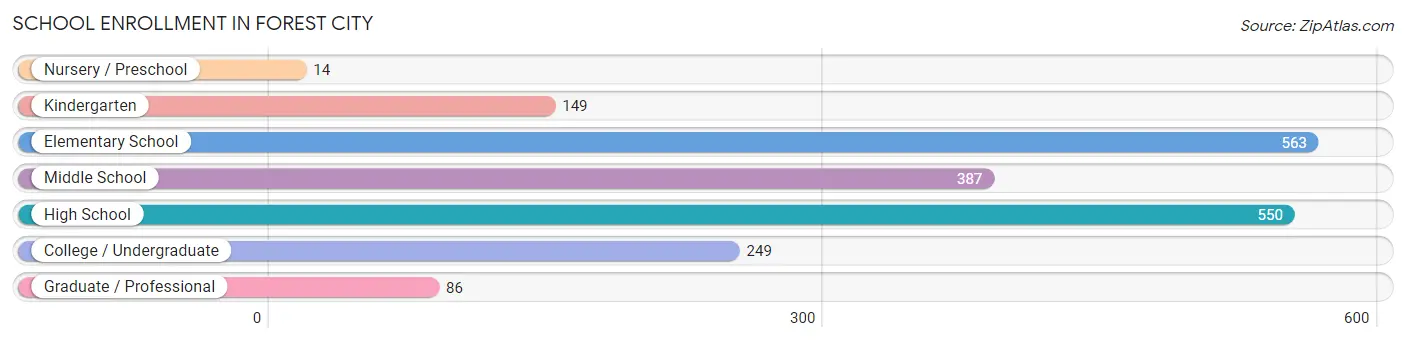
| School Level | # Students | % Students |
| Nursery / Preschool | 14 | 0.7% |
| Kindergarten | 149 | 7.5% |
| Elementary School | 563 | 28.2% |
| Middle School | 387 | 19.4% |
| High School | 550 | 27.5% |
| College / Undergraduate | 249 | 12.5% |
| Graduate / Professional | 86 | 4.3% |
| Total | 1,998 | 100.0% |
School Enrollment by Age by Funding Source in Forest City
Out of a total of 1,998 students who are enrolled in schools in Forest City, 162 (8.1%) attend a private institution, while the remaining 1,836 (91.9%) are enrolled in public schools. The age group of 20 to 24 year olds has the highest likelihood of being enrolled in private schools, with 42 (44.2% in the age bracket) enrolled. Conversely, the age group of 18 to 19 year olds has the lowest likelihood of being enrolled in a private school, with 207 (100.0% in the age bracket) attending a public institution.
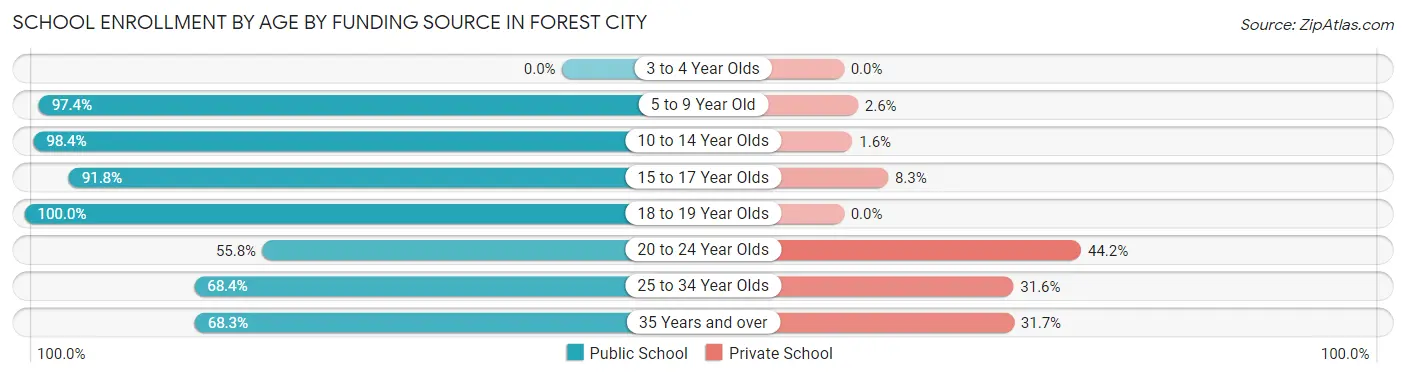
| Age Bracket | Public School | Private School |
| 3 to 4 Year Olds | 0 (0.0%) | 0 (0.0%) |
| 5 to 9 Year Old | 591 (97.4%) | 16 (2.6%) |
| 10 to 14 Year Olds | 485 (98.4%) | 8 (1.6%) |
| 15 to 17 Year Olds | 367 (91.7%) | 33 (8.3%) |
| 18 to 19 Year Olds | 207 (100.0%) | 0 (0.0%) |
| 20 to 24 Year Olds | 53 (55.8%) | 42 (44.2%) |
| 25 to 34 Year Olds | 106 (68.4%) | 49 (31.6%) |
| 35 Years and over | 28 (68.3%) | 13 (31.7%) |
| Total | 1,836 (91.9%) | 162 (8.1%) |
Educational Attainment by Field of Study in Forest City
Education (160 | 19.7%), arts & humanities (134 | 16.5%), business (130 | 16.0%), science & technology (129 | 15.9%), and bio, nature & agricultural (81 | 10.0%) are the most common fields of study among 812 individuals in Forest City who have obtained a bachelor's degree or higher.
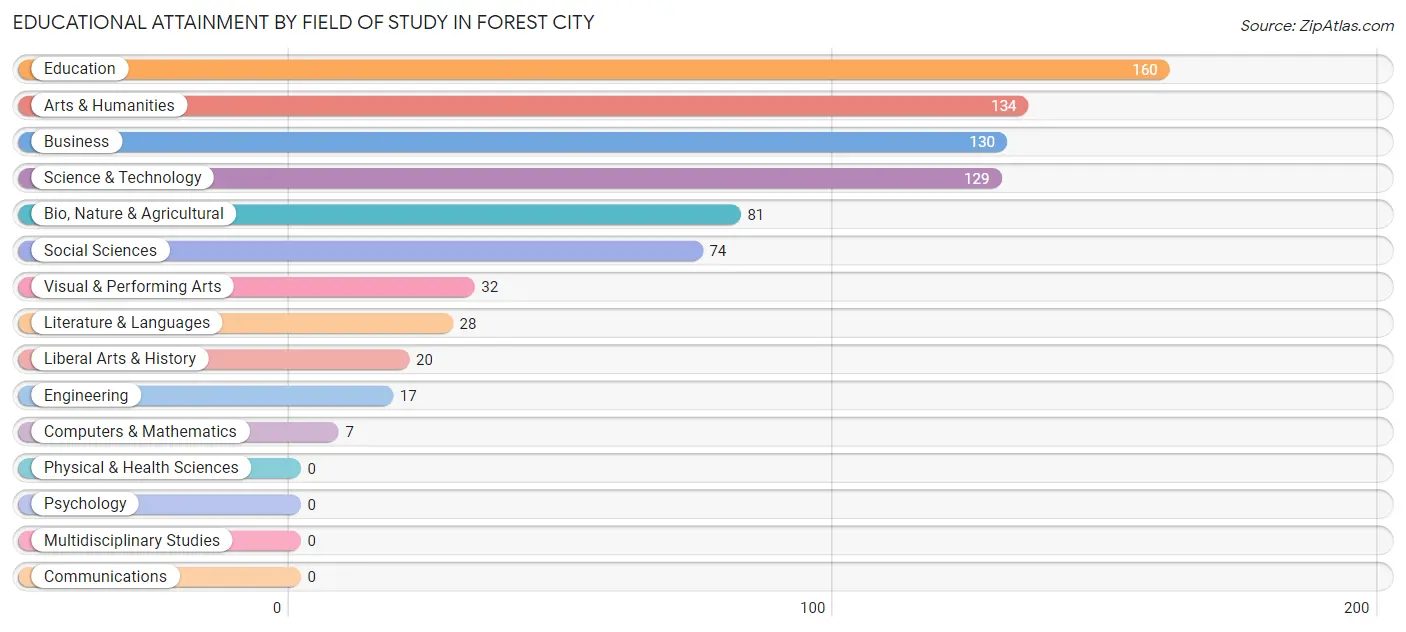
| Field of Study | # Graduates | % Graduates |
| Computers & Mathematics | 7 | 0.9% |
| Bio, Nature & Agricultural | 81 | 10.0% |
| Physical & Health Sciences | 0 | 0.0% |
| Psychology | 0 | 0.0% |
| Social Sciences | 74 | 9.1% |
| Engineering | 17 | 2.1% |
| Multidisciplinary Studies | 0 | 0.0% |
| Science & Technology | 129 | 15.9% |
| Business | 130 | 16.0% |
| Education | 160 | 19.7% |
| Literature & Languages | 28 | 3.5% |
| Liberal Arts & History | 20 | 2.5% |
| Visual & Performing Arts | 32 | 3.9% |
| Communications | 0 | 0.0% |
| Arts & Humanities | 134 | 16.5% |
| Total | 812 | 100.0% |
Transportation & Commute in Forest City
Vehicle Availability by Sex in Forest City
The most prevalent vehicle ownership categories in Forest City are males with 2 vehicles (486, accounting for 41.5%) and females with 2 vehicles (361, making up 36.1%).
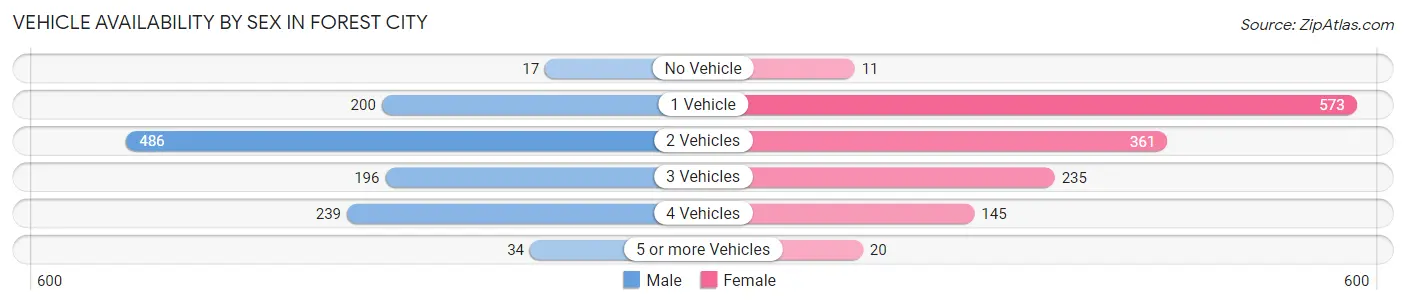
| Vehicles Available | Male | Female |
| No Vehicle | 17 (1.5%) | 11 (0.8%) |
| 1 Vehicle | 200 (17.1%) | 573 (42.6%) |
| 2 Vehicles | 486 (41.5%) | 361 (26.8%) |
| 3 Vehicles | 196 (16.7%) | 235 (17.5%) |
| 4 Vehicles | 239 (20.4%) | 145 (10.8%) |
| 5 or more Vehicles | 34 (2.9%) | 20 (1.5%) |
| Total | 1,172 (100.0%) | 1,345 (100.0%) |
Commute Time in Forest City
The most frequently occuring commute durations in Forest City are 5 to 9 minutes (588 commuters, 24.0%), 15 to 19 minutes (497 commuters, 20.3%), and 10 to 14 minutes (294 commuters, 12.0%).
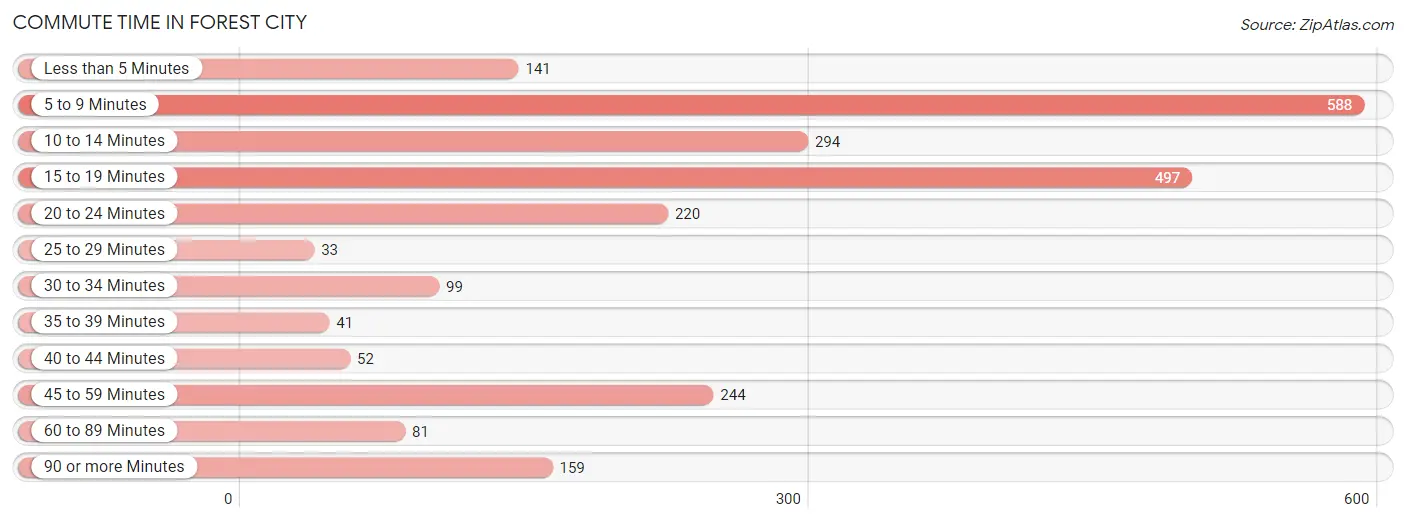
| Commute Time | # Commuters | % Commuters |
| Less than 5 Minutes | 141 | 5.8% |
| 5 to 9 Minutes | 588 | 24.0% |
| 10 to 14 Minutes | 294 | 12.0% |
| 15 to 19 Minutes | 497 | 20.3% |
| 20 to 24 Minutes | 220 | 9.0% |
| 25 to 29 Minutes | 33 | 1.3% |
| 30 to 34 Minutes | 99 | 4.0% |
| 35 to 39 Minutes | 41 | 1.7% |
| 40 to 44 Minutes | 52 | 2.1% |
| 45 to 59 Minutes | 244 | 10.0% |
| 60 to 89 Minutes | 81 | 3.3% |
| 90 or more Minutes | 159 | 6.5% |
Commute Time by Sex in Forest City
The most common commute times in Forest City are 5 to 9 minutes (297 commuters, 25.3%) for males and 5 to 9 minutes (291 commuters, 22.9%) for females.
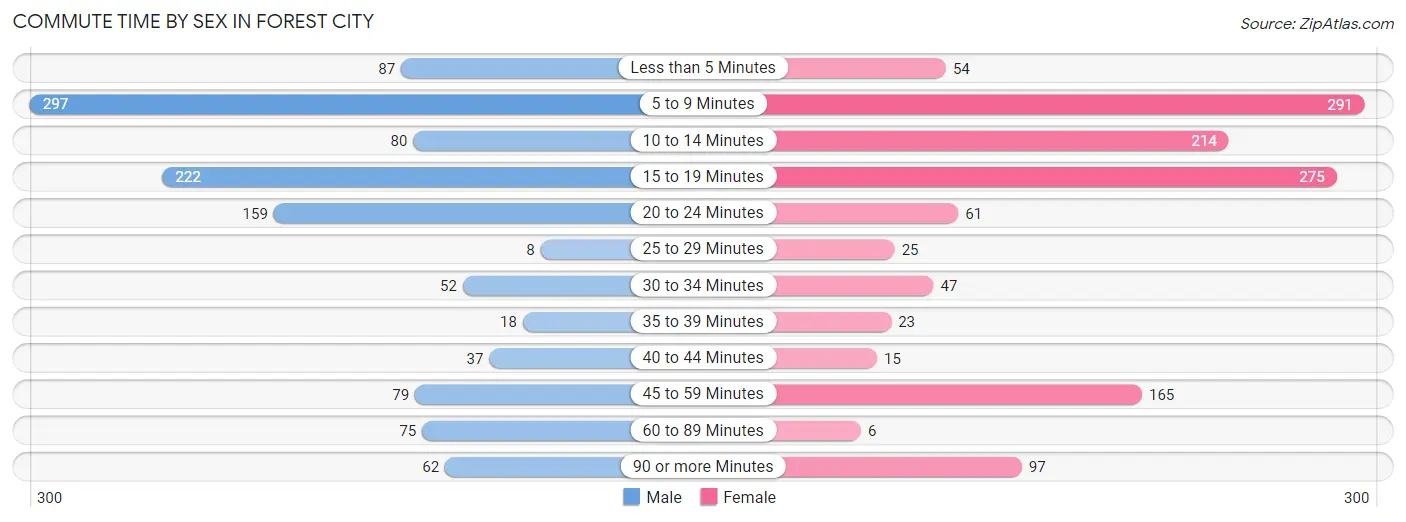
| Commute Time | Male | Female |
| Less than 5 Minutes | 87 (7.4%) | 54 (4.2%) |
| 5 to 9 Minutes | 297 (25.3%) | 291 (22.9%) |
| 10 to 14 Minutes | 80 (6.8%) | 214 (16.8%) |
| 15 to 19 Minutes | 222 (18.9%) | 275 (21.6%) |
| 20 to 24 Minutes | 159 (13.5%) | 61 (4.8%) |
| 25 to 29 Minutes | 8 (0.7%) | 25 (2.0%) |
| 30 to 34 Minutes | 52 (4.4%) | 47 (3.7%) |
| 35 to 39 Minutes | 18 (1.5%) | 23 (1.8%) |
| 40 to 44 Minutes | 37 (3.2%) | 15 (1.2%) |
| 45 to 59 Minutes | 79 (6.7%) | 165 (13.0%) |
| 60 to 89 Minutes | 75 (6.4%) | 6 (0.5%) |
| 90 or more Minutes | 62 (5.3%) | 97 (7.6%) |
Time of Departure to Work by Sex in Forest City
The most frequent times of departure to work in Forest City are 7:00 AM to 7:29 AM (264, 22.5%) for males and 12:00 PM to 3:59 PM (306, 24.0%) for females.
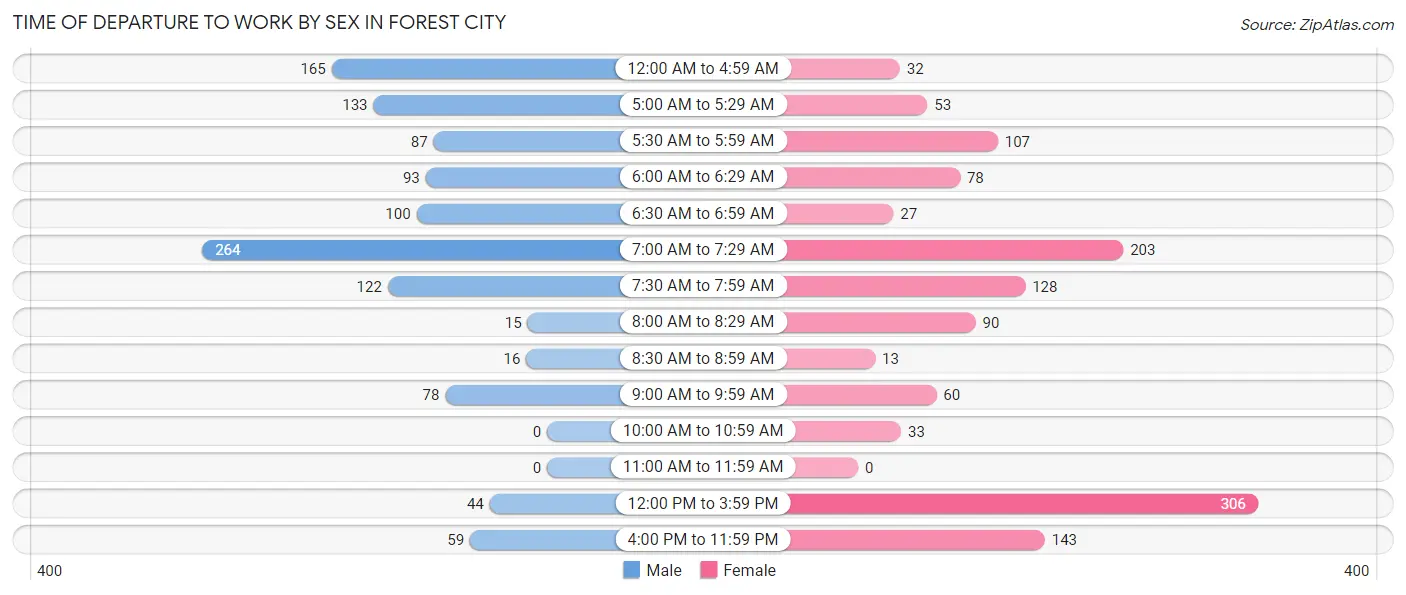
| Time of Departure | Male | Female |
| 12:00 AM to 4:59 AM | 165 (14.0%) | 32 (2.5%) |
| 5:00 AM to 5:29 AM | 133 (11.3%) | 53 (4.2%) |
| 5:30 AM to 5:59 AM | 87 (7.4%) | 107 (8.4%) |
| 6:00 AM to 6:29 AM | 93 (7.9%) | 78 (6.1%) |
| 6:30 AM to 6:59 AM | 100 (8.5%) | 27 (2.1%) |
| 7:00 AM to 7:29 AM | 264 (22.5%) | 203 (16.0%) |
| 7:30 AM to 7:59 AM | 122 (10.4%) | 128 (10.1%) |
| 8:00 AM to 8:29 AM | 15 (1.3%) | 90 (7.1%) |
| 8:30 AM to 8:59 AM | 16 (1.4%) | 13 (1.0%) |
| 9:00 AM to 9:59 AM | 78 (6.6%) | 60 (4.7%) |
| 10:00 AM to 10:59 AM | 0 (0.0%) | 33 (2.6%) |
| 11:00 AM to 11:59 AM | 0 (0.0%) | 0 (0.0%) |
| 12:00 PM to 3:59 PM | 44 (3.7%) | 306 (24.0%) |
| 4:00 PM to 11:59 PM | 59 (5.0%) | 143 (11.2%) |
| Total | 1,176 (100.0%) | 1,273 (100.0%) |
Housing Occupancy in Forest City
Occupancy by Ownership in Forest City
Of the total 2,691 dwellings in Forest City, owner-occupied units account for 1,204 (44.7%), while renter-occupied units make up 1,487 (55.3%).
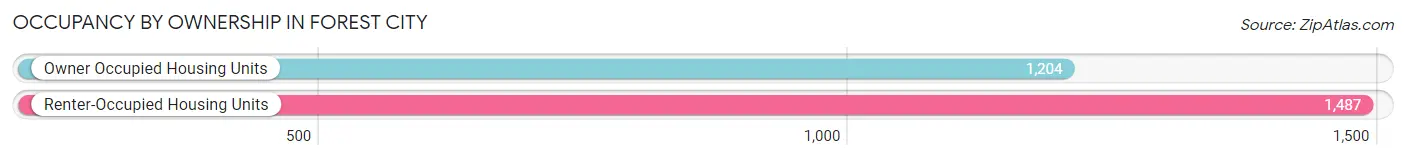
| Occupancy | # Housing Units | % Housing Units |
| Owner Occupied Housing Units | 1,204 | 44.7% |
| Renter-Occupied Housing Units | 1,487 | 55.3% |
| Total Occupied Housing Units | 2,691 | 100.0% |
Occupancy by Household Size in Forest City
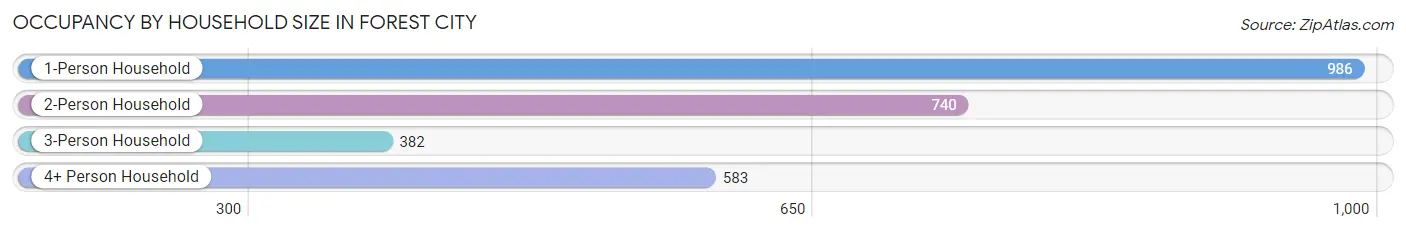
| Household Size | # Housing Units | % Housing Units |
| 1-Person Household | 986 | 36.6% |
| 2-Person Household | 740 | 27.5% |
| 3-Person Household | 382 | 14.2% |
| 4+ Person Household | 583 | 21.7% |
| Total Housing Units | 2,691 | 100.0% |
Occupancy by Ownership by Household Size in Forest City
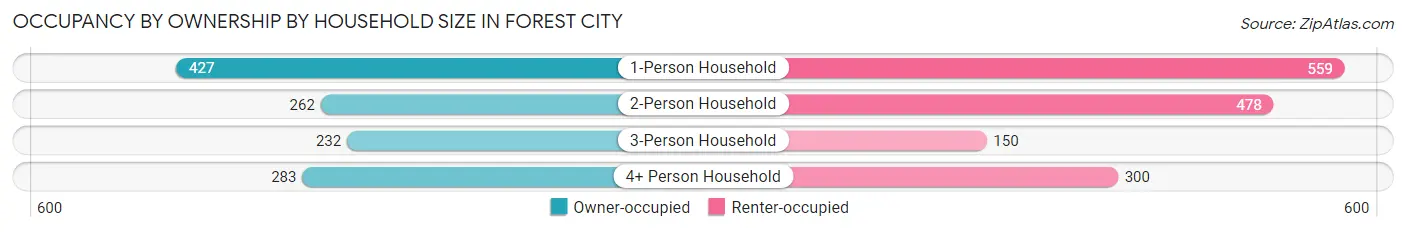
| Household Size | Owner-occupied | Renter-occupied |
| 1-Person Household | 427 (43.3%) | 559 (56.7%) |
| 2-Person Household | 262 (35.4%) | 478 (64.6%) |
| 3-Person Household | 232 (60.7%) | 150 (39.3%) |
| 4+ Person Household | 283 (48.5%) | 300 (51.5%) |
| Total Housing Units | 1,204 (44.7%) | 1,487 (55.3%) |
Occupancy by Educational Attainment in Forest City
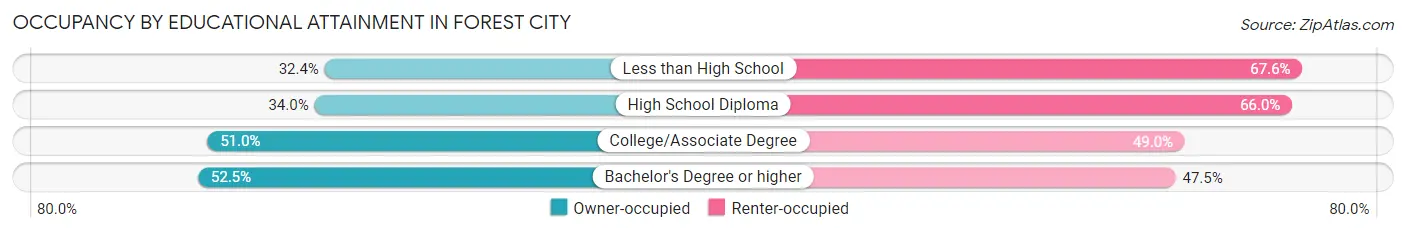
| Household Size | Owner-occupied | Renter-occupied |
| Less than High School | 93 (32.4%) | 194 (67.6%) |
| High School Diploma | 247 (34.0%) | 479 (66.0%) |
| College/Associate Degree | 592 (51.0%) | 568 (49.0%) |
| Bachelor's Degree or higher | 272 (52.5%) | 246 (47.5%) |
Occupancy by Age of Householder in Forest City
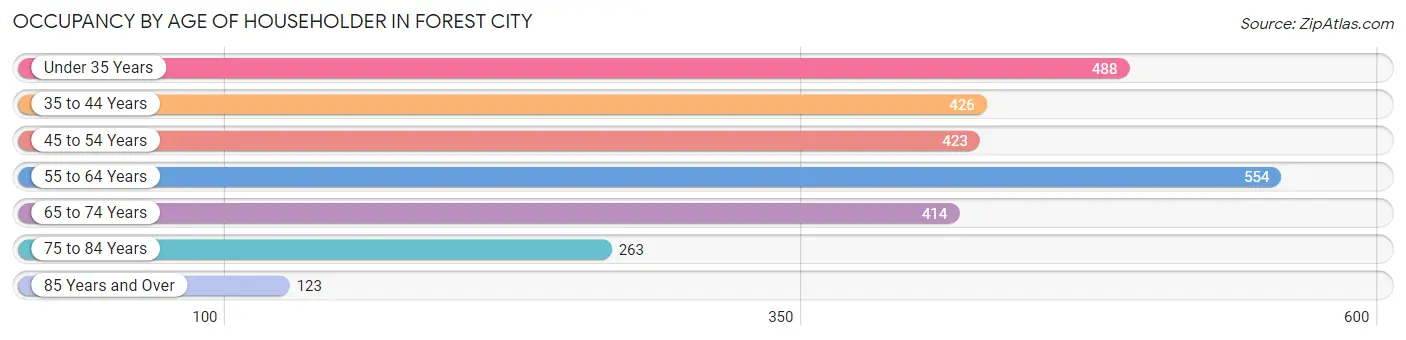
| Age Bracket | # Households | % Households |
| Under 35 Years | 488 | 18.1% |
| 35 to 44 Years | 426 | 15.8% |
| 45 to 54 Years | 423 | 15.7% |
| 55 to 64 Years | 554 | 20.6% |
| 65 to 74 Years | 414 | 15.4% |
| 75 to 84 Years | 263 | 9.8% |
| 85 Years and Over | 123 | 4.6% |
| Total | 2,691 | 100.0% |
Housing Finances in Forest City
Median Income by Occupancy in Forest City
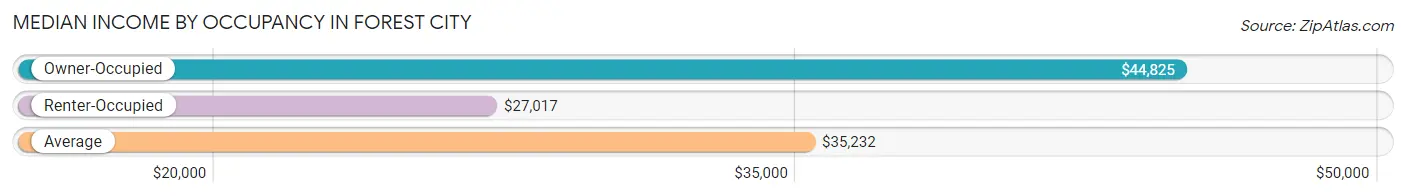
| Occupancy Type | # Households | Median Income |
| Owner-Occupied | 1,204 (44.7%) | $44,825 |
| Renter-Occupied | 1,487 (55.3%) | $27,017 |
| Average | 2,691 (100.0%) | $35,232 |
Occupancy by Householder Income Bracket in Forest City
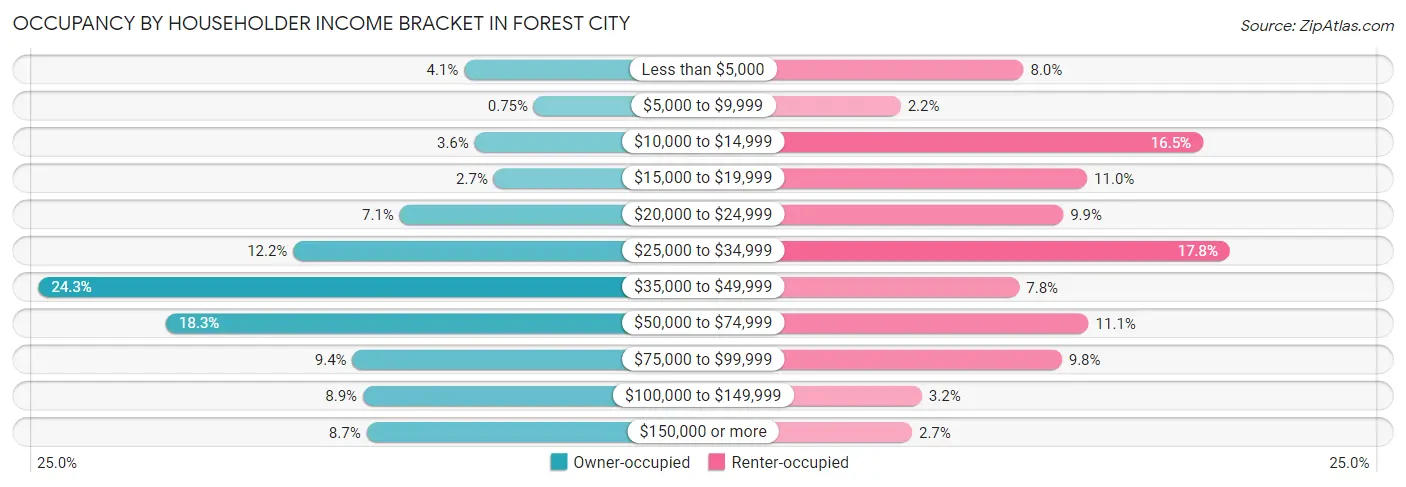
| Income Bracket | Owner-occupied | Renter-occupied |
| Less than $5,000 | 49 (4.1%) | 119 (8.0%) |
| $5,000 to $9,999 | 9 (0.7%) | 32 (2.1%) |
| $10,000 to $14,999 | 43 (3.6%) | 246 (16.5%) |
| $15,000 to $19,999 | 32 (2.7%) | 164 (11.0%) |
| $20,000 to $24,999 | 86 (7.1%) | 147 (9.9%) |
| $25,000 to $34,999 | 147 (12.2%) | 265 (17.8%) |
| $35,000 to $49,999 | 293 (24.3%) | 116 (7.8%) |
| $50,000 to $74,999 | 220 (18.3%) | 165 (11.1%) |
| $75,000 to $99,999 | 113 (9.4%) | 146 (9.8%) |
| $100,000 to $149,999 | 107 (8.9%) | 47 (3.2%) |
| $150,000 or more | 105 (8.7%) | 40 (2.7%) |
| Total | 1,204 (100.0%) | 1,487 (100.0%) |
Monthly Housing Cost Tiers in Forest City
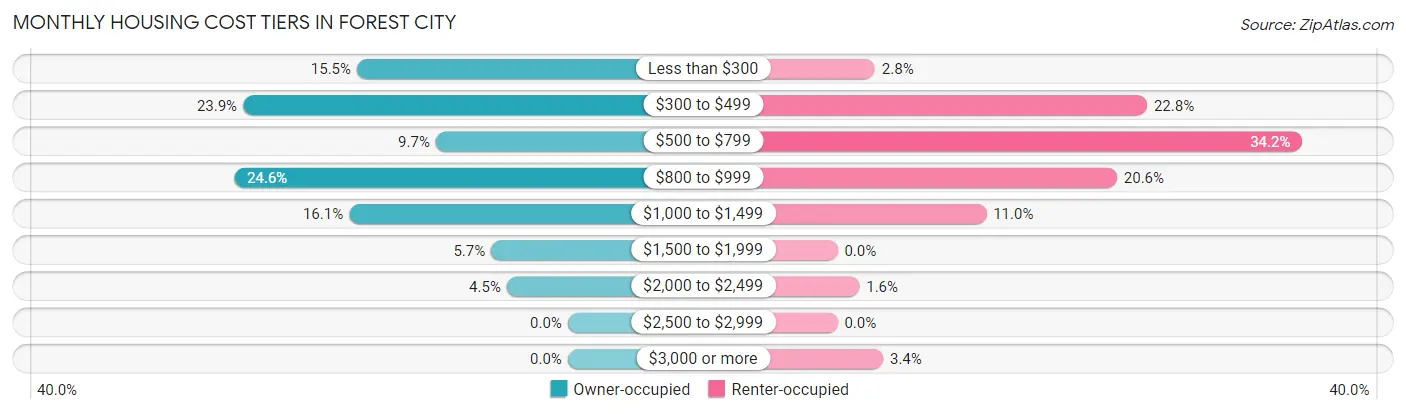
| Monthly Cost | Owner-occupied | Renter-occupied |
| Less than $300 | 187 (15.5%) | 41 (2.8%) |
| $300 to $499 | 288 (23.9%) | 339 (22.8%) |
| $500 to $799 | 117 (9.7%) | 509 (34.2%) |
| $800 to $999 | 296 (24.6%) | 306 (20.6%) |
| $1,000 to $1,499 | 194 (16.1%) | 163 (11.0%) |
| $1,500 to $1,999 | 68 (5.7%) | 0 (0.0%) |
| $2,000 to $2,499 | 54 (4.5%) | 24 (1.6%) |
| $2,500 to $2,999 | 0 (0.0%) | 0 (0.0%) |
| $3,000 or more | 0 (0.0%) | 50 (3.4%) |
| Total | 1,204 (100.0%) | 1,487 (100.0%) |
Physical Housing Characteristics in Forest City
Housing Structures in Forest City
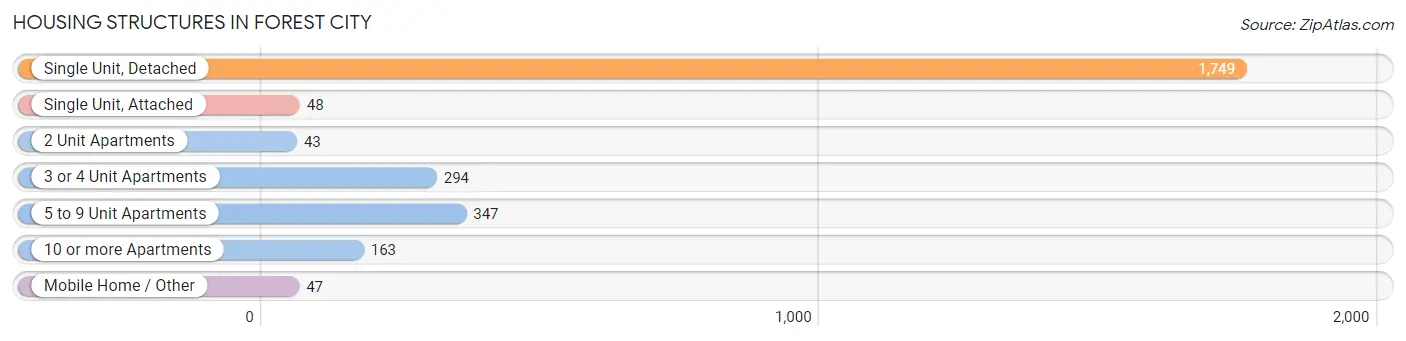
| Structure Type | # Housing Units | % Housing Units |
| Single Unit, Detached | 1,749 | 65.0% |
| Single Unit, Attached | 48 | 1.8% |
| 2 Unit Apartments | 43 | 1.6% |
| 3 or 4 Unit Apartments | 294 | 10.9% |
| 5 to 9 Unit Apartments | 347 | 12.9% |
| 10 or more Apartments | 163 | 6.1% |
| Mobile Home / Other | 47 | 1.8% |
| Total | 2,691 | 100.0% |
Housing Structures by Occupancy in Forest City
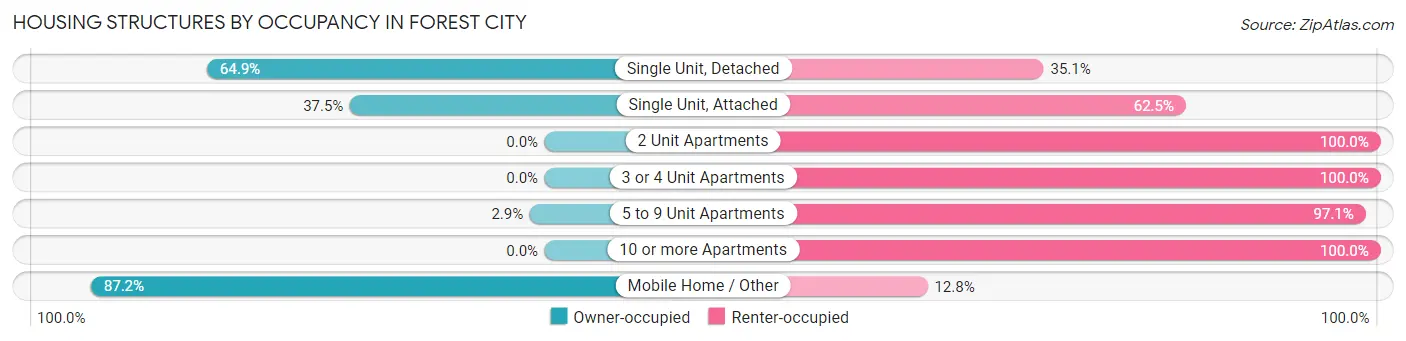
| Structure Type | Owner-occupied | Renter-occupied |
| Single Unit, Detached | 1,135 (64.9%) | 614 (35.1%) |
| Single Unit, Attached | 18 (37.5%) | 30 (62.5%) |
| 2 Unit Apartments | 0 (0.0%) | 43 (100.0%) |
| 3 or 4 Unit Apartments | 0 (0.0%) | 294 (100.0%) |
| 5 to 9 Unit Apartments | 10 (2.9%) | 337 (97.1%) |
| 10 or more Apartments | 0 (0.0%) | 163 (100.0%) |
| Mobile Home / Other | 41 (87.2%) | 6 (12.8%) |
| Total | 1,204 (44.7%) | 1,487 (55.3%) |
Housing Structures by Number of Rooms in Forest City
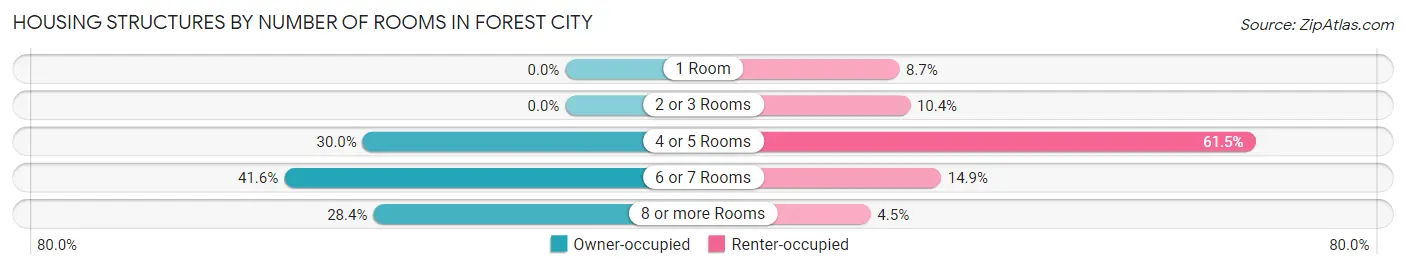
| Number of Rooms | Owner-occupied | Renter-occupied |
| 1 Room | 0 (0.0%) | 130 (8.7%) |
| 2 or 3 Rooms | 0 (0.0%) | 154 (10.4%) |
| 4 or 5 Rooms | 361 (30.0%) | 914 (61.5%) |
| 6 or 7 Rooms | 501 (41.6%) | 222 (14.9%) |
| 8 or more Rooms | 342 (28.4%) | 67 (4.5%) |
| Total | 1,204 (100.0%) | 1,487 (100.0%) |
Housing Structure by Heating Type in Forest City
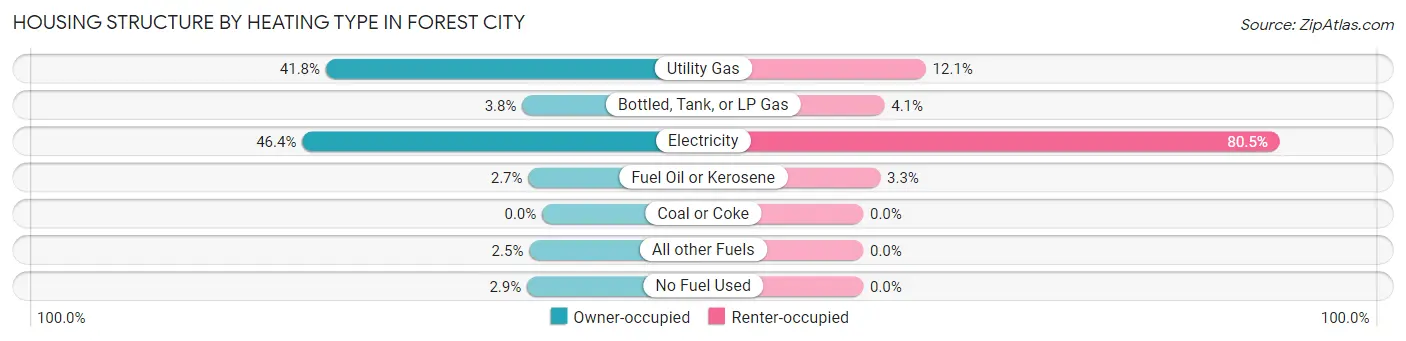
| Heating Type | Owner-occupied | Renter-occupied |
| Utility Gas | 503 (41.8%) | 180 (12.1%) |
| Bottled, Tank, or LP Gas | 46 (3.8%) | 61 (4.1%) |
| Electricity | 558 (46.4%) | 1,197 (80.5%) |
| Fuel Oil or Kerosene | 32 (2.7%) | 49 (3.3%) |
| Coal or Coke | 0 (0.0%) | 0 (0.0%) |
| All other Fuels | 30 (2.5%) | 0 (0.0%) |
| No Fuel Used | 35 (2.9%) | 0 (0.0%) |
| Total | 1,204 (100.0%) | 1,487 (100.0%) |
Household Vehicle Usage in Forest City
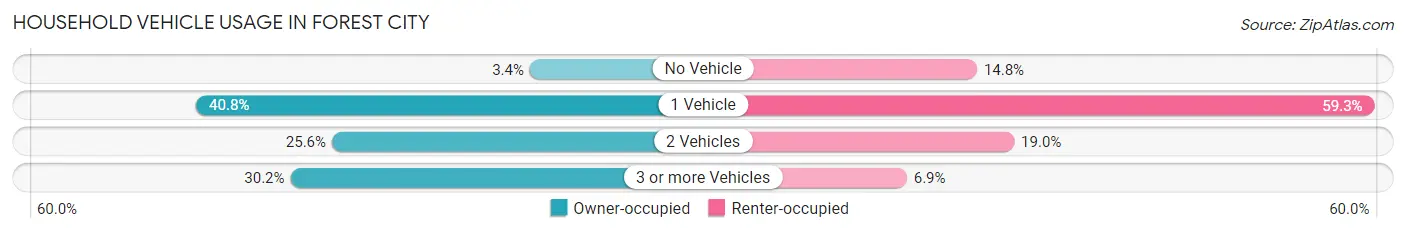
| Vehicles per Household | Owner-occupied | Renter-occupied |
| No Vehicle | 41 (3.4%) | 220 (14.8%) |
| 1 Vehicle | 491 (40.8%) | 882 (59.3%) |
| 2 Vehicles | 308 (25.6%) | 282 (19.0%) |
| 3 or more Vehicles | 364 (30.2%) | 103 (6.9%) |
| Total | 1,204 (100.0%) | 1,487 (100.0%) |
Real Estate & Mortgages in Forest City
Real Estate and Mortgage Overview in Forest City
| Characteristic | Without Mortgage | With Mortgage |
| Housing Units | 651 | 553 |
| Median Property Value | $120,200 | $156,100 |
| Median Household Income | $41,406 | $99 |
| Monthly Housing Costs | $340 | $0 |
| Real Estate Taxes | $903 | $9 |
Property Value by Mortgage Status in Forest City
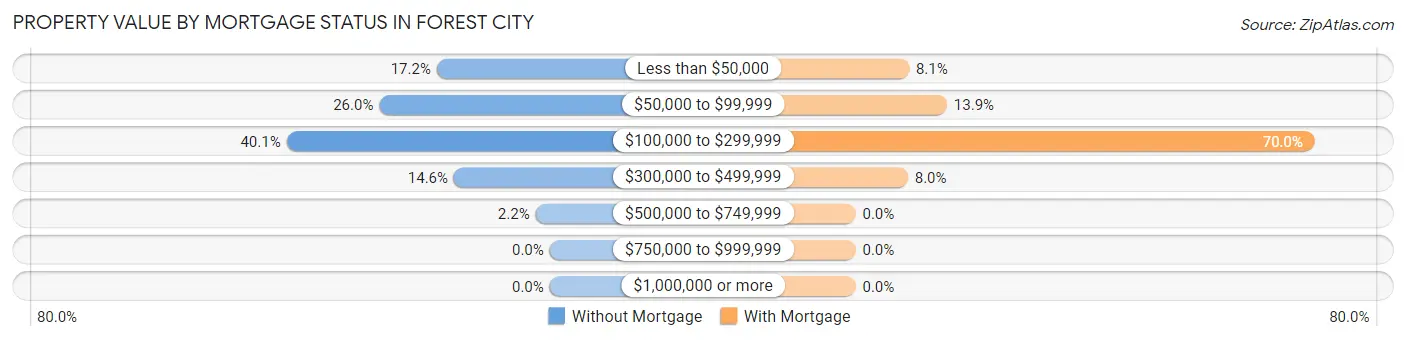
| Property Value | Without Mortgage | With Mortgage |
| Less than $50,000 | 112 (17.2%) | 45 (8.1%) |
| $50,000 to $99,999 | 169 (26.0%) | 77 (13.9%) |
| $100,000 to $299,999 | 261 (40.1%) | 387 (70.0%) |
| $300,000 to $499,999 | 95 (14.6%) | 44 (8.0%) |
| $500,000 to $749,999 | 14 (2.1%) | 0 (0.0%) |
| $750,000 to $999,999 | 0 (0.0%) | 0 (0.0%) |
| $1,000,000 or more | 0 (0.0%) | 0 (0.0%) |
| Total | 651 (100.0%) | 553 (100.0%) |
Household Income by Mortgage Status in Forest City
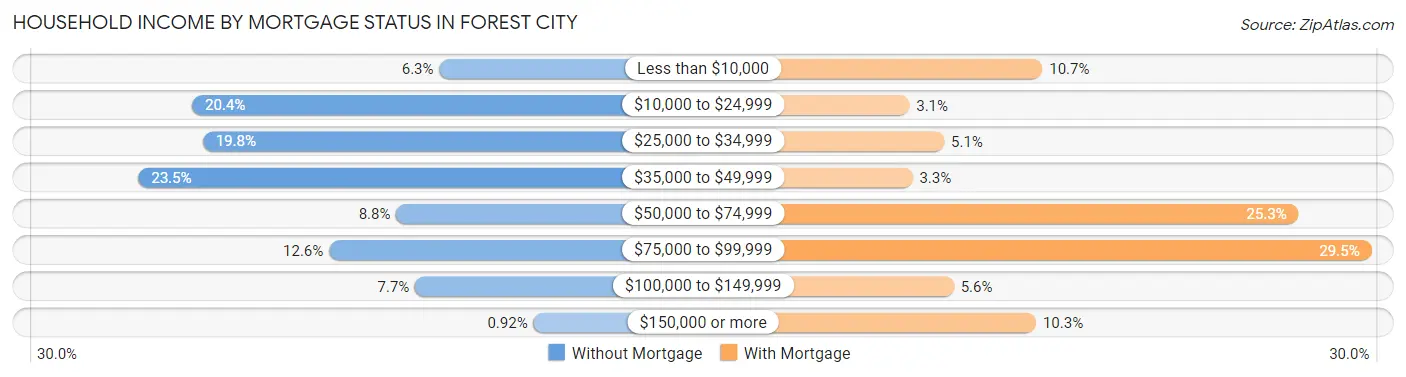
| Household Income | Without Mortgage | With Mortgage |
| Less than $10,000 | 41 (6.3%) | 59 (10.7%) |
| $10,000 to $24,999 | 133 (20.4%) | 17 (3.1%) |
| $25,000 to $34,999 | 129 (19.8%) | 28 (5.1%) |
| $35,000 to $49,999 | 153 (23.5%) | 18 (3.3%) |
| $50,000 to $74,999 | 57 (8.8%) | 140 (25.3%) |
| $75,000 to $99,999 | 82 (12.6%) | 163 (29.5%) |
| $100,000 to $149,999 | 50 (7.7%) | 31 (5.6%) |
| $150,000 or more | 6 (0.9%) | 57 (10.3%) |
| Total | 651 (100.0%) | 553 (100.0%) |
Property Value to Household Income Ratio in Forest City
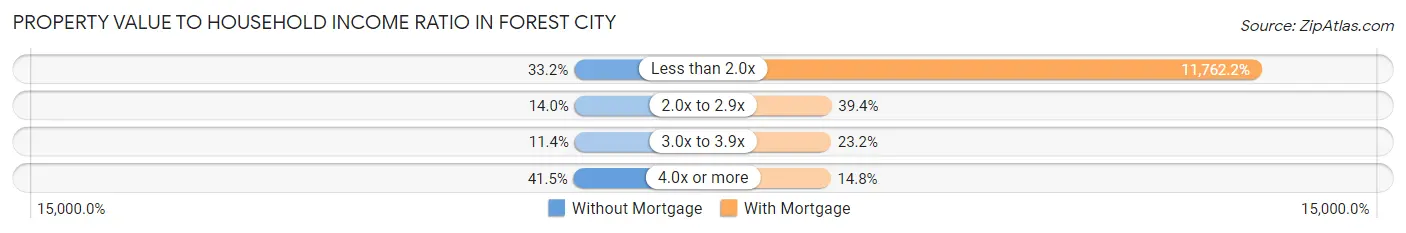
| Value-to-Income Ratio | Without Mortgage | With Mortgage |
| Less than 2.0x | 216 (33.2%) | 65,045 (11,762.2%) |
| 2.0x to 2.9x | 91 (14.0%) | 218 (39.4%) |
| 3.0x to 3.9x | 74 (11.4%) | 128 (23.2%) |
| 4.0x or more | 270 (41.5%) | 82 (14.8%) |
| Total | 651 (100.0%) | 553 (100.0%) |
Real Estate Taxes by Mortgage Status in Forest City
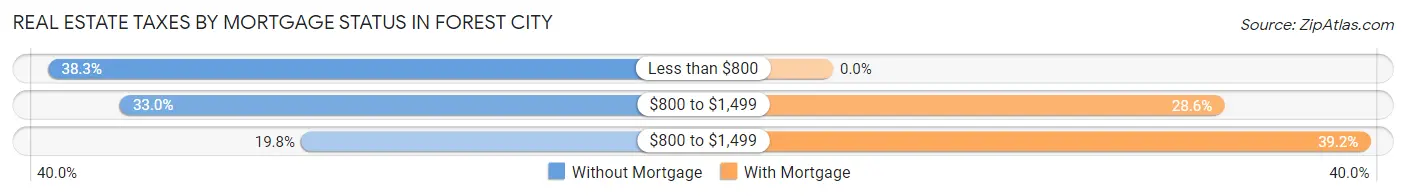
| Property Taxes | Without Mortgage | With Mortgage |
| Less than $800 | 249 (38.3%) | 0 (0.0%) |
| $800 to $1,499 | 215 (33.0%) | 158 (28.6%) |
| $800 to $1,499 | 129 (19.8%) | 217 (39.2%) |
| Total | 651 (100.0%) | 553 (100.0%) |
Health & Disability in Forest City
Health Insurance Coverage by Age in Forest City
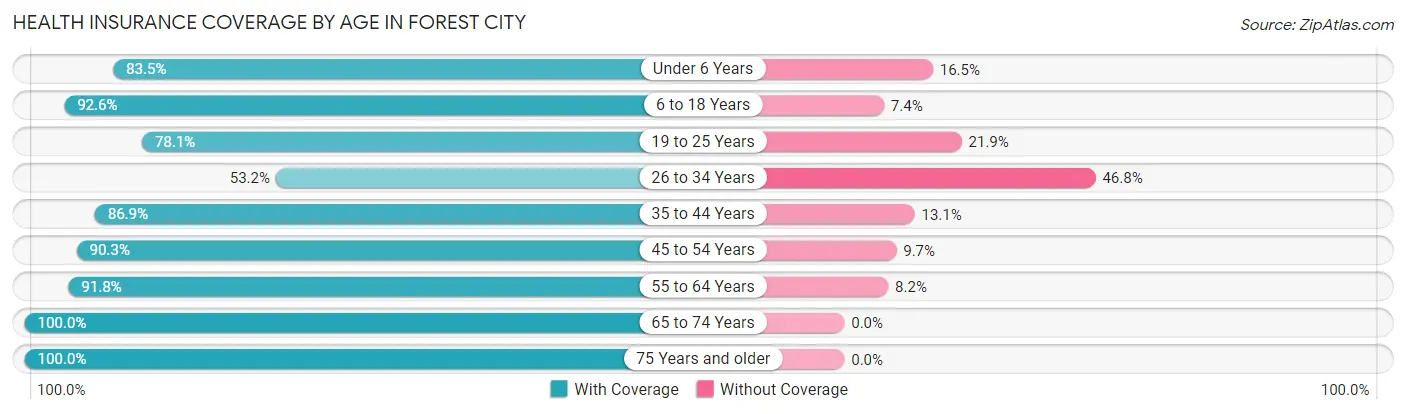
| Age Bracket | With Coverage | Without Coverage |
| Under 6 Years | 582 (83.5%) | 115 (16.5%) |
| 6 to 18 Years | 1,579 (92.6%) | 126 (7.4%) |
| 19 to 25 Years | 375 (78.1%) | 105 (21.9%) |
| 26 to 34 Years | 546 (53.2%) | 481 (46.8%) |
| 35 to 44 Years | 564 (86.9%) | 85 (13.1%) |
| 45 to 54 Years | 718 (90.3%) | 77 (9.7%) |
| 55 to 64 Years | 707 (91.8%) | 63 (8.2%) |
| 65 to 74 Years | 669 (100.0%) | 0 (0.0%) |
| 75 Years and older | 521 (100.0%) | 0 (0.0%) |
| Total | 6,261 (85.6%) | 1,052 (14.4%) |
Health Insurance Coverage by Citizenship Status in Forest City
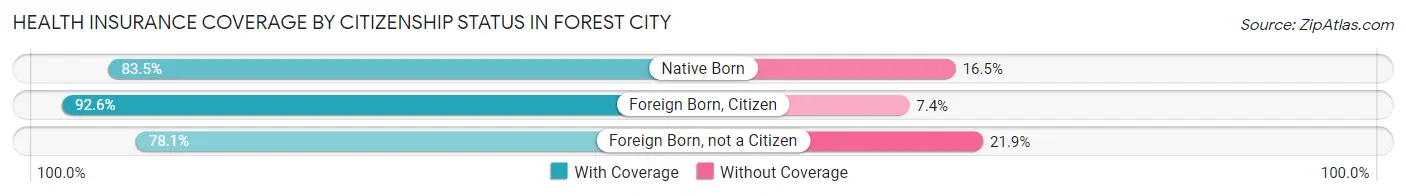
| Citizenship Status | With Coverage | Without Coverage |
| Native Born | 582 (83.5%) | 115 (16.5%) |
| Foreign Born, Citizen | 1,579 (92.6%) | 126 (7.4%) |
| Foreign Born, not a Citizen | 375 (78.1%) | 105 (21.9%) |
Health Insurance Coverage by Household Income in Forest City
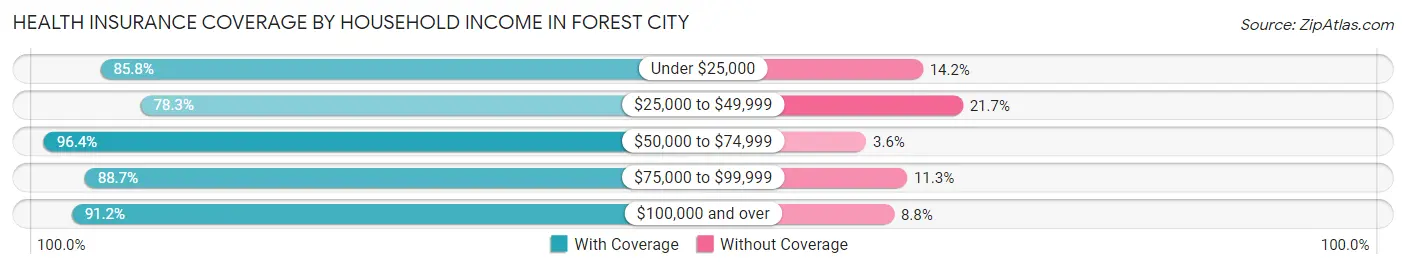
| Household Income | With Coverage | Without Coverage |
| Under $25,000 | 1,611 (85.8%) | 267 (14.2%) |
| $25,000 to $49,999 | 1,953 (78.3%) | 542 (21.7%) |
| $50,000 to $74,999 | 986 (96.4%) | 37 (3.6%) |
| $75,000 to $99,999 | 802 (88.7%) | 102 (11.3%) |
| $100,000 and over | 847 (91.2%) | 82 (8.8%) |
Public vs Private Health Insurance Coverage by Age in Forest City
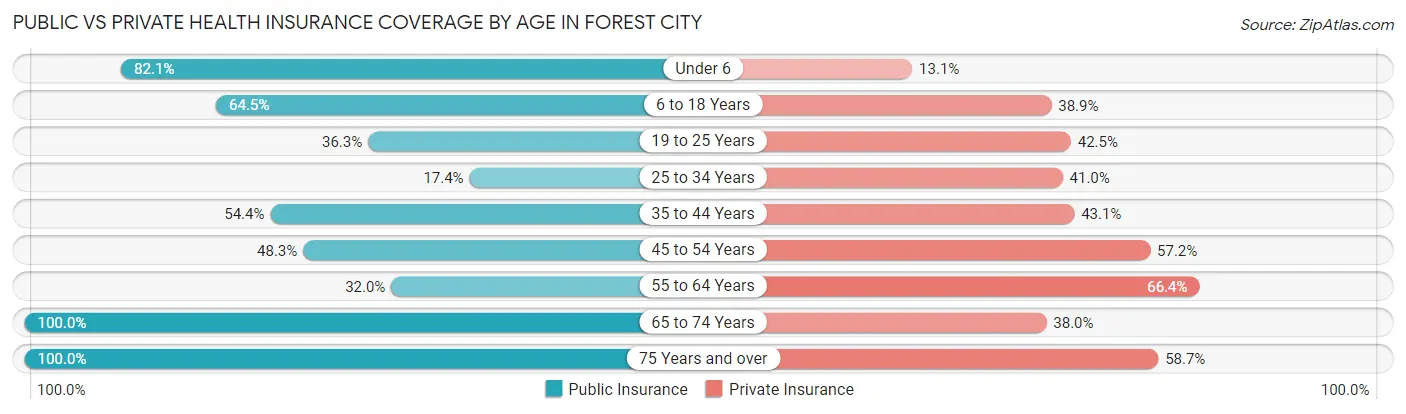
| Age Bracket | Public Insurance | Private Insurance |
| Under 6 | 572 (82.1%) | 91 (13.1%) |
| 6 to 18 Years | 1,099 (64.5%) | 663 (38.9%) |
| 19 to 25 Years | 174 (36.2%) | 204 (42.5%) |
| 25 to 34 Years | 179 (17.4%) | 421 (41.0%) |
| 35 to 44 Years | 353 (54.4%) | 280 (43.1%) |
| 45 to 54 Years | 384 (48.3%) | 455 (57.2%) |
| 55 to 64 Years | 246 (32.0%) | 511 (66.4%) |
| 65 to 74 Years | 669 (100.0%) | 254 (38.0%) |
| 75 Years and over | 521 (100.0%) | 306 (58.7%) |
| Total | 4,197 (57.4%) | 3,185 (43.5%) |
Disability Status by Sex by Age in Forest City
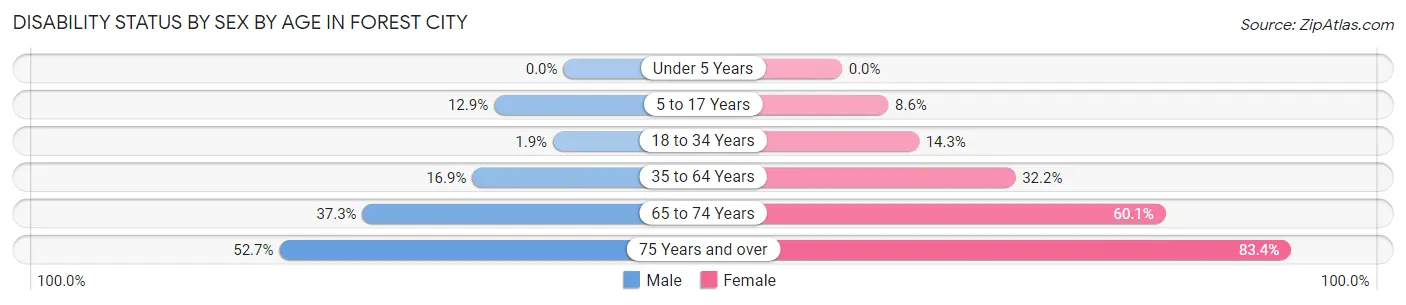
| Age Bracket | Male | Female |
| Under 5 Years | 0 (0.0%) | 0 (0.0%) |
| 5 to 17 Years | 105 (12.9%) | 64 (8.6%) |
| 18 to 34 Years | 15 (1.9%) | 131 (14.3%) |
| 35 to 64 Years | 137 (16.9%) | 452 (32.2%) |
| 65 to 74 Years | 113 (37.3%) | 220 (60.1%) |
| 75 Years and over | 97 (52.7%) | 281 (83.4%) |
Disability Class by Sex by Age in Forest City
Disability Class: Hearing Difficulty
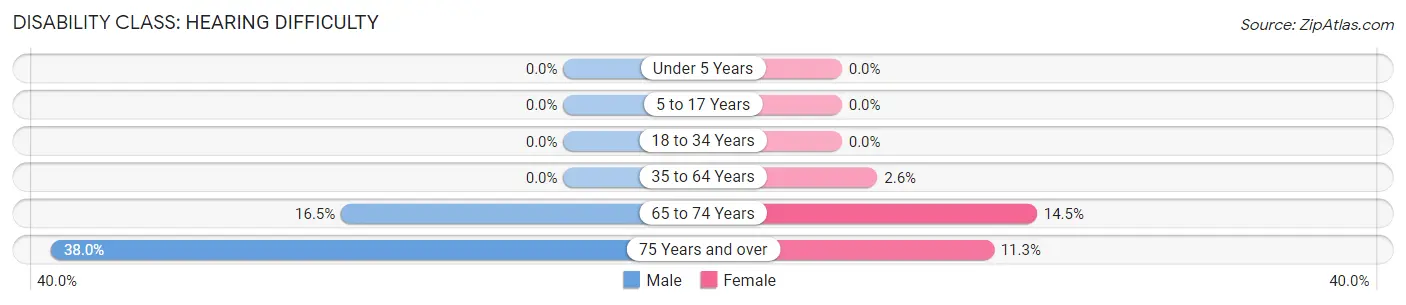
| Age Bracket | Male | Female |
| Under 5 Years | 0 (0.0%) | 0 (0.0%) |
| 5 to 17 Years | 0 (0.0%) | 0 (0.0%) |
| 18 to 34 Years | 0 (0.0%) | 0 (0.0%) |
| 35 to 64 Years | 0 (0.0%) | 37 (2.6%) |
| 65 to 74 Years | 50 (16.5%) | 53 (14.5%) |
| 75 Years and over | 70 (38.0%) | 38 (11.3%) |
Disability Class: Vision Difficulty
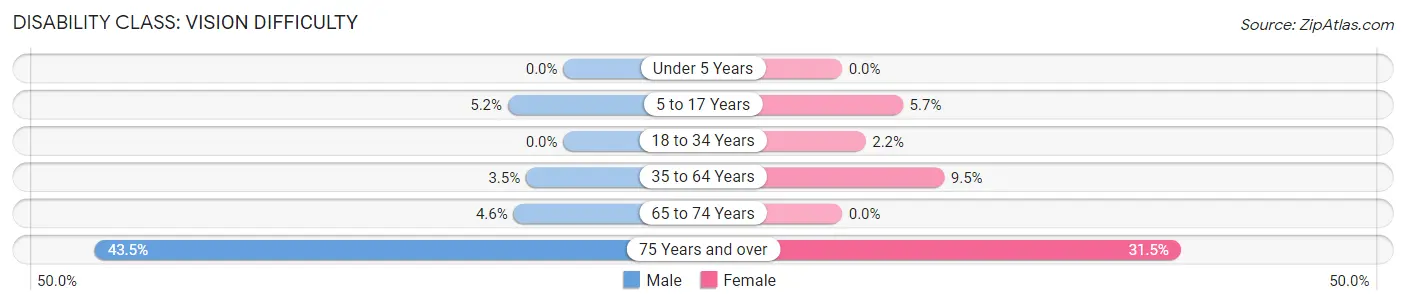
| Age Bracket | Male | Female |
| Under 5 Years | 0 (0.0%) | 0 (0.0%) |
| 5 to 17 Years | 42 (5.1%) | 42 (5.7%) |
| 18 to 34 Years | 0 (0.0%) | 20 (2.2%) |
| 35 to 64 Years | 28 (3.5%) | 133 (9.5%) |
| 65 to 74 Years | 14 (4.6%) | 0 (0.0%) |
| 75 Years and over | 80 (43.5%) | 106 (31.5%) |
Disability Class: Cognitive Difficulty
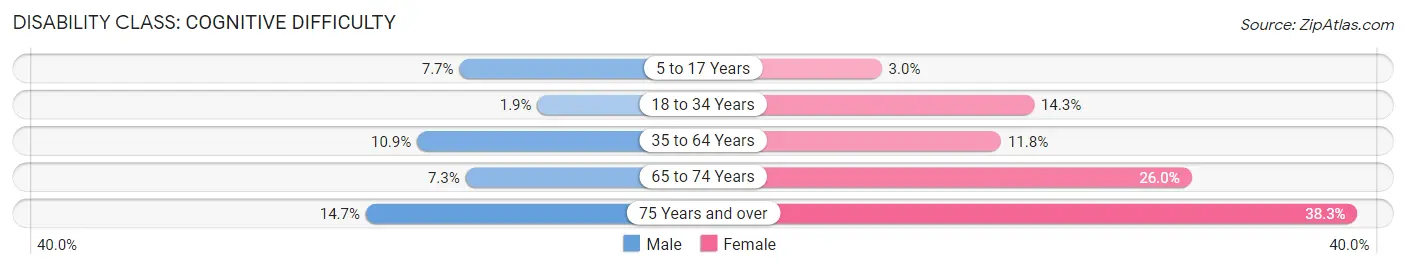
| Age Bracket | Male | Female |
| 5 to 17 Years | 63 (7.7%) | 22 (3.0%) |
| 18 to 34 Years | 15 (1.9%) | 131 (14.3%) |
| 35 to 64 Years | 88 (10.9%) | 166 (11.8%) |
| 65 to 74 Years | 22 (7.3%) | 95 (26.0%) |
| 75 Years and over | 27 (14.7%) | 129 (38.3%) |
Disability Class: Ambulatory Difficulty
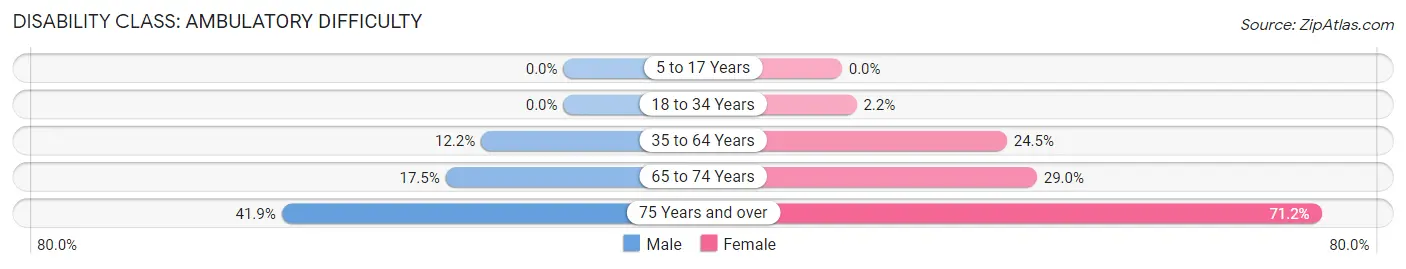
| Age Bracket | Male | Female |
| 5 to 17 Years | 0 (0.0%) | 0 (0.0%) |
| 18 to 34 Years | 0 (0.0%) | 20 (2.2%) |
| 35 to 64 Years | 99 (12.2%) | 344 (24.5%) |
| 65 to 74 Years | 53 (17.5%) | 106 (29.0%) |
| 75 Years and over | 77 (41.8%) | 240 (71.2%) |
Disability Class: Self-Care Difficulty
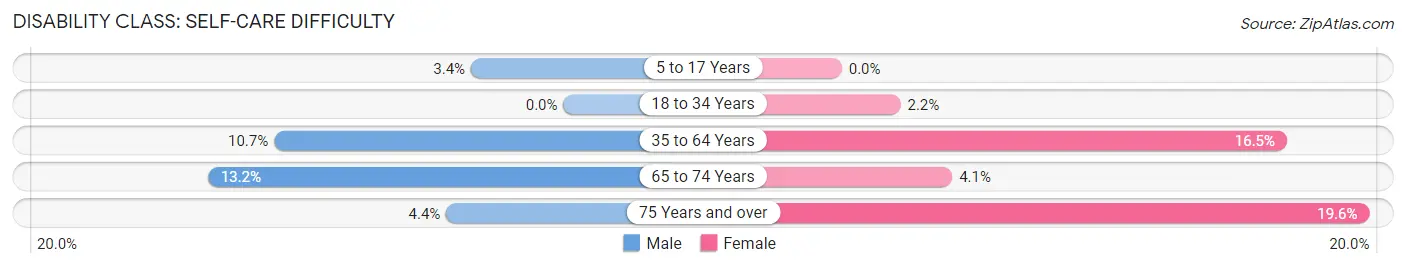
| Age Bracket | Male | Female |
| 5 to 17 Years | 28 (3.4%) | 0 (0.0%) |
| 18 to 34 Years | 0 (0.0%) | 20 (2.2%) |
| 35 to 64 Years | 87 (10.7%) | 232 (16.5%) |
| 65 to 74 Years | 40 (13.2%) | 15 (4.1%) |
| 75 Years and over | 8 (4.3%) | 66 (19.6%) |
Technology Access in Forest City
Computing Device Access in Forest City
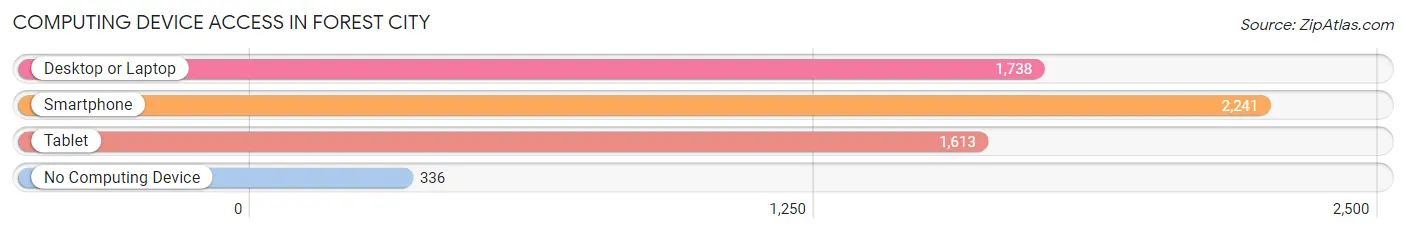
| Device Type | # Households | % Households |
| Desktop or Laptop | 1,738 | 64.6% |
| Smartphone | 2,241 | 83.3% |
| Tablet | 1,613 | 59.9% |
| No Computing Device | 336 | 12.5% |
| Total | 2,691 | 100.0% |
Internet Access in Forest City
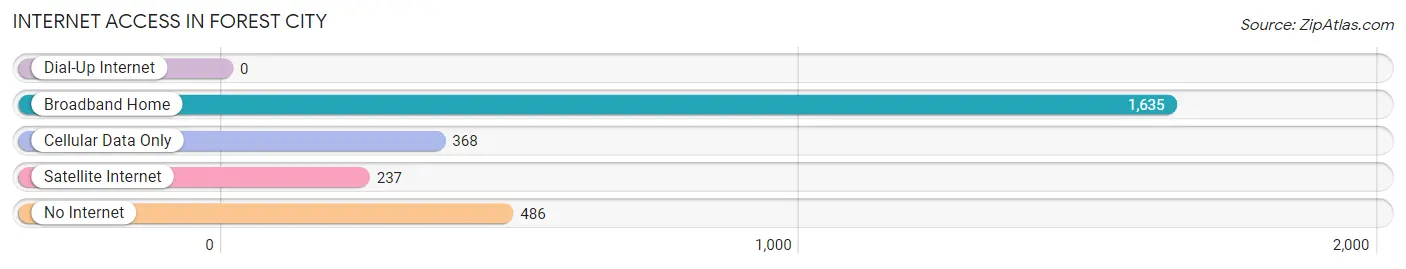
| Internet Type | # Households | % Households |
| Dial-Up Internet | 0 | 0.0% |
| Broadband Home | 1,635 | 60.8% |
| Cellular Data Only | 368 | 13.7% |
| Satellite Internet | 237 | 8.8% |
| No Internet | 486 | 18.1% |
| Total | 2,691 | 100.0% |
Forest City Summary
City of Forest City
Forest City is a small town located in Rutherford County, North Carolina. It is situated in the foothills of the Blue Ridge Mountains and is part of the Hickory-Lenoir-Morganton Metropolitan Statistical Area. The town has a population of approximately 7,500 people and is the county seat of Rutherford County.
History
The town of Forest City was founded in 1877 by Colonel William A. Davis, a Confederate veteran. He named the town after the nearby forest and the city was incorporated in 1887. The town was originally a farming community and was known for its production of apples, peaches, and other fruits.
In the early 1900s, the town began to grow and develop. The first railroad line was built in 1906 and the town was connected to the larger cities of Charlotte and Asheville. This allowed for the growth of the local economy and the population began to increase.
In the 1920s, the town began to experience a boom in the textile industry. Several mills were built in the area and the town became a major center for the production of textiles. This led to an increase in population and the town began to grow rapidly.
In the 1950s, the town began to experience a decline in the textile industry. This led to a decrease in population and the town began to struggle economically. In the 1970s, the town began to experience a resurgence in the economy as new businesses began to move into the area.
Geography
Forest City is located in the foothills of the Blue Ridge Mountains in western North Carolina. The town is situated at an elevation of 1,000 feet and is located at the intersection of US Highway 74 and NC Highway 108. The town is located approximately 40 miles east of Asheville and 60 miles west of Charlotte.
The town is located in a hilly area and is surrounded by forests and rolling hills. The town is located near the South Mountains State Park and the Pisgah National Forest. The town is also located near several lakes, including Lake Lure and Lake Adger.
Economy
The economy of Forest City is largely based on the manufacturing industry. The town is home to several large manufacturing companies, including the Forest City Textile Company, the Forest City Furniture Company, and the Forest City Paper Company. The town is also home to several smaller businesses, including restaurants, retail stores, and service providers.
The town is also home to several educational institutions, including Isothermal Community College and Rutherford Community College. The town is also home to several medical facilities, including Rutherford Regional Medical Center and Rutherford County Hospital.
Demographics
As of the 2010 census, the population of Forest City was 7,476. The racial makeup of the town was 87.3% White, 8.2% African American, 0.3% Native American, 0.7% Asian, 0.1% Pacific Islander, 1.3% from other races, and 2.1% from two or more races. Hispanic or Latino of any race were 3.2% of the population.
The median income for a household in the town was $31,944 and the median income for a family was $41,944. The per capita income for the town was $17,845. About 17.2% of families and 20.3% of the population were below the poverty line, including 28.2% of those under age 18 and 11.2% of those age 65 or over.
Common Questions
What is Per Capita Income in Forest City?
Per Capita income in Forest City is $21,671.
What is the Median Family Income in Forest City?
Median Family Income in Forest City is $43,710.
What is the Median Household income in Forest City?
Median Household Income in Forest City is $35,232.
What is Income or Wage Gap in Forest City?
Income or Wage Gap in Forest City is 20.2%.
Women in Forest City earn 79.8 cents for every dollar earned by a man.
What is Inequality or Gini Index in Forest City?
Inequality or Gini Index in Forest City is 0.50.
What is the Total Population of Forest City?
Total Population of Forest City is 7,357.
What is the Total Male Population of Forest City?
Total Male Population of Forest City is 3,266.
What is the Total Female Population of Forest City?
Total Female Population of Forest City is 4,091.
What is the Ratio of Males per 100 Females in Forest City?
There are 79.83 Males per 100 Females in Forest City.
What is the Ratio of Females per 100 Males in Forest City?
There are 125.26 Females per 100 Males in Forest City.
What is the Median Population Age in Forest City?
Median Population Age in Forest City is 32.8 Years.
What is the Average Family Size in Forest City
Average Family Size in Forest City is 3.6 People.
What is the Average Household Size in Forest City
Average Household Size in Forest City is 2.7 People.
How Large is the Labor Force in Forest City?
There are 2,901 People in the Labor Forcein in Forest City.
What is the Percentage of People in the Labor Force in Forest City?
53.9% of People are in the Labor Force in Forest City.
What is the Unemployment Rate in Forest City?
Unemployment Rate in Forest City is 10.1%.