Cities with the Highest Percentage of Population Employed in Health Technologists in Montana
RELATED REPORTS & OPTIONS
Health Technologists
Montana
Compare Cities
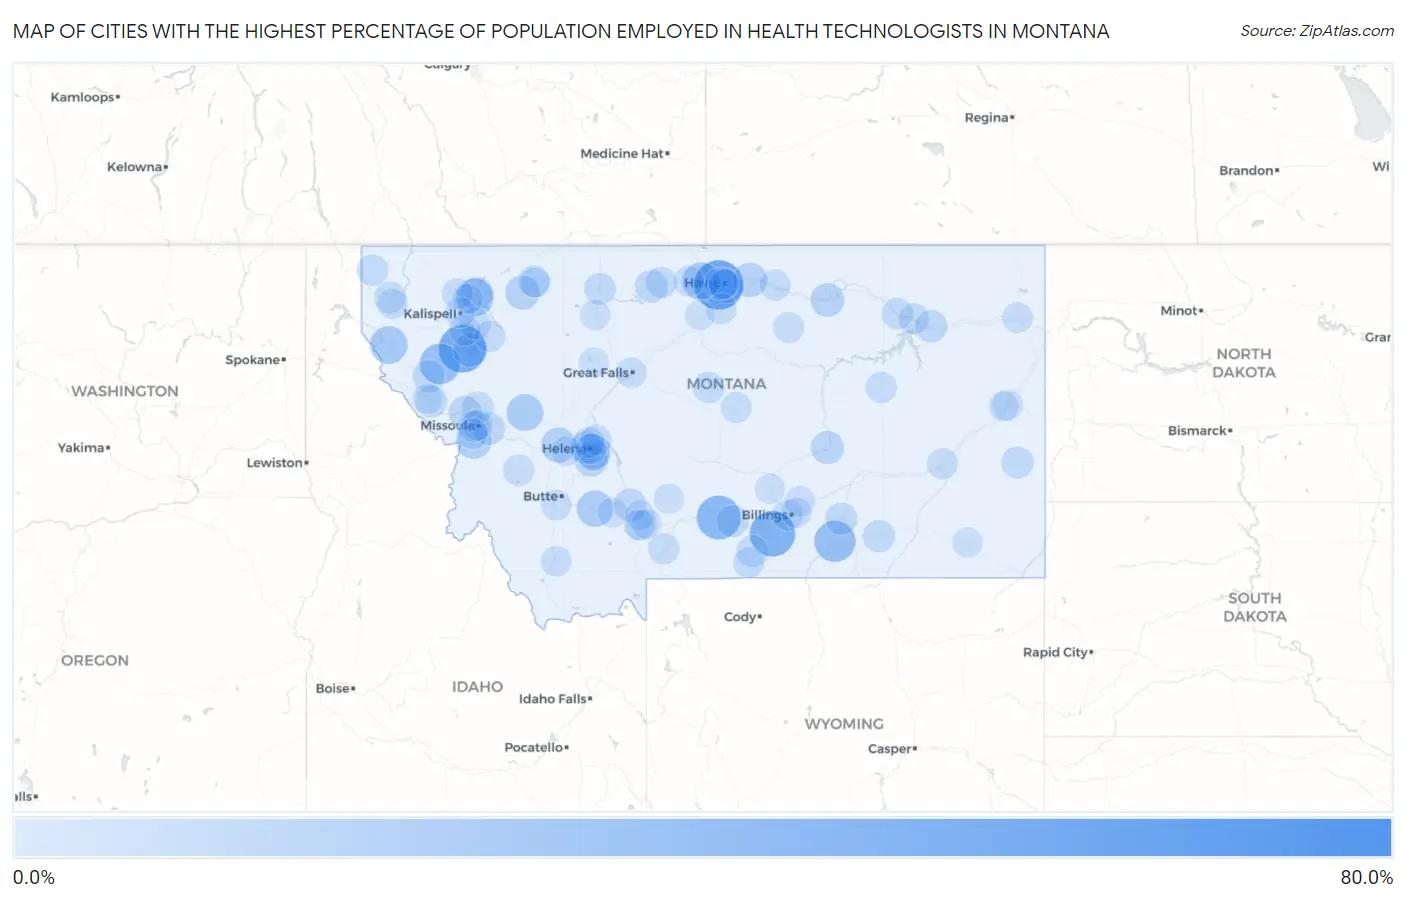
Map of Cities with the Highest Percentage of Population Employed in Health Technologists in Montana
0.0%
80.0%
Cities with the Highest Percentage of Population Employed in Health Technologists in Montana
| City | % Employed | vs State | vs National | |
| 1. | Glacier Colony | 61.1% | 4.5%(+56.6)#1 | 4.3%(+56.8)#21 |
| 2. | Hardy | 47.1% | 4.5%(+42.6)#2 | 4.3%(+42.8)#50 |
| 3. | Herron | 44.4% | 4.5%(+39.9)#3 | 4.3%(+40.2)#59 |
| 4. | Big Arm | 40.4% | 4.5%(+35.8)#4 | 4.3%(+36.1)#76 |
| 5. | Silesia | 36.4% | 4.5%(+31.9)#5 | 4.3%(+32.1)#91 |
| 6. | Vida | 33.3% | 4.5%(+28.8)#6 | 4.3%(+29.0)#120 |
| 7. | Greycliff | 32.5% | 4.5%(+28.0)#7 | 4.3%(+28.2)#125 |
| 8. | St Xavier | 26.9% | 4.5%(+22.4)#8 | 4.3%(+22.6)#192 |
| 9. | Hot Springs | 25.4% | 4.5%(+20.9)#9 | 4.3%(+21.1)#211 |
| 10. | Trout Creek | 19.4% | 4.5%(+14.9)#10 | 4.3%(+15.1)#387 |
| 11. | Kremlin | 19.2% | 4.5%(+14.7)#11 | 4.3%(+14.9)#403 |
| 12. | Hungry Horse | 18.8% | 4.5%(+14.3)#12 | 4.3%(+14.5)#424 |
| 13. | Ovando | 17.4% | 4.5%(+12.9)#13 | 4.3%(+13.1)#498 |
| 14. | Cardwell | 16.7% | 4.5%(+12.2)#14 | 4.3%(+12.4)#550 |
| 15. | South Hills | 15.5% | 4.5%(+11.0)#15 | 4.3%(+11.2)#641 |
| 16. | Rimini | 15.1% | 4.5%(+10.6)#16 | 4.3%(+10.8)#680 |
| 17. | Carlton | 14.5% | 4.5%(+10.0)#17 | 4.3%(+10.2)#749 |
| 18. | Avon | 14.0% | 4.5%(+9.50)#18 | 4.3%(+9.71)#816 |
| 19. | York | 13.7% | 4.5%(+9.19)#19 | 4.3%(+9.40)#865 |
| 20. | Luther | 13.3% | 4.5%(+8.83)#20 | 4.3%(+9.05)#930 |
| 21. | Chinook | 12.9% | 4.5%(+8.38)#21 | 4.3%(+8.59)#1,002 |
| 22. | East Glacier Park Village | 12.6% | 4.5%(+8.10)#22 | 4.3%(+8.31)#1,052 |
| 23. | Saddle Butte | 11.8% | 4.5%(+7.26)#23 | 4.3%(+7.48)#1,251 |
| 24. | Malta | 11.5% | 4.5%(+6.99)#24 | 4.3%(+7.20)#1,324 |
| 25. | Kings Point | 11.4% | 4.5%(+6.94)#25 | 4.3%(+7.16)#1,337 |
| 26. | Coram | 10.8% | 4.5%(+6.28)#26 | 4.3%(+6.50)#1,510 |
| 27. | Clancy | 10.3% | 4.5%(+5.79)#27 | 4.3%(+6.01)#1,679 |
| 28. | Melstone | 9.8% | 4.5%(+5.25)#28 | 4.3%(+5.47)#1,901 |
| 29. | Frenchtown | 9.5% | 4.5%(+4.96)#29 | 4.3%(+5.18)#2,029 |
| 30. | Helena West Side | 9.3% | 4.5%(+4.82)#30 | 4.3%(+5.03)#2,099 |
| 31. | West Havre | 9.2% | 4.5%(+4.69)#31 | 4.3%(+4.91)#2,167 |
| 32. | Chester | 9.1% | 4.5%(+4.59)#32 | 4.3%(+4.80)#2,218 |
| 33. | Gallatin River Ranch | 9.1% | 4.5%(+4.59)#33 | 4.3%(+4.80)#2,229 |
| 34. | Turah | 8.8% | 4.5%(+4.31)#34 | 4.3%(+4.53)#2,407 |
| 35. | Plains | 8.5% | 4.5%(+3.98)#35 | 4.3%(+4.20)#2,615 |
| 36. | Frazer | 8.3% | 4.5%(+3.83)#36 | 4.3%(+4.05)#2,713 |
| 37. | Busby | 8.2% | 4.5%(+3.72)#37 | 4.3%(+3.93)#2,791 |
| 38. | Reed Point | 8.1% | 4.5%(+3.64)#38 | 4.3%(+3.85)#2,870 |
| 39. | Hardin | 8.1% | 4.5%(+3.61)#39 | 4.3%(+3.83)#2,887 |
| 40. | Riverbend | 8.1% | 4.5%(+3.58)#40 | 4.3%(+3.79)#2,912 |
| 41. | Roberts | 8.0% | 4.5%(+3.50)#41 | 4.3%(+3.71)#2,979 |
| 42. | Plevna | 7.9% | 4.5%(+3.39)#42 | 4.3%(+3.61)#3,071 |
| 43. | North Browning | 7.6% | 4.5%(+3.07)#43 | 4.3%(+3.29)#3,367 |
| 44. | Shelby | 7.5% | 4.5%(+3.01)#44 | 4.3%(+3.23)#3,420 |
| 45. | Evaro | 7.2% | 4.5%(+2.75)#45 | 4.3%(+2.96)#3,672 |
| 46. | Montana City | 7.2% | 4.5%(+2.67)#46 | 4.3%(+2.88)#3,762 |
| 47. | Libby | 7.1% | 4.5%(+2.59)#47 | 4.3%(+2.81)#3,860 |
| 48. | Bigfork | 7.0% | 4.5%(+2.49)#48 | 4.3%(+2.71)#3,970 |
| 49. | Glasgow | 6.9% | 4.5%(+2.40)#49 | 4.3%(+2.61)#4,089 |
| 50. | Orchard Homes | 6.6% | 4.5%(+2.10)#50 | 4.3%(+2.32)#4,472 |
| 51. | Joplin | 6.6% | 4.5%(+2.08)#51 | 4.3%(+2.29)#4,513 |
| 52. | Helena Valley West Central | 6.5% | 4.5%(+2.00)#52 | 4.3%(+2.22)#4,597 |
| 53. | Denton | 6.5% | 4.5%(+1.97)#53 | 4.3%(+2.19)#4,646 |
| 54. | Sylvanite | 6.5% | 4.5%(+1.95)#54 | 4.3%(+2.17)#4,681 |
| 55. | Lakeside | 6.3% | 4.5%(+1.81)#55 | 4.3%(+2.02)#4,873 |
| 56. | Philipsburg | 6.3% | 4.5%(+1.80)#56 | 4.3%(+2.02)#4,879 |
| 57. | Swan Lake | 6.2% | 4.5%(+1.75)#57 | 4.3%(+1.96)#4,959 |
| 58. | Billings | 6.2% | 4.5%(+1.75)#58 | 4.3%(+1.96)#4,973 |
| 59. | Emigrant | 6.2% | 4.5%(+1.71)#59 | 4.3%(+1.92)#5,030 |
| 60. | Harlem | 6.1% | 4.5%(+1.56)#60 | 4.3%(+1.77)#5,266 |
| 61. | Jordan | 6.0% | 4.5%(+1.48)#61 | 4.3%(+1.69)#5,418 |
| 62. | Lodge Pole | 6.0% | 4.5%(+1.47)#62 | 4.3%(+1.68)#5,436 |
| 63. | Lewistown Heights | 5.6% | 4.5%(+1.07)#63 | 4.3%(+1.29)#6,119 |
| 64. | Parker School | 5.6% | 4.5%(+1.05)#64 | 4.3%(+1.27)#6,163 |
| 65. | Nashua | 5.6% | 4.5%(+1.05)#65 | 4.3%(+1.27)#6,165 |
| 66. | Miles City | 5.5% | 4.5%(+0.987)#66 | 4.3%(+1.20)#6,288 |
| 67. | Whitefish | 5.5% | 4.5%(+0.967)#67 | 4.3%(+1.18)#6,324 |
| 68. | Red Lodge | 5.4% | 4.5%(+0.907)#68 | 4.3%(+1.12)#6,442 |
| 69. | Helena Valley Northeast | 5.4% | 4.5%(+0.898)#69 | 4.3%(+1.11)#6,470 |
| 70. | King Arthur Park | 5.4% | 4.5%(+0.867)#70 | 4.3%(+1.08)#6,541 |
| 71. | Butte Silver Bow Balance | 5.3% | 4.5%(+0.821)#71 | 4.3%(+1.04)#6,632 |
| 72. | Culbertson | 5.3% | 4.5%(+0.762)#72 | 4.3%(+0.977)#6,764 |
| 73. | Glendive | 5.2% | 4.5%(+0.703)#73 | 4.3%(+0.919)#6,909 |
| 74. | Dillon | 5.1% | 4.5%(+0.591)#74 | 4.3%(+0.806)#7,156 |
| 75. | Gildford | 5.1% | 4.5%(+0.584)#75 | 4.3%(+0.799)#7,180 |
| 76. | Missoula | 5.1% | 4.5%(+0.558)#76 | 4.3%(+0.773)#7,241 |
| 77. | Lolo | 5.0% | 4.5%(+0.534)#77 | 4.3%(+0.749)#7,306 |
| 78. | Helena | 5.0% | 4.5%(+0.495)#78 | 4.3%(+0.710)#7,371 |
| 79. | Shepherd | 4.9% | 4.5%(+0.377)#79 | 4.3%(+0.592)#7,616 |
| 80. | Great Falls | 4.8% | 4.5%(+0.334)#80 | 4.3%(+0.550)#7,734 |
| 81. | Havre | 4.8% | 4.5%(+0.320)#81 | 4.3%(+0.535)#7,773 |
| 82. | Pioneer Junction | 4.8% | 4.5%(+0.278)#82 | 4.3%(+0.493)#7,878 |
| 83. | Four Corners | 4.7% | 4.5%(+0.238)#83 | 4.3%(+0.453)#7,985 |
| 84. | Kalispell | 4.7% | 4.5%(+0.225)#84 | 4.3%(+0.440)#8,024 |
| 85. | Conrad | 4.5% | 4.5%(-0.026)#85 | 4.3%(+0.189)#8,692 |
| 86. | Wilsall | 4.4% | 4.5%(-0.089)#86 | 4.3%(+0.126)#8,875 |
| 87. | Lockwood | 4.3% | 4.5%(-0.173)#87 | 4.3%(+0.042)#9,119 |
| 88. | Columbia Falls | 4.2% | 4.5%(-0.283)#88 | 4.3%(-0.068)#9,420 |
| 89. | Fairfield | 4.2% | 4.5%(-0.310)#89 | 4.3%(-0.094)#9,498 |
| 90. | Superior | 4.2% | 4.5%(-0.320)#90 | 4.3%(-0.105)#9,530 |
| 91. | Tracy | 4.2% | 4.5%(-0.334)#91 | 4.3%(-0.119)#9,591 |
| 92. | Broadus | 4.2% | 4.5%(-0.350)#92 | 4.3%(-0.135)#9,625 |
| 93. | Willow Creek | 4.1% | 4.5%(-0.420)#93 | 4.3%(-0.204)#9,850 |
| 94. | Broadview | 4.1% | 4.5%(-0.436)#94 | 4.3%(-0.221)#9,906 |
| 95. | Belgrade | 4.0% | 4.5%(-0.465)#95 | 4.3%(-0.250)#9,999 |
| 96. | Elliston | 4.0% | 4.5%(-0.469)#96 | 4.3%(-0.254)#10,013 |
| 97. | Big Sandy | 4.0% | 4.5%(-0.489)#97 | 4.3%(-0.274)#10,069 |
| 98. | Bozeman | 4.0% | 4.5%(-0.496)#98 | 4.3%(-0.281)#10,087 |
| 99. | Browning | 4.0% | 4.5%(-0.501)#99 | 4.3%(-0.286)#10,102 |
| 100. | West Glendive | 4.0% | 4.5%(-0.520)#100 | 4.3%(-0.304)#10,166 |
Common Questions
What are the Top 10 Cities with the Highest Percentage of Population Employed in Health Technologists in Montana?
Top 10 Cities with the Highest Percentage of Population Employed in Health Technologists in Montana are:
#1
44.4%
#2
40.4%
#3
36.4%
#4
32.5%
#5
26.9%
#6
25.4%
#7
19.4%
#8
19.2%
#9
18.8%
#10
17.4%
What city has the Highest Percentage of Population Employed in Health Technologists in Montana?
Herron has the Highest Percentage of Population Employed in Health Technologists in Montana with 44.4%.
What is the Percentage of Population Employed in Health Technologists in the State of Montana?
Percentage of Population Employed in Health Technologists in Montana is 4.5%.
What is the Percentage of Population Employed in Health Technologists in the United States?
Percentage of Population Employed in Health Technologists in the United States is 4.3%.