Bozeman, MT Map & Demographics
Bozeman Map
Bozeman Overview
$45,037
PER CAPITA INCOME
$104,864
AVG FAMILY INCOME
$74,113
AVG HOUSEHOLD INCOME
37.4%
WAGE / INCOME GAP [ % ]
62.6¢/ $1
WAGE / INCOME GAP [ $ ]
$8,051
FAMILY INCOME DEFICIT
0.49
INEQUALITY / GINI INDEX
53,500
TOTAL POPULATION
28,338
MALE POPULATION
25,162
FEMALE POPULATION
112.62
MALES / 100 FEMALES
88.79
FEMALES / 100 MALES
28.2
MEDIAN AGE
2.7
AVG FAMILY SIZE
2.2
AVG HOUSEHOLD SIZE
33,648
LABOR FORCE [ PEOPLE ]
71.4%
PERCENT IN LABOR FORCE
2.8%
UNEMPLOYMENT RATE
Bozeman Area Codes
Income in Bozeman
Income Overview in Bozeman
Per Capita Income in Bozeman is $45,037, while median incomes of families and households are $104,864 and $74,113 respectively.
| Characteristic | Number | Measure |
| Per Capita Income | 53,500 | $45,037 |
| Median Family Income | 10,070 | $104,864 |
| Mean Family Income | 10,070 | $136,154 |
| Median Household Income | 22,041 | $74,113 |
| Mean Household Income | 22,041 | $106,862 |
| Income Deficit | 10,070 | $8,051 |
| Wage / Income Gap (%) | 53,500 | 37.37% |
| Wage / Income Gap ($) | 53,500 | 62.63¢ per $1 |
| Gini / Inequality Index | 53,500 | 0.49 |
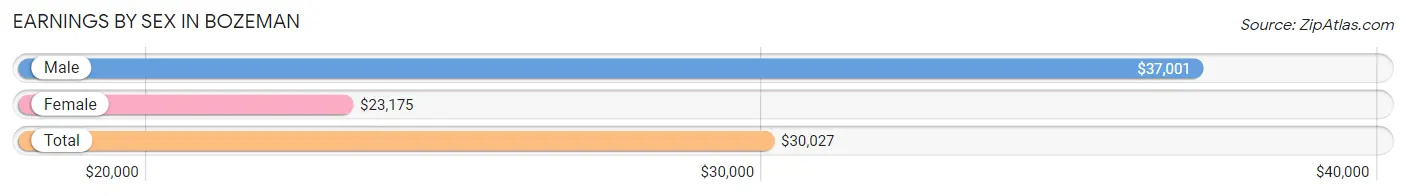
Earnings by Sex in Bozeman
Average Earnings in Bozeman are $30,027, $37,001 for men and $23,175 for women, a difference of 37.4%.
| Sex | Number | Average Earnings |
| Male | 21,018 (55.0%) | $37,001 |
| Female | 17,204 (45.0%) | $23,175 |
| Total | 38,222 (100.0%) | $30,027 |
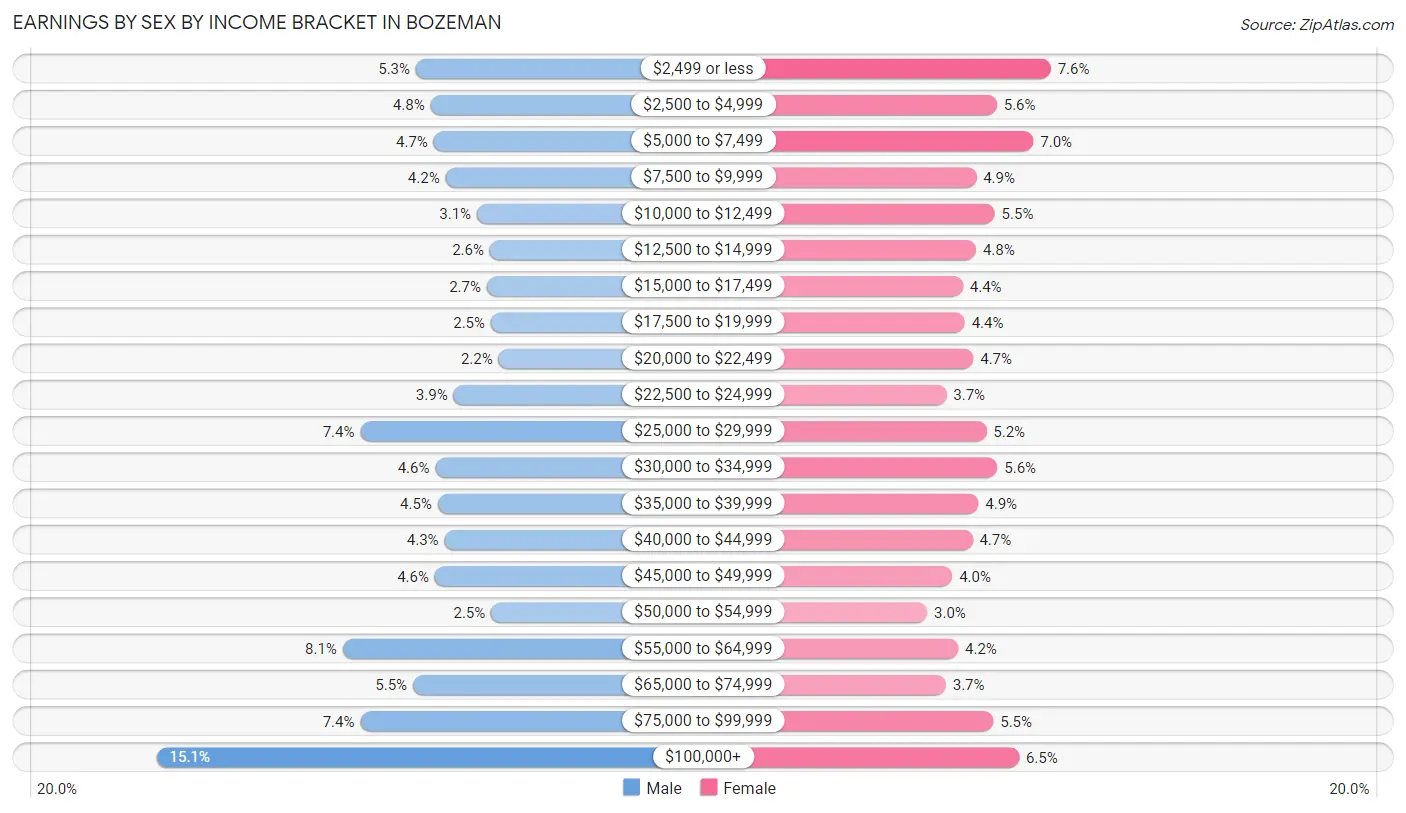
Earnings by Sex by Income Bracket in Bozeman
The most common earnings brackets in Bozeman are $100,000+ for men (3,164 | 15.0%) and $2,499 or less for women (1,315 | 7.6%).
| Income | Male | Female |
| $2,499 or less | 1,122 (5.3%) | 1,315 (7.6%) |
| $2,500 to $4,999 | 1,007 (4.8%) | 967 (5.6%) |
| $5,000 to $7,499 | 982 (4.7%) | 1,202 (7.0%) |
| $7,500 to $9,999 | 890 (4.2%) | 835 (4.9%) |
| $10,000 to $12,499 | 640 (3.0%) | 953 (5.5%) |
| $12,500 to $14,999 | 540 (2.6%) | 833 (4.8%) |
| $15,000 to $17,499 | 563 (2.7%) | 748 (4.3%) |
| $17,500 to $19,999 | 532 (2.5%) | 760 (4.4%) |
| $20,000 to $22,499 | 471 (2.2%) | 816 (4.7%) |
| $22,500 to $24,999 | 825 (3.9%) | 641 (3.7%) |
| $25,000 to $29,999 | 1,560 (7.4%) | 899 (5.2%) |
| $30,000 to $34,999 | 968 (4.6%) | 970 (5.6%) |
| $35,000 to $39,999 | 950 (4.5%) | 849 (4.9%) |
| $40,000 to $44,999 | 898 (4.3%) | 810 (4.7%) |
| $45,000 to $49,999 | 973 (4.6%) | 679 (4.0%) |
| $50,000 to $54,999 | 530 (2.5%) | 518 (3.0%) |
| $55,000 to $64,999 | 1,698 (8.1%) | 717 (4.2%) |
| $65,000 to $74,999 | 1,145 (5.4%) | 638 (3.7%) |
| $75,000 to $99,999 | 1,560 (7.4%) | 945 (5.5%) |
| $100,000+ | 3,164 (15.0%) | 1,109 (6.5%) |
| Total | 21,018 (100.0%) | 17,204 (100.0%) |
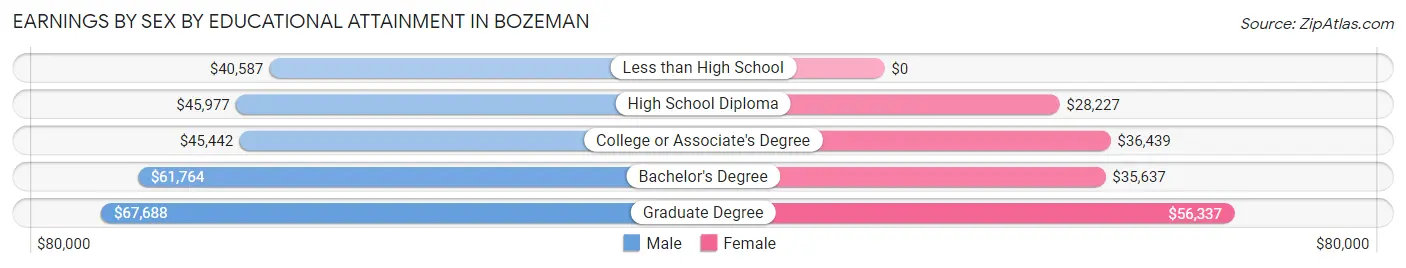
Earnings by Sex by Educational Attainment in Bozeman
Average earnings in Bozeman are $56,643 for men and $38,553 for women, a difference of 31.9%. Men with an educational attainment of graduate degree enjoy the highest average annual earnings of $67,688, while those with less than high school education earn the least with $40,587. Women with an educational attainment of graduate degree earn the most with the average annual earnings of $56,337, while those with high school diploma education have the smallest earnings of $28,227.
| Educational Attainment | Male Income | Female Income |
| Less than High School | $40,587 | $0 |
| High School Diploma | $45,977 | $28,227 |
| College or Associate's Degree | $45,442 | $36,439 |
| Bachelor's Degree | $61,764 | $35,637 |
| Graduate Degree | $67,688 | $56,337 |
| Total | $56,643 | $38,553 |
Family Income in Bozeman
Family Income Brackets in Bozeman
According to the Bozeman family income data, there are 2,779 families falling into the $100,000 to $149,999 income range, which is the most common income bracket and makes up 27.6% of all families. Conversely, the $10,000 to $14,999 income bracket is the least frequent group with only 30 families (0.3%) belonging to this category.
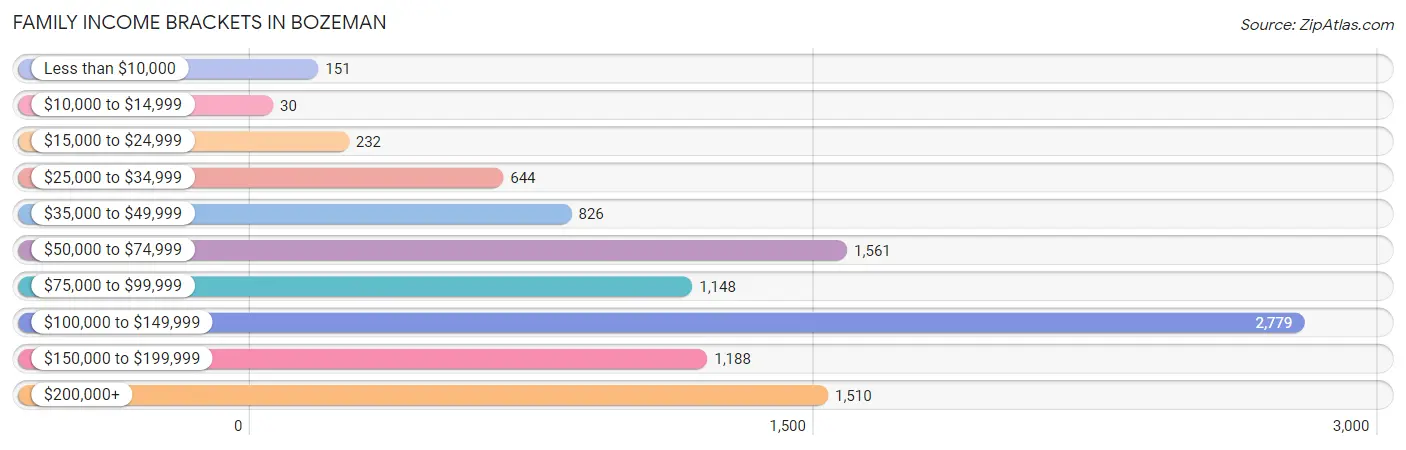
| Income Bracket | # Families | % Families |
| Less than $10,000 | 151 | 1.5% |
| $10,000 to $14,999 | 30 | 0.3% |
| $15,000 to $24,999 | 232 | 2.3% |
| $25,000 to $34,999 | 644 | 6.4% |
| $35,000 to $49,999 | 826 | 8.2% |
| $50,000 to $74,999 | 1,561 | 15.5% |
| $75,000 to $99,999 | 1,148 | 11.4% |
| $100,000 to $149,999 | 2,779 | 27.6% |
| $150,000 to $199,999 | 1,188 | 11.8% |
| $200,000+ | 1,510 | 15.0% |
Family Income by Famaliy Size in Bozeman
4-person families (1,542 | 15.3%) account for the highest median family income in Bozeman with $117,111 per family, while 2-person families (5,797 | 57.6%) have the highest median income of $51,132 per family member.
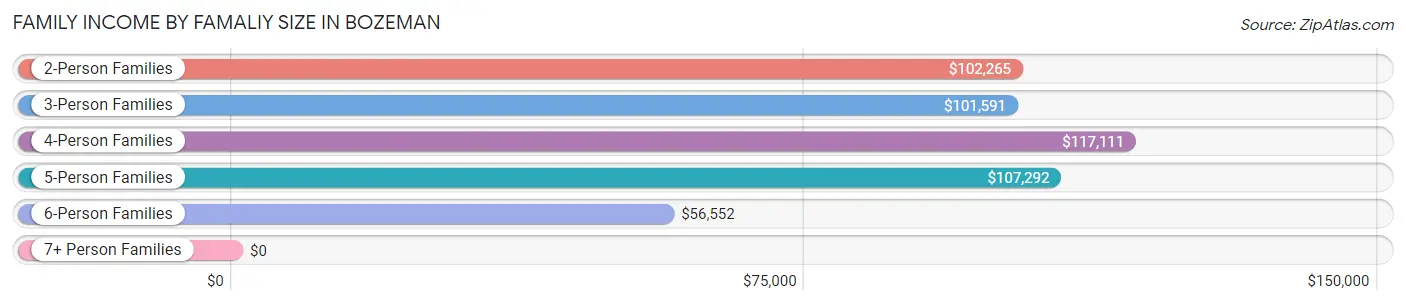
| Income Bracket | # Families | Median Income |
| 2-Person Families | 5,797 (57.6%) | $102,265 |
| 3-Person Families | 2,136 (21.2%) | $101,591 |
| 4-Person Families | 1,542 (15.3%) | $117,111 |
| 5-Person Families | 501 (5.0%) | $107,292 |
| 6-Person Families | 88 (0.9%) | $56,552 |
| 7+ Person Families | 6 (0.1%) | $0 |
| Total | 10,070 (100.0%) | $104,864 |
Family Income by Number of Earners in Bozeman
The median family income in Bozeman is $104,864, with families comprising 3+ earners (673) having the highest median family income of $175,402, while families with no earners (1,132) have the lowest median family income of $61,098, accounting for 6.7% and 11.2% of families, respectively.
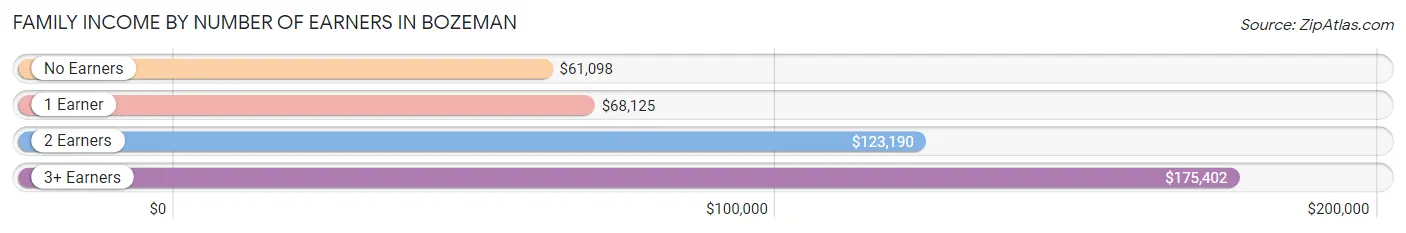
| Number of Earners | # Families | Median Income |
| No Earners | 1,132 (11.2%) | $61,098 |
| 1 Earner | 2,685 (26.7%) | $68,125 |
| 2 Earners | 5,580 (55.4%) | $123,190 |
| 3+ Earners | 673 (6.7%) | $175,402 |
| Total | 10,070 (100.0%) | $104,864 |
Household Income in Bozeman
Household Income Brackets in Bozeman
With 4,078 households falling in the category, the $100,000 to $149,999 income range is the most frequent in Bozeman, accounting for 18.5% of all households. In contrast, only 771 households (3.5%) fall into the $10,000 to $14,999 income bracket, making it the least populous group.
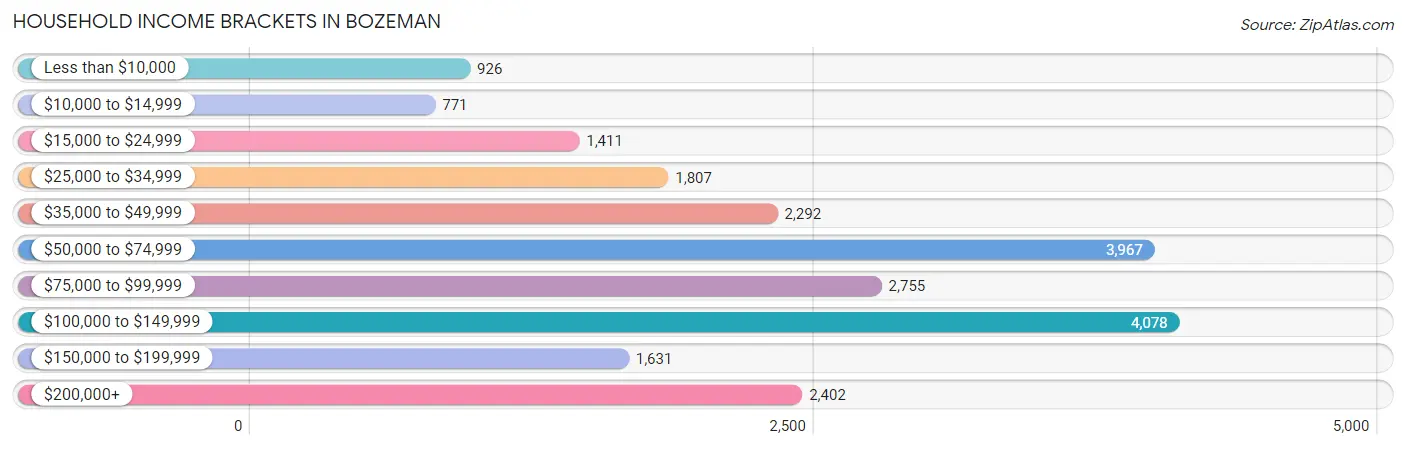
| Income Bracket | # Households | % Households |
| Less than $10,000 | 926 | 4.2% |
| $10,000 to $14,999 | 771 | 3.5% |
| $15,000 to $24,999 | 1,411 | 6.4% |
| $25,000 to $34,999 | 1,807 | 8.2% |
| $35,000 to $49,999 | 2,292 | 10.4% |
| $50,000 to $74,999 | 3,967 | 18.0% |
| $75,000 to $99,999 | 2,755 | 12.5% |
| $100,000 to $149,999 | 4,078 | 18.5% |
| $150,000 to $199,999 | 1,631 | 7.4% |
| $200,000+ | 2,402 | 10.9% |
Household Income by Householder Age in Bozeman
The median household income in Bozeman is $74,113, with the highest median household income of $101,368 found in the 45 to 64 years age bracket for the primary householder. A total of 5,143 households (23.3%) fall into this category. Meanwhile, the 15 to 24 years age bracket for the primary householder has the lowest median household income of $32,469, with 3,709 households (16.8%) in this group.
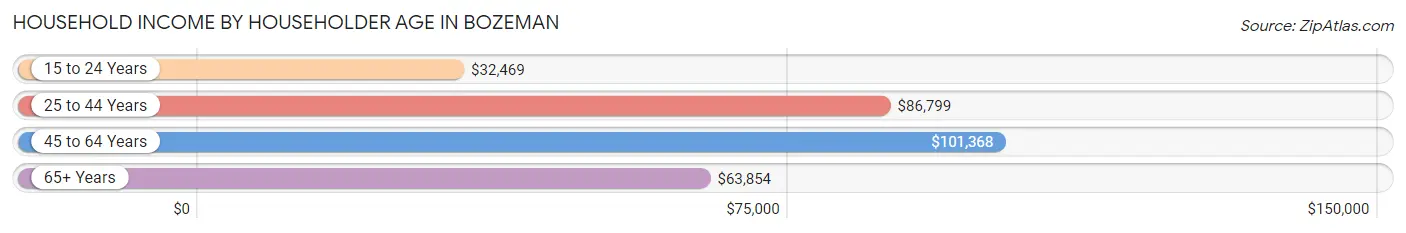
| Income Bracket | # Households | Median Income |
| 15 to 24 Years | 3,709 (16.8%) | $32,469 |
| 25 to 44 Years | 9,580 (43.5%) | $86,799 |
| 45 to 64 Years | 5,143 (23.3%) | $101,368 |
| 65+ Years | 3,609 (16.4%) | $63,854 |
| Total | 22,041 (100.0%) | $74,113 |
Poverty in Bozeman
Income Below Poverty by Sex and Age in Bozeman
With 14.0% poverty level for males and 15.5% for females among the residents of Bozeman, 18 to 24 year old males and 18 to 24 year old females are the most vulnerable to poverty, with 2,628 males (41.2%) and 2,380 females (45.5%) in their respective age groups living below the poverty level.
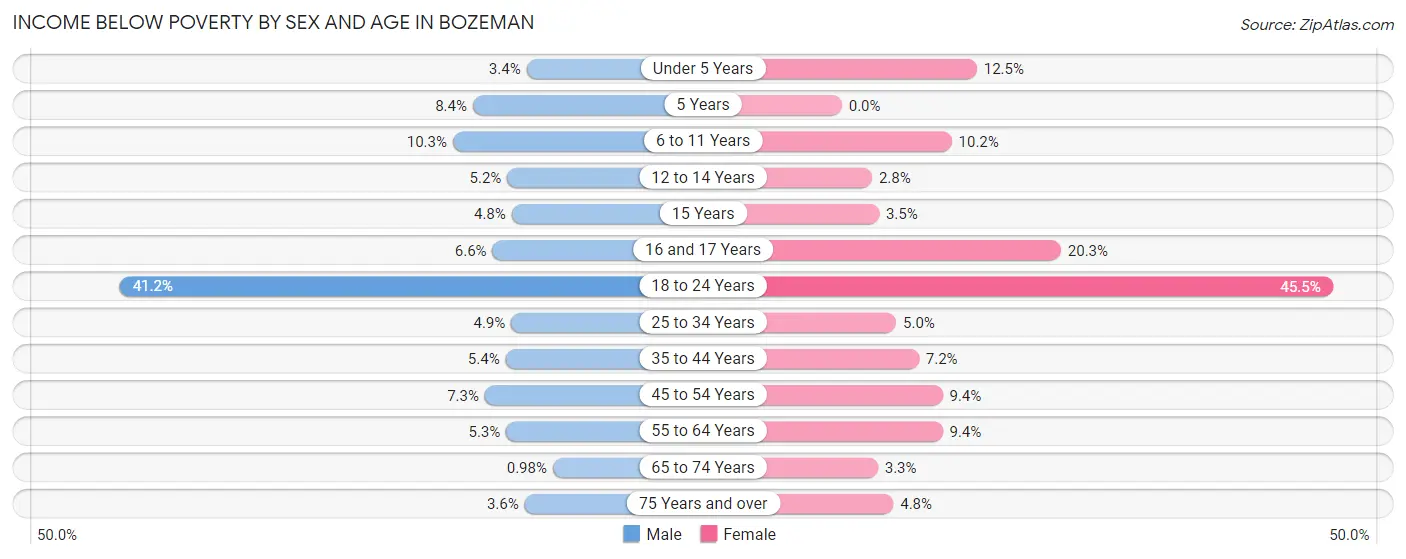
| Age Bracket | Male | Female |
| Under 5 Years | 32 (3.4%) | 106 (12.5%) |
| 5 Years | 11 (8.4%) | 0 (0.0%) |
| 6 to 11 Years | 148 (10.3%) | 108 (10.2%) |
| 12 to 14 Years | 30 (5.2%) | 16 (2.8%) |
| 15 Years | 11 (4.8%) | 8 (3.5%) |
| 16 and 17 Years | 25 (6.6%) | 49 (20.3%) |
| 18 to 24 Years | 2,628 (41.2%) | 2,380 (45.5%) |
| 25 to 34 Years | 309 (4.9%) | 250 (5.0%) |
| 35 to 44 Years | 173 (5.4%) | 193 (7.1%) |
| 45 to 54 Years | 181 (7.3%) | 208 (9.3%) |
| 55 to 64 Years | 89 (5.3%) | 159 (9.3%) |
| 65 to 74 Years | 15 (1.0%) | 59 (3.3%) |
| 75 Years and over | 34 (3.6%) | 63 (4.8%) |
| Total | 3,686 (14.0%) | 3,599 (15.5%) |
Income Above Poverty by Sex and Age in Bozeman
According to the poverty statistics in Bozeman, males aged 65 to 74 years and females aged 5 years are the age groups that are most secure financially, with 99.0% of males and 100.0% of females in these age groups living above the poverty line.
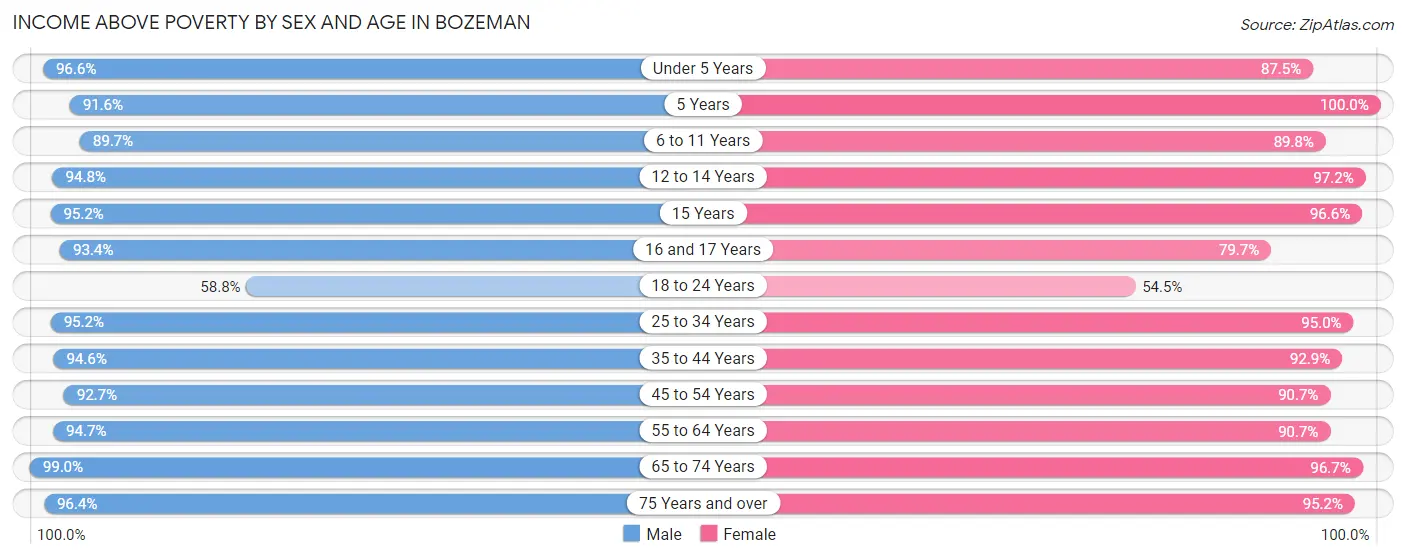
| Age Bracket | Male | Female |
| Under 5 Years | 904 (96.6%) | 740 (87.5%) |
| 5 Years | 120 (91.6%) | 323 (100.0%) |
| 6 to 11 Years | 1,295 (89.7%) | 952 (89.8%) |
| 12 to 14 Years | 546 (94.8%) | 555 (97.2%) |
| 15 Years | 218 (95.2%) | 224 (96.6%) |
| 16 and 17 Years | 355 (93.4%) | 192 (79.7%) |
| 18 to 24 Years | 3,756 (58.8%) | 2,846 (54.5%) |
| 25 to 34 Years | 6,068 (95.2%) | 4,713 (95.0%) |
| 35 to 44 Years | 3,050 (94.6%) | 2,505 (92.8%) |
| 45 to 54 Years | 2,302 (92.7%) | 2,017 (90.6%) |
| 55 to 64 Years | 1,588 (94.7%) | 1,541 (90.6%) |
| 65 to 74 Years | 1,512 (99.0%) | 1,710 (96.7%) |
| 75 Years and over | 910 (96.4%) | 1,255 (95.2%) |
| Total | 22,624 (86.0%) | 19,573 (84.5%) |
Income Below Poverty Among Married-Couple Families in Bozeman
The poverty statistics for married-couple families in Bozeman show that 1.5% or 123 of the total 7,964 families live below the poverty line. Families with 3 or 4 children have the highest poverty rate of 13.3%, comprising of 61 families. On the other hand, families with 5 or more children have the lowest poverty rate of 0.0%, which includes 0 families.
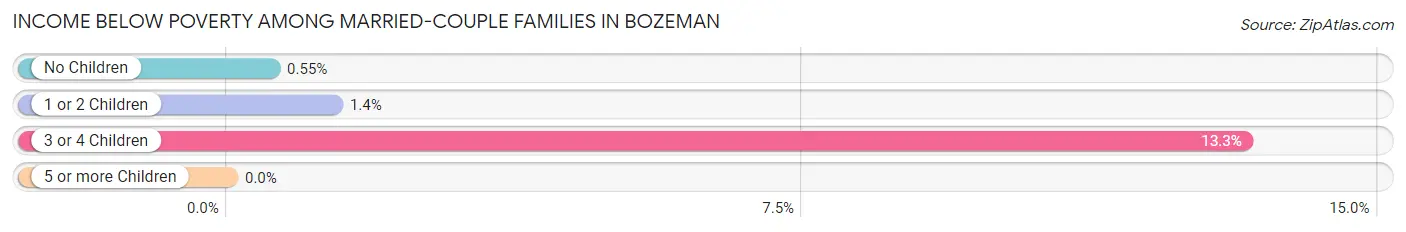
| Children | Above Poverty | Below Poverty |
| No Children | 4,920 (99.5%) | 27 (0.5%) |
| 1 or 2 Children | 2,516 (98.6%) | 35 (1.4%) |
| 3 or 4 Children | 399 (86.7%) | 61 (13.3%) |
| 5 or more Children | 6 (100.0%) | 0 (0.0%) |
| Total | 7,841 (98.5%) | 123 (1.5%) |
Income Below Poverty Among Single-Parent Households in Bozeman
According to the poverty data in Bozeman, 8.1% or 63 single-father households and 13.8% or 183 single-mother households are living below the poverty line. Among single-father households, those with 1 or 2 children have the highest poverty rate, with 33 households (11.4%) experiencing poverty. Likewise, among single-mother households, those with 3 or 4 children have the highest poverty rate, with 21 households (31.3%) falling below the poverty line.
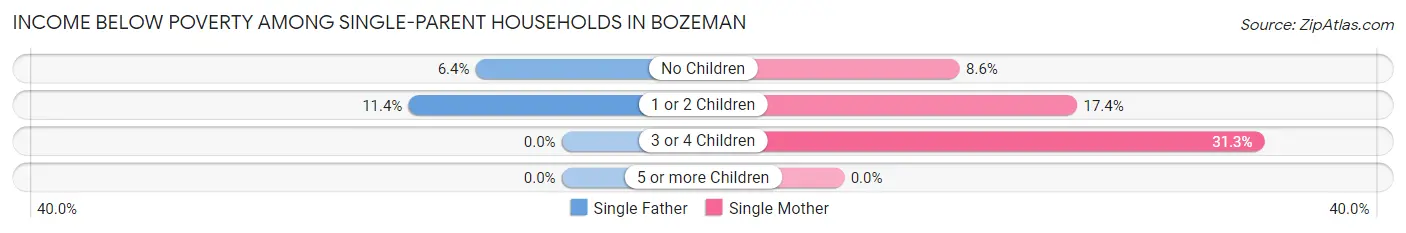
| Children | Single Father | Single Mother |
| No Children | 30 (6.4%) | 56 (8.6%) |
| 1 or 2 Children | 33 (11.4%) | 106 (17.3%) |
| 3 or 4 Children | 0 (0.0%) | 21 (31.3%) |
| 5 or more Children | 0 (0.0%) | 0 (0.0%) |
| Total | 63 (8.1%) | 183 (13.8%) |
Income Below Poverty Among Married-Couple vs Single-Parent Households in Bozeman
The poverty data for Bozeman shows that 123 of the married-couple family households (1.5%) and 246 of the single-parent households (11.7%) are living below the poverty level. Within the married-couple family households, those with 3 or 4 children have the highest poverty rate, with 61 households (13.3%) falling below the poverty line. Among the single-parent households, those with 3 or 4 children have the highest poverty rate, with 21 household (23.9%) living below poverty.
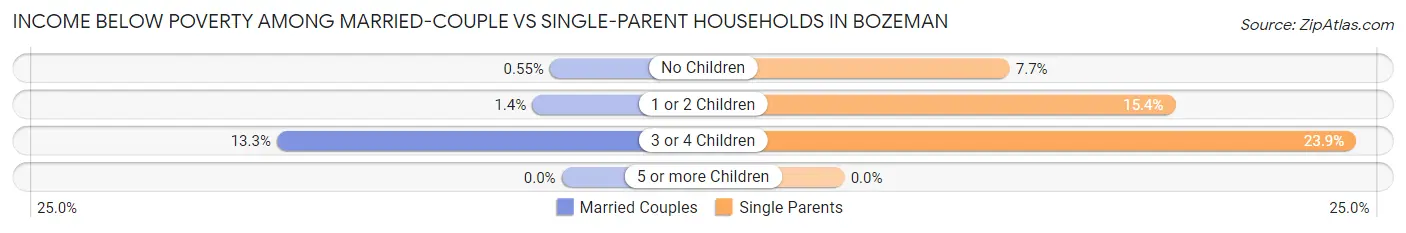
| Children | Married-Couple Families | Single-Parent Households |
| No Children | 27 (0.5%) | 86 (7.7%) |
| 1 or 2 Children | 35 (1.4%) | 139 (15.4%) |
| 3 or 4 Children | 61 (13.3%) | 21 (23.9%) |
| 5 or more Children | 0 (0.0%) | 0 (0.0%) |
| Total | 123 (1.5%) | 246 (11.7%) |
Race in Bozeman
The most populous races in Bozeman are White / Caucasian (47,398 | 88.6%), Two or more Races (2,995 | 5.6%), and Hispanic or Latino (2,572 | 4.8%).
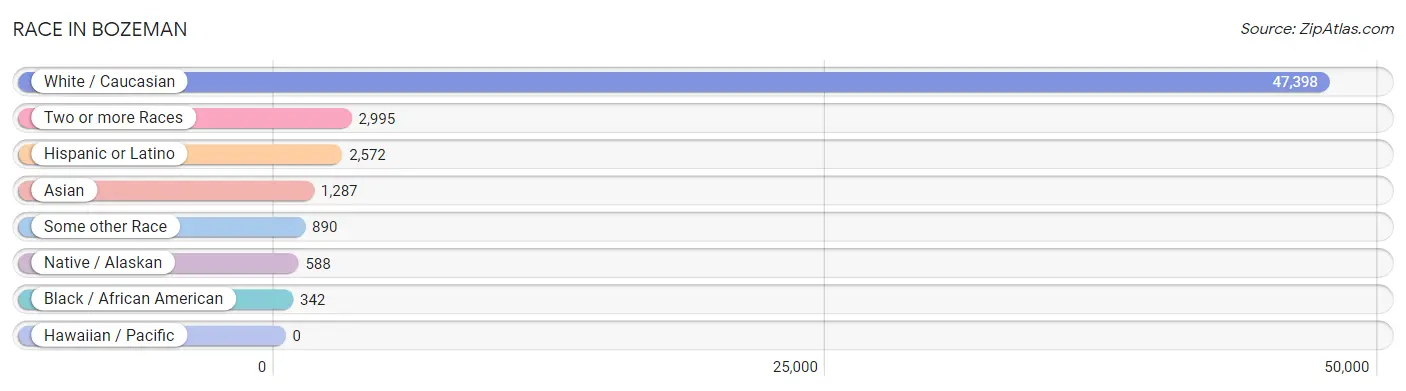
| Race | # Population | % Population |
| Asian | 1,287 | 2.4% |
| Black / African American | 342 | 0.6% |
| Hawaiian / Pacific | 0 | 0.0% |
| Hispanic or Latino | 2,572 | 4.8% |
| Native / Alaskan | 588 | 1.1% |
| White / Caucasian | 47,398 | 88.6% |
| Two or more Races | 2,995 | 5.6% |
| Some other Race | 890 | 1.7% |
| Total | 53,500 | 100.0% |
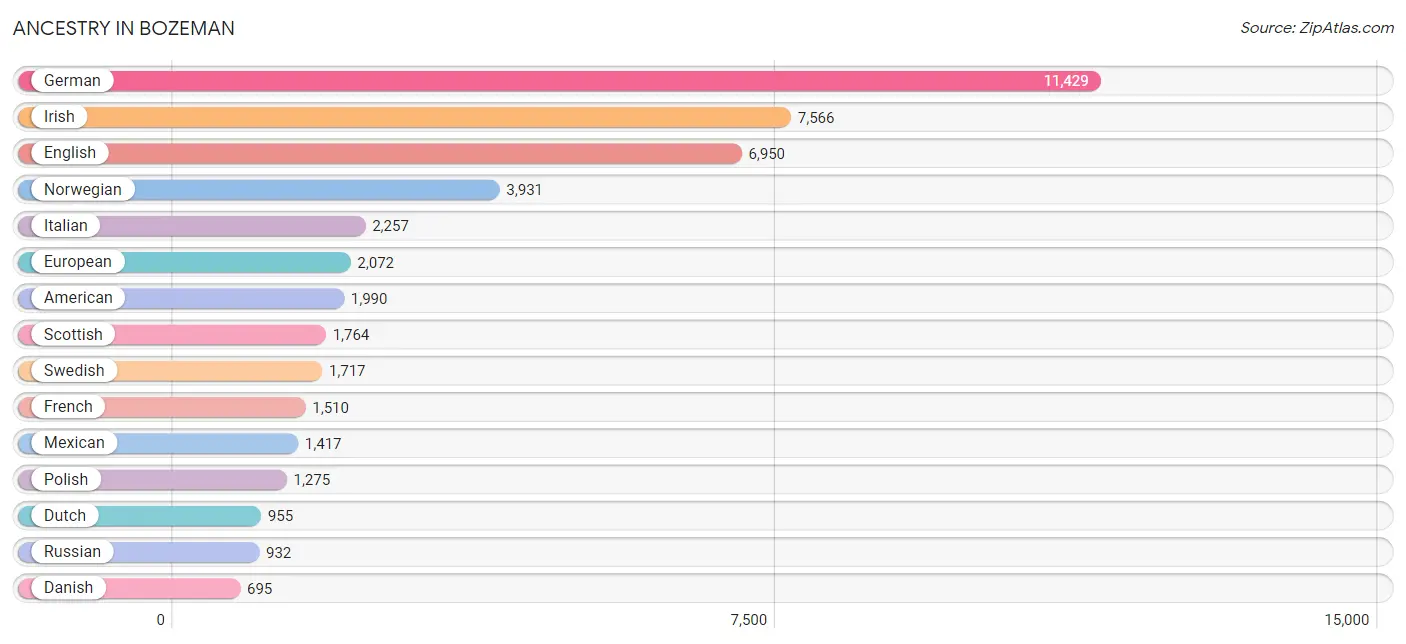
Ancestry in Bozeman
The most populous ancestries reported in Bozeman are German (11,429 | 21.4%), Irish (7,566 | 14.1%), English (6,950 | 13.0%), Norwegian (3,931 | 7.3%), and Italian (2,257 | 4.2%), together accounting for 60.1% of all Bozeman residents.
| Ancestry | # Population | % Population |
| African | 25 | 0.1% |
| American | 1,990 | 3.7% |
| Apache | 148 | 0.3% |
| Arab | 134 | 0.3% |
| Argentinean | 24 | 0.0% |
| Armenian | 29 | 0.1% |
| Australian | 83 | 0.2% |
| Austrian | 258 | 0.5% |
| Basque | 30 | 0.1% |
| Belgian | 87 | 0.2% |
| Bhutanese | 243 | 0.4% |
| Blackfeet | 116 | 0.2% |
| Bolivian | 9 | 0.0% |
| Brazilian | 32 | 0.1% |
| British | 311 | 0.6% |
| Bulgarian | 72 | 0.1% |
| Burmese | 45 | 0.1% |
| Canadian | 100 | 0.2% |
| Celtic | 9 | 0.0% |
| Central American | 41 | 0.1% |
| Cherokee | 276 | 0.5% |
| Cheyenne | 10 | 0.0% |
| Chilean | 7 | 0.0% |
| Chippewa | 85 | 0.2% |
| Choctaw | 23 | 0.0% |
| Colombian | 58 | 0.1% |
| Colville | 2 | 0.0% |
| Costa Rican | 25 | 0.1% |
| Cree | 16 | 0.0% |
| Creek | 10 | 0.0% |
| Croatian | 66 | 0.1% |
| Crow | 40 | 0.1% |
| Cuban | 125 | 0.2% |
| Cypriot | 30 | 0.1% |
| Czech | 307 | 0.6% |
| Czechoslovakian | 91 | 0.2% |
| Danish | 695 | 1.3% |
| Dutch | 955 | 1.8% |
| Eastern European | 345 | 0.6% |
| Ecuadorian | 12 | 0.0% |
| English | 6,950 | 13.0% |
| Ethiopian | 150 | 0.3% |
| European | 2,072 | 3.9% |
| Filipino | 45 | 0.1% |
| Finnish | 124 | 0.2% |
| French | 1,510 | 2.8% |
| French American Indian | 62 | 0.1% |
| French Canadian | 248 | 0.5% |
| German | 11,429 | 21.4% |
| Greek | 153 | 0.3% |
| Guatemalan | 7 | 0.0% |
| Honduran | 9 | 0.0% |
| Hungarian | 295 | 0.5% |
| Icelander | 28 | 0.1% |
| Indian (Asian) | 649 | 1.2% |
| Iranian | 15 | 0.0% |
| Irish | 7,566 | 14.1% |
| Israeli | 34 | 0.1% |
| Italian | 2,257 | 4.2% |
| Korean | 362 | 0.7% |
| Laotian | 11 | 0.0% |
| Latvian | 47 | 0.1% |
| Lebanese | 96 | 0.2% |
| Lithuanian | 167 | 0.3% |
| Luxembourger | 9 | 0.0% |
| Macedonian | 19 | 0.0% |
| Mexican | 1,417 | 2.6% |
| Native Hawaiian | 109 | 0.2% |
| Navajo | 31 | 0.1% |
| Northern European | 673 | 1.3% |
| Norwegian | 3,931 | 7.3% |
| Ottawa | 70 | 0.1% |
| Pakistani | 10 | 0.0% |
| Pennsylvania German | 6 | 0.0% |
| Peruvian | 63 | 0.1% |
| Polish | 1,275 | 2.4% |
| Portuguese | 59 | 0.1% |
| Pueblo | 19 | 0.0% |
| Puerto Rican | 224 | 0.4% |
| Puget Sound Salish | 13 | 0.0% |
| Romanian | 67 | 0.1% |
| Russian | 932 | 1.7% |
| Samoan | 32 | 0.1% |
| Scandinavian | 468 | 0.9% |
| Scotch-Irish | 468 | 0.9% |
| Scottish | 1,764 | 3.3% |
| Serbian | 166 | 0.3% |
| Shoshone | 30 | 0.1% |
| Sioux | 56 | 0.1% |
| Slavic | 23 | 0.0% |
| Slovak | 71 | 0.1% |
| Slovene | 52 | 0.1% |
| South African | 25 | 0.1% |
| South American | 230 | 0.4% |
| Spaniard | 64 | 0.1% |
| Spanish | 148 | 0.3% |
| Sri Lankan | 23 | 0.0% |
| Subsaharan African | 260 | 0.5% |
| Swedish | 1,717 | 3.2% |
| Swiss | 317 | 0.6% |
| Syrian | 21 | 0.0% |
| Thai | 332 | 0.6% |
| Tongan | 32 | 0.1% |
| Turkish | 119 | 0.2% |
| Ukrainian | 373 | 0.7% |
| Ute | 124 | 0.2% |
| Venezuelan | 57 | 0.1% |
| Vietnamese | 3 | 0.0% |
| Welsh | 542 | 1.0% |
| West Indian | 36 | 0.1% |
| Yugoslavian | 63 | 0.1% |
| Zimbabwean | 15 | 0.0% | View All 112 Rows |
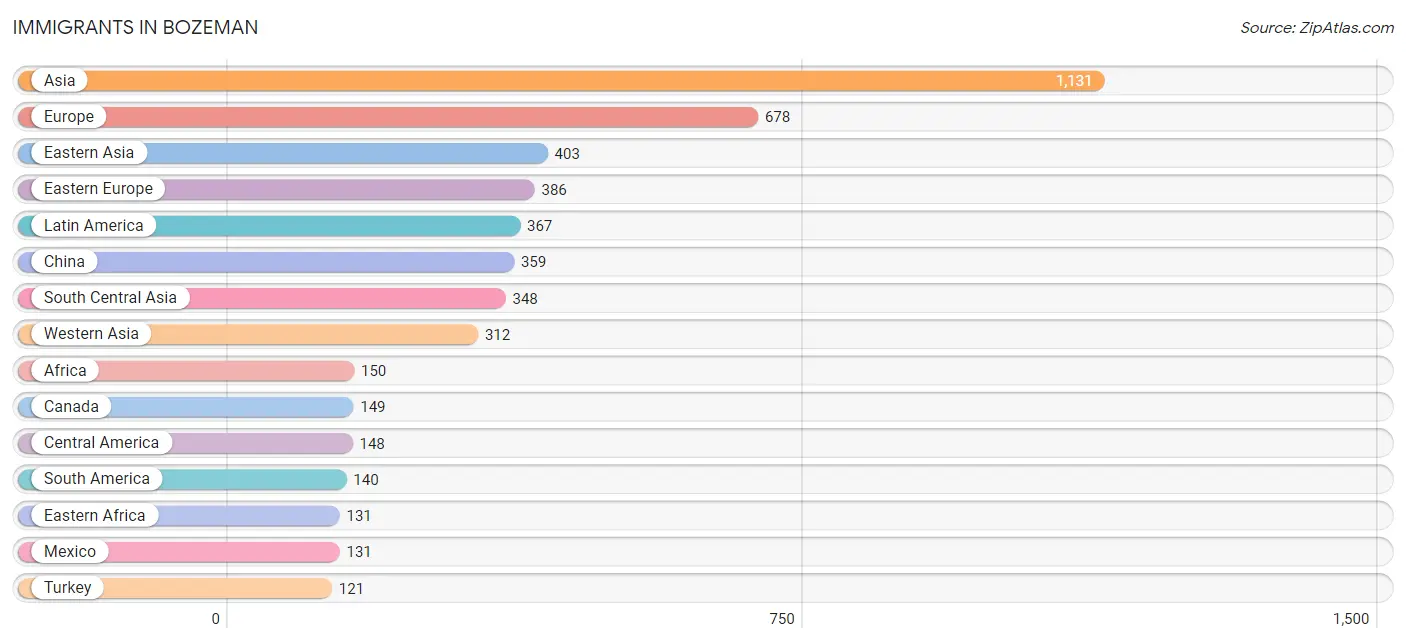
Immigrants in Bozeman
The most numerous immigrant groups reported in Bozeman came from Asia (1,131 | 2.1%), Europe (678 | 1.3%), Eastern Asia (403 | 0.7%), Eastern Europe (386 | 0.7%), and Latin America (367 | 0.7%), together accounting for 5.5% of all Bozeman residents.
| Immigration Origin | # Population | % Population |
| Africa | 150 | 0.3% |
| Asia | 1,131 | 2.1% |
| Bangladesh | 3 | 0.0% |
| Brazil | 20 | 0.0% |
| Canada | 149 | 0.3% |
| Caribbean | 79 | 0.2% |
| Central America | 148 | 0.3% |
| China | 359 | 0.7% |
| Colombia | 38 | 0.1% |
| Costa Rica | 10 | 0.0% |
| Cuba | 26 | 0.1% |
| Dominican Republic | 53 | 0.1% |
| Eastern Africa | 131 | 0.2% |
| Eastern Asia | 403 | 0.7% |
| Eastern Europe | 386 | 0.7% |
| England | 21 | 0.0% |
| Ethiopia | 82 | 0.2% |
| Europe | 678 | 1.3% |
| France | 13 | 0.0% |
| Germany | 68 | 0.1% |
| Greece | 10 | 0.0% |
| Guatemala | 7 | 0.0% |
| Guyana | 77 | 0.1% |
| Hungary | 7 | 0.0% |
| India | 90 | 0.2% |
| Iran | 26 | 0.1% |
| Ireland | 17 | 0.0% |
| Israel | 46 | 0.1% |
| Italy | 45 | 0.1% |
| Japan | 31 | 0.1% |
| Korea | 13 | 0.0% |
| Latin America | 367 | 0.7% |
| Latvia | 26 | 0.1% |
| Lithuania | 6 | 0.0% |
| Mexico | 131 | 0.2% |
| Nepal | 101 | 0.2% |
| Netherlands | 20 | 0.0% |
| Northern Europe | 120 | 0.2% |
| Pakistan | 4 | 0.0% |
| Philippines | 48 | 0.1% |
| Poland | 112 | 0.2% |
| Russia | 94 | 0.2% |
| Saudi Arabia | 58 | 0.1% |
| Singapore | 10 | 0.0% |
| South Africa | 16 | 0.0% |
| South America | 140 | 0.3% |
| South Central Asia | 348 | 0.6% |
| South Eastern Asia | 68 | 0.1% |
| Southern Europe | 67 | 0.1% |
| Spain | 12 | 0.0% |
| Sri Lanka | 83 | 0.2% |
| Switzerland | 4 | 0.0% |
| Taiwan | 57 | 0.1% |
| Thailand | 10 | 0.0% |
| Turkey | 121 | 0.2% |
| Ukraine | 82 | 0.2% |
| Venezuela | 5 | 0.0% |
| Western Africa | 3 | 0.0% |
| Western Asia | 312 | 0.6% |
| Western Europe | 105 | 0.2% |
| Zimbabwe | 15 | 0.0% | View All 61 Rows |
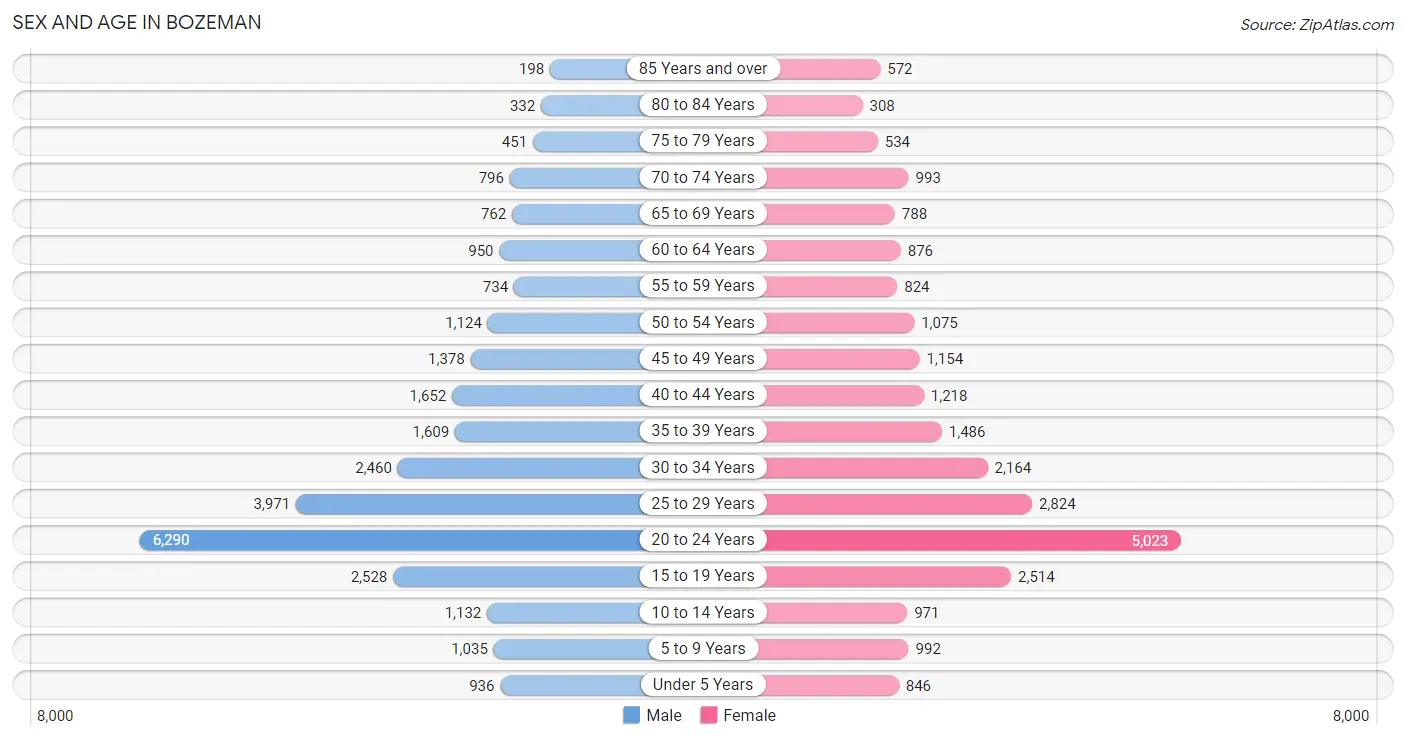
Sex and Age in Bozeman
Sex and Age in Bozeman
The most populous age groups in Bozeman are 20 to 24 Years (6,290 | 22.2%) for men and 20 to 24 Years (5,023 | 20.0%) for women.
| Age Bracket | Male | Female |
| Under 5 Years | 936 (3.3%) | 846 (3.4%) |
| 5 to 9 Years | 1,035 (3.6%) | 992 (3.9%) |
| 10 to 14 Years | 1,132 (4.0%) | 971 (3.9%) |
| 15 to 19 Years | 2,528 (8.9%) | 2,514 (10.0%) |
| 20 to 24 Years | 6,290 (22.2%) | 5,023 (20.0%) |
| 25 to 29 Years | 3,971 (14.0%) | 2,824 (11.2%) |
| 30 to 34 Years | 2,460 (8.7%) | 2,164 (8.6%) |
| 35 to 39 Years | 1,609 (5.7%) | 1,486 (5.9%) |
| 40 to 44 Years | 1,652 (5.8%) | 1,218 (4.8%) |
| 45 to 49 Years | 1,378 (4.9%) | 1,154 (4.6%) |
| 50 to 54 Years | 1,124 (4.0%) | 1,075 (4.3%) |
| 55 to 59 Years | 734 (2.6%) | 824 (3.3%) |
| 60 to 64 Years | 950 (3.4%) | 876 (3.5%) |
| 65 to 69 Years | 762 (2.7%) | 788 (3.1%) |
| 70 to 74 Years | 796 (2.8%) | 993 (4.0%) |
| 75 to 79 Years | 451 (1.6%) | 534 (2.1%) |
| 80 to 84 Years | 332 (1.2%) | 308 (1.2%) |
| 85 Years and over | 198 (0.7%) | 572 (2.3%) |
| Total | 28,338 (100.0%) | 25,162 (100.0%) |
Families and Households in Bozeman
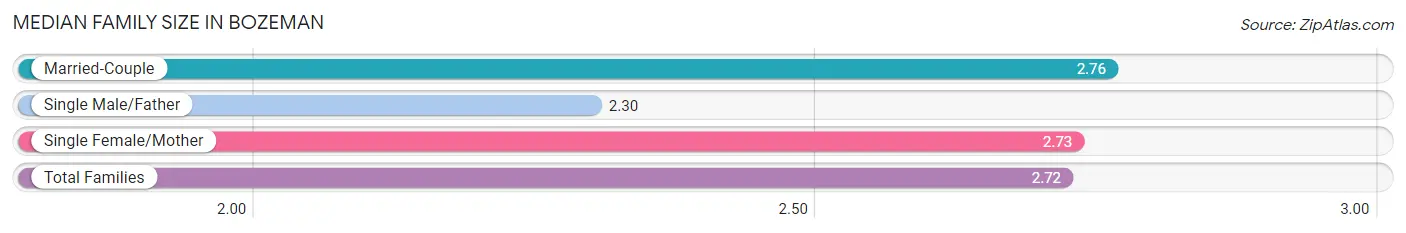
Median Family Size in Bozeman
The median family size in Bozeman is 2.72 persons per family, with married-couple families (7,964 | 79.1%) accounting for the largest median family size of 2.76 persons per family. On the other hand, single male/father families (777 | 7.7%) represent the smallest median family size with 2.30 persons per family.
| Family Type | # Families | Family Size |
| Married-Couple | 7,964 (79.1%) | 2.76 |
| Single Male/Father | 777 (7.7%) | 2.30 |
| Single Female/Mother | 1,329 (13.2%) | 2.73 |
| Total Families | 10,070 (100.0%) | 2.72 |
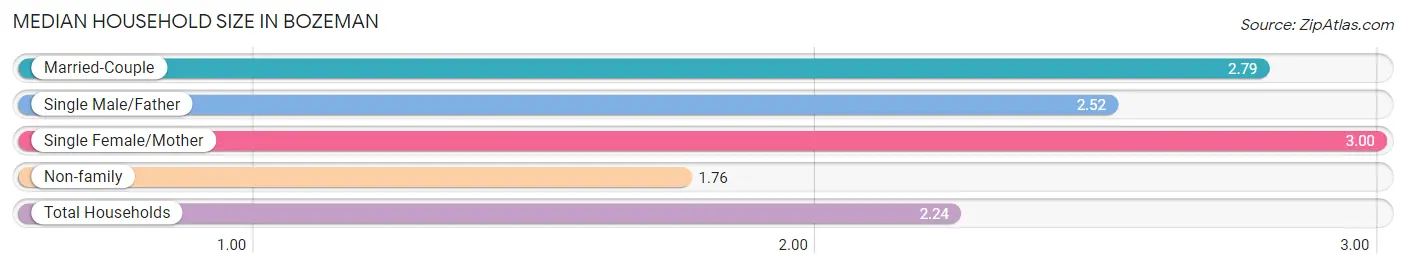
Median Household Size in Bozeman
The median household size in Bozeman is 2.24 persons per household, with single female/mother households (1,329 | 6.0%) accounting for the largest median household size of 3 persons per household. non-family households (11,971 | 54.3%) represent the smallest median household size with 1.76 persons per household.
| Household Type | # Households | Household Size |
| Married-Couple | 7,964 (36.1%) | 2.79 |
| Single Male/Father | 777 (3.5%) | 2.52 |
| Single Female/Mother | 1,329 (6.0%) | 3.00 |
| Non-family | 11,971 (54.3%) | 1.76 |
| Total Households | 22,041 (100.0%) | 2.24 |
Household Size by Marriage Status in Bozeman
Out of a total of 22,041 households in Bozeman, 10,070 (45.7%) are family households, while 11,971 (54.3%) are nonfamily households. The most numerous type of family households are 2-person households, comprising 5,236, and the most common type of nonfamily households are 1-person households, comprising 6,324.
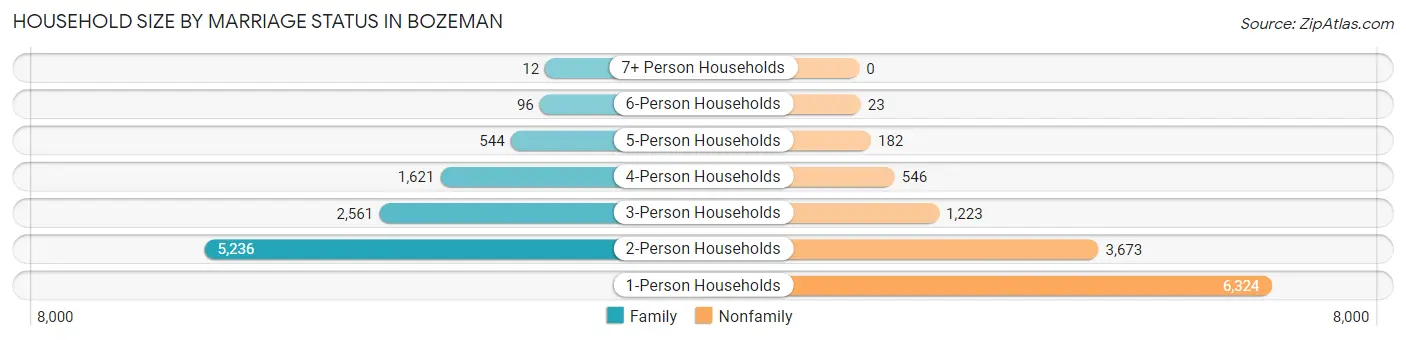
| Household Size | Family Households | Nonfamily Households |
| 1-Person Households | - | 6,324 (28.7%) |
| 2-Person Households | 5,236 (23.8%) | 3,673 (16.7%) |
| 3-Person Households | 2,561 (11.6%) | 1,223 (5.6%) |
| 4-Person Households | 1,621 (7.3%) | 546 (2.5%) |
| 5-Person Households | 544 (2.5%) | 182 (0.8%) |
| 6-Person Households | 96 (0.4%) | 23 (0.1%) |
| 7+ Person Households | 12 (0.1%) | 0 (0.0%) |
| Total | 10,070 (45.7%) | 11,971 (54.3%) |
Female Fertility in Bozeman
Fertility by Age in Bozeman
Average fertility rate in Bozeman is 26.0 births per 1,000 women. Women in the age bracket of 20 to 34 years have the highest fertility rate with 33.0 births per 1,000 women. Women in the age bracket of 20 to 34 years acount for 76.2% of all women with births.
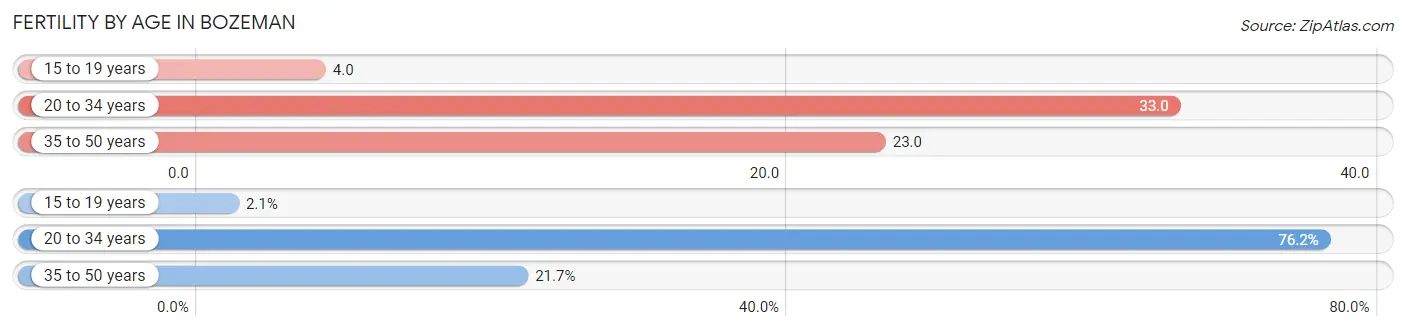
| Age Bracket | Women with Births | Births / 1,000 Women |
| 15 to 19 years | 9 (2.1%) | 4.0 |
| 20 to 34 years | 326 (76.2%) | 33.0 |
| 35 to 50 years | 93 (21.7%) | 23.0 |
| Total | 428 (100.0%) | 26.0 |
Fertility by Age by Marriage Status in Bozeman
97.9% of women with births (428) in Bozeman are married. The highest percentage of unmarried women with births falls into 15 to 19 years age bracket with 100.0% of them unmarried at the time of birth, while the lowest percentage of unmarried women with births belong to 20 to 34 years age bracket with 0.0% of them unmarried.
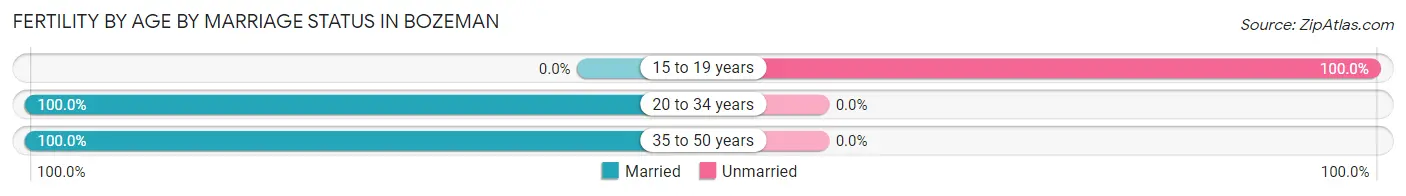
| Age Bracket | Married | Unmarried |
| 15 to 19 years | 0 (0.0%) | 9 (100.0%) |
| 20 to 34 years | 326 (100.0%) | 0 (0.0%) |
| 35 to 50 years | 93 (100.0%) | 0 (0.0%) |
| Total | 419 (97.9%) | 9 (2.1%) |
Fertility by Education in Bozeman
Average fertility rate in Bozeman is 26.0 births per 1,000 women. Women with the education attainment of graduate degree have the highest fertility rate of 50.0 births per 1,000 women, while women with the education attainment of less than high school have the lowest fertility at 11.0 births per 1,000 women. Women with the education attainment of bachelor's degree represent 37.9% of all women with births.
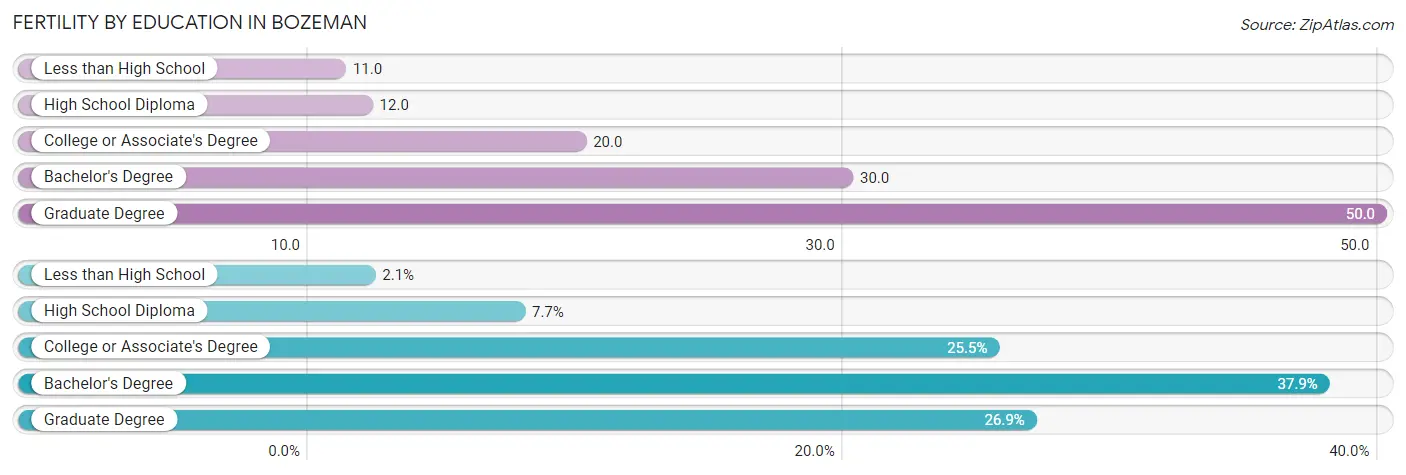
| Educational Attainment | Women with Births | Births / 1,000 Women |
| Less than High School | 9 (2.1%) | 11.0 |
| High School Diploma | 33 (7.7%) | 12.0 |
| College or Associate's Degree | 109 (25.5%) | 20.0 |
| Bachelor's Degree | 162 (37.9%) | 30.0 |
| Graduate Degree | 115 (26.9%) | 50.0 |
| Total | 428 (100.0%) | 26.0 |
Fertility by Education by Marriage Status in Bozeman
2.1% of women with births in Bozeman are unmarried. Women with the educational attainment of high school diploma are most likely to be married with 100.0% of them married at childbirth, while women with the educational attainment of less than high school are least likely to be married with 100.0% of them unmarried at childbirth.
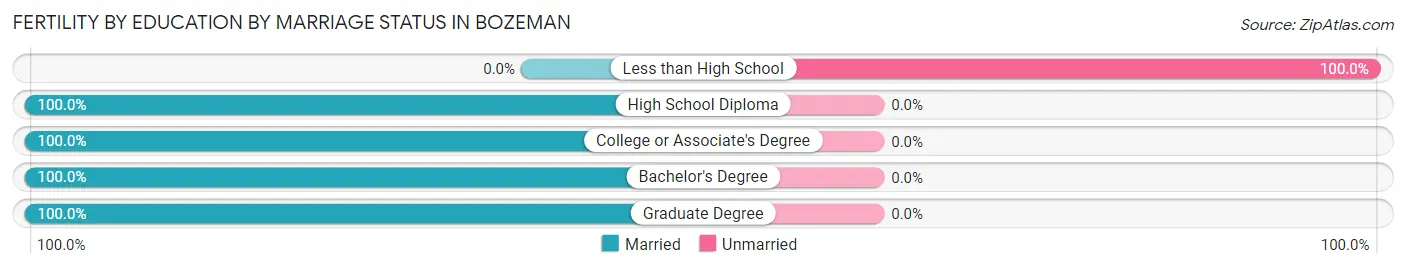
| Educational Attainment | Married | Unmarried |
| Less than High School | 0 (0.0%) | 9 (100.0%) |
| High School Diploma | 33 (100.0%) | 0 (0.0%) |
| College or Associate's Degree | 109 (100.0%) | 0 (0.0%) |
| Bachelor's Degree | 162 (100.0%) | 0 (0.0%) |
| Graduate Degree | 115 (100.0%) | 0 (0.0%) |
| Total | 419 (97.9%) | 9 (2.1%) |
Employment Characteristics in Bozeman
Employment by Class of Employer in Bozeman
Among the 31,532 employed individuals in Bozeman, private company employees (18,806 | 59.6%), state government employees (3,542 | 11.2%), and not-for-profit organizations (3,520 | 11.2%) make up the most common classes of employment.
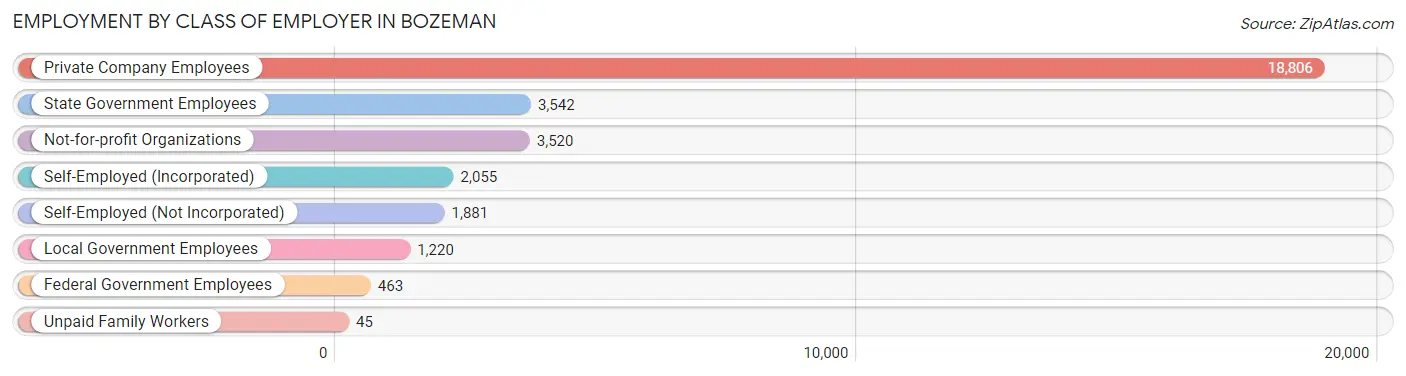
| Employer Class | # Employees | % Employees |
| Private Company Employees | 18,806 | 59.6% |
| Self-Employed (Incorporated) | 2,055 | 6.5% |
| Self-Employed (Not Incorporated) | 1,881 | 6.0% |
| Not-for-profit Organizations | 3,520 | 11.2% |
| Local Government Employees | 1,220 | 3.9% |
| State Government Employees | 3,542 | 11.2% |
| Federal Government Employees | 463 | 1.5% |
| Unpaid Family Workers | 45 | 0.1% |
| Total | 31,532 | 100.0% |
Employment Status by Age in Bozeman
According to the labor force statistics for Bozeman, out of the total population over 16 years of age (47,126), 71.4% or 33,648 individuals are in the labor force, with 2.8% or 942 of them unemployed. The age group with the highest labor force participation rate is 30 to 34 years, with 95.3% or 4,407 individuals in the labor force. Within the labor force, the 16 to 19 years age range has the highest percentage of unemployed individuals, with 15.4% or 319 of them being unemployed.
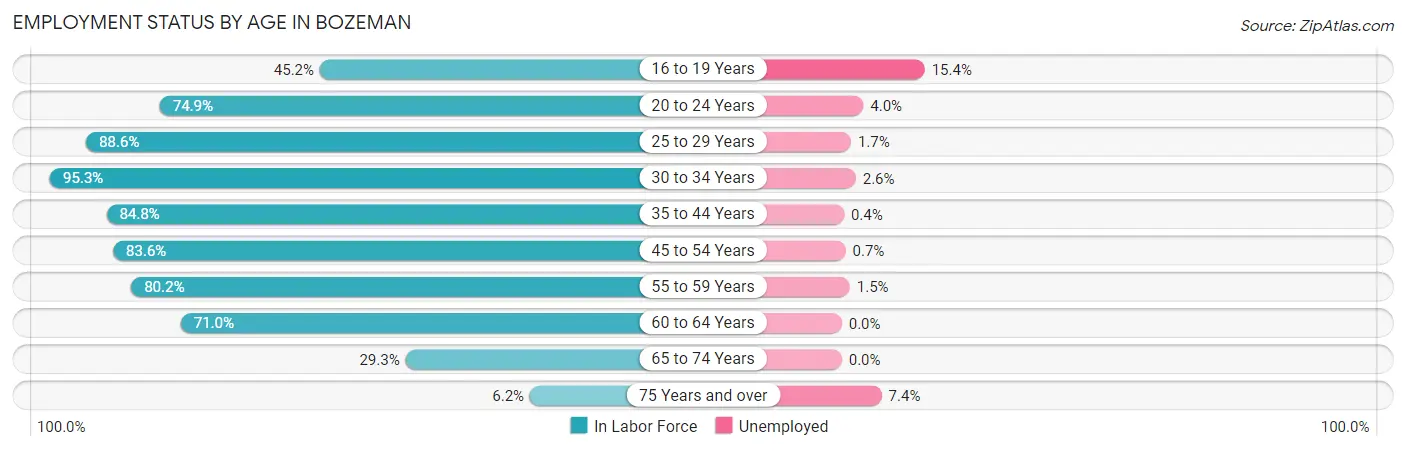
| Age Bracket | In Labor Force | Unemployed |
| 16 to 19 Years | 2,070 (45.2%) | 319 (15.4%) |
| 20 to 24 Years | 8,473 (74.9%) | 339 (4.0%) |
| 25 to 29 Years | 6,020 (88.6%) | 102 (1.7%) |
| 30 to 34 Years | 4,407 (95.3%) | 115 (2.6%) |
| 35 to 44 Years | 5,058 (84.8%) | 20 (0.4%) |
| 45 to 54 Years | 3,955 (83.6%) | 28 (0.7%) |
| 55 to 59 Years | 1,250 (80.2%) | 19 (1.5%) |
| 60 to 64 Years | 1,296 (71.0%) | 0 (0.0%) |
| 65 to 74 Years | 978 (29.3%) | 0 (0.0%) |
| 75 Years and over | 148 (6.2%) | 11 (7.4%) |
| Total | 33,648 (71.4%) | 942 (2.8%) |
Employment Status by Educational Attainment in Bozeman
According to labor force statistics for Bozeman, 86.2% of individuals (21,980) out of the total population between 25 and 64 years of age (25,499) are in the labor force, with 1.3% or 286 of them being unemployed. The group with the highest labor force participation rate are those with the educational attainment of bachelor's degree or higher, with 89.2% or 15,066 individuals in the labor force. Within the labor force, individuals with high school diploma education have the highest percentage of unemployment, with 3.0% or 53 of them being unemployed.
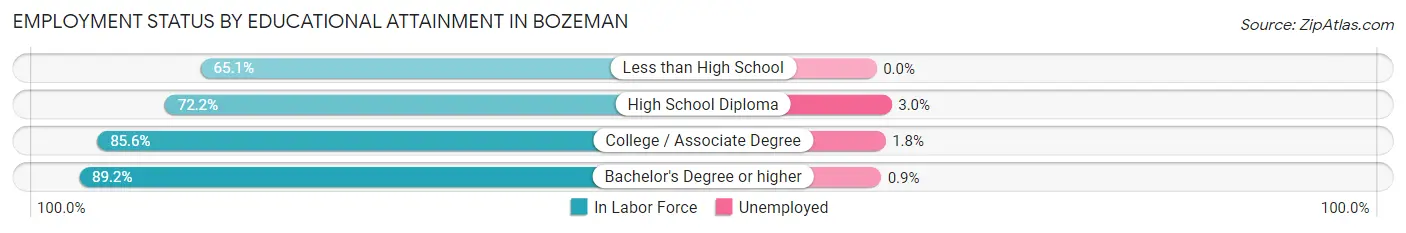
| Educational Attainment | In Labor Force | Unemployed |
| Less than High School | 372 (65.1%) | 0 (0.0%) |
| High School Diploma | 1,780 (72.2%) | 74 (3.0%) |
| College / Associate Degree | 4,770 (85.6%) | 100 (1.8%) |
| Bachelor's Degree or higher | 15,066 (89.2%) | 152 (0.9%) |
| Total | 21,980 (86.2%) | 331 (1.3%) |
Employment Occupations by Sex in Bozeman
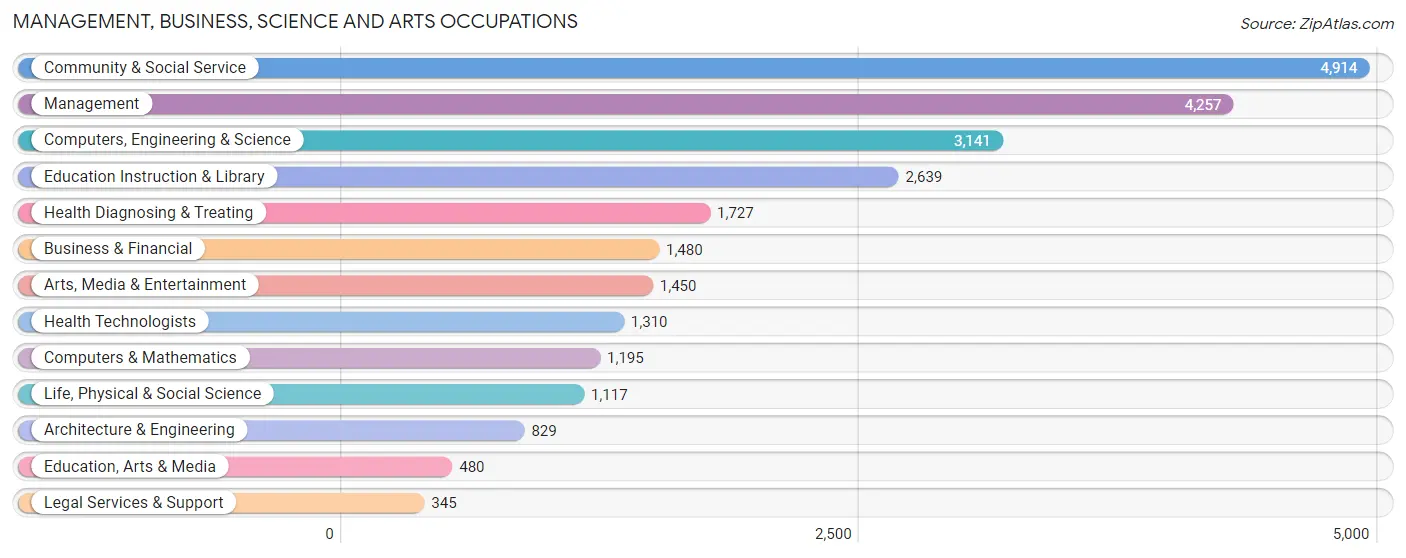
Management, Business, Science and Arts Occupations
The most common Management, Business, Science and Arts occupations in Bozeman are Community & Social Service (4,914 | 15.0%), Management (4,257 | 13.0%), Computers, Engineering & Science (3,141 | 9.6%), Education Instruction & Library (2,639 | 8.1%), and Health Diagnosing & Treating (1,727 | 5.3%).
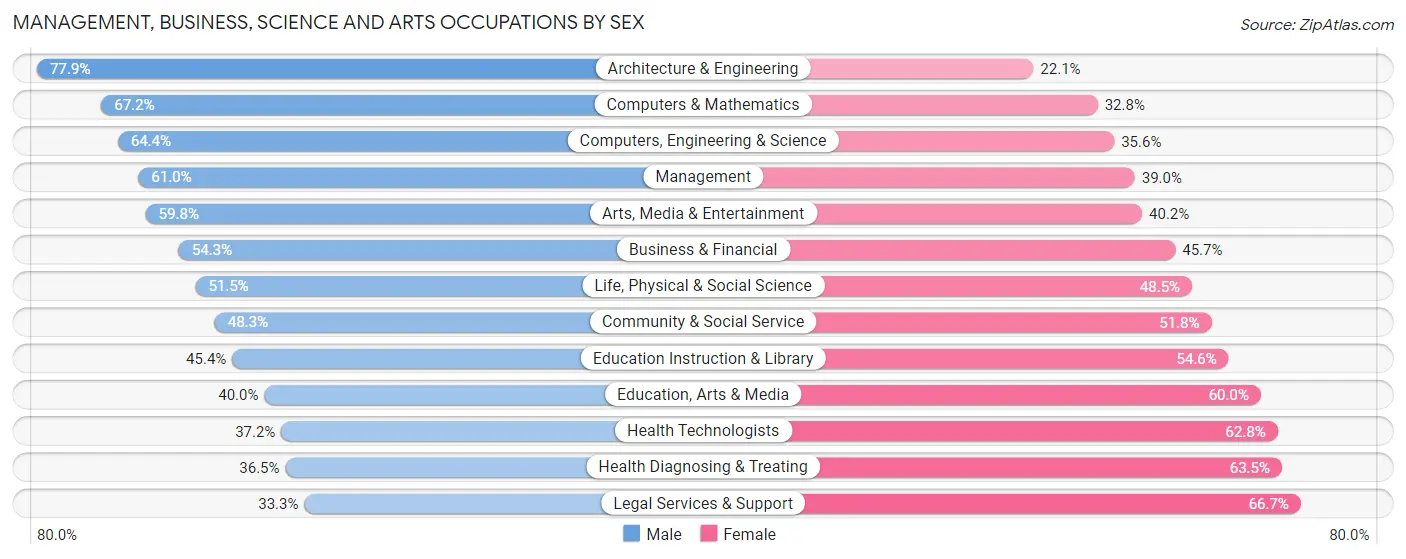
Management, Business, Science and Arts Occupations by Sex
Within the Management, Business, Science and Arts occupations in Bozeman, the most male-oriented occupations are Architecture & Engineering (77.9%), Computers & Mathematics (67.2%), and Computers, Engineering & Science (64.4%), while the most female-oriented occupations are Legal Services & Support (66.7%), Health Diagnosing & Treating (63.5%), and Health Technologists (62.8%).
| Occupation | Male | Female |
| Management | 2,597 (61.0%) | 1,660 (39.0%) |
| Business & Financial | 803 (54.3%) | 677 (45.7%) |
| Computers, Engineering & Science | 2,024 (64.4%) | 1,117 (35.6%) |
| Computers & Mathematics | 803 (67.2%) | 392 (32.8%) |
| Architecture & Engineering | 646 (77.9%) | 183 (22.1%) |
| Life, Physical & Social Science | 575 (51.5%) | 542 (48.5%) |
| Community & Social Service | 2,371 (48.2%) | 2,543 (51.7%) |
| Education, Arts & Media | 192 (40.0%) | 288 (60.0%) |
| Legal Services & Support | 115 (33.3%) | 230 (66.7%) |
| Education Instruction & Library | 1,197 (45.4%) | 1,442 (54.6%) |
| Arts, Media & Entertainment | 867 (59.8%) | 583 (40.2%) |
| Health Diagnosing & Treating | 630 (36.5%) | 1,097 (63.5%) |
| Health Technologists | 487 (37.2%) | 823 (62.8%) |
| Total (Category) | 8,425 (54.3%) | 7,094 (45.7%) |
| Total (Overall) | 17,776 (54.3%) | 14,932 (45.7%) |
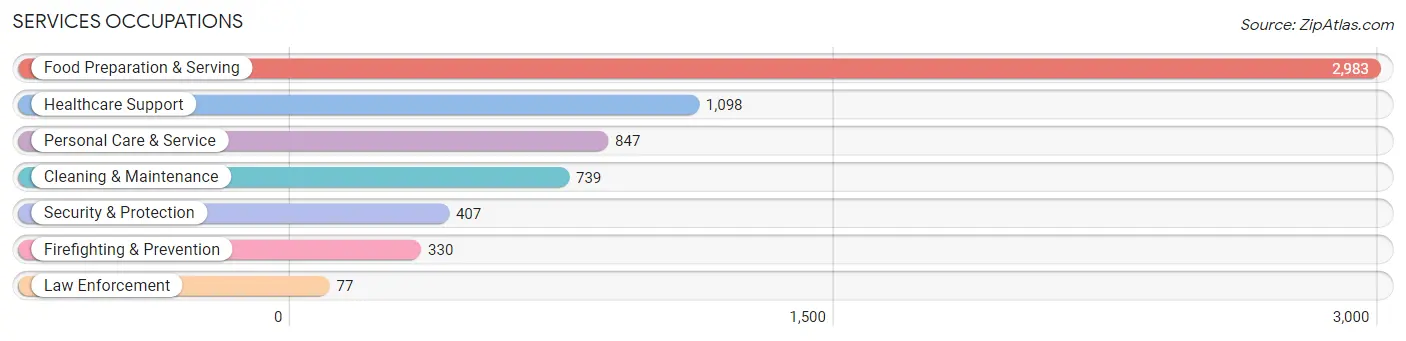
Services Occupations
The most common Services occupations in Bozeman are Food Preparation & Serving (2,983 | 9.1%), Healthcare Support (1,098 | 3.4%), Personal Care & Service (847 | 2.6%), Cleaning & Maintenance (739 | 2.3%), and Security & Protection (407 | 1.2%).
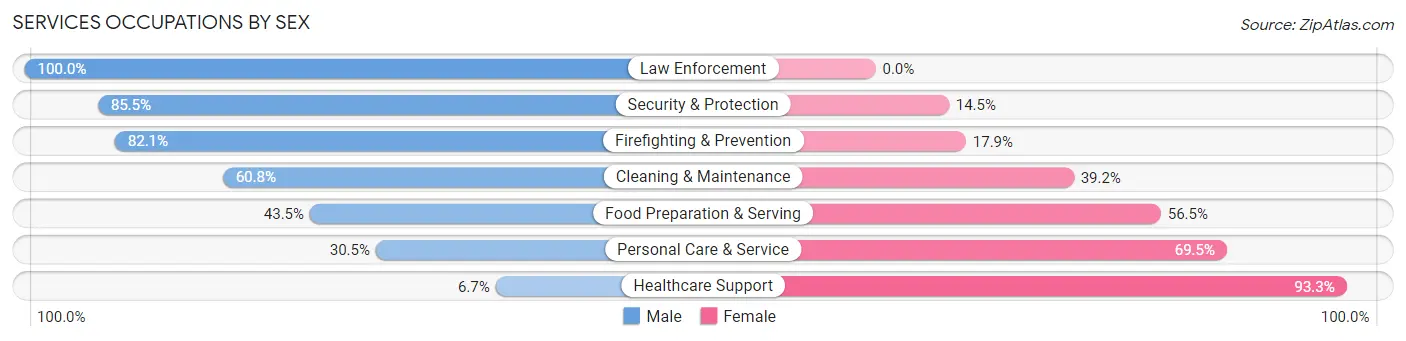
Services Occupations by Sex
Within the Services occupations in Bozeman, the most male-oriented occupations are Law Enforcement (100.0%), Security & Protection (85.5%), and Firefighting & Prevention (82.1%), while the most female-oriented occupations are Healthcare Support (93.3%), Personal Care & Service (69.5%), and Food Preparation & Serving (56.5%).
| Occupation | Male | Female |
| Healthcare Support | 74 (6.7%) | 1,024 (93.3%) |
| Security & Protection | 348 (85.5%) | 59 (14.5%) |
| Firefighting & Prevention | 271 (82.1%) | 59 (17.9%) |
| Law Enforcement | 77 (100.0%) | 0 (0.0%) |
| Food Preparation & Serving | 1,298 (43.5%) | 1,685 (56.5%) |
| Cleaning & Maintenance | 449 (60.8%) | 290 (39.2%) |
| Personal Care & Service | 258 (30.5%) | 589 (69.5%) |
| Total (Category) | 2,427 (40.0%) | 3,647 (60.0%) |
| Total (Overall) | 17,776 (54.3%) | 14,932 (45.7%) |
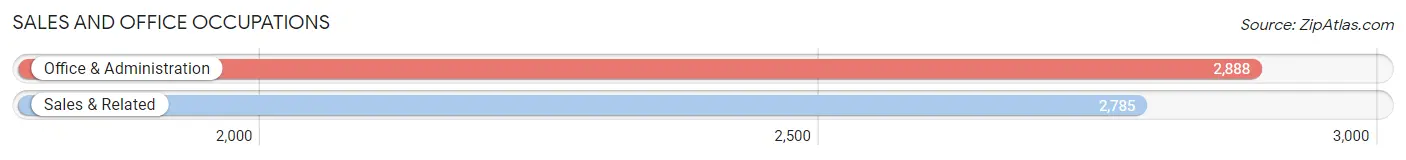
Sales and Office Occupations
The most common Sales and Office occupations in Bozeman are Office & Administration (2,888 | 8.8%), and Sales & Related (2,785 | 8.5%).
Sales and Office Occupations by Sex
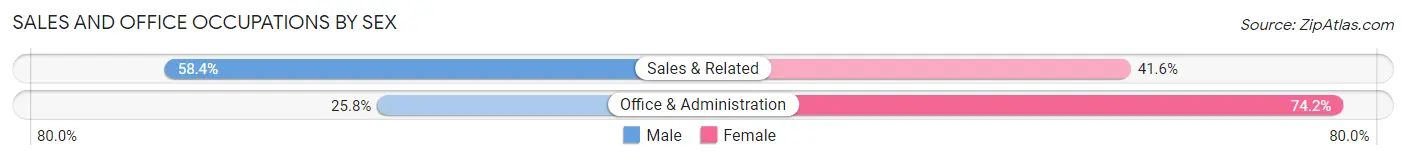
| Occupation | Male | Female |
| Sales & Related | 1,627 (58.4%) | 1,158 (41.6%) |
| Office & Administration | 744 (25.8%) | 2,144 (74.2%) |
| Total (Category) | 2,371 (41.8%) | 3,302 (58.2%) |
| Total (Overall) | 17,776 (54.3%) | 14,932 (45.7%) |
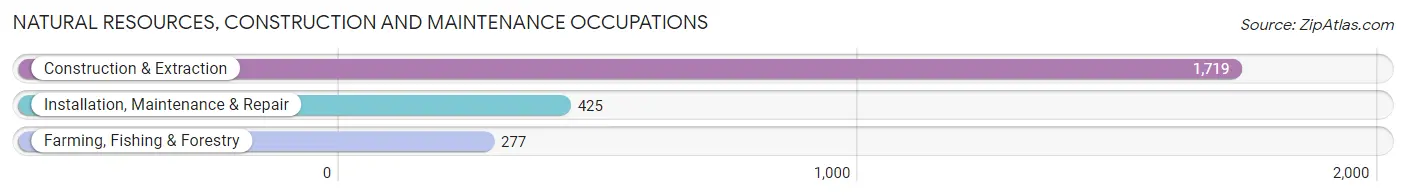
Natural Resources, Construction and Maintenance Occupations
The most common Natural Resources, Construction and Maintenance occupations in Bozeman are Construction & Extraction (1,719 | 5.3%), Installation, Maintenance & Repair (425 | 1.3%), and Farming, Fishing & Forestry (277 | 0.9%).
Natural Resources, Construction and Maintenance Occupations by Sex
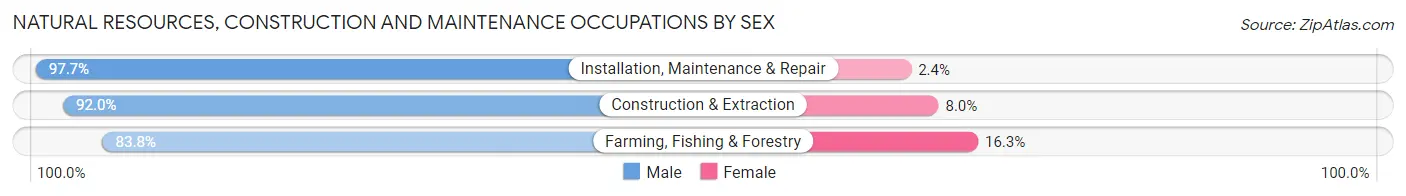
| Occupation | Male | Female |
| Farming, Fishing & Forestry | 232 (83.8%) | 45 (16.3%) |
| Construction & Extraction | 1,581 (92.0%) | 138 (8.0%) |
| Installation, Maintenance & Repair | 415 (97.7%) | 10 (2.4%) |
| Total (Category) | 2,228 (92.0%) | 193 (8.0%) |
| Total (Overall) | 17,776 (54.3%) | 14,932 (45.7%) |
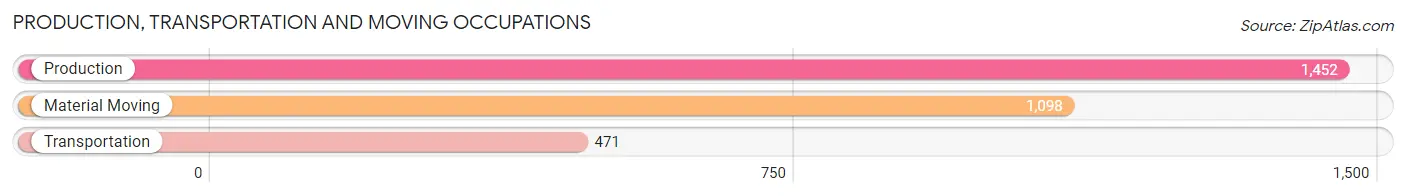
Production, Transportation and Moving Occupations
The most common Production, Transportation and Moving occupations in Bozeman are Production (1,452 | 4.4%), Material Moving (1,098 | 3.4%), and Transportation (471 | 1.4%).
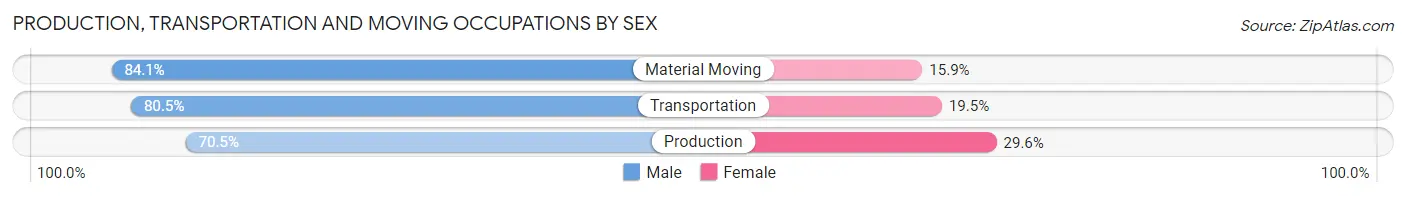
Production, Transportation and Moving Occupations by Sex
| Occupation | Male | Female |
| Production | 1,023 (70.5%) | 429 (29.5%) |
| Transportation | 379 (80.5%) | 92 (19.5%) |
| Material Moving | 923 (84.1%) | 175 (15.9%) |
| Total (Category) | 2,325 (77.0%) | 696 (23.0%) |
| Total (Overall) | 17,776 (54.3%) | 14,932 (45.7%) |
Employment Industries by Sex in Bozeman
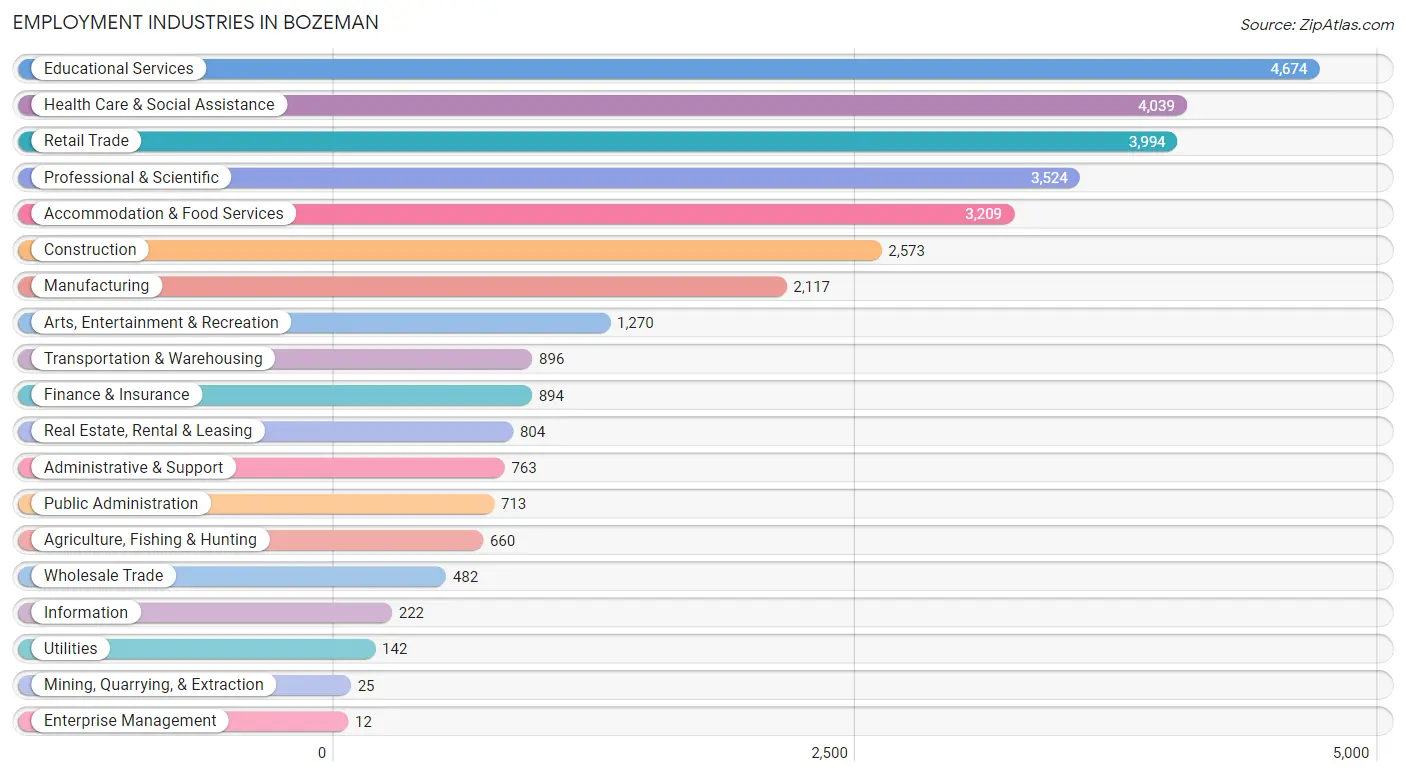
Employment Industries in Bozeman
The major employment industries in Bozeman include Educational Services (4,674 | 14.3%), Health Care & Social Assistance (4,039 | 12.3%), Retail Trade (3,994 | 12.2%), Professional & Scientific (3,524 | 10.8%), and Accommodation & Food Services (3,209 | 9.8%).
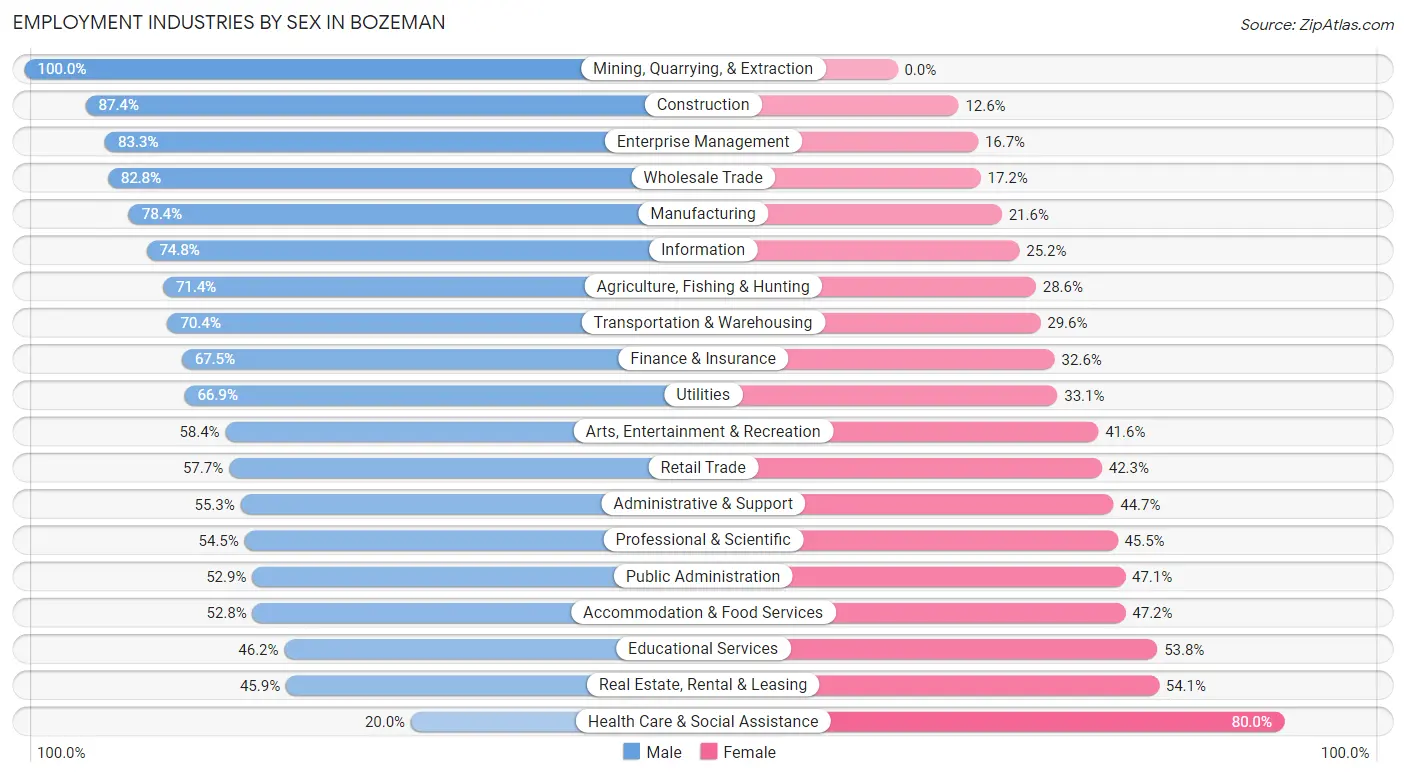
Employment Industries by Sex in Bozeman
The Bozeman industries that see more men than women are Mining, Quarrying, & Extraction (100.0%), Construction (87.4%), and Enterprise Management (83.3%), whereas the industries that tend to have a higher number of women are Health Care & Social Assistance (80.0%), Real Estate, Rental & Leasing (54.1%), and Educational Services (53.8%).
| Industry | Male | Female |
| Agriculture, Fishing & Hunting | 471 (71.4%) | 189 (28.6%) |
| Mining, Quarrying, & Extraction | 25 (100.0%) | 0 (0.0%) |
| Construction | 2,248 (87.4%) | 325 (12.6%) |
| Manufacturing | 1,660 (78.4%) | 457 (21.6%) |
| Wholesale Trade | 399 (82.8%) | 83 (17.2%) |
| Retail Trade | 2,304 (57.7%) | 1,690 (42.3%) |
| Transportation & Warehousing | 631 (70.4%) | 265 (29.6%) |
| Utilities | 95 (66.9%) | 47 (33.1%) |
| Information | 166 (74.8%) | 56 (25.2%) |
| Finance & Insurance | 603 (67.4%) | 291 (32.6%) |
| Real Estate, Rental & Leasing | 369 (45.9%) | 435 (54.1%) |
| Professional & Scientific | 1,919 (54.5%) | 1,605 (45.5%) |
| Enterprise Management | 10 (83.3%) | 2 (16.7%) |
| Administrative & Support | 422 (55.3%) | 341 (44.7%) |
| Educational Services | 2,161 (46.2%) | 2,513 (53.8%) |
| Health Care & Social Assistance | 809 (20.0%) | 3,230 (80.0%) |
| Arts, Entertainment & Recreation | 742 (58.4%) | 528 (41.6%) |
| Accommodation & Food Services | 1,695 (52.8%) | 1,514 (47.2%) |
| Public Administration | 377 (52.9%) | 336 (47.1%) |
| Total | 17,776 (54.3%) | 14,932 (45.7%) |
Education in Bozeman
School Enrollment in Bozeman
The most common levels of schooling among the 18,903 students in Bozeman are college / undergraduate (10,960 | 58.0%), graduate / professional (2,295 | 12.1%), and elementary school (1,773 | 9.4%).
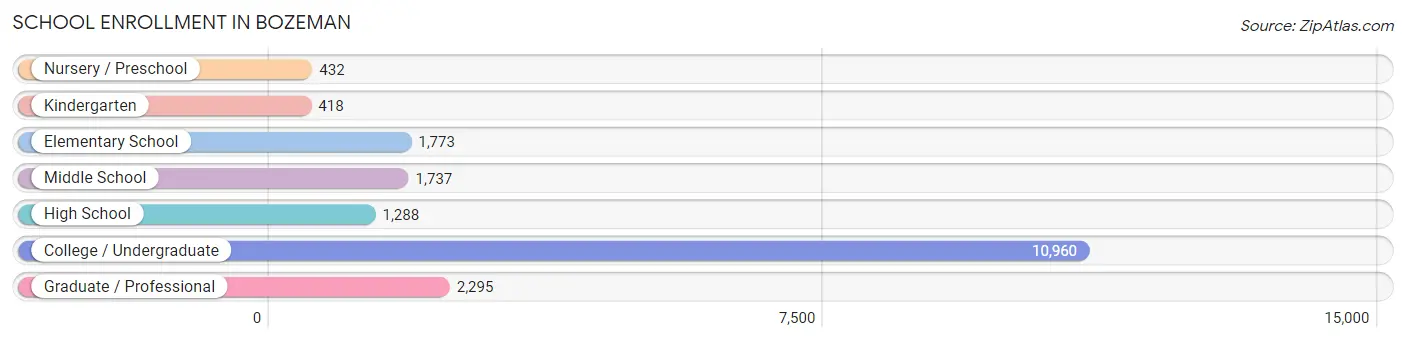
| School Level | # Students | % Students |
| Nursery / Preschool | 432 | 2.3% |
| Kindergarten | 418 | 2.2% |
| Elementary School | 1,773 | 9.4% |
| Middle School | 1,737 | 9.2% |
| High School | 1,288 | 6.8% |
| College / Undergraduate | 10,960 | 58.0% |
| Graduate / Professional | 2,295 | 12.1% |
| Total | 18,903 | 100.0% |
School Enrollment by Age by Funding Source in Bozeman
Out of a total of 18,903 students who are enrolled in schools in Bozeman, 2,023 (10.7%) attend a private institution, while the remaining 16,880 (89.3%) are enrolled in public schools. The age group of 3 to 4 year olds has the highest likelihood of being enrolled in private schools, with 266 (74.3% in the age bracket) enrolled. Conversely, the age group of 25 to 34 year olds has the lowest likelihood of being enrolled in a private school, with 2,160 (96.8% in the age bracket) attending a public institution.
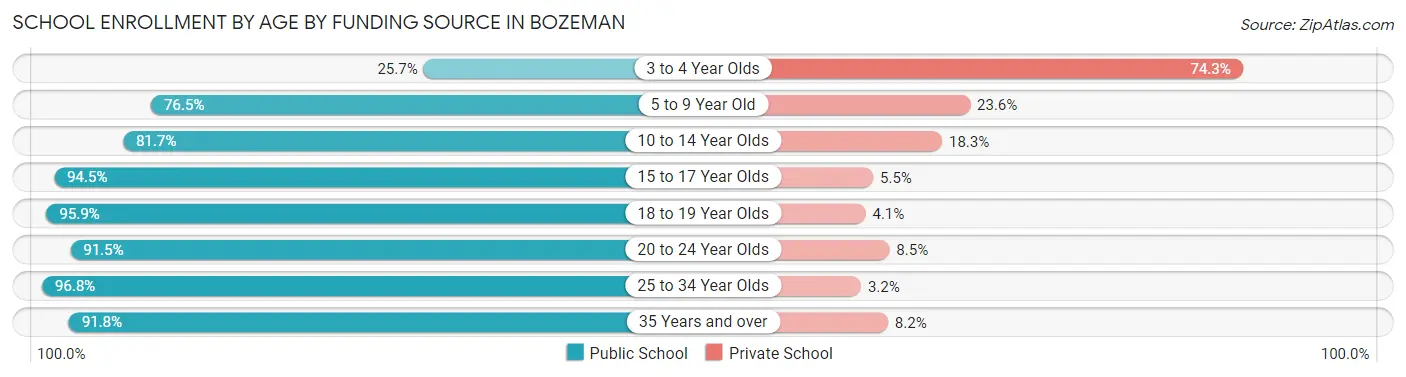
| Age Bracket | Public School | Private School |
| 3 to 4 Year Olds | 92 (25.7%) | 266 (74.3%) |
| 5 to 9 Year Old | 1,432 (76.4%) | 441 (23.5%) |
| 10 to 14 Year Olds | 1,707 (81.7%) | 383 (18.3%) |
| 15 to 17 Year Olds | 1,069 (94.5%) | 62 (5.5%) |
| 18 to 19 Year Olds | 3,374 (95.9%) | 143 (4.1%) |
| 20 to 24 Year Olds | 6,557 (91.5%) | 611 (8.5%) |
| 25 to 34 Year Olds | 2,160 (96.8%) | 72 (3.2%) |
| 35 Years and over | 490 (91.8%) | 44 (8.2%) |
| Total | 16,880 (89.3%) | 2,023 (10.7%) |
Educational Attainment by Field of Study in Bozeman
Bio, nature & agricultural (2,829 | 12.5%), business (2,473 | 11.0%), science & technology (2,182 | 9.7%), education (1,879 | 8.3%), and liberal arts & history (1,787 | 7.9%) are the most common fields of study among 22,560 individuals in Bozeman who have obtained a bachelor's degree or higher.
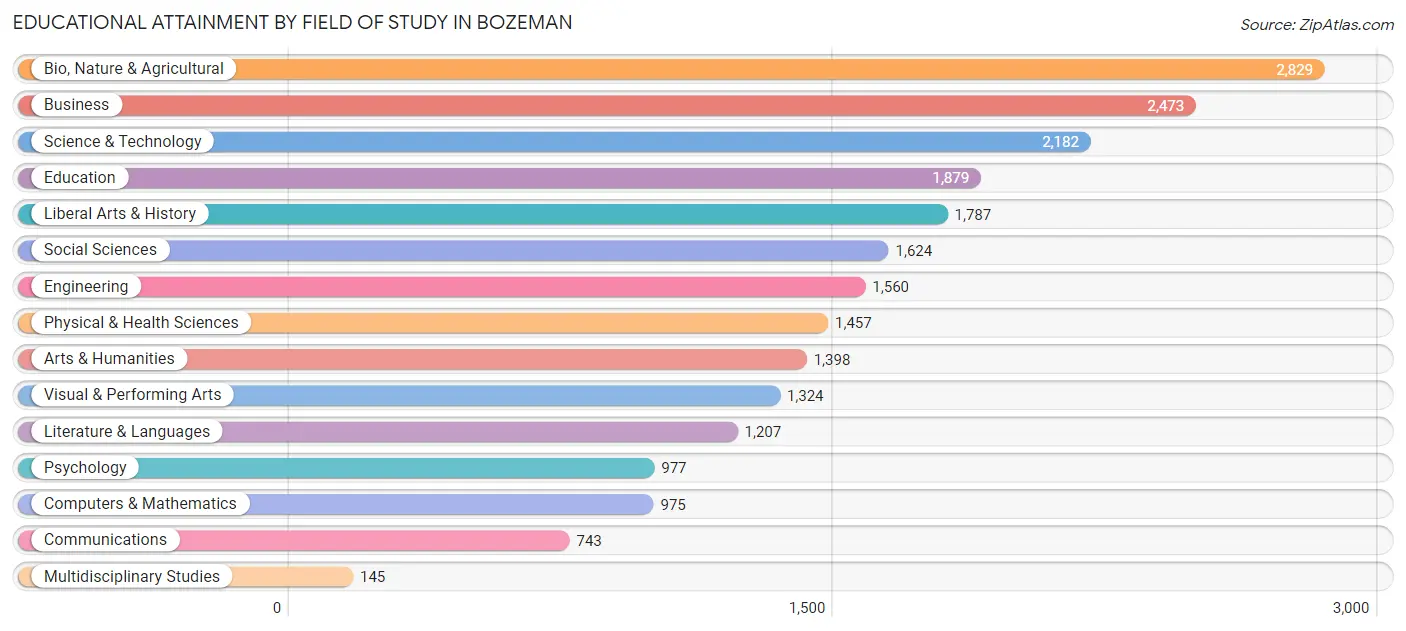
| Field of Study | # Graduates | % Graduates |
| Computers & Mathematics | 975 | 4.3% |
| Bio, Nature & Agricultural | 2,829 | 12.5% |
| Physical & Health Sciences | 1,457 | 6.5% |
| Psychology | 977 | 4.3% |
| Social Sciences | 1,624 | 7.2% |
| Engineering | 1,560 | 6.9% |
| Multidisciplinary Studies | 145 | 0.6% |
| Science & Technology | 2,182 | 9.7% |
| Business | 2,473 | 11.0% |
| Education | 1,879 | 8.3% |
| Literature & Languages | 1,207 | 5.3% |
| Liberal Arts & History | 1,787 | 7.9% |
| Visual & Performing Arts | 1,324 | 5.9% |
| Communications | 743 | 3.3% |
| Arts & Humanities | 1,398 | 6.2% |
| Total | 22,560 | 100.0% |
Transportation & Commute in Bozeman
Vehicle Availability by Sex in Bozeman
The most prevalent vehicle ownership categories in Bozeman are males with 2 vehicles (7,460, accounting for 45.2%) and females with 2 vehicles (6,046, making up 55.3%).
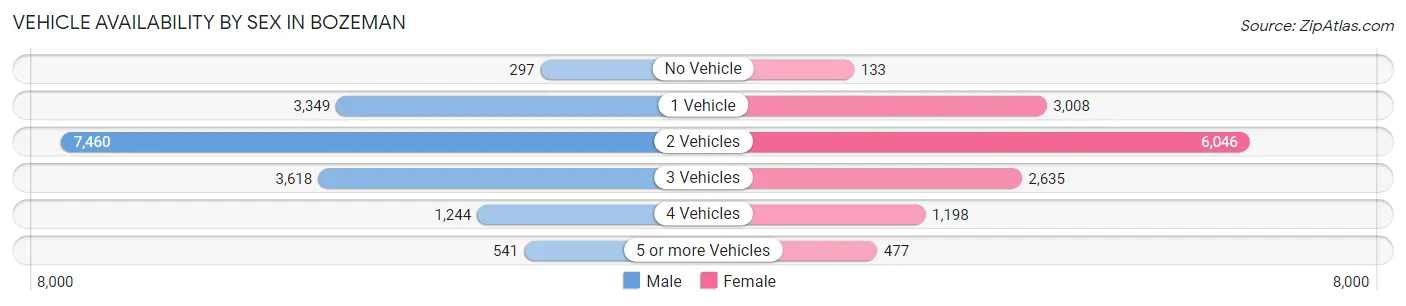
| Vehicles Available | Male | Female |
| No Vehicle | 297 (1.8%) | 133 (1.0%) |
| 1 Vehicle | 3,349 (20.3%) | 3,008 (22.3%) |
| 2 Vehicles | 7,460 (45.2%) | 6,046 (44.8%) |
| 3 Vehicles | 3,618 (21.9%) | 2,635 (19.5%) |
| 4 Vehicles | 1,244 (7.5%) | 1,198 (8.9%) |
| 5 or more Vehicles | 541 (3.3%) | 477 (3.5%) |
| Total | 16,509 (100.0%) | 13,497 (100.0%) |
Commute Time in Bozeman
The most frequently occuring commute durations in Bozeman are 10 to 14 minutes (6,743 commuters, 25.0%), 15 to 19 minutes (6,449 commuters, 23.9%), and 5 to 9 minutes (6,284 commuters, 23.3%).
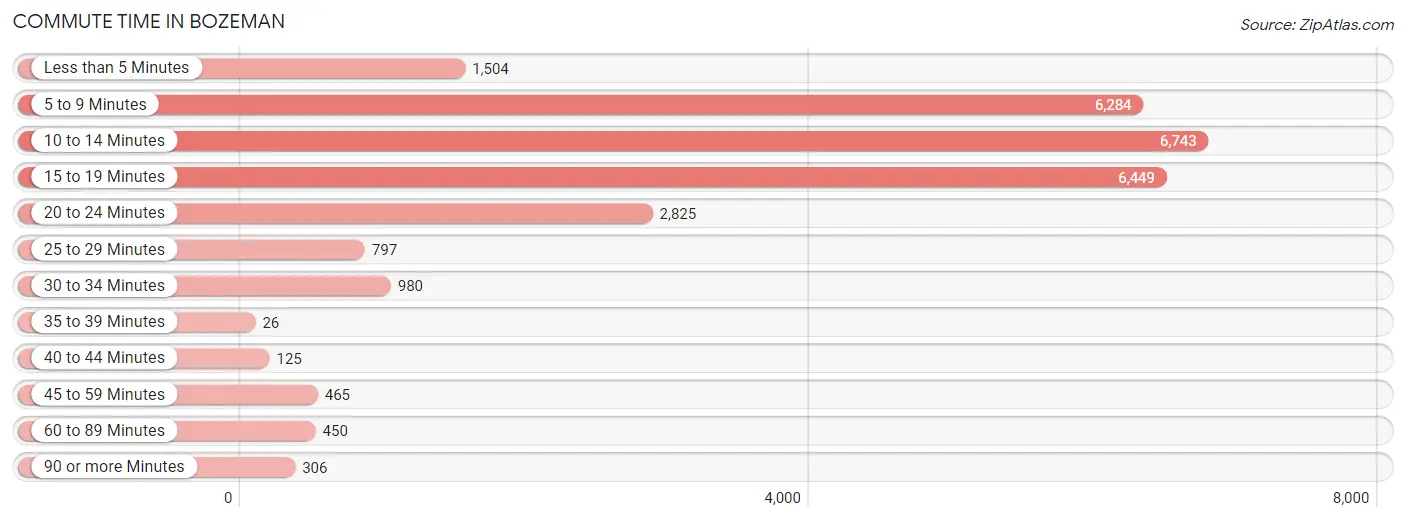
| Commute Time | # Commuters | % Commuters |
| Less than 5 Minutes | 1,504 | 5.6% |
| 5 to 9 Minutes | 6,284 | 23.3% |
| 10 to 14 Minutes | 6,743 | 25.0% |
| 15 to 19 Minutes | 6,449 | 23.9% |
| 20 to 24 Minutes | 2,825 | 10.5% |
| 25 to 29 Minutes | 797 | 3.0% |
| 30 to 34 Minutes | 980 | 3.6% |
| 35 to 39 Minutes | 26 | 0.1% |
| 40 to 44 Minutes | 125 | 0.5% |
| 45 to 59 Minutes | 465 | 1.7% |
| 60 to 89 Minutes | 450 | 1.7% |
| 90 or more Minutes | 306 | 1.1% |
Commute Time by Sex in Bozeman
The most common commute times in Bozeman are 10 to 14 minutes (4,034 commuters, 26.9%) for males and 15 to 19 minutes (3,449 commuters, 28.8%) for females.
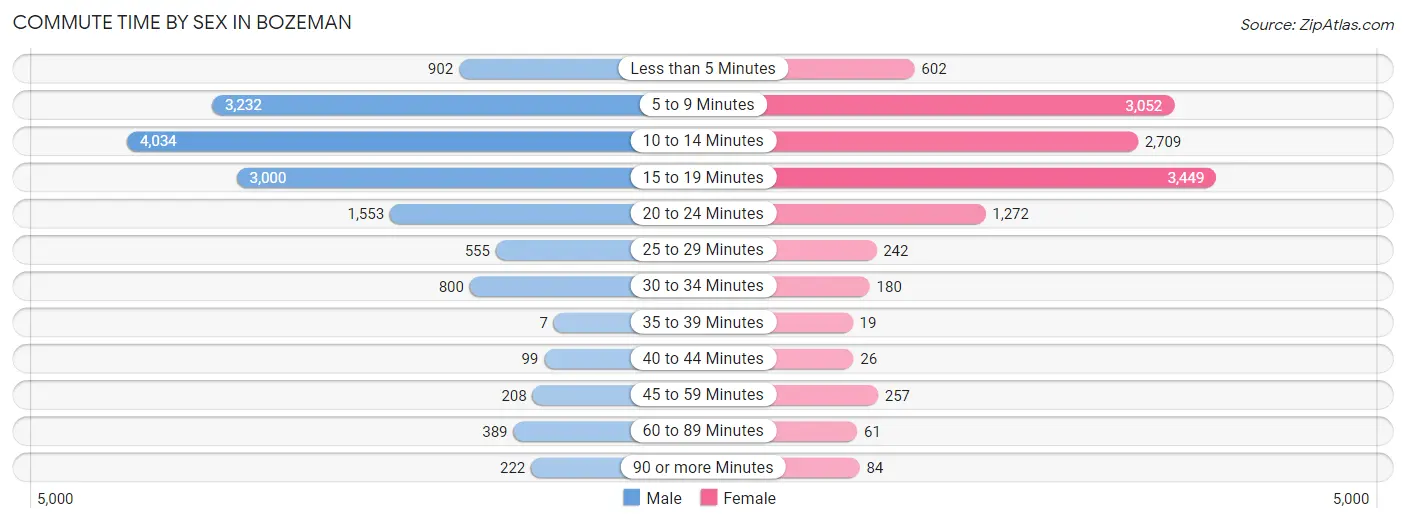
| Commute Time | Male | Female |
| Less than 5 Minutes | 902 (6.0%) | 602 (5.0%) |
| 5 to 9 Minutes | 3,232 (21.5%) | 3,052 (25.5%) |
| 10 to 14 Minutes | 4,034 (26.9%) | 2,709 (22.7%) |
| 15 to 19 Minutes | 3,000 (20.0%) | 3,449 (28.8%) |
| 20 to 24 Minutes | 1,553 (10.3%) | 1,272 (10.6%) |
| 25 to 29 Minutes | 555 (3.7%) | 242 (2.0%) |
| 30 to 34 Minutes | 800 (5.3%) | 180 (1.5%) |
| 35 to 39 Minutes | 7 (0.1%) | 19 (0.2%) |
| 40 to 44 Minutes | 99 (0.7%) | 26 (0.2%) |
| 45 to 59 Minutes | 208 (1.4%) | 257 (2.1%) |
| 60 to 89 Minutes | 389 (2.6%) | 61 (0.5%) |
| 90 or more Minutes | 222 (1.5%) | 84 (0.7%) |
Time of Departure to Work by Sex in Bozeman
The most frequent times of departure to work in Bozeman are 7:30 AM to 7:59 AM (2,672, 17.8%) for males and 7:30 AM to 7:59 AM (2,401, 20.1%) for females.
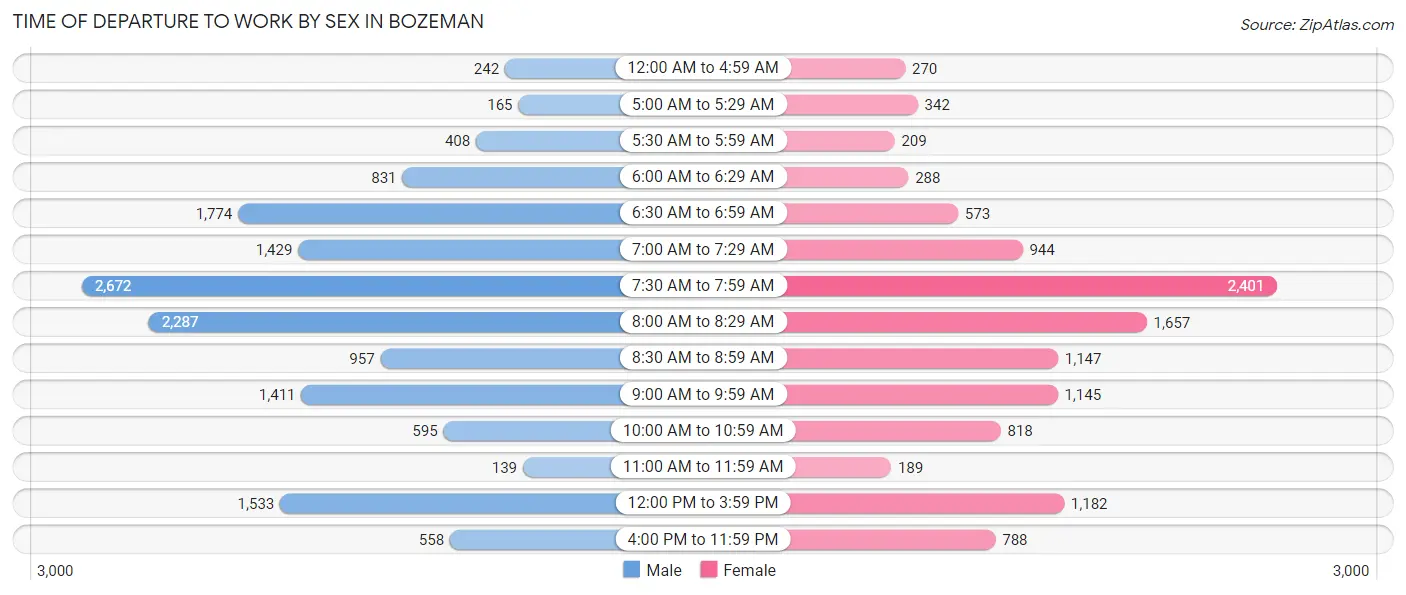
| Time of Departure | Male | Female |
| 12:00 AM to 4:59 AM | 242 (1.6%) | 270 (2.3%) |
| 5:00 AM to 5:29 AM | 165 (1.1%) | 342 (2.9%) |
| 5:30 AM to 5:59 AM | 408 (2.7%) | 209 (1.8%) |
| 6:00 AM to 6:29 AM | 831 (5.5%) | 288 (2.4%) |
| 6:30 AM to 6:59 AM | 1,774 (11.8%) | 573 (4.8%) |
| 7:00 AM to 7:29 AM | 1,429 (9.5%) | 944 (7.9%) |
| 7:30 AM to 7:59 AM | 2,672 (17.8%) | 2,401 (20.1%) |
| 8:00 AM to 8:29 AM | 2,287 (15.2%) | 1,657 (13.9%) |
| 8:30 AM to 8:59 AM | 957 (6.4%) | 1,147 (9.6%) |
| 9:00 AM to 9:59 AM | 1,411 (9.4%) | 1,145 (9.6%) |
| 10:00 AM to 10:59 AM | 595 (4.0%) | 818 (6.8%) |
| 11:00 AM to 11:59 AM | 139 (0.9%) | 189 (1.6%) |
| 12:00 PM to 3:59 PM | 1,533 (10.2%) | 1,182 (9.9%) |
| 4:00 PM to 11:59 PM | 558 (3.7%) | 788 (6.6%) |
| Total | 15,001 (100.0%) | 11,953 (100.0%) |
Housing Occupancy in Bozeman
Occupancy by Ownership in Bozeman
Of the total 22,041 dwellings in Bozeman, owner-occupied units account for 9,641 (43.7%), while renter-occupied units make up 12,400 (56.3%).
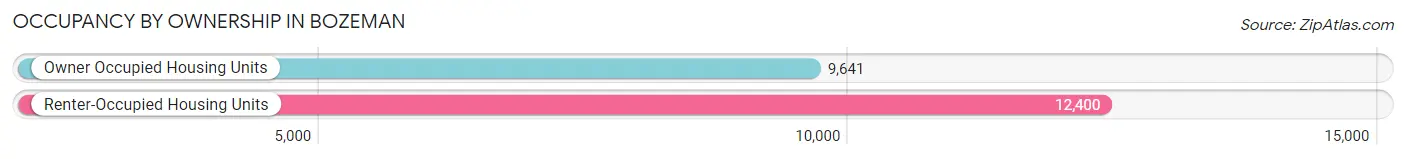
| Occupancy | # Housing Units | % Housing Units |
| Owner Occupied Housing Units | 9,641 | 43.7% |
| Renter-Occupied Housing Units | 12,400 | 56.3% |
| Total Occupied Housing Units | 22,041 | 100.0% |
Occupancy by Household Size in Bozeman
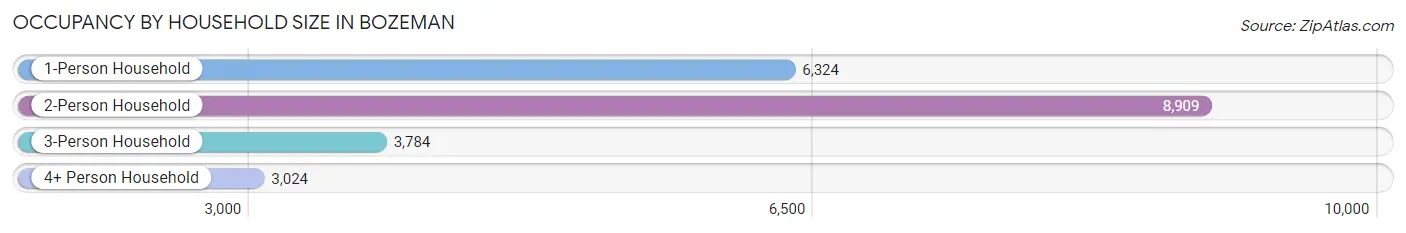
| Household Size | # Housing Units | % Housing Units |
| 1-Person Household | 6,324 | 28.7% |
| 2-Person Household | 8,909 | 40.4% |
| 3-Person Household | 3,784 | 17.2% |
| 4+ Person Household | 3,024 | 13.7% |
| Total Housing Units | 22,041 | 100.0% |
Occupancy by Ownership by Household Size in Bozeman
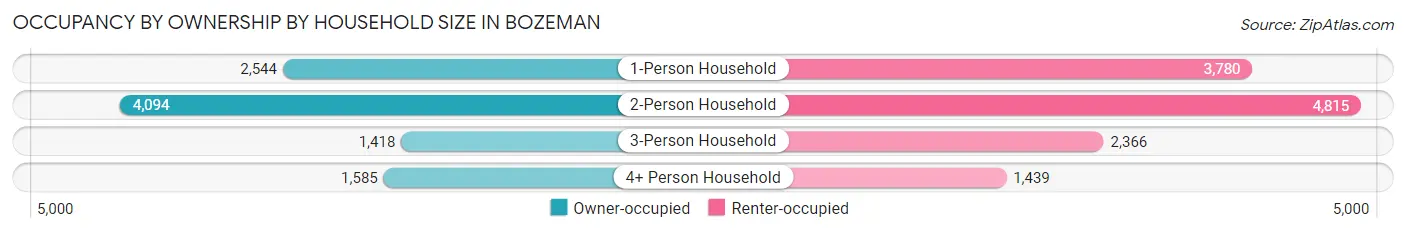
| Household Size | Owner-occupied | Renter-occupied |
| 1-Person Household | 2,544 (40.2%) | 3,780 (59.8%) |
| 2-Person Household | 4,094 (46.0%) | 4,815 (54.0%) |
| 3-Person Household | 1,418 (37.5%) | 2,366 (62.5%) |
| 4+ Person Household | 1,585 (52.4%) | 1,439 (47.6%) |
| Total Housing Units | 9,641 (43.7%) | 12,400 (56.3%) |
Occupancy by Educational Attainment in Bozeman
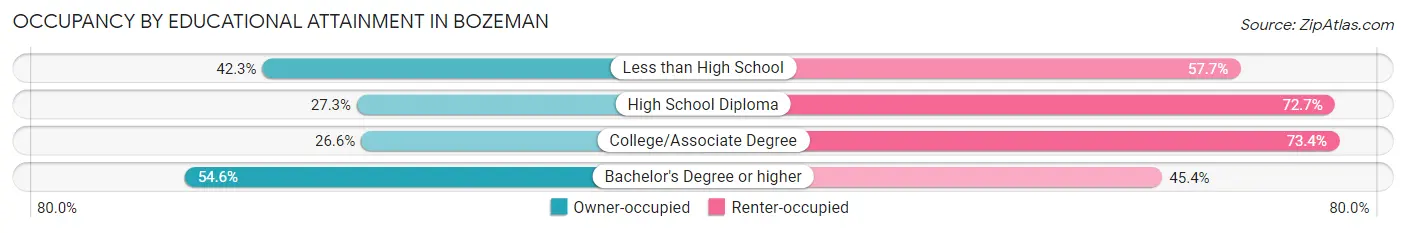
| Household Size | Owner-occupied | Renter-occupied |
| Less than High School | 107 (42.3%) | 146 (57.7%) |
| High School Diploma | 650 (27.3%) | 1,731 (72.7%) |
| College/Associate Degree | 1,632 (26.6%) | 4,494 (73.4%) |
| Bachelor's Degree or higher | 7,252 (54.6%) | 6,029 (45.4%) |
Occupancy by Age of Householder in Bozeman
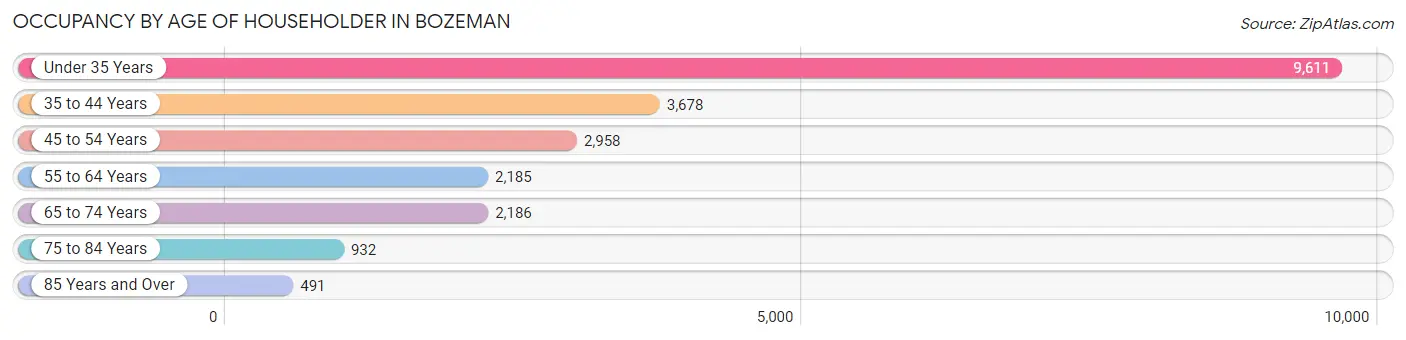
| Age Bracket | # Households | % Households |
| Under 35 Years | 9,611 | 43.6% |
| 35 to 44 Years | 3,678 | 16.7% |
| 45 to 54 Years | 2,958 | 13.4% |
| 55 to 64 Years | 2,185 | 9.9% |
| 65 to 74 Years | 2,186 | 9.9% |
| 75 to 84 Years | 932 | 4.2% |
| 85 Years and Over | 491 | 2.2% |
| Total | 22,041 | 100.0% |
Housing Finances in Bozeman
Median Income by Occupancy in Bozeman
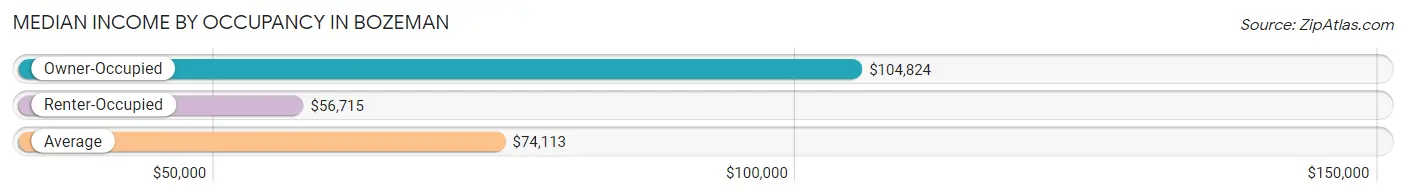
| Occupancy Type | # Households | Median Income |
| Owner-Occupied | 9,641 (43.7%) | $104,824 |
| Renter-Occupied | 12,400 (56.3%) | $56,715 |
| Average | 22,041 (100.0%) | $74,113 |
Occupancy by Householder Income Bracket in Bozeman
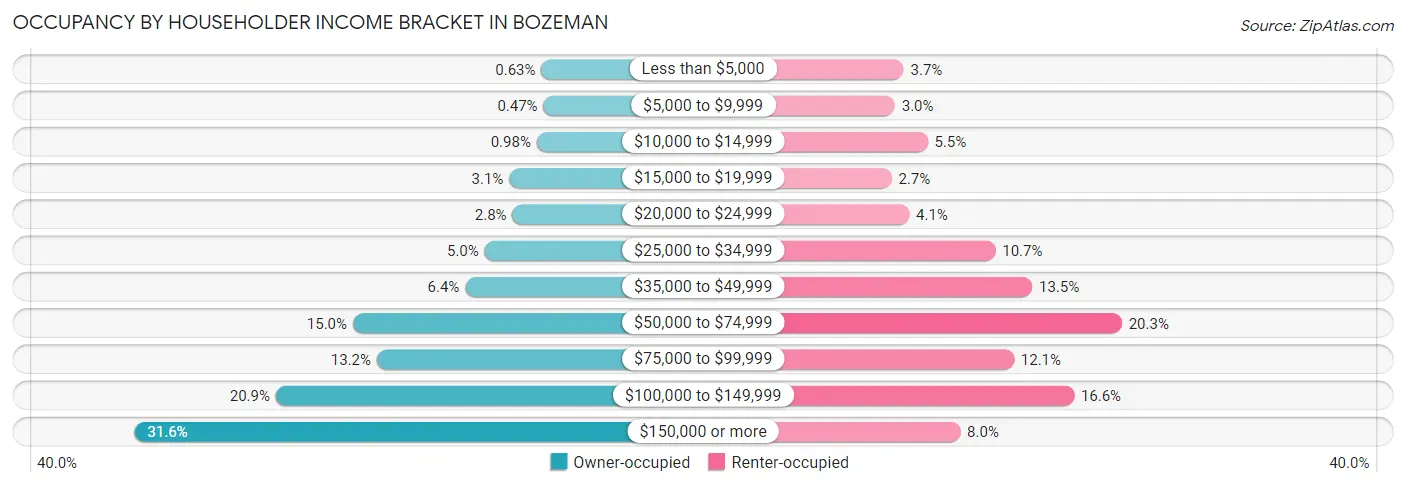
| Income Bracket | Owner-occupied | Renter-occupied |
| Less than $5,000 | 61 (0.6%) | 454 (3.7%) |
| $5,000 to $9,999 | 45 (0.5%) | 371 (3.0%) |
| $10,000 to $14,999 | 94 (1.0%) | 680 (5.5%) |
| $15,000 to $19,999 | 297 (3.1%) | 340 (2.7%) |
| $20,000 to $24,999 | 273 (2.8%) | 506 (4.1%) |
| $25,000 to $34,999 | 477 (5.0%) | 1,320 (10.6%) |
| $35,000 to $49,999 | 620 (6.4%) | 1,668 (13.5%) |
| $50,000 to $74,999 | 1,445 (15.0%) | 2,515 (20.3%) |
| $75,000 to $99,999 | 1,269 (13.2%) | 1,495 (12.1%) |
| $100,000 to $149,999 | 2,011 (20.9%) | 2,063 (16.6%) |
| $150,000 or more | 3,049 (31.6%) | 988 (8.0%) |
| Total | 9,641 (100.0%) | 12,400 (100.0%) |
Monthly Housing Cost Tiers in Bozeman
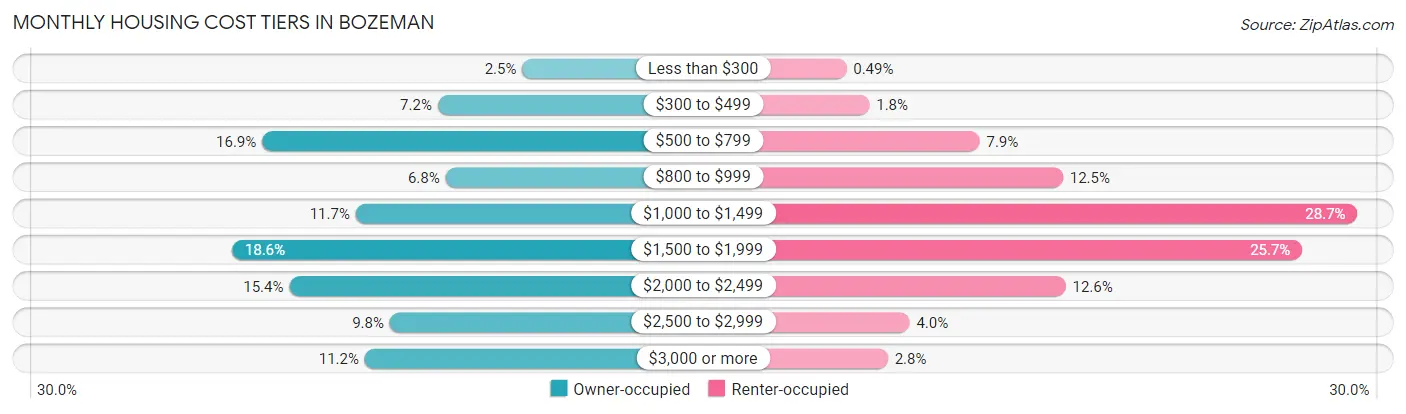
| Monthly Cost | Owner-occupied | Renter-occupied |
| Less than $300 | 242 (2.5%) | 61 (0.5%) |
| $300 to $499 | 692 (7.2%) | 218 (1.8%) |
| $500 to $799 | 1,627 (16.9%) | 973 (7.9%) |
| $800 to $999 | 651 (6.8%) | 1,544 (12.4%) |
| $1,000 to $1,499 | 1,129 (11.7%) | 3,561 (28.7%) |
| $1,500 to $1,999 | 1,788 (18.5%) | 3,183 (25.7%) |
| $2,000 to $2,499 | 1,483 (15.4%) | 1,562 (12.6%) |
| $2,500 to $2,999 | 948 (9.8%) | 493 (4.0%) |
| $3,000 or more | 1,081 (11.2%) | 345 (2.8%) |
| Total | 9,641 (100.0%) | 12,400 (100.0%) |
Physical Housing Characteristics in Bozeman
Housing Structures in Bozeman
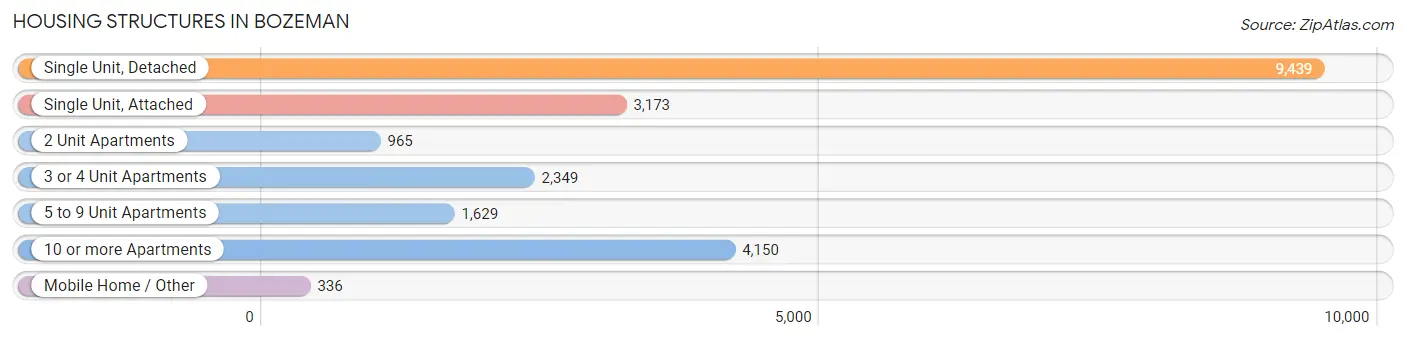
| Structure Type | # Housing Units | % Housing Units |
| Single Unit, Detached | 9,439 | 42.8% |
| Single Unit, Attached | 3,173 | 14.4% |
| 2 Unit Apartments | 965 | 4.4% |
| 3 or 4 Unit Apartments | 2,349 | 10.7% |
| 5 to 9 Unit Apartments | 1,629 | 7.4% |
| 10 or more Apartments | 4,150 | 18.8% |
| Mobile Home / Other | 336 | 1.5% |
| Total | 22,041 | 100.0% |
Housing Structures by Occupancy in Bozeman
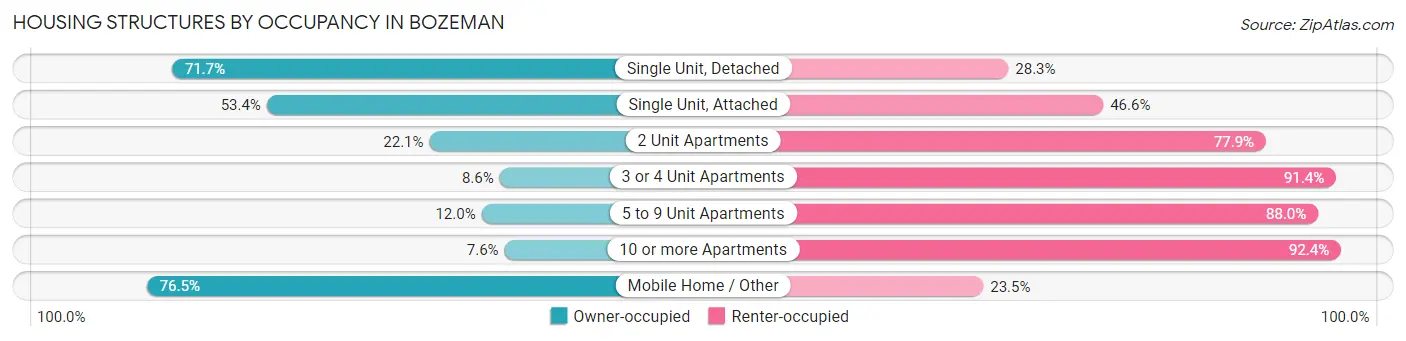
| Structure Type | Owner-occupied | Renter-occupied |
| Single Unit, Detached | 6,764 (71.7%) | 2,675 (28.3%) |
| Single Unit, Attached | 1,694 (53.4%) | 1,479 (46.6%) |
| 2 Unit Apartments | 213 (22.1%) | 752 (77.9%) |
| 3 or 4 Unit Apartments | 201 (8.6%) | 2,148 (91.4%) |
| 5 to 9 Unit Apartments | 196 (12.0%) | 1,433 (88.0%) |
| 10 or more Apartments | 316 (7.6%) | 3,834 (92.4%) |
| Mobile Home / Other | 257 (76.5%) | 79 (23.5%) |
| Total | 9,641 (43.7%) | 12,400 (56.3%) |
Housing Structures by Number of Rooms in Bozeman
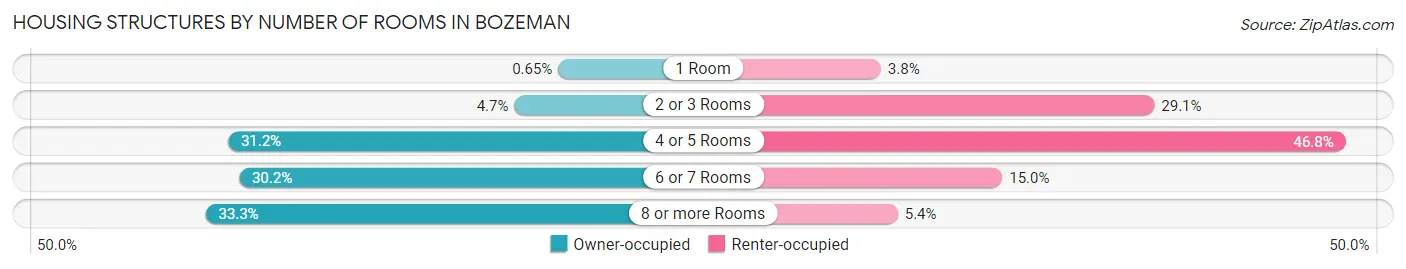
| Number of Rooms | Owner-occupied | Renter-occupied |
| 1 Room | 63 (0.6%) | 470 (3.8%) |
| 2 or 3 Rooms | 454 (4.7%) | 3,606 (29.1%) |
| 4 or 5 Rooms | 3,007 (31.2%) | 5,798 (46.8%) |
| 6 or 7 Rooms | 2,909 (30.2%) | 1,862 (15.0%) |
| 8 or more Rooms | 3,208 (33.3%) | 664 (5.3%) |
| Total | 9,641 (100.0%) | 12,400 (100.0%) |
Housing Structure by Heating Type in Bozeman
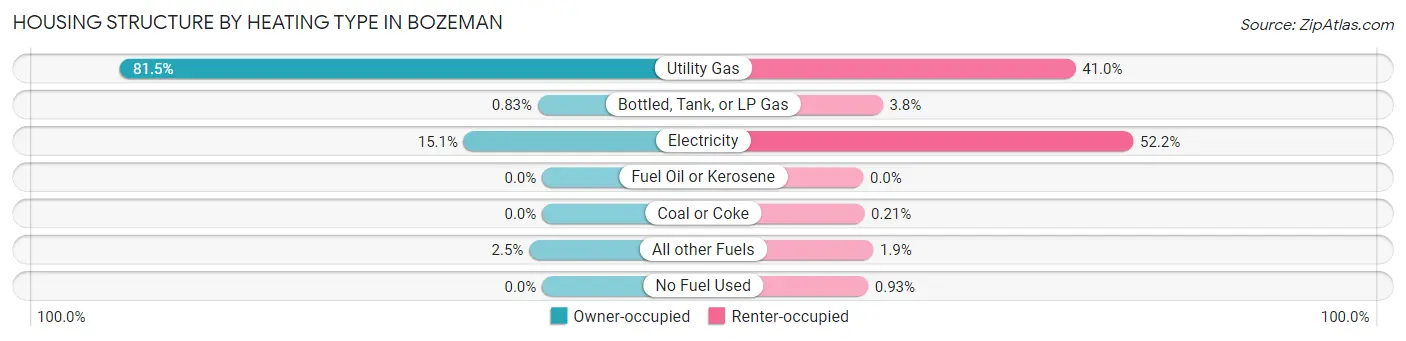
| Heating Type | Owner-occupied | Renter-occupied |
| Utility Gas | 7,861 (81.5%) | 5,085 (41.0%) |
| Bottled, Tank, or LP Gas | 80 (0.8%) | 465 (3.7%) |
| Electricity | 1,459 (15.1%) | 6,470 (52.2%) |
| Fuel Oil or Kerosene | 0 (0.0%) | 0 (0.0%) |
| Coal or Coke | 0 (0.0%) | 26 (0.2%) |
| All other Fuels | 241 (2.5%) | 239 (1.9%) |
| No Fuel Used | 0 (0.0%) | 115 (0.9%) |
| Total | 9,641 (100.0%) | 12,400 (100.0%) |
Household Vehicle Usage in Bozeman
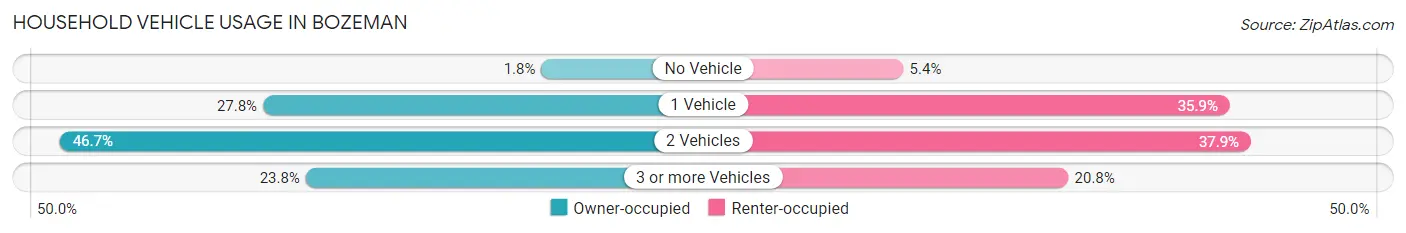
| Vehicles per Household | Owner-occupied | Renter-occupied |
| No Vehicle | 171 (1.8%) | 668 (5.4%) |
| 1 Vehicle | 2,675 (27.8%) | 4,454 (35.9%) |
| 2 Vehicles | 4,504 (46.7%) | 4,700 (37.9%) |
| 3 or more Vehicles | 2,291 (23.8%) | 2,578 (20.8%) |
| Total | 9,641 (100.0%) | 12,400 (100.0%) |
Real Estate & Mortgages in Bozeman
Real Estate and Mortgage Overview in Bozeman
| Characteristic | Without Mortgage | With Mortgage |
| Housing Units | 3,427 | 6,214 |
| Median Property Value | $524,500 | $557,100 |
| Median Household Income | $76,076 | $2,343 |
| Monthly Housing Costs | $630 | $1,052 |
| Real Estate Taxes | $3,477 | $103 |
Property Value by Mortgage Status in Bozeman
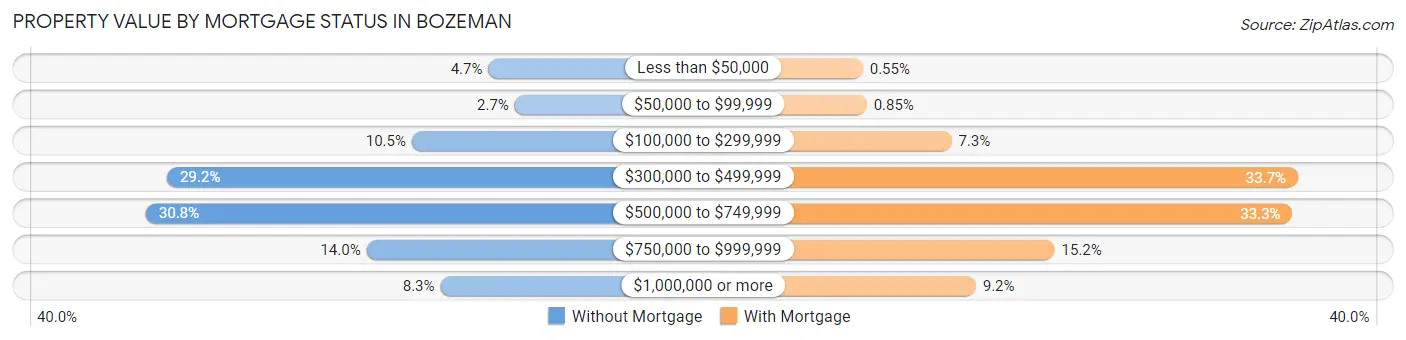
| Property Value | Without Mortgage | With Mortgage |
| Less than $50,000 | 160 (4.7%) | 34 (0.5%) |
| $50,000 to $99,999 | 91 (2.7%) | 53 (0.9%) |
| $100,000 to $299,999 | 360 (10.5%) | 454 (7.3%) |
| $300,000 to $499,999 | 999 (29.1%) | 2,094 (33.7%) |
| $500,000 to $749,999 | 1,054 (30.8%) | 2,068 (33.3%) |
| $750,000 to $999,999 | 478 (14.0%) | 942 (15.2%) |
| $1,000,000 or more | 285 (8.3%) | 569 (9.2%) |
| Total | 3,427 (100.0%) | 6,214 (100.0%) |
Household Income by Mortgage Status in Bozeman
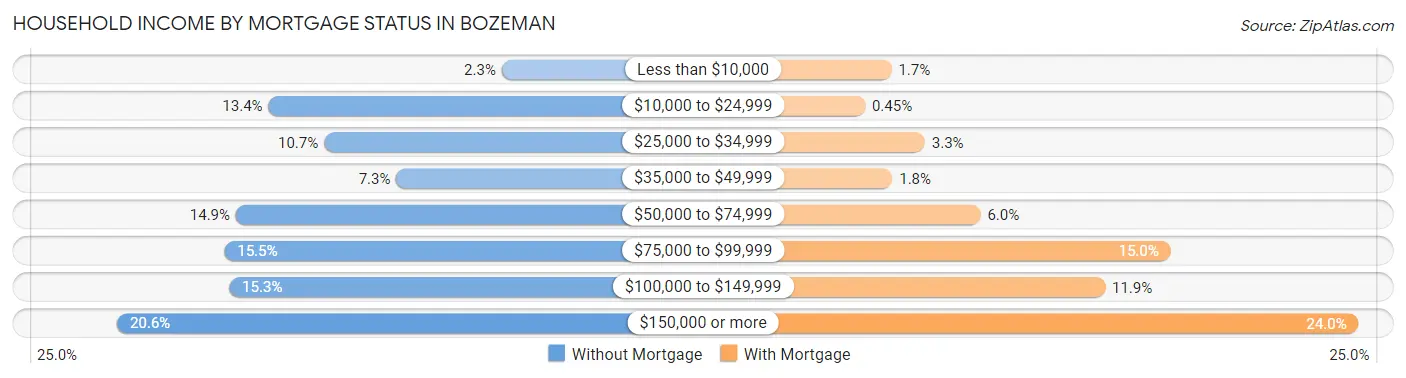
| Household Income | Without Mortgage | With Mortgage |
| Less than $10,000 | 78 (2.3%) | 106 (1.7%) |
| $10,000 to $24,999 | 459 (13.4%) | 28 (0.4%) |
| $25,000 to $34,999 | 368 (10.7%) | 205 (3.3%) |
| $35,000 to $49,999 | 250 (7.3%) | 109 (1.8%) |
| $50,000 to $74,999 | 512 (14.9%) | 370 (5.9%) |
| $75,000 to $99,999 | 531 (15.5%) | 933 (15.0%) |
| $100,000 to $149,999 | 523 (15.3%) | 738 (11.9%) |
| $150,000 or more | 706 (20.6%) | 1,488 (23.9%) |
| Total | 3,427 (100.0%) | 6,214 (100.0%) |
Property Value to Household Income Ratio in Bozeman
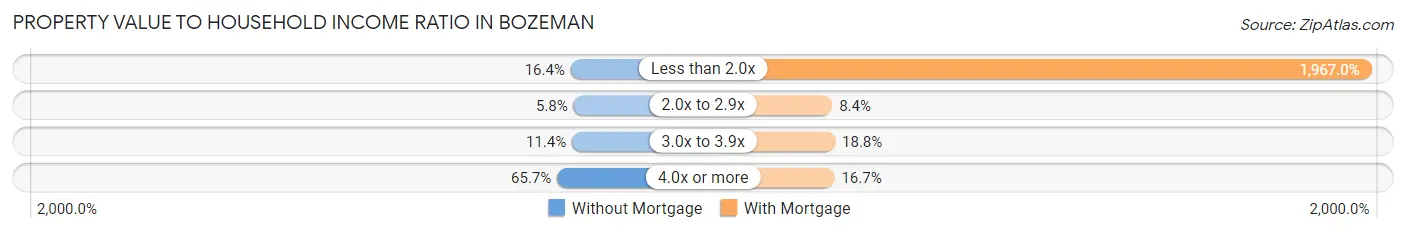
| Value-to-Income Ratio | Without Mortgage | With Mortgage |
| Less than 2.0x | 562 (16.4%) | 122,228 (1,967.0%) |
| 2.0x to 2.9x | 197 (5.8%) | 519 (8.4%) |
| 3.0x to 3.9x | 392 (11.4%) | 1,169 (18.8%) |
| 4.0x or more | 2,252 (65.7%) | 1,035 (16.7%) |
| Total | 3,427 (100.0%) | 6,214 (100.0%) |
Real Estate Taxes by Mortgage Status in Bozeman
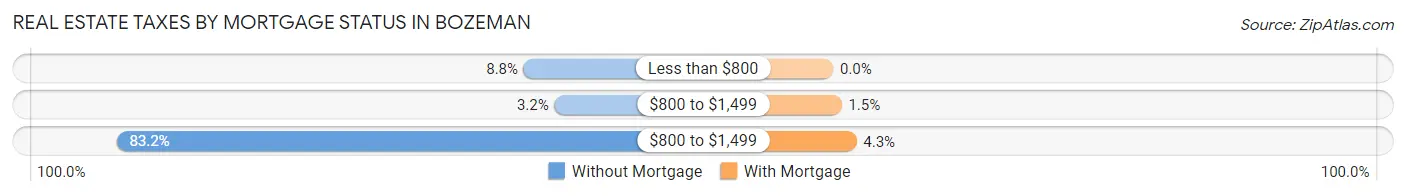
| Property Taxes | Without Mortgage | With Mortgage |
| Less than $800 | 302 (8.8%) | 0 (0.0%) |
| $800 to $1,499 | 110 (3.2%) | 96 (1.5%) |
| $800 to $1,499 | 2,852 (83.2%) | 264 (4.3%) |
| Total | 3,427 (100.0%) | 6,214 (100.0%) |
Health & Disability in Bozeman
Health Insurance Coverage by Age in Bozeman
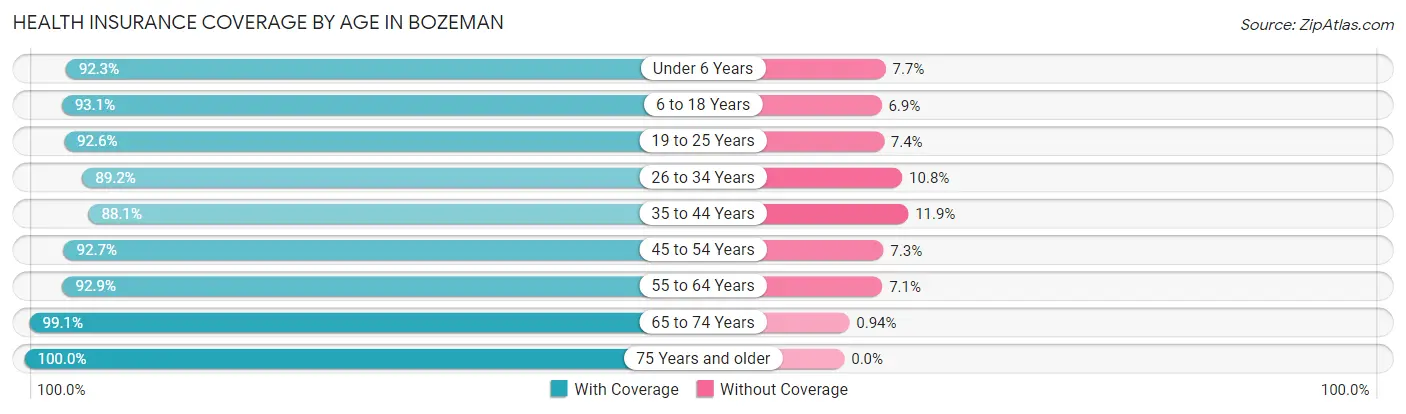
| Age Bracket | With Coverage | Without Coverage |
| Under 6 Years | 2,064 (92.3%) | 172 (7.7%) |
| 6 to 18 Years | 6,067 (93.1%) | 452 (6.9%) |
| 19 to 25 Years | 13,774 (92.6%) | 1,097 (7.4%) |
| 26 to 34 Years | 8,905 (89.2%) | 1,077 (10.8%) |
| 35 to 44 Years | 5,215 (88.1%) | 706 (11.9%) |
| 45 to 54 Years | 4,365 (92.7%) | 343 (7.3%) |
| 55 to 64 Years | 3,138 (92.9%) | 239 (7.1%) |
| 65 to 74 Years | 3,265 (99.1%) | 31 (0.9%) |
| 75 Years and older | 2,262 (100.0%) | 0 (0.0%) |
| Total | 49,055 (92.3%) | 4,117 (7.7%) |
Health Insurance Coverage by Citizenship Status in Bozeman
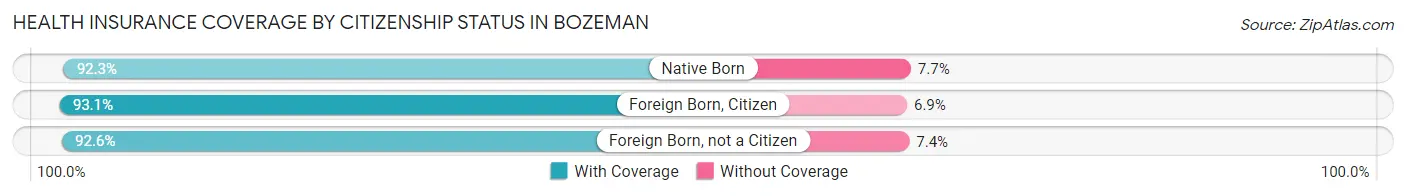
| Citizenship Status | With Coverage | Without Coverage |
| Native Born | 2,064 (92.3%) | 172 (7.7%) |
| Foreign Born, Citizen | 6,067 (93.1%) | 452 (6.9%) |
| Foreign Born, not a Citizen | 13,774 (92.6%) | 1,097 (7.4%) |
Health Insurance Coverage by Household Income in Bozeman
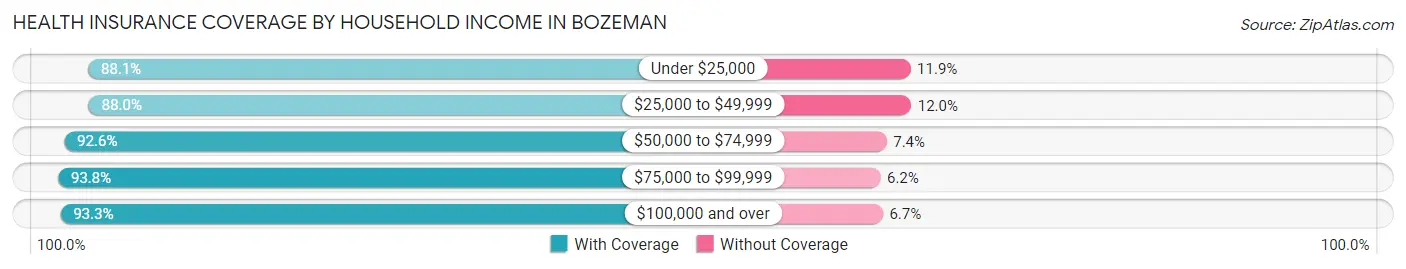
| Household Income | With Coverage | Without Coverage |
| Under $25,000 | 4,375 (88.1%) | 589 (11.9%) |
| $25,000 to $49,999 | 7,428 (88.0%) | 1,012 (12.0%) |
| $50,000 to $74,999 | 7,904 (92.6%) | 632 (7.4%) |
| $75,000 to $99,999 | 6,010 (93.8%) | 399 (6.2%) |
| $100,000 and over | 19,547 (93.3%) | 1,400 (6.7%) |
Public vs Private Health Insurance Coverage by Age in Bozeman
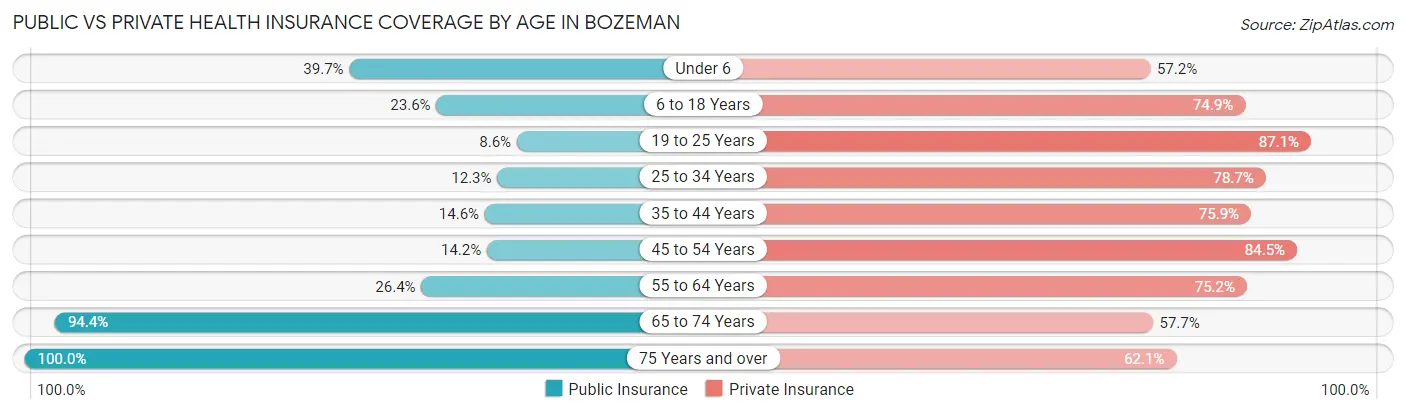
| Age Bracket | Public Insurance | Private Insurance |
| Under 6 | 888 (39.7%) | 1,279 (57.2%) |
| 6 to 18 Years | 1,536 (23.6%) | 4,880 (74.9%) |
| 19 to 25 Years | 1,282 (8.6%) | 12,948 (87.1%) |
| 25 to 34 Years | 1,223 (12.2%) | 7,853 (78.7%) |
| 35 to 44 Years | 862 (14.6%) | 4,496 (75.9%) |
| 45 to 54 Years | 667 (14.2%) | 3,977 (84.5%) |
| 55 to 64 Years | 890 (26.4%) | 2,538 (75.2%) |
| 65 to 74 Years | 3,110 (94.4%) | 1,901 (57.7%) |
| 75 Years and over | 2,262 (100.0%) | 1,404 (62.1%) |
| Total | 12,720 (23.9%) | 41,276 (77.6%) |
Disability Status by Sex by Age in Bozeman
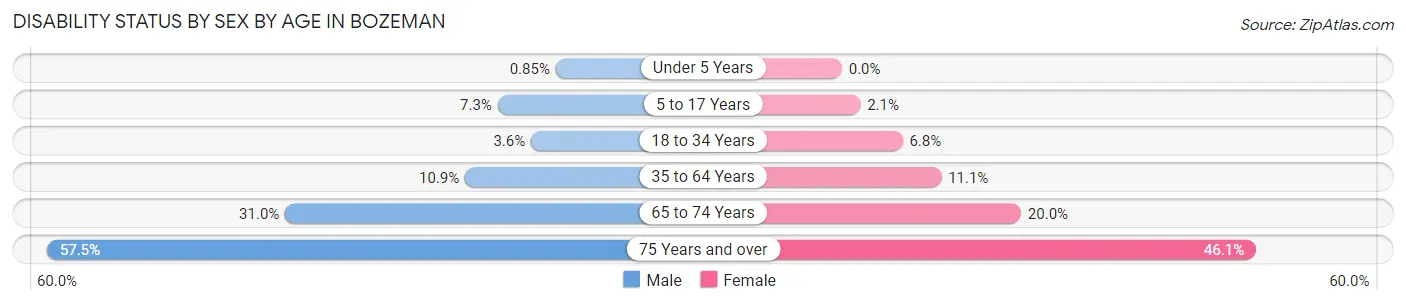
| Age Bracket | Male | Female |
| Under 5 Years | 8 (0.9%) | 0 (0.0%) |
| 5 to 17 Years | 204 (7.3%) | 51 (2.1%) |
| 18 to 34 Years | 524 (3.6%) | 810 (6.8%) |
| 35 to 64 Years | 808 (10.9%) | 733 (11.1%) |
| 65 to 74 Years | 473 (31.0%) | 353 (20.0%) |
| 75 Years and over | 543 (57.5%) | 608 (46.1%) |
Disability Class by Sex by Age in Bozeman
Disability Class: Hearing Difficulty
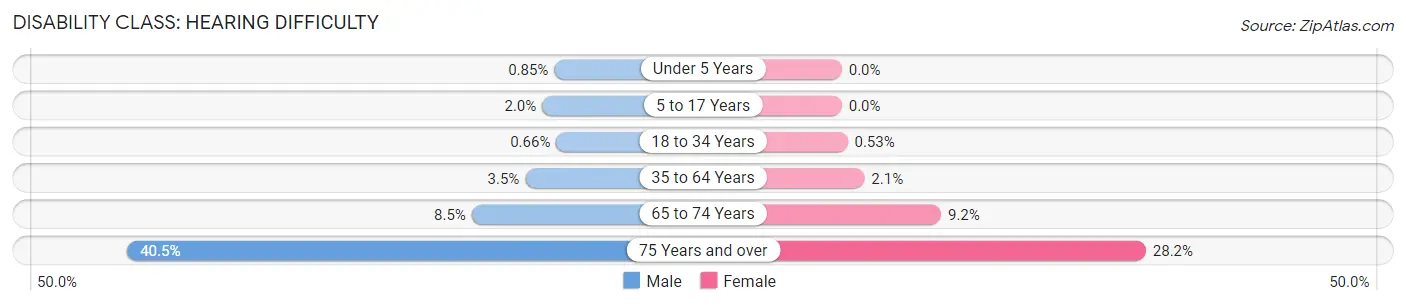
| Age Bracket | Male | Female |
| Under 5 Years | 8 (0.9%) | 0 (0.0%) |
| 5 to 17 Years | 55 (2.0%) | 0 (0.0%) |
| 18 to 34 Years | 96 (0.7%) | 63 (0.5%) |
| 35 to 64 Years | 261 (3.5%) | 139 (2.1%) |
| 65 to 74 Years | 130 (8.5%) | 163 (9.2%) |
| 75 Years and over | 382 (40.5%) | 372 (28.2%) |
Disability Class: Vision Difficulty
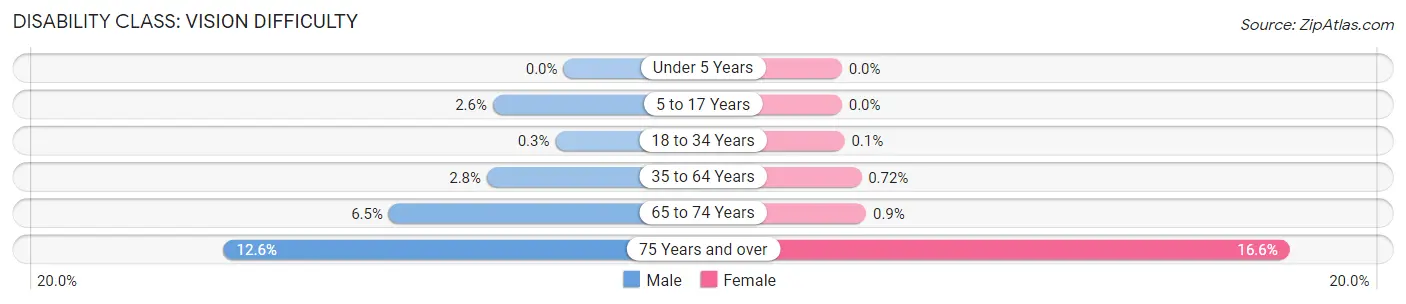
| Age Bracket | Male | Female |
| Under 5 Years | 0 (0.0%) | 0 (0.0%) |
| 5 to 17 Years | 73 (2.6%) | 0 (0.0%) |
| 18 to 34 Years | 43 (0.3%) | 12 (0.1%) |
| 35 to 64 Years | 210 (2.8%) | 48 (0.7%) |
| 65 to 74 Years | 99 (6.5%) | 16 (0.9%) |
| 75 Years and over | 119 (12.6%) | 219 (16.6%) |
Disability Class: Cognitive Difficulty
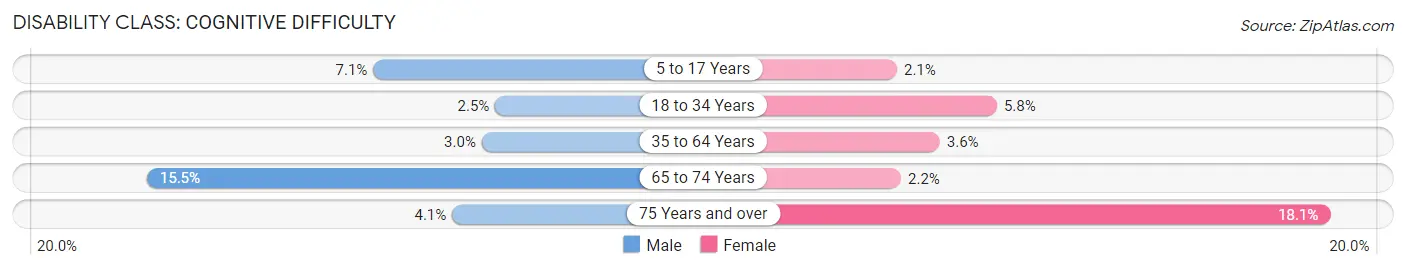
| Age Bracket | Male | Female |
| 5 to 17 Years | 197 (7.1%) | 51 (2.1%) |
| 18 to 34 Years | 368 (2.5%) | 690 (5.8%) |
| 35 to 64 Years | 224 (3.0%) | 241 (3.6%) |
| 65 to 74 Years | 236 (15.5%) | 39 (2.2%) |
| 75 Years and over | 39 (4.1%) | 239 (18.1%) |
Disability Class: Ambulatory Difficulty
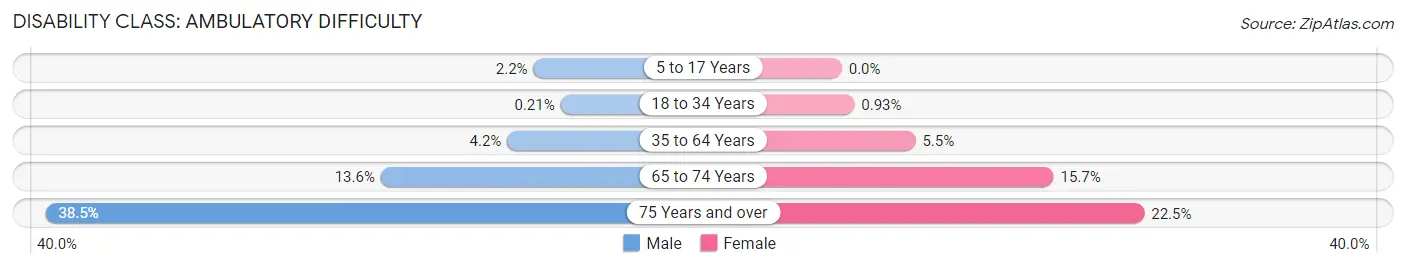
| Age Bracket | Male | Female |
| 5 to 17 Years | 62 (2.2%) | 0 (0.0%) |
| 18 to 34 Years | 30 (0.2%) | 111 (0.9%) |
| 35 to 64 Years | 308 (4.2%) | 362 (5.5%) |
| 65 to 74 Years | 207 (13.6%) | 278 (15.7%) |
| 75 Years and over | 363 (38.5%) | 296 (22.5%) |
Disability Class: Self-Care Difficulty
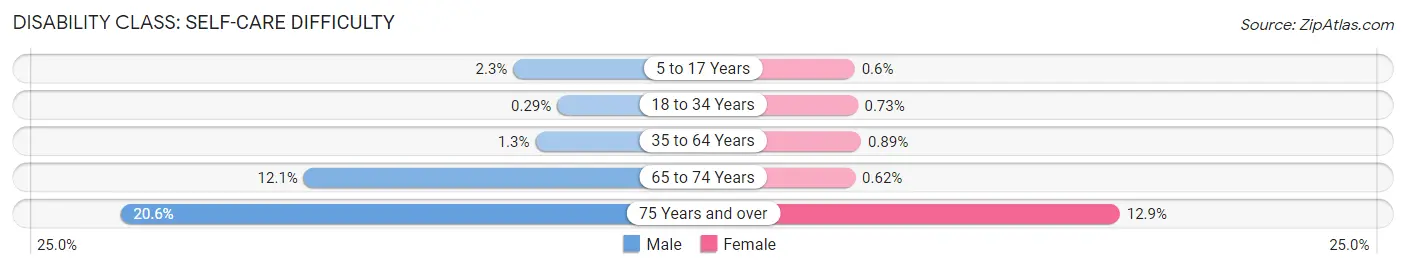
| Age Bracket | Male | Female |
| 5 to 17 Years | 65 (2.3%) | 15 (0.6%) |
| 18 to 34 Years | 42 (0.3%) | 87 (0.7%) |
| 35 to 64 Years | 96 (1.3%) | 59 (0.9%) |
| 65 to 74 Years | 184 (12.0%) | 11 (0.6%) |
| 75 Years and over | 194 (20.5%) | 170 (12.9%) |
Technology Access in Bozeman
Computing Device Access in Bozeman
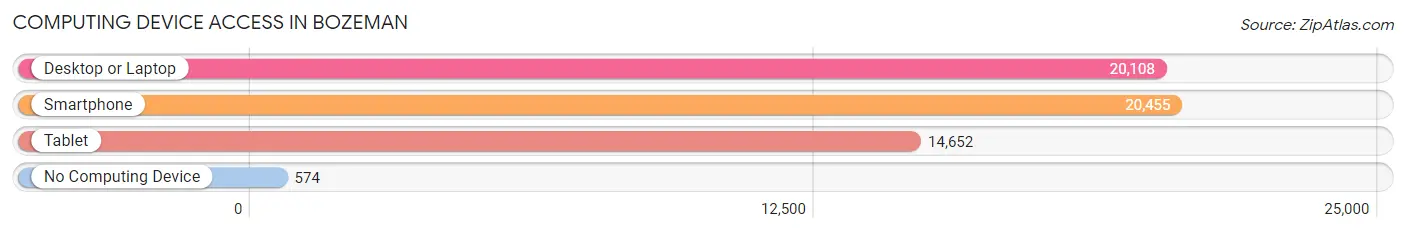
| Device Type | # Households | % Households |
| Desktop or Laptop | 20,108 | 91.2% |
| Smartphone | 20,455 | 92.8% |
| Tablet | 14,652 | 66.5% |
| No Computing Device | 574 | 2.6% |
| Total | 22,041 | 100.0% |
Internet Access in Bozeman
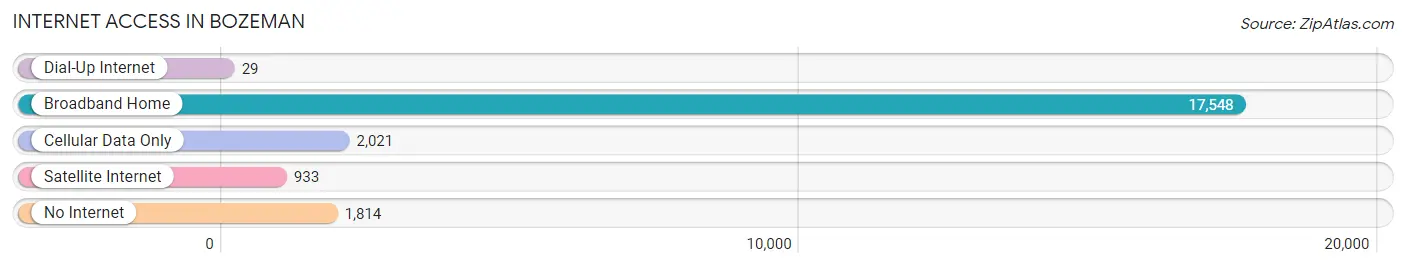
| Internet Type | # Households | % Households |
| Dial-Up Internet | 29 | 0.1% |
| Broadband Home | 17,548 | 79.6% |
| Cellular Data Only | 2,021 | 9.2% |
| Satellite Internet | 933 | 4.2% |
| No Internet | 1,814 | 8.2% |
| Total | 22,041 | 100.0% |
Bozeman Summary
Bozeman, Montana is a city located in the southwestern part of the state, in the Gallatin Valley. It is the county seat of Gallatin County and the principal city of the Bozeman, Montana Metropolitan Statistical Area. Bozeman is the fourth largest city in Montana, with a population of approximately 45,250 as of the 2019 census.
History
The area that is now Bozeman was first inhabited by Native American tribes, including the Shoshone, Crow, and Blackfeet. The first European settlers arrived in the area in the early 1860s, and the city was officially founded in 1864. The city was named after John M. Bozeman, a prospector and trailblazer who helped establish the Bozeman Trail, a route that connected the Oregon Trail to the gold fields of Montana.
The city quickly grew in the late 19th century, becoming an important hub for the mining, ranching, and agricultural industries. Bozeman was also home to Montana State University, which was founded in 1893. The university has since grown to become one of the largest universities in the state.
Geography
Bozeman is located in the Gallatin Valley, which is surrounded by the Bridger, Gallatin, and Madison mountain ranges. The city is situated at an elevation of 4,820 feet (1,470 m). The Gallatin River runs through the city, and the nearby Hyalite Reservoir is a popular recreational area.
The city has a total area of 11.2 square miles (29 km2), of which 11.1 square miles (29 km2) is land and 0.1 square miles (0.26 km2) is water.
Economy
Bozeman is a major economic center in the state of Montana. The city is home to a variety of industries, including tourism, education, healthcare, and technology. The city is also a major hub for the agricultural and ranching industries, and is home to several large companies, including Bozeman Health, Bozeman Brewing Company, and Bozeman Technologies.
Demographics
As of the 2019 census, Bozeman had a population of 45,250. The racial makeup of the city was 90.2% White, 2.2% Native American, 2.2% Asian, 1.7% African American, 0.2% Pacific Islander, and 3.7% from other races. The median household income was $50,945, and the median family income was $63,945. The per capita income was $30,945.
Bozeman is a diverse city, with a variety of religious and cultural backgrounds. The city is home to a variety of churches, including Catholic, Lutheran, Methodist, and Presbyterian. The city also has a large Jewish community, and is home to the Bozeman Synagogue.
Conclusion
Bozeman, Montana is a vibrant city located in the southwestern part of the state. The city has a rich history, and is home to a variety of industries, including tourism, education, healthcare, and technology. Bozeman is also a diverse city, with a variety of religious and cultural backgrounds. The city has a population of 45,250, and a median household income of $50,945. Bozeman is an important economic center in the state of Montana, and is a great place to live and work.
Common Questions
What is Per Capita Income in Bozeman?
Per Capita income in Bozeman is $45,037.
What is the Median Family Income in Bozeman?
Median Family Income in Bozeman is $104,864.
What is the Median Household income in Bozeman?
Median Household Income in Bozeman is $74,113.
What is Income or Wage Gap in Bozeman?
Income or Wage Gap in Bozeman is 37.4%.
Women in Bozeman earn 62.6 cents for every dollar earned by a man.
What is Family Income Deficit in Bozeman?
Family Income Deficit in Bozeman is $8,051.
Families that are below poverty line in Bozeman earn $8,051 less on average than the poverty threshold level.
What is Inequality or Gini Index in Bozeman?
Inequality or Gini Index in Bozeman is 0.49.
What is the Total Population of Bozeman?
Total Population of Bozeman is 53,500.
What is the Total Male Population of Bozeman?
Total Male Population of Bozeman is 28,338.
What is the Total Female Population of Bozeman?
Total Female Population of Bozeman is 25,162.
What is the Ratio of Males per 100 Females in Bozeman?
There are 112.62 Males per 100 Females in Bozeman.
What is the Ratio of Females per 100 Males in Bozeman?
There are 88.79 Females per 100 Males in Bozeman.
What is the Median Population Age in Bozeman?
Median Population Age in Bozeman is 28.2 Years.
What is the Average Family Size in Bozeman
Average Family Size in Bozeman is 2.7 People.
What is the Average Household Size in Bozeman
Average Household Size in Bozeman is 2.2 People.
How Large is the Labor Force in Bozeman?
There are 33,648 People in the Labor Forcein in Bozeman.
What is the Percentage of People in the Labor Force in Bozeman?
71.4% of People are in the Labor Force in Bozeman.
What is the Unemployment Rate in Bozeman?
Unemployment Rate in Bozeman is 2.8%.