Manhattan, MT Map & Demographics
Manhattan Map
Manhattan Overview
$35,703
PER CAPITA INCOME
$104,159
AVG FAMILY INCOME
$57,045
AVG HOUSEHOLD INCOME
7.4%
WAGE / INCOME GAP [ % ]
92.6¢/ $1
WAGE / INCOME GAP [ $ ]
0.46
INEQUALITY / GINI INDEX
1,986
TOTAL POPULATION
1,148
MALE POPULATION
838
FEMALE POPULATION
136.99
MALES / 100 FEMALES
73.00
FEMALES / 100 MALES
39.6
MEDIAN AGE
3.3
AVG FAMILY SIZE
2.4
AVG HOUSEHOLD SIZE
1,042
LABOR FORCE [ PEOPLE ]
75.1%
PERCENT IN LABOR FORCE
Manhattan Zip Codes
Manhattan Area Codes
Income in Manhattan
Income Overview in Manhattan
Per Capita Income in Manhattan is $35,703, while median incomes of families and households are $104,159 and $57,045 respectively.
| Characteristic | Number | Measure |
| Per Capita Income | 1,986 | $35,703 |
| Median Family Income | 477 | $104,159 |
| Mean Family Income | 477 | $127,204 |
| Median Household Income | 830 | $57,045 |
| Mean Household Income | 830 | $90,517 |
| Income Deficit | 477 | $0 |
| Wage / Income Gap (%) | 1,986 | 7.45% |
| Wage / Income Gap ($) | 1,986 | 92.55¢ per $1 |
| Gini / Inequality Index | 1,986 | 0.46 |
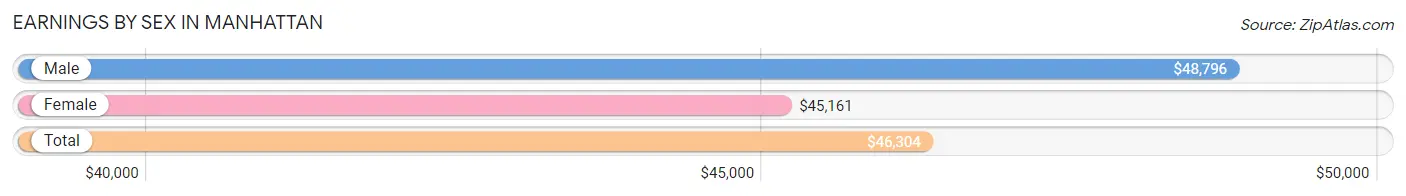
Earnings by Sex in Manhattan
Average Earnings in Manhattan are $46,304, $48,796 for men and $45,161 for women, a difference of 7.4%.
| Sex | Number | Average Earnings |
| Male | 606 (56.7%) | $48,796 |
| Female | 462 (43.3%) | $45,161 |
| Total | 1,068 (100.0%) | $46,304 |
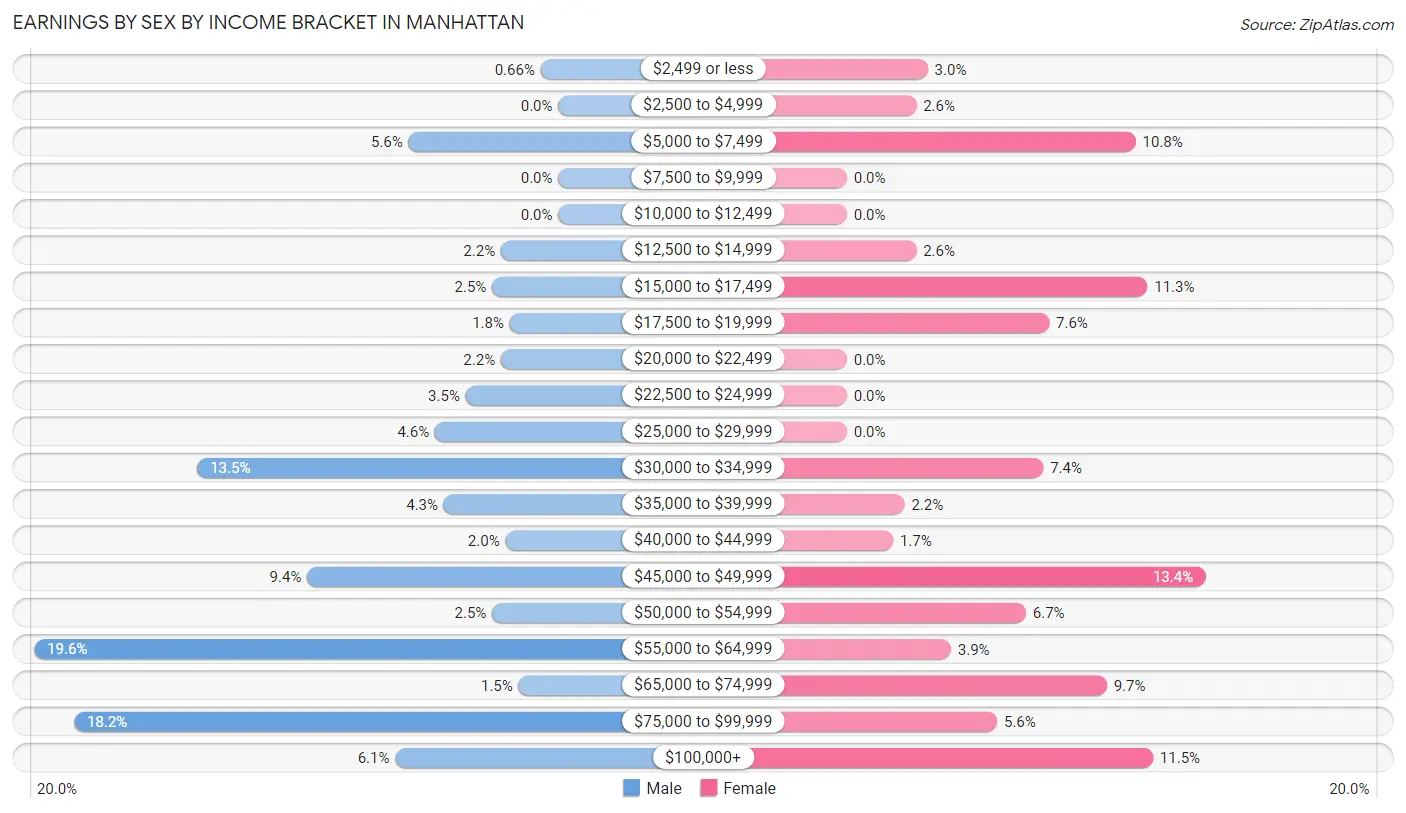
Earnings by Sex by Income Bracket in Manhattan
The most common earnings brackets in Manhattan are $55,000 to $64,999 for men (119 | 19.6%) and $45,000 to $49,999 for women (62 | 13.4%).
| Income | Male | Female |
| $2,499 or less | 4 (0.7%) | 14 (3.0%) |
| $2,500 to $4,999 | 0 (0.0%) | 12 (2.6%) |
| $5,000 to $7,499 | 34 (5.6%) | 50 (10.8%) |
| $7,500 to $9,999 | 0 (0.0%) | 0 (0.0%) |
| $10,000 to $12,499 | 0 (0.0%) | 0 (0.0%) |
| $12,500 to $14,999 | 13 (2.1%) | 12 (2.6%) |
| $15,000 to $17,499 | 15 (2.5%) | 52 (11.3%) |
| $17,500 to $19,999 | 11 (1.8%) | 35 (7.6%) |
| $20,000 to $22,499 | 13 (2.1%) | 0 (0.0%) |
| $22,500 to $24,999 | 21 (3.5%) | 0 (0.0%) |
| $25,000 to $29,999 | 28 (4.6%) | 0 (0.0%) |
| $30,000 to $34,999 | 82 (13.5%) | 34 (7.4%) |
| $35,000 to $39,999 | 26 (4.3%) | 10 (2.2%) |
| $40,000 to $44,999 | 12 (2.0%) | 8 (1.7%) |
| $45,000 to $49,999 | 57 (9.4%) | 62 (13.4%) |
| $50,000 to $54,999 | 15 (2.5%) | 31 (6.7%) |
| $55,000 to $64,999 | 119 (19.6%) | 18 (3.9%) |
| $65,000 to $74,999 | 9 (1.5%) | 45 (9.7%) |
| $75,000 to $99,999 | 110 (18.1%) | 26 (5.6%) |
| $100,000+ | 37 (6.1%) | 53 (11.5%) |
| Total | 606 (100.0%) | 462 (100.0%) |
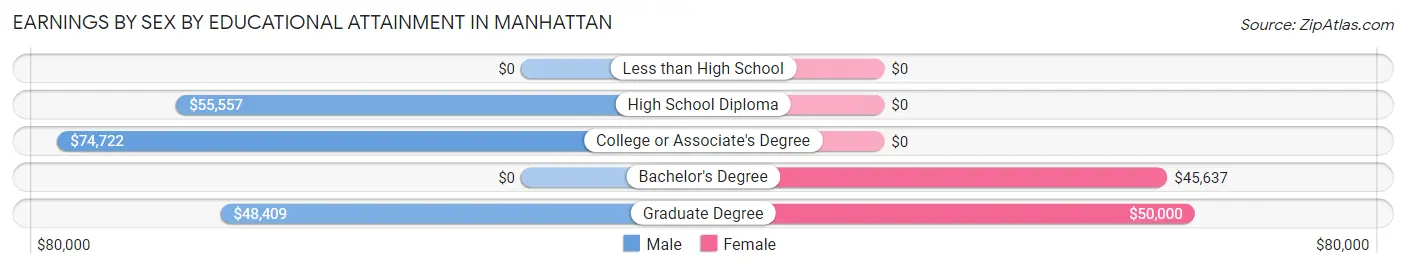
Earnings by Sex by Educational Attainment in Manhattan
Average earnings in Manhattan are $55,731 for men and $45,161 for women, a difference of 19.0%. Men with an educational attainment of college or associate's degree enjoy the highest average annual earnings of $74,722, while those with graduate degree education earn the least with $48,409. Women with an educational attainment of graduate degree earn the most with the average annual earnings of $50,000, while those with bachelor's degree education have the smallest earnings of $45,637.
| Educational Attainment | Male Income | Female Income |
| Less than High School | - | - |
| High School Diploma | $55,557 | $0 |
| College or Associate's Degree | $74,722 | $0 |
| Bachelor's Degree | - | - |
| Graduate Degree | $48,409 | $50,000 |
| Total | $55,731 | $45,161 |
Family Income in Manhattan
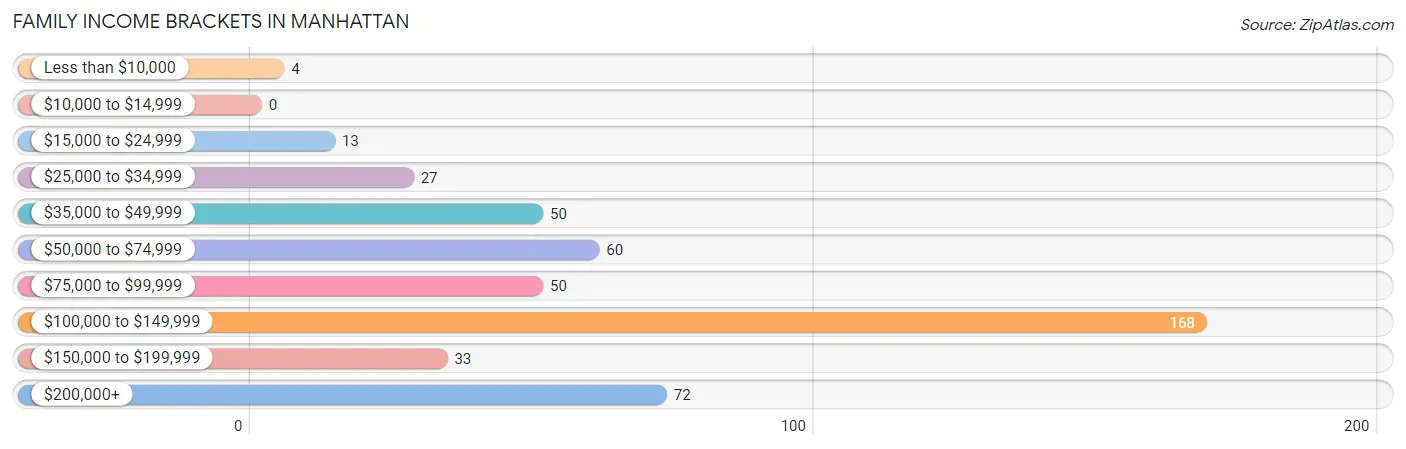
Family Income Brackets in Manhattan
According to the Manhattan family income data, there are 168 families falling into the $100,000 to $149,999 income range, which is the most common income bracket and makes up 35.2% of all families.
| Income Bracket | # Families | % Families |
| Less than $10,000 | 4 | 0.8% |
| $10,000 to $14,999 | 0 | 0.0% |
| $15,000 to $24,999 | 13 | 2.7% |
| $25,000 to $34,999 | 27 | 5.7% |
| $35,000 to $49,999 | 50 | 10.5% |
| $50,000 to $74,999 | 60 | 12.6% |
| $75,000 to $99,999 | 50 | 10.5% |
| $100,000 to $149,999 | 168 | 35.2% |
| $150,000 to $199,999 | 33 | 6.9% |
| $200,000+ | 72 | 15.1% |
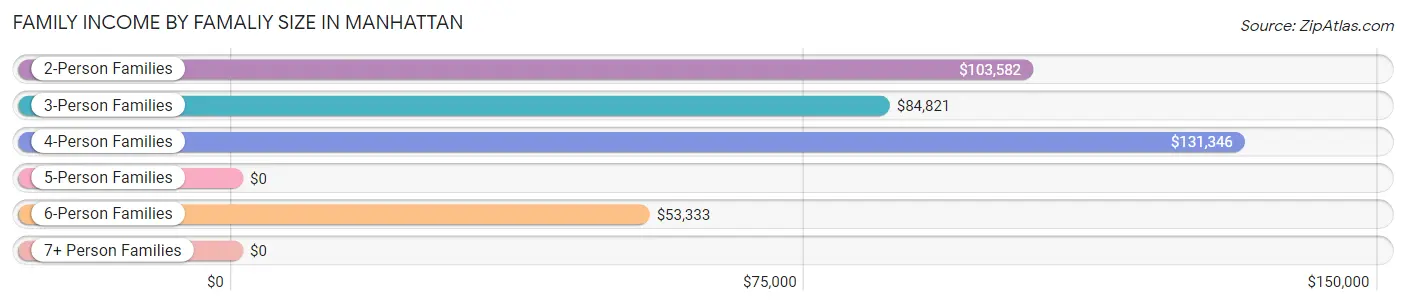
Family Income by Famaliy Size in Manhattan
4-person families (198 | 41.5%) account for the highest median family income in Manhattan with $131,346 per family, while 2-person families (193 | 40.5%) have the highest median income of $51,791 per family member.
| Income Bracket | # Families | Median Income |
| 2-Person Families | 193 (40.5%) | $103,582 |
| 3-Person Families | 46 (9.6%) | $84,821 |
| 4-Person Families | 198 (41.5%) | $131,346 |
| 5-Person Families | 0 (0.0%) | $0 |
| 6-Person Families | 34 (7.1%) | $53,333 |
| 7+ Person Families | 6 (1.3%) | $0 |
| Total | 477 (100.0%) | $104,159 |
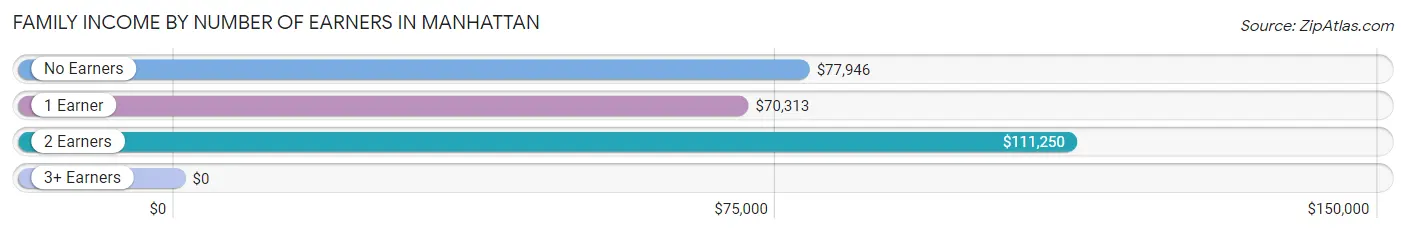
Family Income by Number of Earners in Manhattan
| Number of Earners | # Families | Median Income |
| No Earners | 31 (6.5%) | $77,946 |
| 1 Earner | 125 (26.2%) | $70,313 |
| 2 Earners | 263 (55.1%) | $111,250 |
| 3+ Earners | 58 (12.2%) | $0 |
| Total | 477 (100.0%) | $104,159 |
Household Income in Manhattan
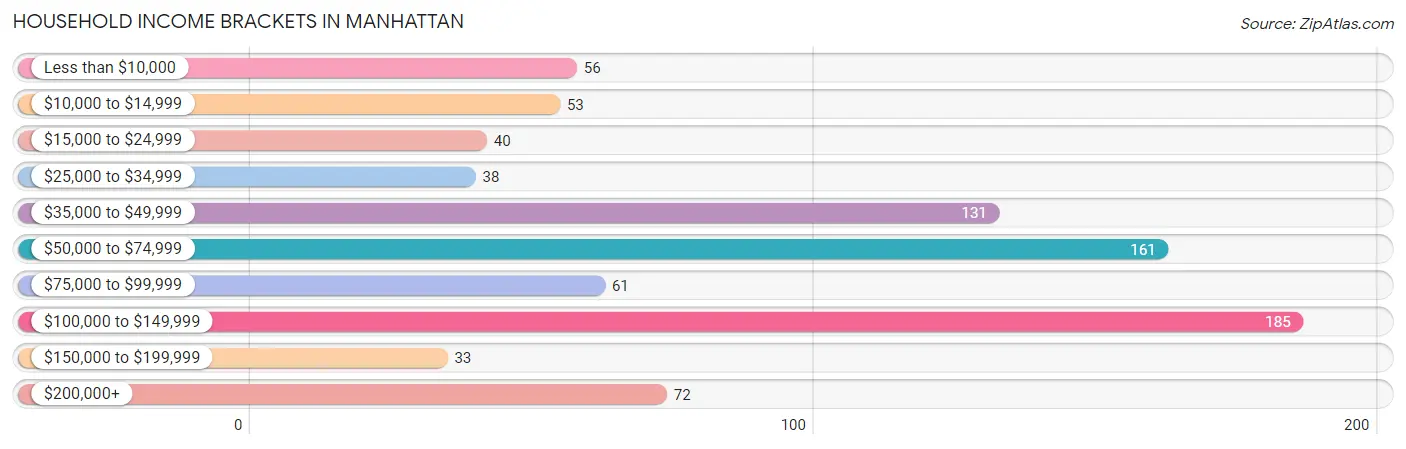
Household Income Brackets in Manhattan
With 185 households falling in the category, the $100,000 to $149,999 income range is the most frequent in Manhattan, accounting for 22.3% of all households. In contrast, only 33 households (4.0%) fall into the $150,000 to $199,999 income bracket, making it the least populous group.
| Income Bracket | # Households | % Households |
| Less than $10,000 | 56 | 6.7% |
| $10,000 to $14,999 | 53 | 6.4% |
| $15,000 to $24,999 | 40 | 4.8% |
| $25,000 to $34,999 | 38 | 4.6% |
| $35,000 to $49,999 | 131 | 15.8% |
| $50,000 to $74,999 | 161 | 19.4% |
| $75,000 to $99,999 | 61 | 7.3% |
| $100,000 to $149,999 | 185 | 22.3% |
| $150,000 to $199,999 | 33 | 4.0% |
| $200,000+ | 72 | 8.7% |
Household Income by Householder Age in Manhattan
The median household income in Manhattan is $57,045, with the highest median household income of $102,885 found in the 45 to 64 years age bracket for the primary householder. A total of 354 households (42.6%) fall into this category. Meanwhile, the 15 to 24 years age bracket for the primary householder has the lowest median household income of $0, with 13 households (1.6%) in this group.
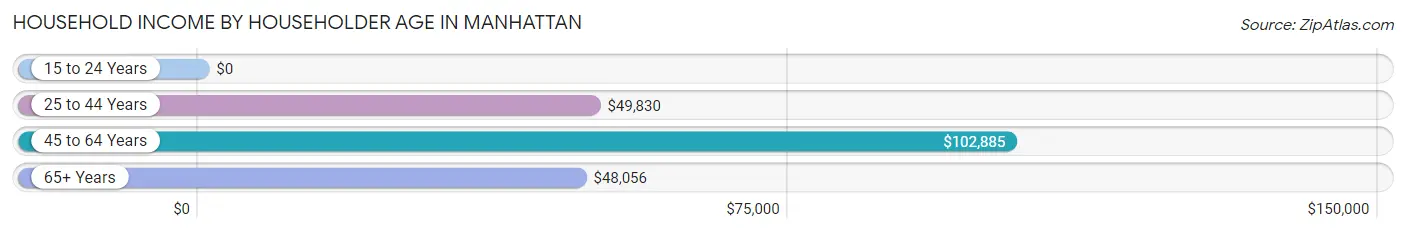
| Income Bracket | # Households | Median Income |
| 15 to 24 Years | 13 (1.6%) | $0 |
| 25 to 44 Years | 207 (24.9%) | $49,830 |
| 45 to 64 Years | 354 (42.6%) | $102,885 |
| 65+ Years | 256 (30.8%) | $48,056 |
| Total | 830 (100.0%) | $57,045 |
Poverty in Manhattan
Income Below Poverty by Sex and Age in Manhattan
With 8.0% poverty level for males and 13.5% for females among the residents of Manhattan, 16 and 17 year old males and 75 year old and over females are the most vulnerable to poverty, with 11 males (40.7%) and 27 females (45.0%) in their respective age groups living below the poverty level.
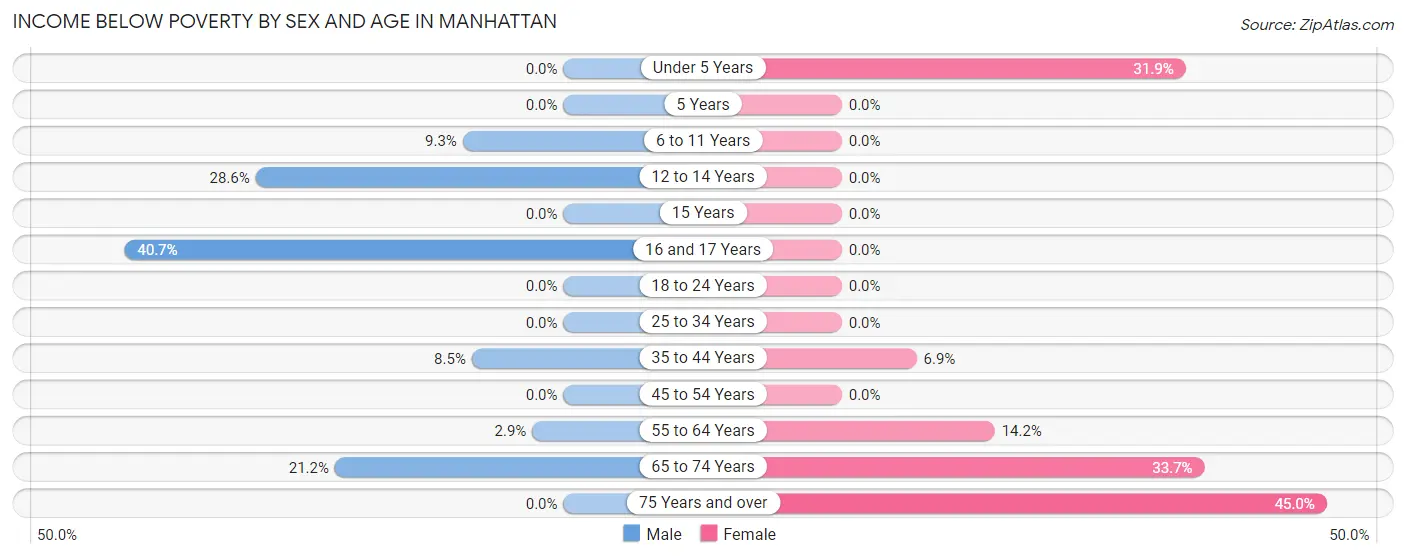
| Age Bracket | Male | Female |
| Under 5 Years | 0 (0.0%) | 15 (31.9%) |
| 5 Years | 0 (0.0%) | 0 (0.0%) |
| 6 to 11 Years | 27 (9.3%) | 0 (0.0%) |
| 12 to 14 Years | 14 (28.6%) | 0 (0.0%) |
| 15 Years | 0 (0.0%) | 0 (0.0%) |
| 16 and 17 Years | 11 (40.7%) | 0 (0.0%) |
| 18 to 24 Years | 0 (0.0%) | 0 (0.0%) |
| 25 to 34 Years | 0 (0.0%) | 0 (0.0%) |
| 35 to 44 Years | 13 (8.5%) | 12 (6.9%) |
| 45 to 54 Years | 0 (0.0%) | 0 (0.0%) |
| 55 to 64 Years | 5 (2.9%) | 21 (14.2%) |
| 65 to 74 Years | 21 (21.2%) | 35 (33.7%) |
| 75 Years and over | 0 (0.0%) | 27 (45.0%) |
| Total | 91 (8.0%) | 110 (13.5%) |
Income Above Poverty by Sex and Age in Manhattan
According to the poverty statistics in Manhattan, males aged under 5 years and females aged 6 to 11 years are the age groups that are most secure financially, with 100.0% of males and 100.0% of females in these age groups living above the poverty line.
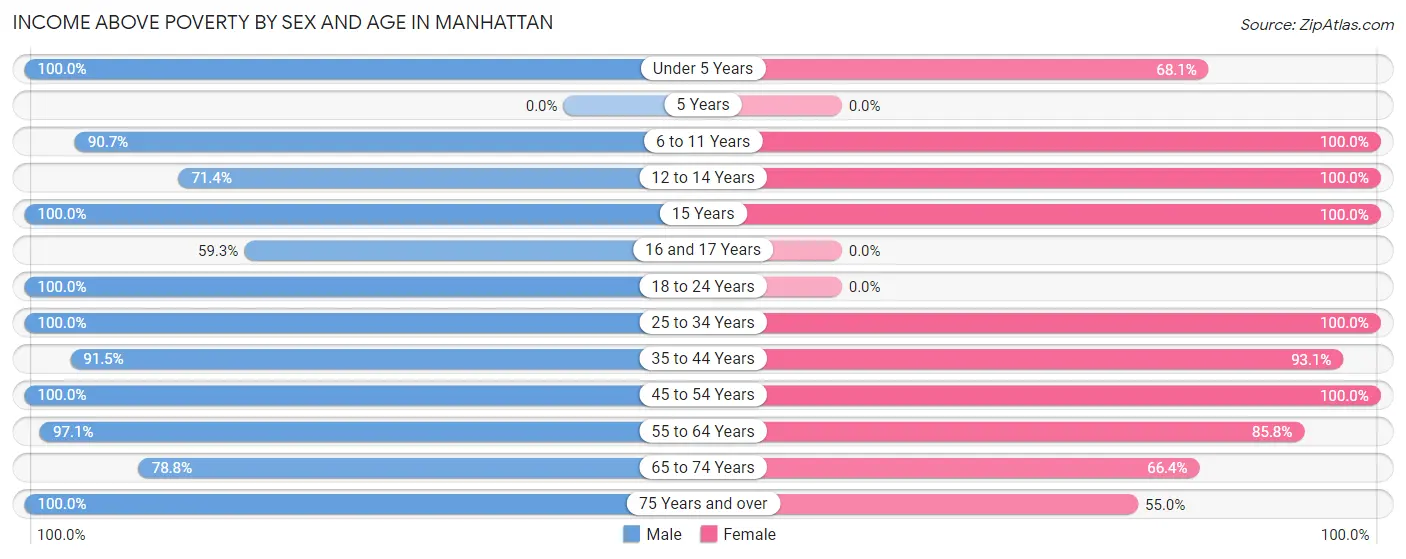
| Age Bracket | Male | Female |
| Under 5 Years | 45 (100.0%) | 32 (68.1%) |
| 5 Years | 0 (0.0%) | 0 (0.0%) |
| 6 to 11 Years | 262 (90.7%) | 79 (100.0%) |
| 12 to 14 Years | 35 (71.4%) | 54 (100.0%) |
| 15 Years | 10 (100.0%) | 26 (100.0%) |
| 16 and 17 Years | 16 (59.3%) | 0 (0.0%) |
| 18 to 24 Years | 91 (100.0%) | 0 (0.0%) |
| 25 to 34 Years | 26 (100.0%) | 42 (100.0%) |
| 35 to 44 Years | 140 (91.5%) | 161 (93.1%) |
| 45 to 54 Years | 117 (100.0%) | 84 (100.0%) |
| 55 to 64 Years | 168 (97.1%) | 127 (85.8%) |
| 65 to 74 Years | 78 (78.8%) | 69 (66.3%) |
| 75 Years and over | 64 (100.0%) | 33 (55.0%) |
| Total | 1,052 (92.0%) | 707 (86.5%) |
Income Below Poverty Among Married-Couple Families in Manhattan
The poverty statistics for married-couple families in Manhattan show that 4.4% or 17 of the total 390 families live below the poverty line. Families with 3 or 4 children have the highest poverty rate of 38.2%, comprising of 13 families. On the other hand, families with 1 or 2 children have the lowest poverty rate of 0.0%, which includes 0 families.
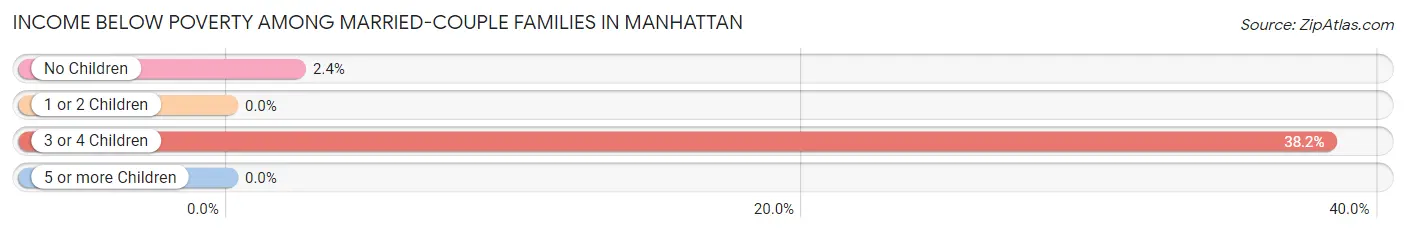
| Children | Above Poverty | Below Poverty |
| No Children | 165 (97.6%) | 4 (2.4%) |
| 1 or 2 Children | 181 (100.0%) | 0 (0.0%) |
| 3 or 4 Children | 21 (61.8%) | 13 (38.2%) |
| 5 or more Children | 6 (100.0%) | 0 (0.0%) |
| Total | 373 (95.6%) | 17 (4.4%) |
Income Below Poverty Among Single-Parent Households in Manhattan
| Children | Single Father | Single Mother |
| No Children | 0 (0.0%) | 0 (0.0%) |
| 1 or 2 Children | 0 (0.0%) | 0 (0.0%) |
| 3 or 4 Children | 0 (0.0%) | 0 (0.0%) |
| 5 or more Children | 0 (0.0%) | 0 (0.0%) |
| Total | 0 (0.0%) | 0 (0.0%) |
Income Below Poverty Among Married-Couple vs Single-Parent Households in Manhattan
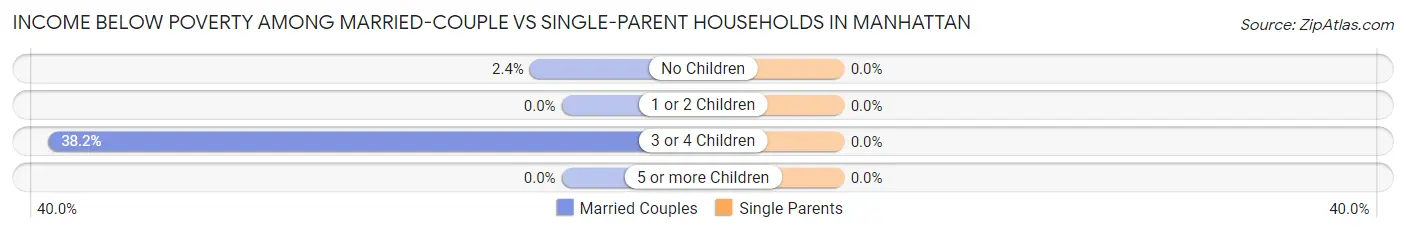
| Children | Married-Couple Families | Single-Parent Households |
| No Children | 4 (2.4%) | 0 (0.0%) |
| 1 or 2 Children | 0 (0.0%) | 0 (0.0%) |
| 3 or 4 Children | 13 (38.2%) | 0 (0.0%) |
| 5 or more Children | 0 (0.0%) | 0 (0.0%) |
| Total | 17 (4.4%) | 0 (0.0%) |
Race in Manhattan
The most populous races in Manhattan are White / Caucasian (1,892 | 95.3%), Two or more Races (71 | 3.6%), and Hispanic or Latino (40 | 2.0%).
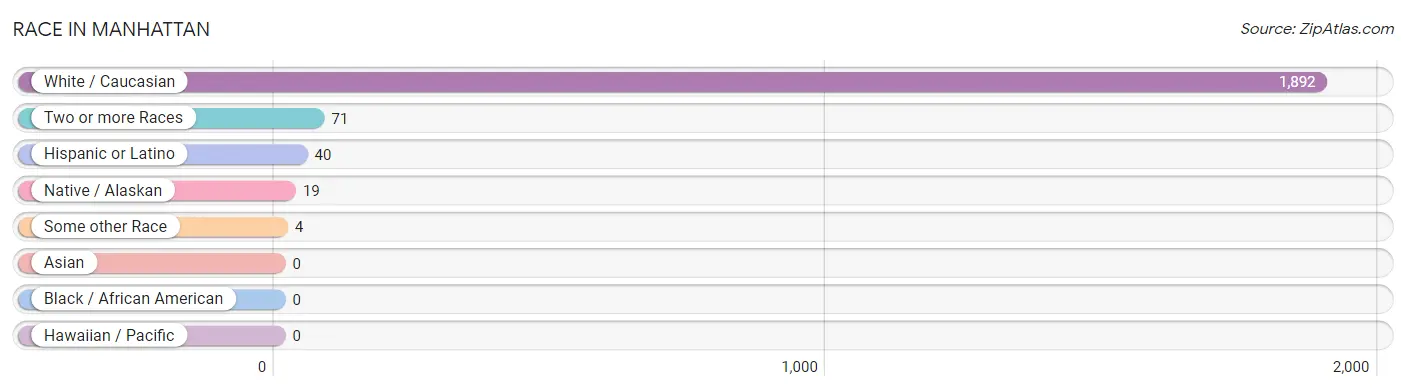
| Race | # Population | % Population |
| Asian | 0 | 0.0% |
| Black / African American | 0 | 0.0% |
| Hawaiian / Pacific | 0 | 0.0% |
| Hispanic or Latino | 40 | 2.0% |
| Native / Alaskan | 19 | 1.0% |
| White / Caucasian | 1,892 | 95.3% |
| Two or more Races | 71 | 3.6% |
| Some other Race | 4 | 0.2% |
| Total | 1,986 | 100.0% |
Ancestry in Manhattan
The most populous ancestries reported in Manhattan are English (606 | 30.5%), German (359 | 18.1%), Irish (337 | 17.0%), Norwegian (330 | 16.6%), and Italian (185 | 9.3%), together accounting for 91.5% of all Manhattan residents.
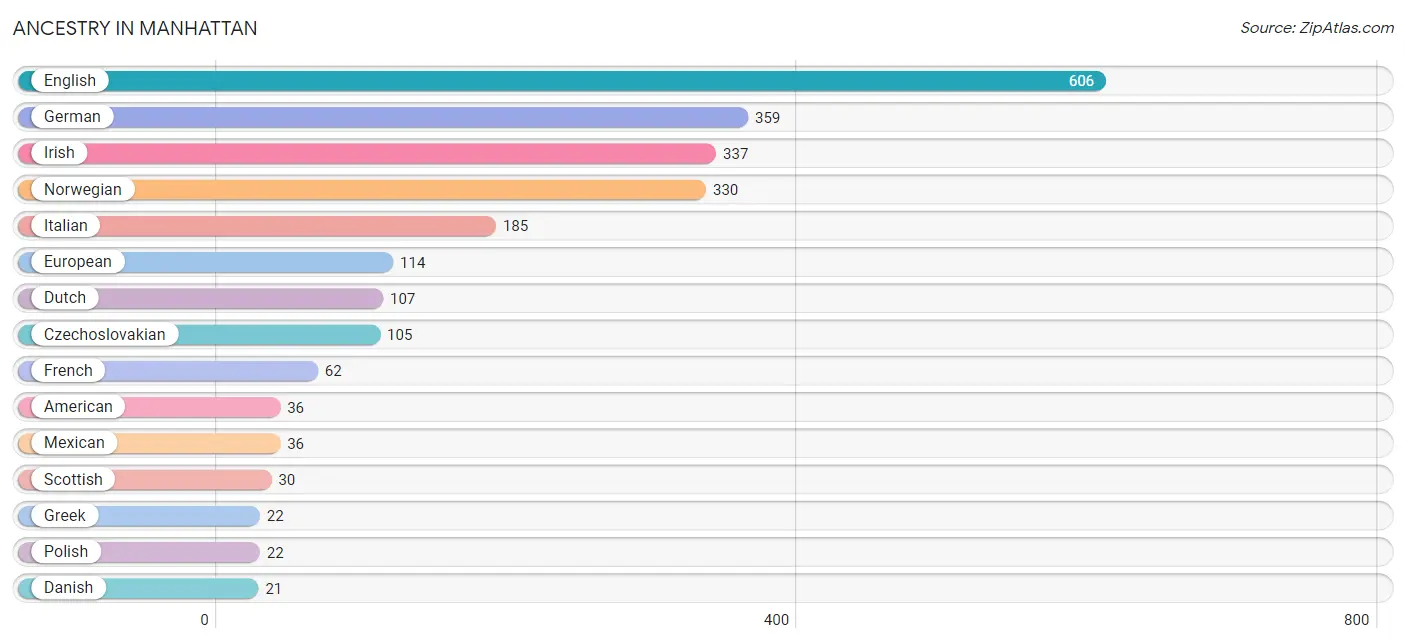
| Ancestry | # Population | % Population |
| Aleut | 6 | 0.3% |
| American | 36 | 1.8% |
| British | 4 | 0.2% |
| Czechoslovakian | 105 | 5.3% |
| Danish | 21 | 1.1% |
| Dutch | 107 | 5.4% |
| English | 606 | 30.5% |
| European | 114 | 5.7% |
| French | 62 | 3.1% |
| German | 359 | 18.1% |
| Greek | 22 | 1.1% |
| Hungarian | 10 | 0.5% |
| Inupiat | 13 | 0.6% |
| Irish | 337 | 17.0% |
| Italian | 185 | 9.3% |
| Korean | 16 | 0.8% |
| Lithuanian | 13 | 0.6% |
| Mexican | 36 | 1.8% |
| Native Hawaiian | 16 | 0.8% |
| Northern European | 18 | 0.9% |
| Norwegian | 330 | 16.6% |
| Polish | 22 | 1.1% |
| Scandinavian | 12 | 0.6% |
| Scotch-Irish | 14 | 0.7% |
| Scottish | 30 | 1.5% |
| Spanish | 4 | 0.2% |
| Swiss | 16 | 0.8% | View All 27 Rows |
Immigrants in Manhattan
The most numerous immigrant groups reported in Manhattan came from Europe (24 | 1.2%), Switzerland (16 | 0.8%), Western Europe (16 | 0.8%), Eastern Europe (8 | 0.4%), and Romania (8 | 0.4%), together accounting for 3.6% of all Manhattan residents.
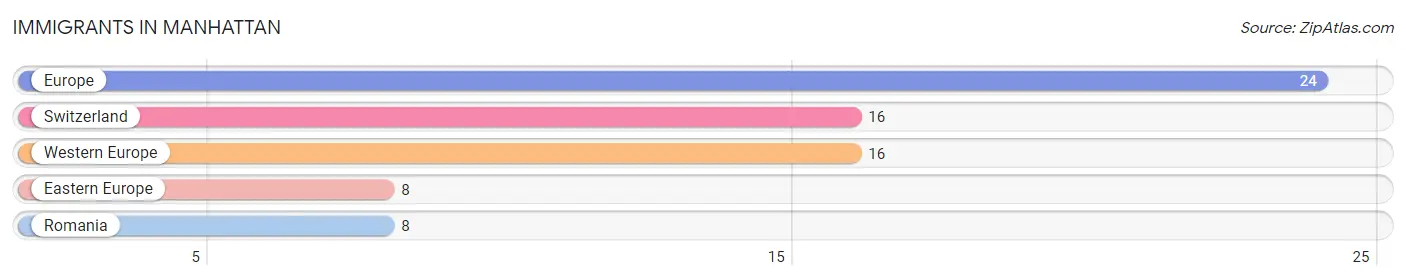
| Immigration Origin | # Population | % Population |
| Eastern Europe | 8 | 0.4% |
| Europe | 24 | 1.2% |
| Romania | 8 | 0.4% |
| Switzerland | 16 | 0.8% |
| Western Europe | 16 | 0.8% | View All 5 Rows |
Sex and Age in Manhattan
Sex and Age in Manhattan
The most populous age groups in Manhattan are 5 to 9 Years (205 | 17.9%) for men and 35 to 39 Years (127 | 15.2%) for women.
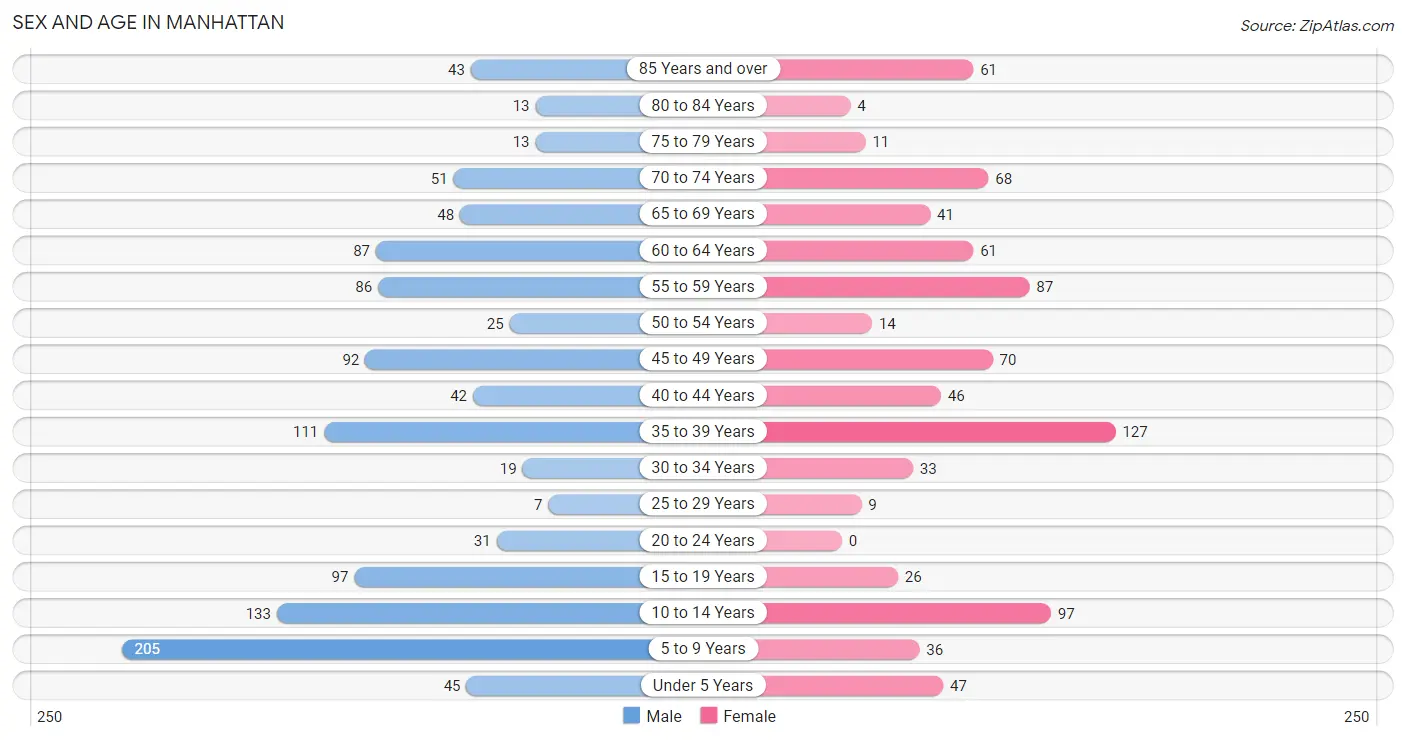
| Age Bracket | Male | Female |
| Under 5 Years | 45 (3.9%) | 47 (5.6%) |
| 5 to 9 Years | 205 (17.9%) | 36 (4.3%) |
| 10 to 14 Years | 133 (11.6%) | 97 (11.6%) |
| 15 to 19 Years | 97 (8.5%) | 26 (3.1%) |
| 20 to 24 Years | 31 (2.7%) | 0 (0.0%) |
| 25 to 29 Years | 7 (0.6%) | 9 (1.1%) |
| 30 to 34 Years | 19 (1.7%) | 33 (3.9%) |
| 35 to 39 Years | 111 (9.7%) | 127 (15.2%) |
| 40 to 44 Years | 42 (3.7%) | 46 (5.5%) |
| 45 to 49 Years | 92 (8.0%) | 70 (8.4%) |
| 50 to 54 Years | 25 (2.2%) | 14 (1.7%) |
| 55 to 59 Years | 86 (7.5%) | 87 (10.4%) |
| 60 to 64 Years | 87 (7.6%) | 61 (7.3%) |
| 65 to 69 Years | 48 (4.2%) | 41 (4.9%) |
| 70 to 74 Years | 51 (4.4%) | 68 (8.1%) |
| 75 to 79 Years | 13 (1.1%) | 11 (1.3%) |
| 80 to 84 Years | 13 (1.1%) | 4 (0.5%) |
| 85 Years and over | 43 (3.7%) | 61 (7.3%) |
| Total | 1,148 (100.0%) | 838 (100.0%) |
Families and Households in Manhattan
Median Family Size in Manhattan
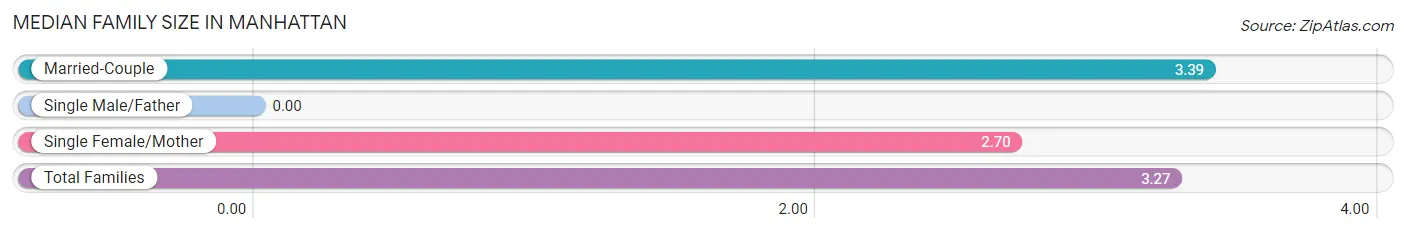
| Family Type | # Families | Family Size |
| Married-Couple | 390 (81.8%) | 3.39 |
| Single Male/Father | 0 (0.0%) | - |
| Single Female/Mother | 87 (18.2%) | 2.70 |
| Total Families | 477 (100.0%) | 3.27 |
Median Household Size in Manhattan
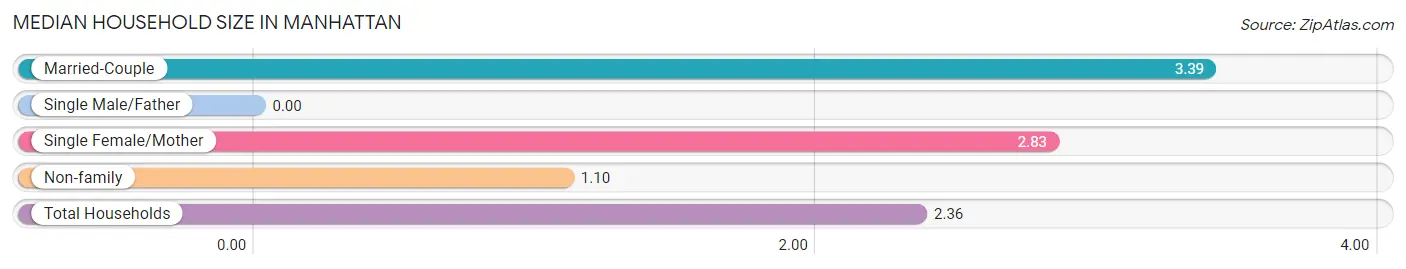
| Household Type | # Households | Household Size |
| Married-Couple | 390 (47.0%) | 3.39 |
| Single Male/Father | 0 (0.0%) | - |
| Single Female/Mother | 87 (10.5%) | 2.83 |
| Non-family | 353 (42.5%) | 1.10 |
| Total Households | 830 (100.0%) | 2.36 |
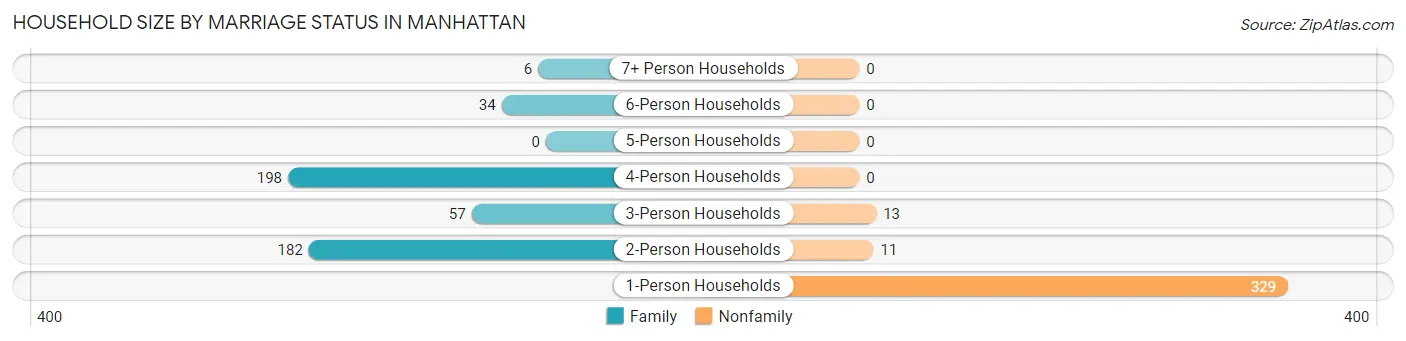
Household Size by Marriage Status in Manhattan
Out of a total of 830 households in Manhattan, 477 (57.5%) are family households, while 353 (42.5%) are nonfamily households. The most numerous type of family households are 4-person households, comprising 198, and the most common type of nonfamily households are 1-person households, comprising 329.
| Household Size | Family Households | Nonfamily Households |
| 1-Person Households | - | 329 (39.6%) |
| 2-Person Households | 182 (21.9%) | 11 (1.3%) |
| 3-Person Households | 57 (6.9%) | 13 (1.6%) |
| 4-Person Households | 198 (23.9%) | 0 (0.0%) |
| 5-Person Households | 0 (0.0%) | 0 (0.0%) |
| 6-Person Households | 34 (4.1%) | 0 (0.0%) |
| 7+ Person Households | 6 (0.7%) | 0 (0.0%) |
| Total | 477 (57.5%) | 353 (42.5%) |
Female Fertility in Manhattan
Fertility by Age in Manhattan
| Age Bracket | Women with Births | Births / 1,000 Women |
| 15 to 19 years | 0 (0.0%) | 0.0 |
| 20 to 34 years | 0 (0.0%) | 0.0 |
| 35 to 50 years | 0 (0.0%) | 0.0 |
| Total | 0 (0.0%) | 0.0 |
Fertility by Age by Marriage Status in Manhattan
| Age Bracket | Married | Unmarried |
| 15 to 19 years | 0 (0.0%) | 0 (0.0%) |
| 20 to 34 years | 0 (0.0%) | 0 (0.0%) |
| 35 to 50 years | 0 (0.0%) | 0 (0.0%) |
| Total | 0 (0.0%) | 0 (0.0%) |
Fertility by Education in Manhattan
| Educational Attainment | Women with Births | Births / 1,000 Women |
| Less than High School | 0 (0.0%) | 0.0 |
| High School Diploma | 0 (0.0%) | 0.0 |
| College or Associate's Degree | 0 (0.0%) | 0.0 |
| Bachelor's Degree | 0 (0.0%) | 0.0 |
| Graduate Degree | 0 (0.0%) | 0.0 |
| Total | 0 (0.0%) | 0.0 |
Fertility by Education by Marriage Status in Manhattan
| Educational Attainment | Married | Unmarried |
| Less than High School | 0 (0.0%) | 0 (0.0%) |
| High School Diploma | 0 (0.0%) | 0 (0.0%) |
| College or Associate's Degree | 0 (0.0%) | 0 (0.0%) |
| Bachelor's Degree | 0 (0.0%) | 0 (0.0%) |
| Graduate Degree | 0 (0.0%) | 0 (0.0%) |
| Total | 0 (0.0%) | 0 (0.0%) |
Employment Characteristics in Manhattan
Employment by Class of Employer in Manhattan
Among the 1,031 employed individuals in Manhattan, private company employees (614 | 59.6%), self-employed (not incorporated) (133 | 12.9%), and self-employed (incorporated) (123 | 11.9%) make up the most common classes of employment.
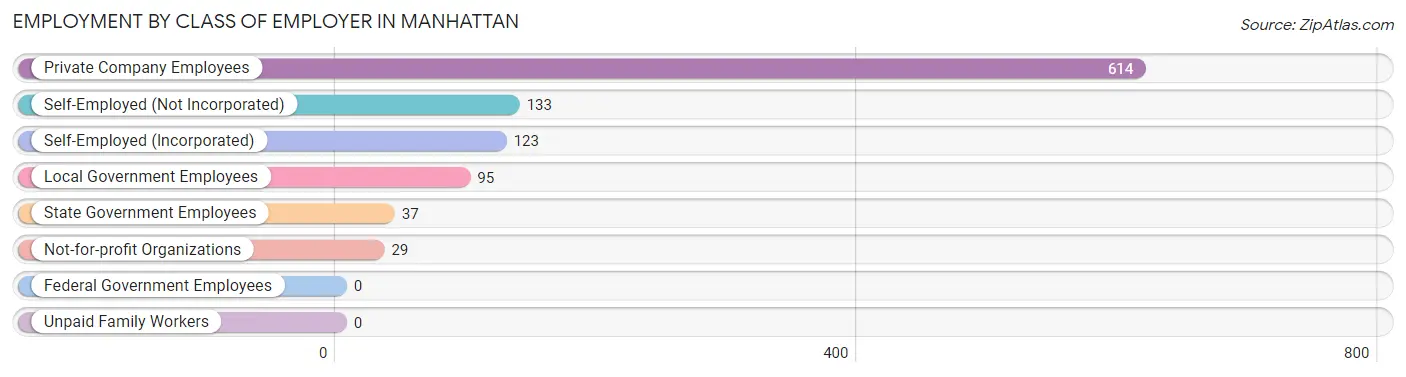
| Employer Class | # Employees | % Employees |
| Private Company Employees | 614 | 59.6% |
| Self-Employed (Incorporated) | 123 | 11.9% |
| Self-Employed (Not Incorporated) | 133 | 12.9% |
| Not-for-profit Organizations | 29 | 2.8% |
| Local Government Employees | 95 | 9.2% |
| State Government Employees | 37 | 3.6% |
| Federal Government Employees | 0 | 0.0% |
| Unpaid Family Workers | 0 | 0.0% |
| Total | 1,031 | 100.0% |
Employment Status by Age in Manhattan
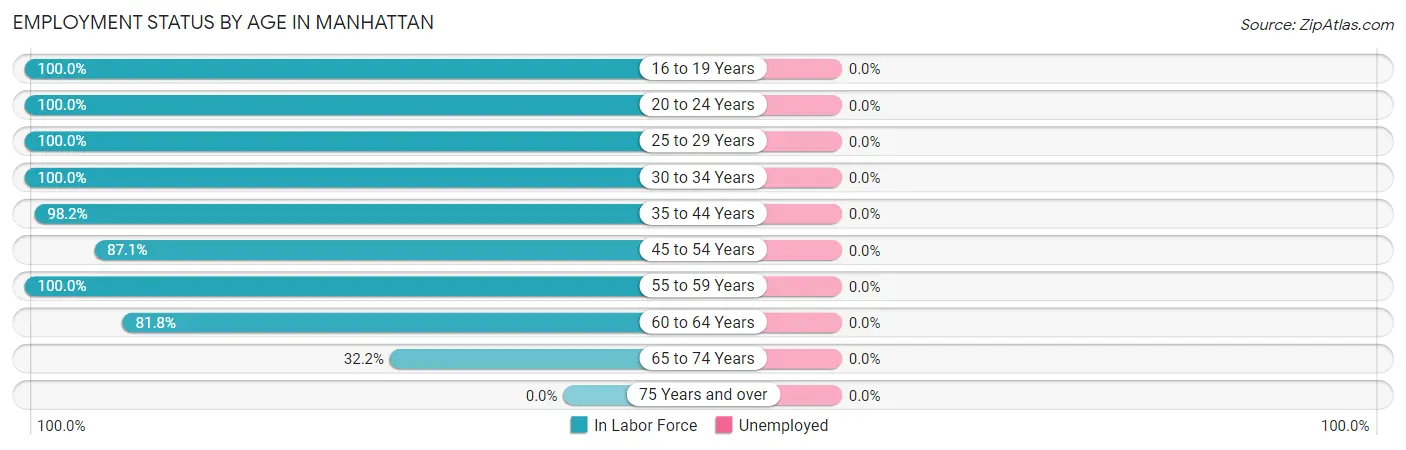
| Age Bracket | In Labor Force | Unemployed |
| 16 to 19 Years | 87 (100.0%) | 0 (0.0%) |
| 20 to 24 Years | 31 (100.0%) | 0 (0.0%) |
| 25 to 29 Years | 16 (100.0%) | 0 (0.0%) |
| 30 to 34 Years | 52 (100.0%) | 0 (0.0%) |
| 35 to 44 Years | 320 (98.2%) | 0 (0.0%) |
| 45 to 54 Years | 175 (87.1%) | 0 (0.0%) |
| 55 to 59 Years | 173 (100.0%) | 0 (0.0%) |
| 60 to 64 Years | 121 (81.8%) | 0 (0.0%) |
| 65 to 74 Years | 67 (32.2%) | 0 (0.0%) |
| 75 Years and over | 0 (0.0%) | 0 (0.0%) |
| Total | 1,042 (75.1%) | 0 (0.0%) |
Employment Status by Educational Attainment in Manhattan
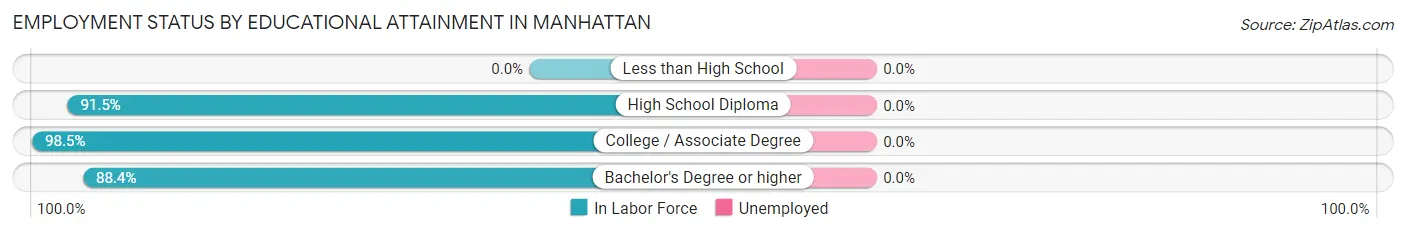
| Educational Attainment | In Labor Force | Unemployed |
| Less than High School | 0 (0.0%) | 0 (0.0%) |
| High School Diploma | 194 (91.5%) | 0 (0.0%) |
| College / Associate Degree | 395 (98.5%) | 0 (0.0%) |
| Bachelor's Degree or higher | 268 (88.4%) | 0 (0.0%) |
| Total | 857 (93.6%) | 0 (0.0%) |
Employment Occupations by Sex in Manhattan
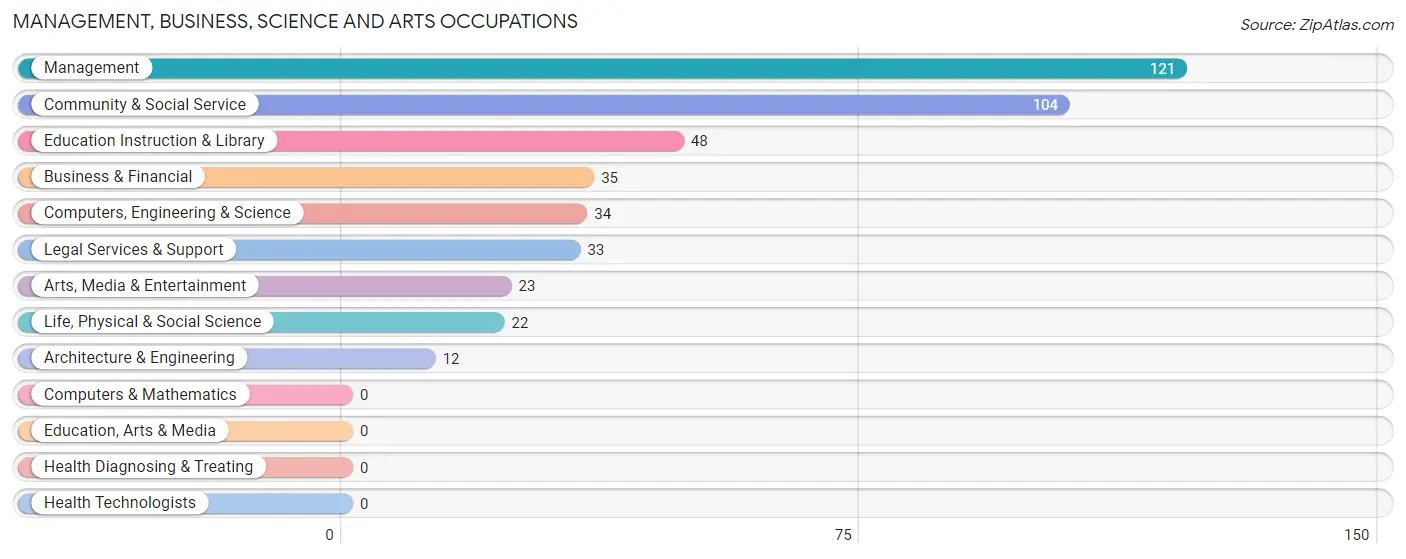
Management, Business, Science and Arts Occupations
The most common Management, Business, Science and Arts occupations in Manhattan are Management (121 | 11.6%), Community & Social Service (104 | 10.0%), Education Instruction & Library (48 | 4.6%), Business & Financial (35 | 3.4%), and Computers, Engineering & Science (34 | 3.3%).
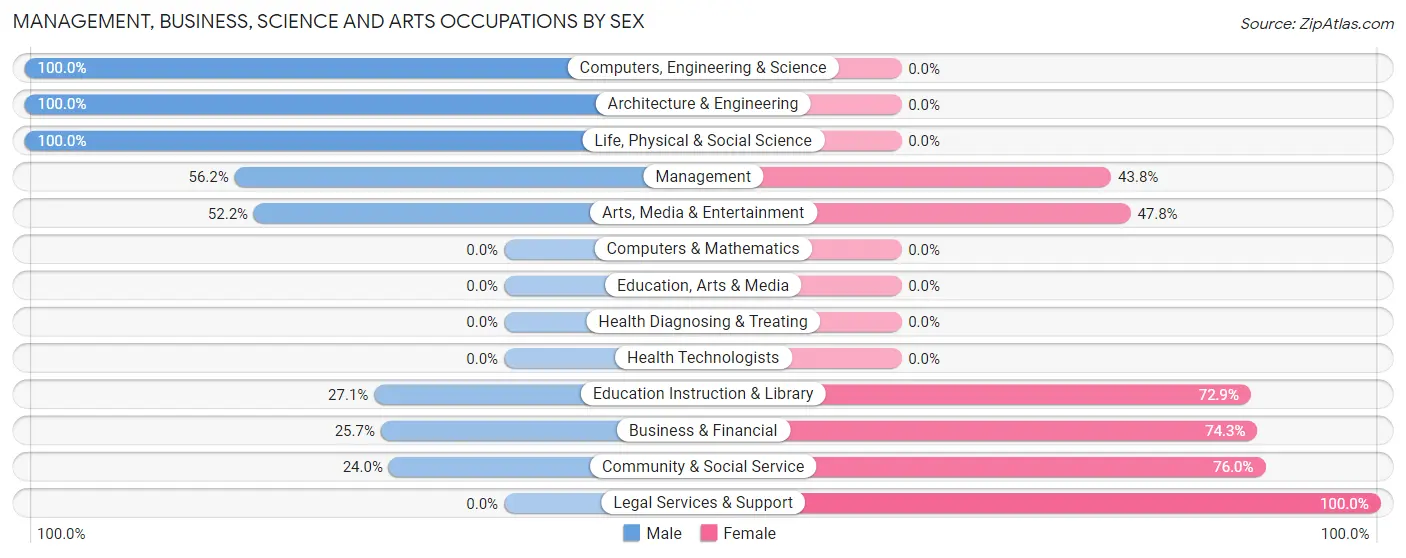
Management, Business, Science and Arts Occupations by Sex
Within the Management, Business, Science and Arts occupations in Manhattan, the most male-oriented occupations are Computers, Engineering & Science (100.0%), Architecture & Engineering (100.0%), and Life, Physical & Social Science (100.0%), while the most female-oriented occupations are Legal Services & Support (100.0%), Community & Social Service (76.0%), and Business & Financial (74.3%).
| Occupation | Male | Female |
| Management | 68 (56.2%) | 53 (43.8%) |
| Business & Financial | 9 (25.7%) | 26 (74.3%) |
| Computers, Engineering & Science | 34 (100.0%) | 0 (0.0%) |
| Computers & Mathematics | 0 (0.0%) | 0 (0.0%) |
| Architecture & Engineering | 12 (100.0%) | 0 (0.0%) |
| Life, Physical & Social Science | 22 (100.0%) | 0 (0.0%) |
| Community & Social Service | 25 (24.0%) | 79 (76.0%) |
| Education, Arts & Media | 0 (0.0%) | 0 (0.0%) |
| Legal Services & Support | 0 (0.0%) | 33 (100.0%) |
| Education Instruction & Library | 13 (27.1%) | 35 (72.9%) |
| Arts, Media & Entertainment | 12 (52.2%) | 11 (47.8%) |
| Health Diagnosing & Treating | 0 (0.0%) | 0 (0.0%) |
| Health Technologists | 0 (0.0%) | 0 (0.0%) |
| Total (Category) | 136 (46.3%) | 158 (53.7%) |
| Total (Overall) | 602 (57.8%) | 440 (42.2%) |
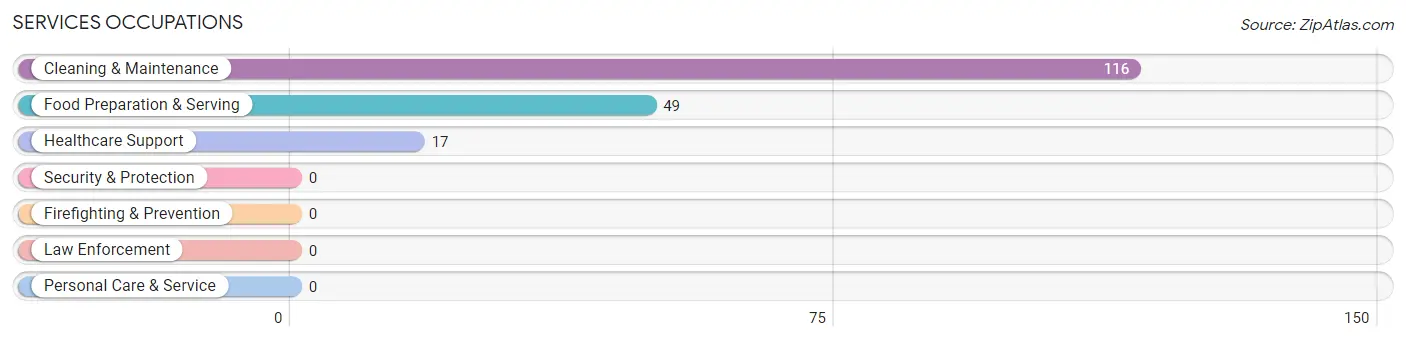
Services Occupations
The most common Services occupations in Manhattan are Cleaning & Maintenance (116 | 11.1%), Food Preparation & Serving (49 | 4.7%), and Healthcare Support (17 | 1.6%).
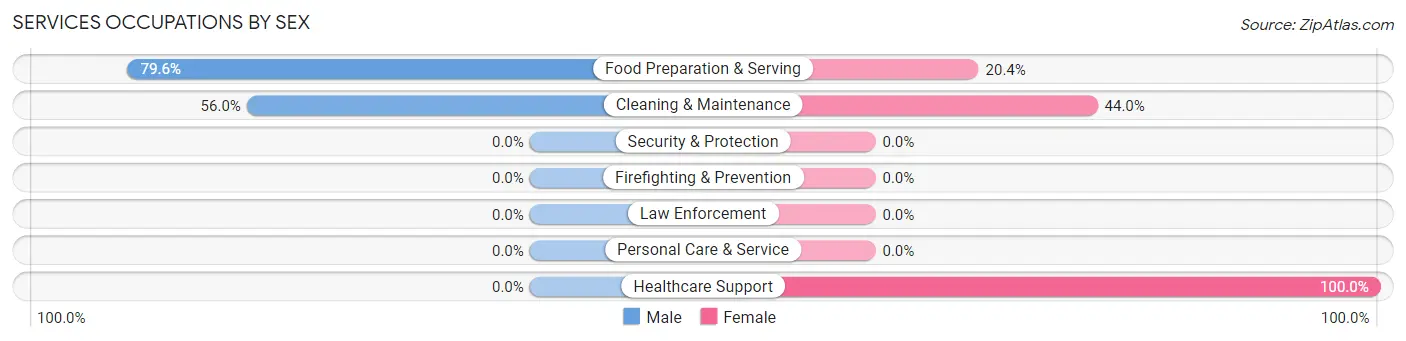
Services Occupations by Sex
Within the Services occupations in Manhattan, the most male-oriented occupations are Food Preparation & Serving (79.6%), and Cleaning & Maintenance (56.0%), while the most female-oriented occupations are Healthcare Support (100.0%), Cleaning & Maintenance (44.0%), and Food Preparation & Serving (20.4%).
| Occupation | Male | Female |
| Healthcare Support | 0 (0.0%) | 17 (100.0%) |
| Security & Protection | 0 (0.0%) | 0 (0.0%) |
| Firefighting & Prevention | 0 (0.0%) | 0 (0.0%) |
| Law Enforcement | 0 (0.0%) | 0 (0.0%) |
| Food Preparation & Serving | 39 (79.6%) | 10 (20.4%) |
| Cleaning & Maintenance | 65 (56.0%) | 51 (44.0%) |
| Personal Care & Service | 0 (0.0%) | 0 (0.0%) |
| Total (Category) | 104 (57.1%) | 78 (42.9%) |
| Total (Overall) | 602 (57.8%) | 440 (42.2%) |
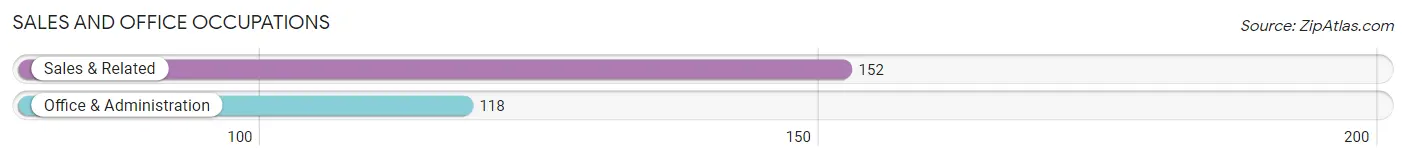
Sales and Office Occupations
The most common Sales and Office occupations in Manhattan are Sales & Related (152 | 14.6%), and Office & Administration (118 | 11.3%).
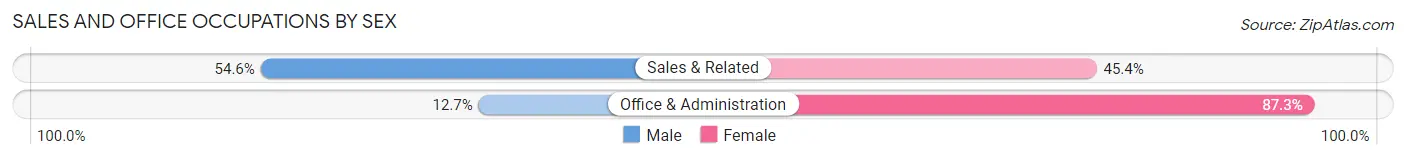
Sales and Office Occupations by Sex
| Occupation | Male | Female |
| Sales & Related | 83 (54.6%) | 69 (45.4%) |
| Office & Administration | 15 (12.7%) | 103 (87.3%) |
| Total (Category) | 98 (36.3%) | 172 (63.7%) |
| Total (Overall) | 602 (57.8%) | 440 (42.2%) |
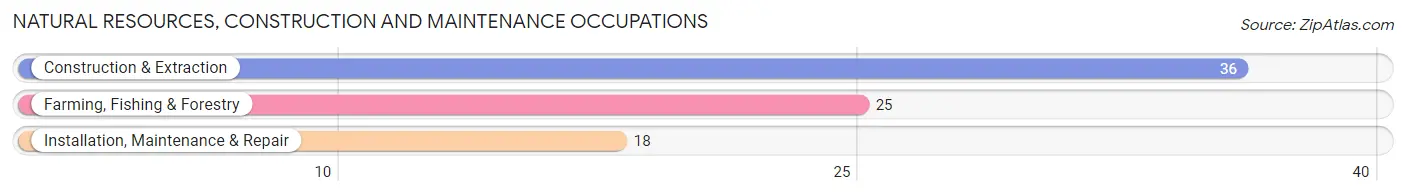
Natural Resources, Construction and Maintenance Occupations
The most common Natural Resources, Construction and Maintenance occupations in Manhattan are Construction & Extraction (36 | 3.5%), Farming, Fishing & Forestry (25 | 2.4%), and Installation, Maintenance & Repair (18 | 1.7%).
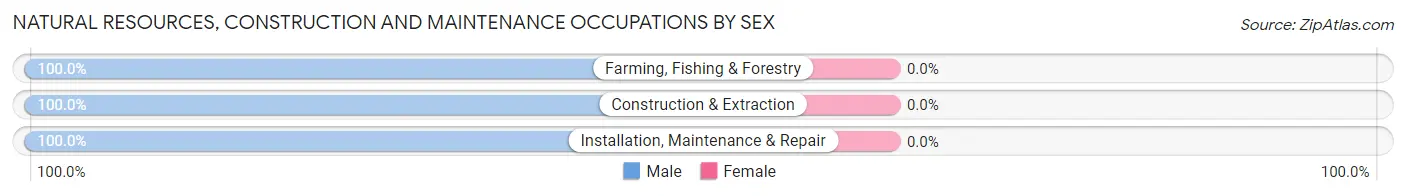
Natural Resources, Construction and Maintenance Occupations by Sex
| Occupation | Male | Female |
| Farming, Fishing & Forestry | 25 (100.0%) | 0 (0.0%) |
| Construction & Extraction | 36 (100.0%) | 0 (0.0%) |
| Installation, Maintenance & Repair | 18 (100.0%) | 0 (0.0%) |
| Total (Category) | 79 (100.0%) | 0 (0.0%) |
| Total (Overall) | 602 (57.8%) | 440 (42.2%) |
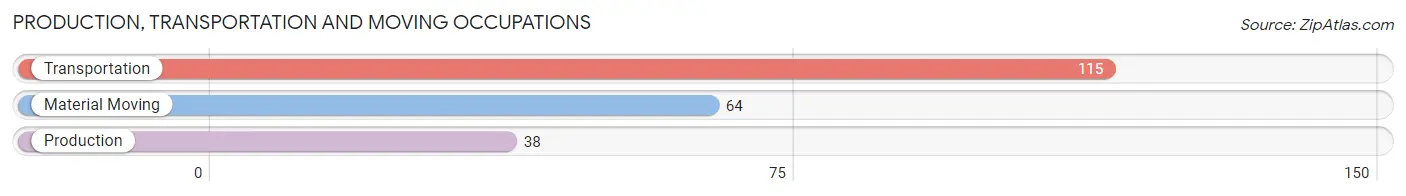
Production, Transportation and Moving Occupations
The most common Production, Transportation and Moving occupations in Manhattan are Transportation (115 | 11.0%), Material Moving (64 | 6.1%), and Production (38 | 3.6%).
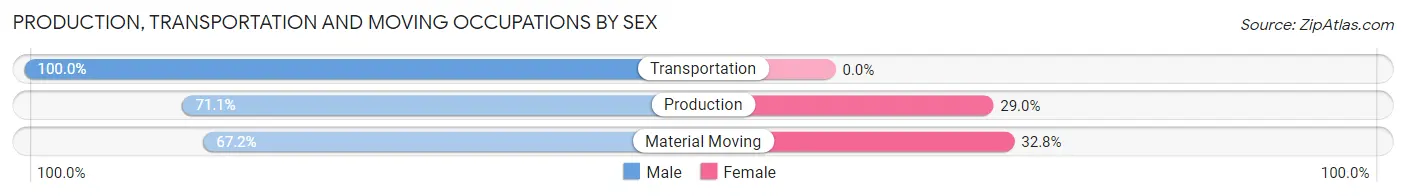
Production, Transportation and Moving Occupations by Sex
| Occupation | Male | Female |
| Production | 27 (71.1%) | 11 (28.9%) |
| Transportation | 115 (100.0%) | 0 (0.0%) |
| Material Moving | 43 (67.2%) | 21 (32.8%) |
| Total (Category) | 185 (85.3%) | 32 (14.7%) |
| Total (Overall) | 602 (57.8%) | 440 (42.2%) |
Employment Industries by Sex in Manhattan
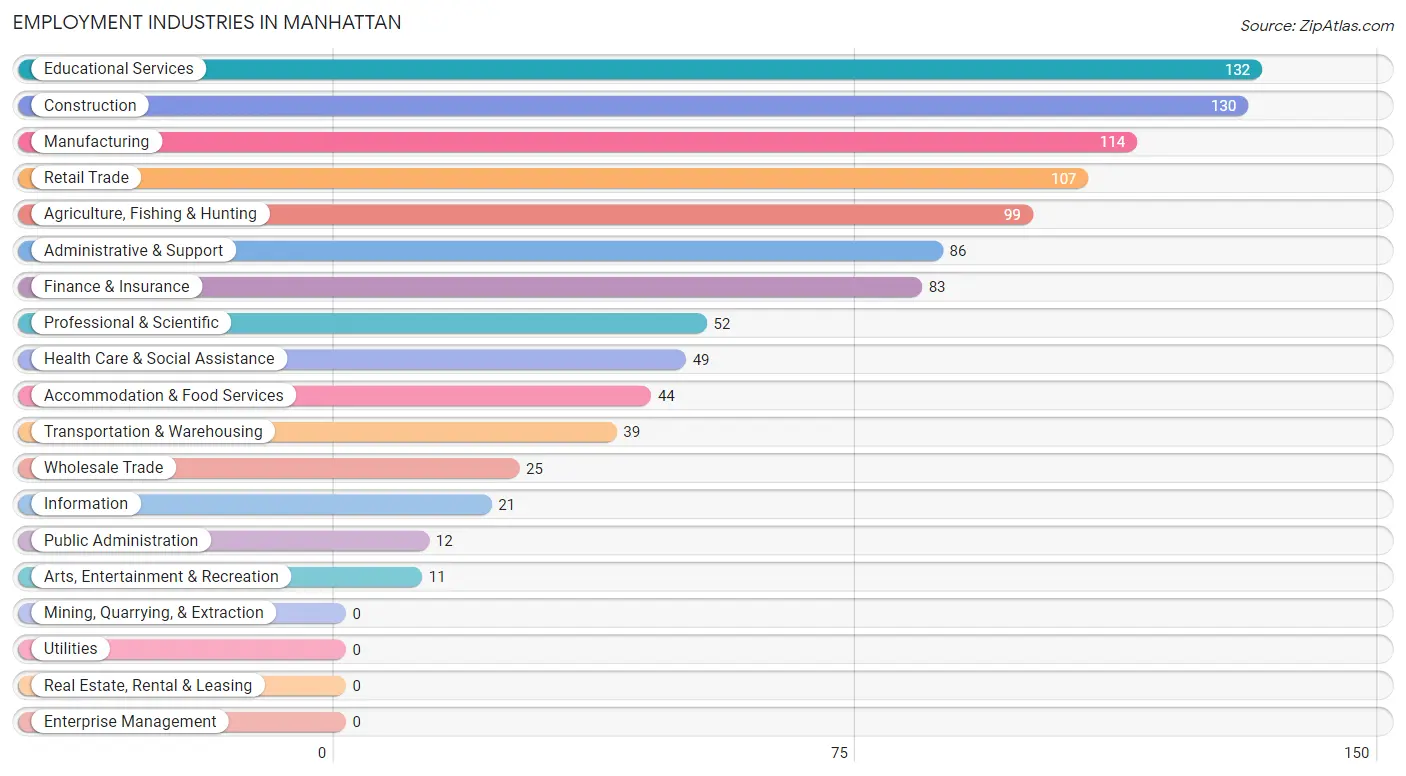
Employment Industries in Manhattan
The major employment industries in Manhattan include Educational Services (132 | 12.7%), Construction (130 | 12.5%), Manufacturing (114 | 10.9%), Retail Trade (107 | 10.3%), and Agriculture, Fishing & Hunting (99 | 9.5%).
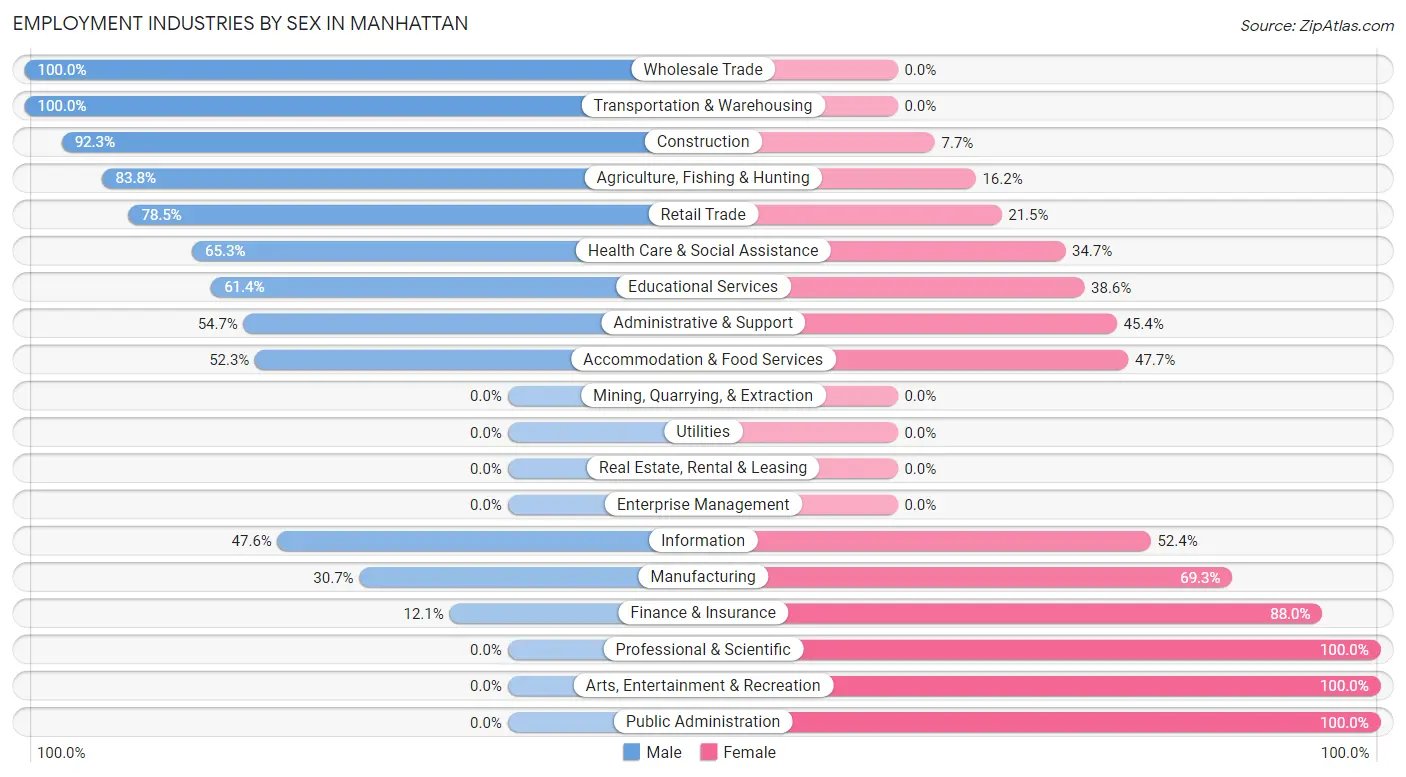
Employment Industries by Sex in Manhattan
The Manhattan industries that see more men than women are Wholesale Trade (100.0%), Transportation & Warehousing (100.0%), and Construction (92.3%), whereas the industries that tend to have a higher number of women are Professional & Scientific (100.0%), Arts, Entertainment & Recreation (100.0%), and Public Administration (100.0%).
| Industry | Male | Female |
| Agriculture, Fishing & Hunting | 83 (83.8%) | 16 (16.2%) |
| Mining, Quarrying, & Extraction | 0 (0.0%) | 0 (0.0%) |
| Construction | 120 (92.3%) | 10 (7.7%) |
| Manufacturing | 35 (30.7%) | 79 (69.3%) |
| Wholesale Trade | 25 (100.0%) | 0 (0.0%) |
| Retail Trade | 84 (78.5%) | 23 (21.5%) |
| Transportation & Warehousing | 39 (100.0%) | 0 (0.0%) |
| Utilities | 0 (0.0%) | 0 (0.0%) |
| Information | 10 (47.6%) | 11 (52.4%) |
| Finance & Insurance | 10 (12.0%) | 73 (87.9%) |
| Real Estate, Rental & Leasing | 0 (0.0%) | 0 (0.0%) |
| Professional & Scientific | 0 (0.0%) | 52 (100.0%) |
| Enterprise Management | 0 (0.0%) | 0 (0.0%) |
| Administrative & Support | 47 (54.6%) | 39 (45.4%) |
| Educational Services | 81 (61.4%) | 51 (38.6%) |
| Health Care & Social Assistance | 32 (65.3%) | 17 (34.7%) |
| Arts, Entertainment & Recreation | 0 (0.0%) | 11 (100.0%) |
| Accommodation & Food Services | 23 (52.3%) | 21 (47.7%) |
| Public Administration | 0 (0.0%) | 12 (100.0%) |
| Total | 602 (57.8%) | 440 (42.2%) |
Education in Manhattan
School Enrollment in Manhattan
The most common levels of schooling among the 591 students in Manhattan are elementary school (234 | 39.6%), middle school (186 | 31.5%), and high school (63 | 10.7%).
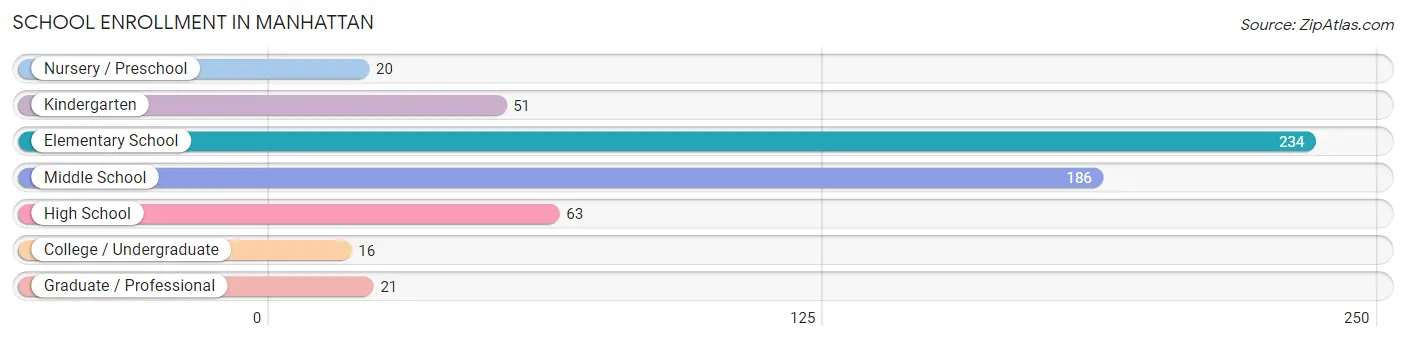
| School Level | # Students | % Students |
| Nursery / Preschool | 20 | 3.4% |
| Kindergarten | 51 | 8.6% |
| Elementary School | 234 | 39.6% |
| Middle School | 186 | 31.5% |
| High School | 63 | 10.7% |
| College / Undergraduate | 16 | 2.7% |
| Graduate / Professional | 21 | 3.5% |
| Total | 591 | 100.0% |
School Enrollment by Age by Funding Source in Manhattan
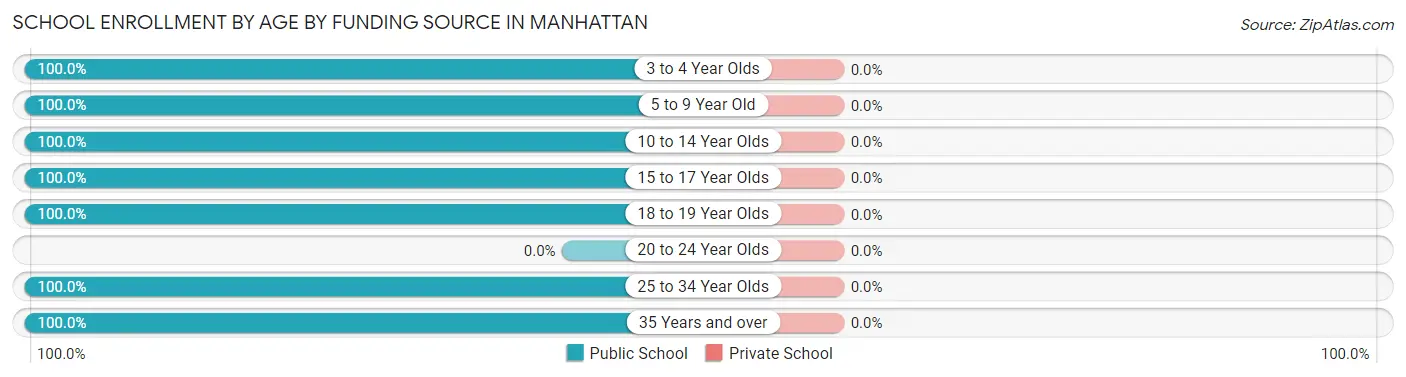
| Age Bracket | Public School | Private School |
| 3 to 4 Year Olds | 20 (100.0%) | 0 (0.0%) |
| 5 to 9 Year Old | 241 (100.0%) | 0 (0.0%) |
| 10 to 14 Year Olds | 230 (100.0%) | 0 (0.0%) |
| 15 to 17 Year Olds | 63 (100.0%) | 0 (0.0%) |
| 18 to 19 Year Olds | 13 (100.0%) | 0 (0.0%) |
| 20 to 24 Year Olds | 0 (0.0%) | 0 (0.0%) |
| 25 to 34 Year Olds | 9 (100.0%) | 0 (0.0%) |
| 35 Years and over | 15 (100.0%) | 0 (0.0%) |
| Total | 591 (100.0%) | 0 (0.0%) |
Educational Attainment by Field of Study in Manhattan
Education (106 | 26.1%), physical & health sciences (60 | 14.8%), business (53 | 13.1%), psychology (43 | 10.6%), and bio, nature & agricultural (40 | 9.9%) are the most common fields of study among 406 individuals in Manhattan who have obtained a bachelor's degree or higher.
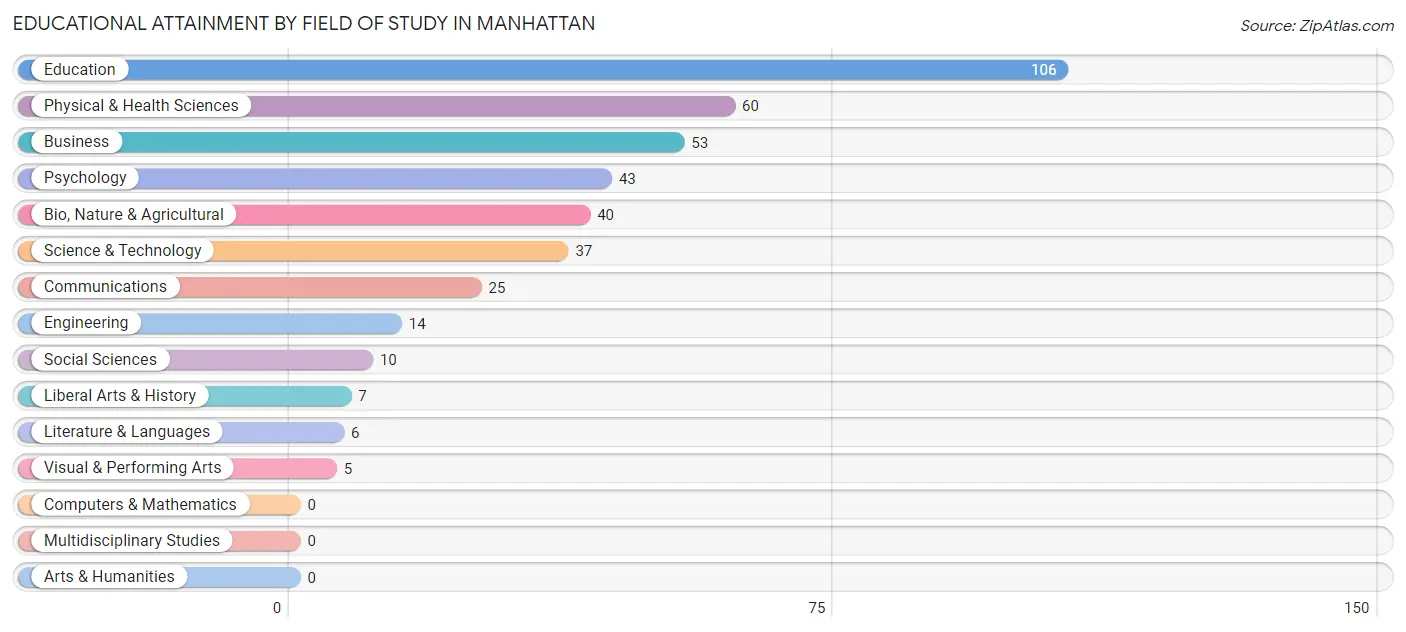
| Field of Study | # Graduates | % Graduates |
| Computers & Mathematics | 0 | 0.0% |
| Bio, Nature & Agricultural | 40 | 9.9% |
| Physical & Health Sciences | 60 | 14.8% |
| Psychology | 43 | 10.6% |
| Social Sciences | 10 | 2.5% |
| Engineering | 14 | 3.5% |
| Multidisciplinary Studies | 0 | 0.0% |
| Science & Technology | 37 | 9.1% |
| Business | 53 | 13.1% |
| Education | 106 | 26.1% |
| Literature & Languages | 6 | 1.5% |
| Liberal Arts & History | 7 | 1.7% |
| Visual & Performing Arts | 5 | 1.2% |
| Communications | 25 | 6.2% |
| Arts & Humanities | 0 | 0.0% |
| Total | 406 | 100.0% |
Transportation & Commute in Manhattan
Vehicle Availability by Sex in Manhattan
The most prevalent vehicle ownership categories in Manhattan are males with 2 vehicles (242, accounting for 40.2%) and females with 2 vehicles (127, making up 56.4%).
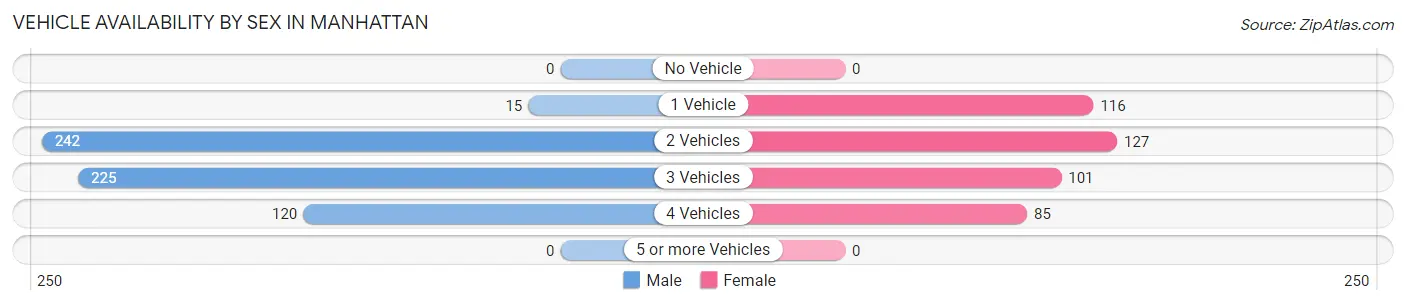
| Vehicles Available | Male | Female |
| No Vehicle | 0 (0.0%) | 0 (0.0%) |
| 1 Vehicle | 15 (2.5%) | 116 (27.0%) |
| 2 Vehicles | 242 (40.2%) | 127 (29.6%) |
| 3 Vehicles | 225 (37.4%) | 101 (23.5%) |
| 4 Vehicles | 120 (19.9%) | 85 (19.8%) |
| 5 or more Vehicles | 0 (0.0%) | 0 (0.0%) |
| Total | 602 (100.0%) | 429 (100.0%) |
Commute Time in Manhattan
The most frequently occuring commute durations in Manhattan are 20 to 24 minutes (188 commuters, 22.1%), 30 to 34 minutes (160 commuters, 18.8%), and 5 to 9 minutes (131 commuters, 15.4%).
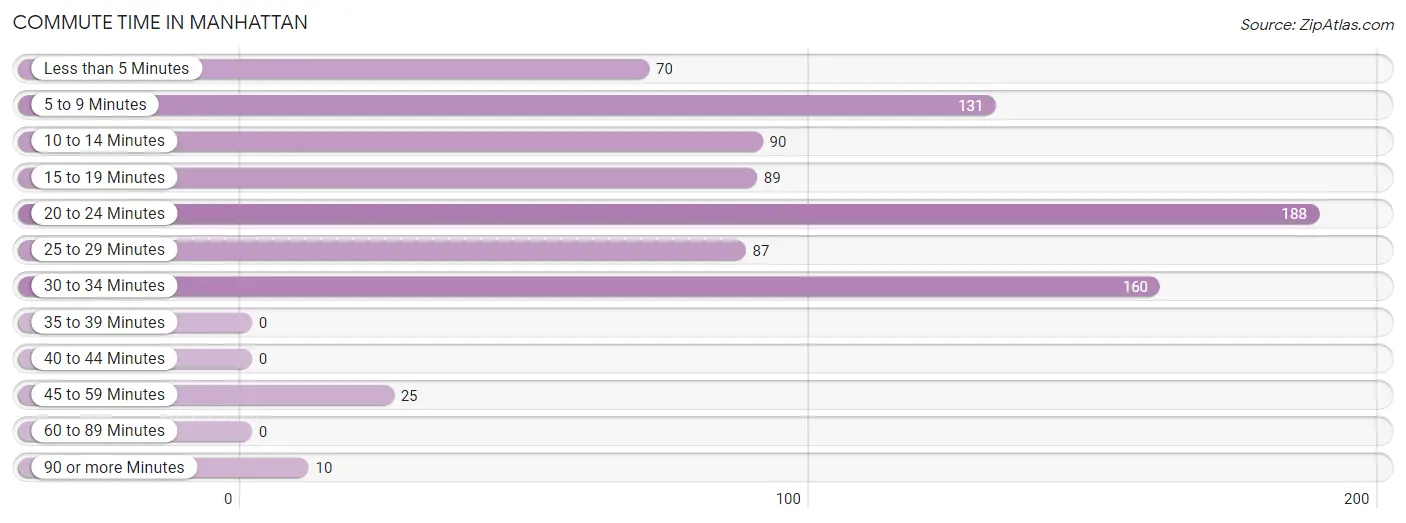
| Commute Time | # Commuters | % Commuters |
| Less than 5 Minutes | 70 | 8.2% |
| 5 to 9 Minutes | 131 | 15.4% |
| 10 to 14 Minutes | 90 | 10.6% |
| 15 to 19 Minutes | 89 | 10.5% |
| 20 to 24 Minutes | 188 | 22.1% |
| 25 to 29 Minutes | 87 | 10.2% |
| 30 to 34 Minutes | 160 | 18.8% |
| 35 to 39 Minutes | 0 | 0.0% |
| 40 to 44 Minutes | 0 | 0.0% |
| 45 to 59 Minutes | 25 | 2.9% |
| 60 to 89 Minutes | 0 | 0.0% |
| 90 or more Minutes | 10 | 1.2% |
Commute Time by Sex in Manhattan
The most common commute times in Manhattan are 30 to 34 minutes (135 commuters, 26.6%) for males and 20 to 24 minutes (107 commuters, 31.3%) for females.
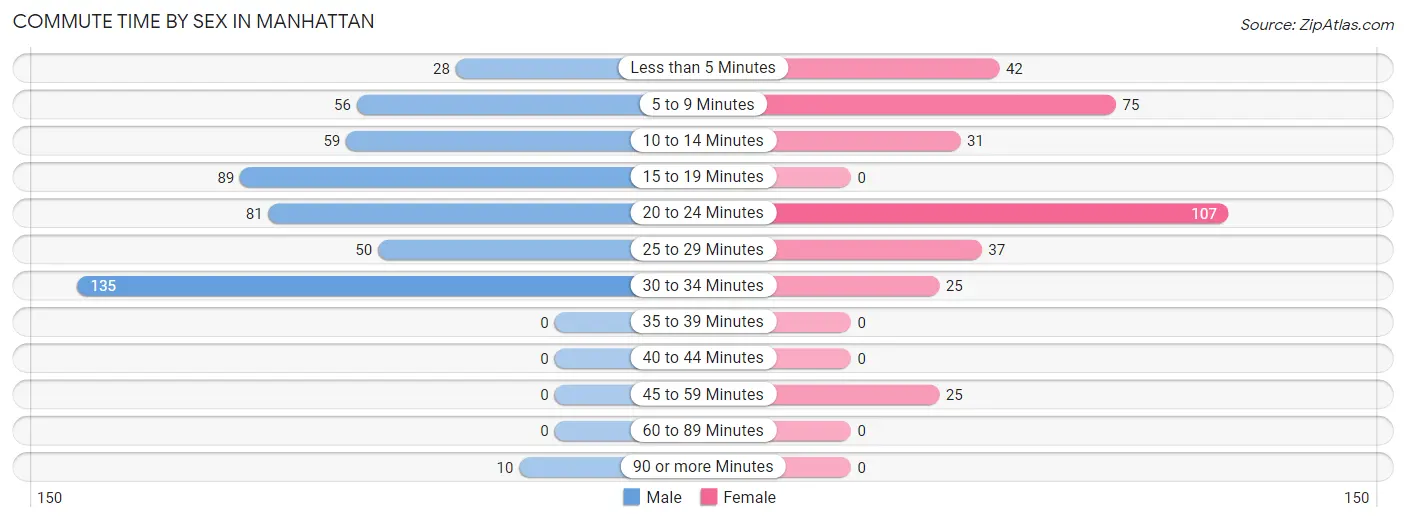
| Commute Time | Male | Female |
| Less than 5 Minutes | 28 (5.5%) | 42 (12.3%) |
| 5 to 9 Minutes | 56 (11.0%) | 75 (21.9%) |
| 10 to 14 Minutes | 59 (11.6%) | 31 (9.1%) |
| 15 to 19 Minutes | 89 (17.5%) | 0 (0.0%) |
| 20 to 24 Minutes | 81 (15.9%) | 107 (31.3%) |
| 25 to 29 Minutes | 50 (9.8%) | 37 (10.8%) |
| 30 to 34 Minutes | 135 (26.6%) | 25 (7.3%) |
| 35 to 39 Minutes | 0 (0.0%) | 0 (0.0%) |
| 40 to 44 Minutes | 0 (0.0%) | 0 (0.0%) |
| 45 to 59 Minutes | 0 (0.0%) | 25 (7.3%) |
| 60 to 89 Minutes | 0 (0.0%) | 0 (0.0%) |
| 90 or more Minutes | 10 (2.0%) | 0 (0.0%) |
Time of Departure to Work by Sex in Manhattan
The most frequent times of departure to work in Manhattan are 7:30 AM to 7:59 AM (86, 16.9%) for males and 7:30 AM to 7:59 AM (137, 40.1%) for females.
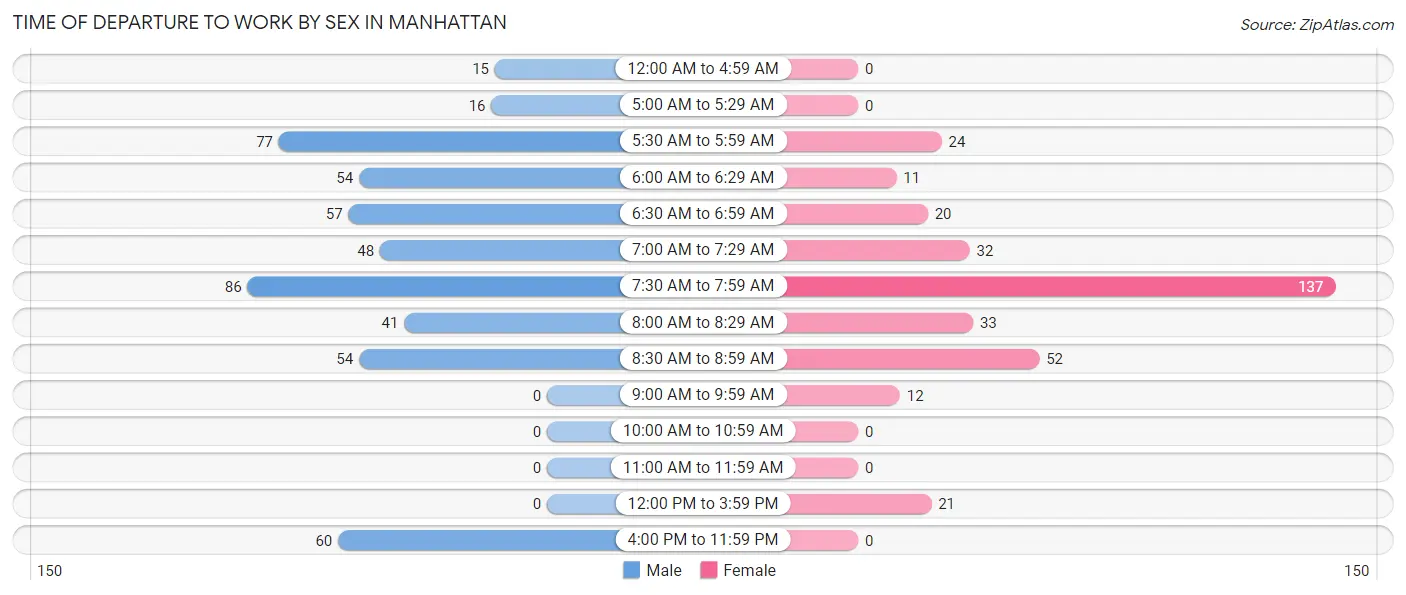
| Time of Departure | Male | Female |
| 12:00 AM to 4:59 AM | 15 (2.9%) | 0 (0.0%) |
| 5:00 AM to 5:29 AM | 16 (3.2%) | 0 (0.0%) |
| 5:30 AM to 5:59 AM | 77 (15.2%) | 24 (7.0%) |
| 6:00 AM to 6:29 AM | 54 (10.6%) | 11 (3.2%) |
| 6:30 AM to 6:59 AM | 57 (11.2%) | 20 (5.9%) |
| 7:00 AM to 7:29 AM | 48 (9.5%) | 32 (9.4%) |
| 7:30 AM to 7:59 AM | 86 (16.9%) | 137 (40.1%) |
| 8:00 AM to 8:29 AM | 41 (8.1%) | 33 (9.7%) |
| 8:30 AM to 8:59 AM | 54 (10.6%) | 52 (15.2%) |
| 9:00 AM to 9:59 AM | 0 (0.0%) | 12 (3.5%) |
| 10:00 AM to 10:59 AM | 0 (0.0%) | 0 (0.0%) |
| 11:00 AM to 11:59 AM | 0 (0.0%) | 0 (0.0%) |
| 12:00 PM to 3:59 PM | 0 (0.0%) | 21 (6.1%) |
| 4:00 PM to 11:59 PM | 60 (11.8%) | 0 (0.0%) |
| Total | 508 (100.0%) | 342 (100.0%) |
Housing Occupancy in Manhattan
Occupancy by Ownership in Manhattan
Of the total 830 dwellings in Manhattan, owner-occupied units account for 591 (71.2%), while renter-occupied units make up 239 (28.8%).
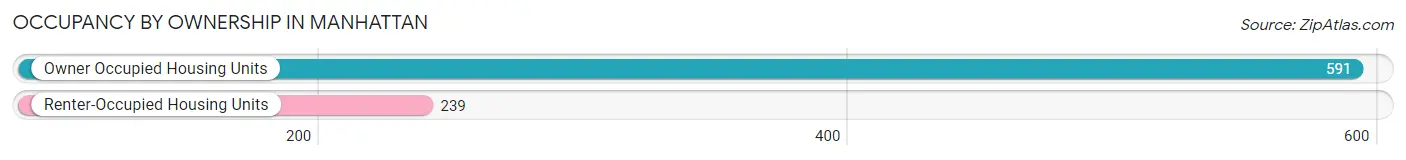
| Occupancy | # Housing Units | % Housing Units |
| Owner Occupied Housing Units | 591 | 71.2% |
| Renter-Occupied Housing Units | 239 | 28.8% |
| Total Occupied Housing Units | 830 | 100.0% |
Occupancy by Household Size in Manhattan
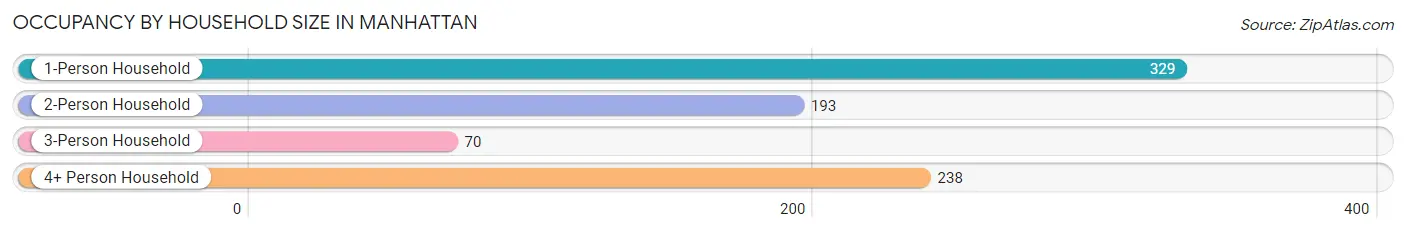
| Household Size | # Housing Units | % Housing Units |
| 1-Person Household | 329 | 39.6% |
| 2-Person Household | 193 | 23.3% |
| 3-Person Household | 70 | 8.4% |
| 4+ Person Household | 238 | 28.7% |
| Total Housing Units | 830 | 100.0% |
Occupancy by Ownership by Household Size in Manhattan
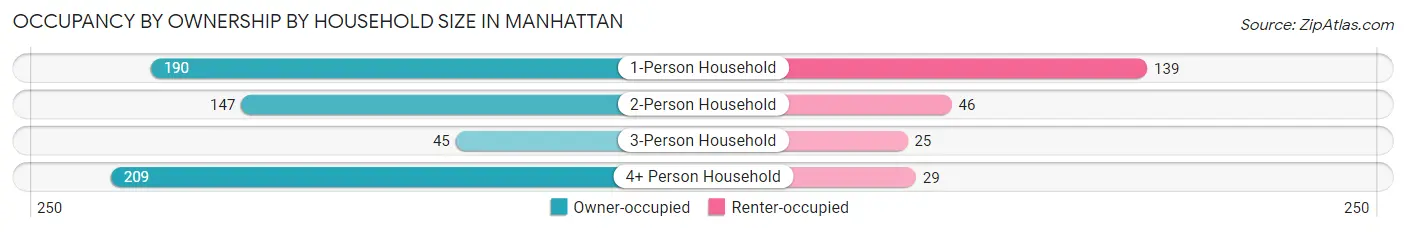
| Household Size | Owner-occupied | Renter-occupied |
| 1-Person Household | 190 (57.8%) | 139 (42.2%) |
| 2-Person Household | 147 (76.2%) | 46 (23.8%) |
| 3-Person Household | 45 (64.3%) | 25 (35.7%) |
| 4+ Person Household | 209 (87.8%) | 29 (12.2%) |
| Total Housing Units | 591 (71.2%) | 239 (28.8%) |
Occupancy by Educational Attainment in Manhattan
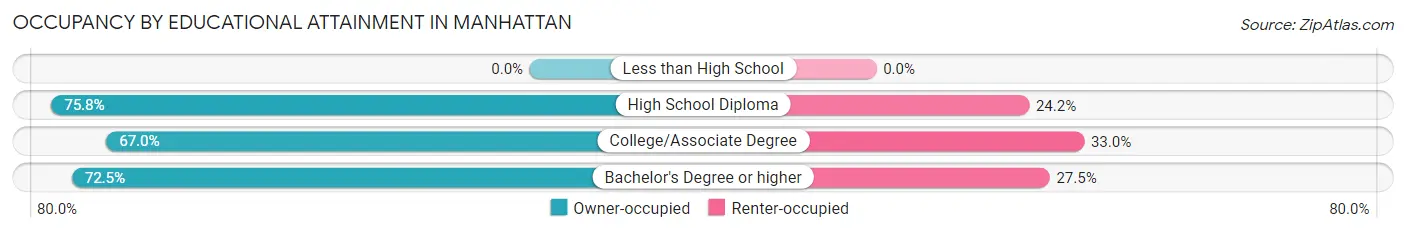
| Household Size | Owner-occupied | Renter-occupied |
| Less than High School | 0 (0.0%) | 0 (0.0%) |
| High School Diploma | 200 (75.8%) | 64 (24.2%) |
| College/Associate Degree | 238 (67.0%) | 117 (33.0%) |
| Bachelor's Degree or higher | 153 (72.5%) | 58 (27.5%) |
Occupancy by Age of Householder in Manhattan
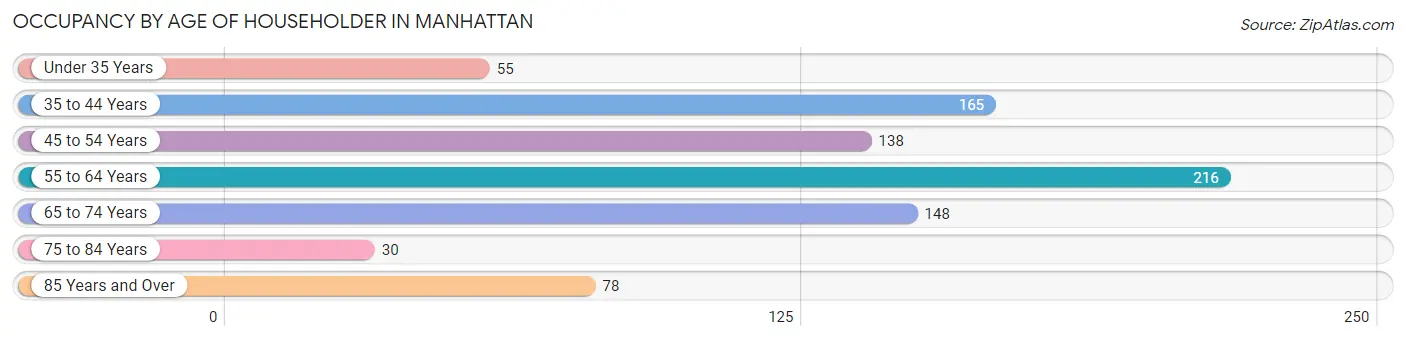
| Age Bracket | # Households | % Households |
| Under 35 Years | 55 | 6.6% |
| 35 to 44 Years | 165 | 19.9% |
| 45 to 54 Years | 138 | 16.6% |
| 55 to 64 Years | 216 | 26.0% |
| 65 to 74 Years | 148 | 17.8% |
| 75 to 84 Years | 30 | 3.6% |
| 85 Years and Over | 78 | 9.4% |
| Total | 830 | 100.0% |
Housing Finances in Manhattan
Median Income by Occupancy in Manhattan
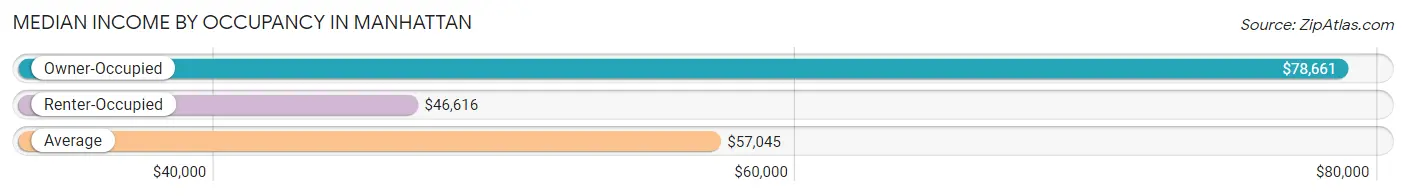
| Occupancy Type | # Households | Median Income |
| Owner-Occupied | 591 (71.2%) | $78,661 |
| Renter-Occupied | 239 (28.8%) | $46,616 |
| Average | 830 (100.0%) | $57,045 |
Occupancy by Householder Income Bracket in Manhattan
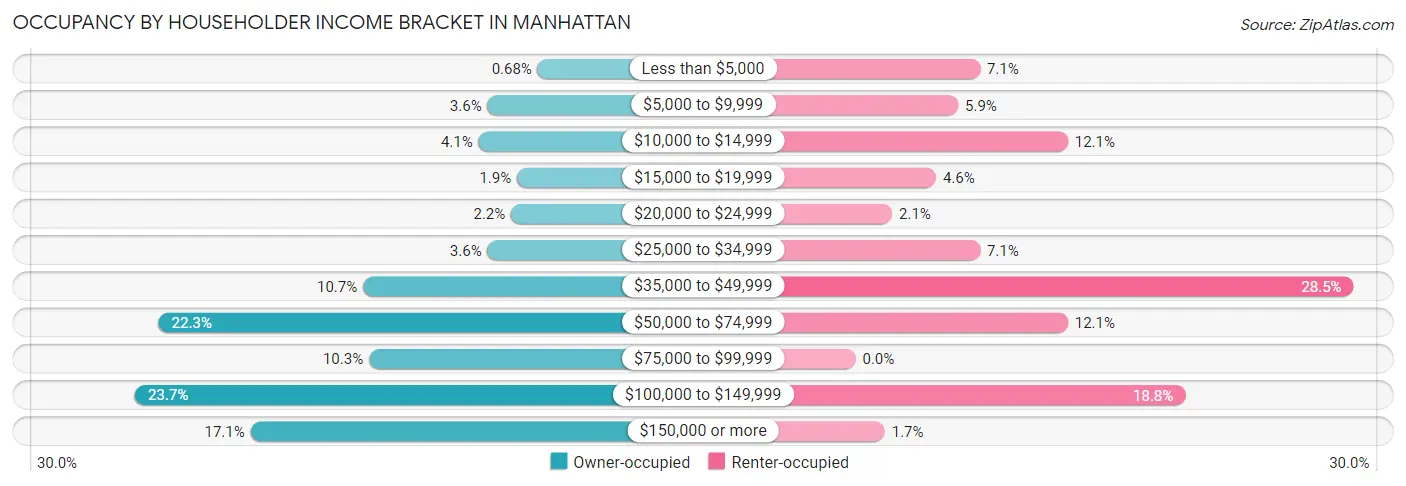
| Income Bracket | Owner-occupied | Renter-occupied |
| Less than $5,000 | 4 (0.7%) | 17 (7.1%) |
| $5,000 to $9,999 | 21 (3.5%) | 14 (5.9%) |
| $10,000 to $14,999 | 24 (4.1%) | 29 (12.1%) |
| $15,000 to $19,999 | 11 (1.9%) | 11 (4.6%) |
| $20,000 to $24,999 | 13 (2.2%) | 5 (2.1%) |
| $25,000 to $34,999 | 21 (3.5%) | 17 (7.1%) |
| $35,000 to $49,999 | 63 (10.7%) | 68 (28.4%) |
| $50,000 to $74,999 | 132 (22.3%) | 29 (12.1%) |
| $75,000 to $99,999 | 61 (10.3%) | 0 (0.0%) |
| $100,000 to $149,999 | 140 (23.7%) | 45 (18.8%) |
| $150,000 or more | 101 (17.1%) | 4 (1.7%) |
| Total | 591 (100.0%) | 239 (100.0%) |
Monthly Housing Cost Tiers in Manhattan
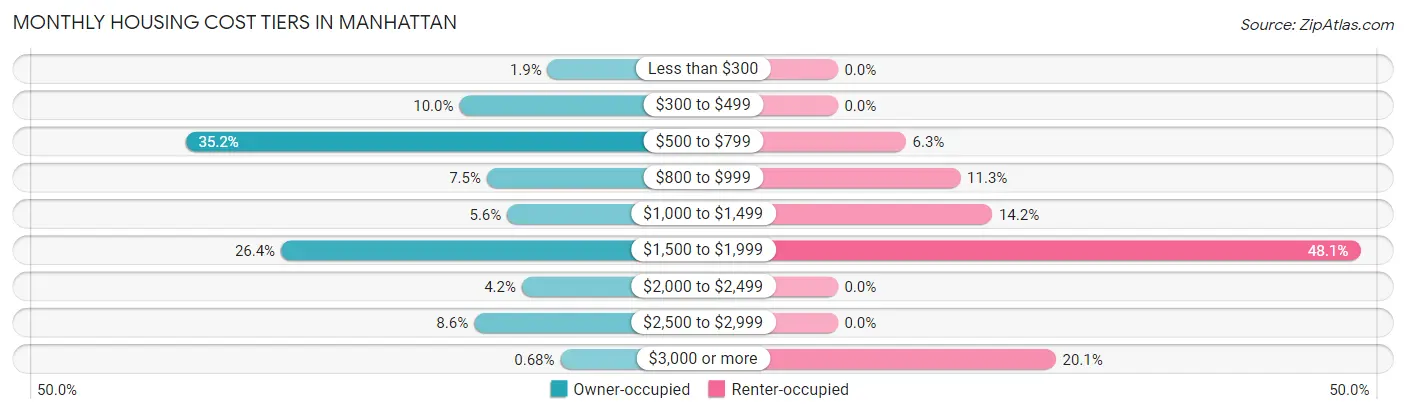
| Monthly Cost | Owner-occupied | Renter-occupied |
| Less than $300 | 11 (1.9%) | 0 (0.0%) |
| $300 to $499 | 59 (10.0%) | 0 (0.0%) |
| $500 to $799 | 208 (35.2%) | 15 (6.3%) |
| $800 to $999 | 44 (7.4%) | 27 (11.3%) |
| $1,000 to $1,499 | 33 (5.6%) | 34 (14.2%) |
| $1,500 to $1,999 | 156 (26.4%) | 115 (48.1%) |
| $2,000 to $2,499 | 25 (4.2%) | 0 (0.0%) |
| $2,500 to $2,999 | 51 (8.6%) | 0 (0.0%) |
| $3,000 or more | 4 (0.7%) | 48 (20.1%) |
| Total | 591 (100.0%) | 239 (100.0%) |
Physical Housing Characteristics in Manhattan
Housing Structures in Manhattan
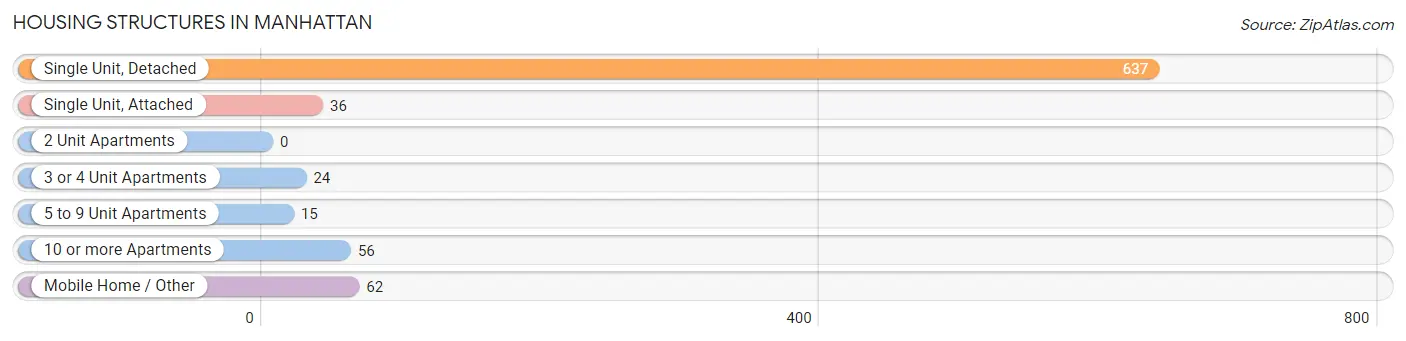
| Structure Type | # Housing Units | % Housing Units |
| Single Unit, Detached | 637 | 76.7% |
| Single Unit, Attached | 36 | 4.3% |
| 2 Unit Apartments | 0 | 0.0% |
| 3 or 4 Unit Apartments | 24 | 2.9% |
| 5 to 9 Unit Apartments | 15 | 1.8% |
| 10 or more Apartments | 56 | 6.8% |
| Mobile Home / Other | 62 | 7.5% |
| Total | 830 | 100.0% |
Housing Structures by Occupancy in Manhattan
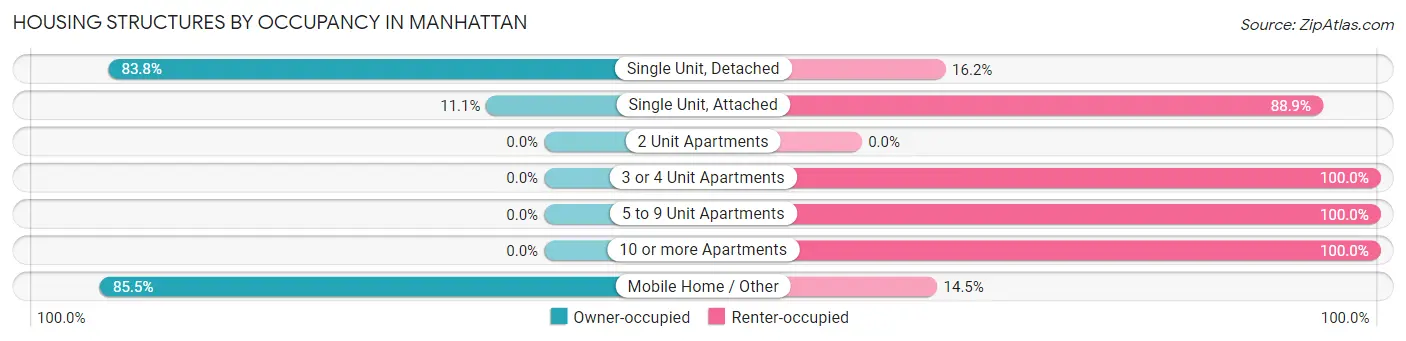
| Structure Type | Owner-occupied | Renter-occupied |
| Single Unit, Detached | 534 (83.8%) | 103 (16.2%) |
| Single Unit, Attached | 4 (11.1%) | 32 (88.9%) |
| 2 Unit Apartments | 0 (0.0%) | 0 (0.0%) |
| 3 or 4 Unit Apartments | 0 (0.0%) | 24 (100.0%) |
| 5 to 9 Unit Apartments | 0 (0.0%) | 15 (100.0%) |
| 10 or more Apartments | 0 (0.0%) | 56 (100.0%) |
| Mobile Home / Other | 53 (85.5%) | 9 (14.5%) |
| Total | 591 (71.2%) | 239 (28.8%) |
Housing Structures by Number of Rooms in Manhattan
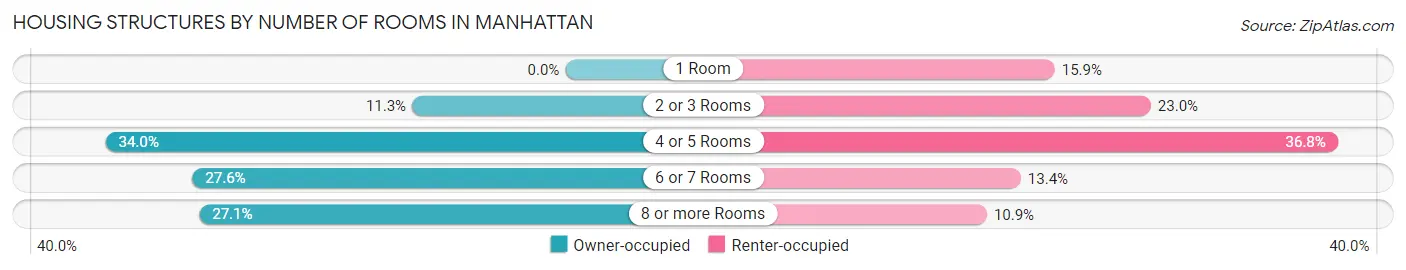
| Number of Rooms | Owner-occupied | Renter-occupied |
| 1 Room | 0 (0.0%) | 38 (15.9%) |
| 2 or 3 Rooms | 67 (11.3%) | 55 (23.0%) |
| 4 or 5 Rooms | 201 (34.0%) | 88 (36.8%) |
| 6 or 7 Rooms | 163 (27.6%) | 32 (13.4%) |
| 8 or more Rooms | 160 (27.1%) | 26 (10.9%) |
| Total | 591 (100.0%) | 239 (100.0%) |
Housing Structure by Heating Type in Manhattan
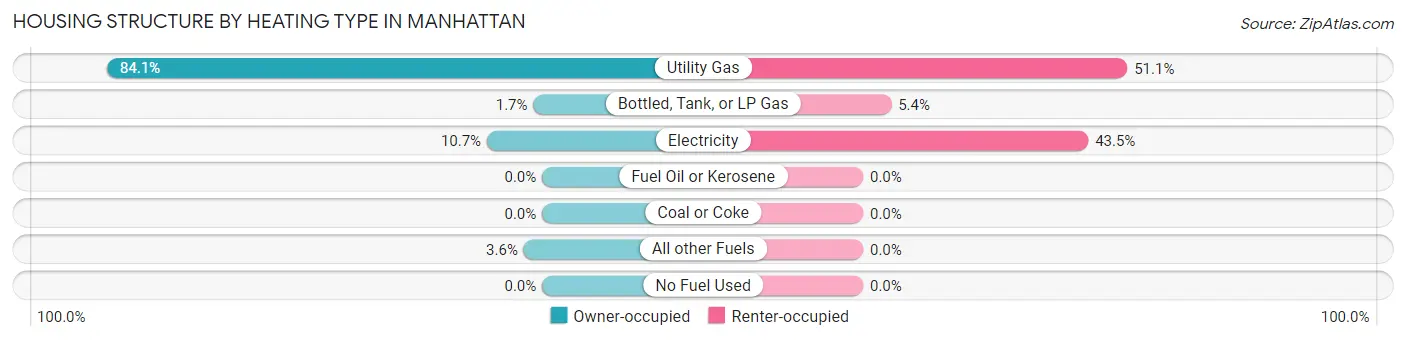
| Heating Type | Owner-occupied | Renter-occupied |
| Utility Gas | 497 (84.1%) | 122 (51.0%) |
| Bottled, Tank, or LP Gas | 10 (1.7%) | 13 (5.4%) |
| Electricity | 63 (10.7%) | 104 (43.5%) |
| Fuel Oil or Kerosene | 0 (0.0%) | 0 (0.0%) |
| Coal or Coke | 0 (0.0%) | 0 (0.0%) |
| All other Fuels | 21 (3.5%) | 0 (0.0%) |
| No Fuel Used | 0 (0.0%) | 0 (0.0%) |
| Total | 591 (100.0%) | 239 (100.0%) |
Household Vehicle Usage in Manhattan
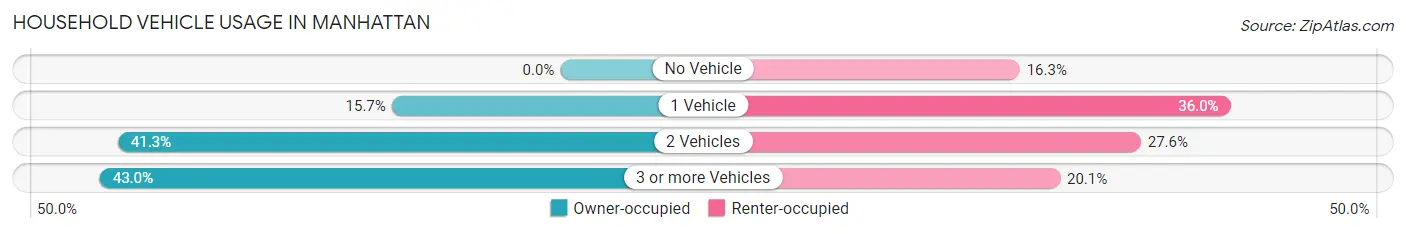
| Vehicles per Household | Owner-occupied | Renter-occupied |
| No Vehicle | 0 (0.0%) | 39 (16.3%) |
| 1 Vehicle | 93 (15.7%) | 86 (36.0%) |
| 2 Vehicles | 244 (41.3%) | 66 (27.6%) |
| 3 or more Vehicles | 254 (43.0%) | 48 (20.1%) |
| Total | 591 (100.0%) | 239 (100.0%) |
Real Estate & Mortgages in Manhattan
Real Estate and Mortgage Overview in Manhattan
| Characteristic | Without Mortgage | With Mortgage |
| Housing Units | 263 | 328 |
| Median Property Value | $340,900 | $351,800 |
| Median Household Income | $56,624 | $63 |
| Monthly Housing Costs | $681 | $4 |
| Real Estate Taxes | $3,128 | $0 |
Property Value by Mortgage Status in Manhattan
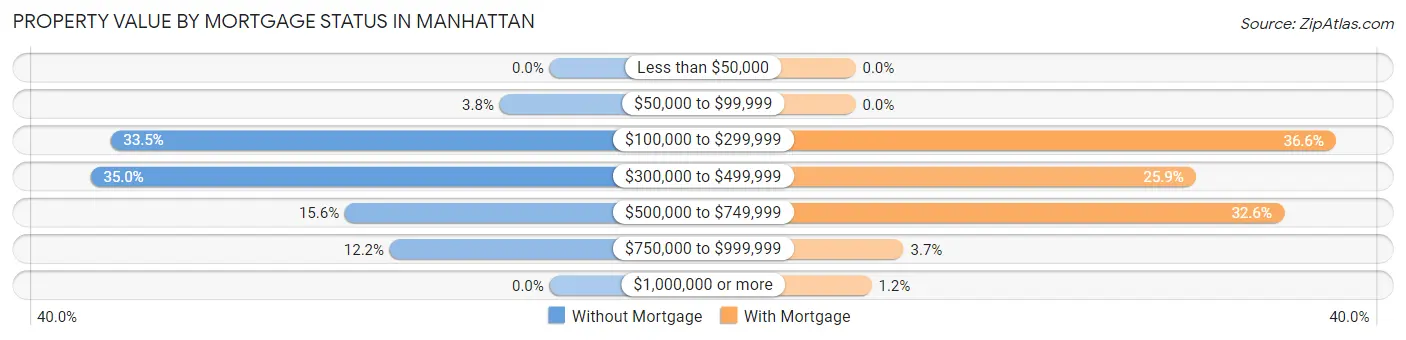
| Property Value | Without Mortgage | With Mortgage |
| Less than $50,000 | 0 (0.0%) | 0 (0.0%) |
| $50,000 to $99,999 | 10 (3.8%) | 0 (0.0%) |
| $100,000 to $299,999 | 88 (33.5%) | 120 (36.6%) |
| $300,000 to $499,999 | 92 (35.0%) | 85 (25.9%) |
| $500,000 to $749,999 | 41 (15.6%) | 107 (32.6%) |
| $750,000 to $999,999 | 32 (12.2%) | 12 (3.7%) |
| $1,000,000 or more | 0 (0.0%) | 4 (1.2%) |
| Total | 263 (100.0%) | 328 (100.0%) |
Household Income by Mortgage Status in Manhattan
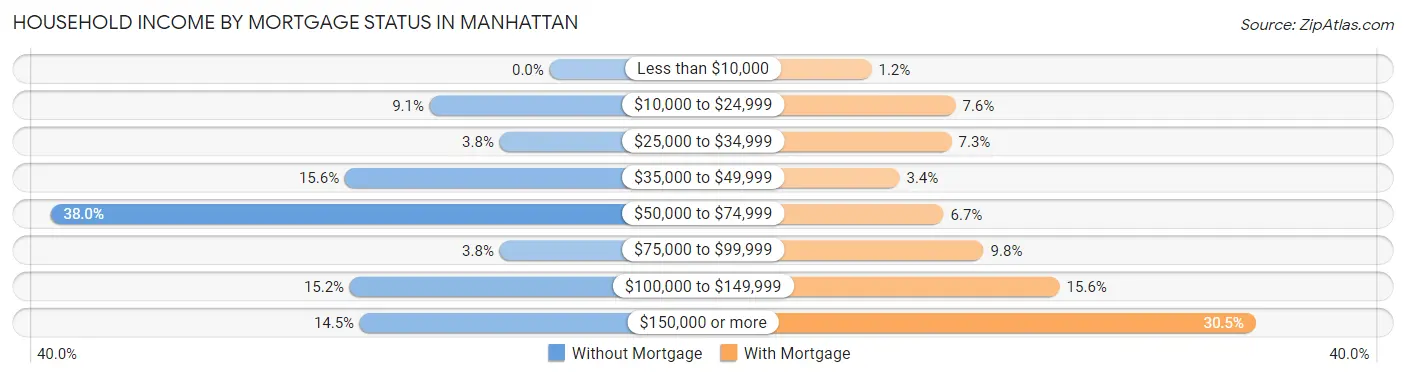
| Household Income | Without Mortgage | With Mortgage |
| Less than $10,000 | 0 (0.0%) | 4 (1.2%) |
| $10,000 to $24,999 | 24 (9.1%) | 25 (7.6%) |
| $25,000 to $34,999 | 10 (3.8%) | 24 (7.3%) |
| $35,000 to $49,999 | 41 (15.6%) | 11 (3.4%) |
| $50,000 to $74,999 | 100 (38.0%) | 22 (6.7%) |
| $75,000 to $99,999 | 10 (3.8%) | 32 (9.8%) |
| $100,000 to $149,999 | 40 (15.2%) | 51 (15.5%) |
| $150,000 or more | 38 (14.4%) | 100 (30.5%) |
| Total | 263 (100.0%) | 328 (100.0%) |
Property Value to Household Income Ratio in Manhattan
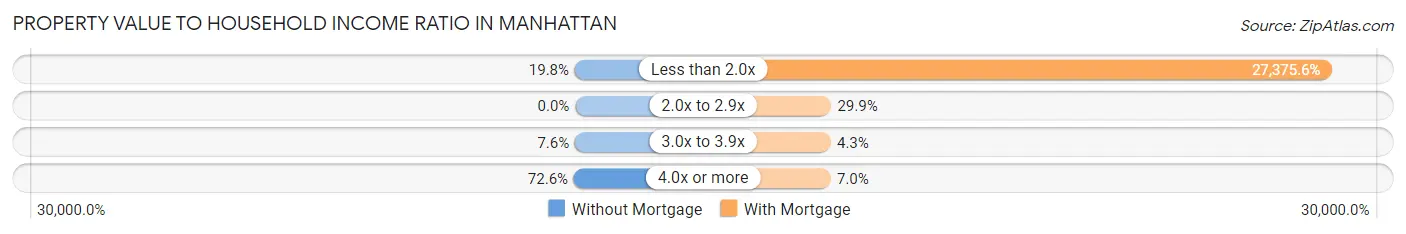
| Value-to-Income Ratio | Without Mortgage | With Mortgage |
| Less than 2.0x | 52 (19.8%) | 89,792 (27,375.6%) |
| 2.0x to 2.9x | 0 (0.0%) | 98 (29.9%) |
| 3.0x to 3.9x | 20 (7.6%) | 14 (4.3%) |
| 4.0x or more | 191 (72.6%) | 23 (7.0%) |
| Total | 263 (100.0%) | 328 (100.0%) |
Real Estate Taxes by Mortgage Status in Manhattan
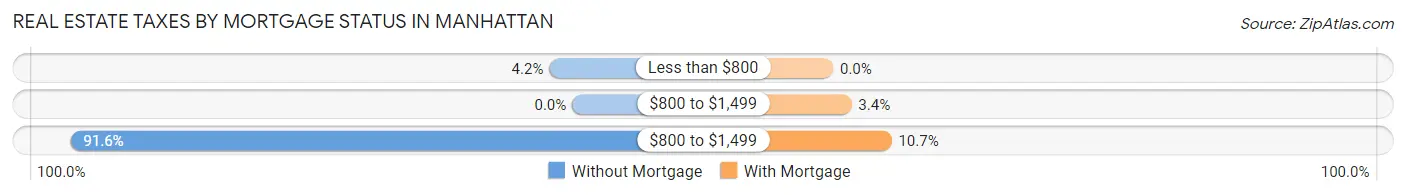
| Property Taxes | Without Mortgage | With Mortgage |
| Less than $800 | 11 (4.2%) | 0 (0.0%) |
| $800 to $1,499 | 0 (0.0%) | 11 (3.4%) |
| $800 to $1,499 | 241 (91.6%) | 35 (10.7%) |
| Total | 263 (100.0%) | 328 (100.0%) |
Health & Disability in Manhattan
Health Insurance Coverage by Age in Manhattan
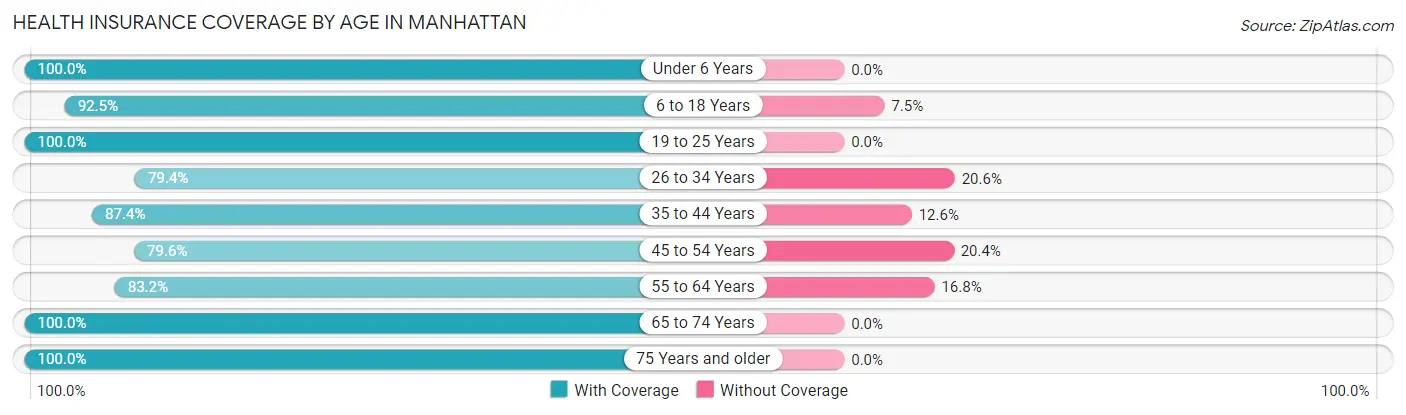
| Age Bracket | With Coverage | Without Coverage |
| Under 6 Years | 92 (100.0%) | 0 (0.0%) |
| 6 to 18 Years | 494 (92.5%) | 40 (7.5%) |
| 19 to 25 Years | 91 (100.0%) | 0 (0.0%) |
| 26 to 34 Years | 54 (79.4%) | 14 (20.6%) |
| 35 to 44 Years | 285 (87.4%) | 41 (12.6%) |
| 45 to 54 Years | 160 (79.6%) | 41 (20.4%) |
| 55 to 64 Years | 267 (83.2%) | 54 (16.8%) |
| 65 to 74 Years | 203 (100.0%) | 0 (0.0%) |
| 75 Years and older | 124 (100.0%) | 0 (0.0%) |
| Total | 1,770 (90.3%) | 190 (9.7%) |
Health Insurance Coverage by Citizenship Status in Manhattan
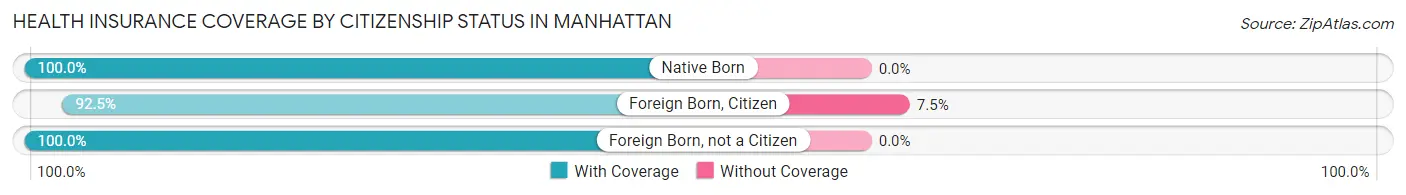
| Citizenship Status | With Coverage | Without Coverage |
| Native Born | 92 (100.0%) | 0 (0.0%) |
| Foreign Born, Citizen | 494 (92.5%) | 40 (7.5%) |
| Foreign Born, not a Citizen | 91 (100.0%) | 0 (0.0%) |
Health Insurance Coverage by Household Income in Manhattan
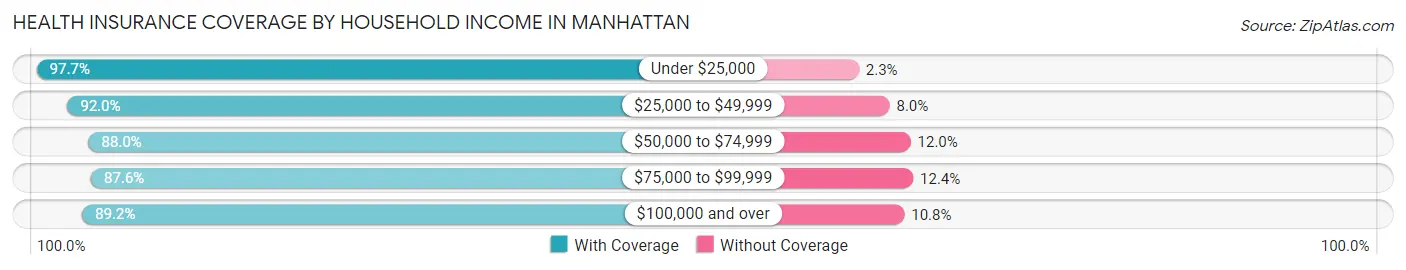
| Household Income | With Coverage | Without Coverage |
| Under $25,000 | 216 (97.7%) | 5 (2.3%) |
| $25,000 to $49,999 | 310 (92.0%) | 27 (8.0%) |
| $50,000 to $74,999 | 287 (88.0%) | 39 (12.0%) |
| $75,000 to $99,999 | 162 (87.6%) | 23 (12.4%) |
| $100,000 and over | 795 (89.2%) | 96 (10.8%) |
Public vs Private Health Insurance Coverage by Age in Manhattan
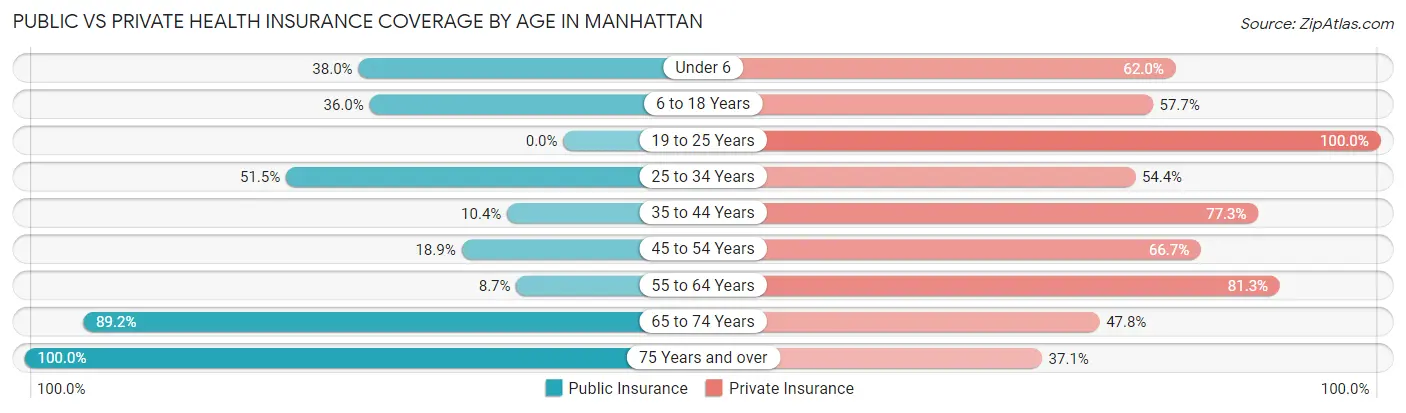
| Age Bracket | Public Insurance | Private Insurance |
| Under 6 | 35 (38.0%) | 57 (62.0%) |
| 6 to 18 Years | 192 (36.0%) | 308 (57.7%) |
| 19 to 25 Years | 0 (0.0%) | 91 (100.0%) |
| 25 to 34 Years | 35 (51.5%) | 37 (54.4%) |
| 35 to 44 Years | 34 (10.4%) | 252 (77.3%) |
| 45 to 54 Years | 38 (18.9%) | 134 (66.7%) |
| 55 to 64 Years | 28 (8.7%) | 261 (81.3%) |
| 65 to 74 Years | 181 (89.2%) | 97 (47.8%) |
| 75 Years and over | 124 (100.0%) | 46 (37.1%) |
| Total | 667 (34.0%) | 1,283 (65.5%) |
Disability Status by Sex by Age in Manhattan
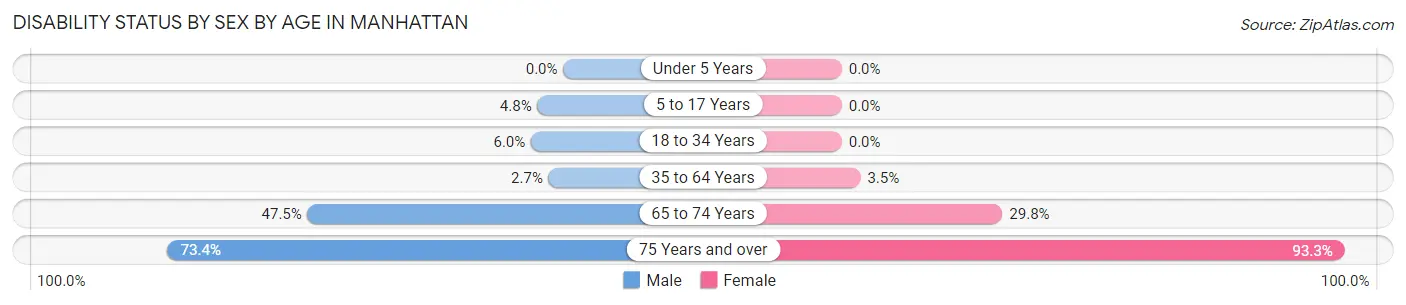
| Age Bracket | Male | Female |
| Under 5 Years | 0 (0.0%) | 0 (0.0%) |
| 5 to 17 Years | 18 (4.8%) | 0 (0.0%) |
| 18 to 34 Years | 7 (6.0%) | 0 (0.0%) |
| 35 to 64 Years | 12 (2.7%) | 14 (3.5%) |
| 65 to 74 Years | 47 (47.5%) | 31 (29.8%) |
| 75 Years and over | 47 (73.4%) | 56 (93.3%) |
Disability Class by Sex by Age in Manhattan
Disability Class: Hearing Difficulty
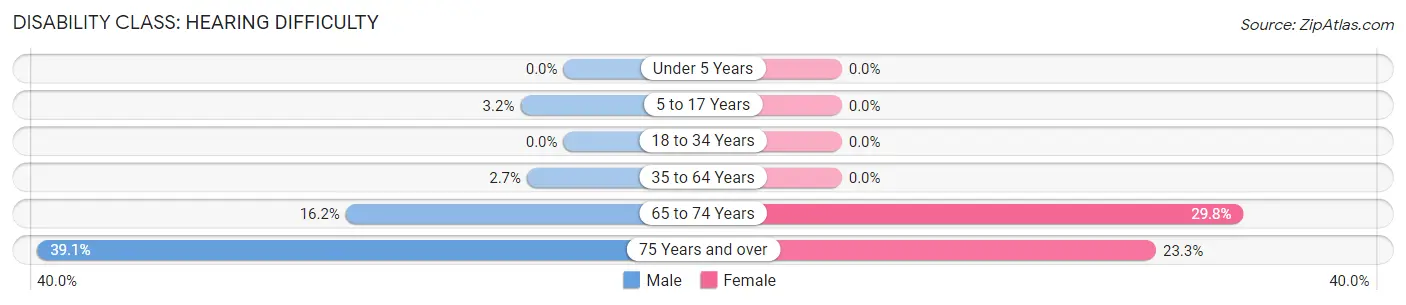
| Age Bracket | Male | Female |
| Under 5 Years | 0 (0.0%) | 0 (0.0%) |
| 5 to 17 Years | 12 (3.2%) | 0 (0.0%) |
| 18 to 34 Years | 0 (0.0%) | 0 (0.0%) |
| 35 to 64 Years | 12 (2.7%) | 0 (0.0%) |
| 65 to 74 Years | 16 (16.2%) | 31 (29.8%) |
| 75 Years and over | 25 (39.1%) | 14 (23.3%) |
Disability Class: Vision Difficulty
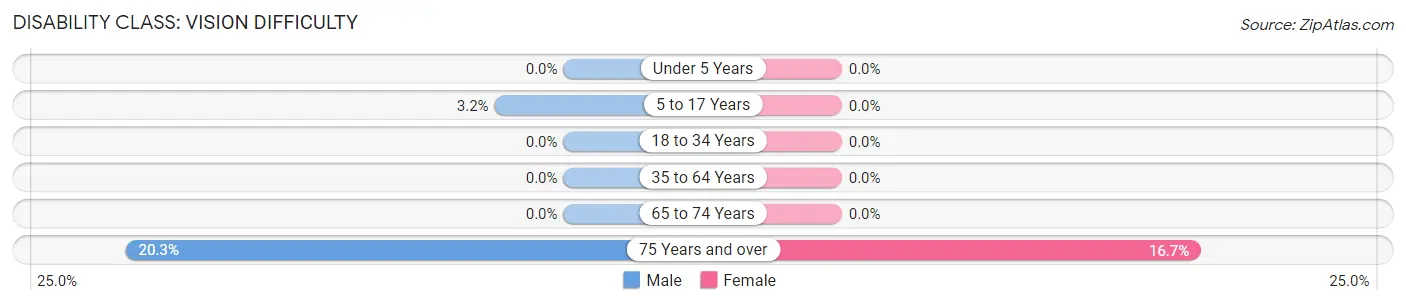
| Age Bracket | Male | Female |
| Under 5 Years | 0 (0.0%) | 0 (0.0%) |
| 5 to 17 Years | 12 (3.2%) | 0 (0.0%) |
| 18 to 34 Years | 0 (0.0%) | 0 (0.0%) |
| 35 to 64 Years | 0 (0.0%) | 0 (0.0%) |
| 65 to 74 Years | 0 (0.0%) | 0 (0.0%) |
| 75 Years and over | 13 (20.3%) | 10 (16.7%) |
Disability Class: Cognitive Difficulty
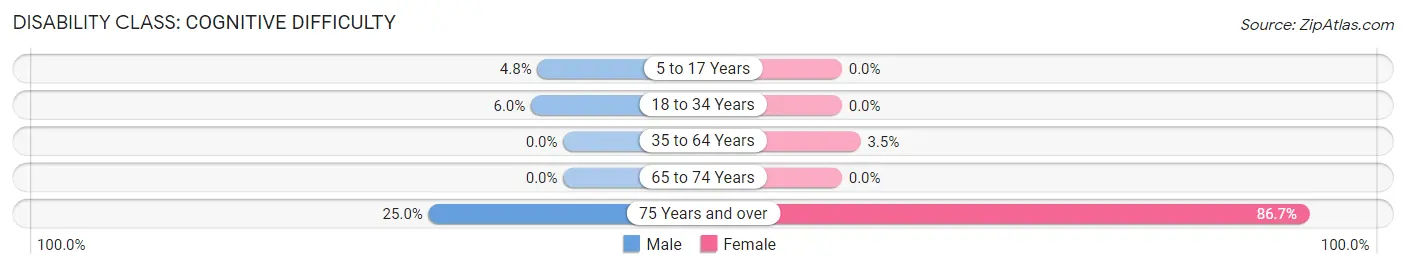
| Age Bracket | Male | Female |
| 5 to 17 Years | 18 (4.8%) | 0 (0.0%) |
| 18 to 34 Years | 7 (6.0%) | 0 (0.0%) |
| 35 to 64 Years | 0 (0.0%) | 14 (3.5%) |
| 65 to 74 Years | 0 (0.0%) | 0 (0.0%) |
| 75 Years and over | 16 (25.0%) | 52 (86.7%) |
Disability Class: Ambulatory Difficulty
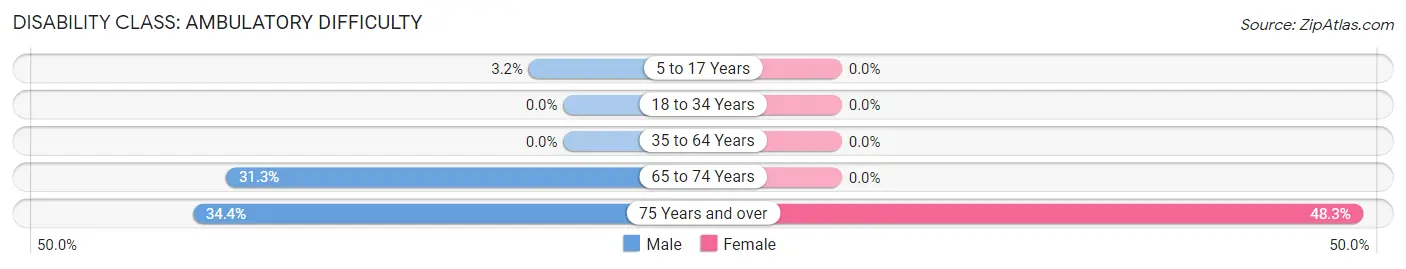
| Age Bracket | Male | Female |
| 5 to 17 Years | 12 (3.2%) | 0 (0.0%) |
| 18 to 34 Years | 0 (0.0%) | 0 (0.0%) |
| 35 to 64 Years | 0 (0.0%) | 0 (0.0%) |
| 65 to 74 Years | 31 (31.3%) | 0 (0.0%) |
| 75 Years and over | 22 (34.4%) | 29 (48.3%) |
Disability Class: Self-Care Difficulty
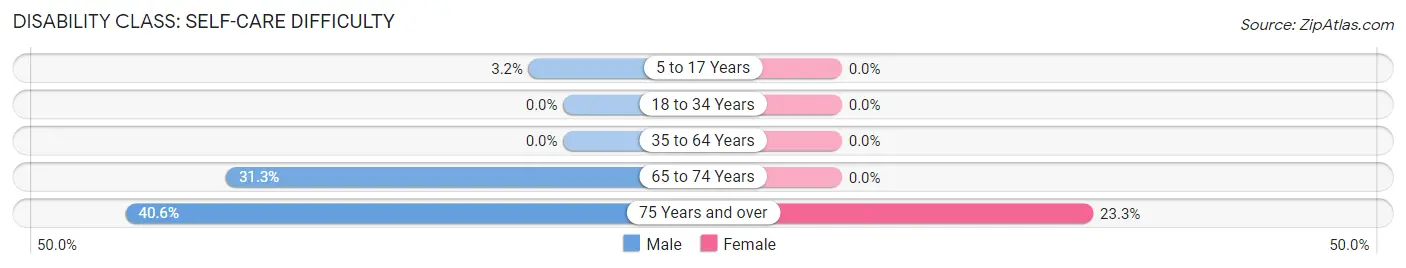
| Age Bracket | Male | Female |
| 5 to 17 Years | 12 (3.2%) | 0 (0.0%) |
| 18 to 34 Years | 0 (0.0%) | 0 (0.0%) |
| 35 to 64 Years | 0 (0.0%) | 0 (0.0%) |
| 65 to 74 Years | 31 (31.3%) | 0 (0.0%) |
| 75 Years and over | 26 (40.6%) | 14 (23.3%) |
Technology Access in Manhattan
Computing Device Access in Manhattan
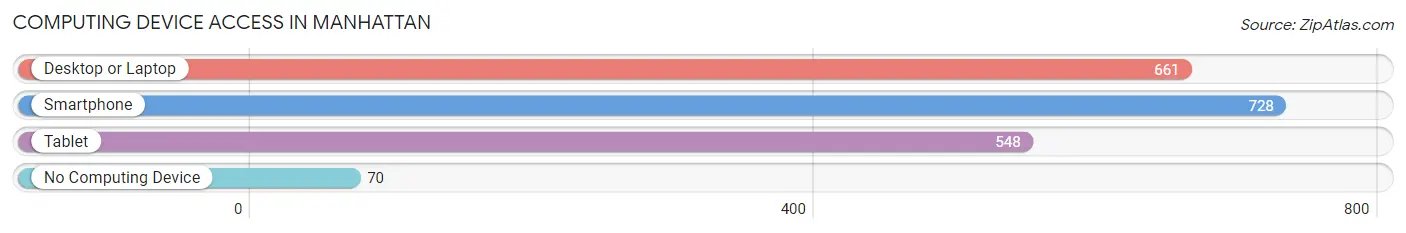
| Device Type | # Households | % Households |
| Desktop or Laptop | 661 | 79.6% |
| Smartphone | 728 | 87.7% |
| Tablet | 548 | 66.0% |
| No Computing Device | 70 | 8.4% |
| Total | 830 | 100.0% |
Internet Access in Manhattan
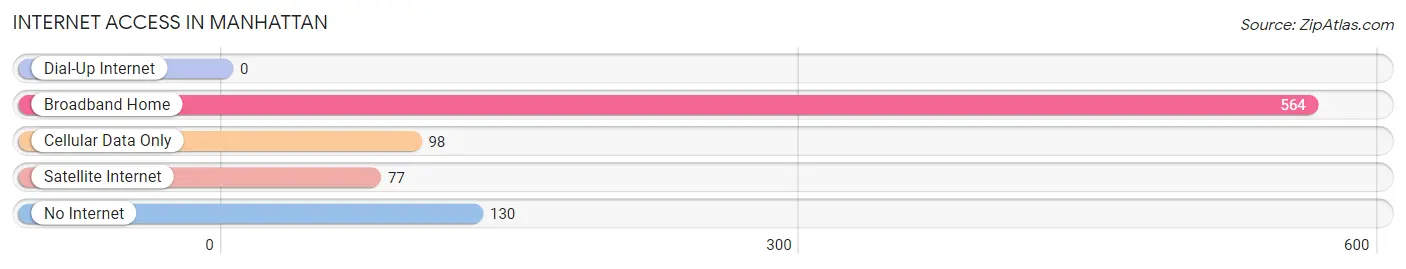
| Internet Type | # Households | % Households |
| Dial-Up Internet | 0 | 0.0% |
| Broadband Home | 564 | 67.9% |
| Cellular Data Only | 98 | 11.8% |
| Satellite Internet | 77 | 9.3% |
| No Internet | 130 | 15.7% |
| Total | 830 | 100.0% |
Manhattan Summary
Manhattan, Montana is a small town located in the southwestern part of the state, in Gallatin County. It is situated at the base of the Bridger Mountains, and is surrounded by the Gallatin National Forest. The town has a population of about 1,500 people, and is known for its small-town charm and outdoor recreation opportunities.
History
The area that is now Manhattan was first settled in the late 1800s by homesteaders and ranchers. The town was officially founded in 1883, and was named after the nearby Manhattan Mine. The mine was a major source of copper ore, and the town quickly grew as a result of the mining industry. By the early 1900s, Manhattan had become a bustling mining town, with a population of over 1,000 people.
The mining industry eventually declined, and the town’s population began to dwindle. In the 1950s, the town was revitalized by the construction of the Bozeman Dam, which provided irrigation water for the surrounding area. This allowed for the development of agriculture in the area, and the town’s population began to grow again.
Geography
Manhattan is located in the southwestern part of Montana, in Gallatin County. It is situated at the base of the Bridger Mountains, and is surrounded by the Gallatin National Forest. The town is located at an elevation of 4,890 feet, and has a total area of 1.2 square miles.
The climate in Manhattan is semi-arid, with hot summers and cold winters. The average high temperature in the summer is around 85 degrees Fahrenheit, and the average low temperature in the winter is around 10 degrees Fahrenheit. The town receives an average of 16 inches of precipitation per year.
Economy
The economy of Manhattan is largely based on agriculture and tourism. The town is home to several farms and ranches, which produce a variety of crops and livestock. The town is also a popular destination for outdoor recreation, and is home to several ski resorts, hiking trails, and other attractions.
The town is also home to several businesses, including restaurants, retail stores, and other services. The town is also home to several manufacturing companies, which produce a variety of products, including furniture, clothing, and electronics.
Demographics
As of the 2010 census, the population of Manhattan was 1,521. The racial makeup of the town was 94.3% White, 0.7% African American, 0.7% Native American, 0.3% Asian, 0.1% Pacific Islander, and 3.0% from other races. The median household income in the town was $41,250, and the median family income was $50,000.
The town is home to several churches, including the First Presbyterian Church, the Church of Jesus Christ of Latter-day Saints, and the United Methodist Church. The town is also home to several schools, including Manhattan Elementary School, Manhattan Middle School, and Manhattan High School.
Common Questions
What is Per Capita Income in Manhattan?
Per Capita income in Manhattan is $35,703.
What is the Median Family Income in Manhattan?
Median Family Income in Manhattan is $104,159.
What is the Median Household income in Manhattan?
Median Household Income in Manhattan is $57,045.
What is Income or Wage Gap in Manhattan?
Income or Wage Gap in Manhattan is 7.4%.
Women in Manhattan earn 92.6 cents for every dollar earned by a man.
What is Inequality or Gini Index in Manhattan?
Inequality or Gini Index in Manhattan is 0.46.
What is the Total Population of Manhattan?
Total Population of Manhattan is 1,986.
What is the Total Male Population of Manhattan?
Total Male Population of Manhattan is 1,148.
What is the Total Female Population of Manhattan?
Total Female Population of Manhattan is 838.
What is the Ratio of Males per 100 Females in Manhattan?
There are 136.99 Males per 100 Females in Manhattan.
What is the Ratio of Females per 100 Males in Manhattan?
There are 73.00 Females per 100 Males in Manhattan.
What is the Median Population Age in Manhattan?
Median Population Age in Manhattan is 39.6 Years.
What is the Average Family Size in Manhattan
Average Family Size in Manhattan is 3.3 People.
What is the Average Household Size in Manhattan
Average Household Size in Manhattan is 2.4 People.
How Large is the Labor Force in Manhattan?
There are 1,042 People in the Labor Forcein in Manhattan.
What is the Percentage of People in the Labor Force in Manhattan?
75.1% of People are in the Labor Force in Manhattan.