Coram, MT Map & Demographics
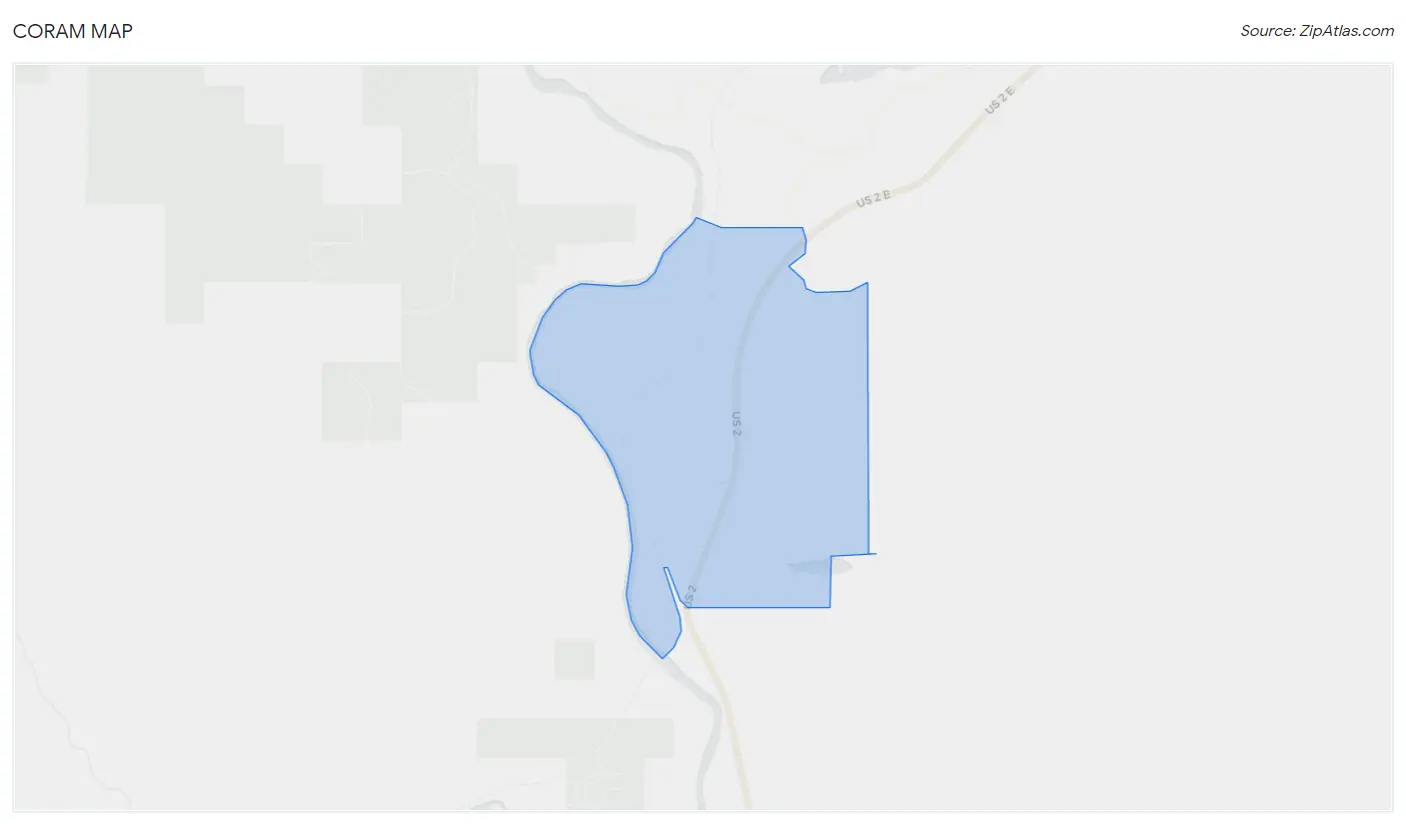
Coram Map
Coram Overview
$23,407
PER CAPITA INCOME
$58,875
AVG FAMILY INCOME
$58,333
AVG HOUSEHOLD INCOME
16.6%
WAGE / INCOME GAP [ % ]
83.4¢/ $1
WAGE / INCOME GAP [ $ ]
0.37
INEQUALITY / GINI INDEX
442
TOTAL POPULATION
257
MALE POPULATION
185
FEMALE POPULATION
138.92
MALES / 100 FEMALES
71.98
FEMALES / 100 MALES
46.5
MEDIAN AGE
4.2
AVG FAMILY SIZE
3.0
AVG HOUSEHOLD SIZE
113
LABOR FORCE [ PEOPLE ]
33.7%
PERCENT IN LABOR FORCE
9.7%
UNEMPLOYMENT RATE
Coram Zip Codes
Coram Area Codes
Income in Coram
Income Overview in Coram
Per Capita Income in Coram is $23,407, while median incomes of families and households are $58,875 and $58,333 respectively.
| Characteristic | Number | Measure |
| Per Capita Income | 442 | $23,407 |
| Median Family Income | 91 | $58,875 |
| Mean Family Income | 91 | $62,356 |
| Median Household Income | 146 | $58,333 |
| Mean Household Income | 146 | $70,171 |
| Income Deficit | 91 | $0 |
| Wage / Income Gap (%) | 442 | 16.64% |
| Wage / Income Gap ($) | 442 | 83.36¢ per $1 |
| Gini / Inequality Index | 442 | 0.37 |
Earnings by Sex in Coram
Average Earnings in Coram are $34,226, $34,762 for men and $28,977 for women, a difference of 16.6%.
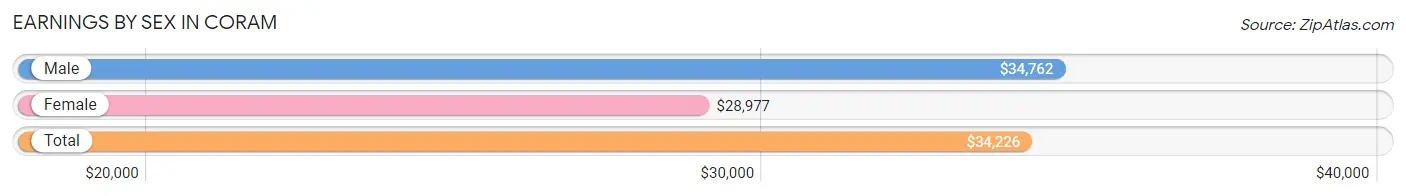
| Sex | Number | Average Earnings |
| Male | 72 (58.5%) | $34,762 |
| Female | 51 (41.5%) | $28,977 |
| Total | 123 (100.0%) | $34,226 |
Earnings by Sex by Income Bracket in Coram
The most common earnings brackets in Coram are $30,000 to $34,999 for men (21 | 29.2%) and $25,000 to $29,999 for women (11 | 21.6%).
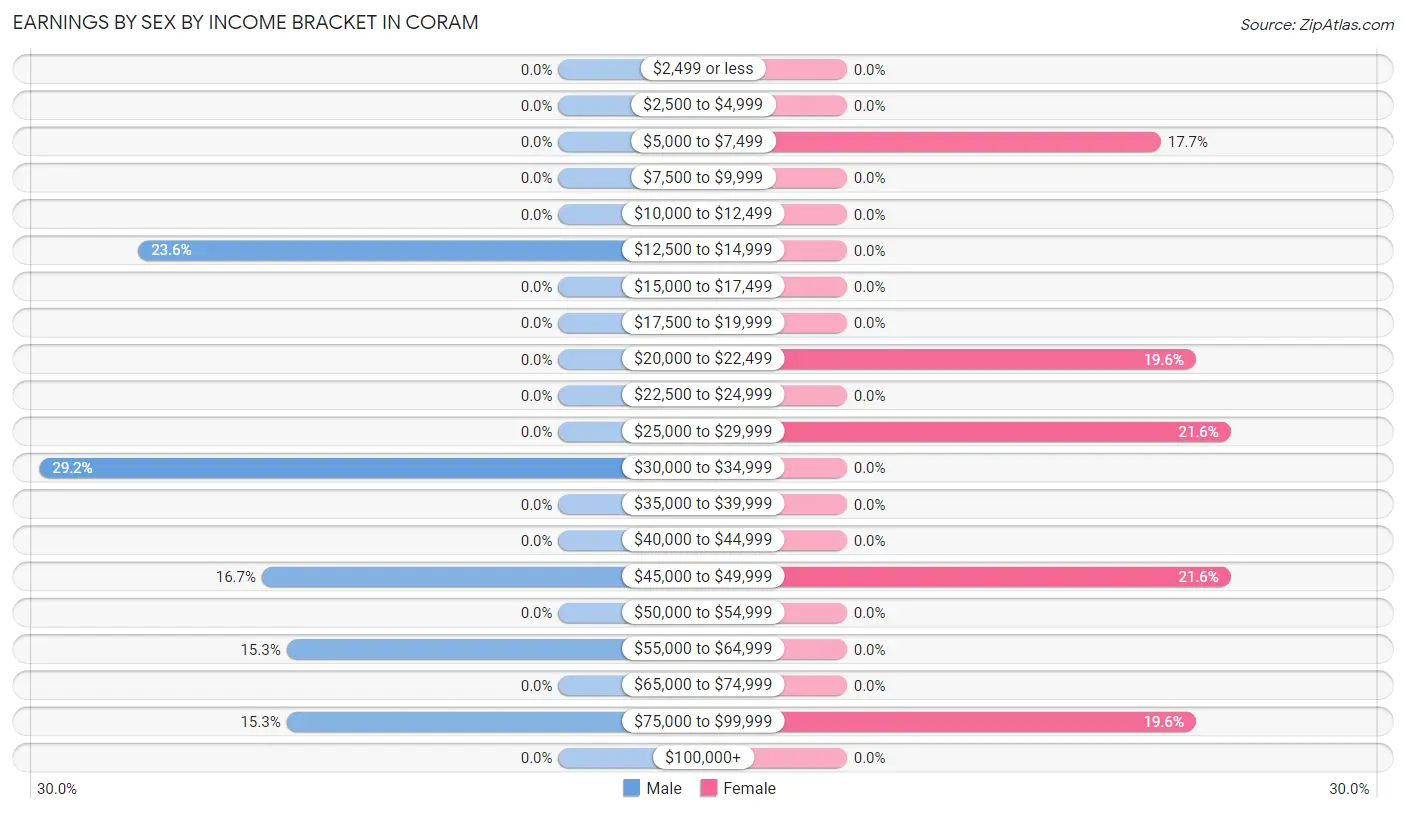
| Income | Male | Female |
| $2,499 or less | 0 (0.0%) | 0 (0.0%) |
| $2,500 to $4,999 | 0 (0.0%) | 0 (0.0%) |
| $5,000 to $7,499 | 0 (0.0%) | 9 (17.6%) |
| $7,500 to $9,999 | 0 (0.0%) | 0 (0.0%) |
| $10,000 to $12,499 | 0 (0.0%) | 0 (0.0%) |
| $12,500 to $14,999 | 17 (23.6%) | 0 (0.0%) |
| $15,000 to $17,499 | 0 (0.0%) | 0 (0.0%) |
| $17,500 to $19,999 | 0 (0.0%) | 0 (0.0%) |
| $20,000 to $22,499 | 0 (0.0%) | 10 (19.6%) |
| $22,500 to $24,999 | 0 (0.0%) | 0 (0.0%) |
| $25,000 to $29,999 | 0 (0.0%) | 11 (21.6%) |
| $30,000 to $34,999 | 21 (29.2%) | 0 (0.0%) |
| $35,000 to $39,999 | 0 (0.0%) | 0 (0.0%) |
| $40,000 to $44,999 | 0 (0.0%) | 0 (0.0%) |
| $45,000 to $49,999 | 12 (16.7%) | 11 (21.6%) |
| $50,000 to $54,999 | 0 (0.0%) | 0 (0.0%) |
| $55,000 to $64,999 | 11 (15.3%) | 0 (0.0%) |
| $65,000 to $74,999 | 0 (0.0%) | 0 (0.0%) |
| $75,000 to $99,999 | 11 (15.3%) | 10 (19.6%) |
| $100,000+ | 0 (0.0%) | 0 (0.0%) |
| Total | 72 (100.0%) | 51 (100.0%) |
Earnings by Sex by Educational Attainment in Coram
Average earnings in Coram are $34,762 for men and $28,977 for women, a difference of 16.6%. Men with an educational attainment of college or associate's degree enjoy the highest average annual earnings of $46,354, while those with college or associate's degree education earn the least with $46,354. Women with an educational attainment of bachelor's degree earn the most with the average annual earnings of $28,977, while those with bachelor's degree education have the smallest earnings of $28,977.
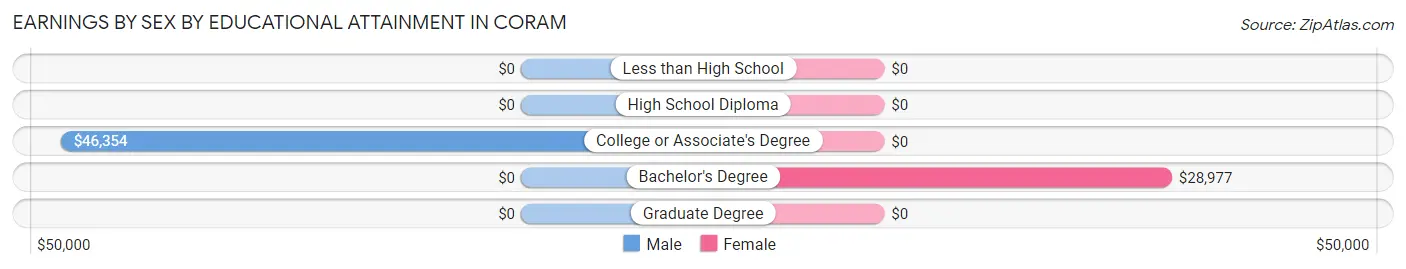
| Educational Attainment | Male Income | Female Income |
| Less than High School | - | - |
| High School Diploma | - | - |
| College or Associate's Degree | $46,354 | $0 |
| Bachelor's Degree | - | - |
| Graduate Degree | - | - |
| Total | $34,762 | $28,977 |
Family Income in Coram
Family Income Brackets in Coram
According to the Coram family income data, there are 51 families falling into the $50,000 to $74,999 income range, which is the most common income bracket and makes up 56.0% of all families.
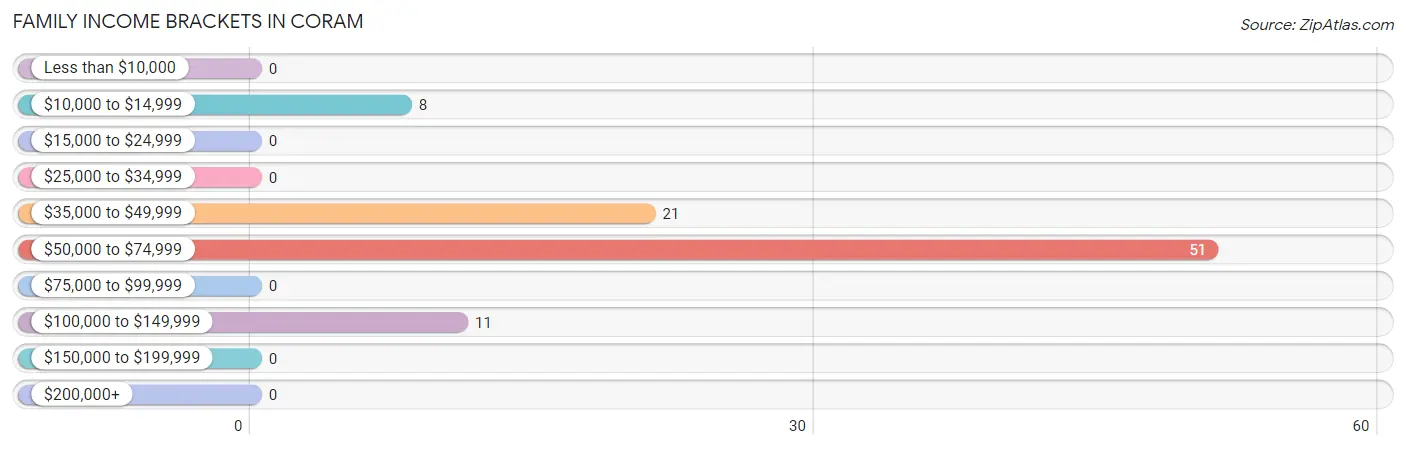
| Income Bracket | # Families | % Families |
| Less than $10,000 | 0 | 0.0% |
| $10,000 to $14,999 | 8 | 8.8% |
| $15,000 to $24,999 | 0 | 0.0% |
| $25,000 to $34,999 | 0 | 0.0% |
| $35,000 to $49,999 | 21 | 23.1% |
| $50,000 to $74,999 | 51 | 56.0% |
| $75,000 to $99,999 | 0 | 0.0% |
| $100,000 to $149,999 | 11 | 12.1% |
| $150,000 to $199,999 | 0 | 0.0% |
| $200,000+ | 0 | 0.0% |
Family Income by Famaliy Size in Coram
3-person families (47 | 51.6%) account for the highest median family income in Coram with $58,042 per family, while 3-person families (47 | 51.6%) have the highest median income of $19,347 per family member.
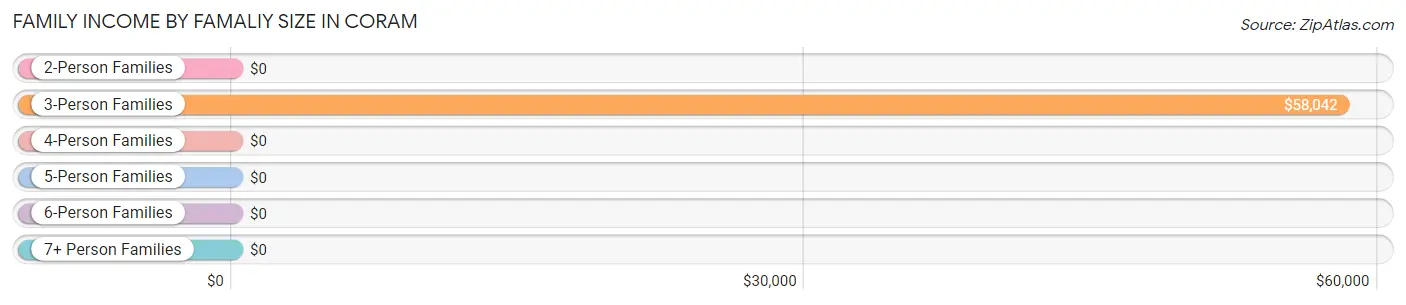
| Income Bracket | # Families | Median Income |
| 2-Person Families | 0 (0.0%) | $0 |
| 3-Person Families | 47 (51.6%) | $58,042 |
| 4-Person Families | 22 (24.2%) | $0 |
| 5-Person Families | 10 (11.0%) | $0 |
| 6-Person Families | 12 (13.2%) | $0 |
| 7+ Person Families | 0 (0.0%) | $0 |
| Total | 91 (100.0%) | $58,875 |
Family Income by Number of Earners in Coram
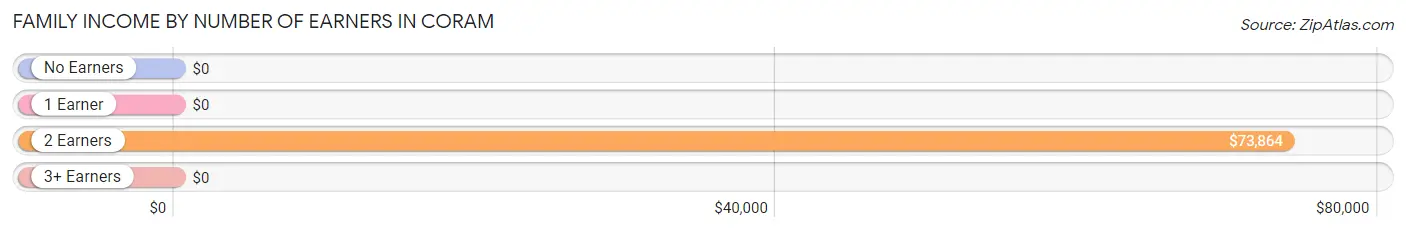
| Number of Earners | # Families | Median Income |
| No Earners | 38 (41.8%) | $0 |
| 1 Earner | 21 (23.1%) | $0 |
| 2 Earners | 32 (35.2%) | $73,864 |
| 3+ Earners | 0 (0.0%) | $0 |
| Total | 91 (100.0%) | $58,875 |
Household Income in Coram
Household Income Brackets in Coram
With 51 households falling in the category, the $50,000 to $74,999 income range is the most frequent in Coram, accounting for 34.9% of all households.
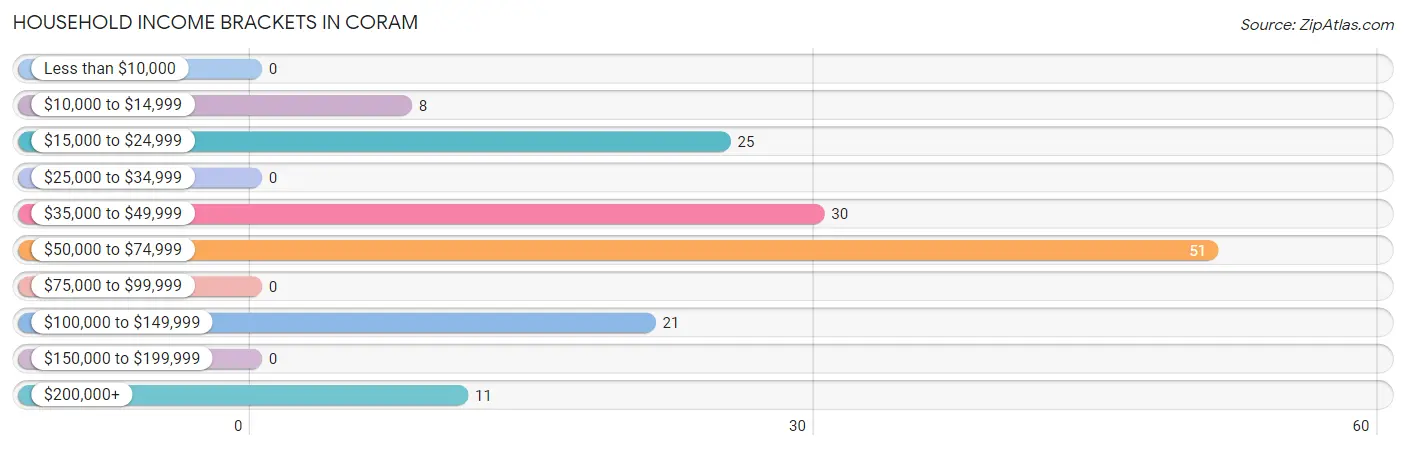
| Income Bracket | # Households | % Households |
| Less than $10,000 | 0 | 0.0% |
| $10,000 to $14,999 | 8 | 5.5% |
| $15,000 to $24,999 | 25 | 17.1% |
| $25,000 to $34,999 | 0 | 0.0% |
| $35,000 to $49,999 | 30 | 20.5% |
| $50,000 to $74,999 | 51 | 34.9% |
| $75,000 to $99,999 | 0 | 0.0% |
| $100,000 to $149,999 | 21 | 14.4% |
| $150,000 to $199,999 | 0 | 0.0% |
| $200,000+ | 11 | 7.5% |
Household Income by Householder Age in Coram
The median household income in Coram is $58,333, with the highest median household income of $71,250 found in the 25 to 44 years age bracket for the primary householder. A total of 44 households (30.1%) fall into this category.
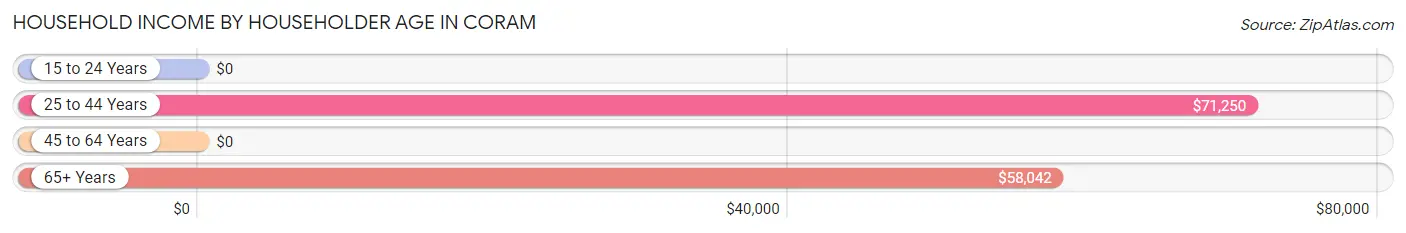
| Income Bracket | # Households | Median Income |
| 15 to 24 Years | 0 (0.0%) | $0 |
| 25 to 44 Years | 44 (30.1%) | $71,250 |
| 45 to 64 Years | 55 (37.7%) | $0 |
| 65+ Years | 47 (32.2%) | $58,042 |
| Total | 146 (100.0%) | $58,333 |
Poverty in Coram
Income Below Poverty by Sex and Age in Coram
With 10.5% poverty level for males and 4.3% for females among the residents of Coram, 75 year old and over males and 75 year old and over females are the most vulnerable to poverty, with 10 males (100.0%) and 8 females (47.1%) in their respective age groups living below the poverty level.
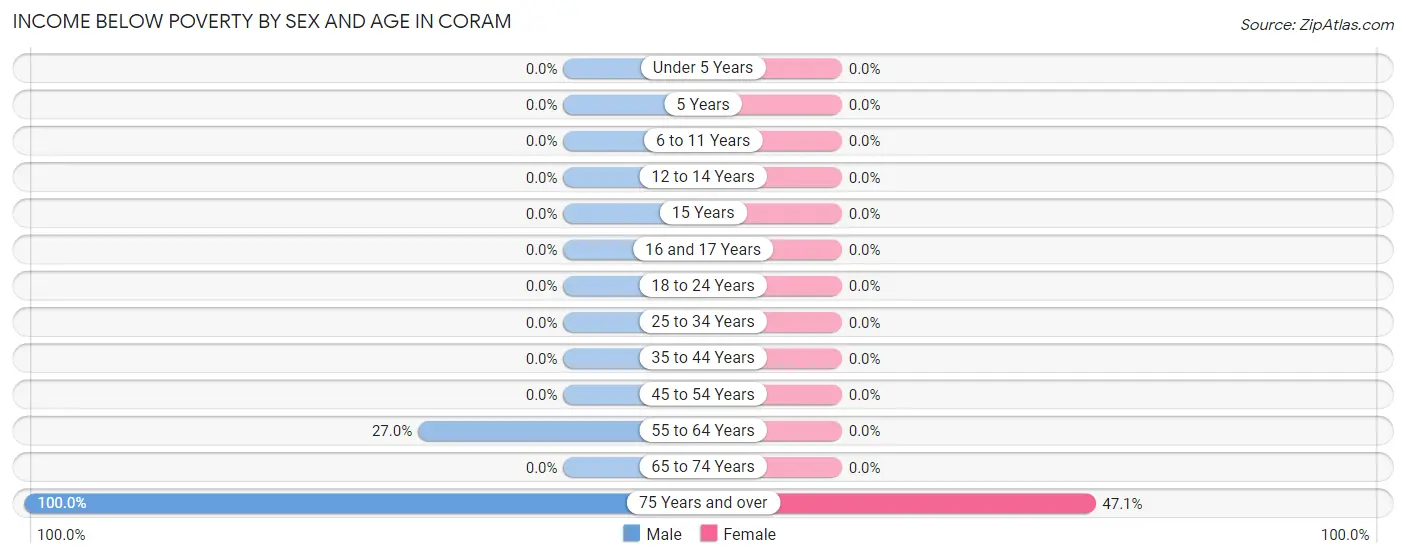
| Age Bracket | Male | Female |
| Under 5 Years | 0 (0.0%) | 0 (0.0%) |
| 5 Years | 0 (0.0%) | 0 (0.0%) |
| 6 to 11 Years | 0 (0.0%) | 0 (0.0%) |
| 12 to 14 Years | 0 (0.0%) | 0 (0.0%) |
| 15 Years | 0 (0.0%) | 0 (0.0%) |
| 16 and 17 Years | 0 (0.0%) | 0 (0.0%) |
| 18 to 24 Years | 0 (0.0%) | 0 (0.0%) |
| 25 to 34 Years | 0 (0.0%) | 0 (0.0%) |
| 35 to 44 Years | 0 (0.0%) | 0 (0.0%) |
| 45 to 54 Years | 0 (0.0%) | 0 (0.0%) |
| 55 to 64 Years | 17 (27.0%) | 0 (0.0%) |
| 65 to 74 Years | 0 (0.0%) | 0 (0.0%) |
| 75 Years and over | 10 (100.0%) | 8 (47.1%) |
| Total | 27 (10.5%) | 8 (4.3%) |
Income Above Poverty by Sex and Age in Coram
According to the poverty statistics in Coram, males aged under 5 years and females aged 6 to 11 years are the age groups that are most secure financially, with 100.0% of males and 100.0% of females in these age groups living above the poverty line.
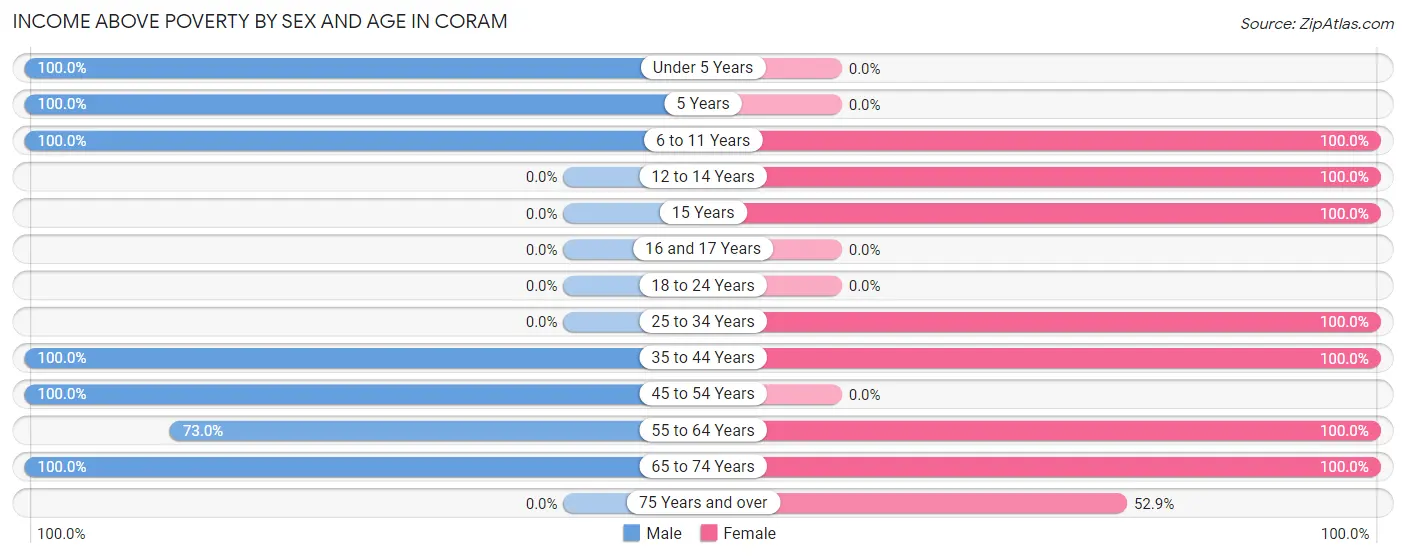
| Age Bracket | Male | Female |
| Under 5 Years | 20 (100.0%) | 0 (0.0%) |
| 5 Years | 12 (100.0%) | 0 (0.0%) |
| 6 to 11 Years | 24 (100.0%) | 36 (100.0%) |
| 12 to 14 Years | 0 (0.0%) | 6 (100.0%) |
| 15 Years | 0 (0.0%) | 9 (100.0%) |
| 16 and 17 Years | 0 (0.0%) | 0 (0.0%) |
| 18 to 24 Years | 0 (0.0%) | 0 (0.0%) |
| 25 to 34 Years | 0 (0.0%) | 11 (100.0%) |
| 35 to 44 Years | 44 (100.0%) | 32 (100.0%) |
| 45 to 54 Years | 54 (100.0%) | 0 (0.0%) |
| 55 to 64 Years | 46 (73.0%) | 44 (100.0%) |
| 65 to 74 Years | 30 (100.0%) | 30 (100.0%) |
| 75 Years and over | 0 (0.0%) | 9 (52.9%) |
| Total | 230 (89.5%) | 177 (95.7%) |
Income Below Poverty Among Married-Couple Families in Coram
The poverty statistics for married-couple families in Coram show that 9.8% or 8 of the total 82 families live below the poverty line. Families with no children have the highest poverty rate of 21.0%, comprising of 8 families. On the other hand, families with 1 or 2 children have the lowest poverty rate of 0.0%, which includes 0 families.
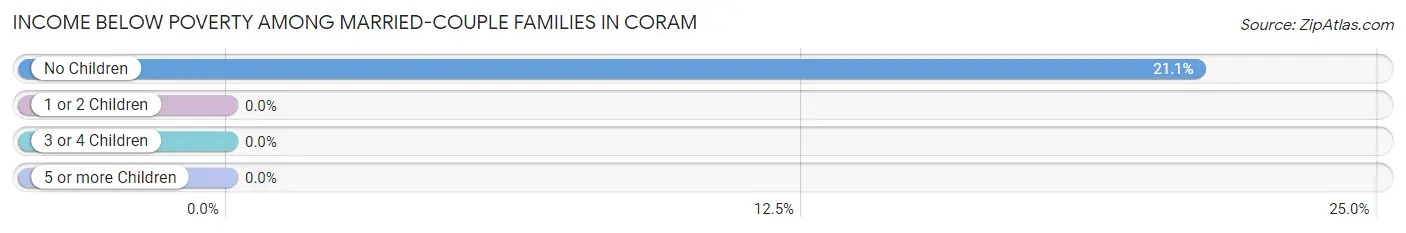
| Children | Above Poverty | Below Poverty |
| No Children | 30 (78.9%) | 8 (21.0%) |
| 1 or 2 Children | 22 (100.0%) | 0 (0.0%) |
| 3 or 4 Children | 22 (100.0%) | 0 (0.0%) |
| 5 or more Children | 0 (0.0%) | 0 (0.0%) |
| Total | 74 (90.2%) | 8 (9.8%) |
Income Below Poverty Among Single-Parent Households in Coram
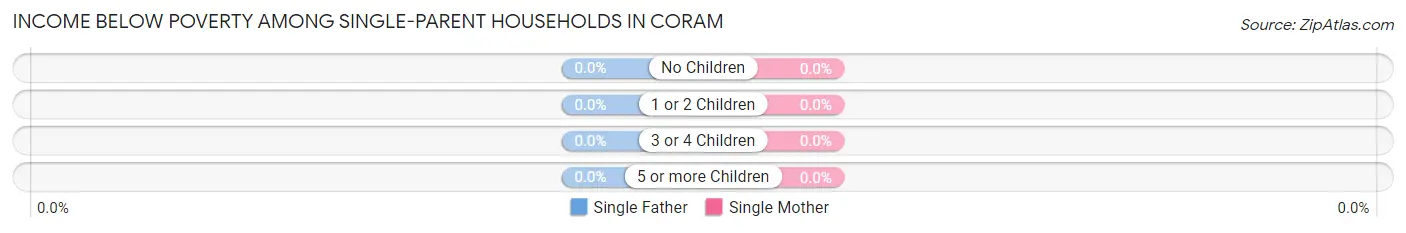
| Children | Single Father | Single Mother |
| No Children | 0 (0.0%) | 0 (0.0%) |
| 1 or 2 Children | 0 (0.0%) | 0 (0.0%) |
| 3 or 4 Children | 0 (0.0%) | 0 (0.0%) |
| 5 or more Children | 0 (0.0%) | 0 (0.0%) |
| Total | 0 (0.0%) | 0 (0.0%) |
Income Below Poverty Among Married-Couple vs Single-Parent Households in Coram
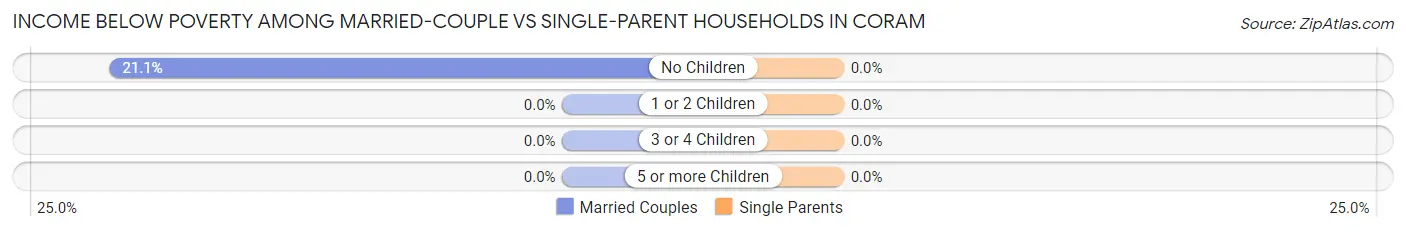
| Children | Married-Couple Families | Single-Parent Households |
| No Children | 8 (21.0%) | 0 (0.0%) |
| 1 or 2 Children | 0 (0.0%) | 0 (0.0%) |
| 3 or 4 Children | 0 (0.0%) | 0 (0.0%) |
| 5 or more Children | 0 (0.0%) | 0 (0.0%) |
| Total | 8 (9.8%) | 0 (0.0%) |
Race in Coram
The most populous races in Coram are White / Caucasian (417 | 94.3%), and Two or more Races (25 | 5.7%).
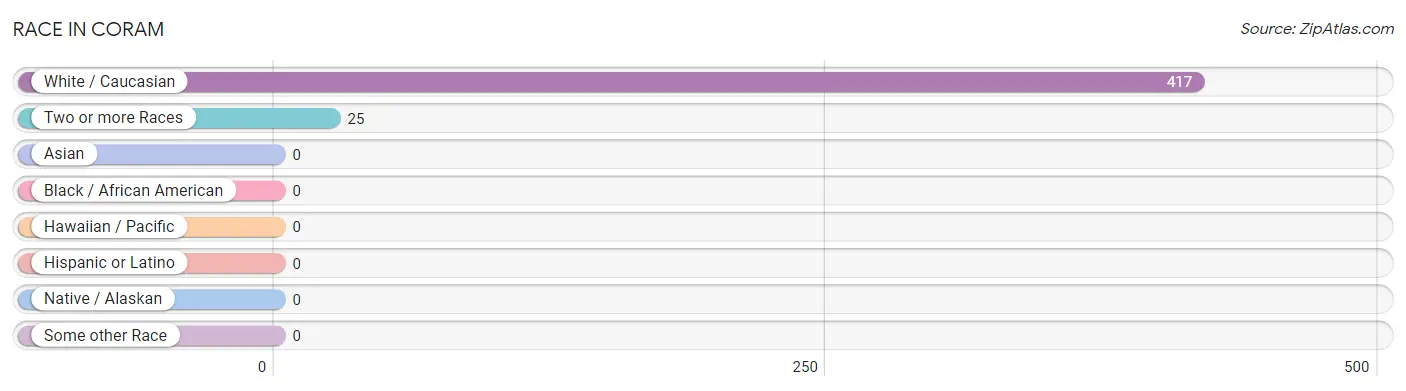
| Race | # Population | % Population |
| Asian | 0 | 0.0% |
| Black / African American | 0 | 0.0% |
| Hawaiian / Pacific | 0 | 0.0% |
| Hispanic or Latino | 0 | 0.0% |
| Native / Alaskan | 0 | 0.0% |
| White / Caucasian | 417 | 94.3% |
| Two or more Races | 25 | 5.7% |
| Some other Race | 0 | 0.0% |
| Total | 442 | 100.0% |
Ancestry in Coram
The most populous ancestries reported in Coram are Norwegian (138 | 31.2%), German (77 | 17.4%), Scottish (56 | 12.7%), Irish (52 | 11.8%), and Yugoslavian (46 | 10.4%), together accounting for 83.5% of all Coram residents.
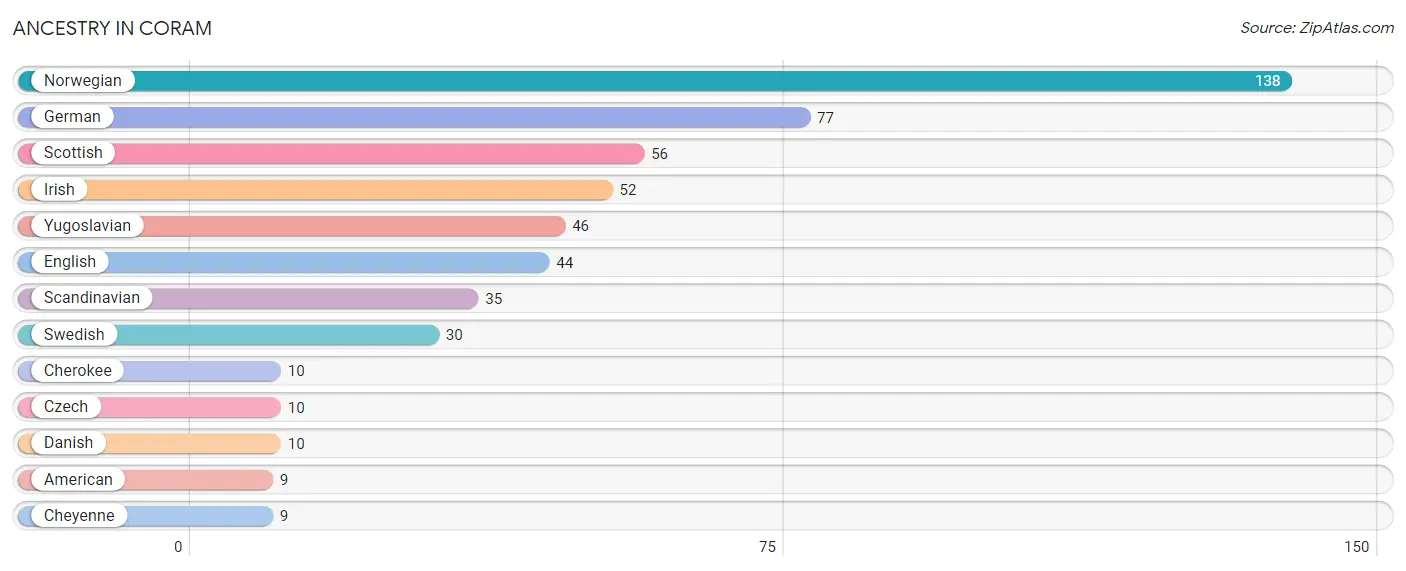
| Ancestry | # Population | % Population |
| American | 9 | 2.0% |
| Cherokee | 10 | 2.3% |
| Cheyenne | 9 | 2.0% |
| Czech | 10 | 2.3% |
| Danish | 10 | 2.3% |
| English | 44 | 10.0% |
| German | 77 | 17.4% |
| Irish | 52 | 11.8% |
| Norwegian | 138 | 31.2% |
| Scandinavian | 35 | 7.9% |
| Scottish | 56 | 12.7% |
| Swedish | 30 | 6.8% |
| Yugoslavian | 46 | 10.4% | View All 13 Rows |
Immigrants in Coram
The most numerous immigrant groups reported in Coram came from Denmark (10 | 2.3%), Europe (10 | 2.3%), and Northern Europe (10 | 2.3%), together accounting for 6.8% of all Coram residents.
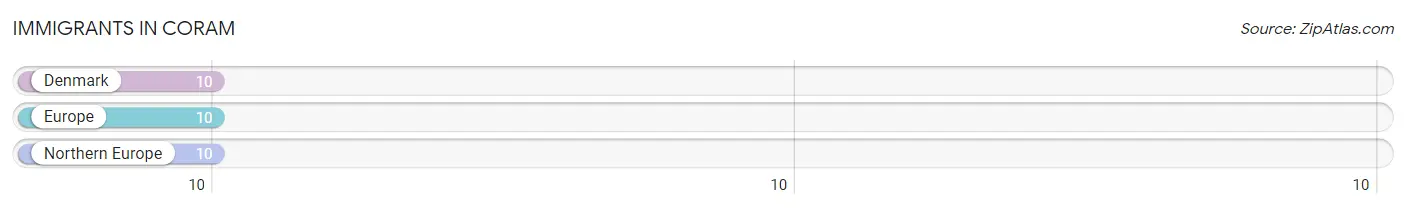
| Immigration Origin | # Population | % Population |
| Denmark | 10 | 2.3% |
| Europe | 10 | 2.3% |
| Northern Europe | 10 | 2.3% | View All 3 Rows |
Sex and Age in Coram
Sex and Age in Coram
The most populous age groups in Coram are 45 to 49 Years (54 | 21.0%) for men and 5 to 9 Years (36 | 19.5%) for women.
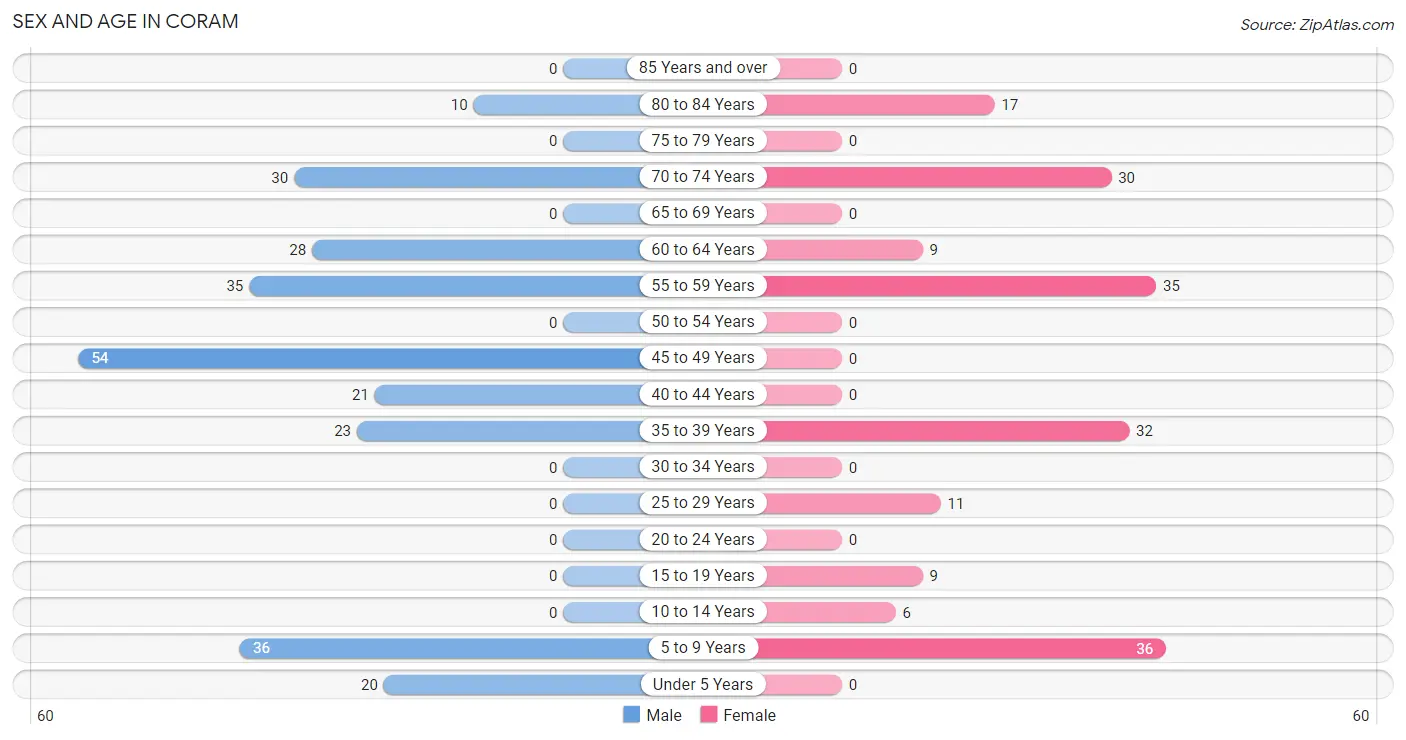
| Age Bracket | Male | Female |
| Under 5 Years | 20 (7.8%) | 0 (0.0%) |
| 5 to 9 Years | 36 (14.0%) | 36 (19.5%) |
| 10 to 14 Years | 0 (0.0%) | 6 (3.2%) |
| 15 to 19 Years | 0 (0.0%) | 9 (4.9%) |
| 20 to 24 Years | 0 (0.0%) | 0 (0.0%) |
| 25 to 29 Years | 0 (0.0%) | 11 (5.9%) |
| 30 to 34 Years | 0 (0.0%) | 0 (0.0%) |
| 35 to 39 Years | 23 (8.9%) | 32 (17.3%) |
| 40 to 44 Years | 21 (8.2%) | 0 (0.0%) |
| 45 to 49 Years | 54 (21.0%) | 0 (0.0%) |
| 50 to 54 Years | 0 (0.0%) | 0 (0.0%) |
| 55 to 59 Years | 35 (13.6%) | 35 (18.9%) |
| 60 to 64 Years | 28 (10.9%) | 9 (4.9%) |
| 65 to 69 Years | 0 (0.0%) | 0 (0.0%) |
| 70 to 74 Years | 30 (11.7%) | 30 (16.2%) |
| 75 to 79 Years | 0 (0.0%) | 0 (0.0%) |
| 80 to 84 Years | 10 (3.9%) | 17 (9.2%) |
| 85 Years and over | 0 (0.0%) | 0 (0.0%) |
| Total | 257 (100.0%) | 185 (100.0%) |
Families and Households in Coram
Median Family Size in Coram
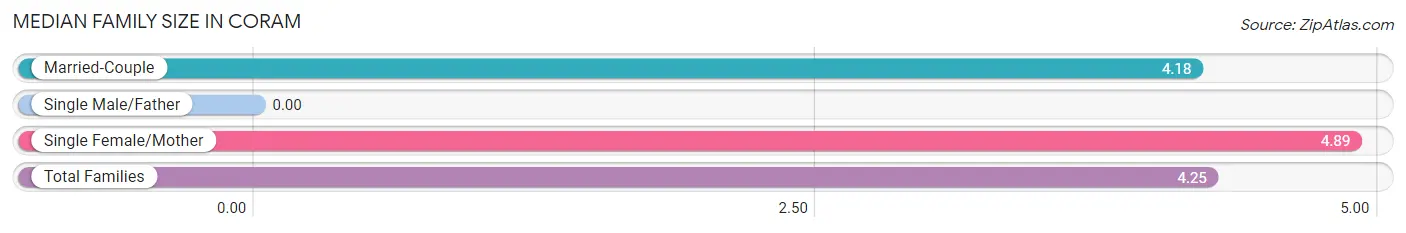
| Family Type | # Families | Family Size |
| Married-Couple | 82 (90.1%) | 4.18 |
| Single Male/Father | 0 (0.0%) | - |
| Single Female/Mother | 9 (9.9%) | 4.89 |
| Total Families | 91 (100.0%) | 4.25 |
Median Household Size in Coram
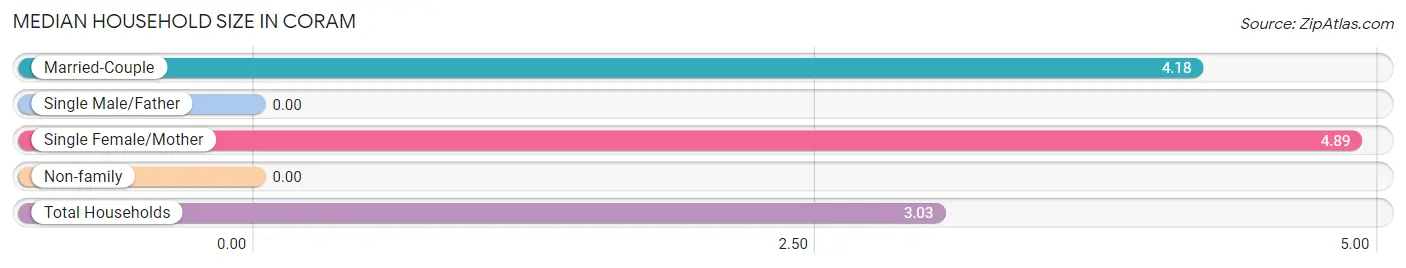
| Household Type | # Households | Household Size |
| Married-Couple | 82 (56.2%) | 4.18 |
| Single Male/Father | 0 (0.0%) | - |
| Single Female/Mother | 9 (6.2%) | 4.89 |
| Non-family | 55 (37.7%) | - |
| Total Households | 146 (100.0%) | 3.03 |
Household Size by Marriage Status in Coram
Out of a total of 146 households in Coram, 91 (62.3%) are family households, while 55 (37.7%) are nonfamily households. The most numerous type of family households are 3-person households, comprising 47, and the most common type of nonfamily households are 1-person households, comprising 55.
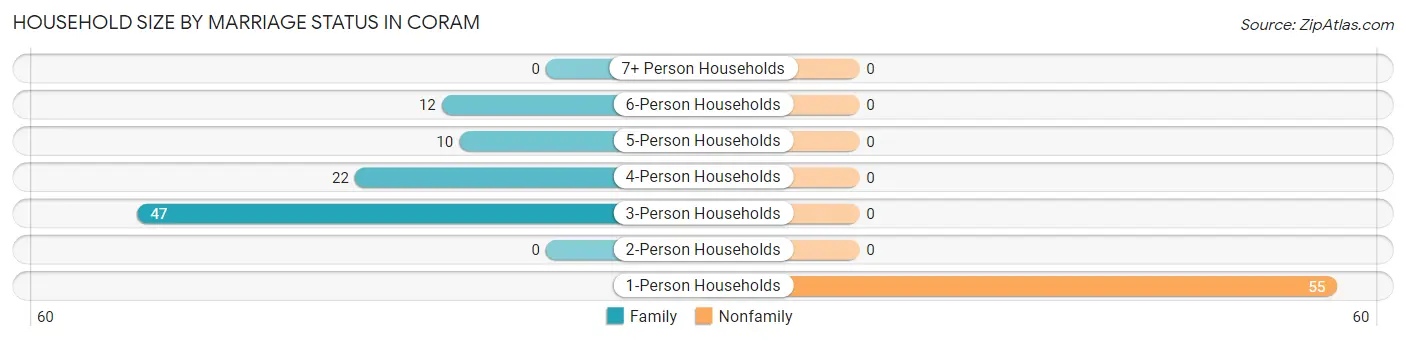
| Household Size | Family Households | Nonfamily Households |
| 1-Person Households | - | 55 (37.7%) |
| 2-Person Households | 0 (0.0%) | 0 (0.0%) |
| 3-Person Households | 47 (32.2%) | 0 (0.0%) |
| 4-Person Households | 22 (15.1%) | 0 (0.0%) |
| 5-Person Households | 10 (6.9%) | 0 (0.0%) |
| 6-Person Households | 12 (8.2%) | 0 (0.0%) |
| 7+ Person Households | 0 (0.0%) | 0 (0.0%) |
| Total | 91 (62.3%) | 55 (37.7%) |
Female Fertility in Coram
Fertility by Age in Coram
| Age Bracket | Women with Births | Births / 1,000 Women |
| 15 to 19 years | 0 (0.0%) | 0.0 |
| 20 to 34 years | 0 (0.0%) | 0.0 |
| 35 to 50 years | 0 (0.0%) | 0.0 |
| Total | 0 (0.0%) | 0.0 |
Fertility by Age by Marriage Status in Coram
| Age Bracket | Married | Unmarried |
| 15 to 19 years | 0 (0.0%) | 0 (0.0%) |
| 20 to 34 years | 0 (0.0%) | 0 (0.0%) |
| 35 to 50 years | 0 (0.0%) | 0 (0.0%) |
| Total | 0 (0.0%) | 0 (0.0%) |
Fertility by Education in Coram
| Educational Attainment | Women with Births | Births / 1,000 Women |
| Less than High School | 0 (0.0%) | 0.0 |
| High School Diploma | 0 (0.0%) | 0.0 |
| College or Associate's Degree | 0 (0.0%) | 0.0 |
| Bachelor's Degree | 0 (0.0%) | 0.0 |
| Graduate Degree | 0 (0.0%) | 0.0 |
| Total | 0 (0.0%) | 0.0 |
Fertility by Education by Marriage Status in Coram
| Educational Attainment | Married | Unmarried |
| Less than High School | 0 (0.0%) | 0 (0.0%) |
| High School Diploma | 0 (0.0%) | 0 (0.0%) |
| College or Associate's Degree | 0 (0.0%) | 0 (0.0%) |
| Bachelor's Degree | 0 (0.0%) | 0 (0.0%) |
| Graduate Degree | 0 (0.0%) | 0 (0.0%) |
| Total | 0 (0.0%) | 0 (0.0%) |
Employment Characteristics in Coram
Employment by Class of Employer in Coram
Among the 102 employed individuals in Coram, private company employees (37 | 36.3%), not-for-profit organizations (23 | 22.6%), and local government employees (11 | 10.8%) make up the most common classes of employment.
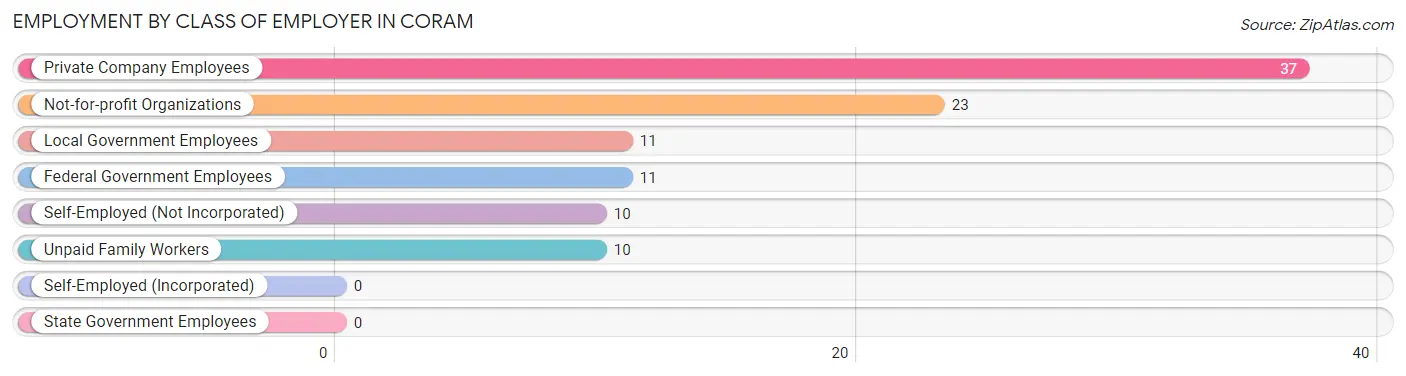
| Employer Class | # Employees | % Employees |
| Private Company Employees | 37 | 36.3% |
| Self-Employed (Incorporated) | 0 | 0.0% |
| Self-Employed (Not Incorporated) | 10 | 9.8% |
| Not-for-profit Organizations | 23 | 22.6% |
| Local Government Employees | 11 | 10.8% |
| State Government Employees | 0 | 0.0% |
| Federal Government Employees | 11 | 10.8% |
| Unpaid Family Workers | 10 | 9.8% |
| Total | 102 | 100.0% |
Employment Status by Age in Coram
According to the labor force statistics for Coram, out of the total population over 16 years of age (335), 33.7% or 113 individuals are in the labor force, with 9.7% or 11 of them unemployed. The age group with the highest labor force participation rate is 35 to 44 years, with 100.0% or 76 individuals in the labor force. Within the labor force, the 35 to 44 years age range has the highest percentage of unemployed individuals, with 14.5% or 11 of them being unemployed.
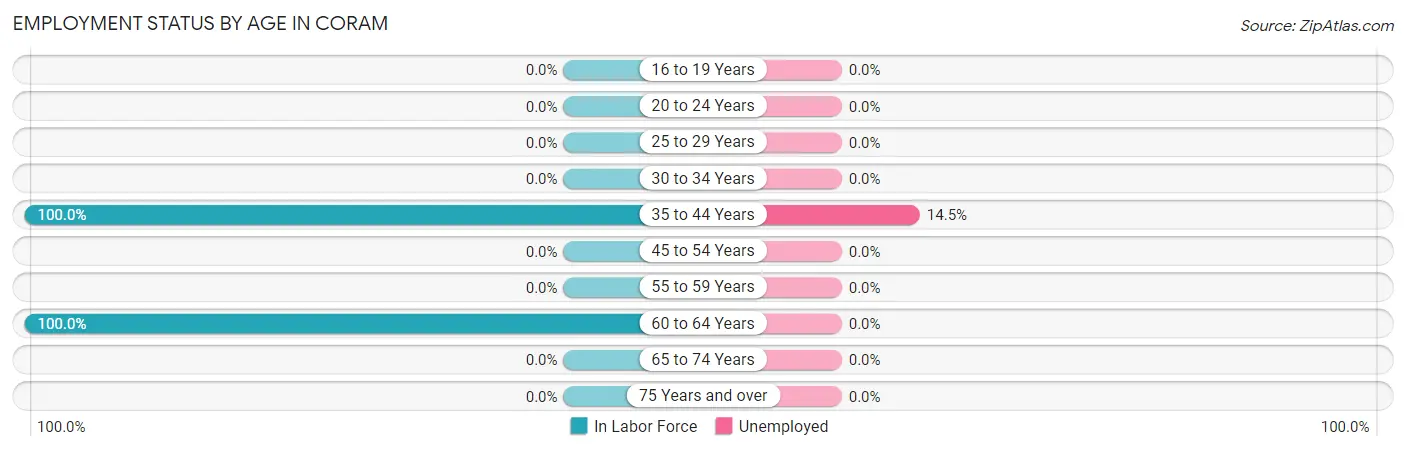
| Age Bracket | In Labor Force | Unemployed |
| 16 to 19 Years | 0 (0.0%) | 0 (0.0%) |
| 20 to 24 Years | 0 (0.0%) | 0 (0.0%) |
| 25 to 29 Years | 0 (0.0%) | 0 (0.0%) |
| 30 to 34 Years | 0 (0.0%) | 0 (0.0%) |
| 35 to 44 Years | 76 (100.0%) | 11 (14.5%) |
| 45 to 54 Years | 0 (0.0%) | 0 (0.0%) |
| 55 to 59 Years | 0 (0.0%) | 0 (0.0%) |
| 60 to 64 Years | 37 (100.0%) | 0 (0.0%) |
| 65 to 74 Years | 0 (0.0%) | 0 (0.0%) |
| 75 Years and over | 0 (0.0%) | 0 (0.0%) |
| Total | 113 (33.7%) | 11 (9.7%) |
Employment Status by Educational Attainment in Coram
According to labor force statistics for Coram, 45.6% of individuals (113) out of the total population between 25 and 64 years of age (248) are in the labor force, with 9.7% or 11 of them being unemployed. The group with the highest labor force participation rate are those with the educational attainment of bachelor's degree or higher, with 100.0% or 70 individuals in the labor force. Within the labor force, individuals with bachelor's degree or higher education have the highest percentage of unemployment, with 15.7% or 11 of them being unemployed.
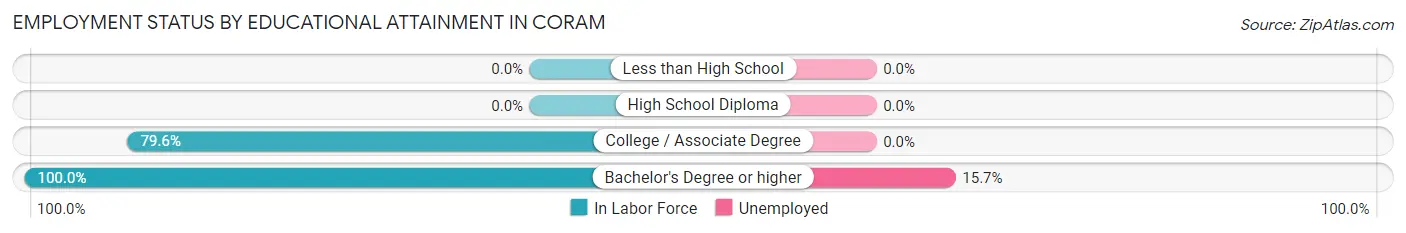
| Educational Attainment | In Labor Force | Unemployed |
| Less than High School | 0 (0.0%) | 0 (0.0%) |
| High School Diploma | 0 (0.0%) | 0 (0.0%) |
| College / Associate Degree | 43 (79.6%) | 0 (0.0%) |
| Bachelor's Degree or higher | 70 (100.0%) | 11 (15.7%) |
| Total | 113 (45.6%) | 24 (9.7%) |
Employment Occupations by Sex in Coram
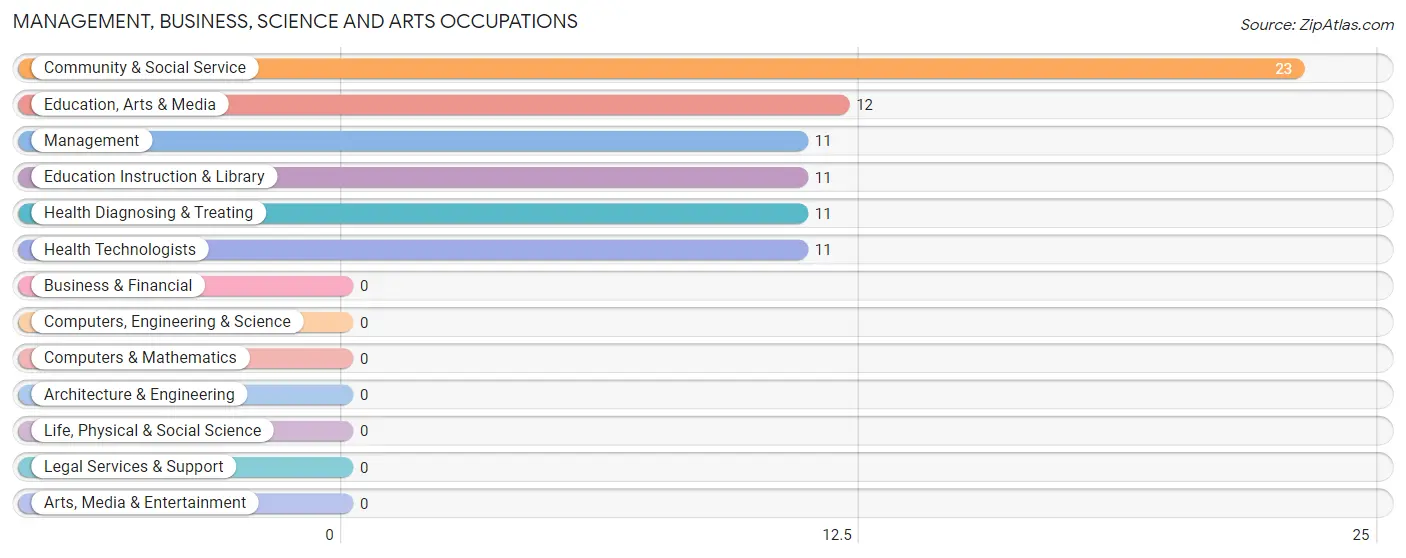
Management, Business, Science and Arts Occupations
The most common Management, Business, Science and Arts occupations in Coram are Community & Social Service (23 | 22.6%), Education, Arts & Media (12 | 11.8%), Management (11 | 10.8%), Education Instruction & Library (11 | 10.8%), and Health Diagnosing & Treating (11 | 10.8%).
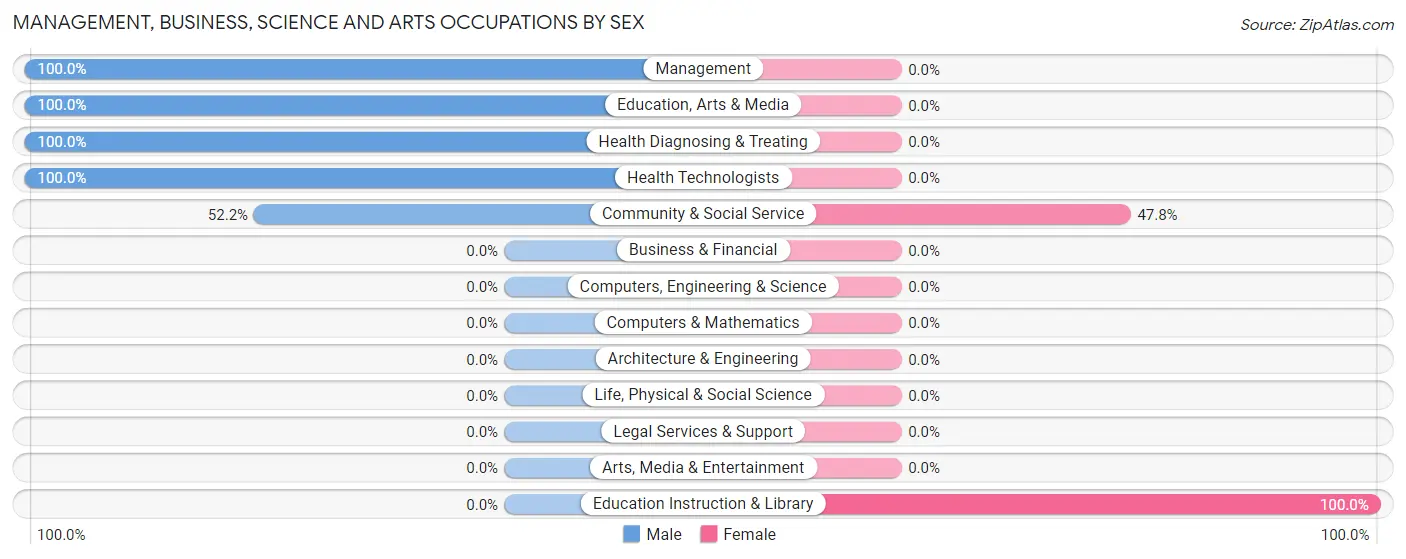
Management, Business, Science and Arts Occupations by Sex
Within the Management, Business, Science and Arts occupations in Coram, the most male-oriented occupations are Management (100.0%), Education, Arts & Media (100.0%), and Health Diagnosing & Treating (100.0%), while the most female-oriented occupations are Education Instruction & Library (100.0%), and Community & Social Service (47.8%).
| Occupation | Male | Female |
| Management | 11 (100.0%) | 0 (0.0%) |
| Business & Financial | 0 (0.0%) | 0 (0.0%) |
| Computers, Engineering & Science | 0 (0.0%) | 0 (0.0%) |
| Computers & Mathematics | 0 (0.0%) | 0 (0.0%) |
| Architecture & Engineering | 0 (0.0%) | 0 (0.0%) |
| Life, Physical & Social Science | 0 (0.0%) | 0 (0.0%) |
| Community & Social Service | 12 (52.2%) | 11 (47.8%) |
| Education, Arts & Media | 12 (100.0%) | 0 (0.0%) |
| Legal Services & Support | 0 (0.0%) | 0 (0.0%) |
| Education Instruction & Library | 0 (0.0%) | 11 (100.0%) |
| Arts, Media & Entertainment | 0 (0.0%) | 0 (0.0%) |
| Health Diagnosing & Treating | 11 (100.0%) | 0 (0.0%) |
| Health Technologists | 11 (100.0%) | 0 (0.0%) |
| Total (Category) | 34 (75.6%) | 11 (24.4%) |
| Total (Overall) | 72 (70.6%) | 30 (29.4%) |
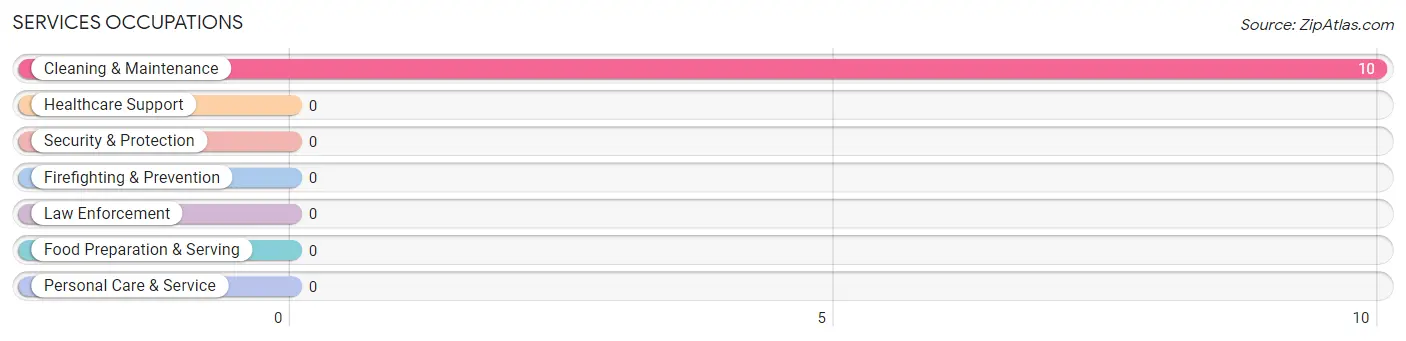
Services Occupations
The most common Services occupations in Coram are , and Cleaning & Maintenance (10 | 9.8%).
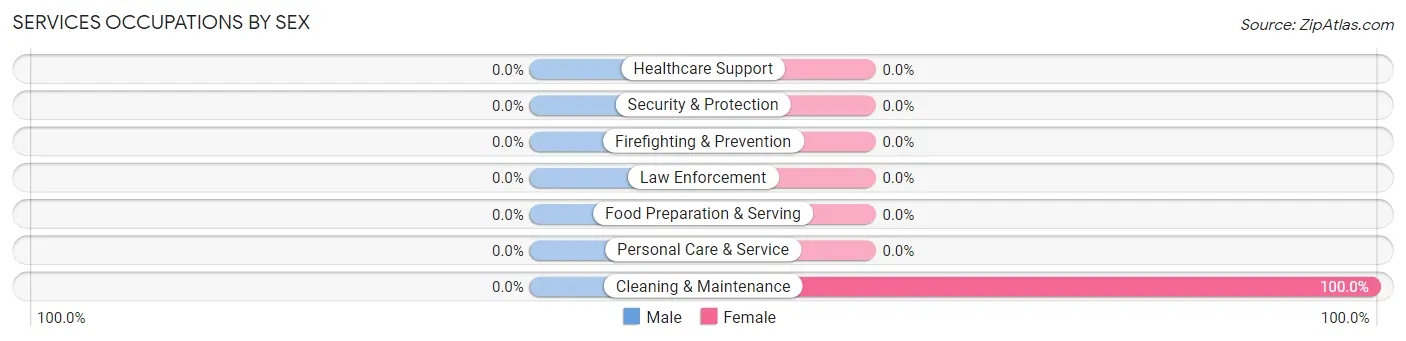
Services Occupations by Sex
| Occupation | Male | Female |
| Healthcare Support | 0 (0.0%) | 0 (0.0%) |
| Security & Protection | 0 (0.0%) | 0 (0.0%) |
| Firefighting & Prevention | 0 (0.0%) | 0 (0.0%) |
| Law Enforcement | 0 (0.0%) | 0 (0.0%) |
| Food Preparation & Serving | 0 (0.0%) | 0 (0.0%) |
| Cleaning & Maintenance | 0 (0.0%) | 10 (100.0%) |
| Personal Care & Service | 0 (0.0%) | 0 (0.0%) |
| Total (Category) | 0 (0.0%) | 10 (100.0%) |
| Total (Overall) | 72 (70.6%) | 30 (29.4%) |
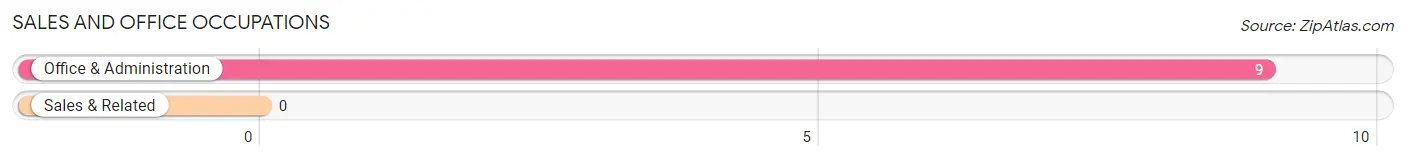
Sales and Office Occupations
The most common Sales and Office occupations in Coram are , and Office & Administration (9 | 8.8%).
Sales and Office Occupations by Sex
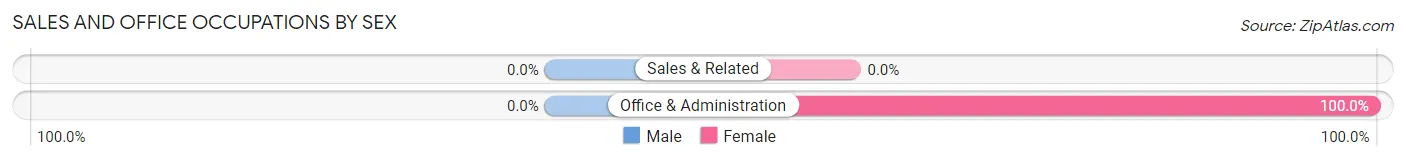
| Occupation | Male | Female |
| Sales & Related | 0 (0.0%) | 0 (0.0%) |
| Office & Administration | 0 (0.0%) | 9 (100.0%) |
| Total (Category) | 0 (0.0%) | 9 (100.0%) |
| Total (Overall) | 72 (70.6%) | 30 (29.4%) |
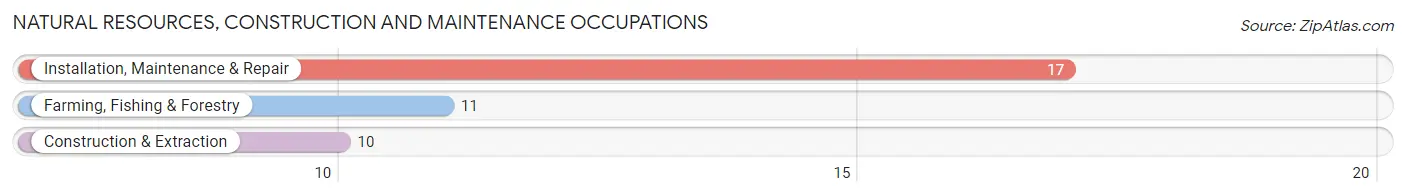
Natural Resources, Construction and Maintenance Occupations
The most common Natural Resources, Construction and Maintenance occupations in Coram are Installation, Maintenance & Repair (17 | 16.7%), Farming, Fishing & Forestry (11 | 10.8%), and Construction & Extraction (10 | 9.8%).
Natural Resources, Construction and Maintenance Occupations by Sex
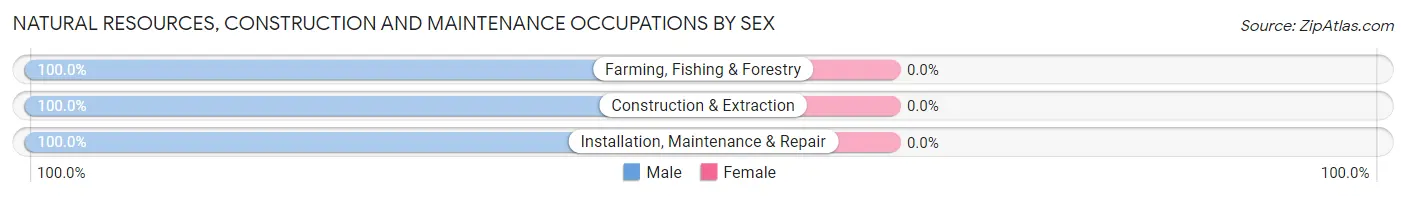
| Occupation | Male | Female |
| Farming, Fishing & Forestry | 11 (100.0%) | 0 (0.0%) |
| Construction & Extraction | 10 (100.0%) | 0 (0.0%) |
| Installation, Maintenance & Repair | 17 (100.0%) | 0 (0.0%) |
| Total (Category) | 38 (100.0%) | 0 (0.0%) |
| Total (Overall) | 72 (70.6%) | 30 (29.4%) |
Production, Transportation and Moving Occupations
Production, Transportation and Moving Occupations by Sex
| Occupation | Male | Female |
| Production | 0 (0.0%) | 0 (0.0%) |
| Transportation | 0 (0.0%) | 0 (0.0%) |
| Material Moving | 0 (0.0%) | 0 (0.0%) |
| Total (Category) | 0 (0.0%) | 0 (0.0%) |
| Total (Overall) | 72 (70.6%) | 30 (29.4%) |
Employment Industries by Sex in Coram
Employment Industries in Coram
The major employment industries in Coram include Construction (17 | 16.7%), Agriculture, Fishing & Hunting (11 | 10.8%), Educational Services (11 | 10.8%), Health Care & Social Assistance (11 | 10.8%), and Accommodation & Food Services (11 | 10.8%).
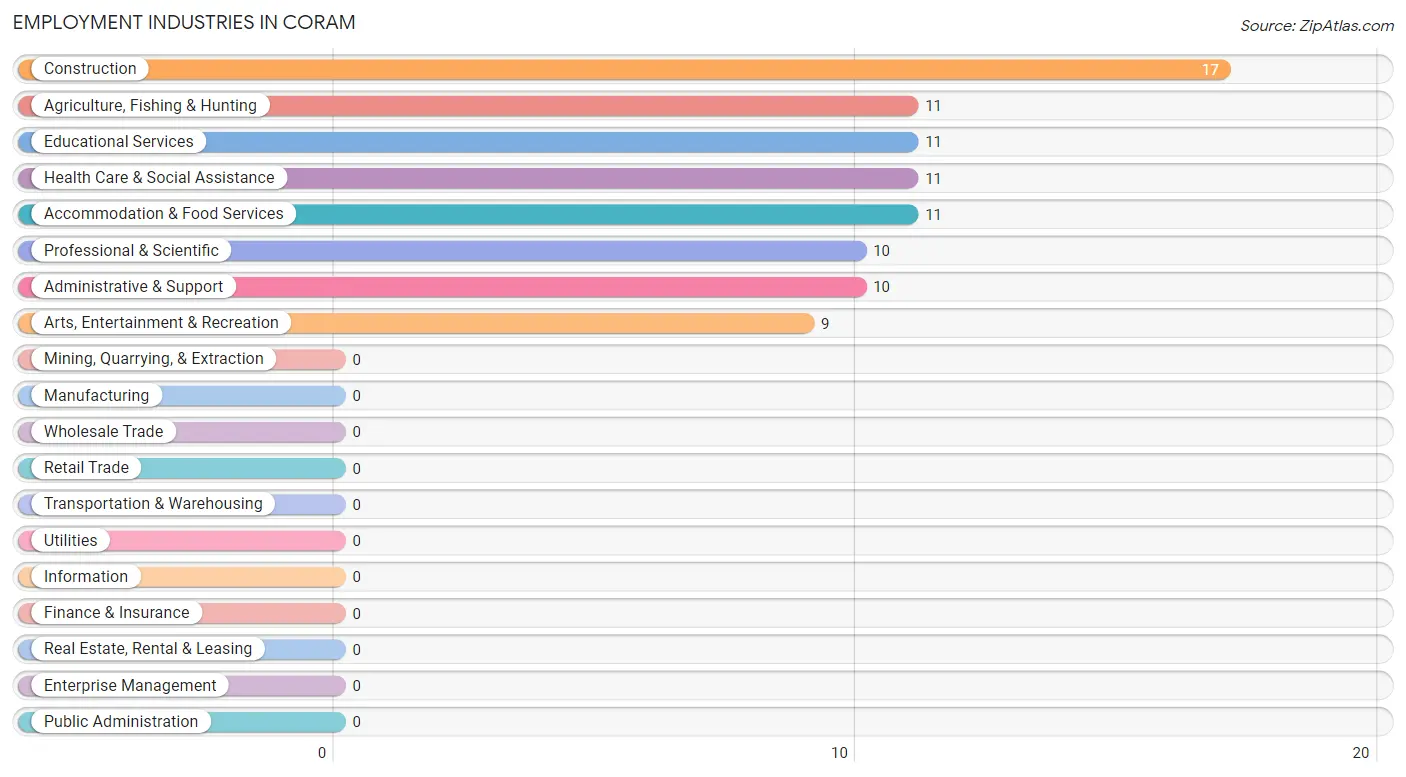
Employment Industries by Sex in Coram
The Coram industries that see more men than women are Agriculture, Fishing & Hunting (100.0%), Construction (100.0%), and Professional & Scientific (100.0%), whereas the industries that tend to have a higher number of women are Administrative & Support (100.0%), Educational Services (100.0%), and Arts, Entertainment & Recreation (100.0%).

| Industry | Male | Female |
| Agriculture, Fishing & Hunting | 11 (100.0%) | 0 (0.0%) |
| Mining, Quarrying, & Extraction | 0 (0.0%) | 0 (0.0%) |
| Construction | 17 (100.0%) | 0 (0.0%) |
| Manufacturing | 0 (0.0%) | 0 (0.0%) |
| Wholesale Trade | 0 (0.0%) | 0 (0.0%) |
| Retail Trade | 0 (0.0%) | 0 (0.0%) |
| Transportation & Warehousing | 0 (0.0%) | 0 (0.0%) |
| Utilities | 0 (0.0%) | 0 (0.0%) |
| Information | 0 (0.0%) | 0 (0.0%) |
| Finance & Insurance | 0 (0.0%) | 0 (0.0%) |
| Real Estate, Rental & Leasing | 0 (0.0%) | 0 (0.0%) |
| Professional & Scientific | 10 (100.0%) | 0 (0.0%) |
| Enterprise Management | 0 (0.0%) | 0 (0.0%) |
| Administrative & Support | 0 (0.0%) | 10 (100.0%) |
| Educational Services | 0 (0.0%) | 11 (100.0%) |
| Health Care & Social Assistance | 11 (100.0%) | 0 (0.0%) |
| Arts, Entertainment & Recreation | 0 (0.0%) | 9 (100.0%) |
| Accommodation & Food Services | 11 (100.0%) | 0 (0.0%) |
| Public Administration | 0 (0.0%) | 0 (0.0%) |
| Total | 72 (70.6%) | 30 (29.4%) |
Education in Coram
School Enrollment in Coram
The most common levels of schooling among the 74 students in Coram are elementary school (36 | 48.6%), middle school (15 | 20.3%), and kindergarten (12 | 16.2%).
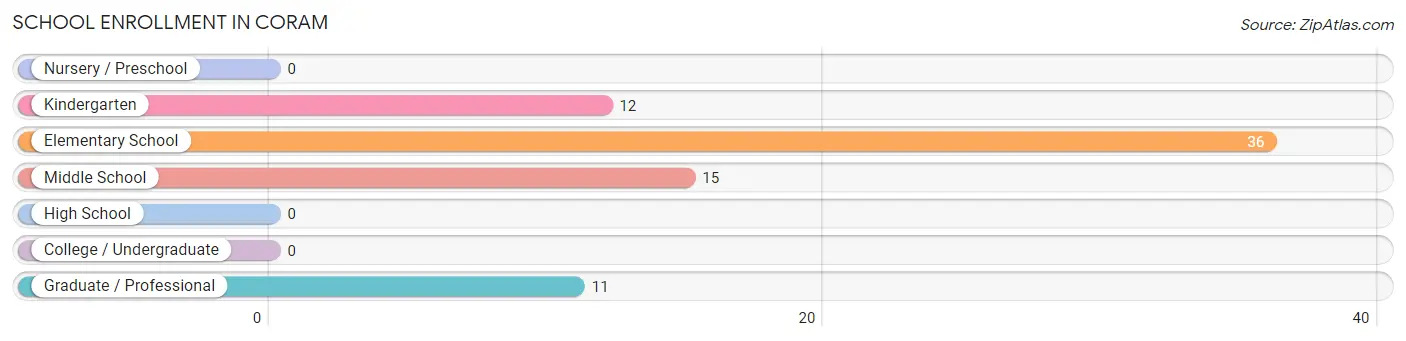
| School Level | # Students | % Students |
| Nursery / Preschool | 0 | 0.0% |
| Kindergarten | 12 | 16.2% |
| Elementary School | 36 | 48.6% |
| Middle School | 15 | 20.3% |
| High School | 0 | 0.0% |
| College / Undergraduate | 0 | 0.0% |
| Graduate / Professional | 11 | 14.9% |
| Total | 74 | 100.0% |
School Enrollment by Age by Funding Source in Coram
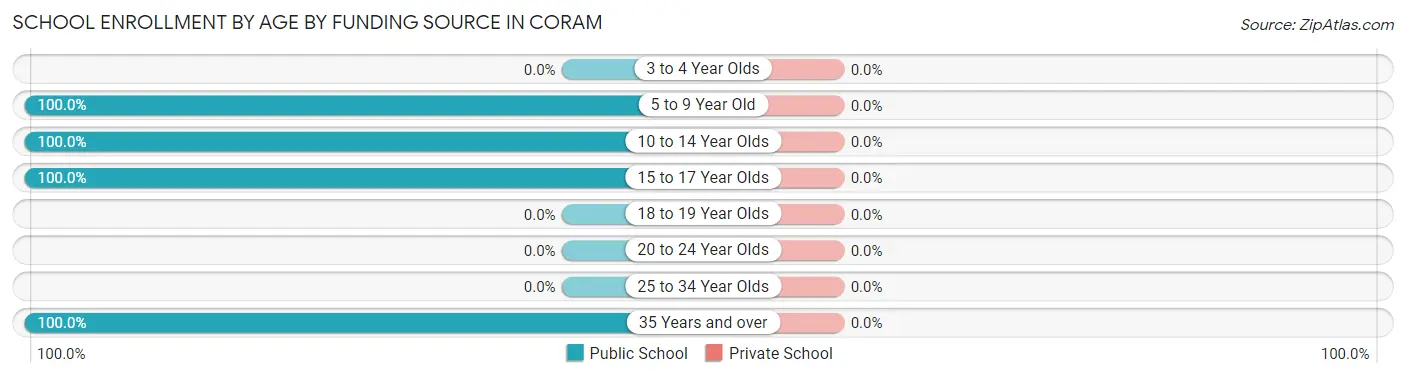
| Age Bracket | Public School | Private School |
| 3 to 4 Year Olds | 0 (0.0%) | 0 (0.0%) |
| 5 to 9 Year Old | 48 (100.0%) | 0 (0.0%) |
| 10 to 14 Year Olds | 6 (100.0%) | 0 (0.0%) |
| 15 to 17 Year Olds | 9 (100.0%) | 0 (0.0%) |
| 18 to 19 Year Olds | 0 (0.0%) | 0 (0.0%) |
| 20 to 24 Year Olds | 0 (0.0%) | 0 (0.0%) |
| 25 to 34 Year Olds | 0 (0.0%) | 0 (0.0%) |
| 35 Years and over | 11 (100.0%) | 0 (0.0%) |
| Total | 74 (100.0%) | 0 (0.0%) |
Educational Attainment by Field of Study in Coram
Bio, nature & agricultural (31 | 38.3%), engineering (17 | 21.0%), science & technology (11 | 13.6%), business (11 | 13.6%), and education (11 | 13.6%) are the most common fields of study among 81 individuals in Coram who have obtained a bachelor's degree or higher.
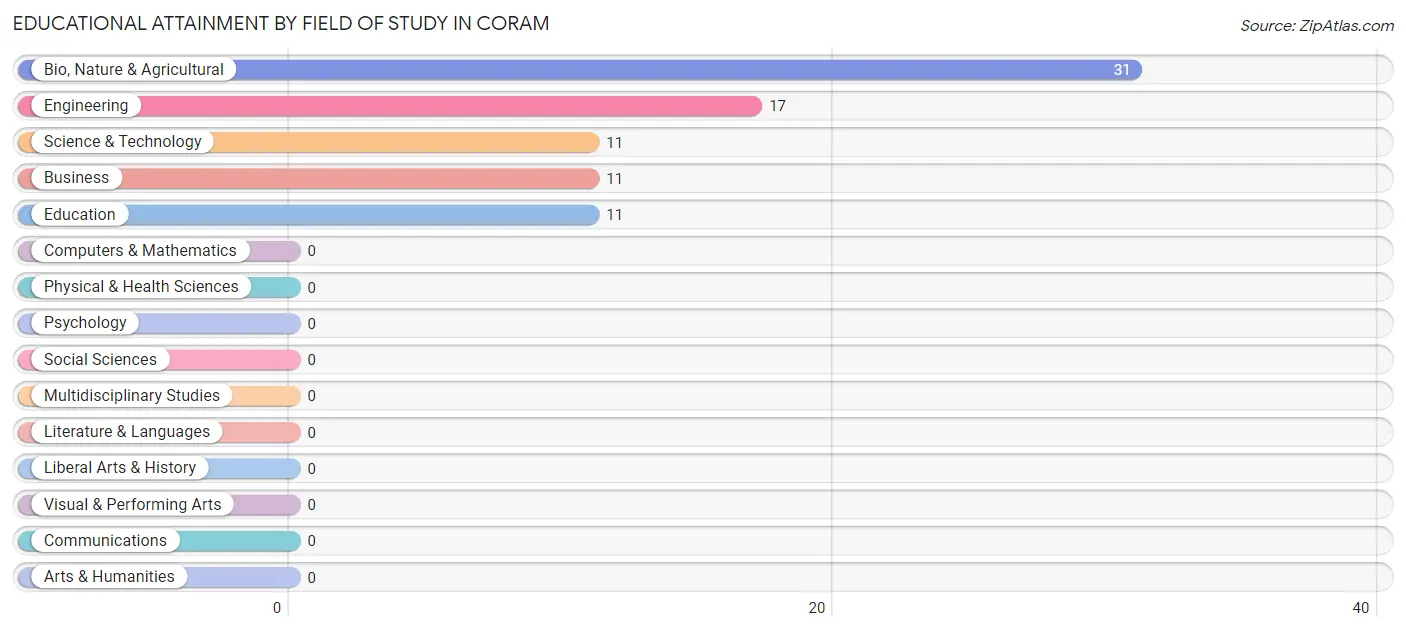
| Field of Study | # Graduates | % Graduates |
| Computers & Mathematics | 0 | 0.0% |
| Bio, Nature & Agricultural | 31 | 38.3% |
| Physical & Health Sciences | 0 | 0.0% |
| Psychology | 0 | 0.0% |
| Social Sciences | 0 | 0.0% |
| Engineering | 17 | 21.0% |
| Multidisciplinary Studies | 0 | 0.0% |
| Science & Technology | 11 | 13.6% |
| Business | 11 | 13.6% |
| Education | 11 | 13.6% |
| Literature & Languages | 0 | 0.0% |
| Liberal Arts & History | 0 | 0.0% |
| Visual & Performing Arts | 0 | 0.0% |
| Communications | 0 | 0.0% |
| Arts & Humanities | 0 | 0.0% |
| Total | 81 | 100.0% |
Transportation & Commute in Coram
Vehicle Availability by Sex in Coram
The most prevalent vehicle ownership categories in Coram are males with 2 vehicles (51, accounting for 70.8%) and females with 2 vehicles (0, making up 170.0%).
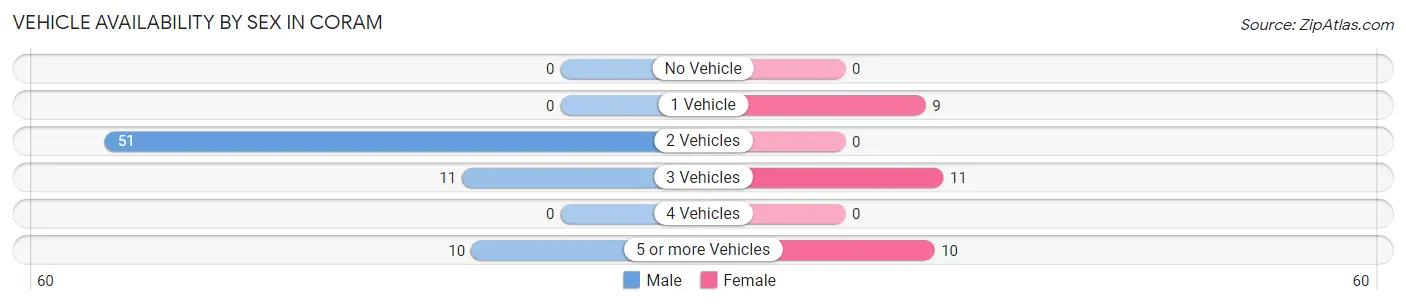
| Vehicles Available | Male | Female |
| No Vehicle | 0 (0.0%) | 0 (0.0%) |
| 1 Vehicle | 0 (0.0%) | 9 (30.0%) |
| 2 Vehicles | 51 (70.8%) | 0 (0.0%) |
| 3 Vehicles | 11 (15.3%) | 11 (36.7%) |
| 4 Vehicles | 0 (0.0%) | 0 (0.0%) |
| 5 or more Vehicles | 10 (13.9%) | 10 (33.3%) |
| Total | 72 (100.0%) | 30 (100.0%) |
Commute Time in Coram
The most frequently occuring commute durations in Coram are less than 5 minutes (29 commuters, 35.4%), 25 to 29 minutes (22 commuters, 26.8%), and 5 to 9 minutes (11 commuters, 13.4%).
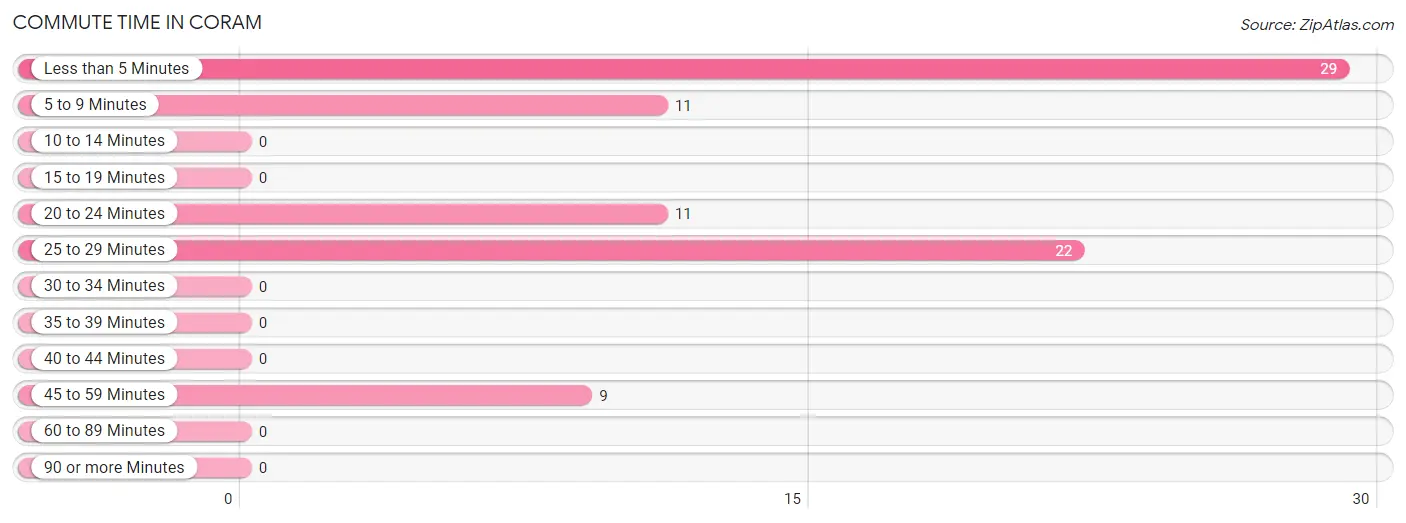
| Commute Time | # Commuters | % Commuters |
| Less than 5 Minutes | 29 | 35.4% |
| 5 to 9 Minutes | 11 | 13.4% |
| 10 to 14 Minutes | 0 | 0.0% |
| 15 to 19 Minutes | 0 | 0.0% |
| 20 to 24 Minutes | 11 | 13.4% |
| 25 to 29 Minutes | 22 | 26.8% |
| 30 to 34 Minutes | 0 | 0.0% |
| 35 to 39 Minutes | 0 | 0.0% |
| 40 to 44 Minutes | 0 | 0.0% |
| 45 to 59 Minutes | 9 | 11.0% |
| 60 to 89 Minutes | 0 | 0.0% |
| 90 or more Minutes | 0 | 0.0% |
Commute Time by Sex in Coram
The most common commute times in Coram are less than 5 minutes (29 commuters, 46.8%) for males and 20 to 24 minutes (11 commuters, 55.0%) for females.
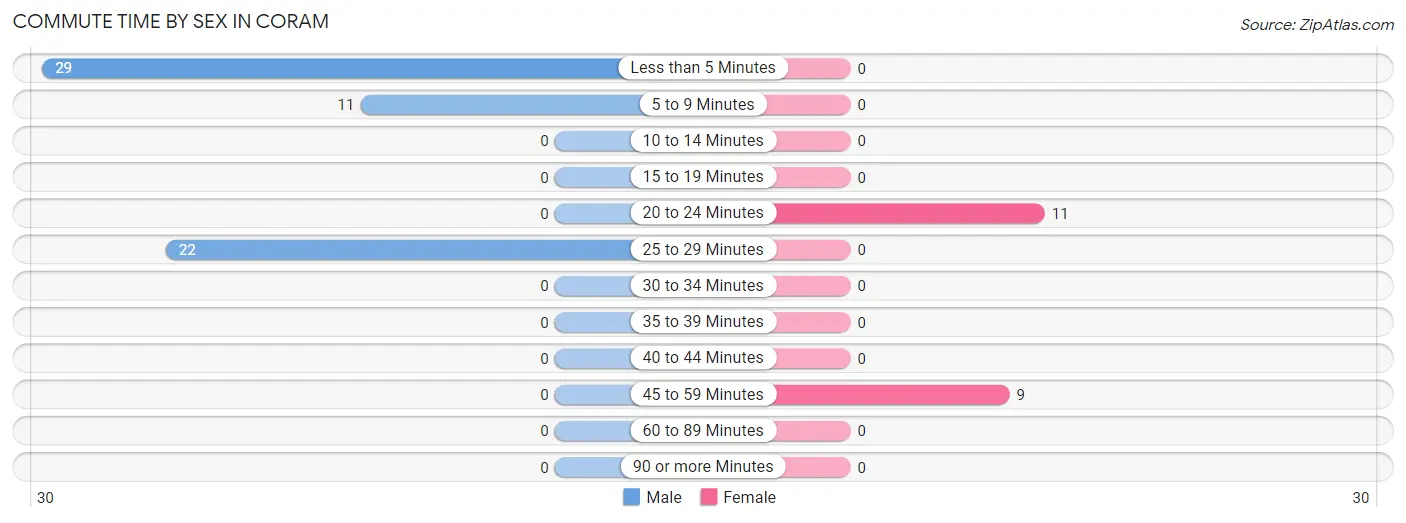
| Commute Time | Male | Female |
| Less than 5 Minutes | 29 (46.8%) | 0 (0.0%) |
| 5 to 9 Minutes | 11 (17.7%) | 0 (0.0%) |
| 10 to 14 Minutes | 0 (0.0%) | 0 (0.0%) |
| 15 to 19 Minutes | 0 (0.0%) | 0 (0.0%) |
| 20 to 24 Minutes | 0 (0.0%) | 11 (55.0%) |
| 25 to 29 Minutes | 22 (35.5%) | 0 (0.0%) |
| 30 to 34 Minutes | 0 (0.0%) | 0 (0.0%) |
| 35 to 39 Minutes | 0 (0.0%) | 0 (0.0%) |
| 40 to 44 Minutes | 0 (0.0%) | 0 (0.0%) |
| 45 to 59 Minutes | 0 (0.0%) | 9 (45.0%) |
| 60 to 89 Minutes | 0 (0.0%) | 0 (0.0%) |
| 90 or more Minutes | 0 (0.0%) | 0 (0.0%) |
Time of Departure to Work by Sex in Coram
The most frequent times of departure to work in Coram are 8:00 AM to 8:29 AM (17, 27.4%) for males and 7:30 AM to 7:59 AM (20, 100.0%) for females.
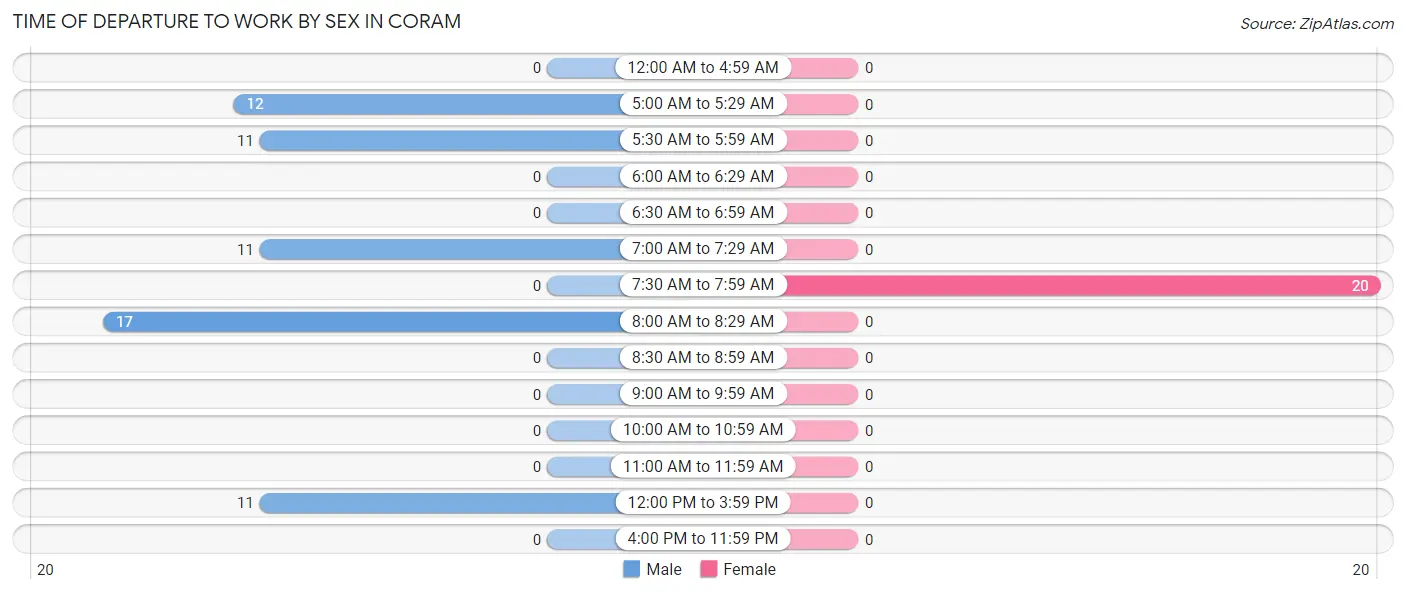
| Time of Departure | Male | Female |
| 12:00 AM to 4:59 AM | 0 (0.0%) | 0 (0.0%) |
| 5:00 AM to 5:29 AM | 12 (19.4%) | 0 (0.0%) |
| 5:30 AM to 5:59 AM | 11 (17.7%) | 0 (0.0%) |
| 6:00 AM to 6:29 AM | 0 (0.0%) | 0 (0.0%) |
| 6:30 AM to 6:59 AM | 0 (0.0%) | 0 (0.0%) |
| 7:00 AM to 7:29 AM | 11 (17.7%) | 0 (0.0%) |
| 7:30 AM to 7:59 AM | 0 (0.0%) | 20 (100.0%) |
| 8:00 AM to 8:29 AM | 17 (27.4%) | 0 (0.0%) |
| 8:30 AM to 8:59 AM | 0 (0.0%) | 0 (0.0%) |
| 9:00 AM to 9:59 AM | 0 (0.0%) | 0 (0.0%) |
| 10:00 AM to 10:59 AM | 0 (0.0%) | 0 (0.0%) |
| 11:00 AM to 11:59 AM | 0 (0.0%) | 0 (0.0%) |
| 12:00 PM to 3:59 PM | 11 (17.7%) | 0 (0.0%) |
| 4:00 PM to 11:59 PM | 0 (0.0%) | 0 (0.0%) |
| Total | 62 (100.0%) | 20 (100.0%) |
Housing Occupancy in Coram
Occupancy by Ownership in Coram
Of the total 146 dwellings in Coram, owner-occupied units account for 134 (91.8%), while renter-occupied units make up 12 (8.2%).
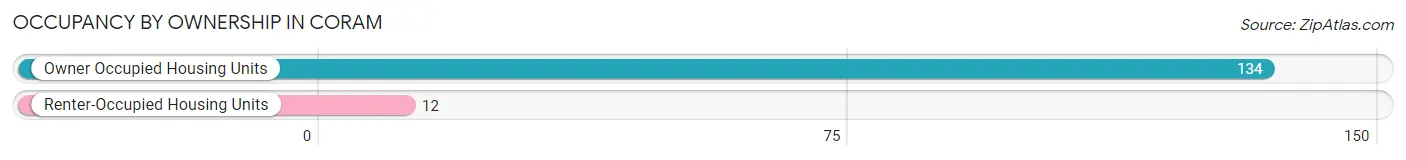
| Occupancy | # Housing Units | % Housing Units |
| Owner Occupied Housing Units | 134 | 91.8% |
| Renter-Occupied Housing Units | 12 | 8.2% |
| Total Occupied Housing Units | 146 | 100.0% |
Occupancy by Household Size in Coram
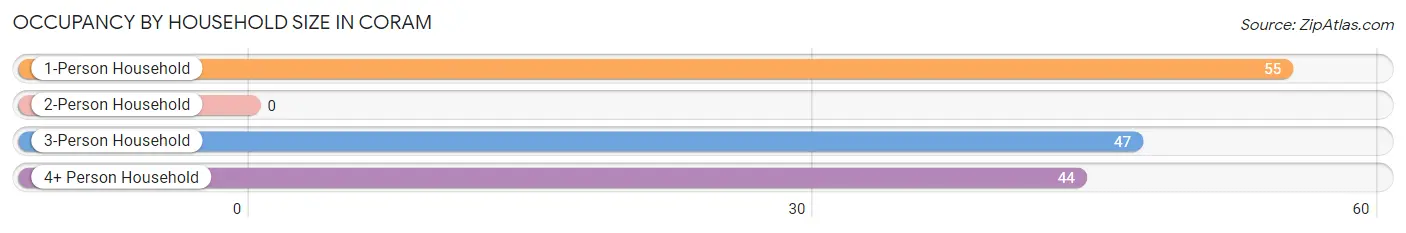
| Household Size | # Housing Units | % Housing Units |
| 1-Person Household | 55 | 37.7% |
| 2-Person Household | 0 | 0.0% |
| 3-Person Household | 47 | 32.2% |
| 4+ Person Household | 44 | 30.1% |
| Total Housing Units | 146 | 100.0% |
Occupancy by Ownership by Household Size in Coram
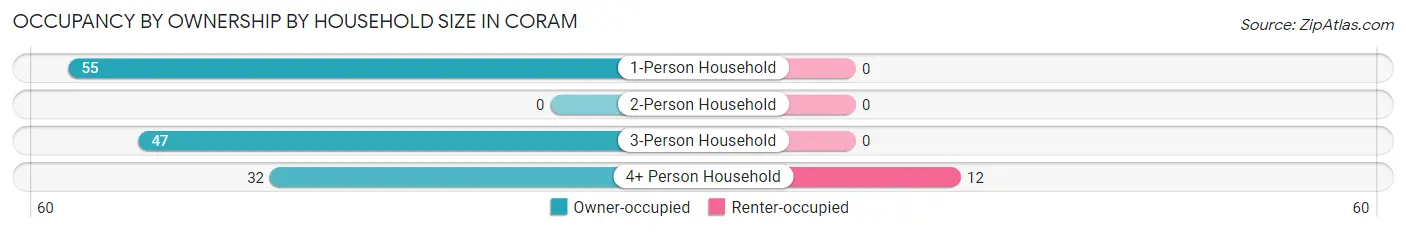
| Household Size | Owner-occupied | Renter-occupied |
| 1-Person Household | 55 (100.0%) | 0 (0.0%) |
| 2-Person Household | 0 (0.0%) | 0 (0.0%) |
| 3-Person Household | 47 (100.0%) | 0 (0.0%) |
| 4+ Person Household | 32 (72.7%) | 12 (27.3%) |
| Total Housing Units | 134 (91.8%) | 12 (8.2%) |
Occupancy by Educational Attainment in Coram
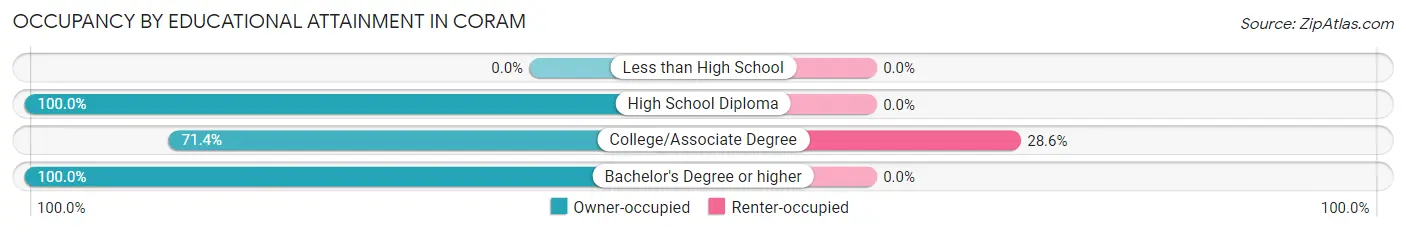
| Household Size | Owner-occupied | Renter-occupied |
| Less than High School | 0 (0.0%) | 0 (0.0%) |
| High School Diploma | 73 (100.0%) | 0 (0.0%) |
| College/Associate Degree | 30 (71.4%) | 12 (28.6%) |
| Bachelor's Degree or higher | 31 (100.0%) | 0 (0.0%) |
Occupancy by Age of Householder in Coram
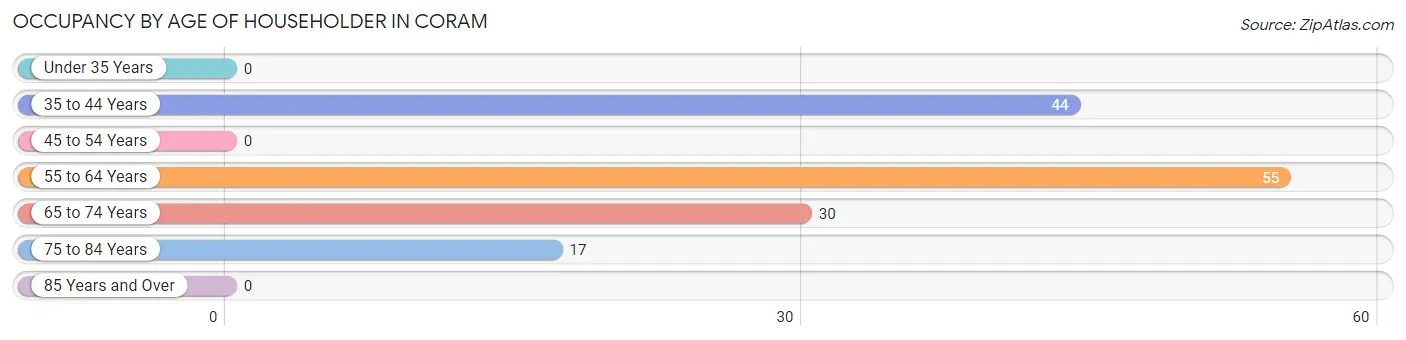
| Age Bracket | # Households | % Households |
| Under 35 Years | 0 | 0.0% |
| 35 to 44 Years | 44 | 30.1% |
| 45 to 54 Years | 0 | 0.0% |
| 55 to 64 Years | 55 | 37.7% |
| 65 to 74 Years | 30 | 20.5% |
| 75 to 84 Years | 17 | 11.6% |
| 85 Years and Over | 0 | 0.0% |
| Total | 146 | 100.0% |
Housing Finances in Coram
Median Income by Occupancy in Coram
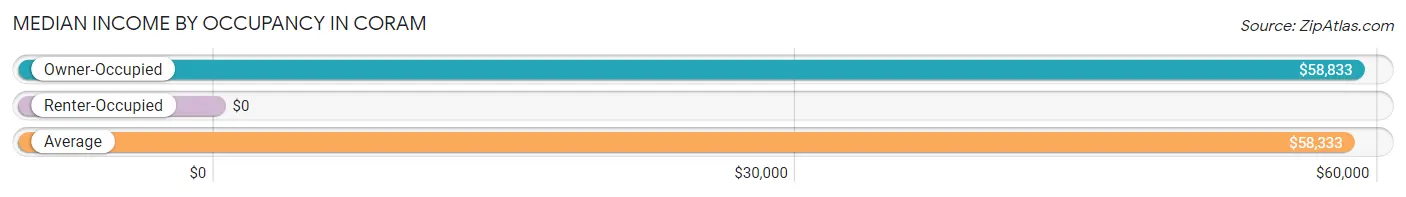
| Occupancy Type | # Households | Median Income |
| Owner-Occupied | 134 (91.8%) | $58,833 |
| Renter-Occupied | 12 (8.2%) | $0 |
| Average | 146 (100.0%) | $58,333 |
Occupancy by Householder Income Bracket in Coram
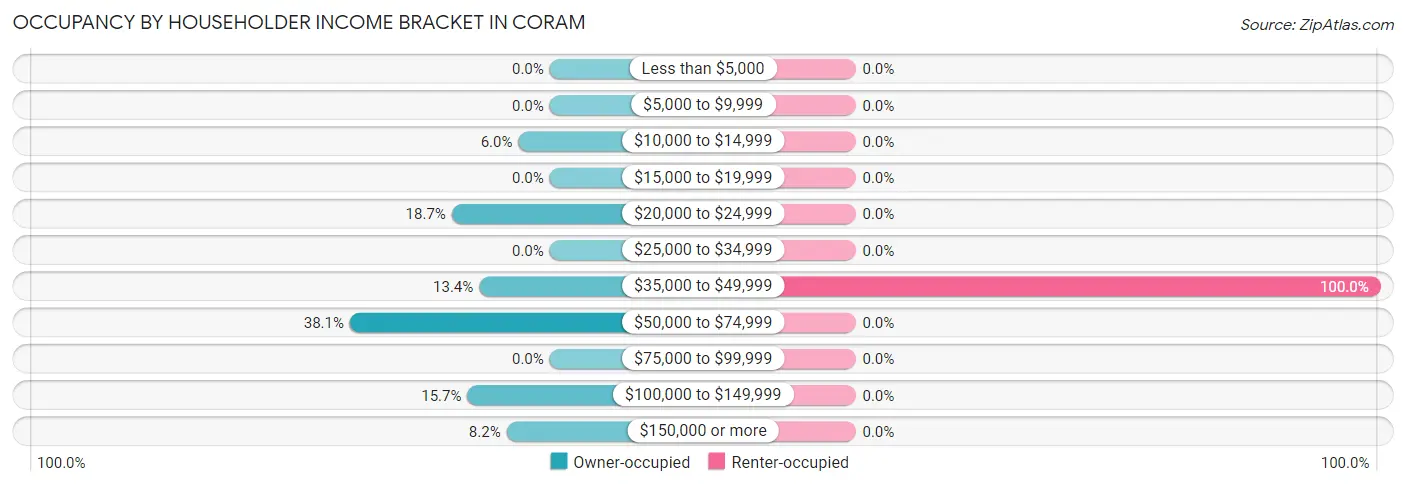
| Income Bracket | Owner-occupied | Renter-occupied |
| Less than $5,000 | 0 (0.0%) | 0 (0.0%) |
| $5,000 to $9,999 | 0 (0.0%) | 0 (0.0%) |
| $10,000 to $14,999 | 8 (6.0%) | 0 (0.0%) |
| $15,000 to $19,999 | 0 (0.0%) | 0 (0.0%) |
| $20,000 to $24,999 | 25 (18.7%) | 0 (0.0%) |
| $25,000 to $34,999 | 0 (0.0%) | 0 (0.0%) |
| $35,000 to $49,999 | 18 (13.4%) | 12 (100.0%) |
| $50,000 to $74,999 | 51 (38.1%) | 0 (0.0%) |
| $75,000 to $99,999 | 0 (0.0%) | 0 (0.0%) |
| $100,000 to $149,999 | 21 (15.7%) | 0 (0.0%) |
| $150,000 or more | 11 (8.2%) | 0 (0.0%) |
| Total | 134 (100.0%) | 12 (100.0%) |
Monthly Housing Cost Tiers in Coram
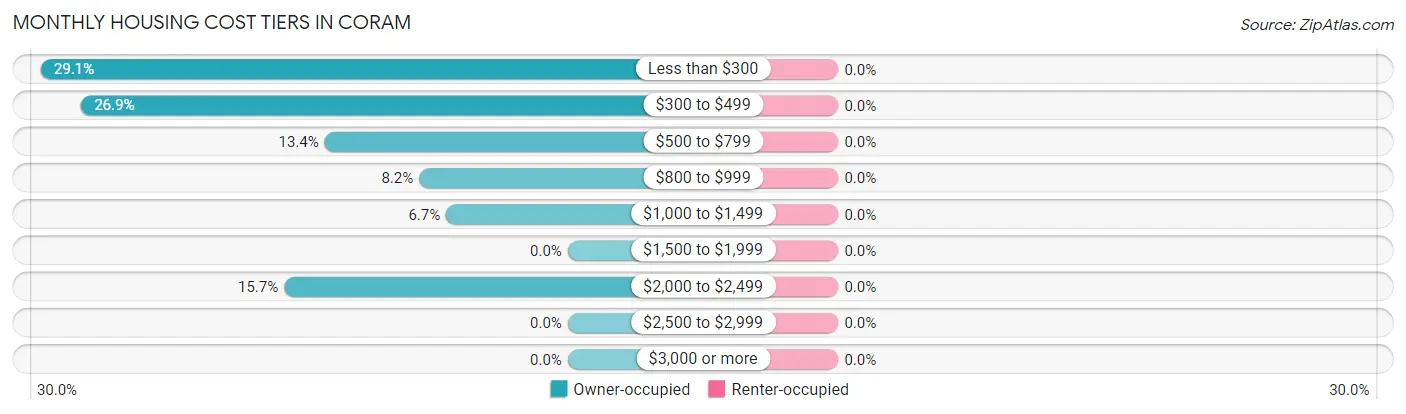
| Monthly Cost | Owner-occupied | Renter-occupied |
| Less than $300 | 39 (29.1%) | 0 (0.0%) |
| $300 to $499 | 36 (26.9%) | 0 (0.0%) |
| $500 to $799 | 18 (13.4%) | 0 (0.0%) |
| $800 to $999 | 11 (8.2%) | 0 (0.0%) |
| $1,000 to $1,499 | 9 (6.7%) | 0 (0.0%) |
| $1,500 to $1,999 | 0 (0.0%) | 0 (0.0%) |
| $2,000 to $2,499 | 21 (15.7%) | 0 (0.0%) |
| $2,500 to $2,999 | 0 (0.0%) | 0 (0.0%) |
| $3,000 or more | 0 (0.0%) | 0 (0.0%) |
| Total | 134 (100.0%) | 12 (100.0%) |
Physical Housing Characteristics in Coram
Housing Structures in Coram
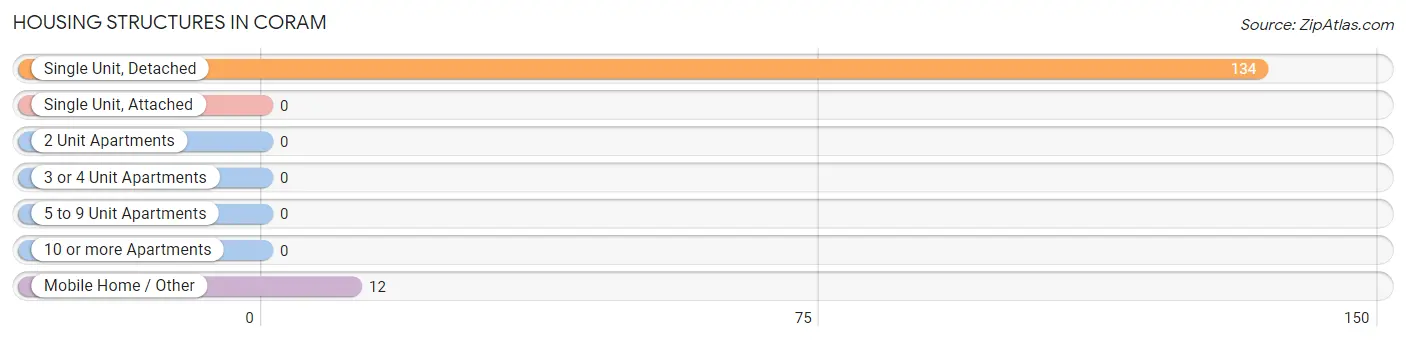
| Structure Type | # Housing Units | % Housing Units |
| Single Unit, Detached | 134 | 91.8% |
| Single Unit, Attached | 0 | 0.0% |
| 2 Unit Apartments | 0 | 0.0% |
| 3 or 4 Unit Apartments | 0 | 0.0% |
| 5 to 9 Unit Apartments | 0 | 0.0% |
| 10 or more Apartments | 0 | 0.0% |
| Mobile Home / Other | 12 | 8.2% |
| Total | 146 | 100.0% |
Housing Structures by Occupancy in Coram
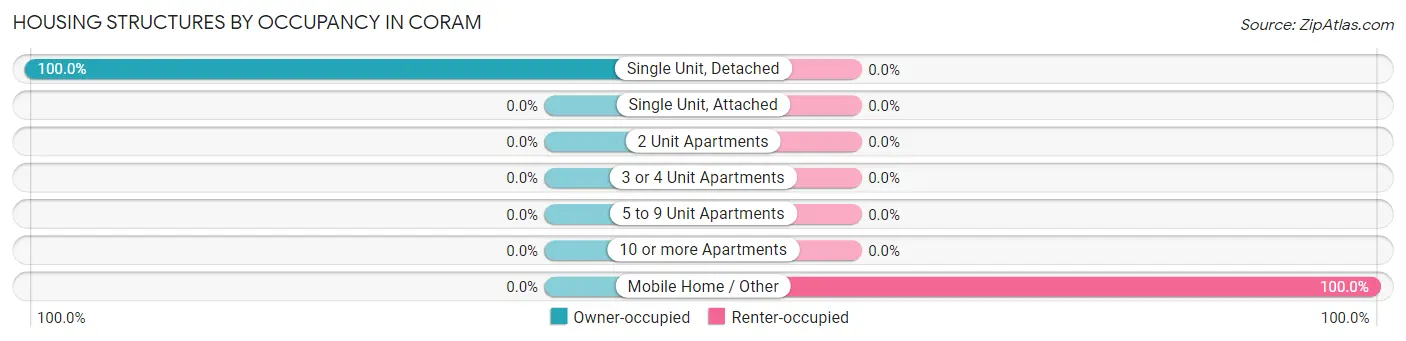
| Structure Type | Owner-occupied | Renter-occupied |
| Single Unit, Detached | 134 (100.0%) | 0 (0.0%) |
| Single Unit, Attached | 0 (0.0%) | 0 (0.0%) |
| 2 Unit Apartments | 0 (0.0%) | 0 (0.0%) |
| 3 or 4 Unit Apartments | 0 (0.0%) | 0 (0.0%) |
| 5 to 9 Unit Apartments | 0 (0.0%) | 0 (0.0%) |
| 10 or more Apartments | 0 (0.0%) | 0 (0.0%) |
| Mobile Home / Other | 0 (0.0%) | 12 (100.0%) |
| Total | 134 (91.8%) | 12 (8.2%) |
Housing Structures by Number of Rooms in Coram
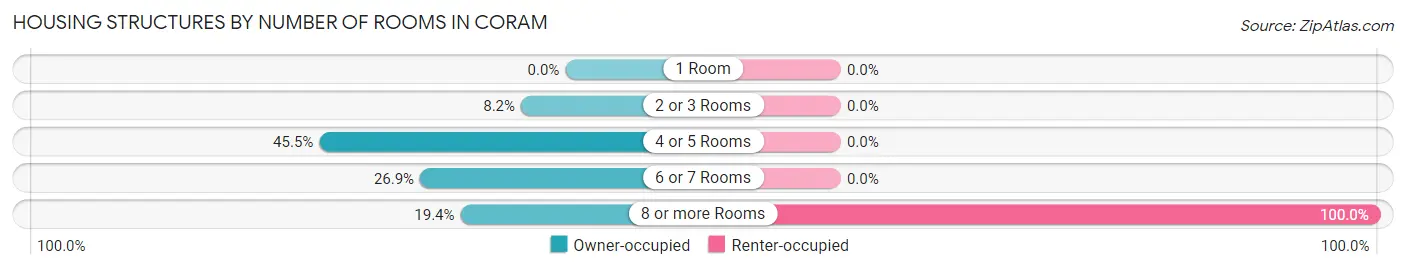
| Number of Rooms | Owner-occupied | Renter-occupied |
| 1 Room | 0 (0.0%) | 0 (0.0%) |
| 2 or 3 Rooms | 11 (8.2%) | 0 (0.0%) |
| 4 or 5 Rooms | 61 (45.5%) | 0 (0.0%) |
| 6 or 7 Rooms | 36 (26.9%) | 0 (0.0%) |
| 8 or more Rooms | 26 (19.4%) | 12 (100.0%) |
| Total | 134 (100.0%) | 12 (100.0%) |
Housing Structure by Heating Type in Coram
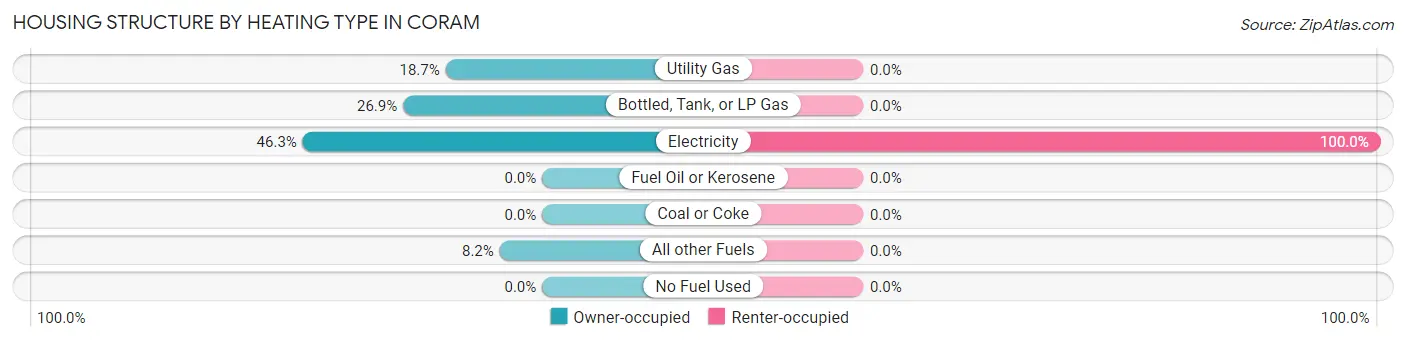
| Heating Type | Owner-occupied | Renter-occupied |
| Utility Gas | 25 (18.7%) | 0 (0.0%) |
| Bottled, Tank, or LP Gas | 36 (26.9%) | 0 (0.0%) |
| Electricity | 62 (46.3%) | 12 (100.0%) |
| Fuel Oil or Kerosene | 0 (0.0%) | 0 (0.0%) |
| Coal or Coke | 0 (0.0%) | 0 (0.0%) |
| All other Fuels | 11 (8.2%) | 0 (0.0%) |
| No Fuel Used | 0 (0.0%) | 0 (0.0%) |
| Total | 134 (100.0%) | 12 (100.0%) |
Household Vehicle Usage in Coram
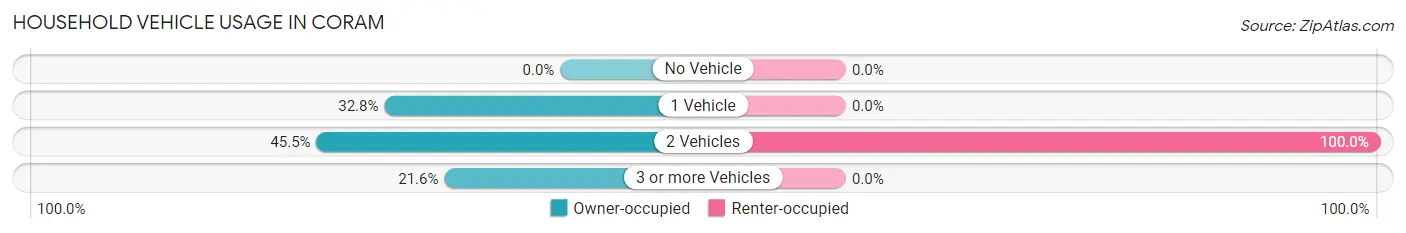
| Vehicles per Household | Owner-occupied | Renter-occupied |
| No Vehicle | 0 (0.0%) | 0 (0.0%) |
| 1 Vehicle | 44 (32.8%) | 0 (0.0%) |
| 2 Vehicles | 61 (45.5%) | 12 (100.0%) |
| 3 or more Vehicles | 29 (21.6%) | 0 (0.0%) |
| Total | 134 (100.0%) | 12 (100.0%) |
Real Estate & Mortgages in Coram
Real Estate and Mortgage Overview in Coram
| Characteristic | Without Mortgage | With Mortgage |
| Housing Units | 104 | 30 |
| Median Property Value | $242,200 | $0 |
| Median Household Income | $58,333 | $0 |
| Monthly Housing Costs | $436 | $0 |
| Real Estate Taxes | $2,068 | $0 |
Property Value by Mortgage Status in Coram
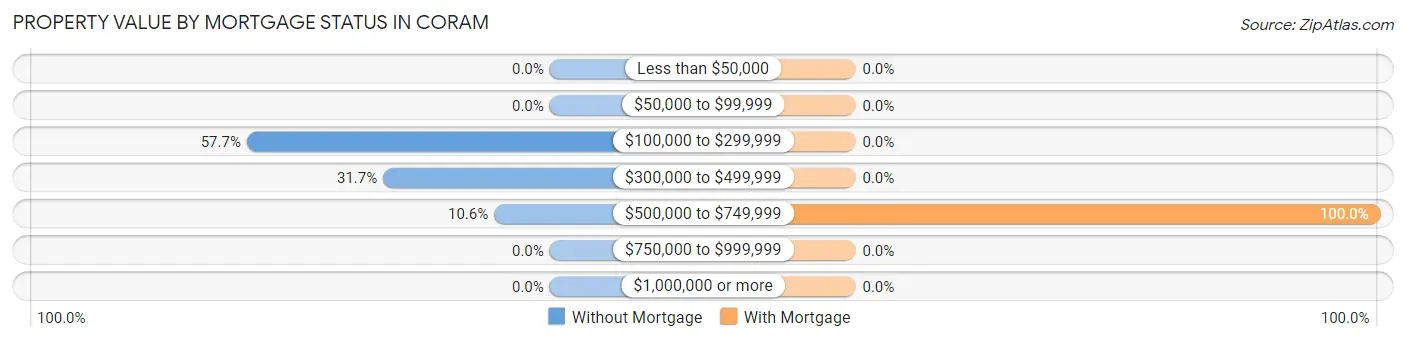
| Property Value | Without Mortgage | With Mortgage |
| Less than $50,000 | 0 (0.0%) | 0 (0.0%) |
| $50,000 to $99,999 | 0 (0.0%) | 0 (0.0%) |
| $100,000 to $299,999 | 60 (57.7%) | 0 (0.0%) |
| $300,000 to $499,999 | 33 (31.7%) | 0 (0.0%) |
| $500,000 to $749,999 | 11 (10.6%) | 30 (100.0%) |
| $750,000 to $999,999 | 0 (0.0%) | 0 (0.0%) |
| $1,000,000 or more | 0 (0.0%) | 0 (0.0%) |
| Total | 104 (100.0%) | 30 (100.0%) |
Household Income by Mortgage Status in Coram
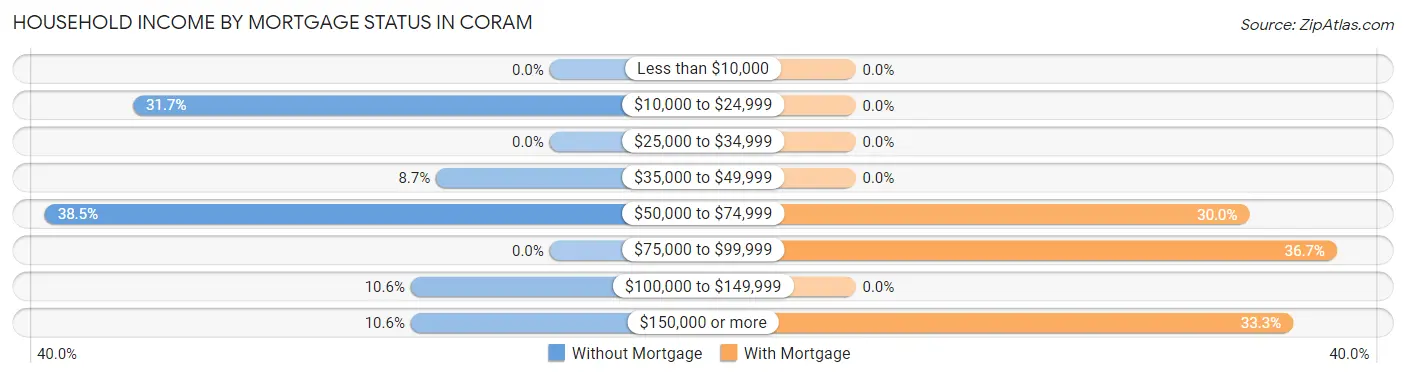
| Household Income | Without Mortgage | With Mortgage |
| Less than $10,000 | 0 (0.0%) | 0 (0.0%) |
| $10,000 to $24,999 | 33 (31.7%) | 0 (0.0%) |
| $25,000 to $34,999 | 0 (0.0%) | 0 (0.0%) |
| $35,000 to $49,999 | 9 (8.6%) | 0 (0.0%) |
| $50,000 to $74,999 | 40 (38.5%) | 9 (30.0%) |
| $75,000 to $99,999 | 0 (0.0%) | 11 (36.7%) |
| $100,000 to $149,999 | 11 (10.6%) | 0 (0.0%) |
| $150,000 or more | 11 (10.6%) | 10 (33.3%) |
| Total | 104 (100.0%) | 30 (100.0%) |
Property Value to Household Income Ratio in Coram
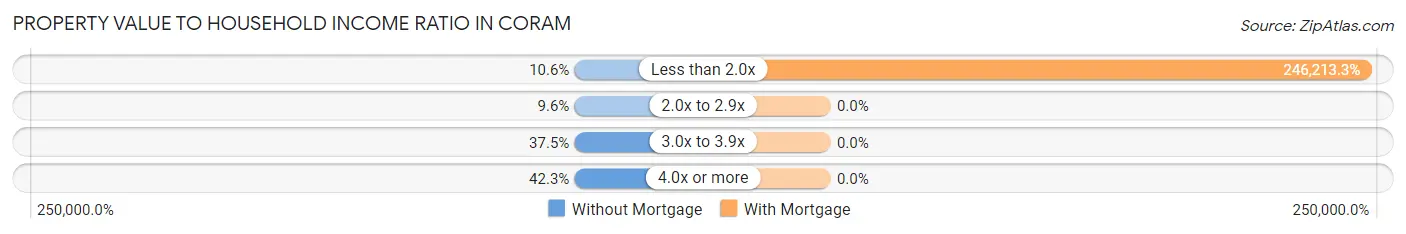
| Value-to-Income Ratio | Without Mortgage | With Mortgage |
| Less than 2.0x | 11 (10.6%) | 73,864 (246,213.3%) |
| 2.0x to 2.9x | 10 (9.6%) | 0 (0.0%) |
| 3.0x to 3.9x | 39 (37.5%) | 0 (0.0%) |
| 4.0x or more | 44 (42.3%) | 0 (0.0%) |
| Total | 104 (100.0%) | 30 (100.0%) |
Real Estate Taxes by Mortgage Status in Coram
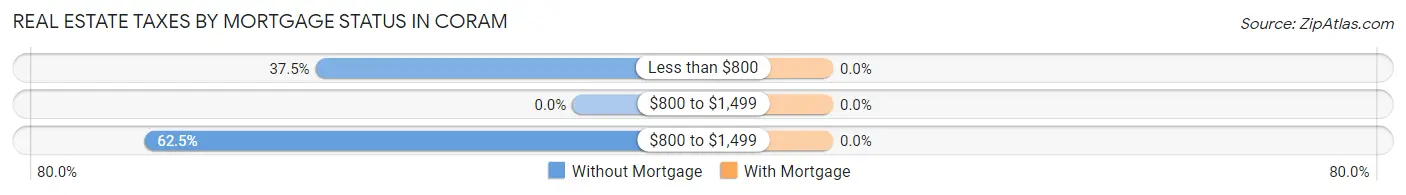
| Property Taxes | Without Mortgage | With Mortgage |
| Less than $800 | 39 (37.5%) | 0 (0.0%) |
| $800 to $1,499 | 0 (0.0%) | 0 (0.0%) |
| $800 to $1,499 | 65 (62.5%) | 0 (0.0%) |
| Total | 104 (100.0%) | 30 (100.0%) |
Health & Disability in Coram
Health Insurance Coverage by Age in Coram
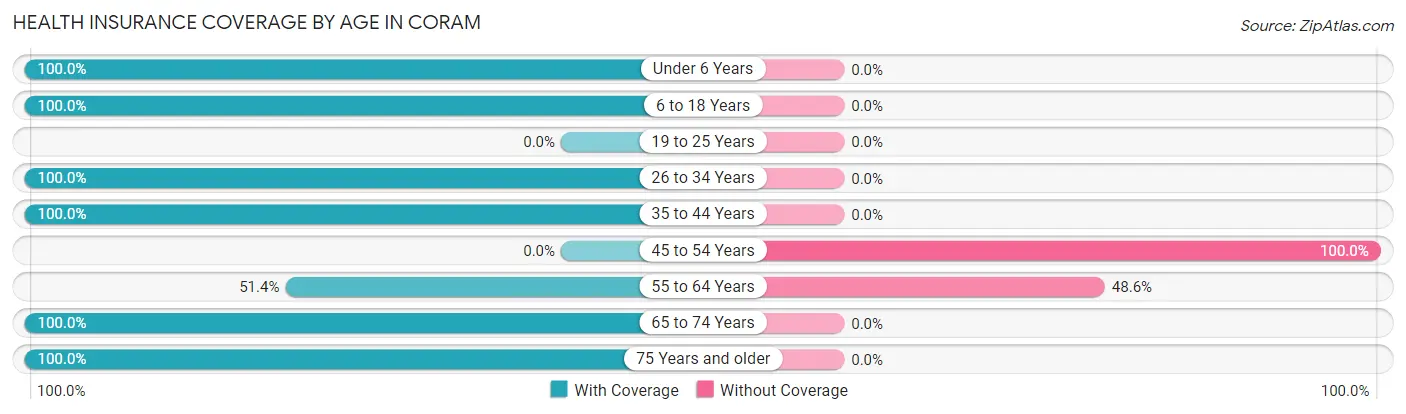
| Age Bracket | With Coverage | Without Coverage |
| Under 6 Years | 32 (100.0%) | 0 (0.0%) |
| 6 to 18 Years | 75 (100.0%) | 0 (0.0%) |
| 19 to 25 Years | 0 (0.0%) | 0 (0.0%) |
| 26 to 34 Years | 11 (100.0%) | 0 (0.0%) |
| 35 to 44 Years | 76 (100.0%) | 0 (0.0%) |
| 45 to 54 Years | 0 (0.0%) | 54 (100.0%) |
| 55 to 64 Years | 55 (51.4%) | 52 (48.6%) |
| 65 to 74 Years | 60 (100.0%) | 0 (0.0%) |
| 75 Years and older | 27 (100.0%) | 0 (0.0%) |
| Total | 336 (76.0%) | 106 (24.0%) |
Health Insurance Coverage by Citizenship Status in Coram
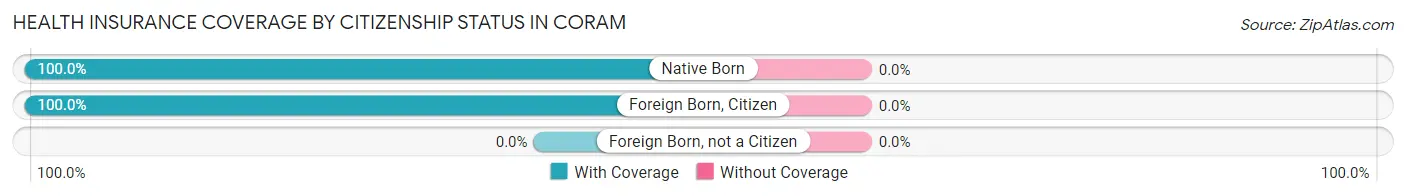
| Citizenship Status | With Coverage | Without Coverage |
| Native Born | 32 (100.0%) | 0 (0.0%) |
| Foreign Born, Citizen | 75 (100.0%) | 0 (0.0%) |
| Foreign Born, not a Citizen | 0 (0.0%) | 0 (0.0%) |
Health Insurance Coverage by Household Income in Coram
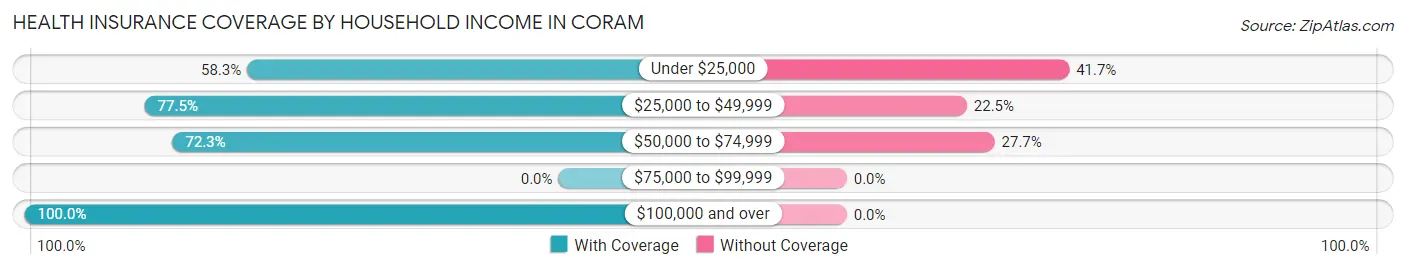
| Household Income | With Coverage | Without Coverage |
| Under $25,000 | 35 (58.3%) | 25 (41.7%) |
| $25,000 to $49,999 | 93 (77.5%) | 27 (22.5%) |
| $50,000 to $74,999 | 141 (72.3%) | 54 (27.7%) |
| $75,000 to $99,999 | 0 (0.0%) | 0 (0.0%) |
| $100,000 and over | 67 (100.0%) | 0 (0.0%) |
Public vs Private Health Insurance Coverage by Age in Coram
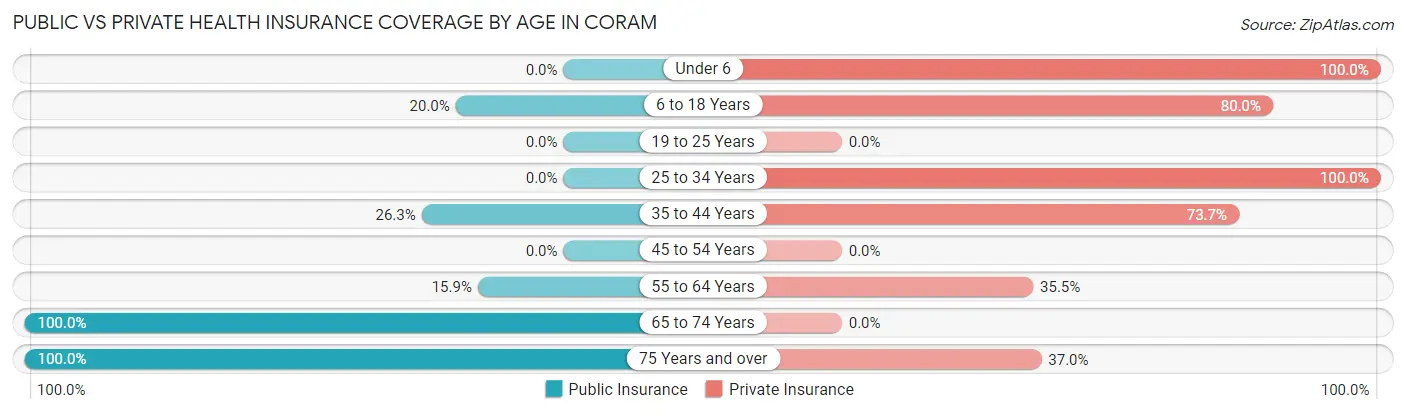
| Age Bracket | Public Insurance | Private Insurance |
| Under 6 | 0 (0.0%) | 32 (100.0%) |
| 6 to 18 Years | 15 (20.0%) | 60 (80.0%) |
| 19 to 25 Years | 0 (0.0%) | 0 (0.0%) |
| 25 to 34 Years | 0 (0.0%) | 11 (100.0%) |
| 35 to 44 Years | 20 (26.3%) | 56 (73.7%) |
| 45 to 54 Years | 0 (0.0%) | 0 (0.0%) |
| 55 to 64 Years | 17 (15.9%) | 38 (35.5%) |
| 65 to 74 Years | 60 (100.0%) | 0 (0.0%) |
| 75 Years and over | 27 (100.0%) | 10 (37.0%) |
| Total | 139 (31.5%) | 207 (46.8%) |
Disability Status by Sex by Age in Coram
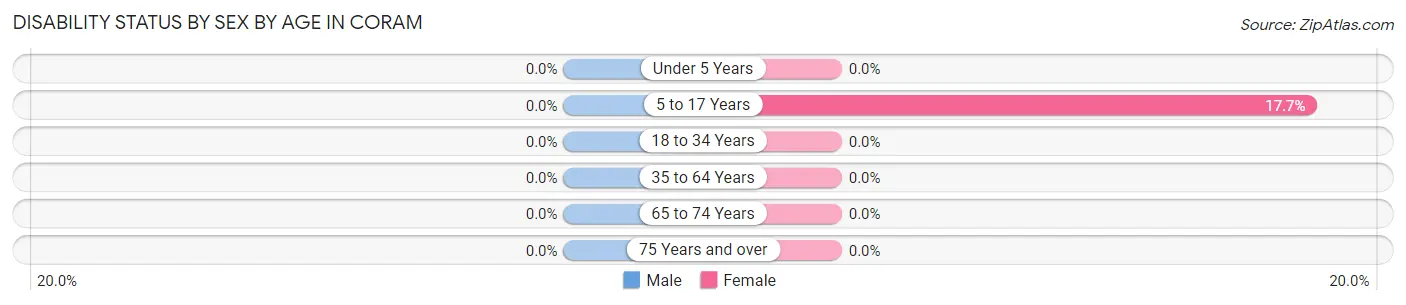
| Age Bracket | Male | Female |
| Under 5 Years | 0 (0.0%) | 0 (0.0%) |
| 5 to 17 Years | 0 (0.0%) | 9 (17.6%) |
| 18 to 34 Years | 0 (0.0%) | 0 (0.0%) |
| 35 to 64 Years | 0 (0.0%) | 0 (0.0%) |
| 65 to 74 Years | 0 (0.0%) | 0 (0.0%) |
| 75 Years and over | 0 (0.0%) | 0 (0.0%) |
Disability Class by Sex by Age in Coram
Disability Class: Hearing Difficulty
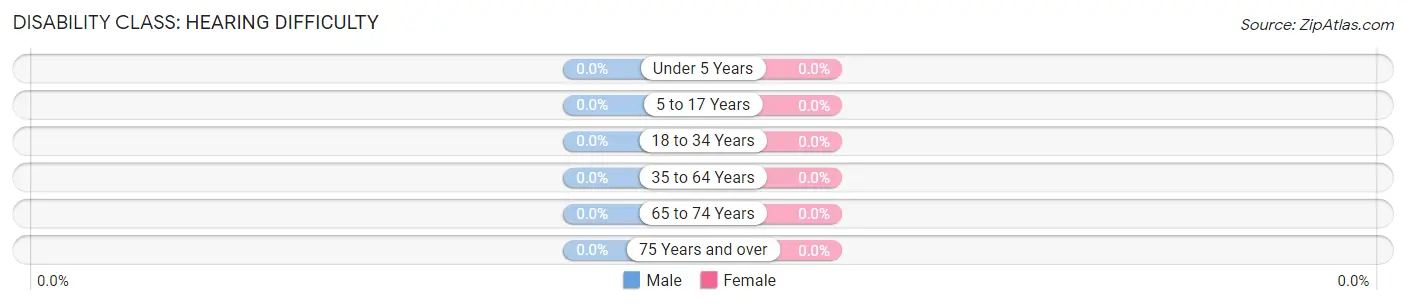
| Age Bracket | Male | Female |
| Under 5 Years | 0 (0.0%) | 0 (0.0%) |
| 5 to 17 Years | 0 (0.0%) | 0 (0.0%) |
| 18 to 34 Years | 0 (0.0%) | 0 (0.0%) |
| 35 to 64 Years | 0 (0.0%) | 0 (0.0%) |
| 65 to 74 Years | 0 (0.0%) | 0 (0.0%) |
| 75 Years and over | 0 (0.0%) | 0 (0.0%) |
Disability Class: Vision Difficulty
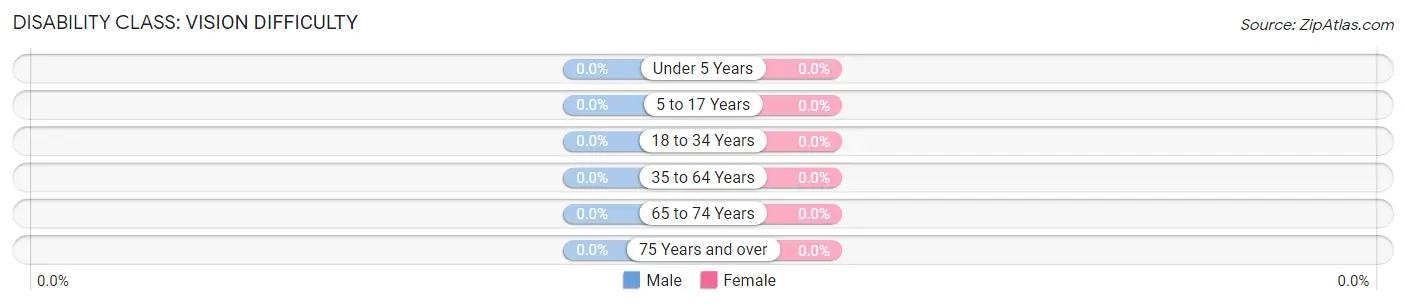
| Age Bracket | Male | Female |
| Under 5 Years | 0 (0.0%) | 0 (0.0%) |
| 5 to 17 Years | 0 (0.0%) | 0 (0.0%) |
| 18 to 34 Years | 0 (0.0%) | 0 (0.0%) |
| 35 to 64 Years | 0 (0.0%) | 0 (0.0%) |
| 65 to 74 Years | 0 (0.0%) | 0 (0.0%) |
| 75 Years and over | 0 (0.0%) | 0 (0.0%) |
Disability Class: Cognitive Difficulty
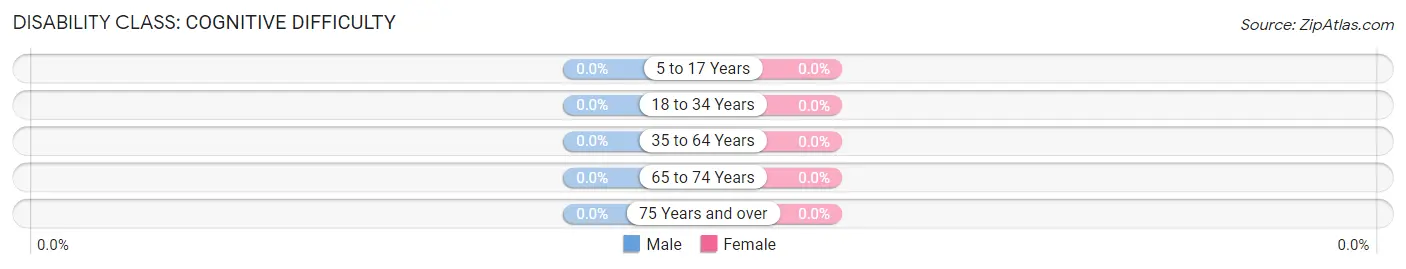
| Age Bracket | Male | Female |
| 5 to 17 Years | 0 (0.0%) | 0 (0.0%) |
| 18 to 34 Years | 0 (0.0%) | 0 (0.0%) |
| 35 to 64 Years | 0 (0.0%) | 0 (0.0%) |
| 65 to 74 Years | 0 (0.0%) | 0 (0.0%) |
| 75 Years and over | 0 (0.0%) | 0 (0.0%) |
Disability Class: Ambulatory Difficulty
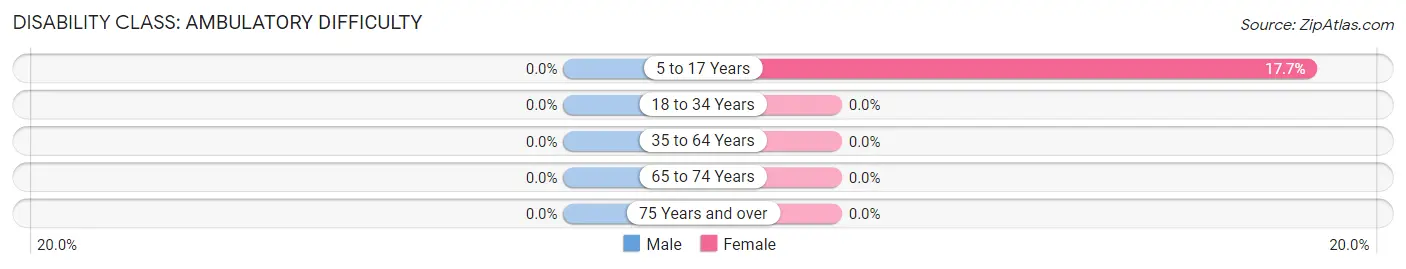
| Age Bracket | Male | Female |
| 5 to 17 Years | 0 (0.0%) | 9 (17.6%) |
| 18 to 34 Years | 0 (0.0%) | 0 (0.0%) |
| 35 to 64 Years | 0 (0.0%) | 0 (0.0%) |
| 65 to 74 Years | 0 (0.0%) | 0 (0.0%) |
| 75 Years and over | 0 (0.0%) | 0 (0.0%) |
Disability Class: Self-Care Difficulty
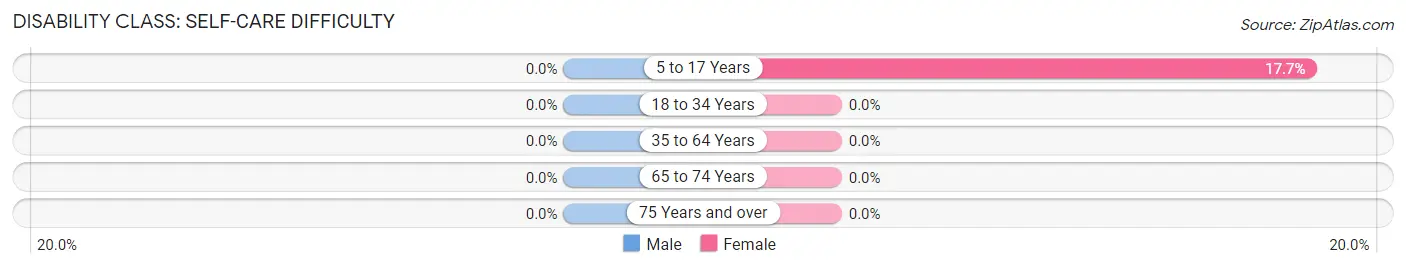
| Age Bracket | Male | Female |
| 5 to 17 Years | 0 (0.0%) | 9 (17.6%) |
| 18 to 34 Years | 0 (0.0%) | 0 (0.0%) |
| 35 to 64 Years | 0 (0.0%) | 0 (0.0%) |
| 65 to 74 Years | 0 (0.0%) | 0 (0.0%) |
| 75 Years and over | 0 (0.0%) | 0 (0.0%) |
Technology Access in Coram
Computing Device Access in Coram
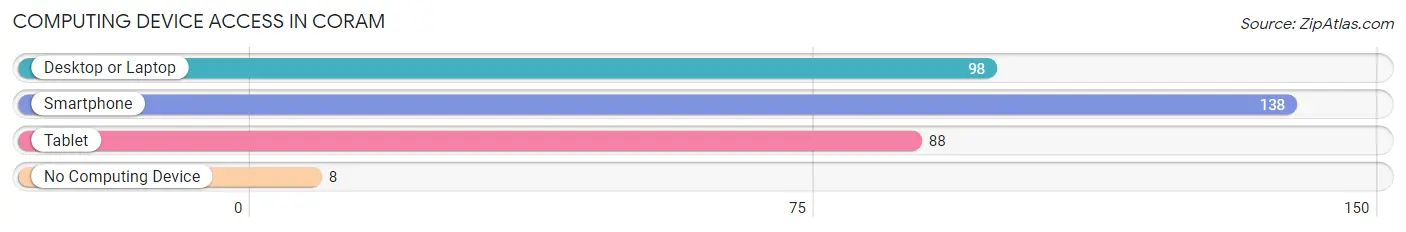
| Device Type | # Households | % Households |
| Desktop or Laptop | 98 | 67.1% |
| Smartphone | 138 | 94.5% |
| Tablet | 88 | 60.3% |
| No Computing Device | 8 | 5.5% |
| Total | 146 | 100.0% |
Internet Access in Coram
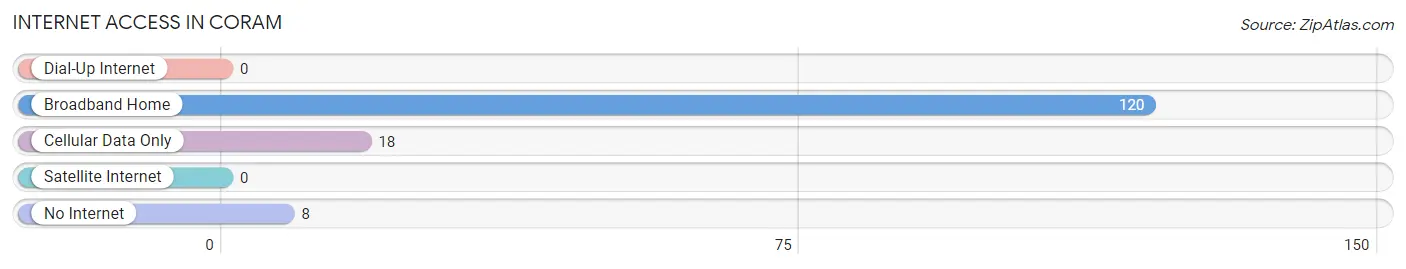
| Internet Type | # Households | % Households |
| Dial-Up Internet | 0 | 0.0% |
| Broadband Home | 120 | 82.2% |
| Cellular Data Only | 18 | 12.3% |
| Satellite Internet | 0 | 0.0% |
| No Internet | 8 | 5.5% |
| Total | 146 | 100.0% |
Coram Summary
Coram, Montana is a small unincorporated community located in Flathead County, Montana. It is situated in the Flathead Valley, approximately 20 miles north of Kalispell and 40 miles south of Whitefish. The population of Coram was estimated to be around 200 people in 2020.
History
Coram was first settled in the late 1800s by homesteaders who were attracted to the area by its abundant natural resources. The first post office was established in 1891 and the town was officially incorporated in 1909. The town was named after Coram, New York, the hometown of one of the original settlers.
The town grew slowly over the years, but it was not until the 1950s that it began to experience significant growth. This was due to the construction of the Hungry Horse Dam, which created a large reservoir and provided irrigation for the surrounding area. The dam also provided hydroelectric power to the region, which helped to spur economic development.
Geography
Coram is located in the Flathead Valley, which is part of the Rocky Mountain Front. The valley is surrounded by the Swan, Mission, and Flathead Mountains. The Flathead River runs through the valley, providing a source of water for the area. The climate in Coram is generally mild, with cold winters and warm summers.
Economy
The economy of Coram is largely based on agriculture and tourism. The area is known for its apple orchards, which produce a variety of apples for local consumption and for sale in nearby cities. The area is also home to several wineries, which produce a variety of wines for sale in the region.
Tourism is also an important part of the local economy. The area is home to several ski resorts, which attract visitors from all over the world. The area is also popular for its hiking and camping opportunities, as well as its proximity to Glacier National Park.
Demographics
The population of Coram is estimated to be around 200 people. The majority of the population is white (90%), with the remaining 10% being made up of Native Americans, African Americans, and other races. The median household income in Coram is $45,000, which is slightly lower than the national average. The median age of the population is 44 years old.
Conclusion
Coram, Montana is a small unincorporated community located in Flathead County, Montana. It is situated in the Flathead Valley, approximately 20 miles north of Kalispell and 40 miles south of Whitefish. The population of Coram was estimated to be around 200 people in 2020. The economy of Coram is largely based on agriculture and tourism, and the majority of the population is white. The median household income in Coram is $45,000, which is slightly lower than the national average. The median age of the population is 44 years old.
Common Questions
What is Per Capita Income in Coram?
Per Capita income in Coram is $23,407.
What is the Median Family Income in Coram?
Median Family Income in Coram is $58,875.
What is the Median Household income in Coram?
Median Household Income in Coram is $58,333.
What is Income or Wage Gap in Coram?
Income or Wage Gap in Coram is 16.6%.
Women in Coram earn 83.4 cents for every dollar earned by a man.
What is Inequality or Gini Index in Coram?
Inequality or Gini Index in Coram is 0.37.
What is the Total Population of Coram?
Total Population of Coram is 442.
What is the Total Male Population of Coram?
Total Male Population of Coram is 257.
What is the Total Female Population of Coram?
Total Female Population of Coram is 185.
What is the Ratio of Males per 100 Females in Coram?
There are 138.92 Males per 100 Females in Coram.
What is the Ratio of Females per 100 Males in Coram?
There are 71.98 Females per 100 Males in Coram.
What is the Median Population Age in Coram?
Median Population Age in Coram is 46.5 Years.
What is the Average Family Size in Coram
Average Family Size in Coram is 4.2 People.
What is the Average Household Size in Coram
Average Household Size in Coram is 3.0 People.
How Large is the Labor Force in Coram?
There are 113 People in the Labor Forcein in Coram.
What is the Percentage of People in the Labor Force in Coram?
33.7% of People are in the Labor Force in Coram.
What is the Unemployment Rate in Coram?
Unemployment Rate in Coram is 9.7%.