Hinsdale, MT Map & Demographics
Hinsdale Map
Hinsdale Overview
$37,097
PER CAPITA INCOME
$76,250
AVG FAMILY INCOME
$43,250
AVG HOUSEHOLD INCOME
25.5%
WAGE / INCOME GAP [ % ]
74.5¢/ $1
WAGE / INCOME GAP [ $ ]
0.49
INEQUALITY / GINI INDEX
239
TOTAL POPULATION
134
MALE POPULATION
105
FEMALE POPULATION
127.62
MALES / 100 FEMALES
78.36
FEMALES / 100 MALES
48.1
MEDIAN AGE
2.7
AVG FAMILY SIZE
1.8
AVG HOUSEHOLD SIZE
143
LABOR FORCE [ PEOPLE ]
65.3%
PERCENT IN LABOR FORCE
2.8%
UNEMPLOYMENT RATE
Hinsdale Zip Codes
Hinsdale Area Codes
Income in Hinsdale
Income Overview in Hinsdale
Per Capita Income in Hinsdale is $37,097, while median incomes of families and households are $76,250 and $43,250 respectively.
| Characteristic | Number | Measure |
| Per Capita Income | 239 | $37,097 |
| Median Family Income | 58 | $76,250 |
| Mean Family Income | 58 | $108,469 |
| Median Household Income | 135 | $43,250 |
| Mean Household Income | 135 | $66,042 |
| Income Deficit | 58 | $0 |
| Wage / Income Gap (%) | 239 | 25.51% |
| Wage / Income Gap ($) | 239 | 74.49¢ per $1 |
| Gini / Inequality Index | 239 | 0.49 |
Earnings by Sex in Hinsdale
Average Earnings in Hinsdale are $31,932, $38,036 for men and $28,333 for women, a difference of 25.5%.
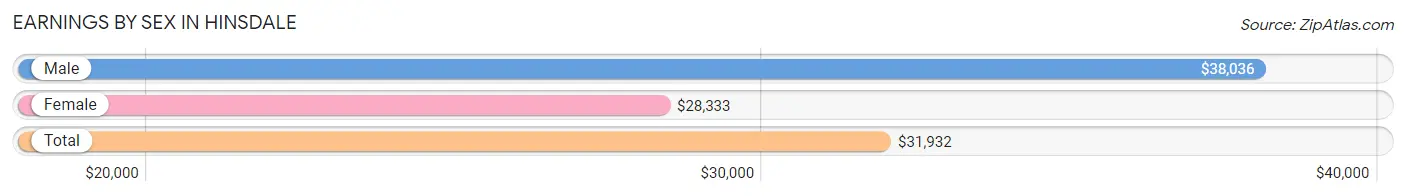
| Sex | Number | Average Earnings |
| Male | 101 (63.5%) | $38,036 |
| Female | 58 (36.5%) | $28,333 |
| Total | 159 (100.0%) | $31,932 |
Earnings by Sex by Income Bracket in Hinsdale
The most common earnings brackets in Hinsdale are $17,500 to $19,999 for men (15 | 14.8%) and $17,500 to $19,999 for women (14 | 24.1%).
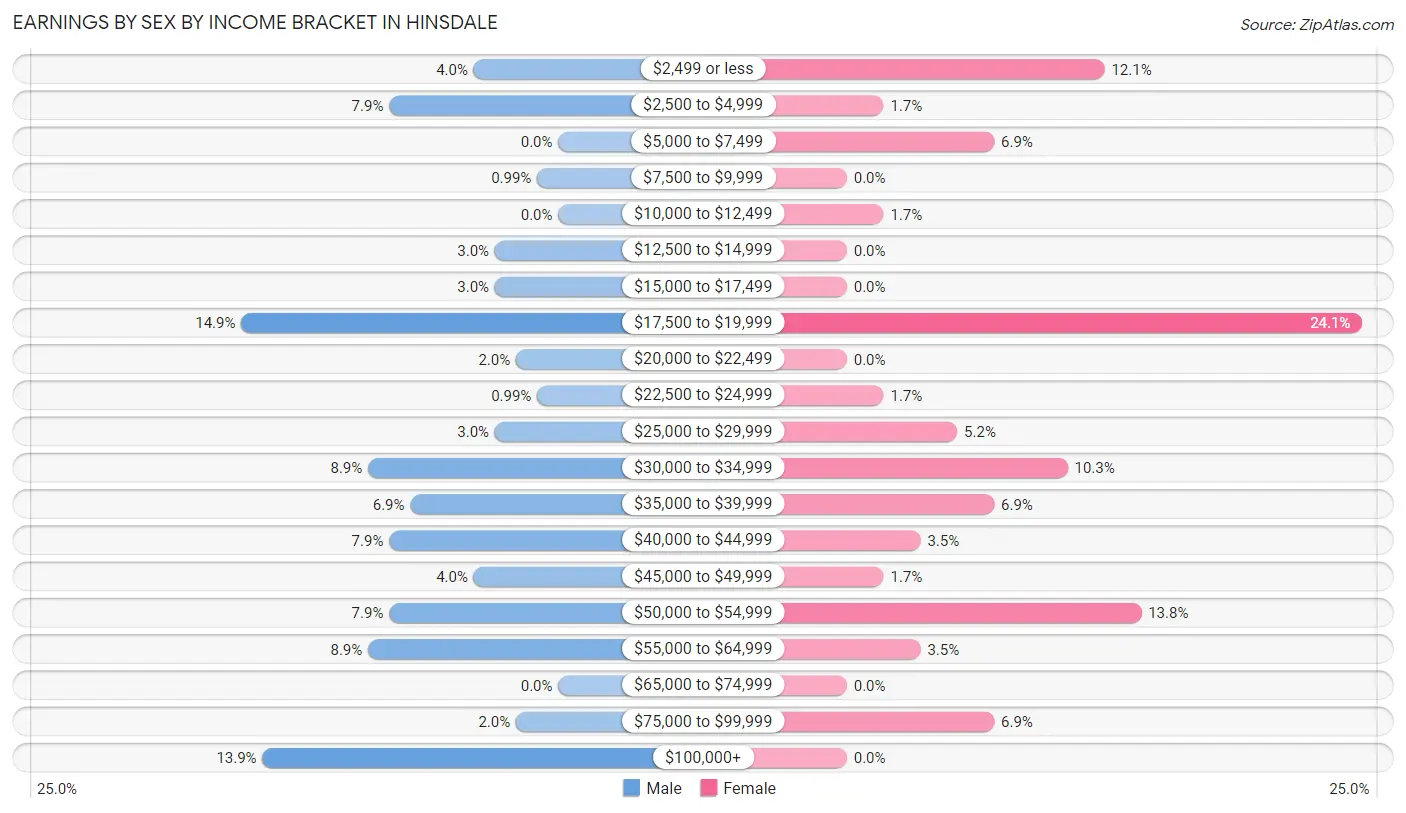
| Income | Male | Female |
| $2,499 or less | 4 (4.0%) | 7 (12.1%) |
| $2,500 to $4,999 | 8 (7.9%) | 1 (1.7%) |
| $5,000 to $7,499 | 0 (0.0%) | 4 (6.9%) |
| $7,500 to $9,999 | 1 (1.0%) | 0 (0.0%) |
| $10,000 to $12,499 | 0 (0.0%) | 1 (1.7%) |
| $12,500 to $14,999 | 3 (3.0%) | 0 (0.0%) |
| $15,000 to $17,499 | 3 (3.0%) | 0 (0.0%) |
| $17,500 to $19,999 | 15 (14.8%) | 14 (24.1%) |
| $20,000 to $22,499 | 2 (2.0%) | 0 (0.0%) |
| $22,500 to $24,999 | 1 (1.0%) | 1 (1.7%) |
| $25,000 to $29,999 | 3 (3.0%) | 3 (5.2%) |
| $30,000 to $34,999 | 9 (8.9%) | 6 (10.3%) |
| $35,000 to $39,999 | 7 (6.9%) | 4 (6.9%) |
| $40,000 to $44,999 | 8 (7.9%) | 2 (3.5%) |
| $45,000 to $49,999 | 4 (4.0%) | 1 (1.7%) |
| $50,000 to $54,999 | 8 (7.9%) | 8 (13.8%) |
| $55,000 to $64,999 | 9 (8.9%) | 2 (3.5%) |
| $65,000 to $74,999 | 0 (0.0%) | 0 (0.0%) |
| $75,000 to $99,999 | 2 (2.0%) | 4 (6.9%) |
| $100,000+ | 14 (13.9%) | 0 (0.0%) |
| Total | 101 (100.0%) | 58 (100.0%) |
Earnings by Sex by Educational Attainment in Hinsdale
Average earnings in Hinsdale are $42,656 for men and $34,063 for women, a difference of 20.1%. Men with an educational attainment of bachelor's degree enjoy the highest average annual earnings of $55,625, while those with high school diploma education earn the least with $31,786. Women with an educational attainment of bachelor's degree earn the most with the average annual earnings of $52,857, while those with college or associate's degree education have the smallest earnings of $36,667.
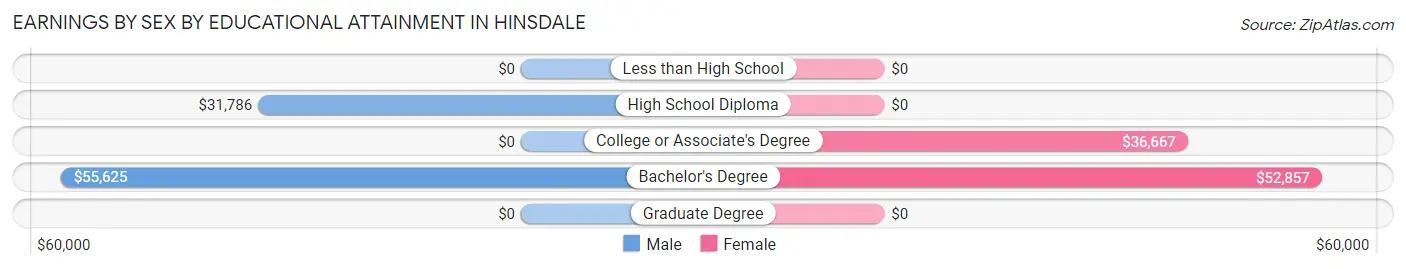
| Educational Attainment | Male Income | Female Income |
| Less than High School | - | - |
| High School Diploma | $31,786 | $0 |
| College or Associate's Degree | - | - |
| Bachelor's Degree | $55,625 | $52,857 |
| Graduate Degree | - | - |
| Total | $42,656 | $34,063 |
Family Income in Hinsdale
Family Income Brackets in Hinsdale
According to the Hinsdale family income data, there are 12 families falling into the $50,000 to $74,999 income range, which is the most common income bracket and makes up 20.7% of all families.
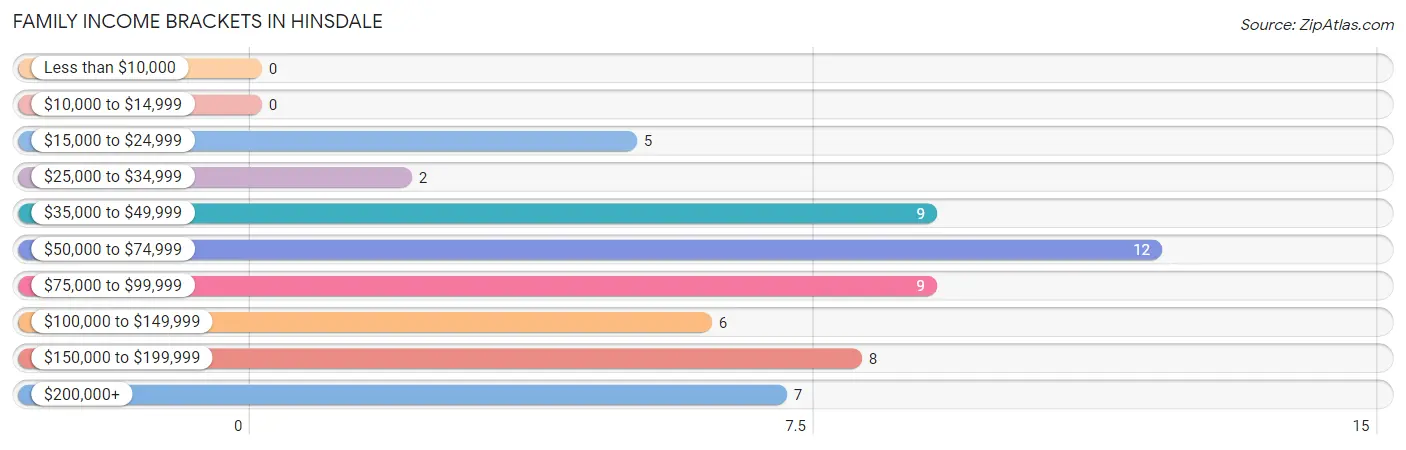
| Income Bracket | # Families | % Families |
| Less than $10,000 | 0 | 0.0% |
| $10,000 to $14,999 | 0 | 0.0% |
| $15,000 to $24,999 | 5 | 8.6% |
| $25,000 to $34,999 | 2 | 3.4% |
| $35,000 to $49,999 | 9 | 15.5% |
| $50,000 to $74,999 | 12 | 20.7% |
| $75,000 to $99,999 | 9 | 15.5% |
| $100,000 to $149,999 | 6 | 10.3% |
| $150,000 to $199,999 | 8 | 13.8% |
| $200,000+ | 7 | 12.1% |
Family Income by Famaliy Size in Hinsdale
3-person families (13 | 22.4%) account for the highest median family income in Hinsdale with $90,625 per family, while 2-person families (45 | 77.6%) have the highest median income of $32,188 per family member.
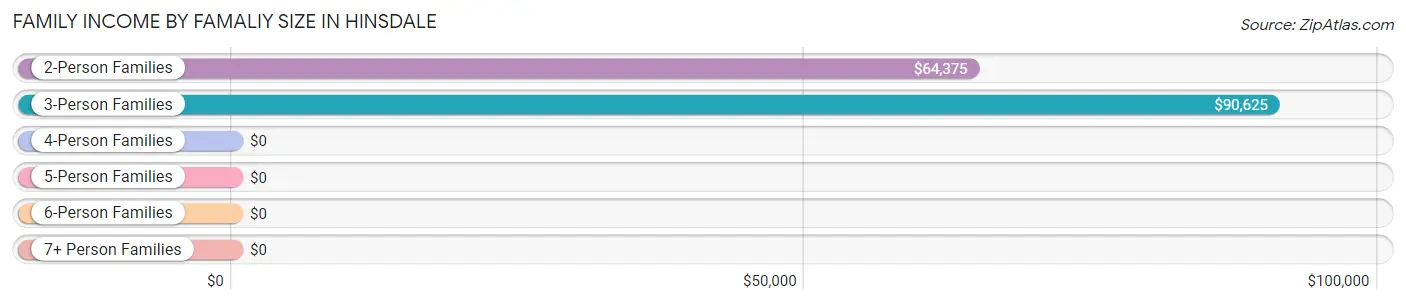
| Income Bracket | # Families | Median Income |
| 2-Person Families | 45 (77.6%) | $64,375 |
| 3-Person Families | 13 (22.4%) | $90,625 |
| 4-Person Families | 0 (0.0%) | $0 |
| 5-Person Families | 0 (0.0%) | $0 |
| 6-Person Families | 0 (0.0%) | $0 |
| 7+ Person Families | 0 (0.0%) | $0 |
| Total | 58 (100.0%) | $76,250 |
Family Income by Number of Earners in Hinsdale
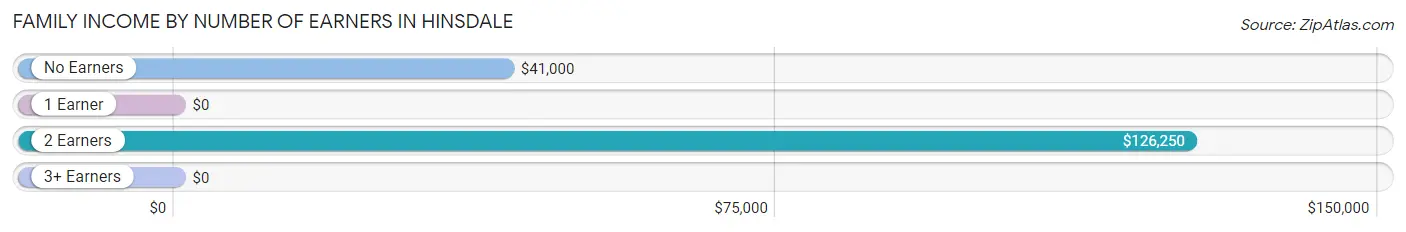
| Number of Earners | # Families | Median Income |
| No Earners | 16 (27.6%) | $41,000 |
| 1 Earner | 4 (6.9%) | $0 |
| 2 Earners | 34 (58.6%) | $126,250 |
| 3+ Earners | 4 (6.9%) | $0 |
| Total | 58 (100.0%) | $76,250 |
Household Income in Hinsdale
Household Income Brackets in Hinsdale
With 28 households falling in the category, the $35,000 to $49,999 income range is the most frequent in Hinsdale, accounting for 20.7% of all households. In contrast, only 3 households (2.2%) fall into the $10,000 to $14,999 income bracket, making it the least populous group.
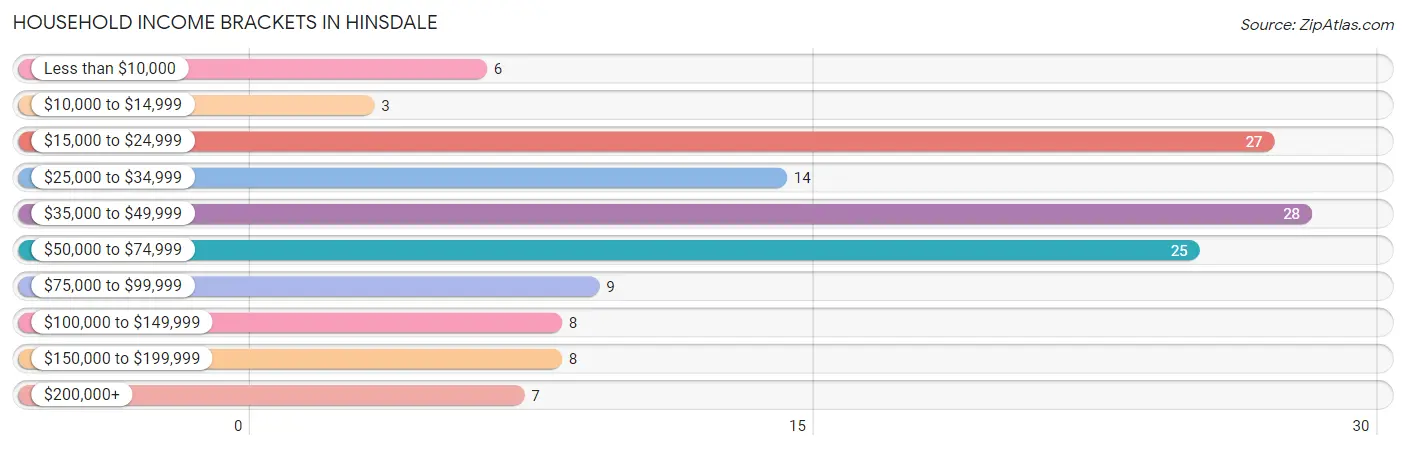
| Income Bracket | # Households | % Households |
| Less than $10,000 | 6 | 4.4% |
| $10,000 to $14,999 | 3 | 2.2% |
| $15,000 to $24,999 | 27 | 20.0% |
| $25,000 to $34,999 | 14 | 10.4% |
| $35,000 to $49,999 | 28 | 20.7% |
| $50,000 to $74,999 | 25 | 18.5% |
| $75,000 to $99,999 | 9 | 6.7% |
| $100,000 to $149,999 | 8 | 5.9% |
| $150,000 to $199,999 | 8 | 5.9% |
| $200,000+ | 7 | 5.2% |
Household Income by Householder Age in Hinsdale
The median household income in Hinsdale is $43,250, with the highest median household income of $91,250 found in the 45 to 64 years age bracket for the primary householder. A total of 34 households (25.2%) fall into this category. Meanwhile, the 65+ years age bracket for the primary householder has the lowest median household income of $30,000, with 48 households (35.6%) in this group.
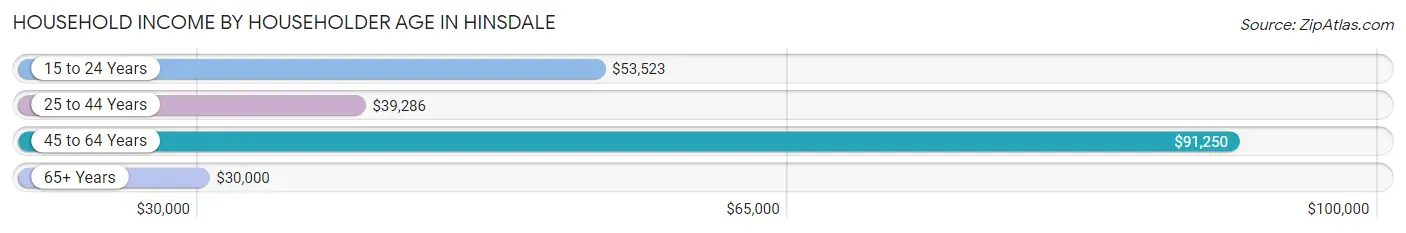
| Income Bracket | # Households | Median Income |
| 15 to 24 Years | 15 (11.1%) | $53,523 |
| 25 to 44 Years | 38 (28.1%) | $39,286 |
| 45 to 64 Years | 34 (25.2%) | $91,250 |
| 65+ Years | 48 (35.6%) | $30,000 |
| Total | 135 (100.0%) | $43,250 |
Poverty in Hinsdale
Income Below Poverty by Sex and Age in Hinsdale
With 2.2% poverty level for males and 9.5% for females among the residents of Hinsdale, 16 and 17 year old males and 25 to 34 year old females are the most vulnerable to poverty, with 1 males (25.0%) and 3 females (50.0%) in their respective age groups living below the poverty level.
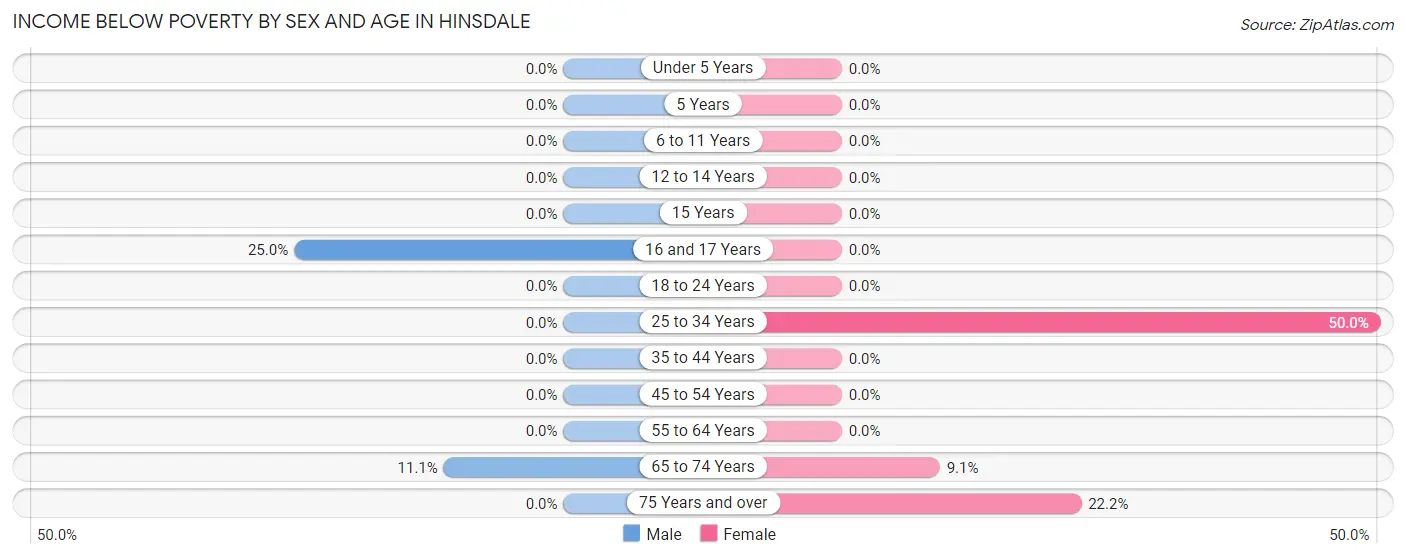
| Age Bracket | Male | Female |
| Under 5 Years | 0 (0.0%) | 0 (0.0%) |
| 5 Years | 0 (0.0%) | 0 (0.0%) |
| 6 to 11 Years | 0 (0.0%) | 0 (0.0%) |
| 12 to 14 Years | 0 (0.0%) | 0 (0.0%) |
| 15 Years | 0 (0.0%) | 0 (0.0%) |
| 16 and 17 Years | 1 (25.0%) | 0 (0.0%) |
| 18 to 24 Years | 0 (0.0%) | 0 (0.0%) |
| 25 to 34 Years | 0 (0.0%) | 3 (50.0%) |
| 35 to 44 Years | 0 (0.0%) | 0 (0.0%) |
| 45 to 54 Years | 0 (0.0%) | 0 (0.0%) |
| 55 to 64 Years | 0 (0.0%) | 0 (0.0%) |
| 65 to 74 Years | 2 (11.1%) | 1 (9.1%) |
| 75 Years and over | 0 (0.0%) | 6 (22.2%) |
| Total | 3 (2.2%) | 10 (9.5%) |
Income Above Poverty by Sex and Age in Hinsdale
According to the poverty statistics in Hinsdale, males aged under 5 years and females aged under 5 years are the age groups that are most secure financially, with 100.0% of males and 100.0% of females in these age groups living above the poverty line.
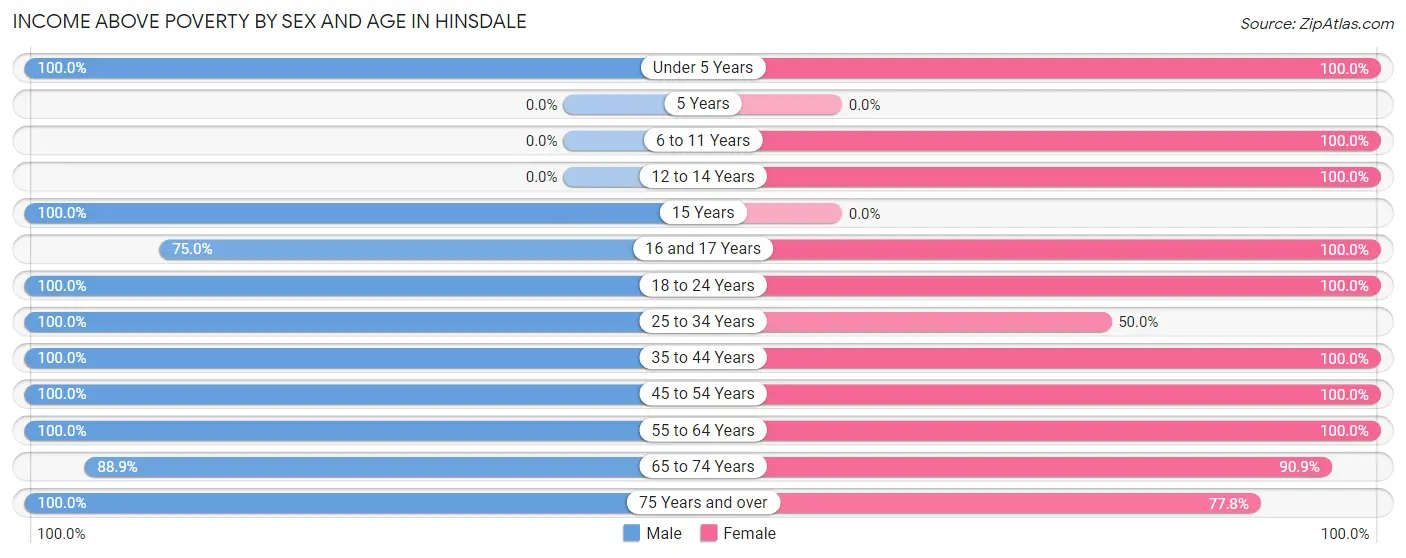
| Age Bracket | Male | Female |
| Under 5 Years | 2 (100.0%) | 11 (100.0%) |
| 5 Years | 0 (0.0%) | 0 (0.0%) |
| 6 to 11 Years | 0 (0.0%) | 2 (100.0%) |
| 12 to 14 Years | 0 (0.0%) | 2 (100.0%) |
| 15 Years | 3 (100.0%) | 0 (0.0%) |
| 16 and 17 Years | 3 (75.0%) | 1 (100.0%) |
| 18 to 24 Years | 12 (100.0%) | 14 (100.0%) |
| 25 to 34 Years | 38 (100.0%) | 3 (50.0%) |
| 35 to 44 Years | 16 (100.0%) | 6 (100.0%) |
| 45 to 54 Years | 4 (100.0%) | 13 (100.0%) |
| 55 to 64 Years | 23 (100.0%) | 12 (100.0%) |
| 65 to 74 Years | 16 (88.9%) | 10 (90.9%) |
| 75 Years and over | 14 (100.0%) | 21 (77.8%) |
| Total | 131 (97.8%) | 95 (90.5%) |
Income Below Poverty Among Married-Couple Families in Hinsdale
The poverty statistics for married-couple families in Hinsdale show that 3.6% or 2 of the total 55 families live below the poverty line. Families with no children have the highest poverty rate of 4.5%, comprising of 2 families. On the other hand, families with 1 or 2 children have the lowest poverty rate of 0.0%, which includes 0 families.
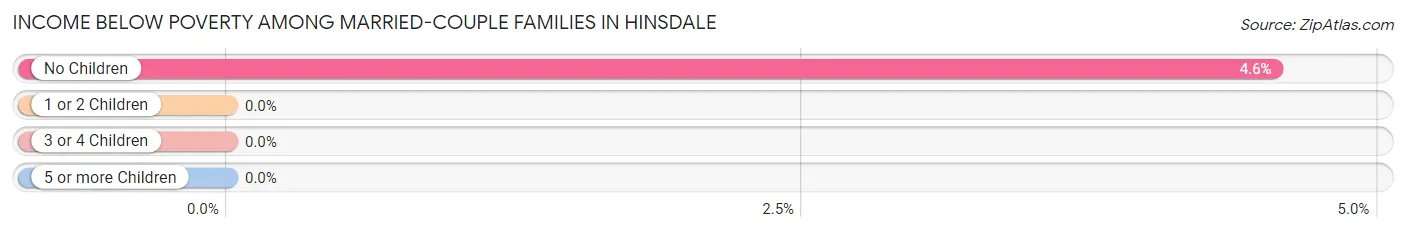
| Children | Above Poverty | Below Poverty |
| No Children | 42 (95.5%) | 2 (4.5%) |
| 1 or 2 Children | 11 (100.0%) | 0 (0.0%) |
| 3 or 4 Children | 0 (0.0%) | 0 (0.0%) |
| 5 or more Children | 0 (0.0%) | 0 (0.0%) |
| Total | 53 (96.4%) | 2 (3.6%) |
Income Below Poverty Among Single-Parent Households in Hinsdale
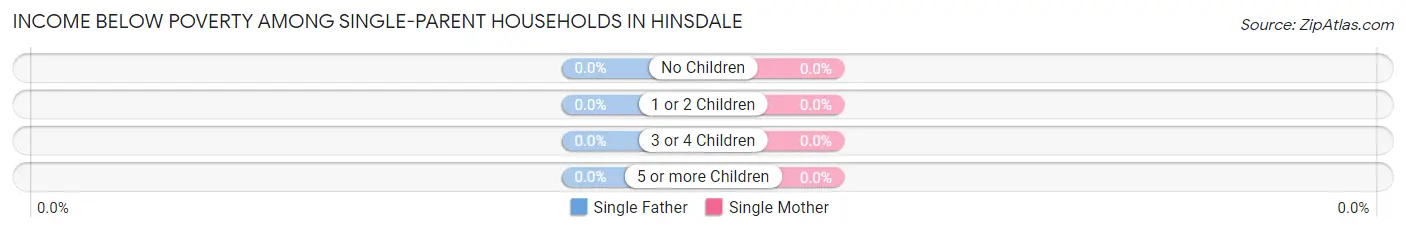
| Children | Single Father | Single Mother |
| No Children | 0 (0.0%) | 0 (0.0%) |
| 1 or 2 Children | 0 (0.0%) | 0 (0.0%) |
| 3 or 4 Children | 0 (0.0%) | 0 (0.0%) |
| 5 or more Children | 0 (0.0%) | 0 (0.0%) |
| Total | 0 (0.0%) | 0 (0.0%) |
Income Below Poverty Among Married-Couple vs Single-Parent Households in Hinsdale
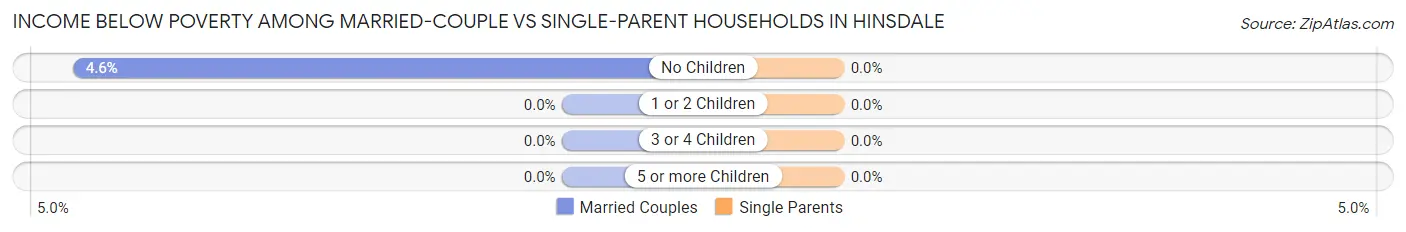
| Children | Married-Couple Families | Single-Parent Households |
| No Children | 2 (4.5%) | 0 (0.0%) |
| 1 or 2 Children | 0 (0.0%) | 0 (0.0%) |
| 3 or 4 Children | 0 (0.0%) | 0 (0.0%) |
| 5 or more Children | 0 (0.0%) | 0 (0.0%) |
| Total | 2 (3.6%) | 0 (0.0%) |
Race in Hinsdale
The most populous races in Hinsdale are White / Caucasian (196 | 82.0%), Hispanic or Latino (24 | 10.0%), and Native / Alaskan (16 | 6.7%).
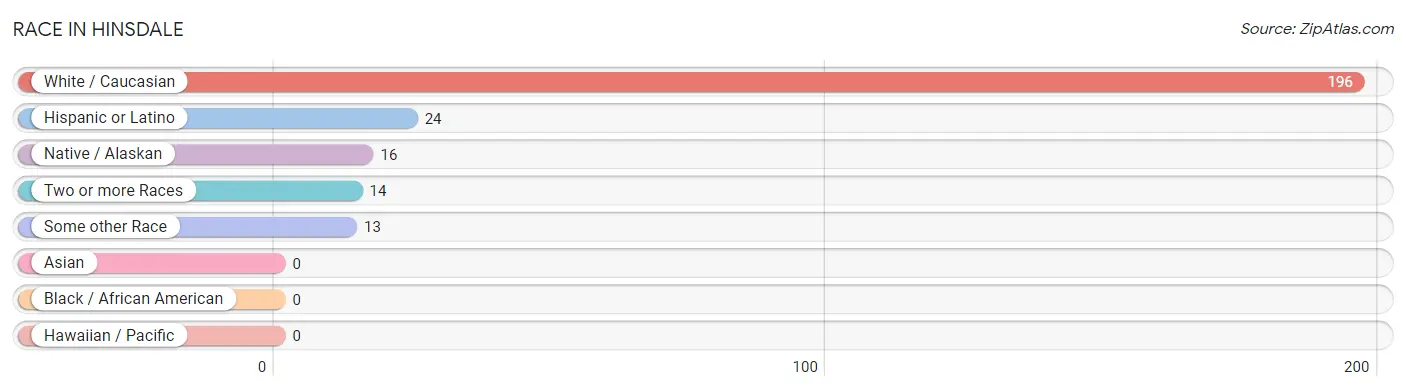
| Race | # Population | % Population |
| Asian | 0 | 0.0% |
| Black / African American | 0 | 0.0% |
| Hawaiian / Pacific | 0 | 0.0% |
| Hispanic or Latino | 24 | 10.0% |
| Native / Alaskan | 16 | 6.7% |
| White / Caucasian | 196 | 82.0% |
| Two or more Races | 14 | 5.9% |
| Some other Race | 13 | 5.4% |
| Total | 239 | 100.0% |
Ancestry in Hinsdale
The most populous ancestries reported in Hinsdale are German (53 | 22.2%), Norwegian (42 | 17.6%), Irish (30 | 12.6%), English (29 | 12.1%), and American (22 | 9.2%), together accounting for 73.6% of all Hinsdale residents.
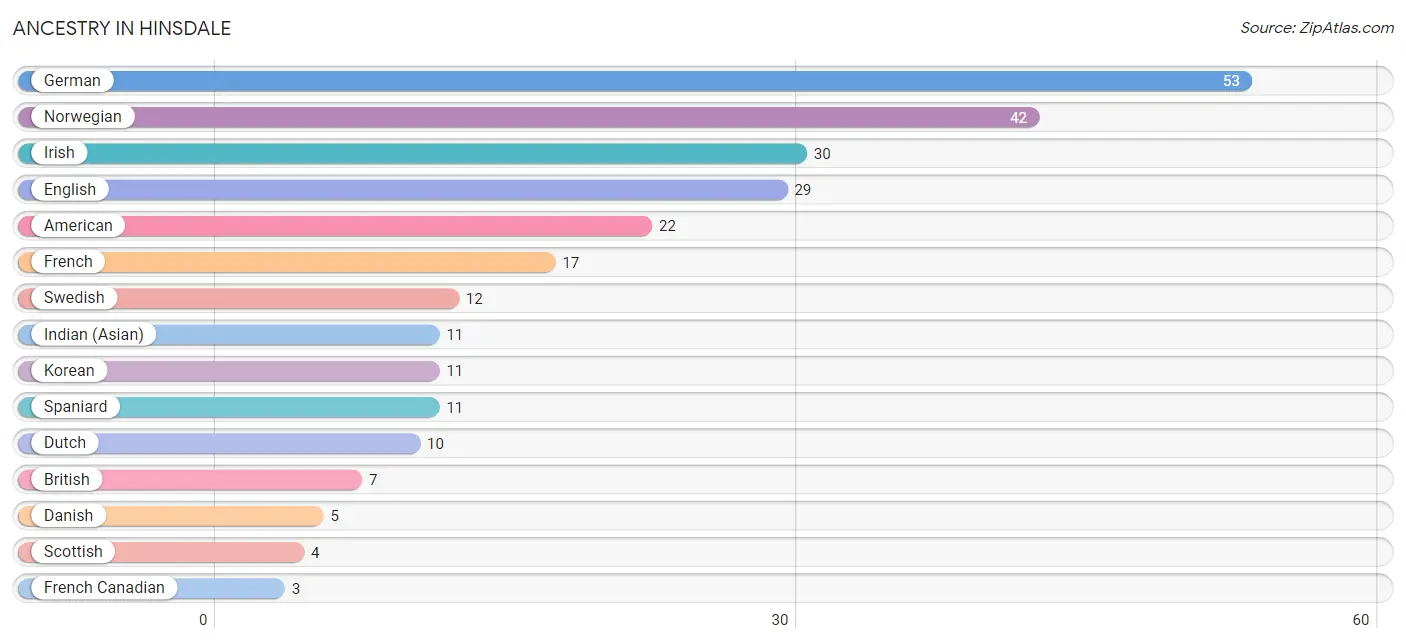
| Ancestry | # Population | % Population |
| American | 22 | 9.2% |
| British | 7 | 2.9% |
| Danish | 5 | 2.1% |
| Dutch | 10 | 4.2% |
| English | 29 | 12.1% |
| European | 2 | 0.8% |
| French | 17 | 7.1% |
| French Canadian | 3 | 1.3% |
| German | 53 | 22.2% |
| Indian (Asian) | 11 | 4.6% |
| Irish | 30 | 12.6% |
| Italian | 2 | 0.8% |
| Korean | 11 | 4.6% |
| Norwegian | 42 | 17.6% |
| Osage | 1 | 0.4% |
| Scandinavian | 2 | 0.8% |
| Scottish | 4 | 1.7% |
| Spaniard | 11 | 4.6% |
| Swedish | 12 | 5.0% | View All 19 Rows |
Immigrants in Hinsdale

| Immigration Origin | # Population | % Population | View All 0 Rows |
Sex and Age in Hinsdale
Sex and Age in Hinsdale
The most populous age groups in Hinsdale are 25 to 29 Years (23 | 17.2%) for men and 20 to 24 Years (14 | 13.3%) for women.
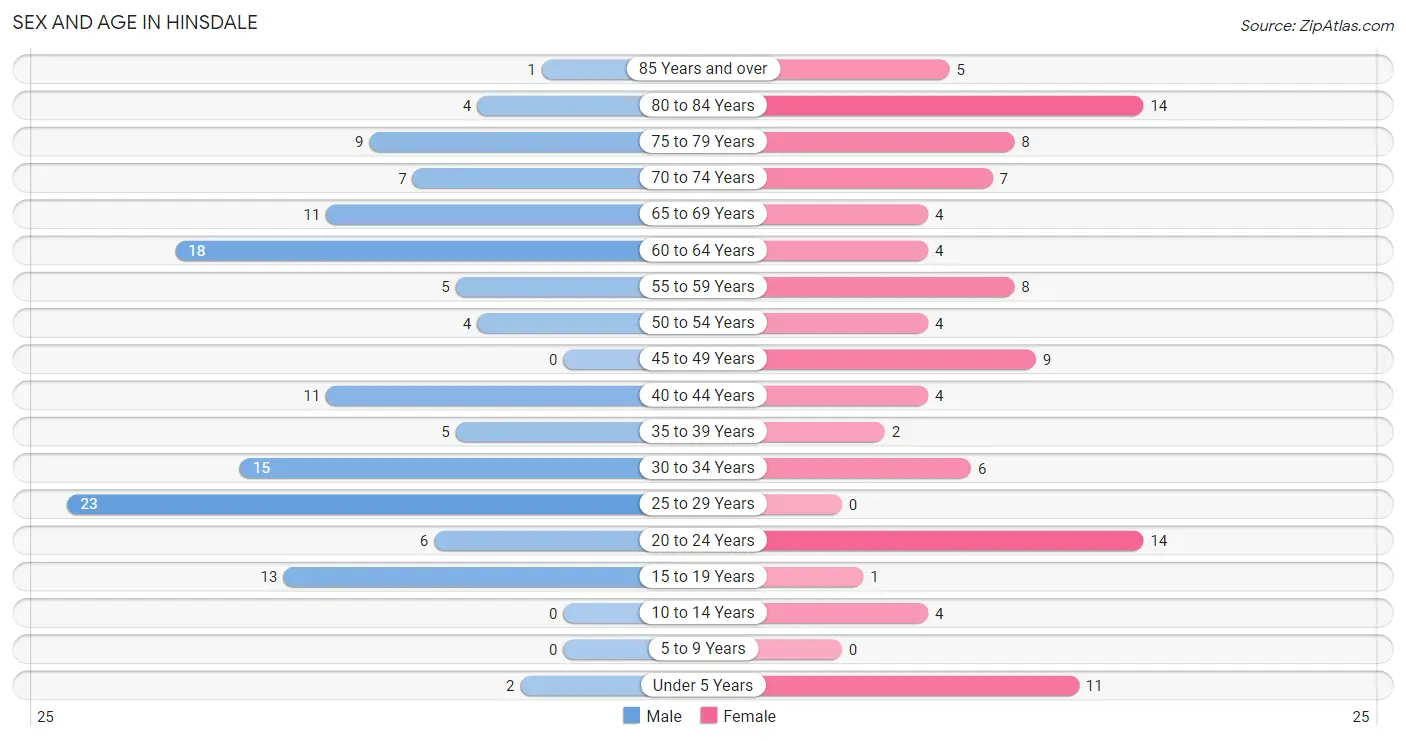
| Age Bracket | Male | Female |
| Under 5 Years | 2 (1.5%) | 11 (10.5%) |
| 5 to 9 Years | 0 (0.0%) | 0 (0.0%) |
| 10 to 14 Years | 0 (0.0%) | 4 (3.8%) |
| 15 to 19 Years | 13 (9.7%) | 1 (0.9%) |
| 20 to 24 Years | 6 (4.5%) | 14 (13.3%) |
| 25 to 29 Years | 23 (17.2%) | 0 (0.0%) |
| 30 to 34 Years | 15 (11.2%) | 6 (5.7%) |
| 35 to 39 Years | 5 (3.7%) | 2 (1.9%) |
| 40 to 44 Years | 11 (8.2%) | 4 (3.8%) |
| 45 to 49 Years | 0 (0.0%) | 9 (8.6%) |
| 50 to 54 Years | 4 (3.0%) | 4 (3.8%) |
| 55 to 59 Years | 5 (3.7%) | 8 (7.6%) |
| 60 to 64 Years | 18 (13.4%) | 4 (3.8%) |
| 65 to 69 Years | 11 (8.2%) | 4 (3.8%) |
| 70 to 74 Years | 7 (5.2%) | 7 (6.7%) |
| 75 to 79 Years | 9 (6.7%) | 8 (7.6%) |
| 80 to 84 Years | 4 (3.0%) | 14 (13.3%) |
| 85 Years and over | 1 (0.7%) | 5 (4.8%) |
| Total | 134 (100.0%) | 105 (100.0%) |
Families and Households in Hinsdale
Median Family Size in Hinsdale
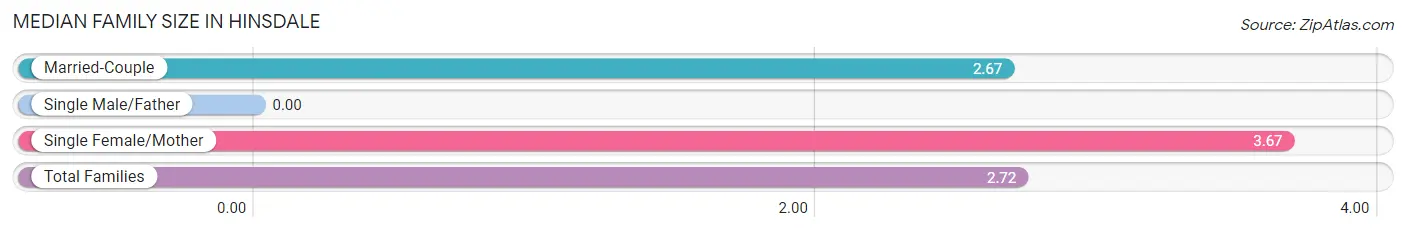
| Family Type | # Families | Family Size |
| Married-Couple | 55 (94.8%) | 2.67 |
| Single Male/Father | 0 (0.0%) | - |
| Single Female/Mother | 3 (5.2%) | 3.67 |
| Total Families | 58 (100.0%) | 2.72 |
Median Household Size in Hinsdale
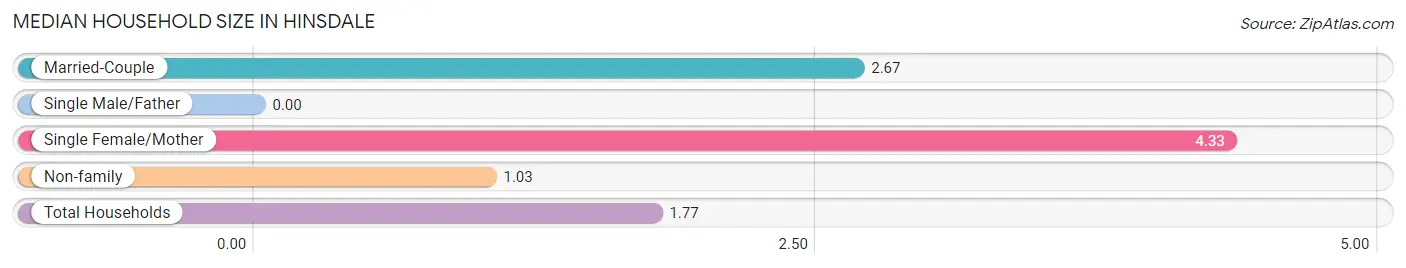
| Household Type | # Households | Household Size |
| Married-Couple | 55 (40.7%) | 2.67 |
| Single Male/Father | 0 (0.0%) | - |
| Single Female/Mother | 3 (2.2%) | 4.33 |
| Non-family | 77 (57.0%) | 1.03 |
| Total Households | 135 (100.0%) | 1.77 |
Household Size by Marriage Status in Hinsdale
Out of a total of 135 households in Hinsdale, 58 (43.0%) are family households, while 77 (57.0%) are nonfamily households. The most numerous type of family households are 2-person households, comprising 44, and the most common type of nonfamily households are 1-person households, comprising 66.
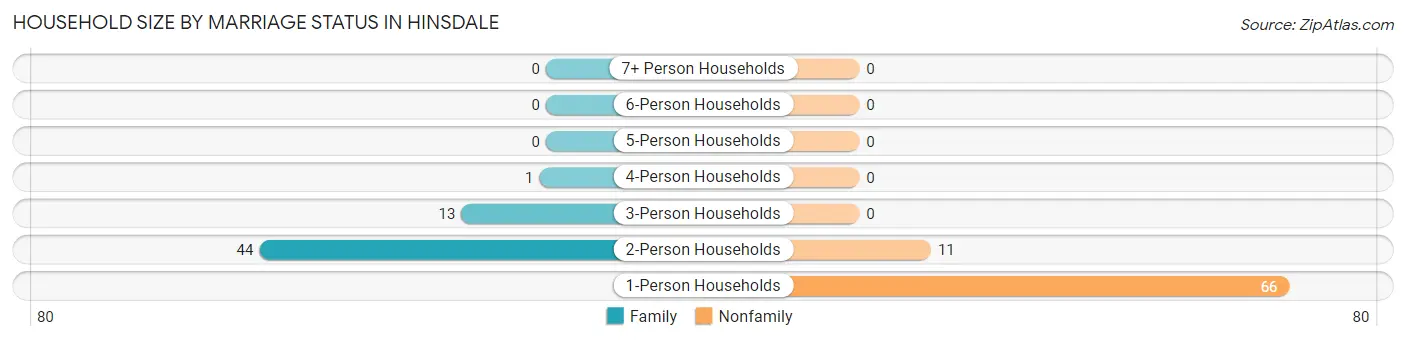
| Household Size | Family Households | Nonfamily Households |
| 1-Person Households | - | 66 (48.9%) |
| 2-Person Households | 44 (32.6%) | 11 (8.2%) |
| 3-Person Households | 13 (9.6%) | 0 (0.0%) |
| 4-Person Households | 1 (0.7%) | 0 (0.0%) |
| 5-Person Households | 0 (0.0%) | 0 (0.0%) |
| 6-Person Households | 0 (0.0%) | 0 (0.0%) |
| 7+ Person Households | 0 (0.0%) | 0 (0.0%) |
| Total | 58 (43.0%) | 77 (57.0%) |
Female Fertility in Hinsdale
Fertility by Age in Hinsdale
Average fertility rate in Hinsdale is 111.0 births per 1,000 women. Women in the age bracket of 20 to 34 years have the highest fertility rate with 200.0 births per 1,000 women. Women in the age bracket of 20 to 34 years acount for 100.0% of all women with births.
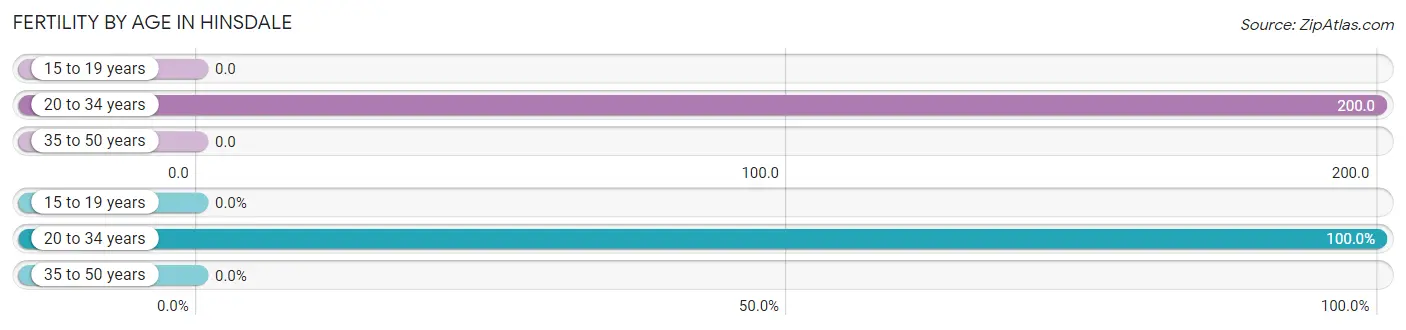
| Age Bracket | Women with Births | Births / 1,000 Women |
| 15 to 19 years | 0 (0.0%) | 0.0 |
| 20 to 34 years | 4 (100.0%) | 200.0 |
| 35 to 50 years | 0 (0.0%) | 0.0 |
| Total | 4 (100.0%) | 111.0 |
Fertility by Age by Marriage Status in Hinsdale
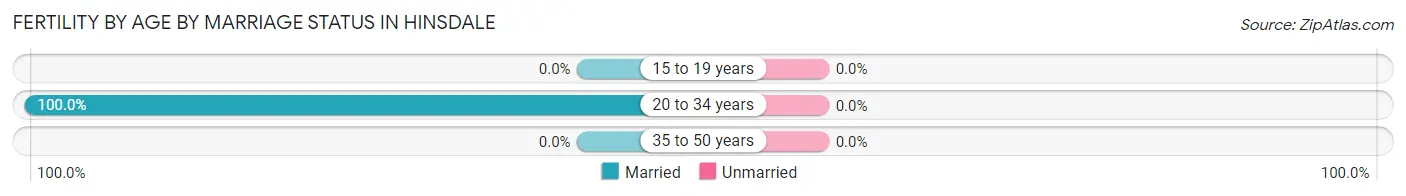
| Age Bracket | Married | Unmarried |
| 15 to 19 years | 0 (0.0%) | 0 (0.0%) |
| 20 to 34 years | 4 (100.0%) | 0 (0.0%) |
| 35 to 50 years | 0 (0.0%) | 0 (0.0%) |
| Total | 4 (100.0%) | 0 (0.0%) |
Fertility by Education in Hinsdale
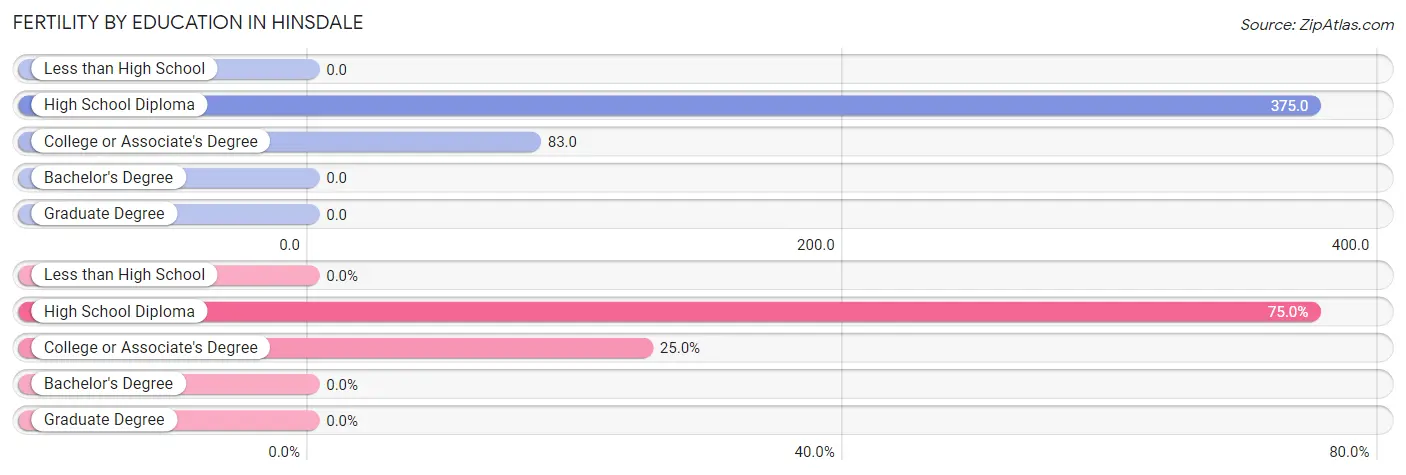
| Educational Attainment | Women with Births | Births / 1,000 Women |
| Less than High School | 0 (0.0%) | 0.0 |
| High School Diploma | 3 (75.0%) | 375.0 |
| College or Associate's Degree | 1 (25.0%) | 83.0 |
| Bachelor's Degree | 0 (0.0%) | 0.0 |
| Graduate Degree | 0 (0.0%) | 0.0 |
| Total | 4 (100.0%) | 111.0 |
Fertility by Education by Marriage Status in Hinsdale
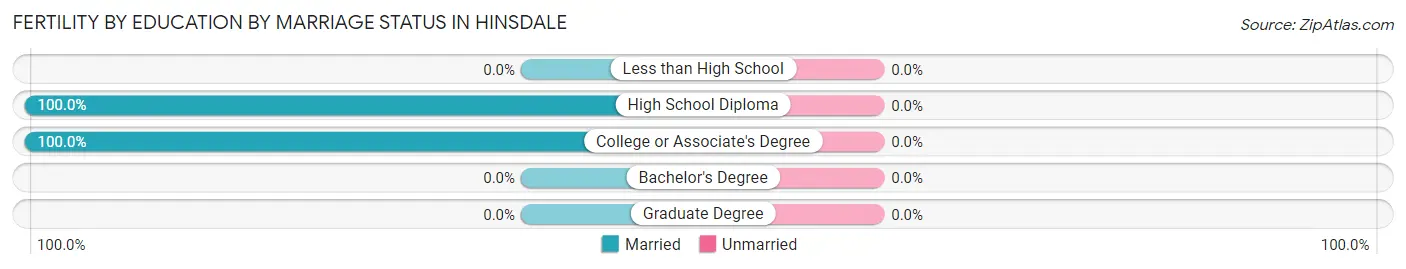
| Educational Attainment | Married | Unmarried |
| Less than High School | 0 (0.0%) | 0 (0.0%) |
| High School Diploma | 3 (100.0%) | 0 (0.0%) |
| College or Associate's Degree | 1 (100.0%) | 0 (0.0%) |
| Bachelor's Degree | 0 (0.0%) | 0 (0.0%) |
| Graduate Degree | 0 (0.0%) | 0 (0.0%) |
| Total | 4 (100.0%) | 0 (0.0%) |
Employment Characteristics in Hinsdale
Employment by Class of Employer in Hinsdale
Among the 139 employed individuals in Hinsdale, private company employees (88 | 63.3%), self-employed (not incorporated) (17 | 12.2%), and local government employees (14 | 10.1%) make up the most common classes of employment.
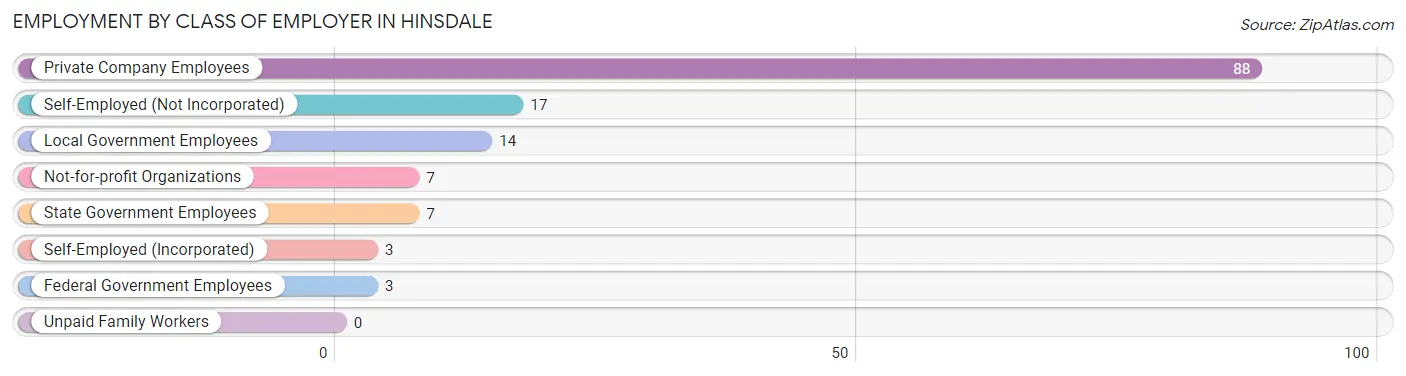
| Employer Class | # Employees | % Employees |
| Private Company Employees | 88 | 63.3% |
| Self-Employed (Incorporated) | 3 | 2.2% |
| Self-Employed (Not Incorporated) | 17 | 12.2% |
| Not-for-profit Organizations | 7 | 5.0% |
| Local Government Employees | 14 | 10.1% |
| State Government Employees | 7 | 5.0% |
| Federal Government Employees | 3 | 2.2% |
| Unpaid Family Workers | 0 | 0.0% |
| Total | 139 | 100.0% |
Employment Status by Age in Hinsdale
According to the labor force statistics for Hinsdale, out of the total population over 16 years of age (219), 65.3% or 143 individuals are in the labor force, with 2.8% or 4 of them unemployed. The age group with the highest labor force participation rate is 20 to 24 years, with 100.0% or 20 individuals in the labor force. Within the labor force, the 60 to 64 years age range has the highest percentage of unemployed individuals, with 26.7% or 4 of them being unemployed.
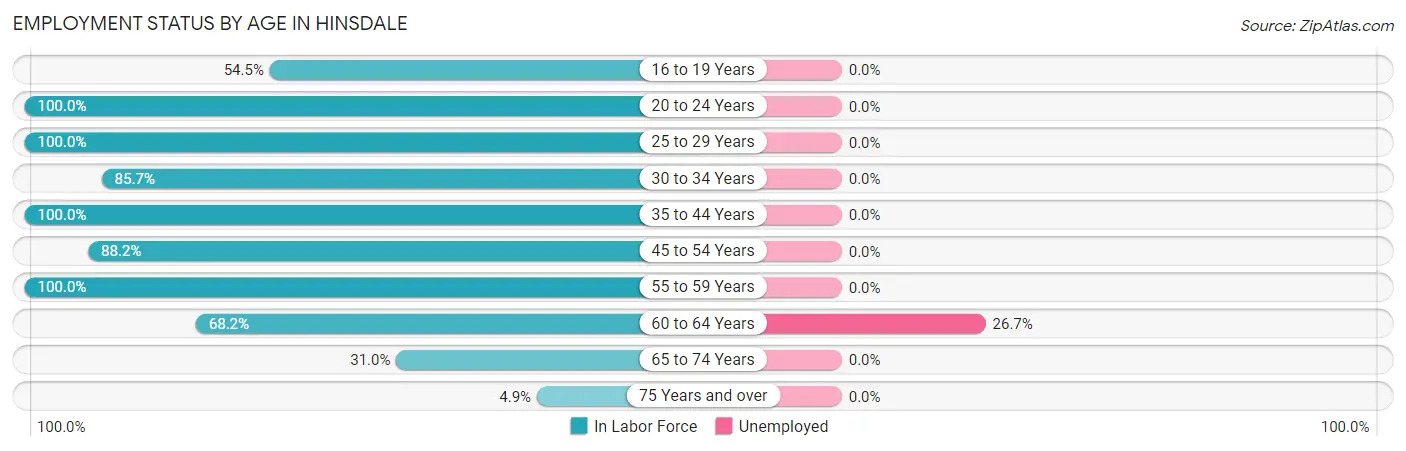
| Age Bracket | In Labor Force | Unemployed |
| 16 to 19 Years | 6 (54.5%) | 0 (0.0%) |
| 20 to 24 Years | 20 (100.0%) | 0 (0.0%) |
| 25 to 29 Years | 23 (100.0%) | 0 (0.0%) |
| 30 to 34 Years | 18 (85.7%) | 0 (0.0%) |
| 35 to 44 Years | 22 (100.0%) | 0 (0.0%) |
| 45 to 54 Years | 15 (88.2%) | 0 (0.0%) |
| 55 to 59 Years | 13 (100.0%) | 0 (0.0%) |
| 60 to 64 Years | 15 (68.2%) | 4 (26.7%) |
| 65 to 74 Years | 9 (31.0%) | 0 (0.0%) |
| 75 Years and over | 2 (4.9%) | 0 (0.0%) |
| Total | 143 (65.3%) | 4 (2.8%) |
Employment Status by Educational Attainment in Hinsdale
According to labor force statistics for Hinsdale, 89.8% of individuals (106) out of the total population between 25 and 64 years of age (118) are in the labor force, with 3.8% or 4 of them being unemployed. The group with the highest labor force participation rate are those with the educational attainment of college / associate degree, with 100.0% or 41 individuals in the labor force. Within the labor force, individuals with bachelor's degree or higher education have the highest percentage of unemployment, with 12.1% or 4 of them being unemployed.
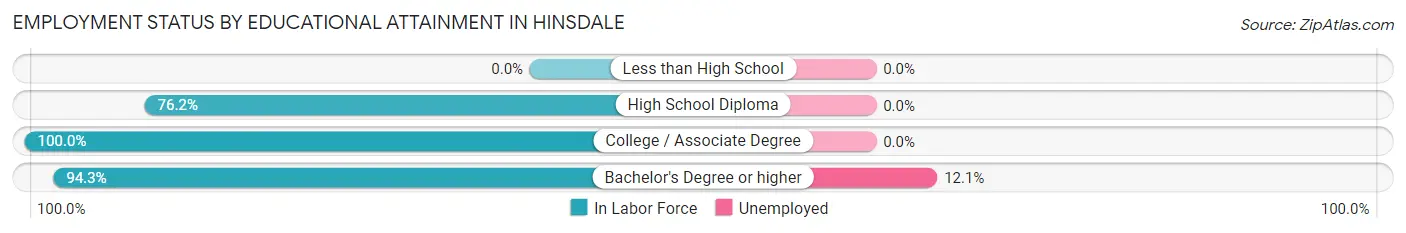
| Educational Attainment | In Labor Force | Unemployed |
| Less than High School | 0 (0.0%) | 0 (0.0%) |
| High School Diploma | 32 (76.2%) | 0 (0.0%) |
| College / Associate Degree | 41 (100.0%) | 0 (0.0%) |
| Bachelor's Degree or higher | 33 (94.3%) | 4 (12.1%) |
| Total | 106 (89.8%) | 4 (3.8%) |
Employment Occupations by Sex in Hinsdale
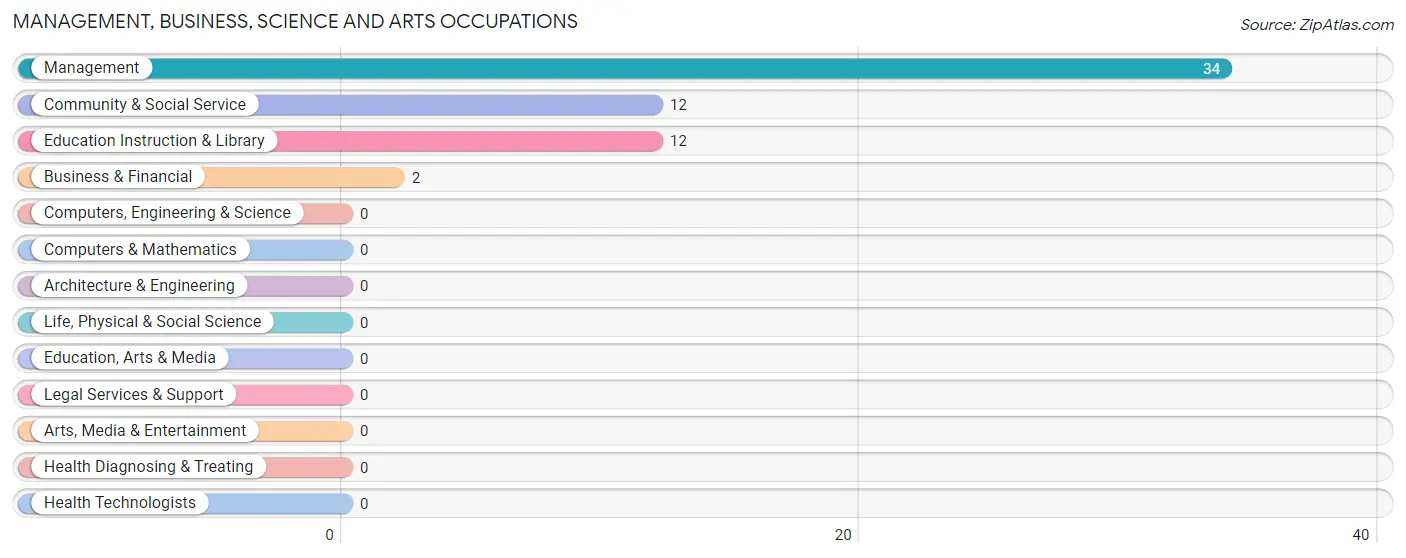
Management, Business, Science and Arts Occupations
The most common Management, Business, Science and Arts occupations in Hinsdale are Management (34 | 24.5%), Community & Social Service (12 | 8.6%), Education Instruction & Library (12 | 8.6%), and Business & Financial (2 | 1.4%).
Management, Business, Science and Arts Occupations by Sex
Within the Management, Business, Science and Arts occupations in Hinsdale, the most male-oriented occupations are Management (67.6%), Community & Social Service (58.3%), and Education Instruction & Library (58.3%), while the most female-oriented occupations are Business & Financial (100.0%), Community & Social Service (41.7%), and Education Instruction & Library (41.7%).
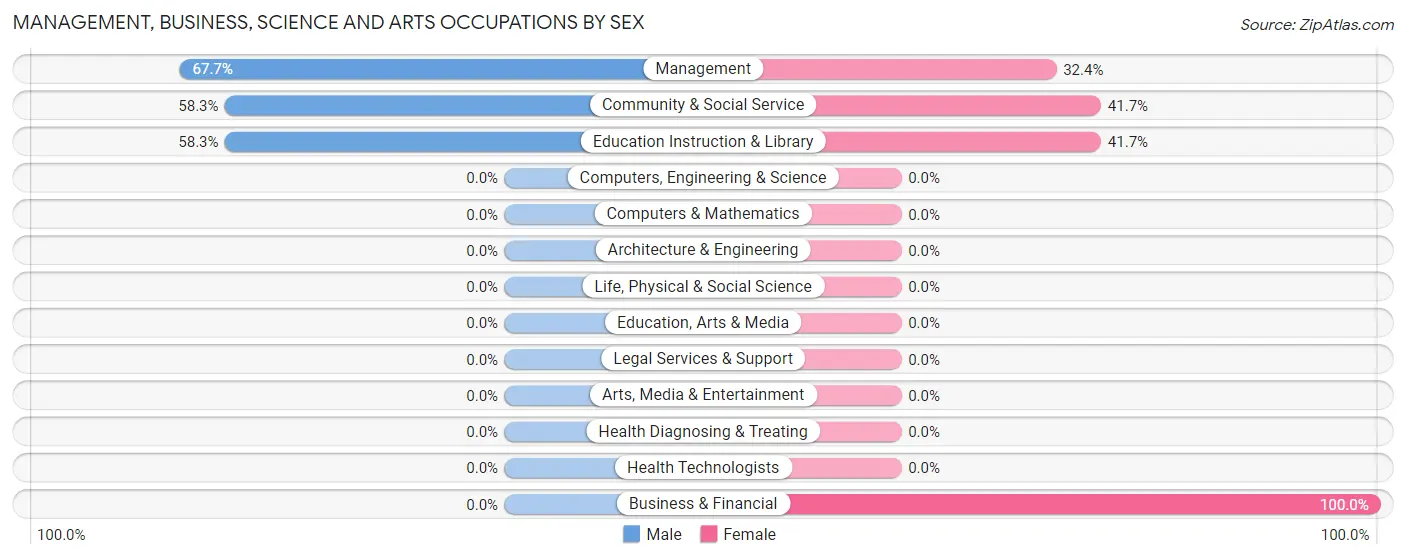
| Occupation | Male | Female |
| Management | 23 (67.6%) | 11 (32.4%) |
| Business & Financial | 0 (0.0%) | 2 (100.0%) |
| Computers, Engineering & Science | 0 (0.0%) | 0 (0.0%) |
| Computers & Mathematics | 0 (0.0%) | 0 (0.0%) |
| Architecture & Engineering | 0 (0.0%) | 0 (0.0%) |
| Life, Physical & Social Science | 0 (0.0%) | 0 (0.0%) |
| Community & Social Service | 7 (58.3%) | 5 (41.7%) |
| Education, Arts & Media | 0 (0.0%) | 0 (0.0%) |
| Legal Services & Support | 0 (0.0%) | 0 (0.0%) |
| Education Instruction & Library | 7 (58.3%) | 5 (41.7%) |
| Arts, Media & Entertainment | 0 (0.0%) | 0 (0.0%) |
| Health Diagnosing & Treating | 0 (0.0%) | 0 (0.0%) |
| Health Technologists | 0 (0.0%) | 0 (0.0%) |
| Total (Category) | 30 (62.5%) | 18 (37.5%) |
| Total (Overall) | 92 (66.2%) | 47 (33.8%) |
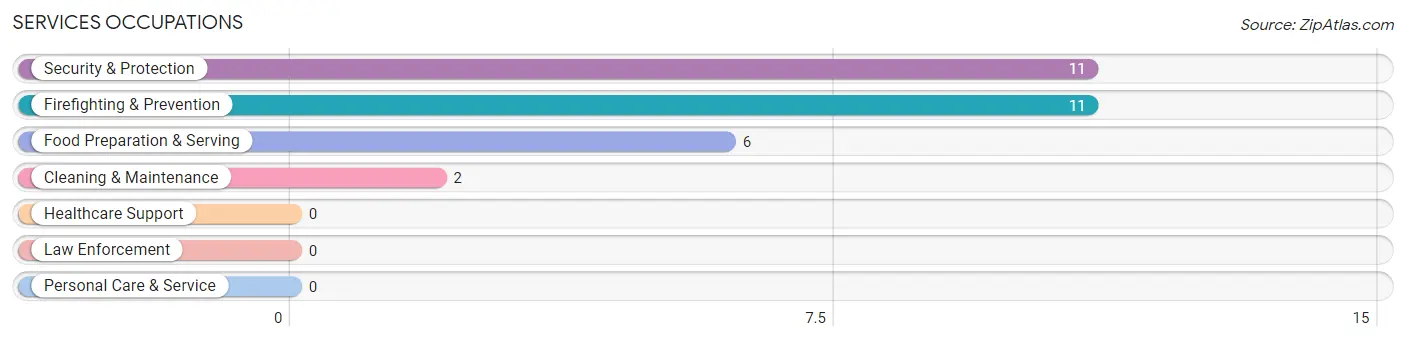
Services Occupations
The most common Services occupations in Hinsdale are Security & Protection (11 | 7.9%), Firefighting & Prevention (11 | 7.9%), Food Preparation & Serving (6 | 4.3%), and Cleaning & Maintenance (2 | 1.4%).
Services Occupations by Sex
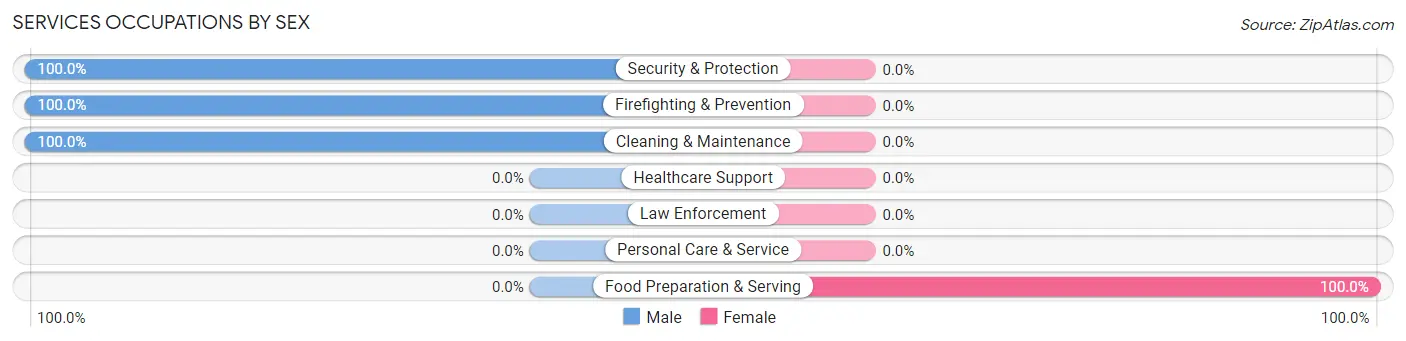
| Occupation | Male | Female |
| Healthcare Support | 0 (0.0%) | 0 (0.0%) |
| Security & Protection | 11 (100.0%) | 0 (0.0%) |
| Firefighting & Prevention | 11 (100.0%) | 0 (0.0%) |
| Law Enforcement | 0 (0.0%) | 0 (0.0%) |
| Food Preparation & Serving | 0 (0.0%) | 6 (100.0%) |
| Cleaning & Maintenance | 2 (100.0%) | 0 (0.0%) |
| Personal Care & Service | 0 (0.0%) | 0 (0.0%) |
| Total (Category) | 13 (68.4%) | 6 (31.6%) |
| Total (Overall) | 92 (66.2%) | 47 (33.8%) |
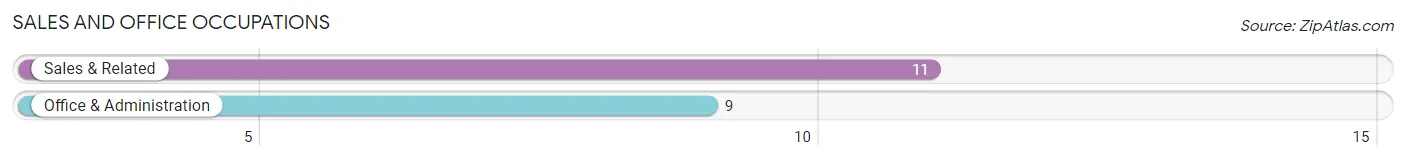
Sales and Office Occupations
The most common Sales and Office occupations in Hinsdale are Sales & Related (11 | 7.9%), and Office & Administration (9 | 6.5%).
Sales and Office Occupations by Sex
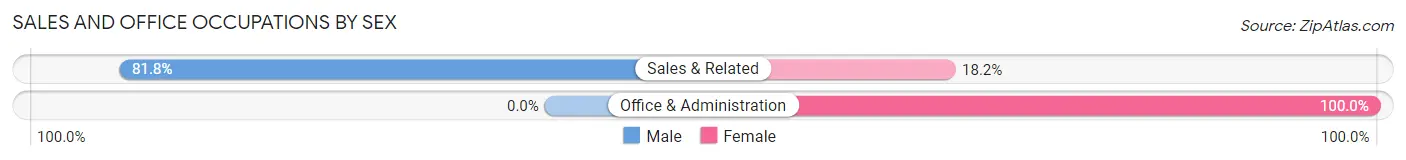
| Occupation | Male | Female |
| Sales & Related | 9 (81.8%) | 2 (18.2%) |
| Office & Administration | 0 (0.0%) | 9 (100.0%) |
| Total (Category) | 9 (45.0%) | 11 (55.0%) |
| Total (Overall) | 92 (66.2%) | 47 (33.8%) |
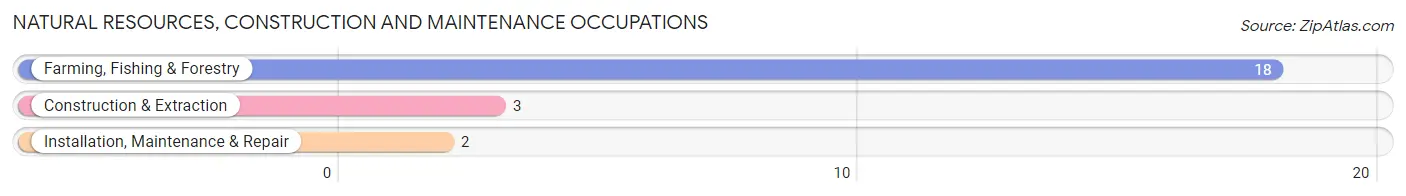
Natural Resources, Construction and Maintenance Occupations
The most common Natural Resources, Construction and Maintenance occupations in Hinsdale are Farming, Fishing & Forestry (18 | 13.0%), Construction & Extraction (3 | 2.2%), and Installation, Maintenance & Repair (2 | 1.4%).
Natural Resources, Construction and Maintenance Occupations by Sex
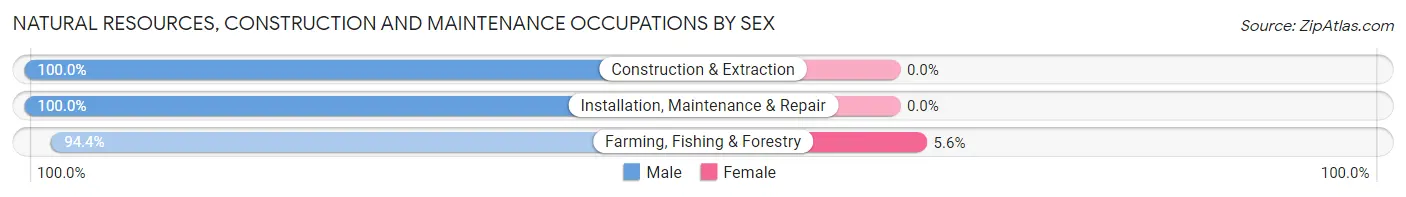
| Occupation | Male | Female |
| Farming, Fishing & Forestry | 17 (94.4%) | 1 (5.6%) |
| Construction & Extraction | 3 (100.0%) | 0 (0.0%) |
| Installation, Maintenance & Repair | 2 (100.0%) | 0 (0.0%) |
| Total (Category) | 22 (95.7%) | 1 (4.3%) |
| Total (Overall) | 92 (66.2%) | 47 (33.8%) |
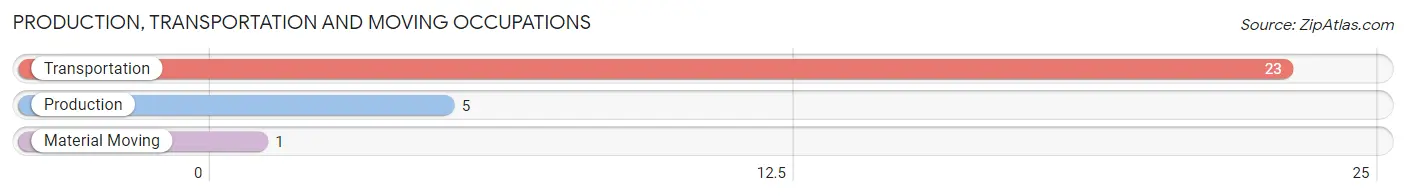
Production, Transportation and Moving Occupations
The most common Production, Transportation and Moving occupations in Hinsdale are Transportation (23 | 16.6%), Production (5 | 3.6%), and Material Moving (1 | 0.7%).
Production, Transportation and Moving Occupations by Sex
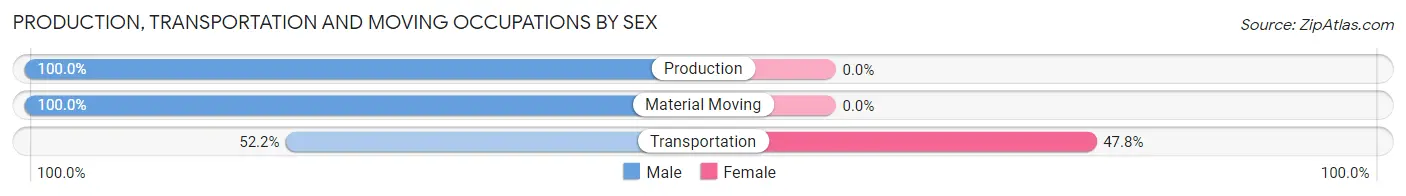
| Occupation | Male | Female |
| Production | 5 (100.0%) | 0 (0.0%) |
| Transportation | 12 (52.2%) | 11 (47.8%) |
| Material Moving | 1 (100.0%) | 0 (0.0%) |
| Total (Category) | 18 (62.1%) | 11 (37.9%) |
| Total (Overall) | 92 (66.2%) | 47 (33.8%) |
Employment Industries by Sex in Hinsdale
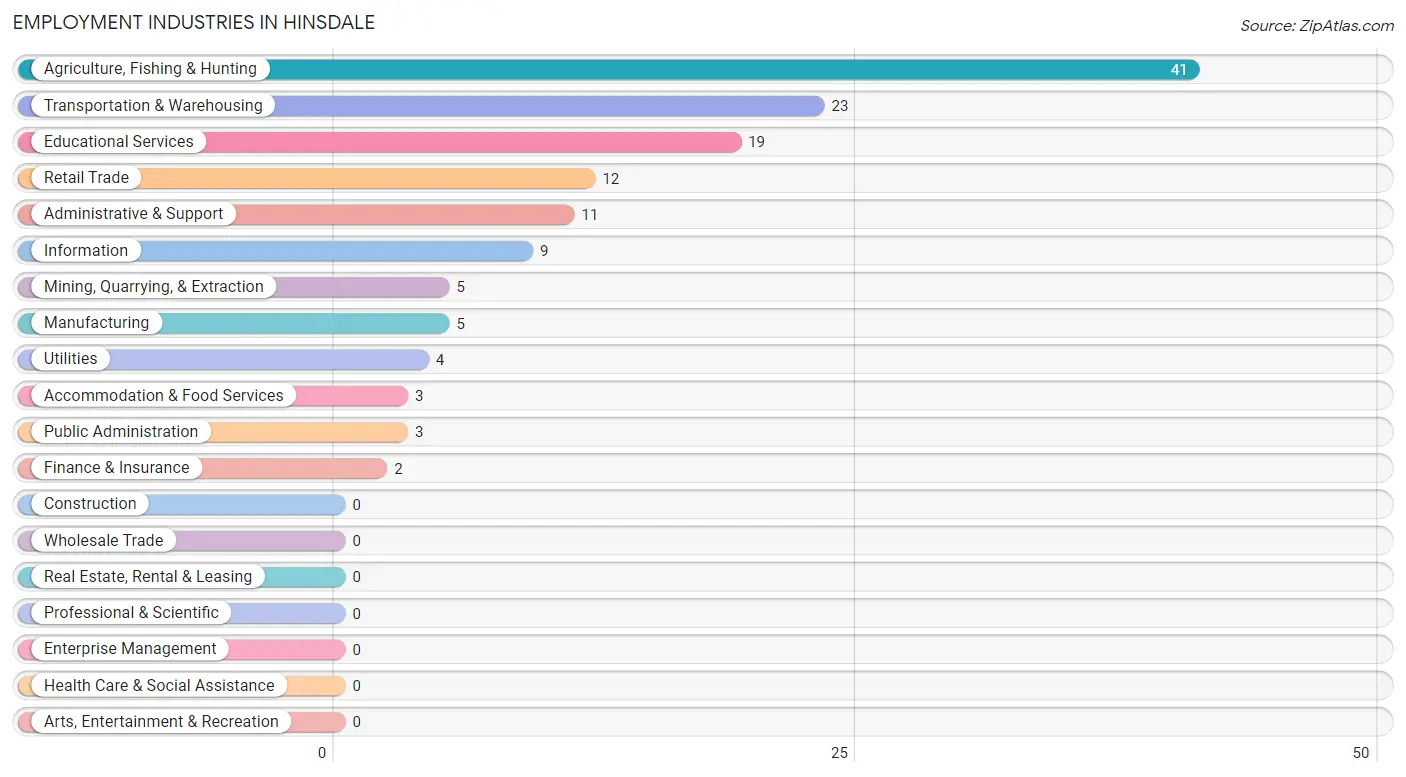
Employment Industries in Hinsdale
The major employment industries in Hinsdale include Agriculture, Fishing & Hunting (41 | 29.5%), Transportation & Warehousing (23 | 16.6%), Educational Services (19 | 13.7%), Retail Trade (12 | 8.6%), and Administrative & Support (11 | 7.9%).
Employment Industries by Sex in Hinsdale
The Hinsdale industries that see more men than women are Mining, Quarrying, & Extraction (100.0%), Manufacturing (100.0%), and Administrative & Support (100.0%), whereas the industries that tend to have a higher number of women are Utilities (100.0%), Information (100.0%), and Finance & Insurance (100.0%).
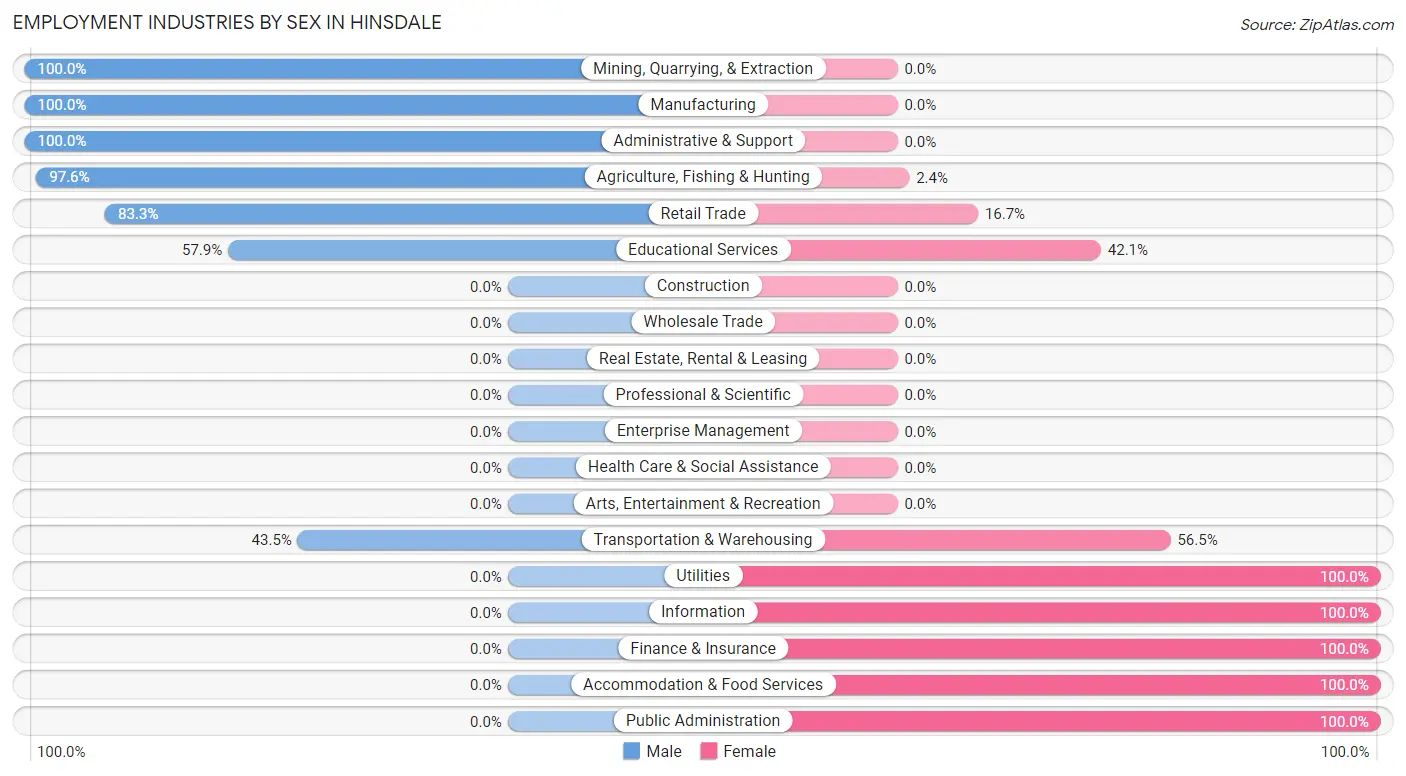
| Industry | Male | Female |
| Agriculture, Fishing & Hunting | 40 (97.6%) | 1 (2.4%) |
| Mining, Quarrying, & Extraction | 5 (100.0%) | 0 (0.0%) |
| Construction | 0 (0.0%) | 0 (0.0%) |
| Manufacturing | 5 (100.0%) | 0 (0.0%) |
| Wholesale Trade | 0 (0.0%) | 0 (0.0%) |
| Retail Trade | 10 (83.3%) | 2 (16.7%) |
| Transportation & Warehousing | 10 (43.5%) | 13 (56.5%) |
| Utilities | 0 (0.0%) | 4 (100.0%) |
| Information | 0 (0.0%) | 9 (100.0%) |
| Finance & Insurance | 0 (0.0%) | 2 (100.0%) |
| Real Estate, Rental & Leasing | 0 (0.0%) | 0 (0.0%) |
| Professional & Scientific | 0 (0.0%) | 0 (0.0%) |
| Enterprise Management | 0 (0.0%) | 0 (0.0%) |
| Administrative & Support | 11 (100.0%) | 0 (0.0%) |
| Educational Services | 11 (57.9%) | 8 (42.1%) |
| Health Care & Social Assistance | 0 (0.0%) | 0 (0.0%) |
| Arts, Entertainment & Recreation | 0 (0.0%) | 0 (0.0%) |
| Accommodation & Food Services | 0 (0.0%) | 3 (100.0%) |
| Public Administration | 0 (0.0%) | 3 (100.0%) |
| Total | 92 (66.2%) | 47 (33.8%) |
Education in Hinsdale
School Enrollment in Hinsdale
The most common levels of schooling among the 35 students in Hinsdale are college / undergraduate (17 | 48.6%), high school (14 | 40.0%), and middle school (4 | 11.4%).
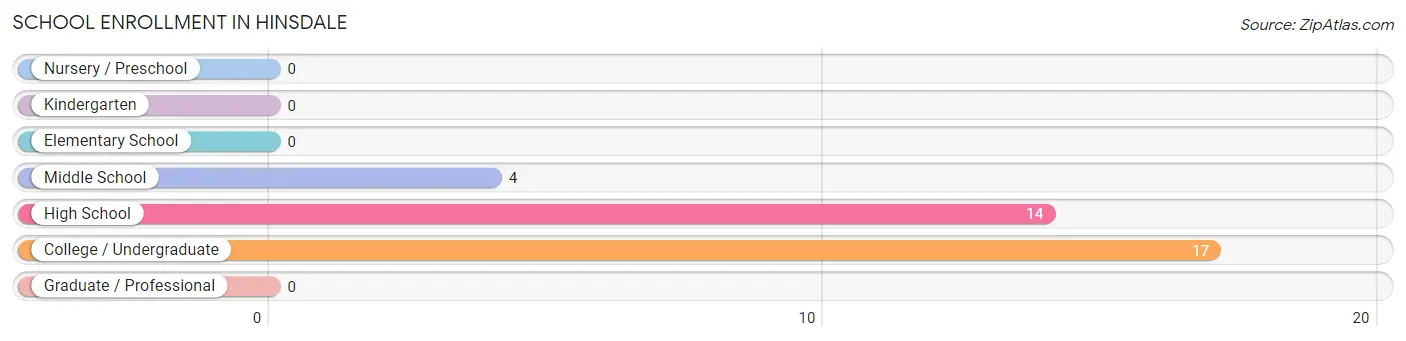
| School Level | # Students | % Students |
| Nursery / Preschool | 0 | 0.0% |
| Kindergarten | 0 | 0.0% |
| Elementary School | 0 | 0.0% |
| Middle School | 4 | 11.4% |
| High School | 14 | 40.0% |
| College / Undergraduate | 17 | 48.6% |
| Graduate / Professional | 0 | 0.0% |
| Total | 35 | 100.0% |
School Enrollment by Age by Funding Source in Hinsdale
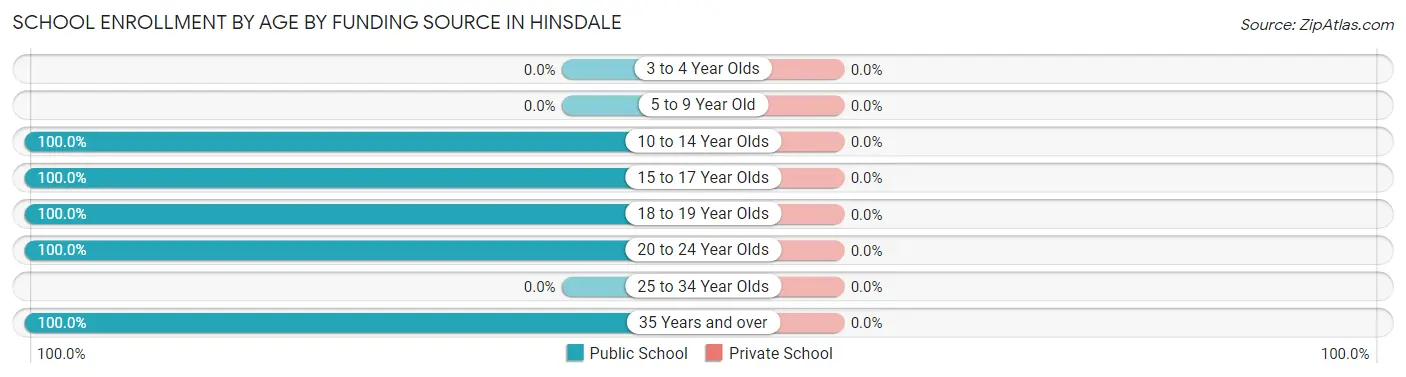
| Age Bracket | Public School | Private School |
| 3 to 4 Year Olds | 0 (0.0%) | 0 (0.0%) |
| 5 to 9 Year Old | 0 (0.0%) | 0 (0.0%) |
| 10 to 14 Year Olds | 4 (100.0%) | 0 (0.0%) |
| 15 to 17 Year Olds | 8 (100.0%) | 0 (0.0%) |
| 18 to 19 Year Olds | 6 (100.0%) | 0 (0.0%) |
| 20 to 24 Year Olds | 15 (100.0%) | 0 (0.0%) |
| 25 to 34 Year Olds | 0 (0.0%) | 0 (0.0%) |
| 35 Years and over | 2 (100.0%) | 0 (0.0%) |
| Total | 35 (100.0%) | 0 (0.0%) |
Educational Attainment by Field of Study in Hinsdale
Business (12 | 21.4%), education (10 | 17.9%), arts & humanities (9 | 16.1%), science & technology (7 | 12.5%), and communications (7 | 12.5%) are the most common fields of study among 56 individuals in Hinsdale who have obtained a bachelor's degree or higher.
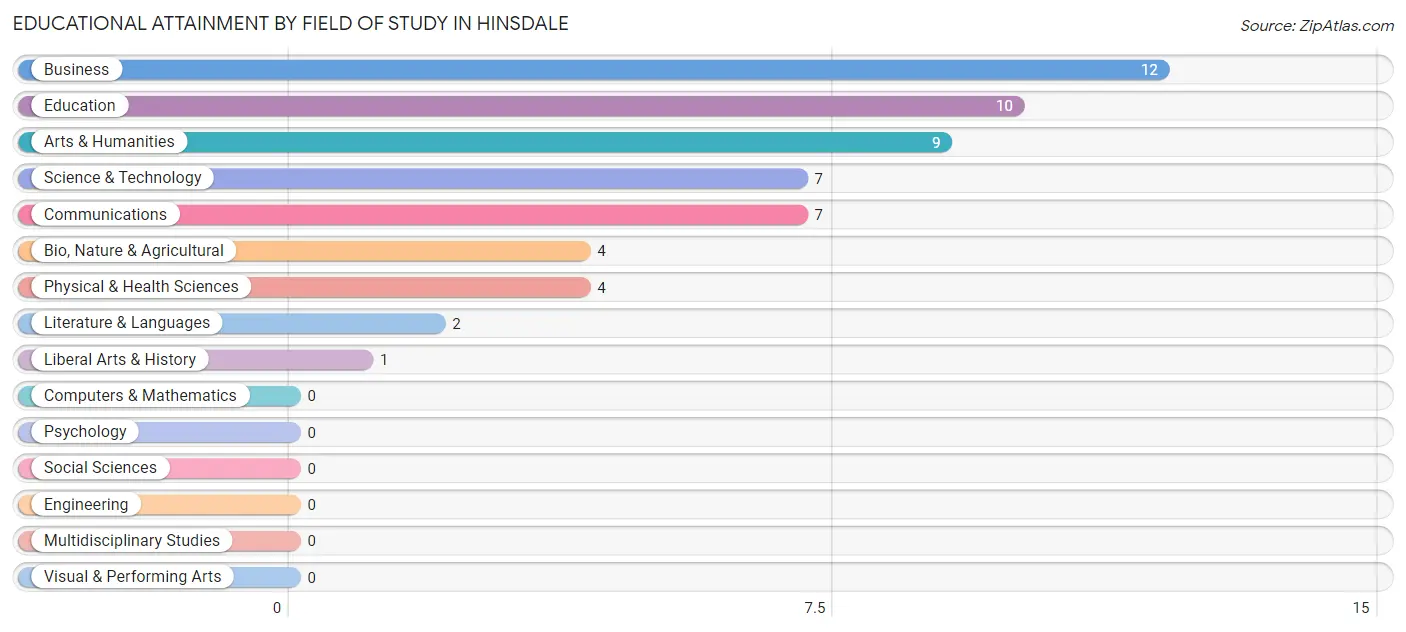
| Field of Study | # Graduates | % Graduates |
| Computers & Mathematics | 0 | 0.0% |
| Bio, Nature & Agricultural | 4 | 7.1% |
| Physical & Health Sciences | 4 | 7.1% |
| Psychology | 0 | 0.0% |
| Social Sciences | 0 | 0.0% |
| Engineering | 0 | 0.0% |
| Multidisciplinary Studies | 0 | 0.0% |
| Science & Technology | 7 | 12.5% |
| Business | 12 | 21.4% |
| Education | 10 | 17.9% |
| Literature & Languages | 2 | 3.6% |
| Liberal Arts & History | 1 | 1.8% |
| Visual & Performing Arts | 0 | 0.0% |
| Communications | 7 | 12.5% |
| Arts & Humanities | 9 | 16.1% |
| Total | 56 | 100.0% |
Transportation & Commute in Hinsdale
Vehicle Availability by Sex in Hinsdale
The most prevalent vehicle ownership categories in Hinsdale are males with 1 vehicle (37, accounting for 40.2%) and females with 1 vehicle (3, making up 78.7%).
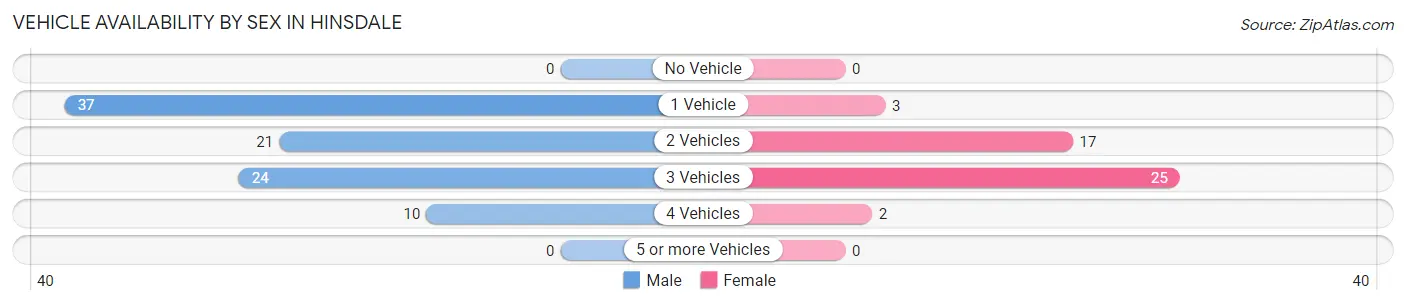
| Vehicles Available | Male | Female |
| No Vehicle | 0 (0.0%) | 0 (0.0%) |
| 1 Vehicle | 37 (40.2%) | 3 (6.4%) |
| 2 Vehicles | 21 (22.8%) | 17 (36.2%) |
| 3 Vehicles | 24 (26.1%) | 25 (53.2%) |
| 4 Vehicles | 10 (10.9%) | 2 (4.3%) |
| 5 or more Vehicles | 0 (0.0%) | 0 (0.0%) |
| Total | 92 (100.0%) | 47 (100.0%) |
Commute Time in Hinsdale
The most frequently occuring commute durations in Hinsdale are 30 to 34 minutes (56 commuters, 41.2%), 5 to 9 minutes (19 commuters, 14.0%), and 10 to 14 minutes (15 commuters, 11.0%).
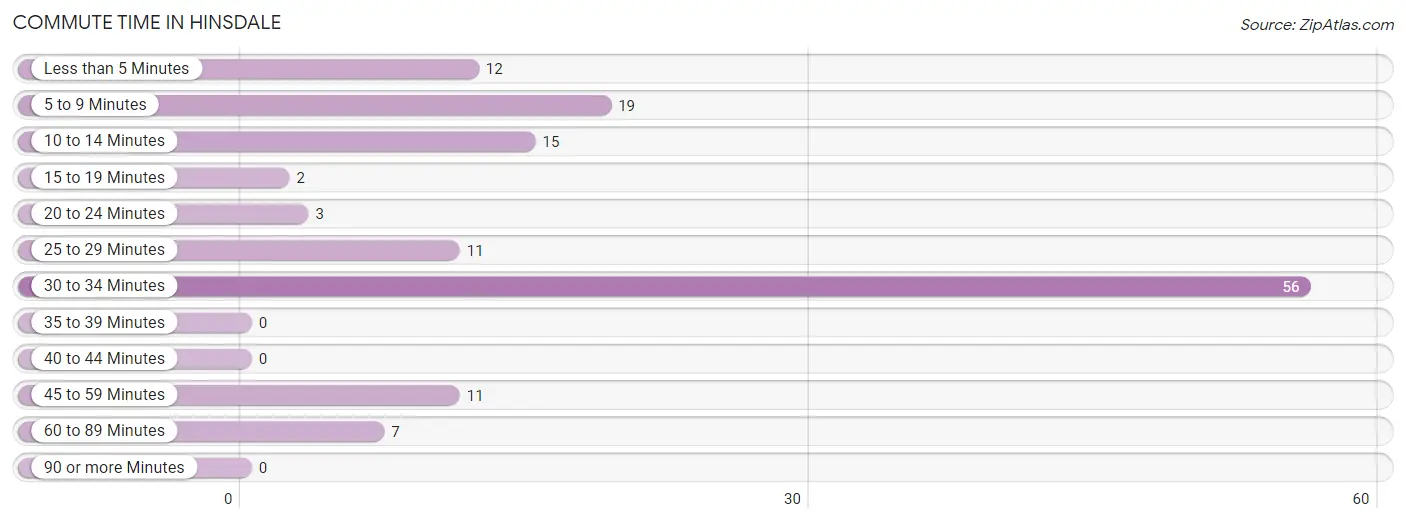
| Commute Time | # Commuters | % Commuters |
| Less than 5 Minutes | 12 | 8.8% |
| 5 to 9 Minutes | 19 | 14.0% |
| 10 to 14 Minutes | 15 | 11.0% |
| 15 to 19 Minutes | 2 | 1.5% |
| 20 to 24 Minutes | 3 | 2.2% |
| 25 to 29 Minutes | 11 | 8.1% |
| 30 to 34 Minutes | 56 | 41.2% |
| 35 to 39 Minutes | 0 | 0.0% |
| 40 to 44 Minutes | 0 | 0.0% |
| 45 to 59 Minutes | 11 | 8.1% |
| 60 to 89 Minutes | 7 | 5.1% |
| 90 or more Minutes | 0 | 0.0% |
Commute Time by Sex in Hinsdale
The most common commute times in Hinsdale are 30 to 34 minutes (37 commuters, 41.6%) for males and 30 to 34 minutes (19 commuters, 40.4%) for females.
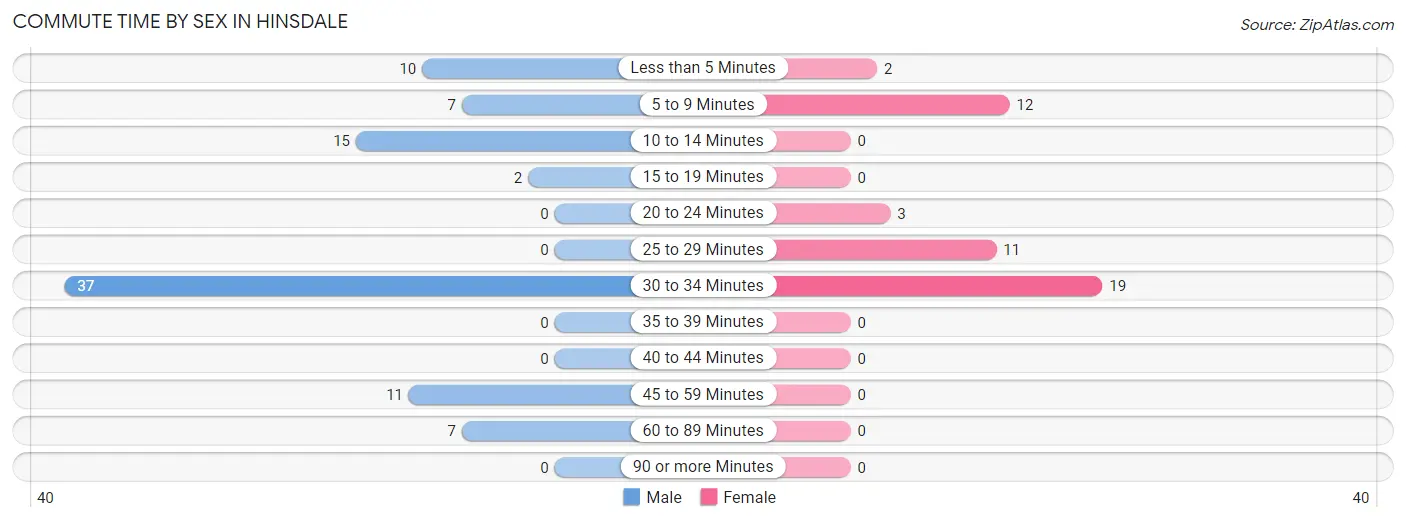
| Commute Time | Male | Female |
| Less than 5 Minutes | 10 (11.2%) | 2 (4.3%) |
| 5 to 9 Minutes | 7 (7.9%) | 12 (25.5%) |
| 10 to 14 Minutes | 15 (16.9%) | 0 (0.0%) |
| 15 to 19 Minutes | 2 (2.2%) | 0 (0.0%) |
| 20 to 24 Minutes | 0 (0.0%) | 3 (6.4%) |
| 25 to 29 Minutes | 0 (0.0%) | 11 (23.4%) |
| 30 to 34 Minutes | 37 (41.6%) | 19 (40.4%) |
| 35 to 39 Minutes | 0 (0.0%) | 0 (0.0%) |
| 40 to 44 Minutes | 0 (0.0%) | 0 (0.0%) |
| 45 to 59 Minutes | 11 (12.4%) | 0 (0.0%) |
| 60 to 89 Minutes | 7 (7.9%) | 0 (0.0%) |
| 90 or more Minutes | 0 (0.0%) | 0 (0.0%) |
Time of Departure to Work by Sex in Hinsdale
The most frequent times of departure to work in Hinsdale are 8:00 AM to 8:29 AM (23, 25.8%) for males and 6:00 AM to 6:29 AM (18, 38.3%) for females.
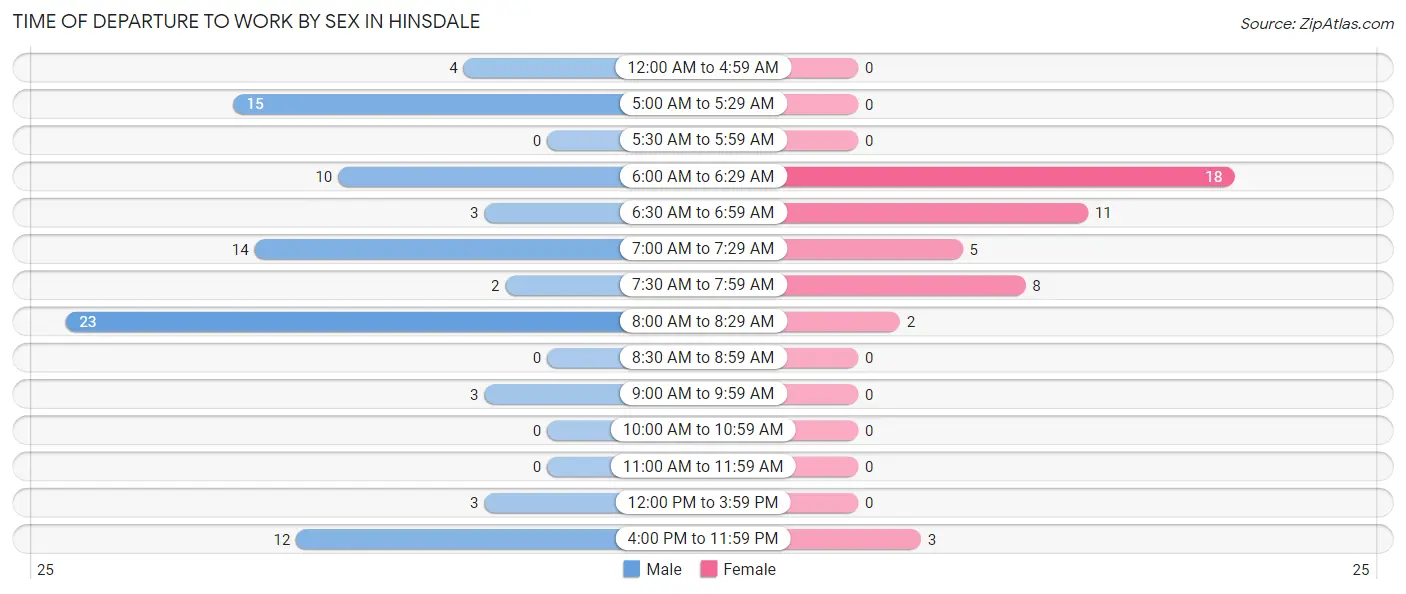
| Time of Departure | Male | Female |
| 12:00 AM to 4:59 AM | 4 (4.5%) | 0 (0.0%) |
| 5:00 AM to 5:29 AM | 15 (16.9%) | 0 (0.0%) |
| 5:30 AM to 5:59 AM | 0 (0.0%) | 0 (0.0%) |
| 6:00 AM to 6:29 AM | 10 (11.2%) | 18 (38.3%) |
| 6:30 AM to 6:59 AM | 3 (3.4%) | 11 (23.4%) |
| 7:00 AM to 7:29 AM | 14 (15.7%) | 5 (10.6%) |
| 7:30 AM to 7:59 AM | 2 (2.2%) | 8 (17.0%) |
| 8:00 AM to 8:29 AM | 23 (25.8%) | 2 (4.3%) |
| 8:30 AM to 8:59 AM | 0 (0.0%) | 0 (0.0%) |
| 9:00 AM to 9:59 AM | 3 (3.4%) | 0 (0.0%) |
| 10:00 AM to 10:59 AM | 0 (0.0%) | 0 (0.0%) |
| 11:00 AM to 11:59 AM | 0 (0.0%) | 0 (0.0%) |
| 12:00 PM to 3:59 PM | 3 (3.4%) | 0 (0.0%) |
| 4:00 PM to 11:59 PM | 12 (13.5%) | 3 (6.4%) |
| Total | 89 (100.0%) | 47 (100.0%) |
Housing Occupancy in Hinsdale
Occupancy by Ownership in Hinsdale
Of the total 135 dwellings in Hinsdale, owner-occupied units account for 97 (71.9%), while renter-occupied units make up 38 (28.1%).
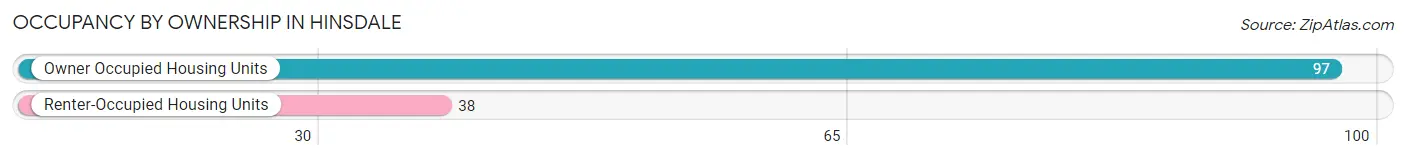
| Occupancy | # Housing Units | % Housing Units |
| Owner Occupied Housing Units | 97 | 71.9% |
| Renter-Occupied Housing Units | 38 | 28.1% |
| Total Occupied Housing Units | 135 | 100.0% |
Occupancy by Household Size in Hinsdale
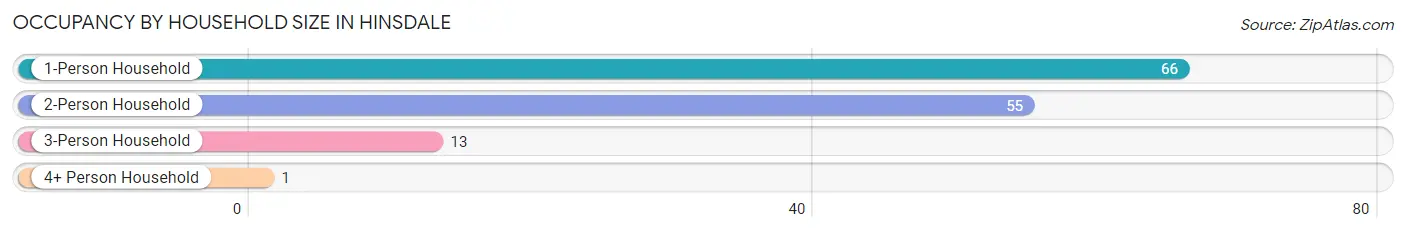
| Household Size | # Housing Units | % Housing Units |
| 1-Person Household | 66 | 48.9% |
| 2-Person Household | 55 | 40.7% |
| 3-Person Household | 13 | 9.6% |
| 4+ Person Household | 1 | 0.7% |
| Total Housing Units | 135 | 100.0% |
Occupancy by Ownership by Household Size in Hinsdale
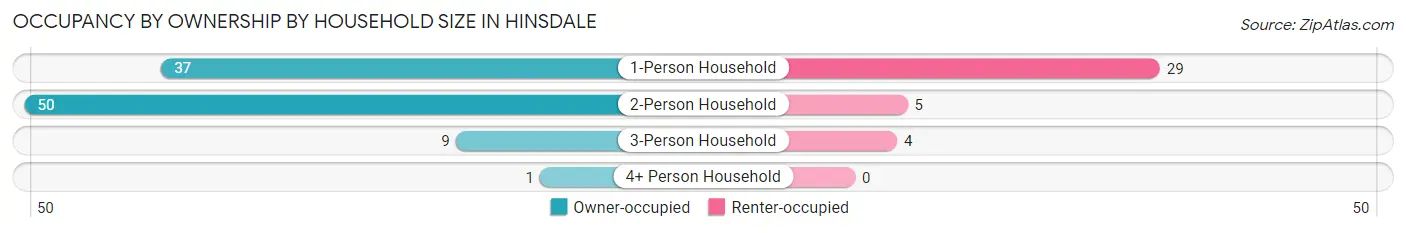
| Household Size | Owner-occupied | Renter-occupied |
| 1-Person Household | 37 (56.1%) | 29 (43.9%) |
| 2-Person Household | 50 (90.9%) | 5 (9.1%) |
| 3-Person Household | 9 (69.2%) | 4 (30.8%) |
| 4+ Person Household | 1 (100.0%) | 0 (0.0%) |
| Total Housing Units | 97 (71.9%) | 38 (28.1%) |
Occupancy by Educational Attainment in Hinsdale
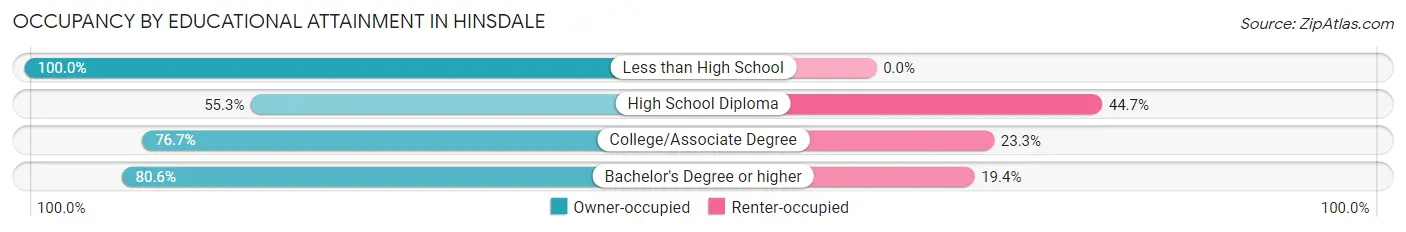
| Household Size | Owner-occupied | Renter-occupied |
| Less than High School | 1 (100.0%) | 0 (0.0%) |
| High School Diploma | 21 (55.3%) | 17 (44.7%) |
| College/Associate Degree | 46 (76.7%) | 14 (23.3%) |
| Bachelor's Degree or higher | 29 (80.6%) | 7 (19.4%) |
Occupancy by Age of Householder in Hinsdale
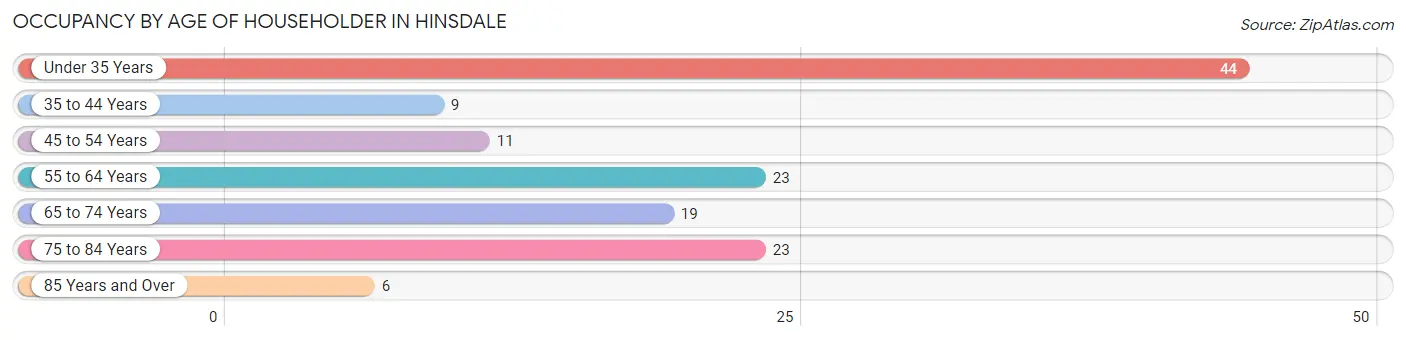
| Age Bracket | # Households | % Households |
| Under 35 Years | 44 | 32.6% |
| 35 to 44 Years | 9 | 6.7% |
| 45 to 54 Years | 11 | 8.2% |
| 55 to 64 Years | 23 | 17.0% |
| 65 to 74 Years | 19 | 14.1% |
| 75 to 84 Years | 23 | 17.0% |
| 85 Years and Over | 6 | 4.4% |
| Total | 135 | 100.0% |
Housing Finances in Hinsdale
Median Income by Occupancy in Hinsdale
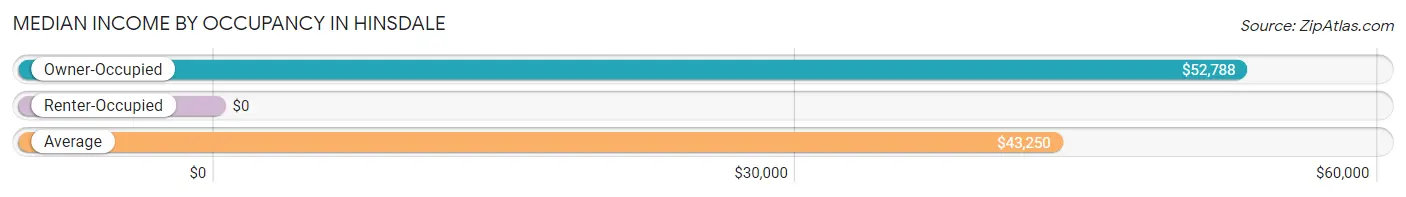
| Occupancy Type | # Households | Median Income |
| Owner-Occupied | 97 (71.9%) | $52,788 |
| Renter-Occupied | 38 (28.1%) | $0 |
| Average | 135 (100.0%) | $43,250 |
Occupancy by Householder Income Bracket in Hinsdale
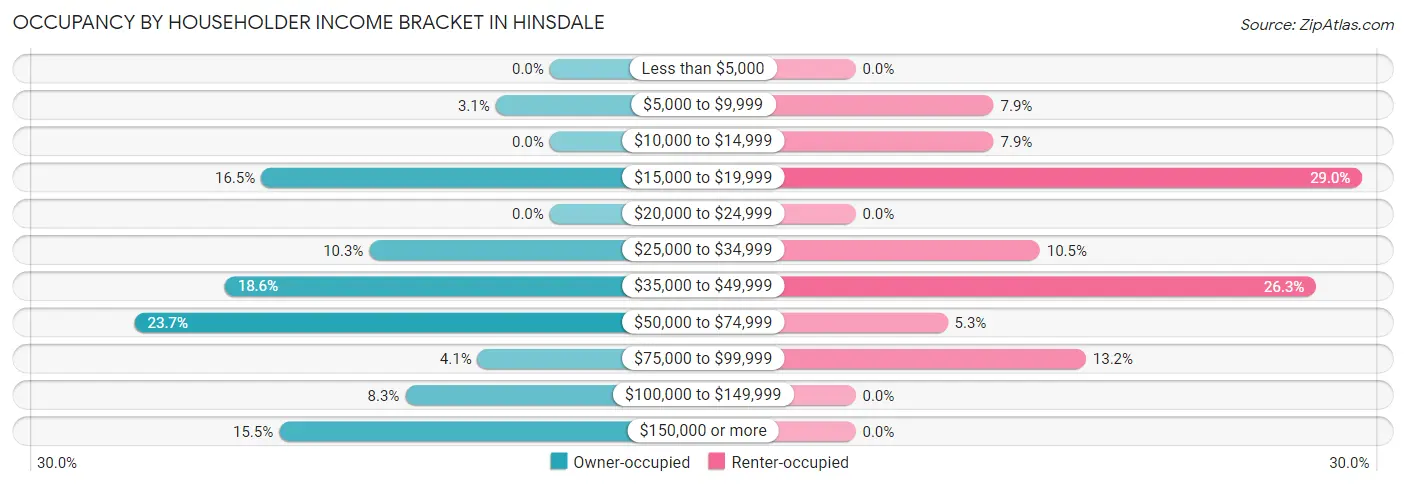
| Income Bracket | Owner-occupied | Renter-occupied |
| Less than $5,000 | 0 (0.0%) | 0 (0.0%) |
| $5,000 to $9,999 | 3 (3.1%) | 3 (7.9%) |
| $10,000 to $14,999 | 0 (0.0%) | 3 (7.9%) |
| $15,000 to $19,999 | 16 (16.5%) | 11 (28.9%) |
| $20,000 to $24,999 | 0 (0.0%) | 0 (0.0%) |
| $25,000 to $34,999 | 10 (10.3%) | 4 (10.5%) |
| $35,000 to $49,999 | 18 (18.6%) | 10 (26.3%) |
| $50,000 to $74,999 | 23 (23.7%) | 2 (5.3%) |
| $75,000 to $99,999 | 4 (4.1%) | 5 (13.2%) |
| $100,000 to $149,999 | 8 (8.3%) | 0 (0.0%) |
| $150,000 or more | 15 (15.5%) | 0 (0.0%) |
| Total | 97 (100.0%) | 38 (100.0%) |
Monthly Housing Cost Tiers in Hinsdale
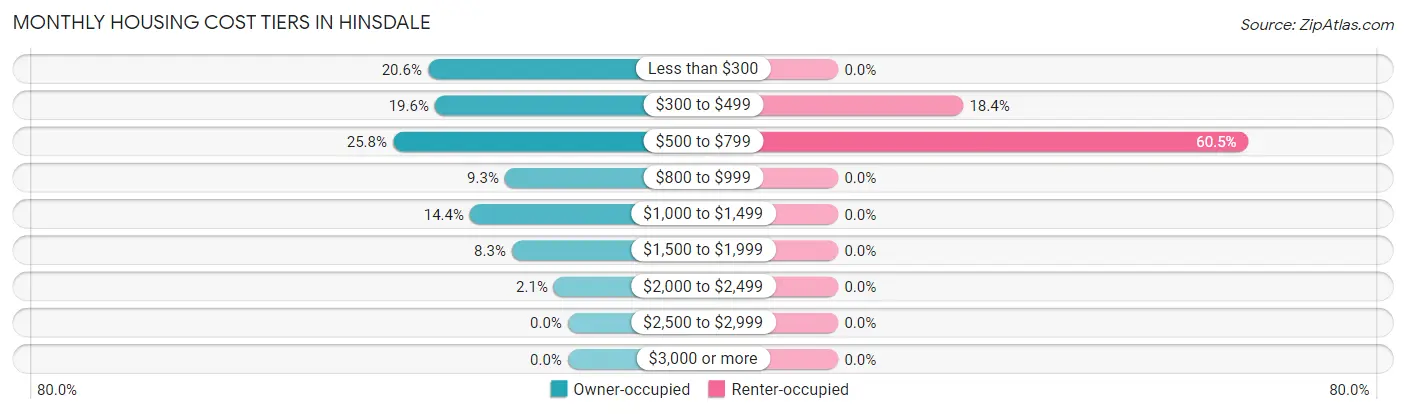
| Monthly Cost | Owner-occupied | Renter-occupied |
| Less than $300 | 20 (20.6%) | 0 (0.0%) |
| $300 to $499 | 19 (19.6%) | 7 (18.4%) |
| $500 to $799 | 25 (25.8%) | 23 (60.5%) |
| $800 to $999 | 9 (9.3%) | 0 (0.0%) |
| $1,000 to $1,499 | 14 (14.4%) | 0 (0.0%) |
| $1,500 to $1,999 | 8 (8.3%) | 0 (0.0%) |
| $2,000 to $2,499 | 2 (2.1%) | 0 (0.0%) |
| $2,500 to $2,999 | 0 (0.0%) | 0 (0.0%) |
| $3,000 or more | 0 (0.0%) | 0 (0.0%) |
| Total | 97 (100.0%) | 38 (100.0%) |
Physical Housing Characteristics in Hinsdale
Housing Structures in Hinsdale
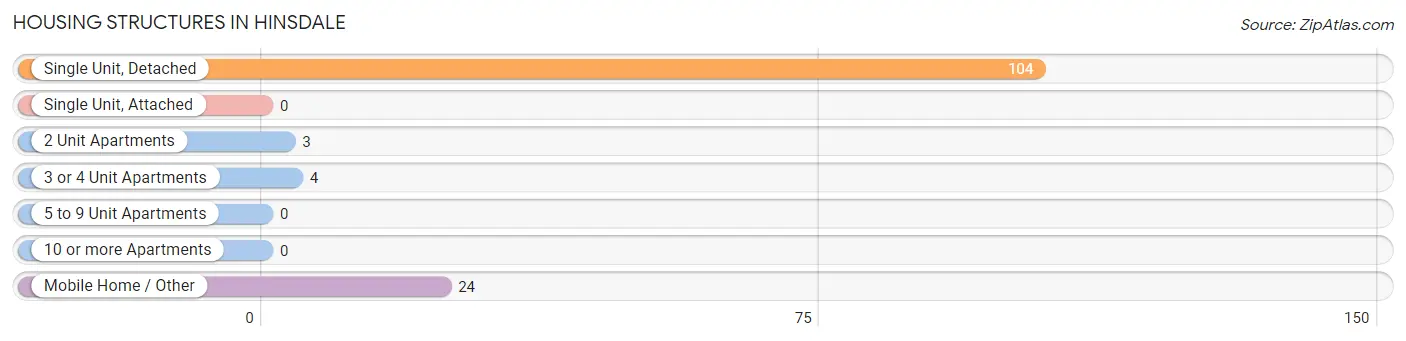
| Structure Type | # Housing Units | % Housing Units |
| Single Unit, Detached | 104 | 77.0% |
| Single Unit, Attached | 0 | 0.0% |
| 2 Unit Apartments | 3 | 2.2% |
| 3 or 4 Unit Apartments | 4 | 3.0% |
| 5 to 9 Unit Apartments | 0 | 0.0% |
| 10 or more Apartments | 0 | 0.0% |
| Mobile Home / Other | 24 | 17.8% |
| Total | 135 | 100.0% |
Housing Structures by Occupancy in Hinsdale
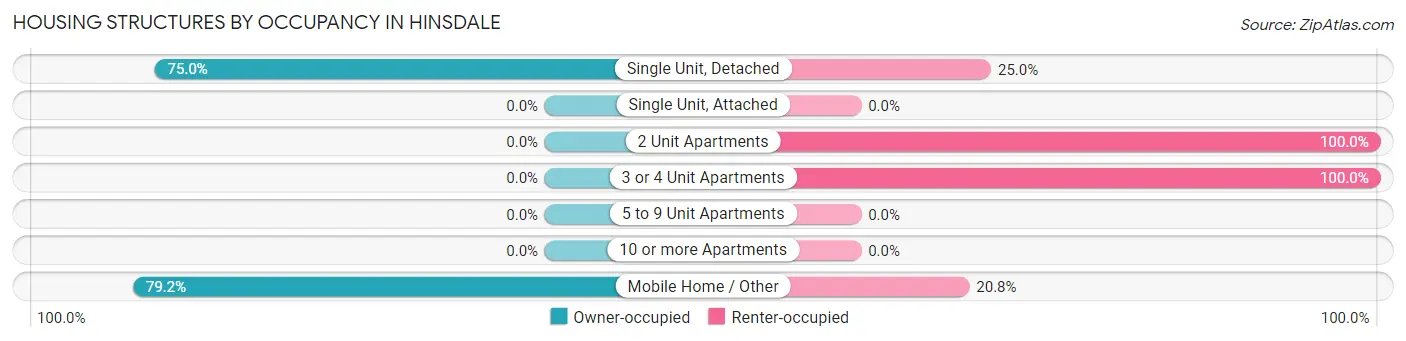
| Structure Type | Owner-occupied | Renter-occupied |
| Single Unit, Detached | 78 (75.0%) | 26 (25.0%) |
| Single Unit, Attached | 0 (0.0%) | 0 (0.0%) |
| 2 Unit Apartments | 0 (0.0%) | 3 (100.0%) |
| 3 or 4 Unit Apartments | 0 (0.0%) | 4 (100.0%) |
| 5 to 9 Unit Apartments | 0 (0.0%) | 0 (0.0%) |
| 10 or more Apartments | 0 (0.0%) | 0 (0.0%) |
| Mobile Home / Other | 19 (79.2%) | 5 (20.8%) |
| Total | 97 (71.9%) | 38 (28.1%) |
Housing Structures by Number of Rooms in Hinsdale
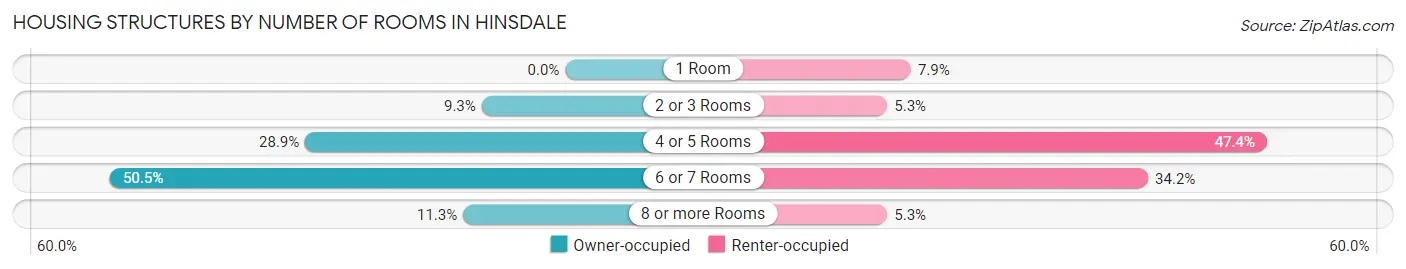
| Number of Rooms | Owner-occupied | Renter-occupied |
| 1 Room | 0 (0.0%) | 3 (7.9%) |
| 2 or 3 Rooms | 9 (9.3%) | 2 (5.3%) |
| 4 or 5 Rooms | 28 (28.9%) | 18 (47.4%) |
| 6 or 7 Rooms | 49 (50.5%) | 13 (34.2%) |
| 8 or more Rooms | 11 (11.3%) | 2 (5.3%) |
| Total | 97 (100.0%) | 38 (100.0%) |
Housing Structure by Heating Type in Hinsdale
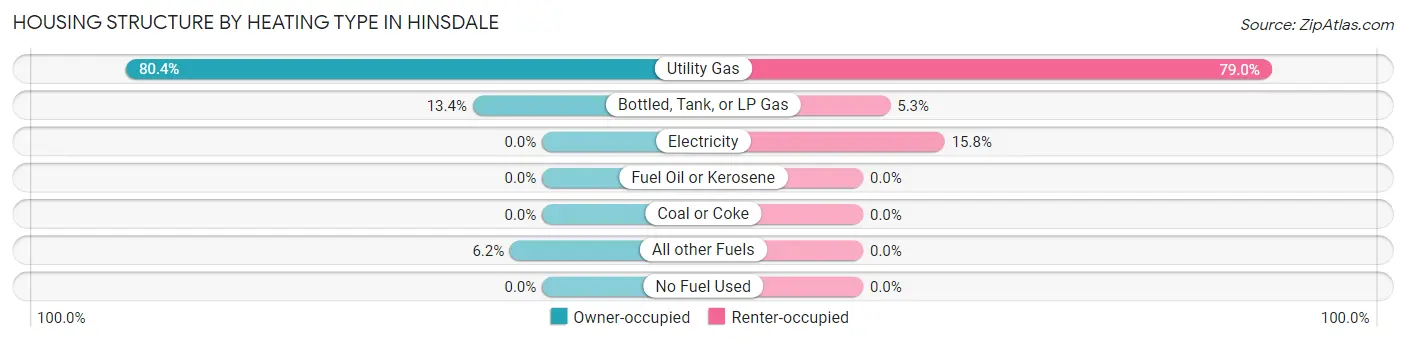
| Heating Type | Owner-occupied | Renter-occupied |
| Utility Gas | 78 (80.4%) | 30 (78.9%) |
| Bottled, Tank, or LP Gas | 13 (13.4%) | 2 (5.3%) |
| Electricity | 0 (0.0%) | 6 (15.8%) |
| Fuel Oil or Kerosene | 0 (0.0%) | 0 (0.0%) |
| Coal or Coke | 0 (0.0%) | 0 (0.0%) |
| All other Fuels | 6 (6.2%) | 0 (0.0%) |
| No Fuel Used | 0 (0.0%) | 0 (0.0%) |
| Total | 97 (100.0%) | 38 (100.0%) |
Household Vehicle Usage in Hinsdale
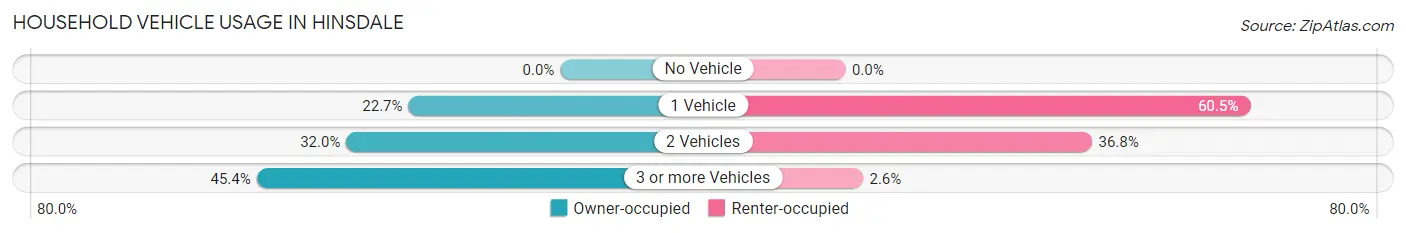
| Vehicles per Household | Owner-occupied | Renter-occupied |
| No Vehicle | 0 (0.0%) | 0 (0.0%) |
| 1 Vehicle | 22 (22.7%) | 23 (60.5%) |
| 2 Vehicles | 31 (32.0%) | 14 (36.8%) |
| 3 or more Vehicles | 44 (45.4%) | 1 (2.6%) |
| Total | 97 (100.0%) | 38 (100.0%) |
Real Estate & Mortgages in Hinsdale
Real Estate and Mortgage Overview in Hinsdale
| Characteristic | Without Mortgage | With Mortgage |
| Housing Units | 61 | 36 |
| Median Property Value | $95,000 | $120,500 |
| Median Household Income | $48,125 | $14 |
| Monthly Housing Costs | $400 | $0 |
| Real Estate Taxes | $956 | $1 |
Property Value by Mortgage Status in Hinsdale
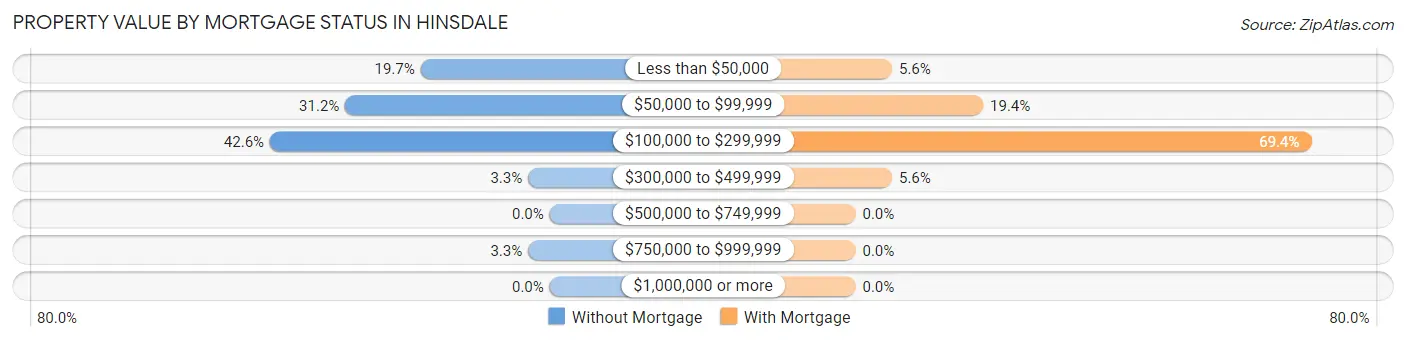
| Property Value | Without Mortgage | With Mortgage |
| Less than $50,000 | 12 (19.7%) | 2 (5.6%) |
| $50,000 to $99,999 | 19 (31.1%) | 7 (19.4%) |
| $100,000 to $299,999 | 26 (42.6%) | 25 (69.4%) |
| $300,000 to $499,999 | 2 (3.3%) | 2 (5.6%) |
| $500,000 to $749,999 | 0 (0.0%) | 0 (0.0%) |
| $750,000 to $999,999 | 2 (3.3%) | 0 (0.0%) |
| $1,000,000 or more | 0 (0.0%) | 0 (0.0%) |
| Total | 61 (100.0%) | 36 (100.0%) |
Household Income by Mortgage Status in Hinsdale
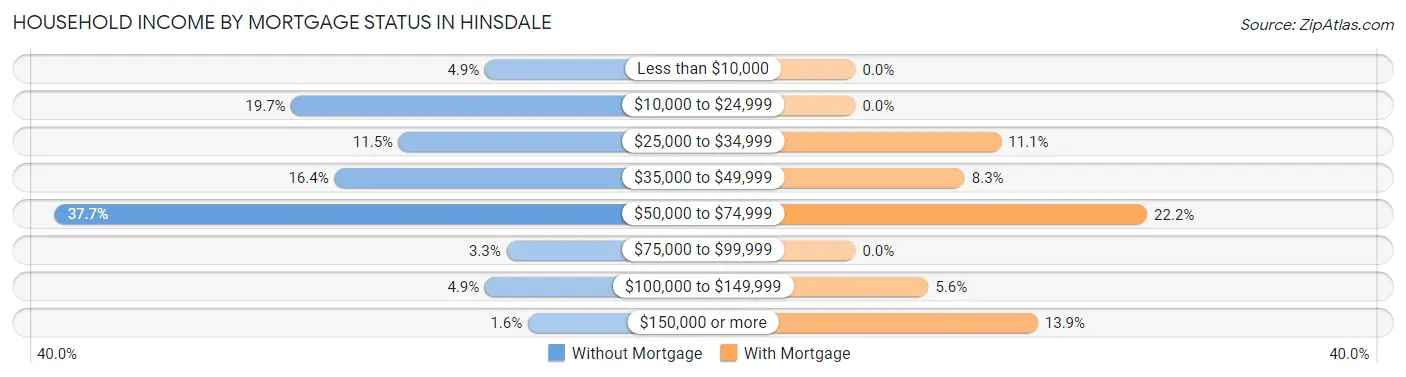
| Household Income | Without Mortgage | With Mortgage |
| Less than $10,000 | 3 (4.9%) | 0 (0.0%) |
| $10,000 to $24,999 | 12 (19.7%) | 0 (0.0%) |
| $25,000 to $34,999 | 7 (11.5%) | 4 (11.1%) |
| $35,000 to $49,999 | 10 (16.4%) | 3 (8.3%) |
| $50,000 to $74,999 | 23 (37.7%) | 8 (22.2%) |
| $75,000 to $99,999 | 2 (3.3%) | 0 (0.0%) |
| $100,000 to $149,999 | 3 (4.9%) | 2 (5.6%) |
| $150,000 or more | 1 (1.6%) | 5 (13.9%) |
| Total | 61 (100.0%) | 36 (100.0%) |
Property Value to Household Income Ratio in Hinsdale
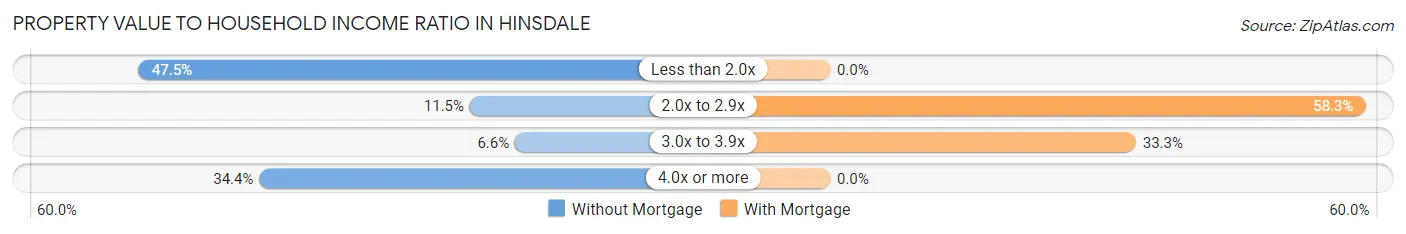
| Value-to-Income Ratio | Without Mortgage | With Mortgage |
| Less than 2.0x | 29 (47.5%) | 0 (0.0%) |
| 2.0x to 2.9x | 7 (11.5%) | 21 (58.3%) |
| 3.0x to 3.9x | 4 (6.6%) | 12 (33.3%) |
| 4.0x or more | 21 (34.4%) | 0 (0.0%) |
| Total | 61 (100.0%) | 36 (100.0%) |
Real Estate Taxes by Mortgage Status in Hinsdale
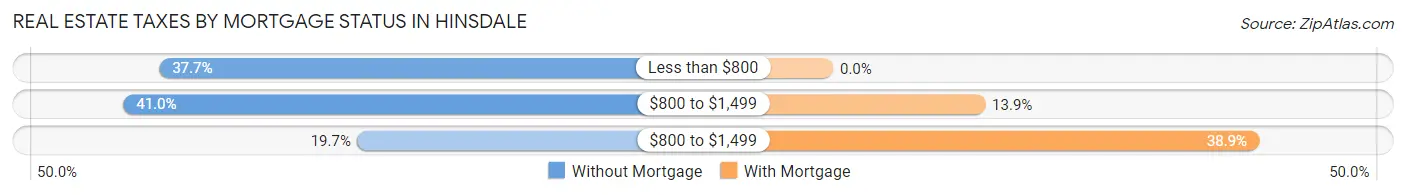
| Property Taxes | Without Mortgage | With Mortgage |
| Less than $800 | 23 (37.7%) | 0 (0.0%) |
| $800 to $1,499 | 25 (41.0%) | 5 (13.9%) |
| $800 to $1,499 | 12 (19.7%) | 14 (38.9%) |
| Total | 61 (100.0%) | 36 (100.0%) |
Health & Disability in Hinsdale
Health Insurance Coverage by Age in Hinsdale
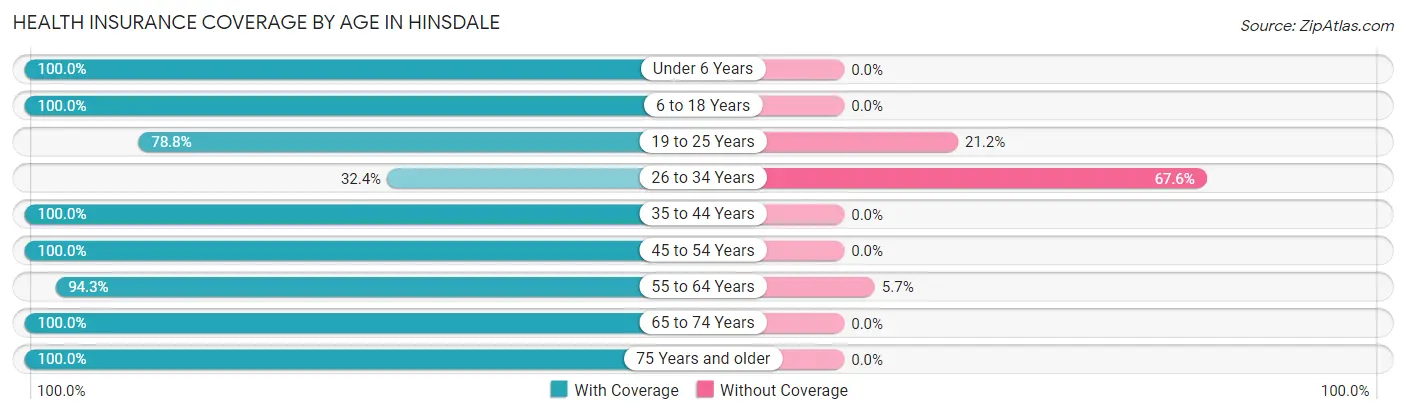
| Age Bracket | With Coverage | Without Coverage |
| Under 6 Years | 13 (100.0%) | 0 (0.0%) |
| 6 to 18 Years | 12 (100.0%) | 0 (0.0%) |
| 19 to 25 Years | 26 (78.8%) | 7 (21.2%) |
| 26 to 34 Years | 12 (32.4%) | 25 (67.6%) |
| 35 to 44 Years | 22 (100.0%) | 0 (0.0%) |
| 45 to 54 Years | 17 (100.0%) | 0 (0.0%) |
| 55 to 64 Years | 33 (94.3%) | 2 (5.7%) |
| 65 to 74 Years | 29 (100.0%) | 0 (0.0%) |
| 75 Years and older | 41 (100.0%) | 0 (0.0%) |
| Total | 205 (85.8%) | 34 (14.2%) |
Health Insurance Coverage by Citizenship Status in Hinsdale
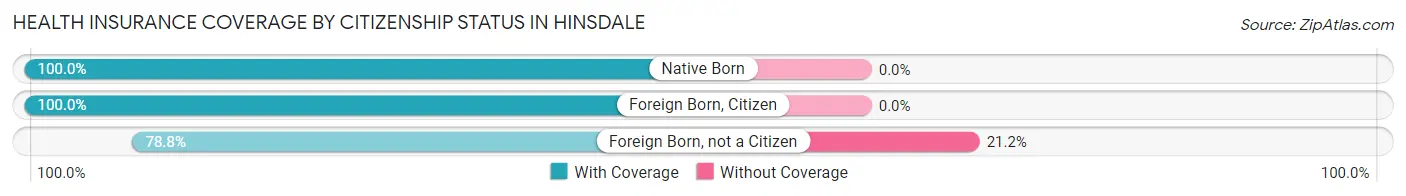
| Citizenship Status | With Coverage | Without Coverage |
| Native Born | 13 (100.0%) | 0 (0.0%) |
| Foreign Born, Citizen | 12 (100.0%) | 0 (0.0%) |
| Foreign Born, not a Citizen | 26 (78.8%) | 7 (21.2%) |
Health Insurance Coverage by Household Income in Hinsdale
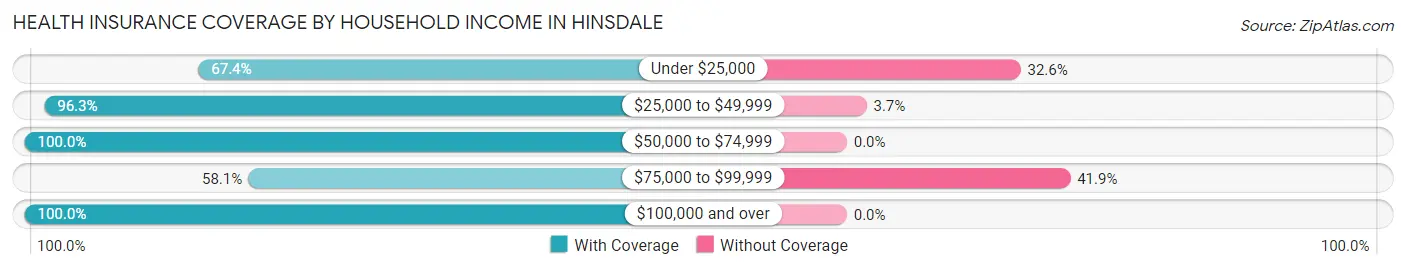
| Household Income | With Coverage | Without Coverage |
| Under $25,000 | 29 (67.4%) | 14 (32.6%) |
| $25,000 to $49,999 | 52 (96.3%) | 2 (3.7%) |
| $50,000 to $74,999 | 53 (100.0%) | 0 (0.0%) |
| $75,000 to $99,999 | 25 (58.1%) | 18 (41.9%) |
| $100,000 and over | 46 (100.0%) | 0 (0.0%) |
Public vs Private Health Insurance Coverage by Age in Hinsdale
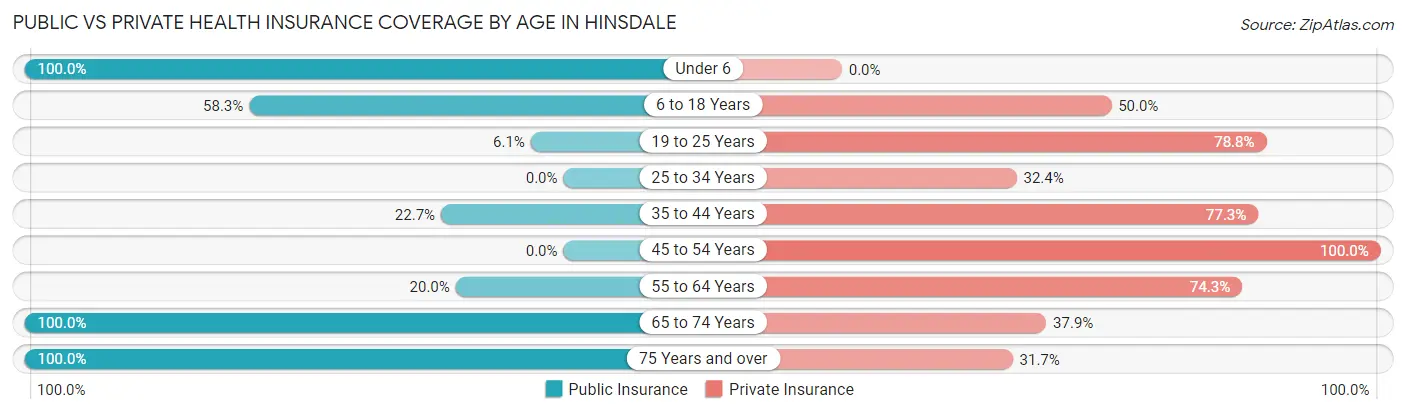
| Age Bracket | Public Insurance | Private Insurance |
| Under 6 | 13 (100.0%) | 0 (0.0%) |
| 6 to 18 Years | 7 (58.3%) | 6 (50.0%) |
| 19 to 25 Years | 2 (6.1%) | 26 (78.8%) |
| 25 to 34 Years | 0 (0.0%) | 12 (32.4%) |
| 35 to 44 Years | 5 (22.7%) | 17 (77.3%) |
| 45 to 54 Years | 0 (0.0%) | 17 (100.0%) |
| 55 to 64 Years | 7 (20.0%) | 26 (74.3%) |
| 65 to 74 Years | 29 (100.0%) | 11 (37.9%) |
| 75 Years and over | 41 (100.0%) | 13 (31.7%) |
| Total | 104 (43.5%) | 128 (53.6%) |
Disability Status by Sex by Age in Hinsdale
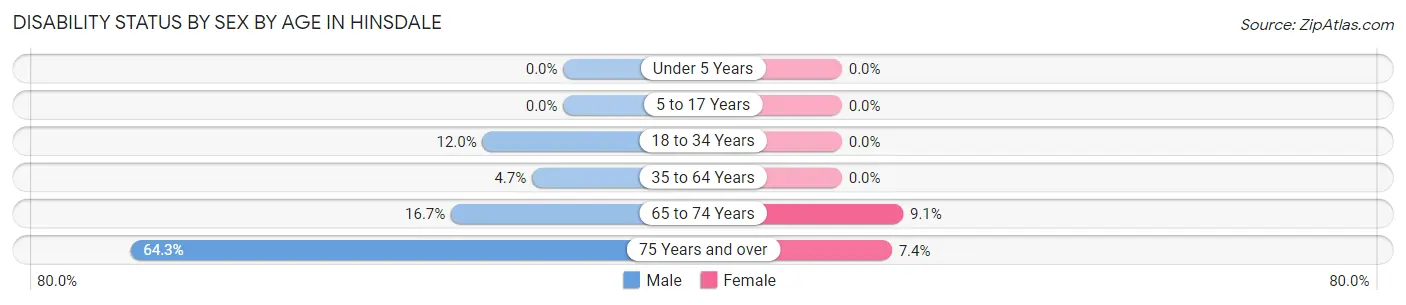
| Age Bracket | Male | Female |
| Under 5 Years | 0 (0.0%) | 0 (0.0%) |
| 5 to 17 Years | 0 (0.0%) | 0 (0.0%) |
| 18 to 34 Years | 6 (12.0%) | 0 (0.0%) |
| 35 to 64 Years | 2 (4.6%) | 0 (0.0%) |
| 65 to 74 Years | 3 (16.7%) | 1 (9.1%) |
| 75 Years and over | 9 (64.3%) | 2 (7.4%) |
Disability Class by Sex by Age in Hinsdale
Disability Class: Hearing Difficulty
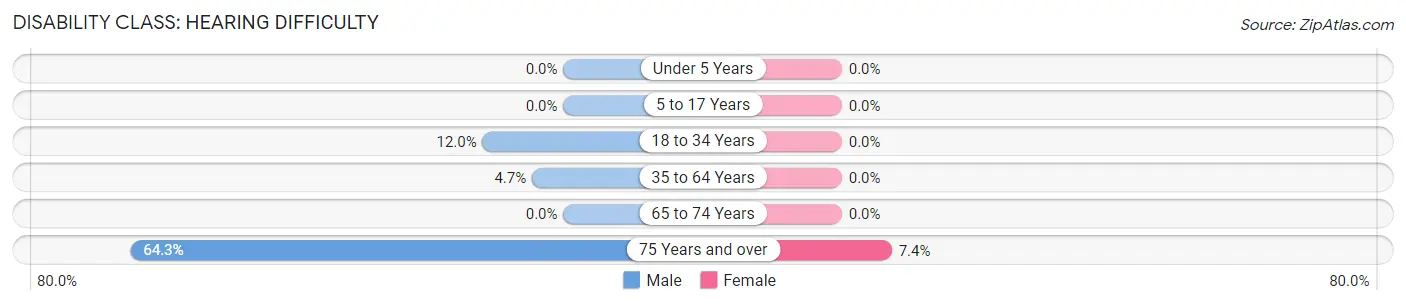
| Age Bracket | Male | Female |
| Under 5 Years | 0 (0.0%) | 0 (0.0%) |
| 5 to 17 Years | 0 (0.0%) | 0 (0.0%) |
| 18 to 34 Years | 6 (12.0%) | 0 (0.0%) |
| 35 to 64 Years | 2 (4.6%) | 0 (0.0%) |
| 65 to 74 Years | 0 (0.0%) | 0 (0.0%) |
| 75 Years and over | 9 (64.3%) | 2 (7.4%) |
Disability Class: Vision Difficulty
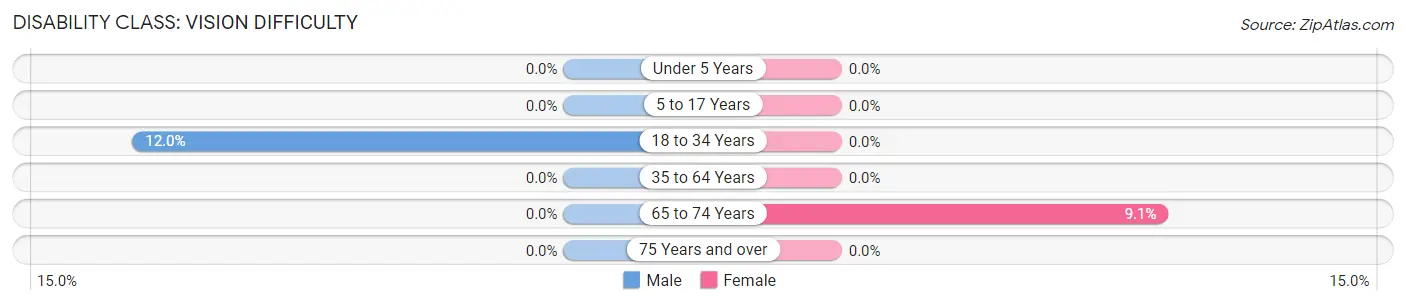
| Age Bracket | Male | Female |
| Under 5 Years | 0 (0.0%) | 0 (0.0%) |
| 5 to 17 Years | 0 (0.0%) | 0 (0.0%) |
| 18 to 34 Years | 6 (12.0%) | 0 (0.0%) |
| 35 to 64 Years | 0 (0.0%) | 0 (0.0%) |
| 65 to 74 Years | 0 (0.0%) | 1 (9.1%) |
| 75 Years and over | 0 (0.0%) | 0 (0.0%) |
Disability Class: Cognitive Difficulty
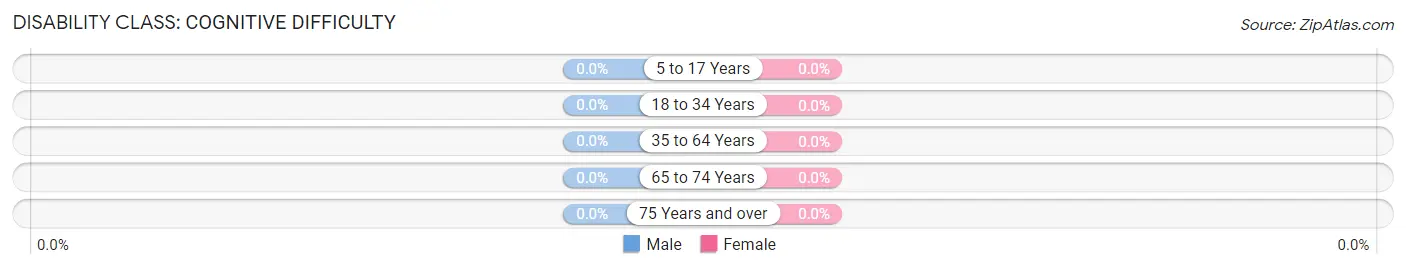
| Age Bracket | Male | Female |
| 5 to 17 Years | 0 (0.0%) | 0 (0.0%) |
| 18 to 34 Years | 0 (0.0%) | 0 (0.0%) |
| 35 to 64 Years | 0 (0.0%) | 0 (0.0%) |
| 65 to 74 Years | 0 (0.0%) | 0 (0.0%) |
| 75 Years and over | 0 (0.0%) | 0 (0.0%) |
Disability Class: Ambulatory Difficulty
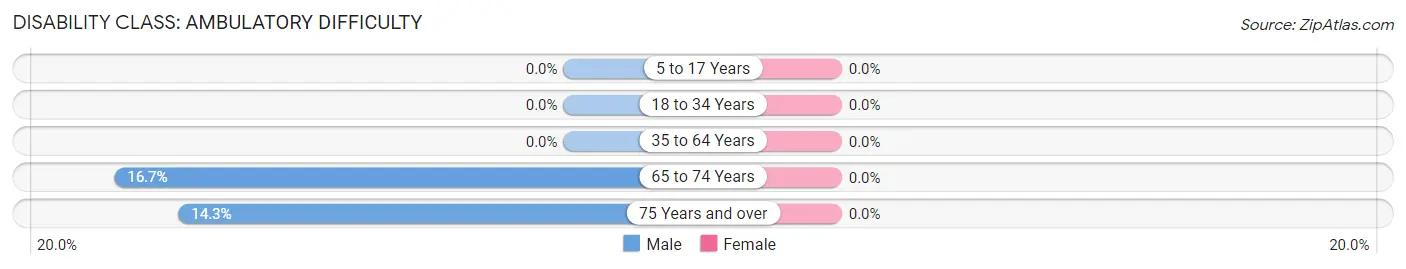
| Age Bracket | Male | Female |
| 5 to 17 Years | 0 (0.0%) | 0 (0.0%) |
| 18 to 34 Years | 0 (0.0%) | 0 (0.0%) |
| 35 to 64 Years | 0 (0.0%) | 0 (0.0%) |
| 65 to 74 Years | 3 (16.7%) | 0 (0.0%) |
| 75 Years and over | 2 (14.3%) | 0 (0.0%) |
Disability Class: Self-Care Difficulty
| Age Bracket | Male | Female |
| 5 to 17 Years | 0 (0.0%) | 0 (0.0%) |
| 18 to 34 Years | 0 (0.0%) | 0 (0.0%) |
| 35 to 64 Years | 0 (0.0%) | 0 (0.0%) |
| 65 to 74 Years | 0 (0.0%) | 0 (0.0%) |
| 75 Years and over | 0 (0.0%) | 0 (0.0%) |
Technology Access in Hinsdale
Computing Device Access in Hinsdale
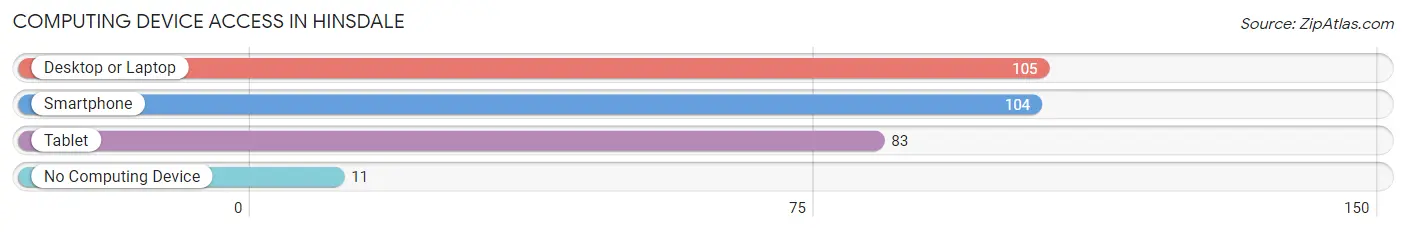
| Device Type | # Households | % Households |
| Desktop or Laptop | 105 | 77.8% |
| Smartphone | 104 | 77.0% |
| Tablet | 83 | 61.5% |
| No Computing Device | 11 | 8.2% |
| Total | 135 | 100.0% |
Internet Access in Hinsdale
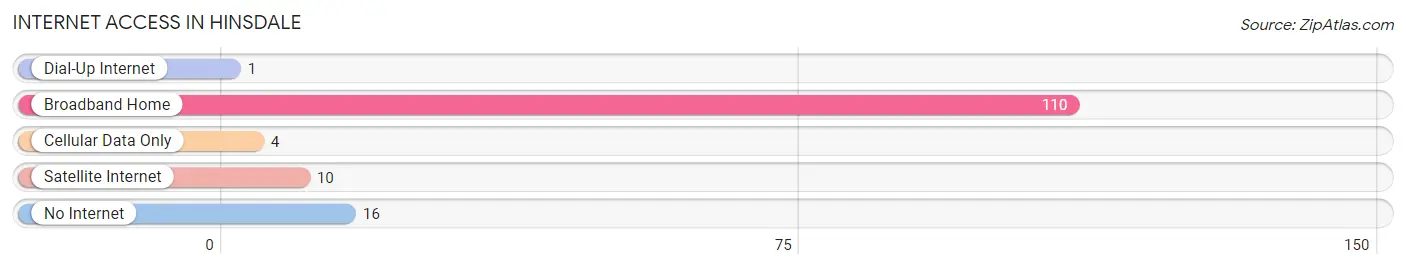
| Internet Type | # Households | % Households |
| Dial-Up Internet | 1 | 0.7% |
| Broadband Home | 110 | 81.5% |
| Cellular Data Only | 4 | 3.0% |
| Satellite Internet | 10 | 7.4% |
| No Internet | 16 | 11.8% |
| Total | 135 | 100.0% |
Hinsdale Summary
Hinsdale, Montana is a small town located in the western part of the state, near the Idaho border. It is situated in the Bitterroot Valley, a region of the Rocky Mountains known for its scenic beauty and outdoor recreation opportunities. The town has a population of just over 500 people, and is the county seat of Ravalli County.
Hinsdale was founded in 1883 by a group of settlers from the Midwest. The town was named after the Hinsdale family, who were among the first settlers in the area. The town was originally a farming and ranching community, but in the early 1900s, the timber industry began to take off in the area. This led to the construction of a sawmill and other related businesses, which helped to spur the growth of the town.
The economy of Hinsdale is largely based on agriculture and timber. The town is home to several farms and ranches, as well as a sawmill and other related businesses. The town also has a small retail sector, with a few stores and restaurants.
The geography of Hinsdale is dominated by the Bitterroot Mountains, which form the western border of the town. The town is situated in a valley, with the Bitterroot River running through it. The town is surrounded by forests and mountains, providing a beautiful backdrop for outdoor activities.
The demographics of Hinsdale are largely white, with a small percentage of Native Americans and Hispanics. The median household income is slightly below the national average, and the poverty rate is slightly higher than the national average. The town has a small but growing population of retirees, as well as a few younger families.
Hinsdale is a small town with a rich history and a beautiful natural setting. It is a great place to live and work, and offers a variety of outdoor activities for residents and visitors alike. The town is a great place to raise a family, and offers a safe and friendly environment.
Common Questions
What is Per Capita Income in Hinsdale?
Per Capita income in Hinsdale is $37,097.
What is the Median Family Income in Hinsdale?
Median Family Income in Hinsdale is $76,250.
What is the Median Household income in Hinsdale?
Median Household Income in Hinsdale is $43,250.
What is Income or Wage Gap in Hinsdale?
Income or Wage Gap in Hinsdale is 25.5%.
Women in Hinsdale earn 74.5 cents for every dollar earned by a man.
What is Inequality or Gini Index in Hinsdale?
Inequality or Gini Index in Hinsdale is 0.49.
What is the Total Population of Hinsdale?
Total Population of Hinsdale is 239.
What is the Total Male Population of Hinsdale?
Total Male Population of Hinsdale is 134.
What is the Total Female Population of Hinsdale?
Total Female Population of Hinsdale is 105.
What is the Ratio of Males per 100 Females in Hinsdale?
There are 127.62 Males per 100 Females in Hinsdale.
What is the Ratio of Females per 100 Males in Hinsdale?
There are 78.36 Females per 100 Males in Hinsdale.
What is the Median Population Age in Hinsdale?
Median Population Age in Hinsdale is 48.1 Years.
What is the Average Family Size in Hinsdale
Average Family Size in Hinsdale is 2.7 People.
What is the Average Household Size in Hinsdale
Average Household Size in Hinsdale is 1.8 People.
How Large is the Labor Force in Hinsdale?
There are 143 People in the Labor Forcein in Hinsdale.
What is the Percentage of People in the Labor Force in Hinsdale?
65.3% of People are in the Labor Force in Hinsdale.
What is the Unemployment Rate in Hinsdale?
Unemployment Rate in Hinsdale is 2.8%.