Fortine, MT Map & Demographics
Fortine Map
Fortine Overview
$26,315
PER CAPITA INCOME
$63,897
AVG FAMILY INCOME
$63,676
AVG HOUSEHOLD INCOME
27.4%
WAGE / INCOME GAP [ % ]
72.6¢/ $1
WAGE / INCOME GAP [ $ ]
0.32
INEQUALITY / GINI INDEX
432
TOTAL POPULATION
186
MALE POPULATION
246
FEMALE POPULATION
75.61
MALES / 100 FEMALES
132.26
FEMALES / 100 MALES
32.0
MEDIAN AGE
3.5
AVG FAMILY SIZE
3.2
AVG HOUSEHOLD SIZE
154
LABOR FORCE [ PEOPLE ]
50.2%
PERCENT IN LABOR FORCE
Fortine Zip Codes
Fortine Area Codes
Income in Fortine
Income Overview in Fortine
Per Capita Income in Fortine is $26,315, while median incomes of families and households are $63,897 and $63,676 respectively.
| Characteristic | Number | Measure |
| Per Capita Income | 432 | $26,315 |
| Median Family Income | 119 | $63,897 |
| Mean Family Income | 119 | $92,045 |
| Median Household Income | 134 | $63,676 |
| Mean Household Income | 134 | $87,019 |
| Income Deficit | 119 | $0 |
| Wage / Income Gap (%) | 432 | 27.39% |
| Wage / Income Gap ($) | 432 | 72.61¢ per $1 |
| Gini / Inequality Index | 432 | 0.32 |
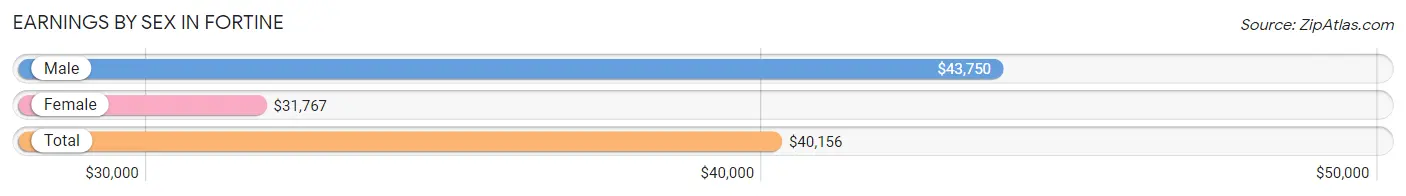
Earnings by Sex in Fortine
Average Earnings in Fortine are $40,156, $43,750 for men and $31,767 for women, a difference of 27.4%.
| Sex | Number | Average Earnings |
| Male | 68 (40.7%) | $43,750 |
| Female | 99 (59.3%) | $31,767 |
| Total | 167 (100.0%) | $40,156 |
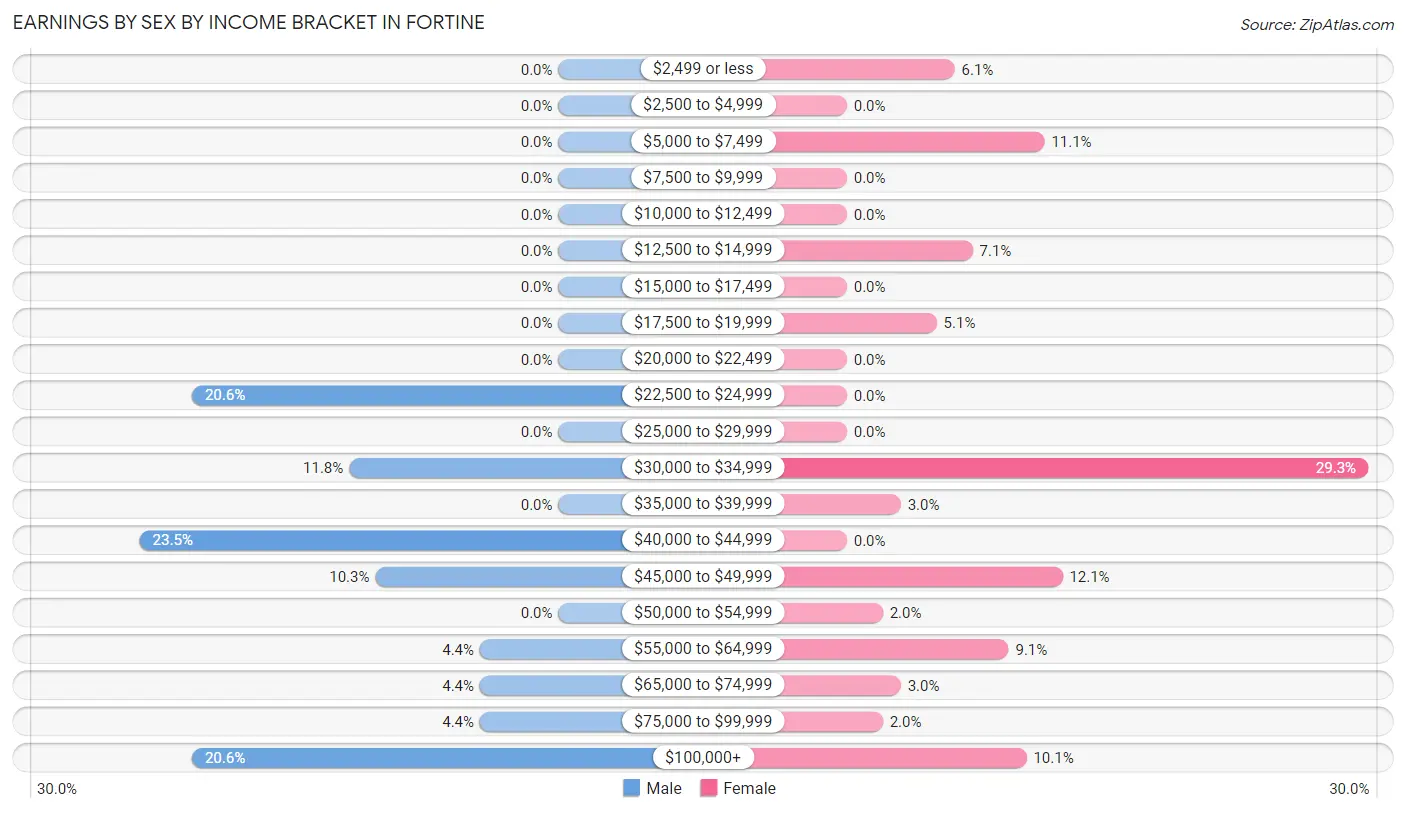
Earnings by Sex by Income Bracket in Fortine
The most common earnings brackets in Fortine are $40,000 to $44,999 for men (16 | 23.5%) and $30,000 to $34,999 for women (29 | 29.3%).
| Income | Male | Female |
| $2,499 or less | 0 (0.0%) | 6 (6.1%) |
| $2,500 to $4,999 | 0 (0.0%) | 0 (0.0%) |
| $5,000 to $7,499 | 0 (0.0%) | 11 (11.1%) |
| $7,500 to $9,999 | 0 (0.0%) | 0 (0.0%) |
| $10,000 to $12,499 | 0 (0.0%) | 0 (0.0%) |
| $12,500 to $14,999 | 0 (0.0%) | 7 (7.1%) |
| $15,000 to $17,499 | 0 (0.0%) | 0 (0.0%) |
| $17,500 to $19,999 | 0 (0.0%) | 5 (5.1%) |
| $20,000 to $22,499 | 0 (0.0%) | 0 (0.0%) |
| $22,500 to $24,999 | 14 (20.6%) | 0 (0.0%) |
| $25,000 to $29,999 | 0 (0.0%) | 0 (0.0%) |
| $30,000 to $34,999 | 8 (11.8%) | 29 (29.3%) |
| $35,000 to $39,999 | 0 (0.0%) | 3 (3.0%) |
| $40,000 to $44,999 | 16 (23.5%) | 0 (0.0%) |
| $45,000 to $49,999 | 7 (10.3%) | 12 (12.1%) |
| $50,000 to $54,999 | 0 (0.0%) | 2 (2.0%) |
| $55,000 to $64,999 | 3 (4.4%) | 9 (9.1%) |
| $65,000 to $74,999 | 3 (4.4%) | 3 (3.0%) |
| $75,000 to $99,999 | 3 (4.4%) | 2 (2.0%) |
| $100,000+ | 14 (20.6%) | 10 (10.1%) |
| Total | 68 (100.0%) | 99 (100.0%) |
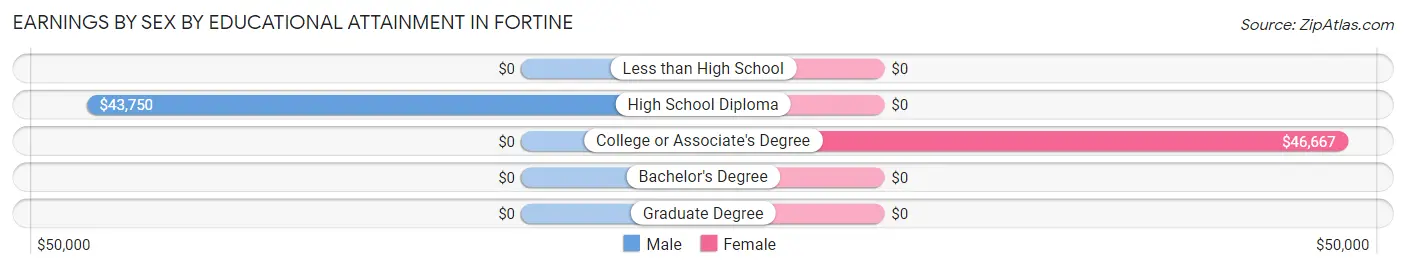
Earnings by Sex by Educational Attainment in Fortine
Average earnings in Fortine are $46,071 for men and $35,000 for women, a difference of 24.0%. Men with an educational attainment of high school diploma enjoy the highest average annual earnings of $43,750, while those with high school diploma education earn the least with $43,750. Women with an educational attainment of college or associate's degree earn the most with the average annual earnings of $46,667, while those with college or associate's degree education have the smallest earnings of $46,667.
| Educational Attainment | Male Income | Female Income |
| Less than High School | - | - |
| High School Diploma | $43,750 | $0 |
| College or Associate's Degree | - | - |
| Bachelor's Degree | - | - |
| Graduate Degree | - | - |
| Total | $46,071 | $35,000 |
Family Income in Fortine
Family Income Brackets in Fortine
According to the Fortine family income data, there are 70 families falling into the $50,000 to $74,999 income range, which is the most common income bracket and makes up 58.8% of all families.
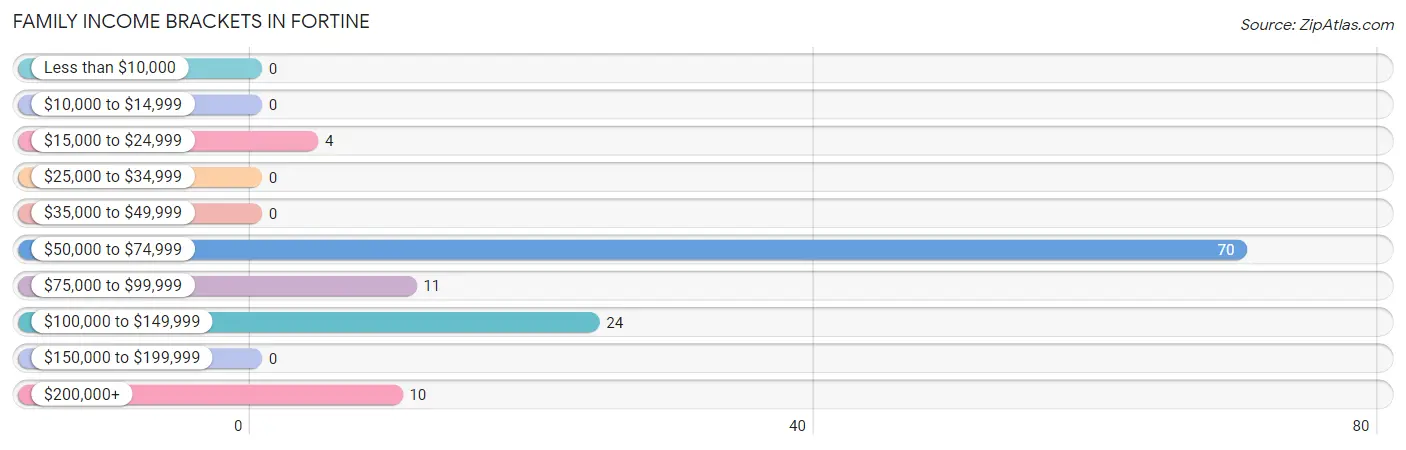
| Income Bracket | # Families | % Families |
| Less than $10,000 | 0 | 0.0% |
| $10,000 to $14,999 | 0 | 0.0% |
| $15,000 to $24,999 | 4 | 3.4% |
| $25,000 to $34,999 | 0 | 0.0% |
| $35,000 to $49,999 | 0 | 0.0% |
| $50,000 to $74,999 | 70 | 58.8% |
| $75,000 to $99,999 | 11 | 9.2% |
| $100,000 to $149,999 | 24 | 20.2% |
| $150,000 to $199,999 | 0 | 0.0% |
| $200,000+ | 10 | 8.4% |
Family Income by Famaliy Size in Fortine
6-person families (10 | 8.4%) account for the highest median family income in Fortine with $123,500 per family, while 2-person families (72 | 60.5%) have the highest median income of $32,500 per family member.
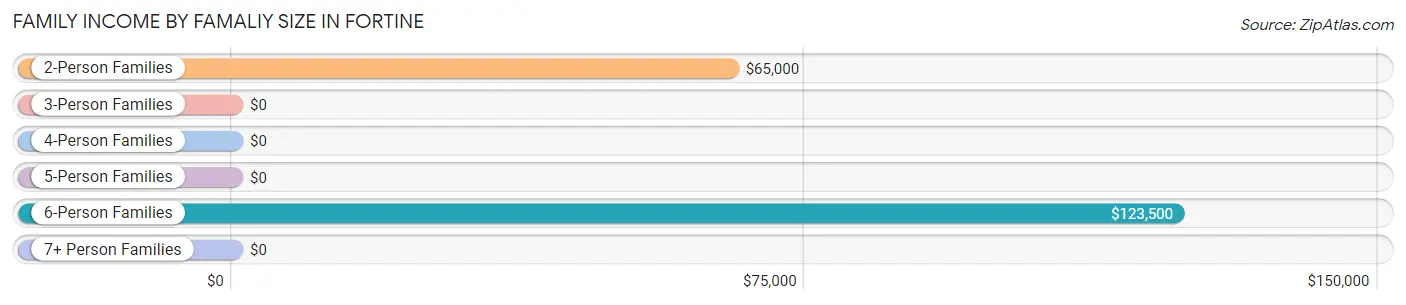
| Income Bracket | # Families | Median Income |
| 2-Person Families | 72 (60.5%) | $65,000 |
| 3-Person Families | 12 (10.1%) | $0 |
| 4-Person Families | 19 (16.0%) | $0 |
| 5-Person Families | 6 (5.0%) | $0 |
| 6-Person Families | 10 (8.4%) | $123,500 |
| 7+ Person Families | 0 (0.0%) | $0 |
| Total | 119 (100.0%) | $63,897 |
Family Income by Number of Earners in Fortine
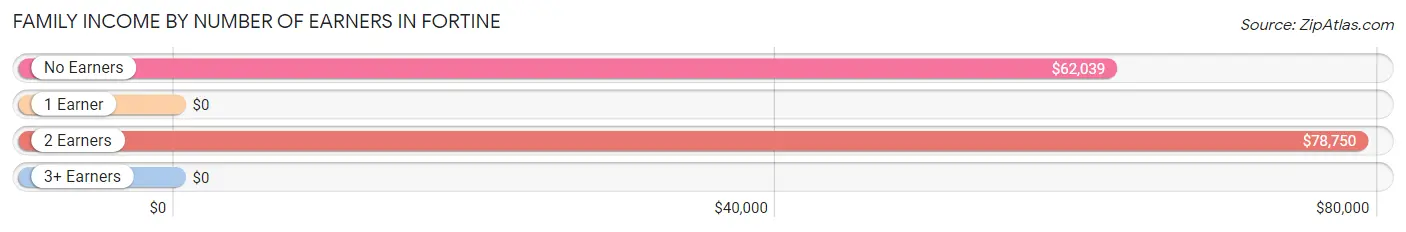
| Number of Earners | # Families | Median Income |
| No Earners | 41 (34.4%) | $62,039 |
| 1 Earner | 18 (15.1%) | $0 |
| 2 Earners | 53 (44.5%) | $78,750 |
| 3+ Earners | 7 (5.9%) | $0 |
| Total | 119 (100.0%) | $63,897 |
Household Income in Fortine
Household Income Brackets in Fortine
With 75 households falling in the category, the $50,000 to $74,999 income range is the most frequent in Fortine, accounting for 56.0% of all households.
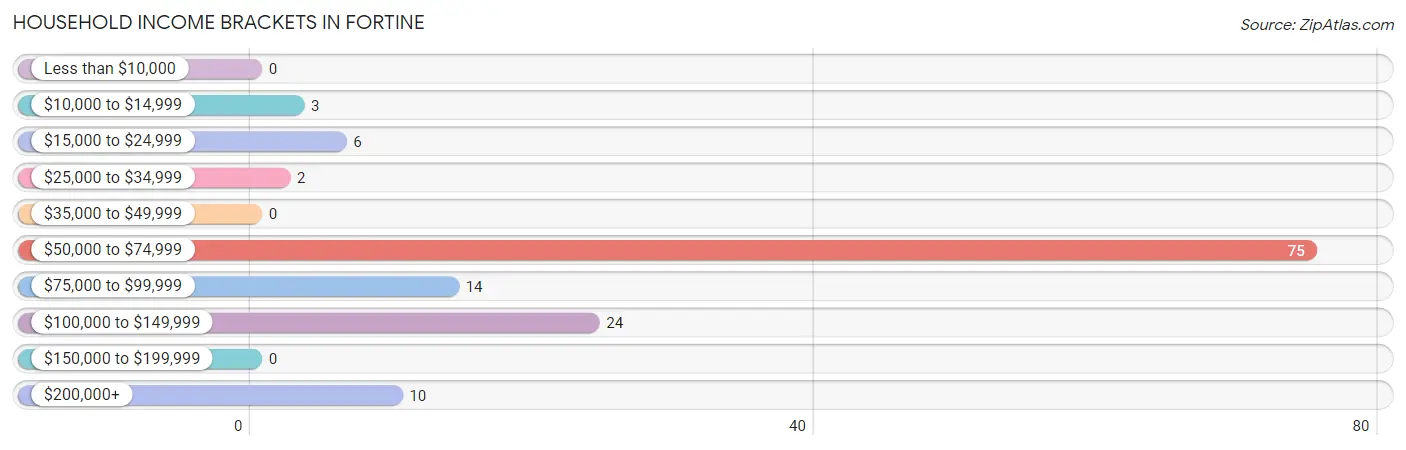
| Income Bracket | # Households | % Households |
| Less than $10,000 | 0 | 0.0% |
| $10,000 to $14,999 | 3 | 2.2% |
| $15,000 to $24,999 | 6 | 4.5% |
| $25,000 to $34,999 | 2 | 1.5% |
| $35,000 to $49,999 | 0 | 0.0% |
| $50,000 to $74,999 | 75 | 56.0% |
| $75,000 to $99,999 | 14 | 10.4% |
| $100,000 to $149,999 | 24 | 17.9% |
| $150,000 to $199,999 | 0 | 0.0% |
| $200,000+ | 10 | 7.5% |
Household Income by Householder Age in Fortine
The median household income in Fortine is $63,676, with the highest median household income of $78,036 found in the 45 to 64 years age bracket for the primary householder. A total of 47 households (35.1%) fall into this category. Meanwhile, the 15 to 24 years age bracket for the primary householder has the lowest median household income of $0, with 14 households (10.4%) in this group.
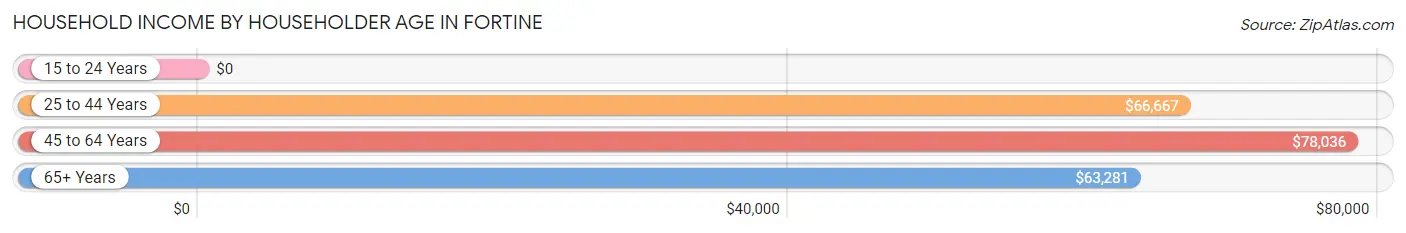
| Income Bracket | # Households | Median Income |
| 15 to 24 Years | 14 (10.4%) | $0 |
| 25 to 44 Years | 38 (28.4%) | $66,667 |
| 45 to 64 Years | 47 (35.1%) | $78,036 |
| 65+ Years | 35 (26.1%) | $63,281 |
| Total | 134 (100.0%) | $63,676 |
Poverty in Fortine
Income Below Poverty by Sex and Age in Fortine
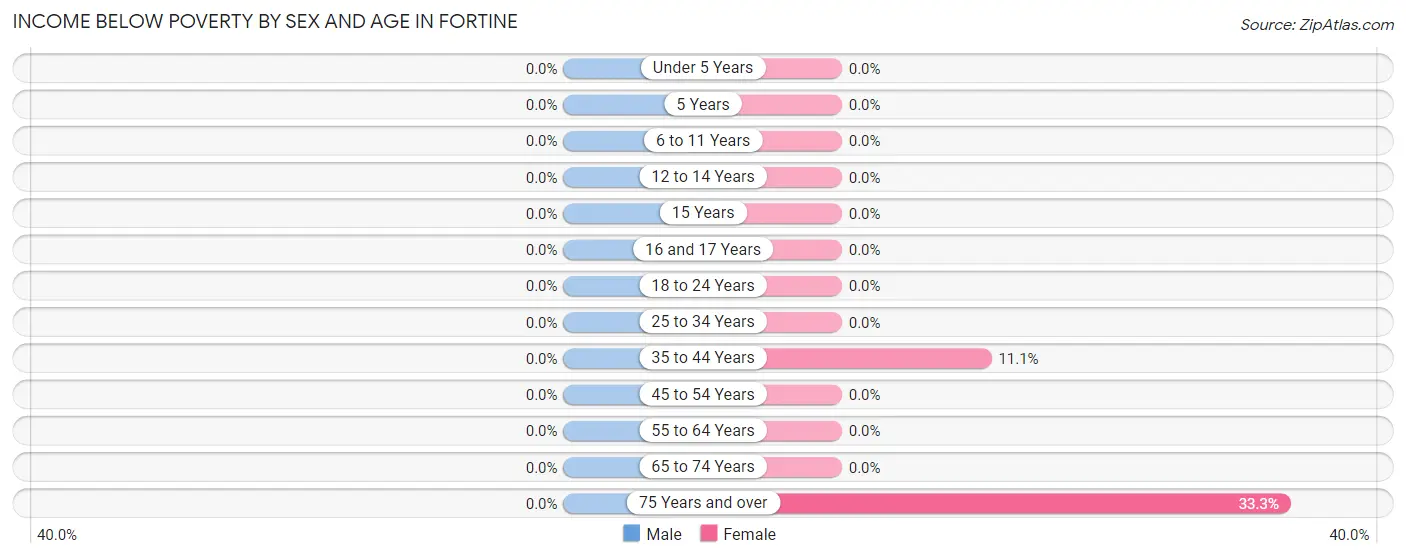
| Age Bracket | Male | Female |
| Under 5 Years | 0 (0.0%) | 0 (0.0%) |
| 5 Years | 0 (0.0%) | 0 (0.0%) |
| 6 to 11 Years | 0 (0.0%) | 0 (0.0%) |
| 12 to 14 Years | 0 (0.0%) | 0 (0.0%) |
| 15 Years | 0 (0.0%) | 0 (0.0%) |
| 16 and 17 Years | 0 (0.0%) | 0 (0.0%) |
| 18 to 24 Years | 0 (0.0%) | 0 (0.0%) |
| 25 to 34 Years | 0 (0.0%) | 0 (0.0%) |
| 35 to 44 Years | 0 (0.0%) | 3 (11.1%) |
| 45 to 54 Years | 0 (0.0%) | 0 (0.0%) |
| 55 to 64 Years | 0 (0.0%) | 0 (0.0%) |
| 65 to 74 Years | 0 (0.0%) | 0 (0.0%) |
| 75 Years and over | 0 (0.0%) | 3 (33.3%) |
| Total | 0 (0.0%) | 6 (2.4%) |
Income Above Poverty by Sex and Age in Fortine
According to the poverty statistics in Fortine, males aged under 5 years and females aged under 5 years are the age groups that are most secure financially, with 100.0% of males and 100.0% of females in these age groups living above the poverty line.
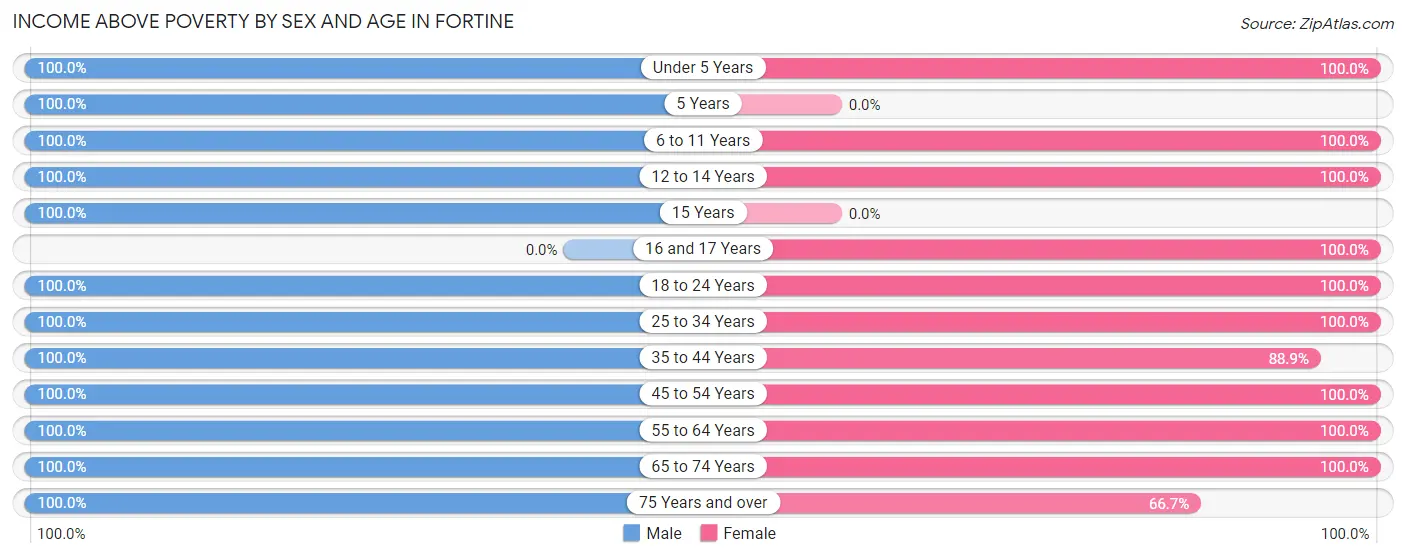
| Age Bracket | Male | Female |
| Under 5 Years | 9 (100.0%) | 40 (100.0%) |
| 5 Years | 4 (100.0%) | 0 (0.0%) |
| 6 to 11 Years | 39 (100.0%) | 8 (100.0%) |
| 12 to 14 Years | 11 (100.0%) | 10 (100.0%) |
| 15 Years | 4 (100.0%) | 0 (0.0%) |
| 16 and 17 Years | 0 (0.0%) | 11 (100.0%) |
| 18 to 24 Years | 14 (100.0%) | 27 (100.0%) |
| 25 to 34 Years | 3 (100.0%) | 39 (100.0%) |
| 35 to 44 Years | 22 (100.0%) | 24 (88.9%) |
| 45 to 54 Years | 30 (100.0%) | 22 (100.0%) |
| 55 to 64 Years | 8 (100.0%) | 43 (100.0%) |
| 65 to 74 Years | 36 (100.0%) | 10 (100.0%) |
| 75 Years and over | 6 (100.0%) | 6 (66.7%) |
| Total | 186 (100.0%) | 240 (97.6%) |
Income Below Poverty Among Married-Couple Families in Fortine
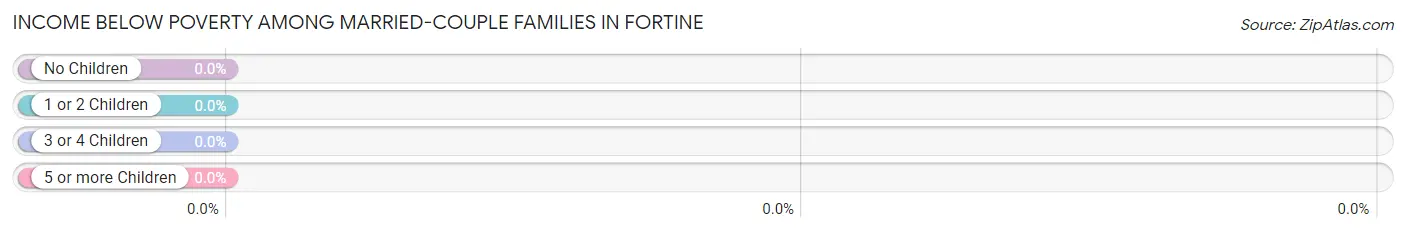
| Children | Above Poverty | Below Poverty |
| No Children | 84 (100.0%) | 0 (0.0%) |
| 1 or 2 Children | 14 (100.0%) | 0 (0.0%) |
| 3 or 4 Children | 16 (100.0%) | 0 (0.0%) |
| 5 or more Children | 0 (0.0%) | 0 (0.0%) |
| Total | 114 (100.0%) | 0 (0.0%) |
Income Below Poverty Among Single-Parent Households in Fortine
| Children | Single Father | Single Mother |
| No Children | 0 (0.0%) | 0 (0.0%) |
| 1 or 2 Children | 0 (0.0%) | 0 (0.0%) |
| 3 or 4 Children | 0 (0.0%) | 0 (0.0%) |
| 5 or more Children | 0 (0.0%) | 0 (0.0%) |
| Total | 0 (0.0%) | 0 (0.0%) |
Income Below Poverty Among Married-Couple vs Single-Parent Households in Fortine
| Children | Married-Couple Families | Single-Parent Households |
| No Children | 0 (0.0%) | 0 (0.0%) |
| 1 or 2 Children | 0 (0.0%) | 0 (0.0%) |
| 3 or 4 Children | 0 (0.0%) | 0 (0.0%) |
| 5 or more Children | 0 (0.0%) | 0 (0.0%) |
| Total | 0 (0.0%) | 0 (0.0%) |
Race in Fortine
The most populous races in Fortine are White / Caucasian (376 | 87.0%), Hispanic or Latino (87 | 20.1%), and Two or more Races (56 | 13.0%).
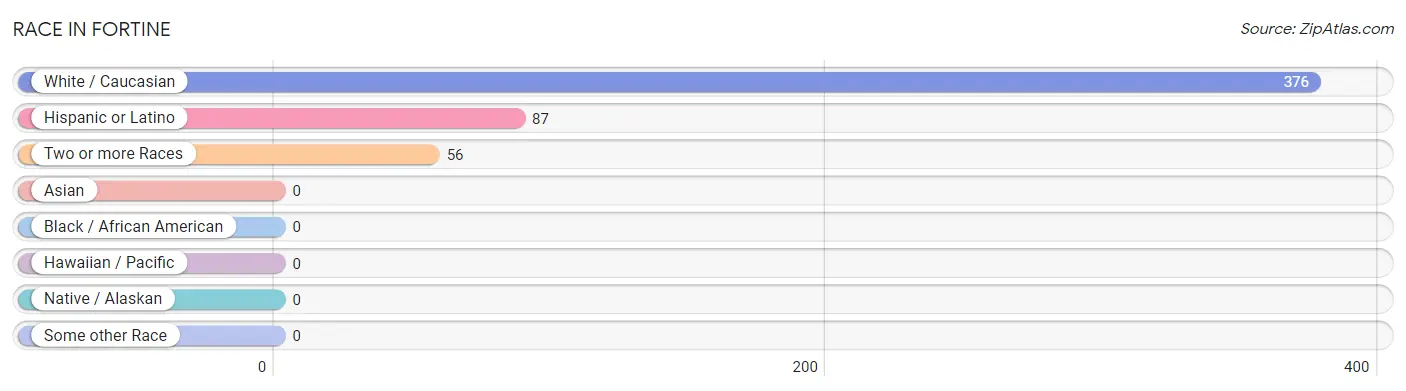
| Race | # Population | % Population |
| Asian | 0 | 0.0% |
| Black / African American | 0 | 0.0% |
| Hawaiian / Pacific | 0 | 0.0% |
| Hispanic or Latino | 87 | 20.1% |
| Native / Alaskan | 0 | 0.0% |
| White / Caucasian | 376 | 87.0% |
| Two or more Races | 56 | 13.0% |
| Some other Race | 0 | 0.0% |
| Total | 432 | 100.0% |
Ancestry in Fortine
The most populous ancestries reported in Fortine are German (77 | 17.8%), English (59 | 13.7%), Mexican (45 | 10.4%), South American Indian (45 | 10.4%), and Cherokee (42 | 9.7%), together accounting for 62.0% of all Fortine residents.
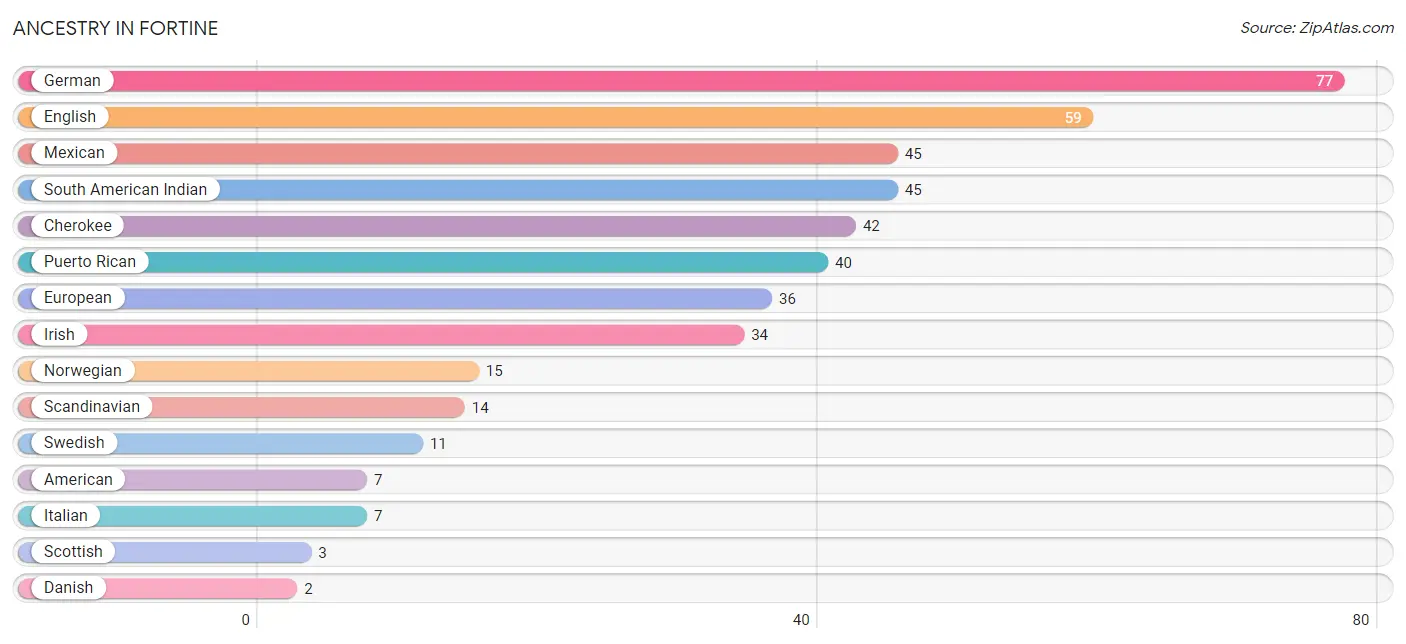
| Ancestry | # Population | % Population |
| American | 7 | 1.6% |
| Cherokee | 42 | 9.7% |
| Danish | 2 | 0.5% |
| Eastern European | 2 | 0.5% |
| English | 59 | 13.7% |
| European | 36 | 8.3% |
| French | 1 | 0.2% |
| French American Indian | 1 | 0.2% |
| German | 77 | 17.8% |
| Irish | 34 | 7.9% |
| Italian | 7 | 1.6% |
| Mexican | 45 | 10.4% |
| Norwegian | 15 | 3.5% |
| Puerto Rican | 40 | 9.3% |
| Romanian | 2 | 0.5% |
| Russian | 2 | 0.5% |
| Scandinavian | 14 | 3.2% |
| Scottish | 3 | 0.7% |
| South American Indian | 45 | 10.4% |
| Spaniard | 2 | 0.5% |
| Swedish | 11 | 2.5% | View All 21 Rows |
Immigrants in Fortine

| Immigration Origin | # Population | % Population | View All 0 Rows |
Sex and Age in Fortine
Sex and Age in Fortine
The most populous age groups in Fortine are 5 to 9 Years (30 | 16.1%) for men and 60 to 64 Years (43 | 17.5%) for women.
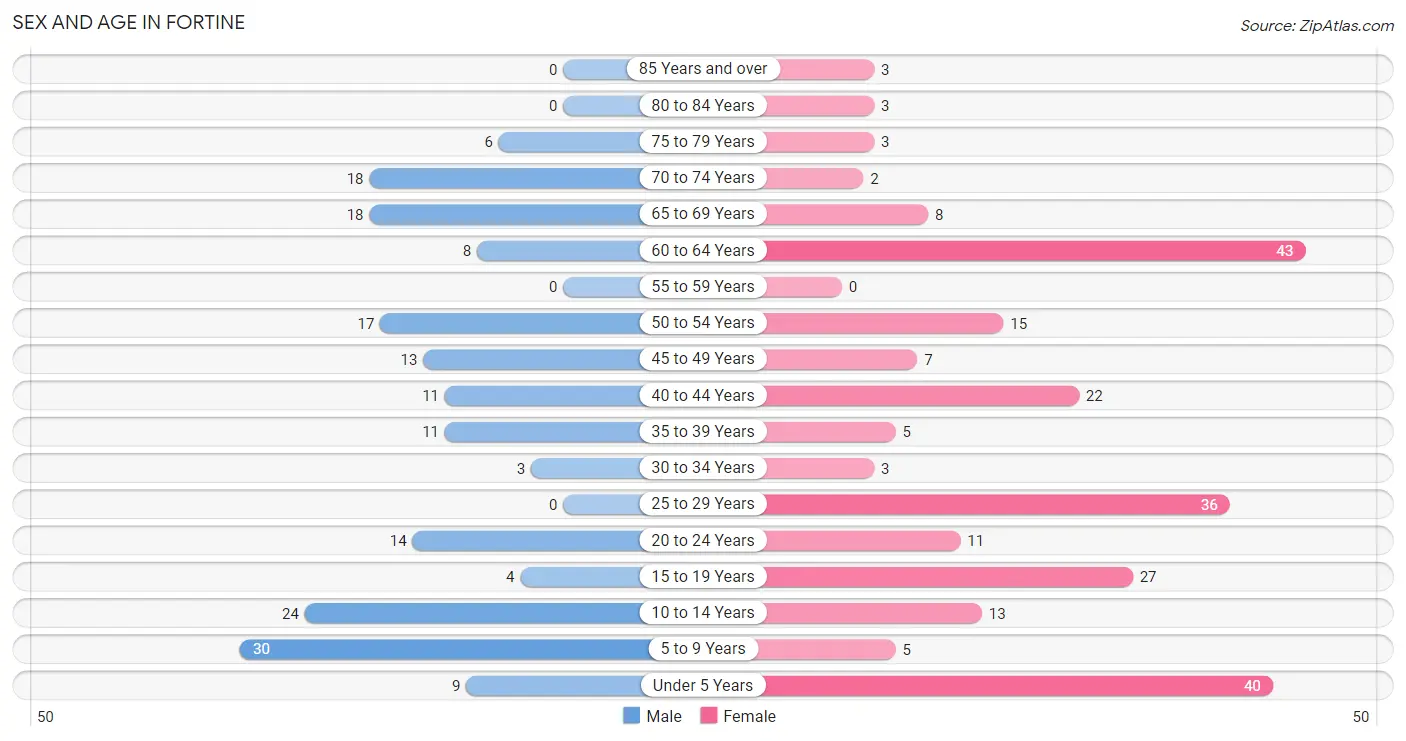
| Age Bracket | Male | Female |
| Under 5 Years | 9 (4.8%) | 40 (16.3%) |
| 5 to 9 Years | 30 (16.1%) | 5 (2.0%) |
| 10 to 14 Years | 24 (12.9%) | 13 (5.3%) |
| 15 to 19 Years | 4 (2.1%) | 27 (11.0%) |
| 20 to 24 Years | 14 (7.5%) | 11 (4.5%) |
| 25 to 29 Years | 0 (0.0%) | 36 (14.6%) |
| 30 to 34 Years | 3 (1.6%) | 3 (1.2%) |
| 35 to 39 Years | 11 (5.9%) | 5 (2.0%) |
| 40 to 44 Years | 11 (5.9%) | 22 (8.9%) |
| 45 to 49 Years | 13 (7.0%) | 7 (2.9%) |
| 50 to 54 Years | 17 (9.1%) | 15 (6.1%) |
| 55 to 59 Years | 0 (0.0%) | 0 (0.0%) |
| 60 to 64 Years | 8 (4.3%) | 43 (17.5%) |
| 65 to 69 Years | 18 (9.7%) | 8 (3.3%) |
| 70 to 74 Years | 18 (9.7%) | 2 (0.8%) |
| 75 to 79 Years | 6 (3.2%) | 3 (1.2%) |
| 80 to 84 Years | 0 (0.0%) | 3 (1.2%) |
| 85 Years and over | 0 (0.0%) | 3 (1.2%) |
| Total | 186 (100.0%) | 246 (100.0%) |
Families and Households in Fortine
Median Family Size in Fortine
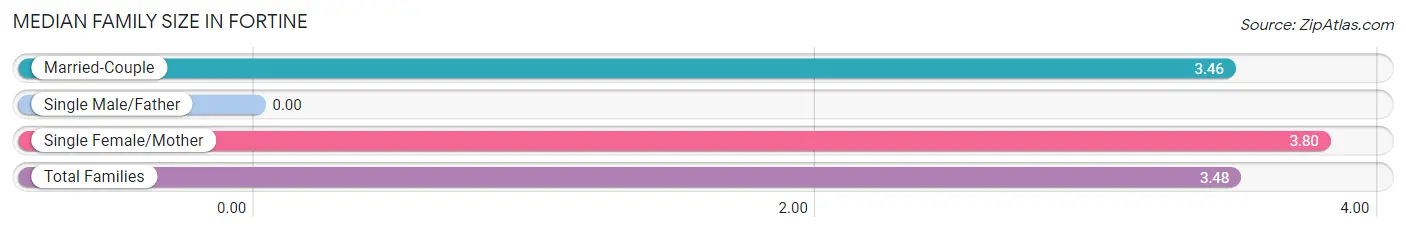
| Family Type | # Families | Family Size |
| Married-Couple | 114 (95.8%) | 3.46 |
| Single Male/Father | 0 (0.0%) | - |
| Single Female/Mother | 5 (4.2%) | 3.80 |
| Total Families | 119 (100.0%) | 3.48 |
Median Household Size in Fortine
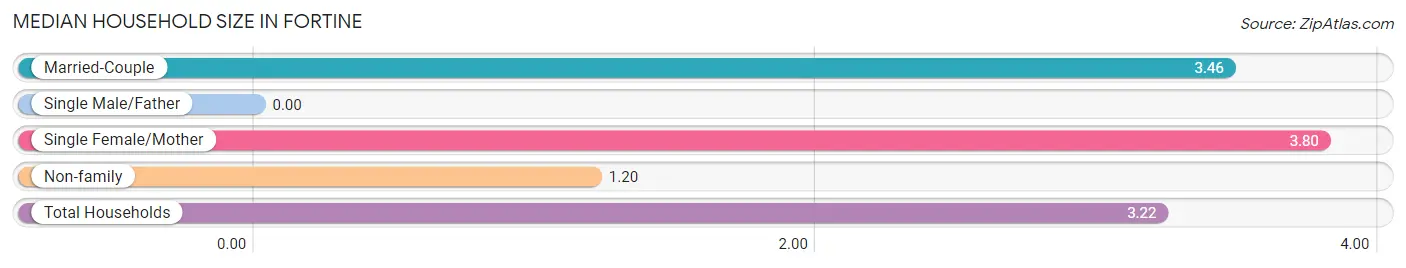
| Household Type | # Households | Household Size |
| Married-Couple | 114 (85.1%) | 3.46 |
| Single Male/Father | 0 (0.0%) | - |
| Single Female/Mother | 5 (3.7%) | 3.80 |
| Non-family | 15 (11.2%) | 1.20 |
| Total Households | 134 (100.0%) | 3.22 |
Household Size by Marriage Status in Fortine
Out of a total of 134 households in Fortine, 119 (88.8%) are family households, while 15 (11.2%) are nonfamily households. The most numerous type of family households are 2-person households, comprising 72, and the most common type of nonfamily households are 1-person households, comprising 12.
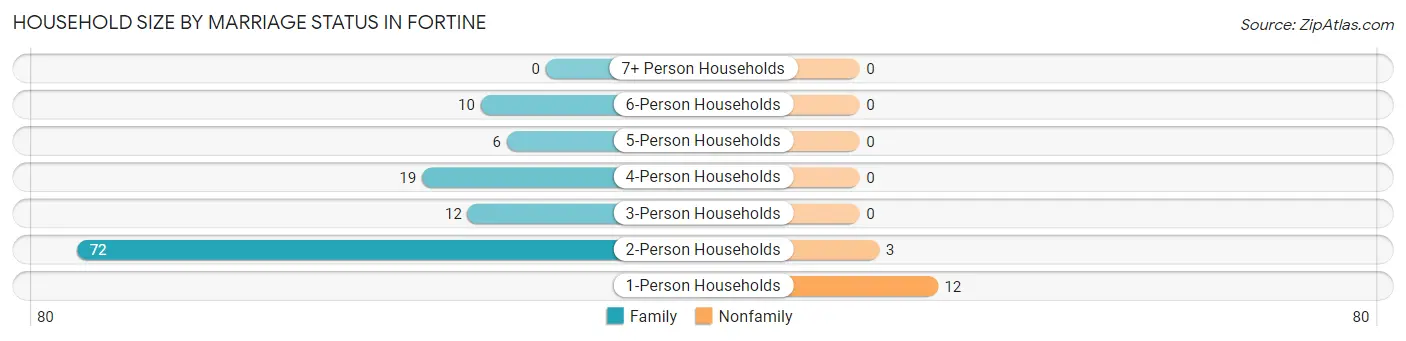
| Household Size | Family Households | Nonfamily Households |
| 1-Person Households | - | 12 (9.0%) |
| 2-Person Households | 72 (53.7%) | 3 (2.2%) |
| 3-Person Households | 12 (9.0%) | 0 (0.0%) |
| 4-Person Households | 19 (14.2%) | 0 (0.0%) |
| 5-Person Households | 6 (4.5%) | 0 (0.0%) |
| 6-Person Households | 10 (7.5%) | 0 (0.0%) |
| 7+ Person Households | 0 (0.0%) | 0 (0.0%) |
| Total | 119 (88.8%) | 15 (11.2%) |
Female Fertility in Fortine
Fertility by Age in Fortine
| Age Bracket | Women with Births | Births / 1,000 Women |
| 15 to 19 years | 0 (0.0%) | 0.0 |
| 20 to 34 years | 0 (0.0%) | 0.0 |
| 35 to 50 years | 0 (0.0%) | 0.0 |
| Total | 0 (0.0%) | 0.0 |
Fertility by Age by Marriage Status in Fortine
| Age Bracket | Married | Unmarried |
| 15 to 19 years | 0 (0.0%) | 0 (0.0%) |
| 20 to 34 years | 0 (0.0%) | 0 (0.0%) |
| 35 to 50 years | 0 (0.0%) | 0 (0.0%) |
| Total | 0 (0.0%) | 0 (0.0%) |
Fertility by Education in Fortine
| Educational Attainment | Women with Births | Births / 1,000 Women |
| Less than High School | 0 (0.0%) | 0.0 |
| High School Diploma | 0 (0.0%) | 0.0 |
| College or Associate's Degree | 0 (0.0%) | 0.0 |
| Bachelor's Degree | 0 (0.0%) | 0.0 |
| Graduate Degree | 0 (0.0%) | 0.0 |
| Total | 0 (0.0%) | 0.0 |
Fertility by Education by Marriage Status in Fortine
| Educational Attainment | Married | Unmarried |
| Less than High School | 0 (0.0%) | 0 (0.0%) |
| High School Diploma | 0 (0.0%) | 0 (0.0%) |
| College or Associate's Degree | 0 (0.0%) | 0 (0.0%) |
| Bachelor's Degree | 0 (0.0%) | 0 (0.0%) |
| Graduate Degree | 0 (0.0%) | 0 (0.0%) |
| Total | 0 (0.0%) | 0 (0.0%) |
Employment Characteristics in Fortine
Employment by Class of Employer in Fortine
Among the 154 employed individuals in Fortine, private company employees (78 | 50.6%), state government employees (35 | 22.7%), and self-employed (not incorporated) (12 | 7.8%) make up the most common classes of employment.
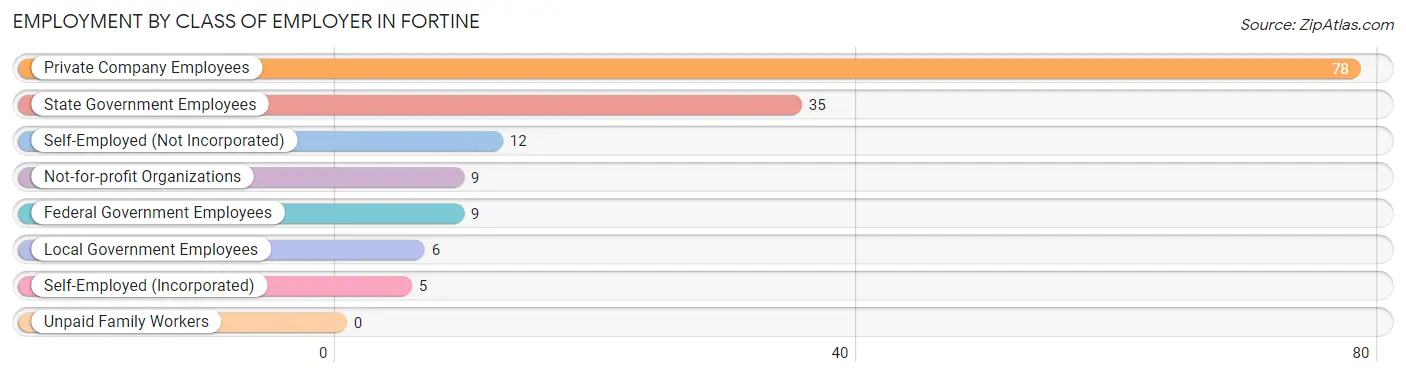
| Employer Class | # Employees | % Employees |
| Private Company Employees | 78 | 50.6% |
| Self-Employed (Incorporated) | 5 | 3.3% |
| Self-Employed (Not Incorporated) | 12 | 7.8% |
| Not-for-profit Organizations | 9 | 5.8% |
| Local Government Employees | 6 | 3.9% |
| State Government Employees | 35 | 22.7% |
| Federal Government Employees | 9 | 5.8% |
| Unpaid Family Workers | 0 | 0.0% |
| Total | 154 | 100.0% |
Employment Status by Age in Fortine
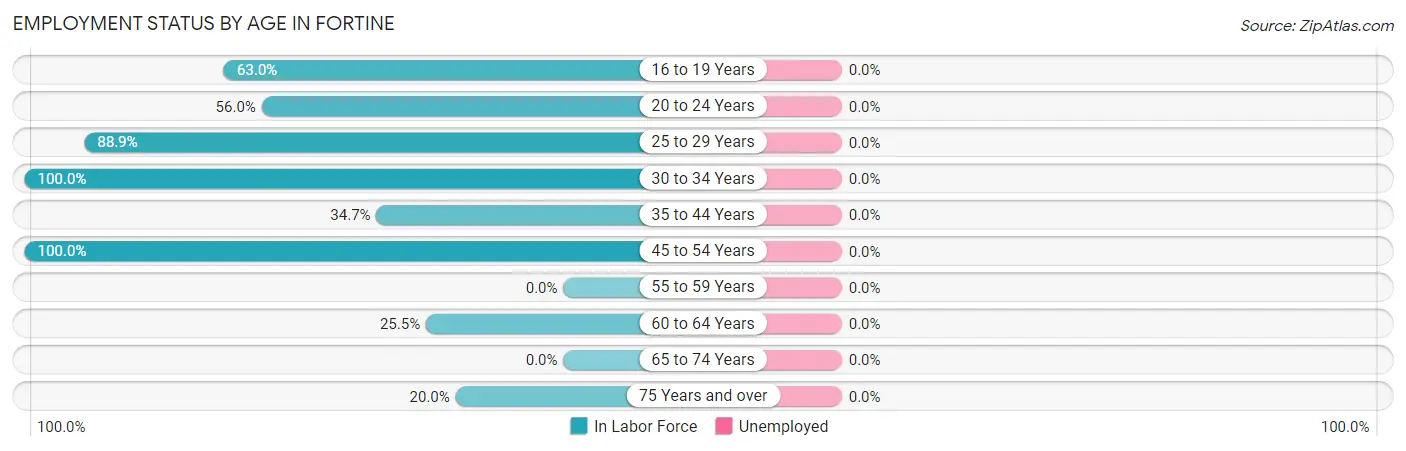
| Age Bracket | In Labor Force | Unemployed |
| 16 to 19 Years | 17 (63.0%) | 0 (0.0%) |
| 20 to 24 Years | 14 (56.0%) | 0 (0.0%) |
| 25 to 29 Years | 32 (88.9%) | 0 (0.0%) |
| 30 to 34 Years | 6 (100.0%) | 0 (0.0%) |
| 35 to 44 Years | 17 (34.7%) | 0 (0.0%) |
| 45 to 54 Years | 52 (100.0%) | 0 (0.0%) |
| 55 to 59 Years | 0 (0.0%) | 0 (0.0%) |
| 60 to 64 Years | 13 (25.5%) | 0 (0.0%) |
| 65 to 74 Years | 0 (0.0%) | 0 (0.0%) |
| 75 Years and over | 3 (20.0%) | 0 (0.0%) |
| Total | 154 (50.2%) | 0 (0.0%) |
Employment Status by Educational Attainment in Fortine
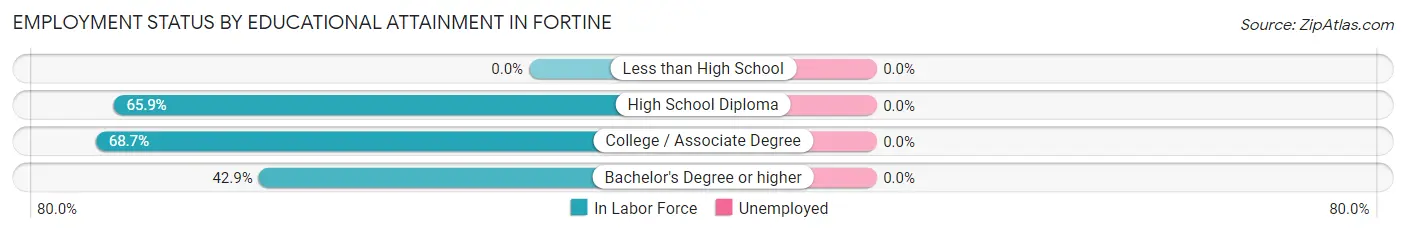
| Educational Attainment | In Labor Force | Unemployed |
| Less than High School | 0 (0.0%) | 0 (0.0%) |
| High School Diploma | 56 (65.9%) | 0 (0.0%) |
| College / Associate Degree | 46 (68.7%) | 0 (0.0%) |
| Bachelor's Degree or higher | 18 (42.9%) | 0 (0.0%) |
| Total | 120 (61.9%) | 0 (0.0%) |
Employment Occupations by Sex in Fortine
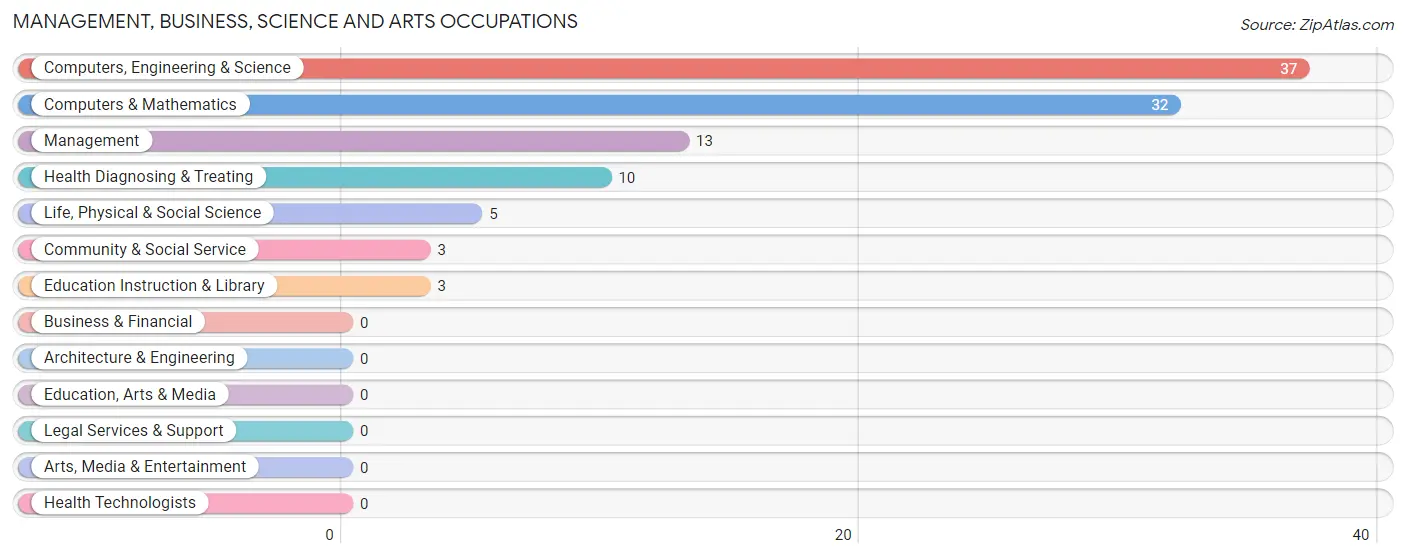
Management, Business, Science and Arts Occupations
The most common Management, Business, Science and Arts occupations in Fortine are Computers, Engineering & Science (37 | 24.0%), Computers & Mathematics (32 | 20.8%), Management (13 | 8.4%), Health Diagnosing & Treating (10 | 6.5%), and Life, Physical & Social Science (5 | 3.3%).
Management, Business, Science and Arts Occupations by Sex
Within the Management, Business, Science and Arts occupations in Fortine, the most male-oriented occupations are Management (84.6%), Life, Physical & Social Science (40.0%), and Computers, Engineering & Science (13.5%), while the most female-oriented occupations are Community & Social Service (100.0%), Education Instruction & Library (100.0%), and Health Diagnosing & Treating (100.0%).
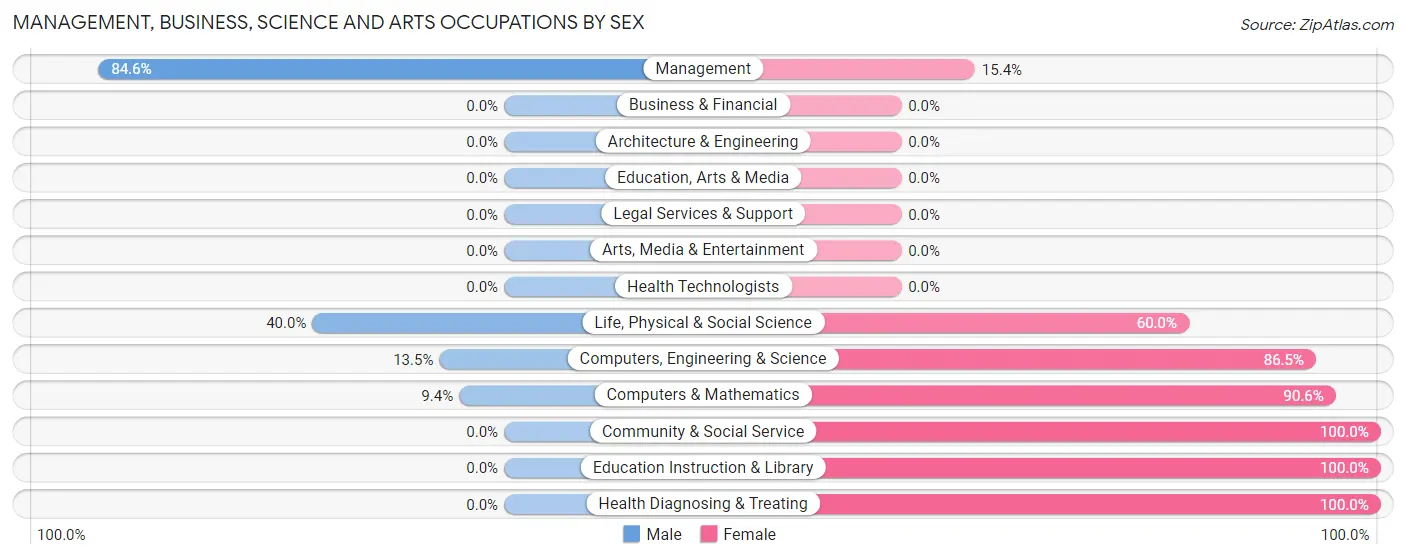
| Occupation | Male | Female |
| Management | 11 (84.6%) | 2 (15.4%) |
| Business & Financial | 0 (0.0%) | 0 (0.0%) |
| Computers, Engineering & Science | 5 (13.5%) | 32 (86.5%) |
| Computers & Mathematics | 3 (9.4%) | 29 (90.6%) |
| Architecture & Engineering | 0 (0.0%) | 0 (0.0%) |
| Life, Physical & Social Science | 2 (40.0%) | 3 (60.0%) |
| Community & Social Service | 0 (0.0%) | 3 (100.0%) |
| Education, Arts & Media | 0 (0.0%) | 0 (0.0%) |
| Legal Services & Support | 0 (0.0%) | 0 (0.0%) |
| Education Instruction & Library | 0 (0.0%) | 3 (100.0%) |
| Arts, Media & Entertainment | 0 (0.0%) | 0 (0.0%) |
| Health Diagnosing & Treating | 0 (0.0%) | 10 (100.0%) |
| Health Technologists | 0 (0.0%) | 0 (0.0%) |
| Total (Category) | 16 (25.4%) | 47 (74.6%) |
| Total (Overall) | 60 (39.0%) | 94 (61.0%) |
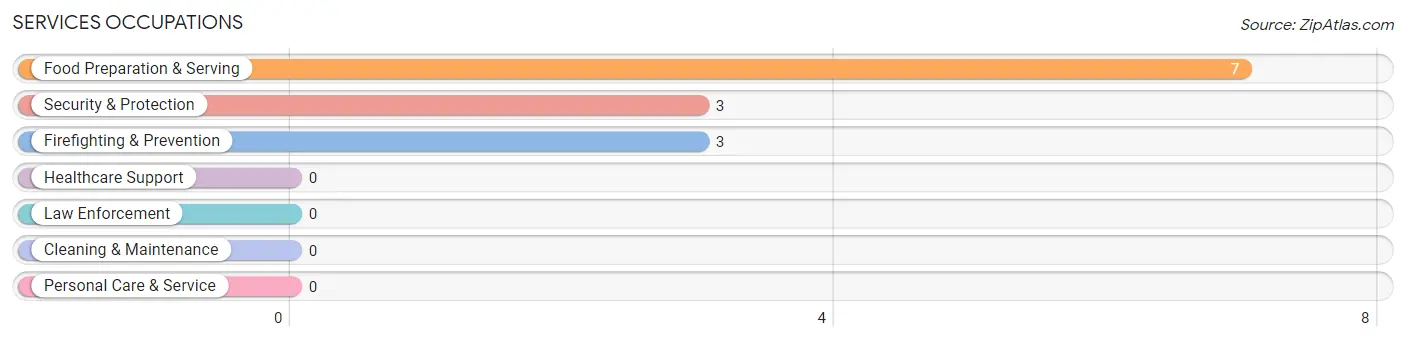
Services Occupations
The most common Services occupations in Fortine are Food Preparation & Serving (7 | 4.5%), Security & Protection (3 | 1.9%), and Firefighting & Prevention (3 | 1.9%).
Services Occupations by Sex
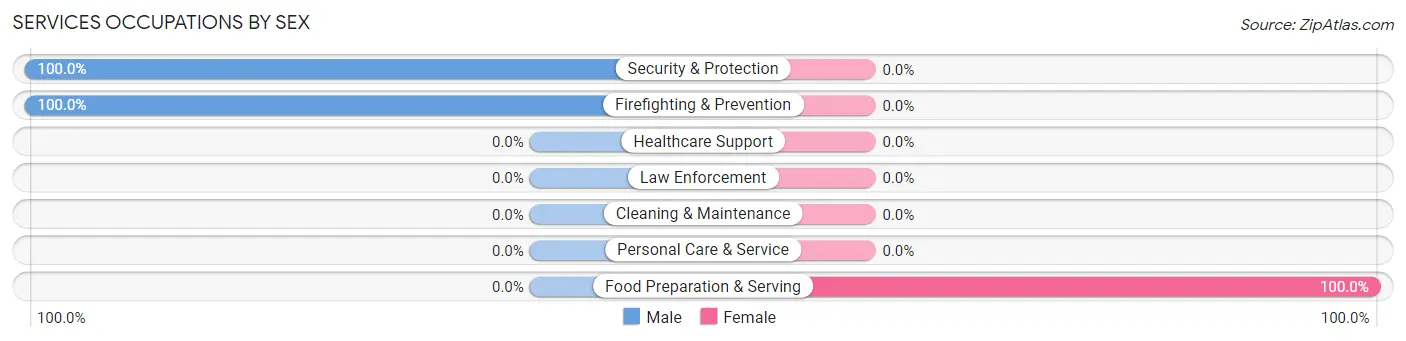
| Occupation | Male | Female |
| Healthcare Support | 0 (0.0%) | 0 (0.0%) |
| Security & Protection | 3 (100.0%) | 0 (0.0%) |
| Firefighting & Prevention | 3 (100.0%) | 0 (0.0%) |
| Law Enforcement | 0 (0.0%) | 0 (0.0%) |
| Food Preparation & Serving | 0 (0.0%) | 7 (100.0%) |
| Cleaning & Maintenance | 0 (0.0%) | 0 (0.0%) |
| Personal Care & Service | 0 (0.0%) | 0 (0.0%) |
| Total (Category) | 3 (30.0%) | 7 (70.0%) |
| Total (Overall) | 60 (39.0%) | 94 (61.0%) |
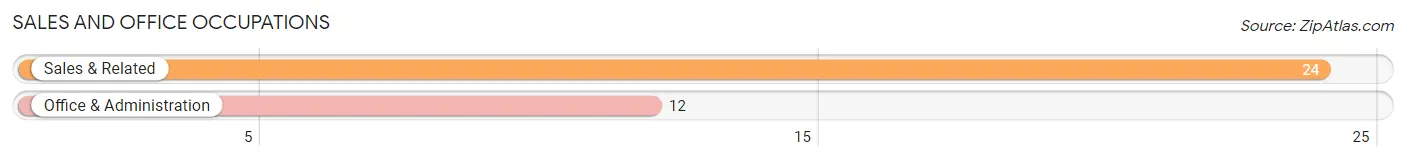
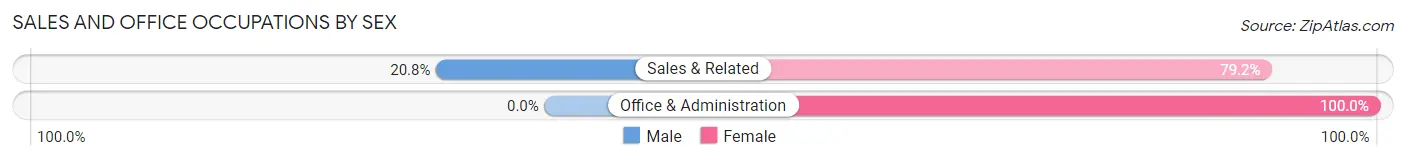
Sales and Office Occupations
The most common Sales and Office occupations in Fortine are Sales & Related (24 | 15.6%), and Office & Administration (12 | 7.8%).
Sales and Office Occupations by Sex
| Occupation | Male | Female |
| Sales & Related | 5 (20.8%) | 19 (79.2%) |
| Office & Administration | 0 (0.0%) | 12 (100.0%) |
| Total (Category) | 5 (13.9%) | 31 (86.1%) |
| Total (Overall) | 60 (39.0%) | 94 (61.0%) |
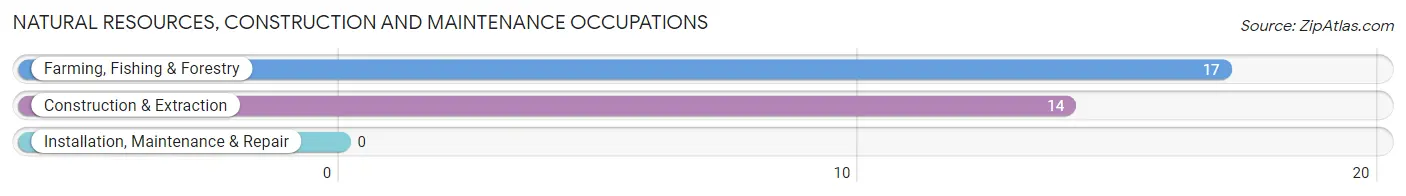
Natural Resources, Construction and Maintenance Occupations
The most common Natural Resources, Construction and Maintenance occupations in Fortine are Farming, Fishing & Forestry (17 | 11.0%), and Construction & Extraction (14 | 9.1%).
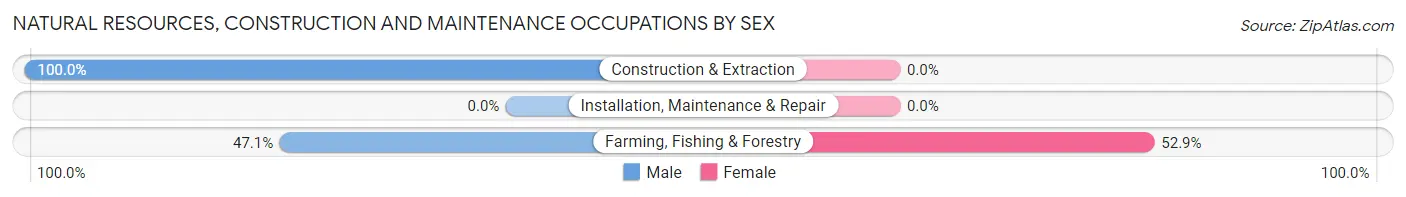
Natural Resources, Construction and Maintenance Occupations by Sex
| Occupation | Male | Female |
| Farming, Fishing & Forestry | 8 (47.1%) | 9 (52.9%) |
| Construction & Extraction | 14 (100.0%) | 0 (0.0%) |
| Installation, Maintenance & Repair | 0 (0.0%) | 0 (0.0%) |
| Total (Category) | 22 (71.0%) | 9 (29.0%) |
| Total (Overall) | 60 (39.0%) | 94 (61.0%) |
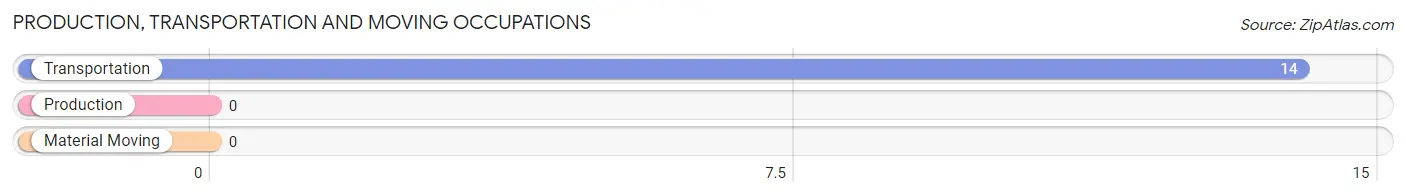
Production, Transportation and Moving Occupations
The most common Production, Transportation and Moving occupations in Fortine are , and Transportation (14 | 9.1%).
Production, Transportation and Moving Occupations by Sex
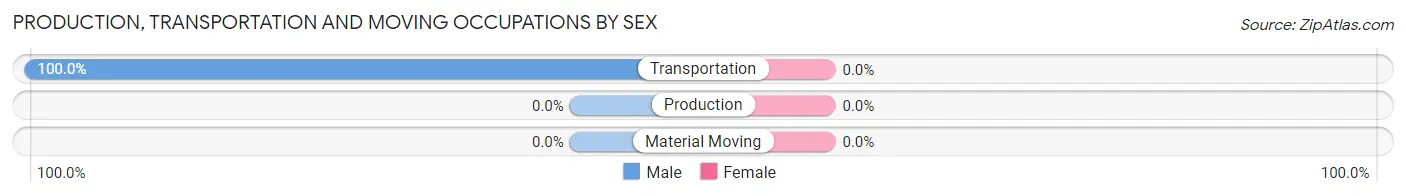
| Occupation | Male | Female |
| Production | 0 (0.0%) | 0 (0.0%) |
| Transportation | 14 (100.0%) | 0 (0.0%) |
| Material Moving | 0 (0.0%) | 0 (0.0%) |
| Total (Category) | 14 (100.0%) | 0 (0.0%) |
| Total (Overall) | 60 (39.0%) | 94 (61.0%) |
Employment Industries by Sex in Fortine
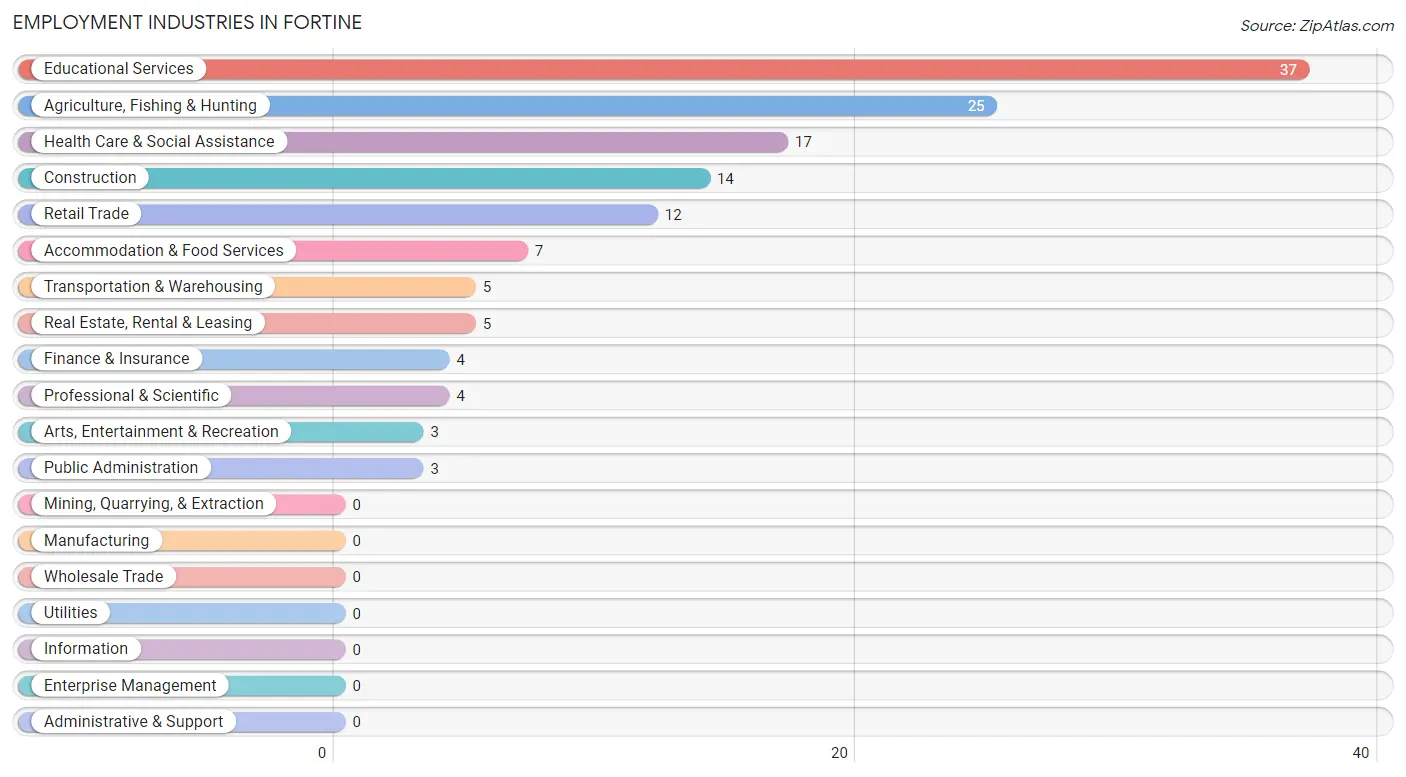
Employment Industries in Fortine
The major employment industries in Fortine include Educational Services (37 | 24.0%), Agriculture, Fishing & Hunting (25 | 16.2%), Health Care & Social Assistance (17 | 11.0%), Construction (14 | 9.1%), and Retail Trade (12 | 7.8%).
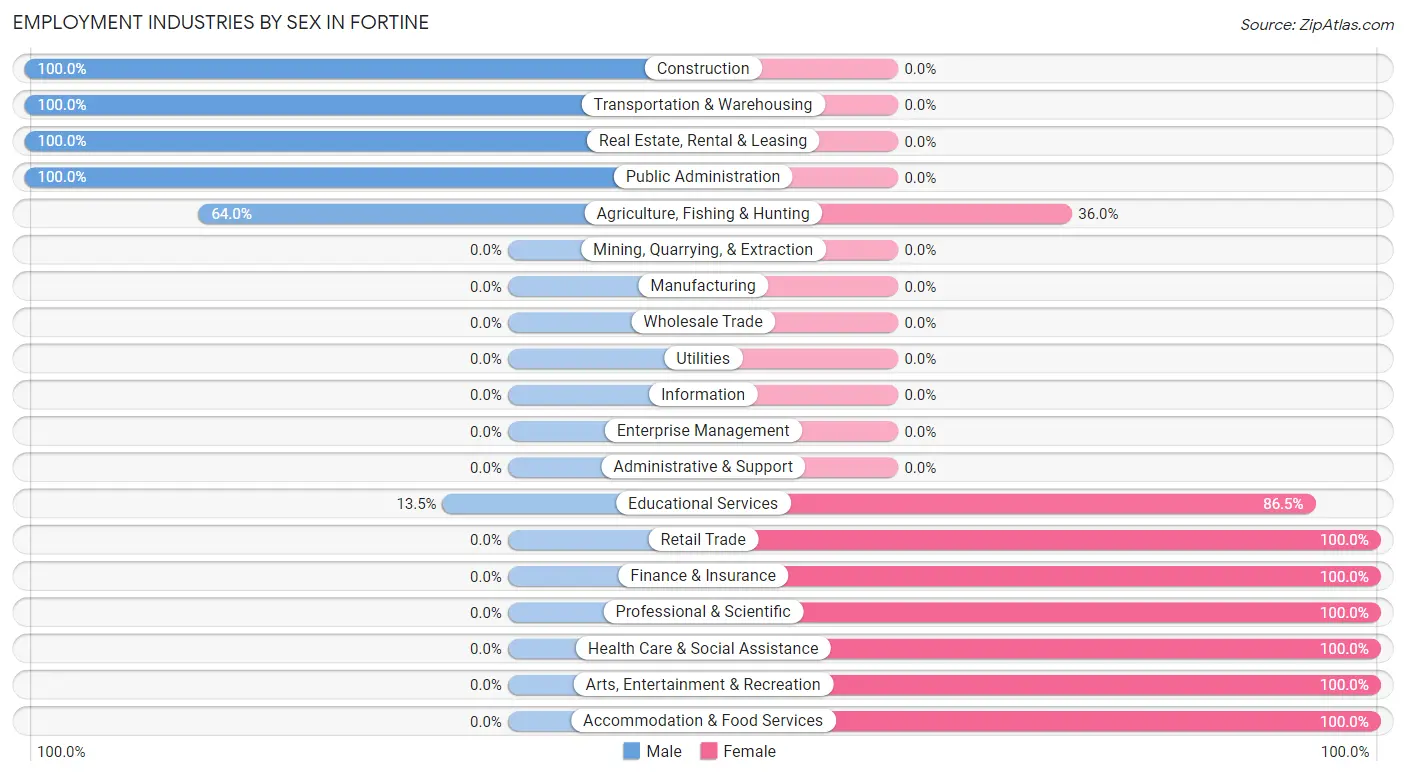
Employment Industries by Sex in Fortine
The Fortine industries that see more men than women are Construction (100.0%), Transportation & Warehousing (100.0%), and Real Estate, Rental & Leasing (100.0%), whereas the industries that tend to have a higher number of women are Retail Trade (100.0%), Finance & Insurance (100.0%), and Professional & Scientific (100.0%).
| Industry | Male | Female |
| Agriculture, Fishing & Hunting | 16 (64.0%) | 9 (36.0%) |
| Mining, Quarrying, & Extraction | 0 (0.0%) | 0 (0.0%) |
| Construction | 14 (100.0%) | 0 (0.0%) |
| Manufacturing | 0 (0.0%) | 0 (0.0%) |
| Wholesale Trade | 0 (0.0%) | 0 (0.0%) |
| Retail Trade | 0 (0.0%) | 12 (100.0%) |
| Transportation & Warehousing | 5 (100.0%) | 0 (0.0%) |
| Utilities | 0 (0.0%) | 0 (0.0%) |
| Information | 0 (0.0%) | 0 (0.0%) |
| Finance & Insurance | 0 (0.0%) | 4 (100.0%) |
| Real Estate, Rental & Leasing | 5 (100.0%) | 0 (0.0%) |
| Professional & Scientific | 0 (0.0%) | 4 (100.0%) |
| Enterprise Management | 0 (0.0%) | 0 (0.0%) |
| Administrative & Support | 0 (0.0%) | 0 (0.0%) |
| Educational Services | 5 (13.5%) | 32 (86.5%) |
| Health Care & Social Assistance | 0 (0.0%) | 17 (100.0%) |
| Arts, Entertainment & Recreation | 0 (0.0%) | 3 (100.0%) |
| Accommodation & Food Services | 0 (0.0%) | 7 (100.0%) |
| Public Administration | 3 (100.0%) | 0 (0.0%) |
| Total | 60 (39.0%) | 94 (61.0%) |
Education in Fortine
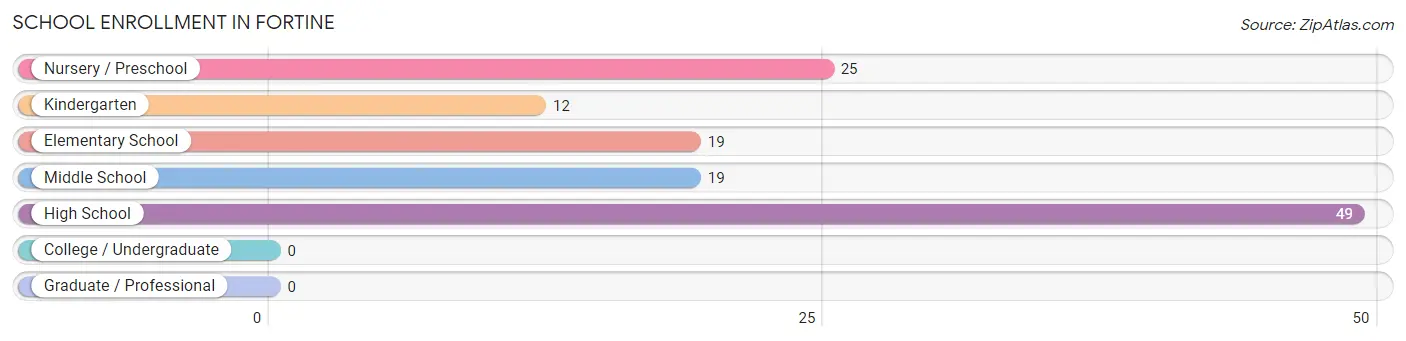
School Enrollment in Fortine
The most common levels of schooling among the 124 students in Fortine are high school (49 | 39.5%), nursery / preschool (25 | 20.2%), and elementary school (19 | 15.3%).
| School Level | # Students | % Students |
| Nursery / Preschool | 25 | 20.2% |
| Kindergarten | 12 | 9.7% |
| Elementary School | 19 | 15.3% |
| Middle School | 19 | 15.3% |
| High School | 49 | 39.5% |
| College / Undergraduate | 0 | 0.0% |
| Graduate / Professional | 0 | 0.0% |
| Total | 124 | 100.0% |
School Enrollment by Age by Funding Source in Fortine
Out of a total of 124 students who are enrolled in schools in Fortine, 64 (51.6%) attend a private institution, while the remaining 60 (48.4%) are enrolled in public schools. The age group of 3 to 4 year olds has the highest likelihood of being enrolled in private schools, with 25 (100.0% in the age bracket) enrolled. Conversely, the age group of 15 to 17 year olds has the lowest likelihood of being enrolled in a private school, with 15 (100.0% in the age bracket) attending a public institution.
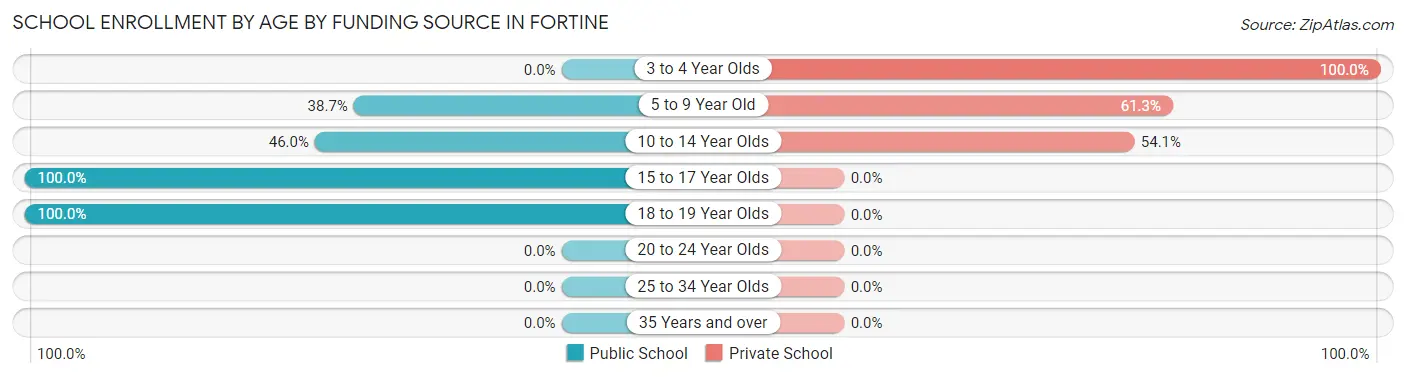
| Age Bracket | Public School | Private School |
| 3 to 4 Year Olds | 0 (0.0%) | 25 (100.0%) |
| 5 to 9 Year Old | 12 (38.7%) | 19 (61.3%) |
| 10 to 14 Year Olds | 17 (46.0%) | 20 (54.0%) |
| 15 to 17 Year Olds | 15 (100.0%) | 0 (0.0%) |
| 18 to 19 Year Olds | 16 (100.0%) | 0 (0.0%) |
| 20 to 24 Year Olds | 0 (0.0%) | 0 (0.0%) |
| 25 to 34 Year Olds | 0 (0.0%) | 0 (0.0%) |
| 35 Years and over | 0 (0.0%) | 0 (0.0%) |
| Total | 60 (48.4%) | 64 (51.6%) |
Educational Attainment by Field of Study in Fortine
Science & technology (16 | 21.3%), social sciences (14 | 18.7%), bio, nature & agricultural (10 | 13.3%), arts & humanities (10 | 13.3%), and physical & health sciences (6 | 8.0%) are the most common fields of study among 75 individuals in Fortine who have obtained a bachelor's degree or higher.
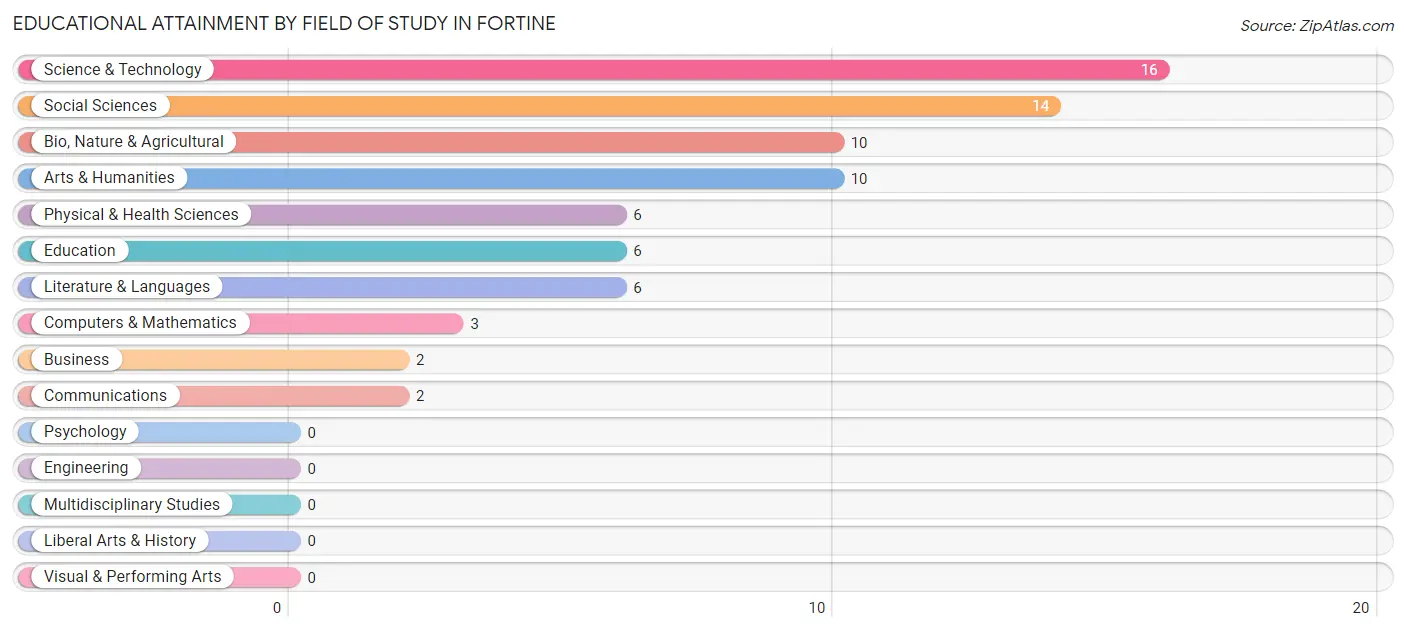
| Field of Study | # Graduates | % Graduates |
| Computers & Mathematics | 3 | 4.0% |
| Bio, Nature & Agricultural | 10 | 13.3% |
| Physical & Health Sciences | 6 | 8.0% |
| Psychology | 0 | 0.0% |
| Social Sciences | 14 | 18.7% |
| Engineering | 0 | 0.0% |
| Multidisciplinary Studies | 0 | 0.0% |
| Science & Technology | 16 | 21.3% |
| Business | 2 | 2.7% |
| Education | 6 | 8.0% |
| Literature & Languages | 6 | 8.0% |
| Liberal Arts & History | 0 | 0.0% |
| Visual & Performing Arts | 0 | 0.0% |
| Communications | 2 | 2.7% |
| Arts & Humanities | 10 | 13.3% |
| Total | 75 | 100.0% |
Transportation & Commute in Fortine
Vehicle Availability by Sex in Fortine
The most prevalent vehicle ownership categories in Fortine are males with 2 vehicles (23, accounting for 38.3%) and females with 2 vehicles (29, making up 24.5%).
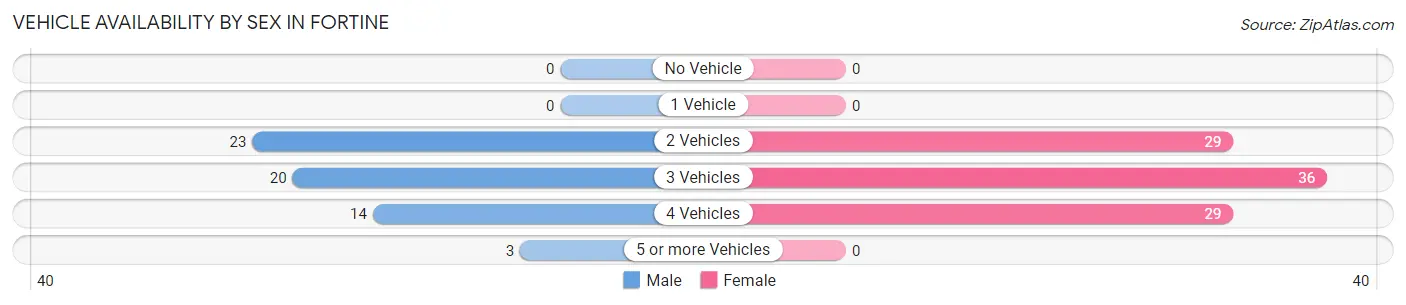
| Vehicles Available | Male | Female |
| No Vehicle | 0 (0.0%) | 0 (0.0%) |
| 1 Vehicle | 0 (0.0%) | 0 (0.0%) |
| 2 Vehicles | 23 (38.3%) | 29 (30.8%) |
| 3 Vehicles | 20 (33.3%) | 36 (38.3%) |
| 4 Vehicles | 14 (23.3%) | 29 (30.8%) |
| 5 or more Vehicles | 3 (5.0%) | 0 (0.0%) |
| Total | 60 (100.0%) | 94 (100.0%) |
Commute Time in Fortine
The most frequently occuring commute durations in Fortine are 5 to 9 minutes (22 commuters, 22.5%), 30 to 34 minutes (22 commuters, 22.5%), and 20 to 24 minutes (16 commuters, 16.3%).
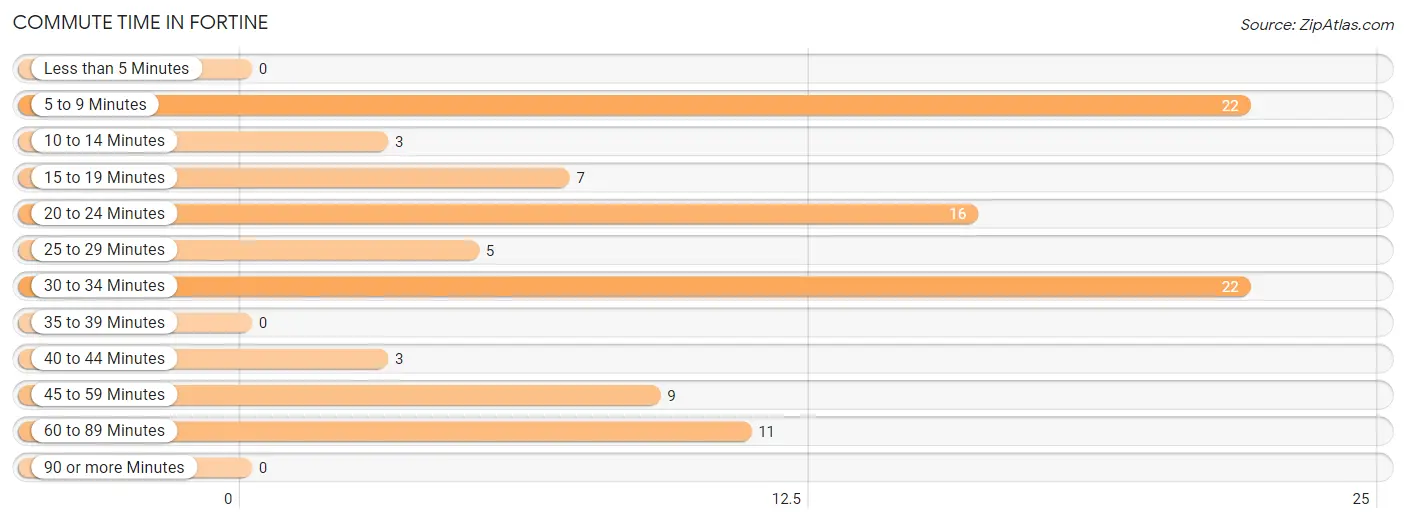
| Commute Time | # Commuters | % Commuters |
| Less than 5 Minutes | 0 | 0.0% |
| 5 to 9 Minutes | 22 | 22.5% |
| 10 to 14 Minutes | 3 | 3.1% |
| 15 to 19 Minutes | 7 | 7.1% |
| 20 to 24 Minutes | 16 | 16.3% |
| 25 to 29 Minutes | 5 | 5.1% |
| 30 to 34 Minutes | 22 | 22.5% |
| 35 to 39 Minutes | 0 | 0.0% |
| 40 to 44 Minutes | 3 | 3.1% |
| 45 to 59 Minutes | 9 | 9.2% |
| 60 to 89 Minutes | 11 | 11.2% |
| 90 or more Minutes | 0 | 0.0% |
Commute Time by Sex in Fortine
The most common commute times in Fortine are 30 to 34 minutes (17 commuters, 36.2%) for males and 5 to 9 minutes (22 commuters, 43.1%) for females.
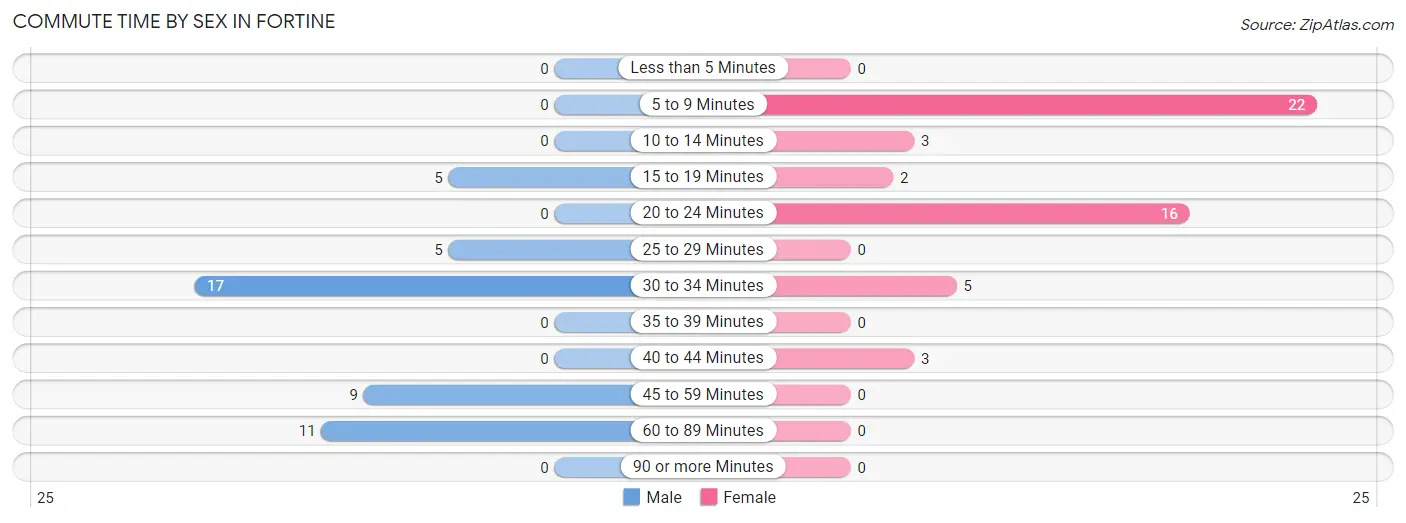
| Commute Time | Male | Female |
| Less than 5 Minutes | 0 (0.0%) | 0 (0.0%) |
| 5 to 9 Minutes | 0 (0.0%) | 22 (43.1%) |
| 10 to 14 Minutes | 0 (0.0%) | 3 (5.9%) |
| 15 to 19 Minutes | 5 (10.6%) | 2 (3.9%) |
| 20 to 24 Minutes | 0 (0.0%) | 16 (31.4%) |
| 25 to 29 Minutes | 5 (10.6%) | 0 (0.0%) |
| 30 to 34 Minutes | 17 (36.2%) | 5 (9.8%) |
| 35 to 39 Minutes | 0 (0.0%) | 0 (0.0%) |
| 40 to 44 Minutes | 0 (0.0%) | 3 (5.9%) |
| 45 to 59 Minutes | 9 (19.2%) | 0 (0.0%) |
| 60 to 89 Minutes | 11 (23.4%) | 0 (0.0%) |
| 90 or more Minutes | 0 (0.0%) | 0 (0.0%) |
Time of Departure to Work by Sex in Fortine
The most frequent times of departure to work in Fortine are 12:00 AM to 4:59 AM (27, 57.5%) for males and 6:30 AM to 6:59 AM (16, 31.4%) for females.
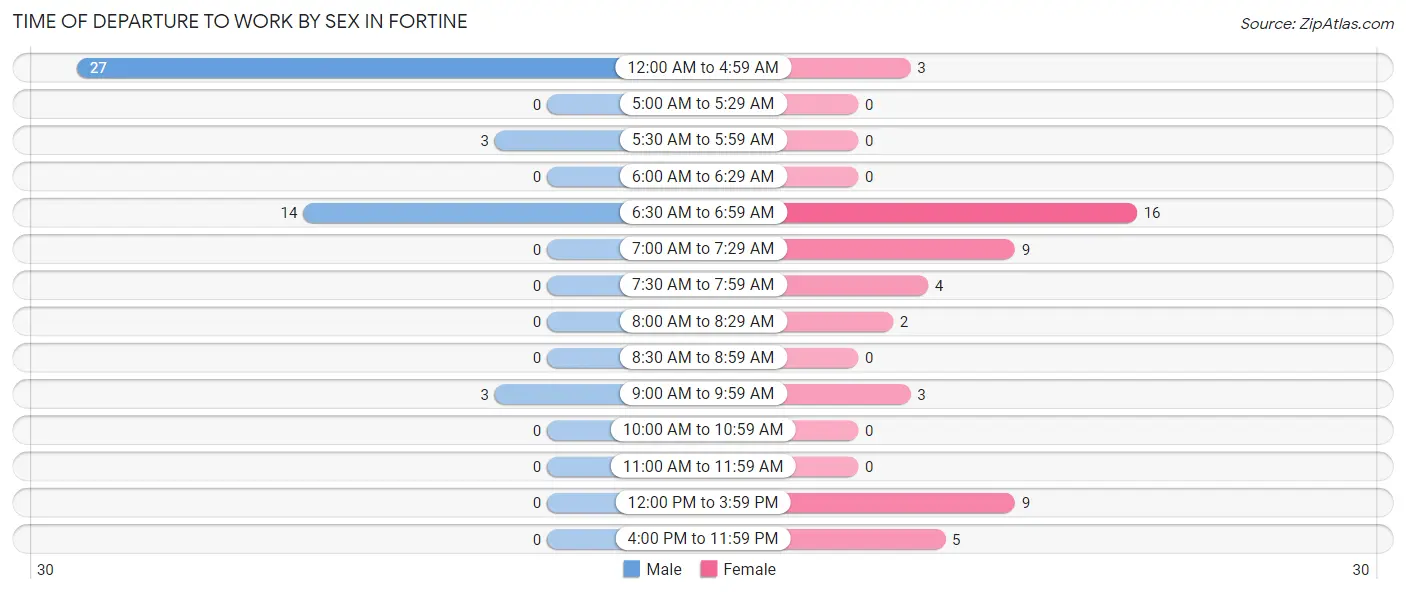
| Time of Departure | Male | Female |
| 12:00 AM to 4:59 AM | 27 (57.5%) | 3 (5.9%) |
| 5:00 AM to 5:29 AM | 0 (0.0%) | 0 (0.0%) |
| 5:30 AM to 5:59 AM | 3 (6.4%) | 0 (0.0%) |
| 6:00 AM to 6:29 AM | 0 (0.0%) | 0 (0.0%) |
| 6:30 AM to 6:59 AM | 14 (29.8%) | 16 (31.4%) |
| 7:00 AM to 7:29 AM | 0 (0.0%) | 9 (17.6%) |
| 7:30 AM to 7:59 AM | 0 (0.0%) | 4 (7.8%) |
| 8:00 AM to 8:29 AM | 0 (0.0%) | 2 (3.9%) |
| 8:30 AM to 8:59 AM | 0 (0.0%) | 0 (0.0%) |
| 9:00 AM to 9:59 AM | 3 (6.4%) | 3 (5.9%) |
| 10:00 AM to 10:59 AM | 0 (0.0%) | 0 (0.0%) |
| 11:00 AM to 11:59 AM | 0 (0.0%) | 0 (0.0%) |
| 12:00 PM to 3:59 PM | 0 (0.0%) | 9 (17.6%) |
| 4:00 PM to 11:59 PM | 0 (0.0%) | 5 (9.8%) |
| Total | 47 (100.0%) | 51 (100.0%) |
Housing Occupancy in Fortine
Occupancy by Ownership in Fortine
Of the total 134 dwellings in Fortine, owner-occupied units account for 106 (79.1%), while renter-occupied units make up 28 (20.9%).
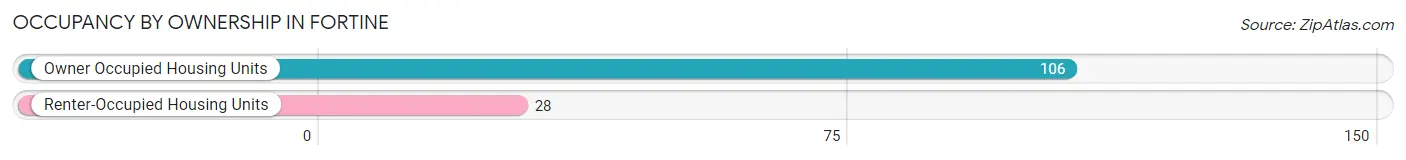
| Occupancy | # Housing Units | % Housing Units |
| Owner Occupied Housing Units | 106 | 79.1% |
| Renter-Occupied Housing Units | 28 | 20.9% |
| Total Occupied Housing Units | 134 | 100.0% |
Occupancy by Household Size in Fortine
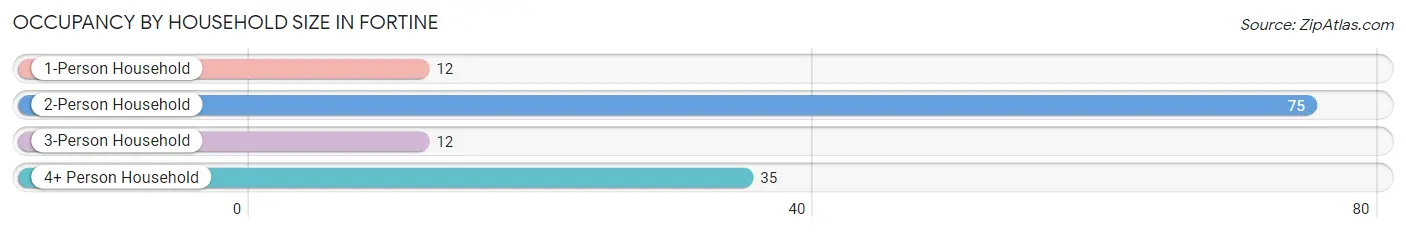
| Household Size | # Housing Units | % Housing Units |
| 1-Person Household | 12 | 9.0% |
| 2-Person Household | 75 | 56.0% |
| 3-Person Household | 12 | 9.0% |
| 4+ Person Household | 35 | 26.1% |
| Total Housing Units | 134 | 100.0% |
Occupancy by Ownership by Household Size in Fortine
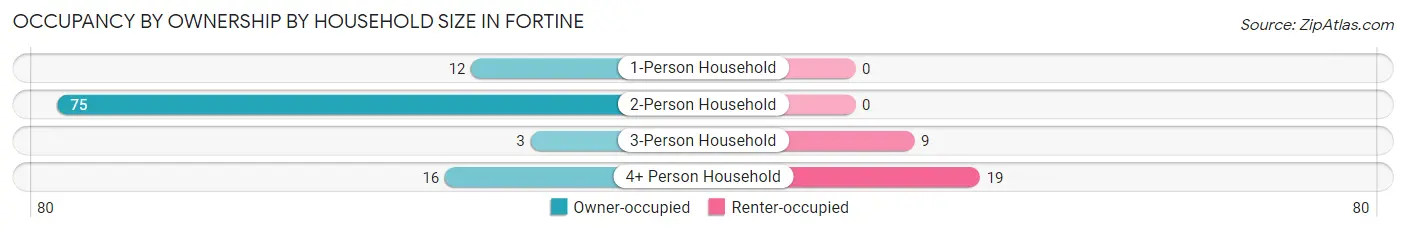
| Household Size | Owner-occupied | Renter-occupied |
| 1-Person Household | 12 (100.0%) | 0 (0.0%) |
| 2-Person Household | 75 (100.0%) | 0 (0.0%) |
| 3-Person Household | 3 (25.0%) | 9 (75.0%) |
| 4+ Person Household | 16 (45.7%) | 19 (54.3%) |
| Total Housing Units | 106 (79.1%) | 28 (20.9%) |
Occupancy by Educational Attainment in Fortine
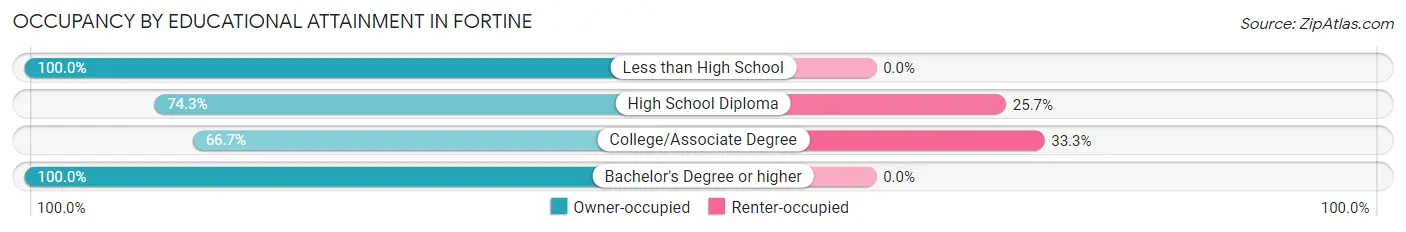
| Household Size | Owner-occupied | Renter-occupied |
| Less than High School | 3 (100.0%) | 0 (0.0%) |
| High School Diploma | 26 (74.3%) | 9 (25.7%) |
| College/Associate Degree | 38 (66.7%) | 19 (33.3%) |
| Bachelor's Degree or higher | 39 (100.0%) | 0 (0.0%) |
Occupancy by Age of Householder in Fortine
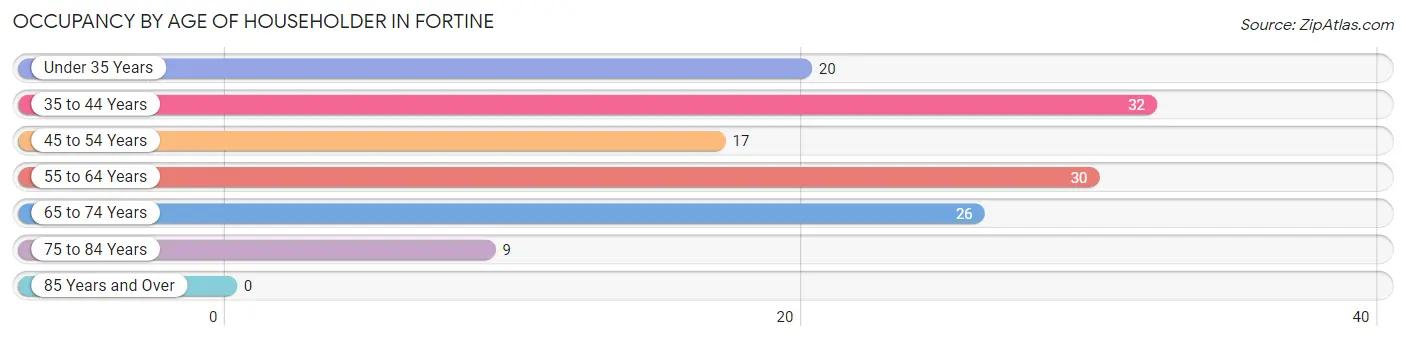
| Age Bracket | # Households | % Households |
| Under 35 Years | 20 | 14.9% |
| 35 to 44 Years | 32 | 23.9% |
| 45 to 54 Years | 17 | 12.7% |
| 55 to 64 Years | 30 | 22.4% |
| 65 to 74 Years | 26 | 19.4% |
| 75 to 84 Years | 9 | 6.7% |
| 85 Years and Over | 0 | 0.0% |
| Total | 134 | 100.0% |
Housing Finances in Fortine
Median Income by Occupancy in Fortine
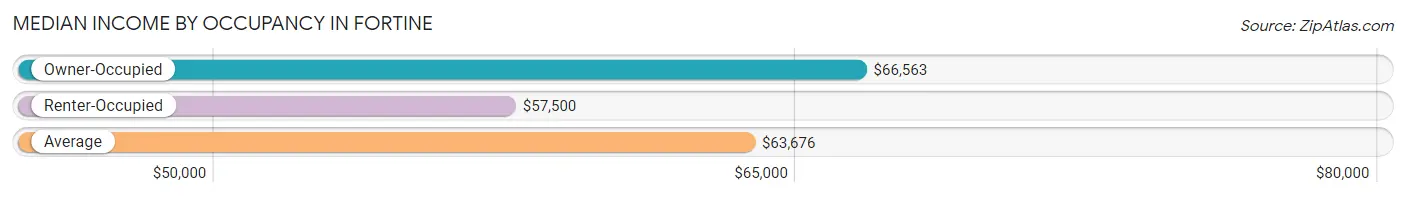
| Occupancy Type | # Households | Median Income |
| Owner-Occupied | 106 (79.1%) | $66,563 |
| Renter-Occupied | 28 (20.9%) | $57,500 |
| Average | 134 (100.0%) | $63,676 |
Occupancy by Householder Income Bracket in Fortine
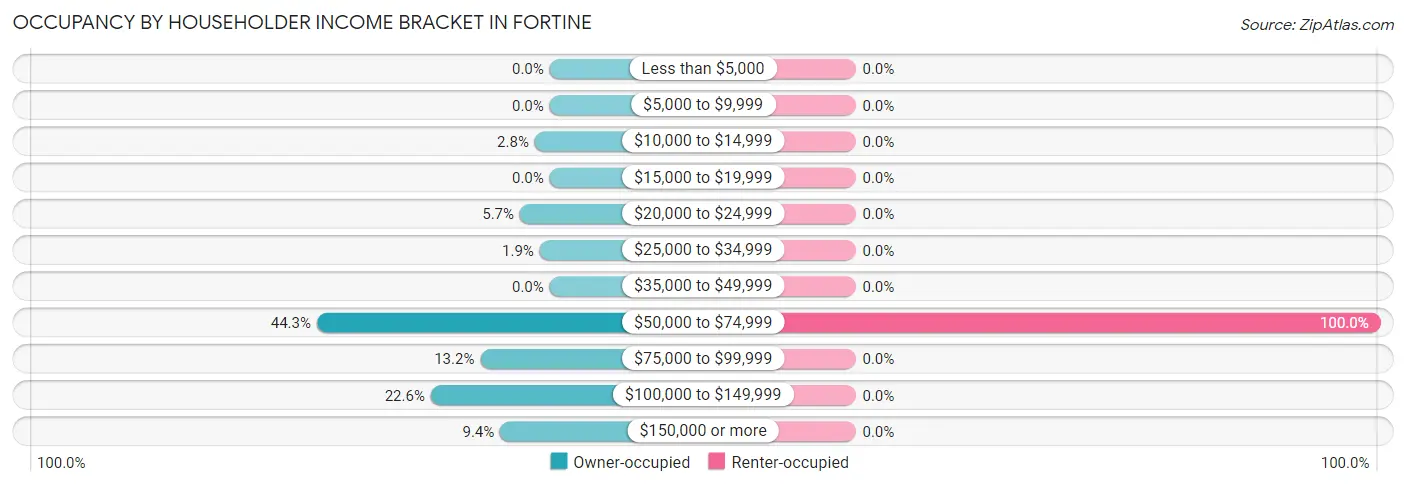
| Income Bracket | Owner-occupied | Renter-occupied |
| Less than $5,000 | 0 (0.0%) | 0 (0.0%) |
| $5,000 to $9,999 | 0 (0.0%) | 0 (0.0%) |
| $10,000 to $14,999 | 3 (2.8%) | 0 (0.0%) |
| $15,000 to $19,999 | 0 (0.0%) | 0 (0.0%) |
| $20,000 to $24,999 | 6 (5.7%) | 0 (0.0%) |
| $25,000 to $34,999 | 2 (1.9%) | 0 (0.0%) |
| $35,000 to $49,999 | 0 (0.0%) | 0 (0.0%) |
| $50,000 to $74,999 | 47 (44.3%) | 28 (100.0%) |
| $75,000 to $99,999 | 14 (13.2%) | 0 (0.0%) |
| $100,000 to $149,999 | 24 (22.6%) | 0 (0.0%) |
| $150,000 or more | 10 (9.4%) | 0 (0.0%) |
| Total | 106 (100.0%) | 28 (100.0%) |
Monthly Housing Cost Tiers in Fortine
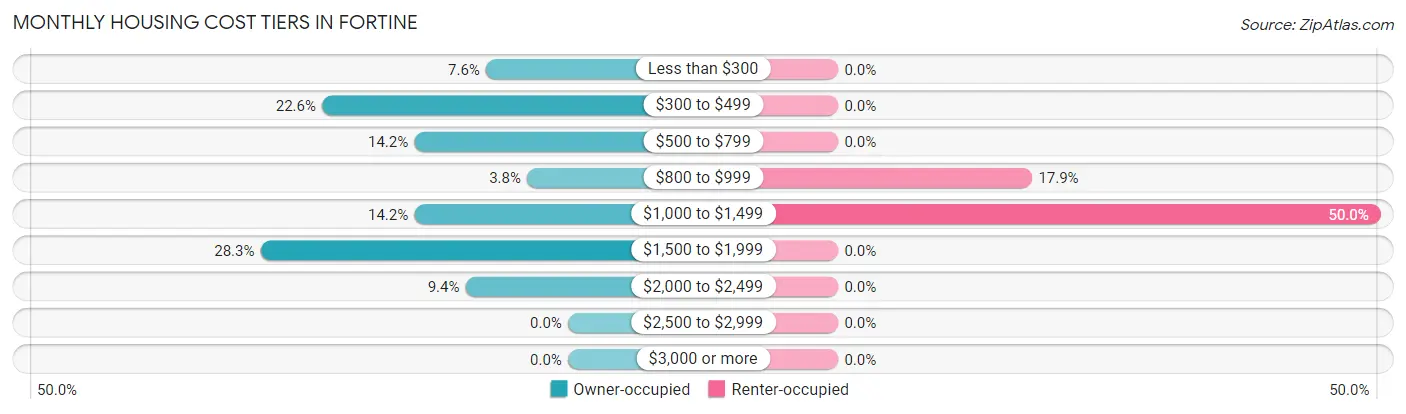
| Monthly Cost | Owner-occupied | Renter-occupied |
| Less than $300 | 8 (7.5%) | 0 (0.0%) |
| $300 to $499 | 24 (22.6%) | 0 (0.0%) |
| $500 to $799 | 15 (14.1%) | 0 (0.0%) |
| $800 to $999 | 4 (3.8%) | 5 (17.9%) |
| $1,000 to $1,499 | 15 (14.1%) | 14 (50.0%) |
| $1,500 to $1,999 | 30 (28.3%) | 0 (0.0%) |
| $2,000 to $2,499 | 10 (9.4%) | 0 (0.0%) |
| $2,500 to $2,999 | 0 (0.0%) | 0 (0.0%) |
| $3,000 or more | 0 (0.0%) | 0 (0.0%) |
| Total | 106 (100.0%) | 28 (100.0%) |
Physical Housing Characteristics in Fortine
Housing Structures in Fortine
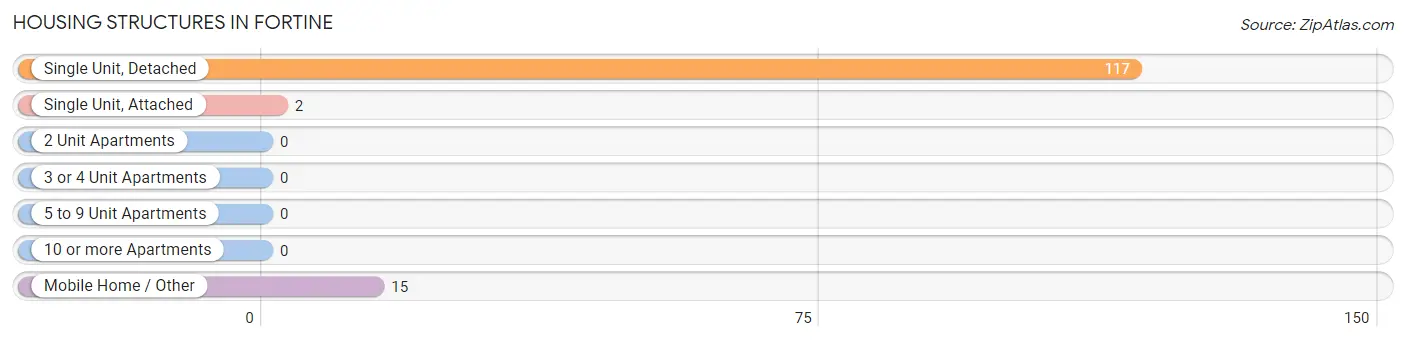
| Structure Type | # Housing Units | % Housing Units |
| Single Unit, Detached | 117 | 87.3% |
| Single Unit, Attached | 2 | 1.5% |
| 2 Unit Apartments | 0 | 0.0% |
| 3 or 4 Unit Apartments | 0 | 0.0% |
| 5 to 9 Unit Apartments | 0 | 0.0% |
| 10 or more Apartments | 0 | 0.0% |
| Mobile Home / Other | 15 | 11.2% |
| Total | 134 | 100.0% |
Housing Structures by Occupancy in Fortine
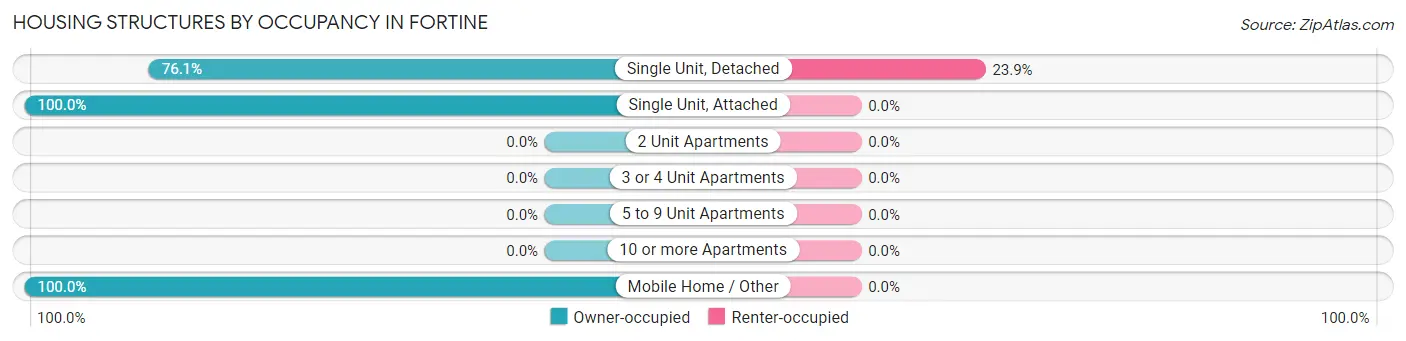
| Structure Type | Owner-occupied | Renter-occupied |
| Single Unit, Detached | 89 (76.1%) | 28 (23.9%) |
| Single Unit, Attached | 2 (100.0%) | 0 (0.0%) |
| 2 Unit Apartments | 0 (0.0%) | 0 (0.0%) |
| 3 or 4 Unit Apartments | 0 (0.0%) | 0 (0.0%) |
| 5 to 9 Unit Apartments | 0 (0.0%) | 0 (0.0%) |
| 10 or more Apartments | 0 (0.0%) | 0 (0.0%) |
| Mobile Home / Other | 15 (100.0%) | 0 (0.0%) |
| Total | 106 (79.1%) | 28 (20.9%) |
Housing Structures by Number of Rooms in Fortine
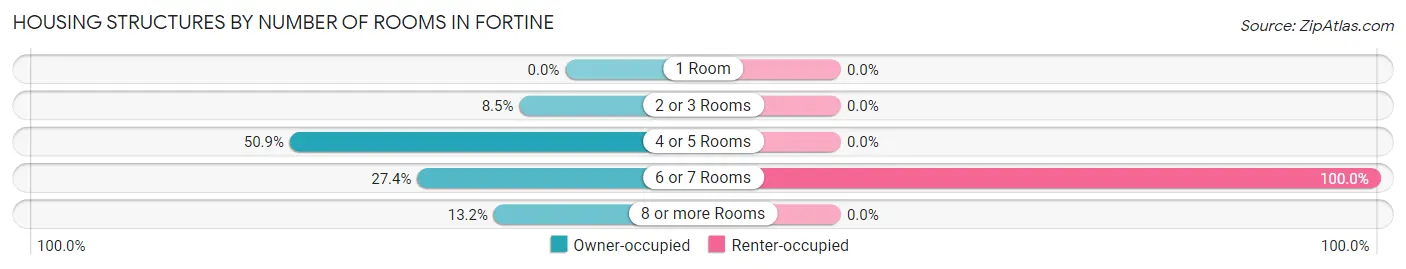
| Number of Rooms | Owner-occupied | Renter-occupied |
| 1 Room | 0 (0.0%) | 0 (0.0%) |
| 2 or 3 Rooms | 9 (8.5%) | 0 (0.0%) |
| 4 or 5 Rooms | 54 (50.9%) | 0 (0.0%) |
| 6 or 7 Rooms | 29 (27.4%) | 28 (100.0%) |
| 8 or more Rooms | 14 (13.2%) | 0 (0.0%) |
| Total | 106 (100.0%) | 28 (100.0%) |
Housing Structure by Heating Type in Fortine
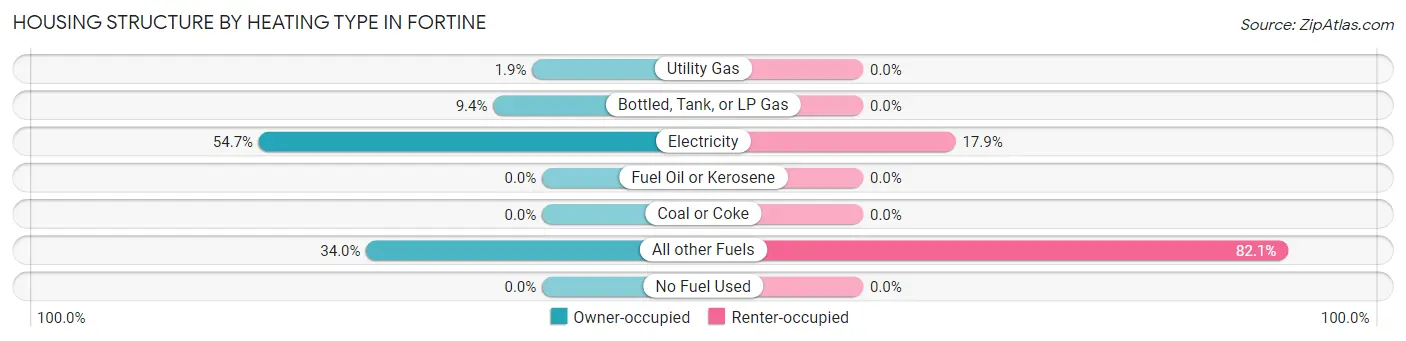
| Heating Type | Owner-occupied | Renter-occupied |
| Utility Gas | 2 (1.9%) | 0 (0.0%) |
| Bottled, Tank, or LP Gas | 10 (9.4%) | 0 (0.0%) |
| Electricity | 58 (54.7%) | 5 (17.9%) |
| Fuel Oil or Kerosene | 0 (0.0%) | 0 (0.0%) |
| Coal or Coke | 0 (0.0%) | 0 (0.0%) |
| All other Fuels | 36 (34.0%) | 23 (82.1%) |
| No Fuel Used | 0 (0.0%) | 0 (0.0%) |
| Total | 106 (100.0%) | 28 (100.0%) |
Household Vehicle Usage in Fortine
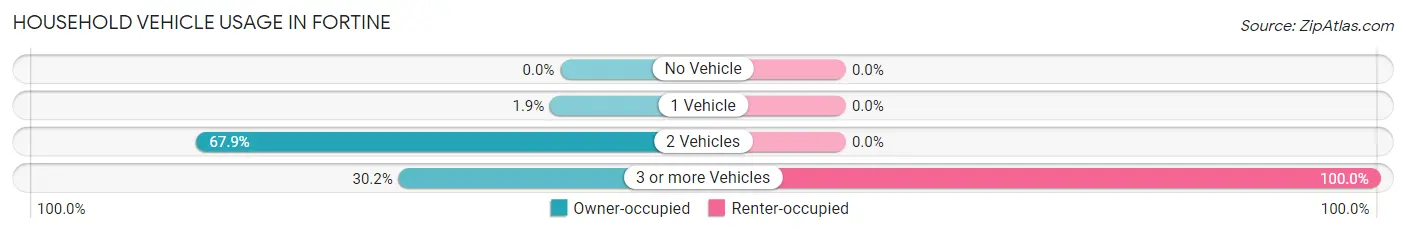
| Vehicles per Household | Owner-occupied | Renter-occupied |
| No Vehicle | 0 (0.0%) | 0 (0.0%) |
| 1 Vehicle | 2 (1.9%) | 0 (0.0%) |
| 2 Vehicles | 72 (67.9%) | 0 (0.0%) |
| 3 or more Vehicles | 32 (30.2%) | 28 (100.0%) |
| Total | 106 (100.0%) | 28 (100.0%) |
Real Estate & Mortgages in Fortine
Real Estate and Mortgage Overview in Fortine
| Characteristic | Without Mortgage | With Mortgage |
| Housing Units | 39 | 67 |
| Median Property Value | $229,700 | $267,600 |
| Median Household Income | $61,645 | $10 |
| Monthly Housing Costs | $441 | $0 |
| Real Estate Taxes | $1,391 | $0 |
Property Value by Mortgage Status in Fortine
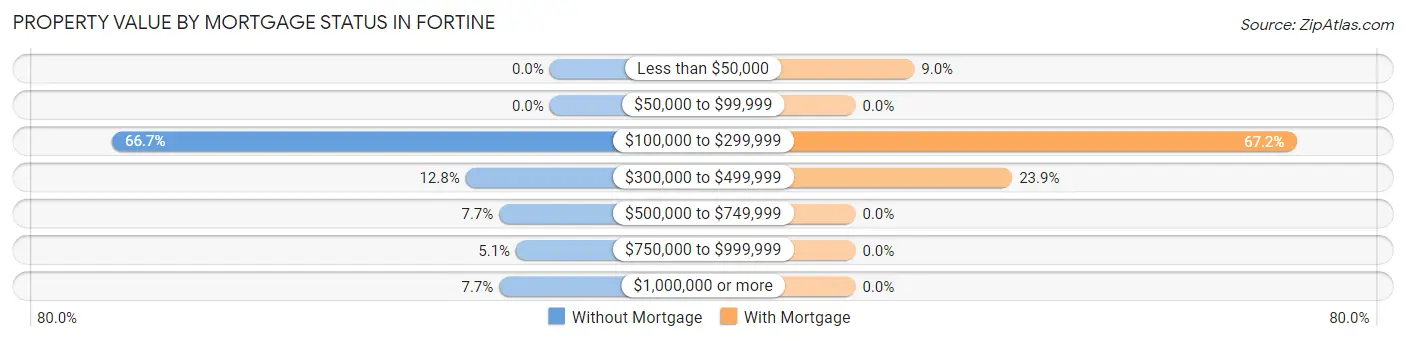
| Property Value | Without Mortgage | With Mortgage |
| Less than $50,000 | 0 (0.0%) | 6 (9.0%) |
| $50,000 to $99,999 | 0 (0.0%) | 0 (0.0%) |
| $100,000 to $299,999 | 26 (66.7%) | 45 (67.2%) |
| $300,000 to $499,999 | 5 (12.8%) | 16 (23.9%) |
| $500,000 to $749,999 | 3 (7.7%) | 0 (0.0%) |
| $750,000 to $999,999 | 2 (5.1%) | 0 (0.0%) |
| $1,000,000 or more | 3 (7.7%) | 0 (0.0%) |
| Total | 39 (100.0%) | 67 (100.0%) |
Household Income by Mortgage Status in Fortine
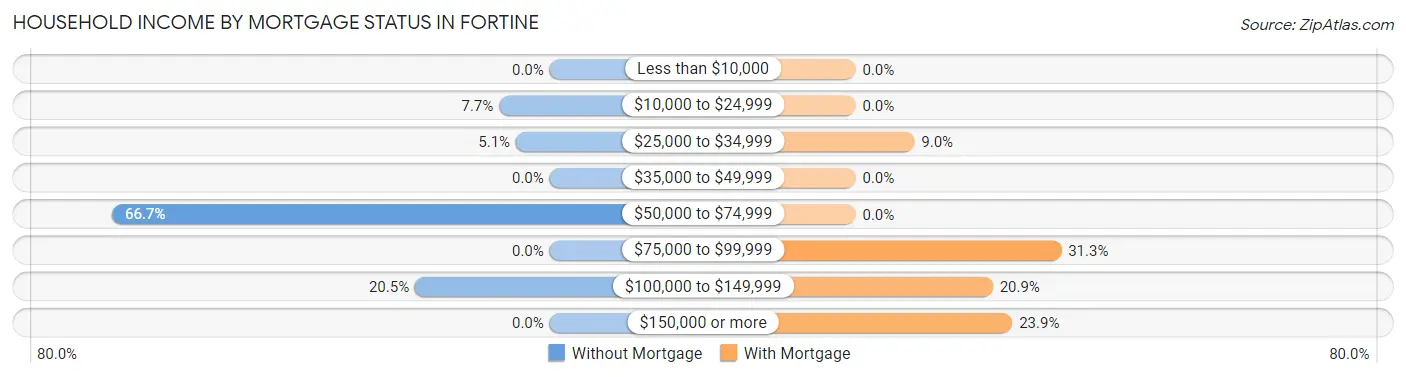
| Household Income | Without Mortgage | With Mortgage |
| Less than $10,000 | 0 (0.0%) | 0 (0.0%) |
| $10,000 to $24,999 | 3 (7.7%) | 0 (0.0%) |
| $25,000 to $34,999 | 2 (5.1%) | 6 (9.0%) |
| $35,000 to $49,999 | 0 (0.0%) | 0 (0.0%) |
| $50,000 to $74,999 | 26 (66.7%) | 0 (0.0%) |
| $75,000 to $99,999 | 0 (0.0%) | 21 (31.3%) |
| $100,000 to $149,999 | 8 (20.5%) | 14 (20.9%) |
| $150,000 or more | 0 (0.0%) | 16 (23.9%) |
| Total | 39 (100.0%) | 67 (100.0%) |
Property Value to Household Income Ratio in Fortine
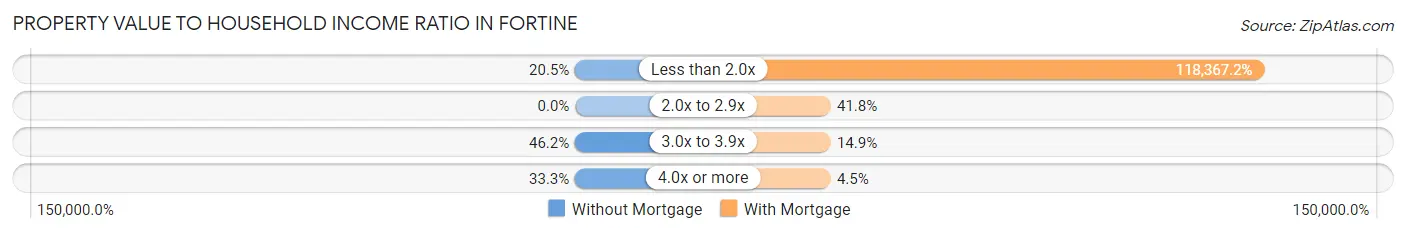
| Value-to-Income Ratio | Without Mortgage | With Mortgage |
| Less than 2.0x | 8 (20.5%) | 79,306 (118,367.2%) |
| 2.0x to 2.9x | 0 (0.0%) | 28 (41.8%) |
| 3.0x to 3.9x | 18 (46.2%) | 10 (14.9%) |
| 4.0x or more | 13 (33.3%) | 3 (4.5%) |
| Total | 39 (100.0%) | 67 (100.0%) |
Real Estate Taxes by Mortgage Status in Fortine
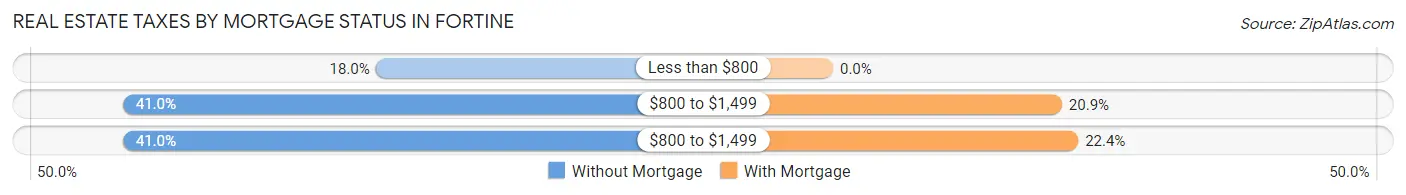
| Property Taxes | Without Mortgage | With Mortgage |
| Less than $800 | 7 (17.9%) | 0 (0.0%) |
| $800 to $1,499 | 16 (41.0%) | 14 (20.9%) |
| $800 to $1,499 | 16 (41.0%) | 15 (22.4%) |
| Total | 39 (100.0%) | 67 (100.0%) |
Health & Disability in Fortine
Health Insurance Coverage by Age in Fortine
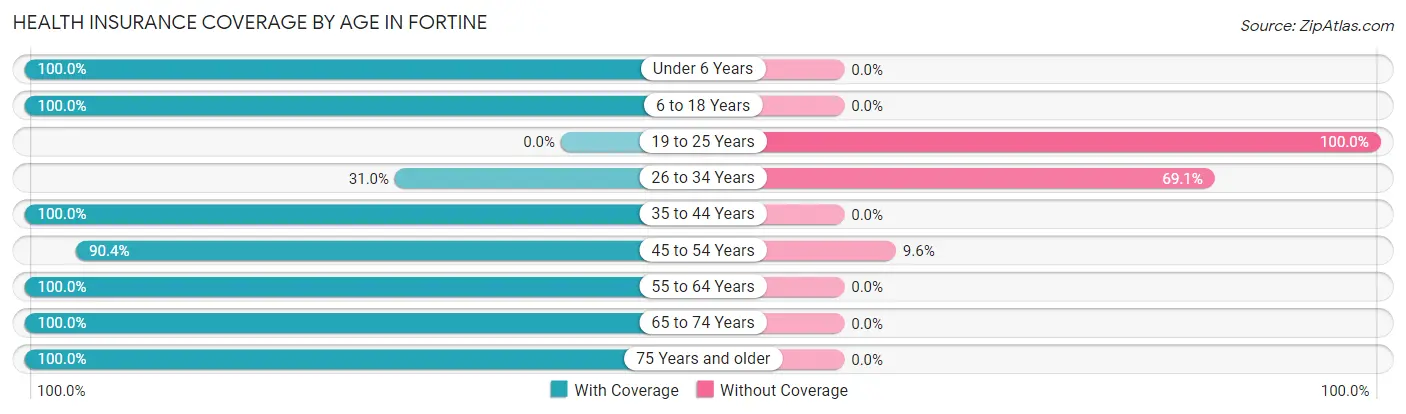
| Age Bracket | With Coverage | Without Coverage |
| Under 6 Years | 53 (100.0%) | 0 (0.0%) |
| 6 to 18 Years | 99 (100.0%) | 0 (0.0%) |
| 19 to 25 Years | 0 (0.0%) | 25 (100.0%) |
| 26 to 34 Years | 13 (30.9%) | 29 (69.1%) |
| 35 to 44 Years | 49 (100.0%) | 0 (0.0%) |
| 45 to 54 Years | 47 (90.4%) | 5 (9.6%) |
| 55 to 64 Years | 51 (100.0%) | 0 (0.0%) |
| 65 to 74 Years | 46 (100.0%) | 0 (0.0%) |
| 75 Years and older | 15 (100.0%) | 0 (0.0%) |
| Total | 373 (86.3%) | 59 (13.7%) |
Health Insurance Coverage by Citizenship Status in Fortine
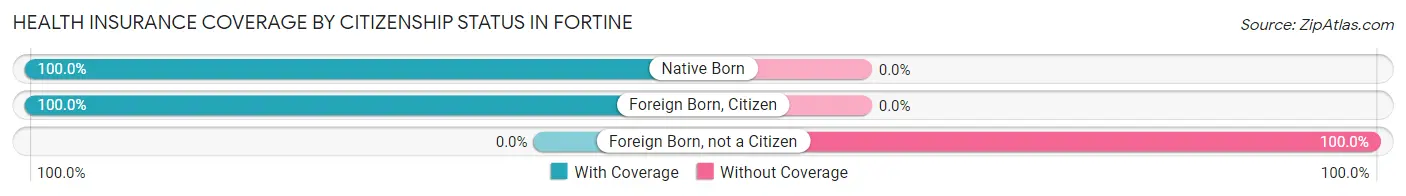
| Citizenship Status | With Coverage | Without Coverage |
| Native Born | 53 (100.0%) | 0 (0.0%) |
| Foreign Born, Citizen | 99 (100.0%) | 0 (0.0%) |
| Foreign Born, not a Citizen | 0 (0.0%) | 25 (100.0%) |
Health Insurance Coverage by Household Income in Fortine
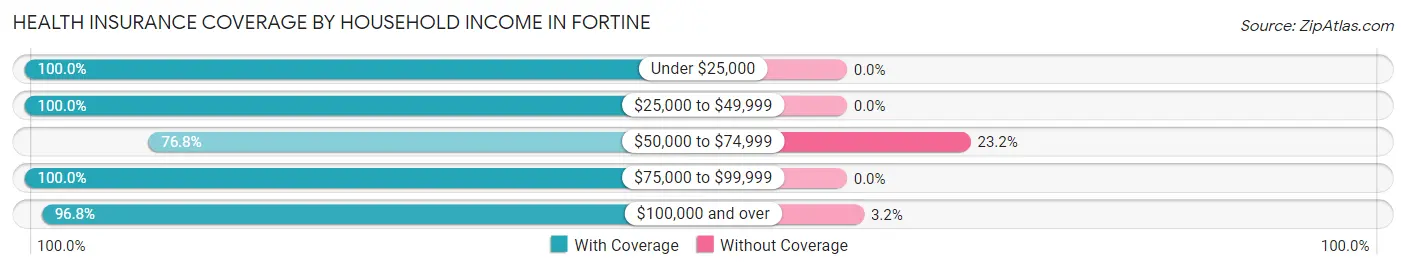
| Household Income | With Coverage | Without Coverage |
| Under $25,000 | 11 (100.0%) | 0 (0.0%) |
| $25,000 to $49,999 | 2 (100.0%) | 0 (0.0%) |
| $50,000 to $74,999 | 179 (76.8%) | 54 (23.2%) |
| $75,000 to $99,999 | 30 (100.0%) | 0 (0.0%) |
| $100,000 and over | 151 (96.8%) | 5 (3.2%) |
Public vs Private Health Insurance Coverage by Age in Fortine
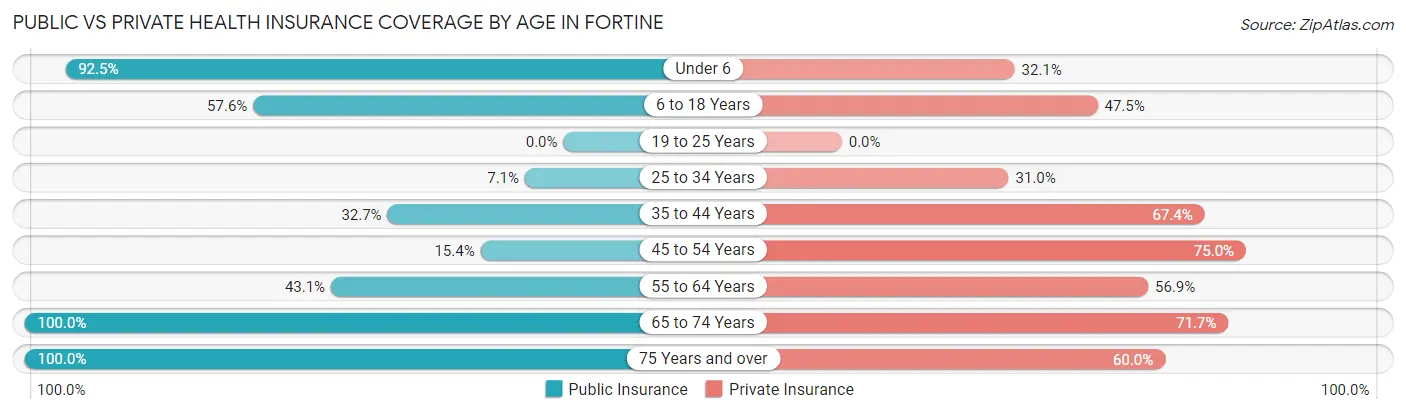
| Age Bracket | Public Insurance | Private Insurance |
| Under 6 | 49 (92.4%) | 17 (32.1%) |
| 6 to 18 Years | 57 (57.6%) | 47 (47.5%) |
| 19 to 25 Years | 0 (0.0%) | 0 (0.0%) |
| 25 to 34 Years | 3 (7.1%) | 13 (30.9%) |
| 35 to 44 Years | 16 (32.7%) | 33 (67.3%) |
| 45 to 54 Years | 8 (15.4%) | 39 (75.0%) |
| 55 to 64 Years | 22 (43.1%) | 29 (56.9%) |
| 65 to 74 Years | 46 (100.0%) | 33 (71.7%) |
| 75 Years and over | 15 (100.0%) | 9 (60.0%) |
| Total | 216 (50.0%) | 220 (50.9%) |
Disability Status by Sex by Age in Fortine
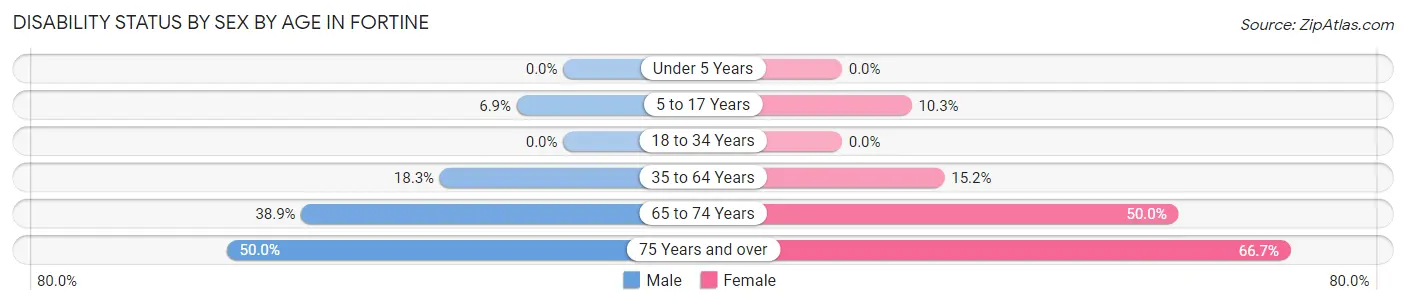
| Age Bracket | Male | Female |
| Under 5 Years | 0 (0.0%) | 0 (0.0%) |
| 5 to 17 Years | 4 (6.9%) | 3 (10.3%) |
| 18 to 34 Years | 0 (0.0%) | 0 (0.0%) |
| 35 to 64 Years | 11 (18.3%) | 14 (15.2%) |
| 65 to 74 Years | 14 (38.9%) | 5 (50.0%) |
| 75 Years and over | 3 (50.0%) | 6 (66.7%) |
Disability Class by Sex by Age in Fortine
Disability Class: Hearing Difficulty
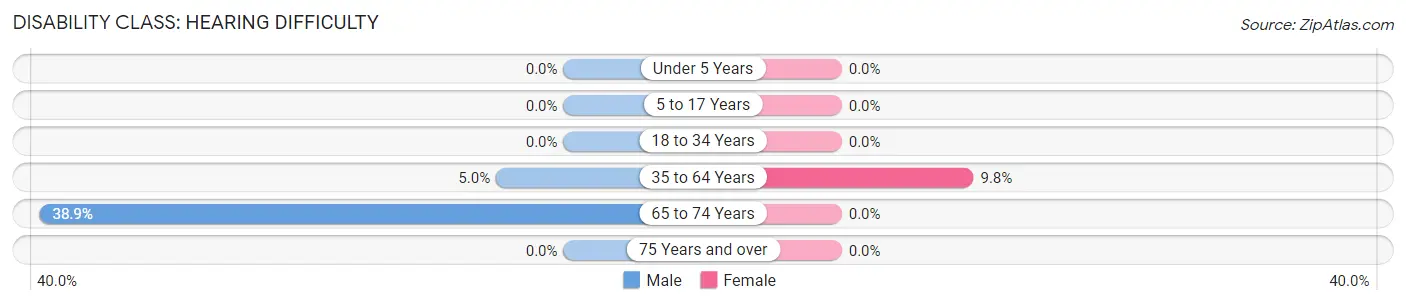
| Age Bracket | Male | Female |
| Under 5 Years | 0 (0.0%) | 0 (0.0%) |
| 5 to 17 Years | 0 (0.0%) | 0 (0.0%) |
| 18 to 34 Years | 0 (0.0%) | 0 (0.0%) |
| 35 to 64 Years | 3 (5.0%) | 9 (9.8%) |
| 65 to 74 Years | 14 (38.9%) | 0 (0.0%) |
| 75 Years and over | 0 (0.0%) | 0 (0.0%) |
Disability Class: Vision Difficulty
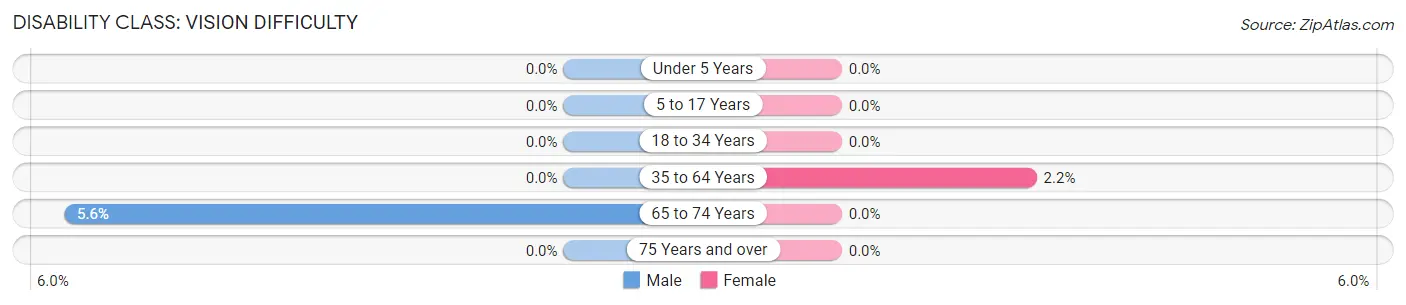
| Age Bracket | Male | Female |
| Under 5 Years | 0 (0.0%) | 0 (0.0%) |
| 5 to 17 Years | 0 (0.0%) | 0 (0.0%) |
| 18 to 34 Years | 0 (0.0%) | 0 (0.0%) |
| 35 to 64 Years | 0 (0.0%) | 2 (2.2%) |
| 65 to 74 Years | 2 (5.6%) | 0 (0.0%) |
| 75 Years and over | 0 (0.0%) | 0 (0.0%) |
Disability Class: Cognitive Difficulty
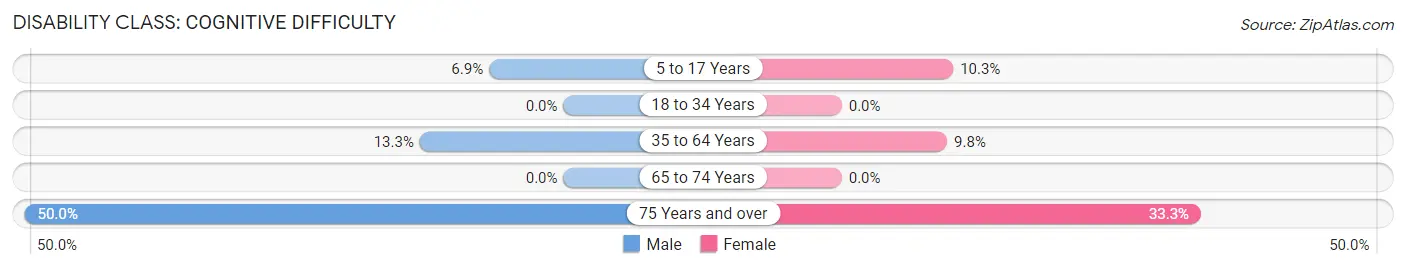
| Age Bracket | Male | Female |
| 5 to 17 Years | 4 (6.9%) | 3 (10.3%) |
| 18 to 34 Years | 0 (0.0%) | 0 (0.0%) |
| 35 to 64 Years | 8 (13.3%) | 9 (9.8%) |
| 65 to 74 Years | 0 (0.0%) | 0 (0.0%) |
| 75 Years and over | 3 (50.0%) | 3 (33.3%) |
Disability Class: Ambulatory Difficulty
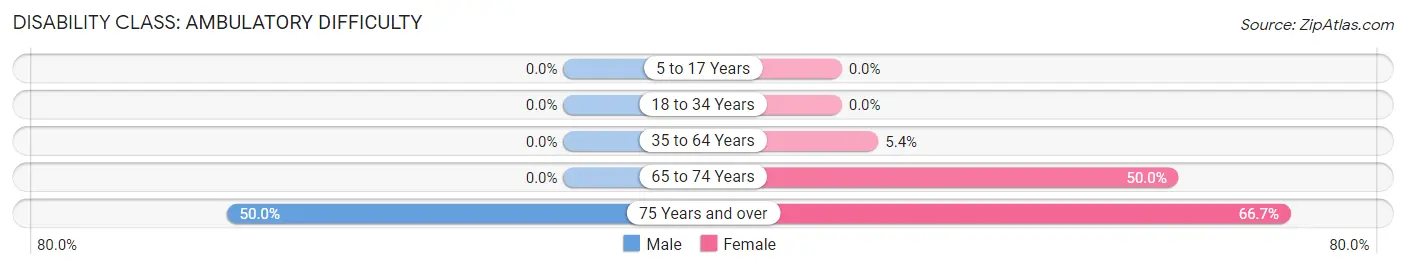
| Age Bracket | Male | Female |
| 5 to 17 Years | 0 (0.0%) | 0 (0.0%) |
| 18 to 34 Years | 0 (0.0%) | 0 (0.0%) |
| 35 to 64 Years | 0 (0.0%) | 5 (5.4%) |
| 65 to 74 Years | 0 (0.0%) | 5 (50.0%) |
| 75 Years and over | 3 (50.0%) | 6 (66.7%) |
Disability Class: Self-Care Difficulty
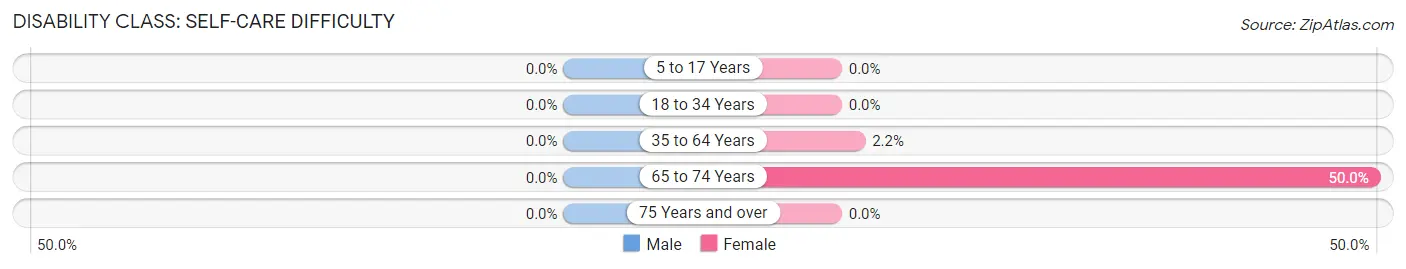
| Age Bracket | Male | Female |
| 5 to 17 Years | 0 (0.0%) | 0 (0.0%) |
| 18 to 34 Years | 0 (0.0%) | 0 (0.0%) |
| 35 to 64 Years | 0 (0.0%) | 2 (2.2%) |
| 65 to 74 Years | 0 (0.0%) | 5 (50.0%) |
| 75 Years and over | 0 (0.0%) | 0 (0.0%) |
Technology Access in Fortine
Computing Device Access in Fortine
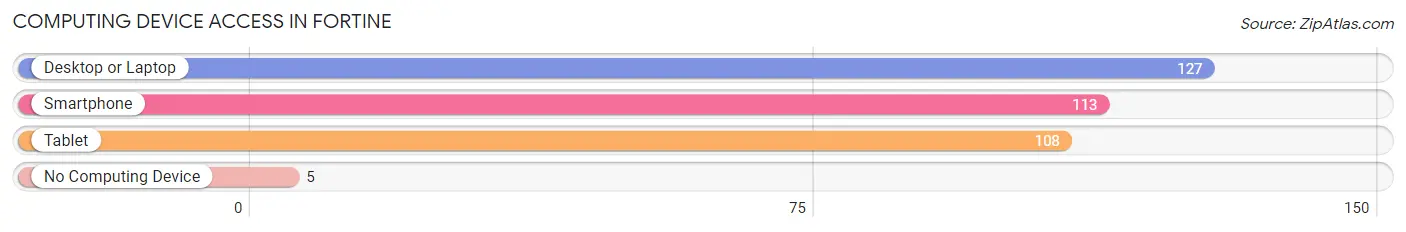
| Device Type | # Households | % Households |
| Desktop or Laptop | 127 | 94.8% |
| Smartphone | 113 | 84.3% |
| Tablet | 108 | 80.6% |
| No Computing Device | 5 | 3.7% |
| Total | 134 | 100.0% |
Internet Access in Fortine
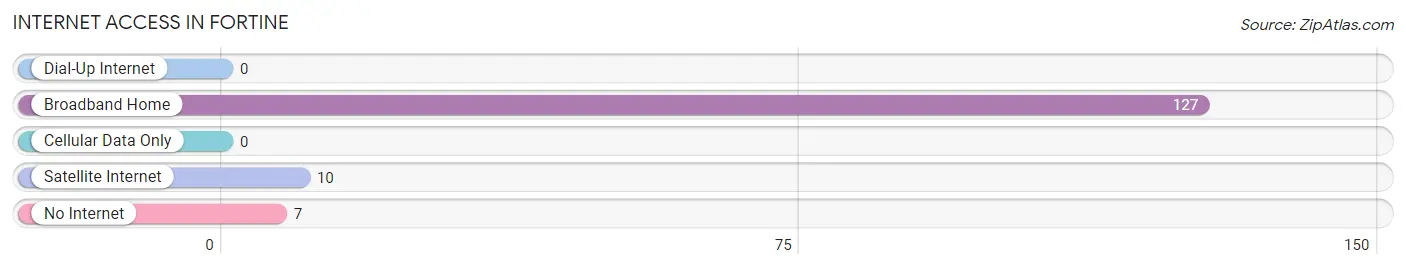
| Internet Type | # Households | % Households |
| Dial-Up Internet | 0 | 0.0% |
| Broadband Home | 127 | 94.8% |
| Cellular Data Only | 0 | 0.0% |
| Satellite Internet | 10 | 7.5% |
| No Internet | 7 | 5.2% |
| Total | 134 | 100.0% |
Fortine Summary
Fortine is a small unincorporated community located in Lincoln County, Montana, United States. It is situated in the Flathead Valley, approximately 20 miles south of the Canadian border. The town is located on the Flathead River, and is surrounded by the Flathead National Forest. The population of Fortine was estimated to be around 200 people in 2020.
History
Fortine was first settled in the late 1800s by homesteaders and trappers. The town was named after Fortine Creek, which was named after a French-Canadian trapper named Fortin. The town was officially incorporated in 1909.
In the early 1900s, Fortine was a bustling logging and mining town. The town was home to several sawmills, a flour mill, and a large copper mine. The copper mine was the largest in the state of Montana, and employed hundreds of people.
The town also had a large railroad station, which was used to transport goods and passengers to and from the town. The railroad station was also used to transport logs to the sawmills.
In the 1950s, the copper mine closed and the sawmills began to shut down. This caused the population of Fortine to decline significantly.
Geography
Fortine is located in the Flathead Valley, in the northwestern part of Montana. The town is situated on the Flathead River, and is surrounded by the Flathead National Forest. The town is located approximately 20 miles south of the Canadian border.
The climate in Fortine is semi-arid, with cold winters and hot summers. The average annual temperature is around 40 degrees Fahrenheit. The average annual precipitation is around 16 inches.
Economy
The economy of Fortine is largely based on tourism. The town is a popular destination for outdoor recreation, such as fishing, hunting, and camping. The town is also home to several small businesses, such as restaurants, stores, and lodges.
The town is also home to a large lumber mill, which is the largest employer in the area. The mill produces lumber for the construction industry.
Demographics
The population of Fortine was estimated to be around 200 people in 2020. The town is predominantly white, with a small Native American population. The median household income is around $35,000. The median age is around 40 years old.
Common Questions
What is Per Capita Income in Fortine?
Per Capita income in Fortine is $26,315.
What is the Median Family Income in Fortine?
Median Family Income in Fortine is $63,897.
What is the Median Household income in Fortine?
Median Household Income in Fortine is $63,676.
What is Income or Wage Gap in Fortine?
Income or Wage Gap in Fortine is 27.4%.
Women in Fortine earn 72.6 cents for every dollar earned by a man.
What is Inequality or Gini Index in Fortine?
Inequality or Gini Index in Fortine is 0.32.
What is the Total Population of Fortine?
Total Population of Fortine is 432.
What is the Total Male Population of Fortine?
Total Male Population of Fortine is 186.
What is the Total Female Population of Fortine?
Total Female Population of Fortine is 246.
What is the Ratio of Males per 100 Females in Fortine?
There are 75.61 Males per 100 Females in Fortine.
What is the Ratio of Females per 100 Males in Fortine?
There are 132.26 Females per 100 Males in Fortine.
What is the Median Population Age in Fortine?
Median Population Age in Fortine is 32.0 Years.
What is the Average Family Size in Fortine
Average Family Size in Fortine is 3.5 People.
What is the Average Household Size in Fortine
Average Household Size in Fortine is 3.2 People.
How Large is the Labor Force in Fortine?
There are 154 People in the Labor Forcein in Fortine.
What is the Percentage of People in the Labor Force in Fortine?
50.2% of People are in the Labor Force in Fortine.