Clancy, MT Map & Demographics
Clancy Map
Clancy Overview
$36,303
PER CAPITA INCOME
$112,000
AVG FAMILY INCOME
$95,357
AVG HOUSEHOLD INCOME
54.5%
WAGE / INCOME GAP [ % ]
45.5¢/ $1
WAGE / INCOME GAP [ $ ]
0.39
INEQUALITY / GINI INDEX
1,970
TOTAL POPULATION
900
MALE POPULATION
1,070
FEMALE POPULATION
84.11
MALES / 100 FEMALES
118.89
FEMALES / 100 MALES
42.2
MEDIAN AGE
3.4
AVG FAMILY SIZE
2.9
AVG HOUSEHOLD SIZE
858
LABOR FORCE [ PEOPLE ]
55.8%
PERCENT IN LABOR FORCE
1.4%
UNEMPLOYMENT RATE
Clancy Zip Codes
Clancy Area Codes
Income in Clancy
Income Overview in Clancy
Per Capita Income in Clancy is $36,303, while median incomes of families and households are $112,000 and $95,357 respectively.
| Characteristic | Number | Measure |
| Per Capita Income | 1,970 | $36,303 |
| Median Family Income | 516 | $112,000 |
| Mean Family Income | 516 | $119,560 |
| Median Household Income | 652 | $95,357 |
| Mean Household Income | 652 | $105,571 |
| Income Deficit | 516 | $0 |
| Wage / Income Gap (%) | 1,970 | 54.49% |
| Wage / Income Gap ($) | 1,970 | 45.51¢ per $1 |
| Gini / Inequality Index | 1,970 | 0.39 |
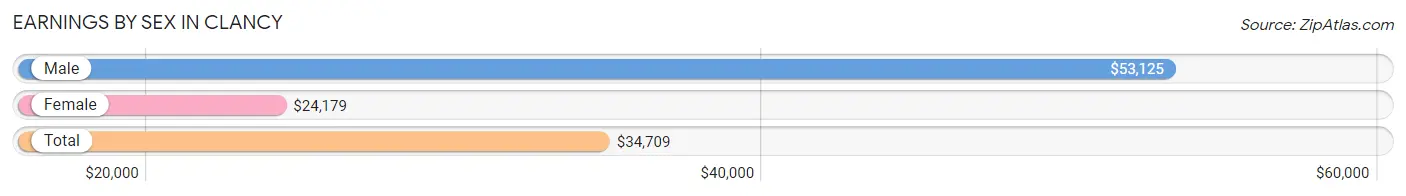
Earnings by Sex in Clancy
Average Earnings in Clancy are $34,709, $53,125 for men and $24,179 for women, a difference of 54.5%.
| Sex | Number | Average Earnings |
| Male | 449 (47.0%) | $53,125 |
| Female | 507 (53.0%) | $24,179 |
| Total | 956 (100.0%) | $34,709 |
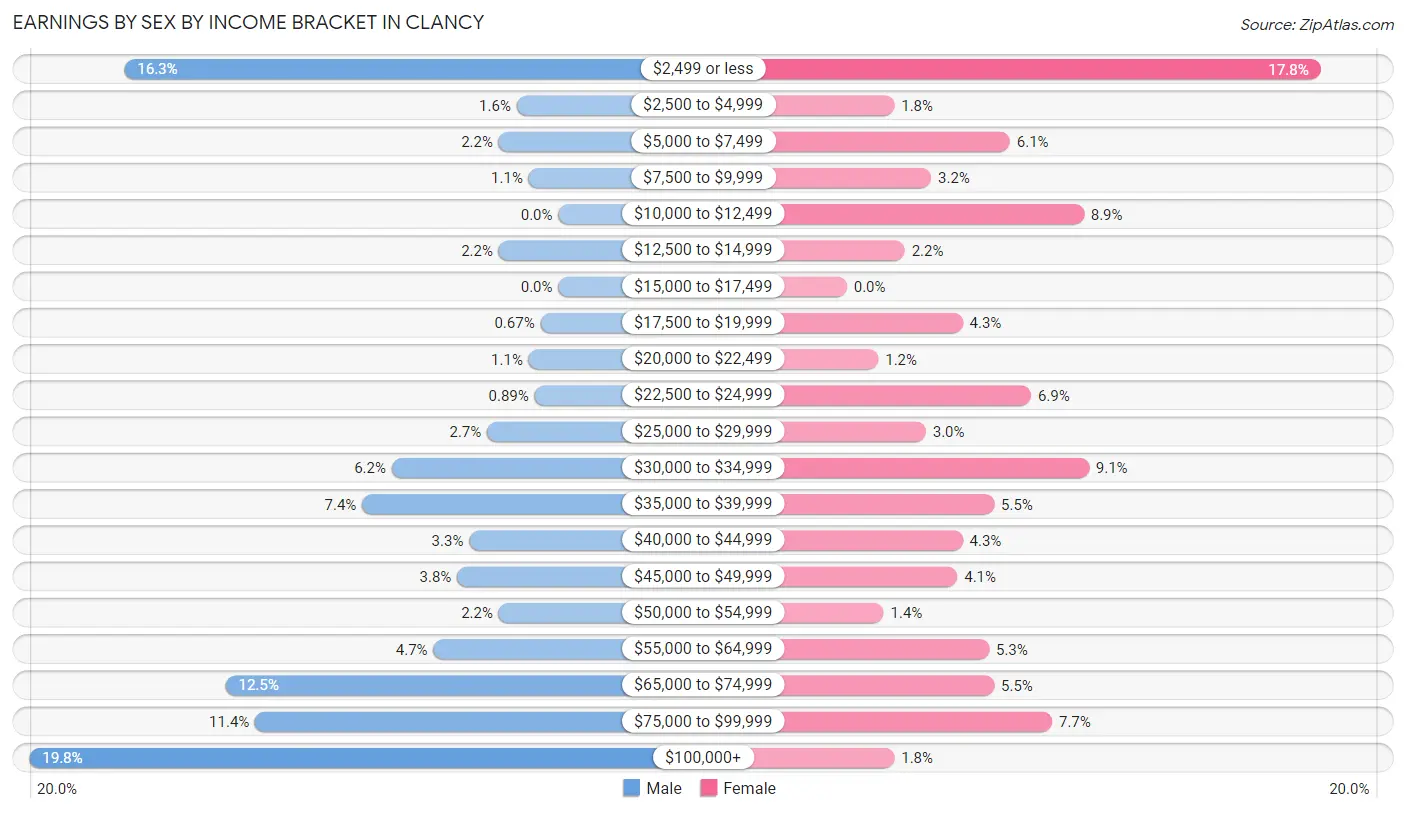
Earnings by Sex by Income Bracket in Clancy
The most common earnings brackets in Clancy are $100,000+ for men (89 | 19.8%) and $2,499 or less for women (90 | 17.7%).
| Income | Male | Female |
| $2,499 or less | 73 (16.3%) | 90 (17.7%) |
| $2,500 to $4,999 | 7 (1.6%) | 9 (1.8%) |
| $5,000 to $7,499 | 10 (2.2%) | 31 (6.1%) |
| $7,500 to $9,999 | 5 (1.1%) | 16 (3.2%) |
| $10,000 to $12,499 | 0 (0.0%) | 45 (8.9%) |
| $12,500 to $14,999 | 10 (2.2%) | 11 (2.2%) |
| $15,000 to $17,499 | 0 (0.0%) | 0 (0.0%) |
| $17,500 to $19,999 | 3 (0.7%) | 22 (4.3%) |
| $20,000 to $22,499 | 5 (1.1%) | 6 (1.2%) |
| $22,500 to $24,999 | 4 (0.9%) | 35 (6.9%) |
| $25,000 to $29,999 | 12 (2.7%) | 15 (3.0%) |
| $30,000 to $34,999 | 28 (6.2%) | 46 (9.1%) |
| $35,000 to $39,999 | 33 (7.3%) | 28 (5.5%) |
| $40,000 to $44,999 | 15 (3.3%) | 22 (4.3%) |
| $45,000 to $49,999 | 17 (3.8%) | 21 (4.1%) |
| $50,000 to $54,999 | 10 (2.2%) | 7 (1.4%) |
| $55,000 to $64,999 | 21 (4.7%) | 27 (5.3%) |
| $65,000 to $74,999 | 56 (12.5%) | 28 (5.5%) |
| $75,000 to $99,999 | 51 (11.4%) | 39 (7.7%) |
| $100,000+ | 89 (19.8%) | 9 (1.8%) |
| Total | 449 (100.0%) | 507 (100.0%) |
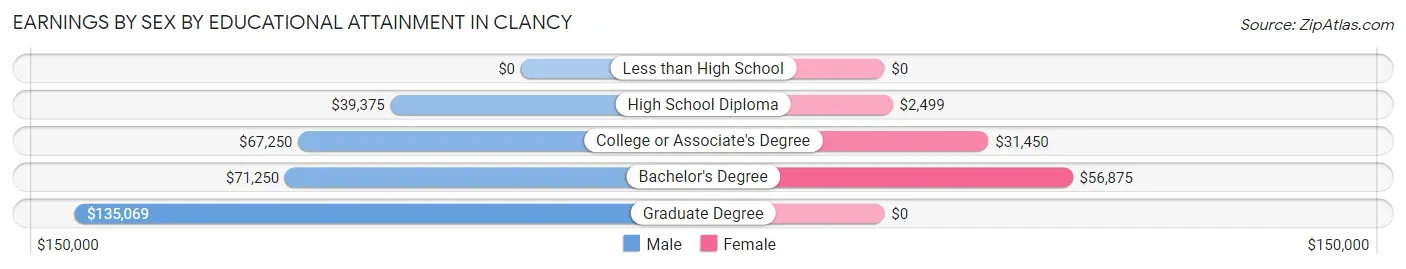
Earnings by Sex by Educational Attainment in Clancy
Average earnings in Clancy are $66,000 for men and $32,738 for women, a difference of 50.4%. Men with an educational attainment of graduate degree enjoy the highest average annual earnings of $135,069, while those with high school diploma education earn the least with $39,375. Women with an educational attainment of bachelor's degree earn the most with the average annual earnings of $56,875, while those with high school diploma education have the smallest earnings of $2,499.
| Educational Attainment | Male Income | Female Income |
| Less than High School | - | - |
| High School Diploma | $39,375 | $2,499 |
| College or Associate's Degree | $67,250 | $31,450 |
| Bachelor's Degree | $71,250 | $56,875 |
| Graduate Degree | $135,069 | $0 |
| Total | $66,000 | $32,738 |
Family Income in Clancy
Family Income Brackets in Clancy
According to the Clancy family income data, there are 195 families falling into the $100,000 to $149,999 income range, which is the most common income bracket and makes up 37.8% of all families.
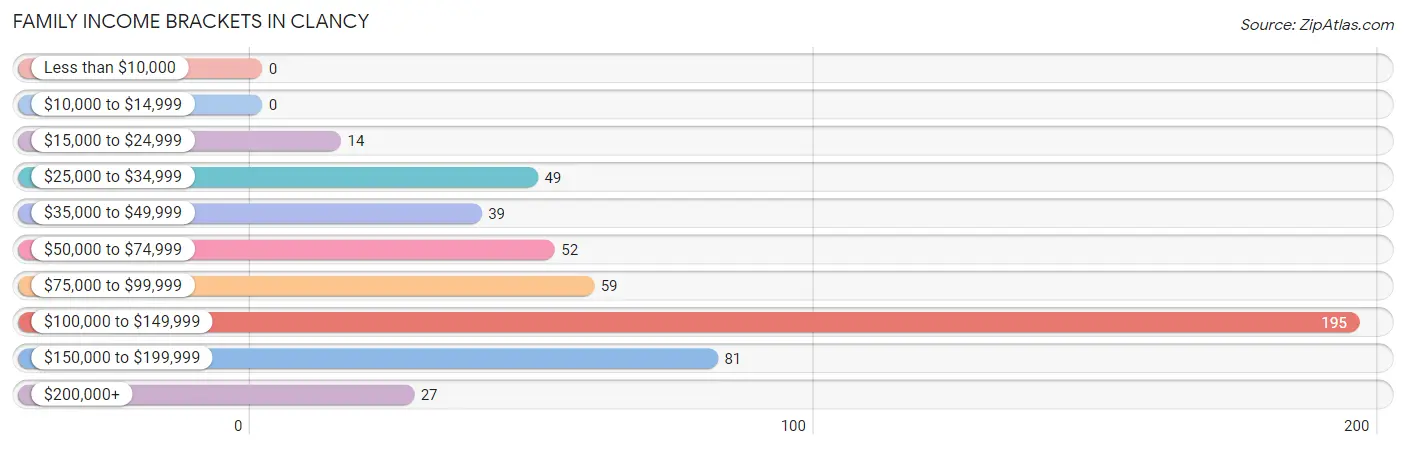
| Income Bracket | # Families | % Families |
| Less than $10,000 | 0 | 0.0% |
| $10,000 to $14,999 | 0 | 0.0% |
| $15,000 to $24,999 | 14 | 2.7% |
| $25,000 to $34,999 | 49 | 9.5% |
| $35,000 to $49,999 | 39 | 7.6% |
| $50,000 to $74,999 | 52 | 10.1% |
| $75,000 to $99,999 | 59 | 11.4% |
| $100,000 to $149,999 | 195 | 37.8% |
| $150,000 to $199,999 | 81 | 15.7% |
| $200,000+ | 27 | 5.2% |
Family Income by Famaliy Size in Clancy
5-person families (66 | 12.8%) account for the highest median family income in Clancy with $150,125 per family, while 3-person families (76 | 14.7%) have the highest median income of $38,917 per family member.
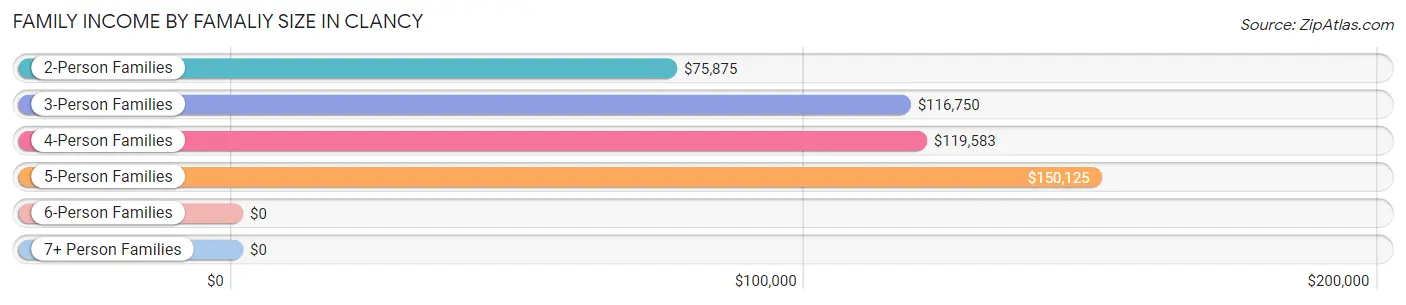
| Income Bracket | # Families | Median Income |
| 2-Person Families | 245 (47.5%) | $75,875 |
| 3-Person Families | 76 (14.7%) | $116,750 |
| 4-Person Families | 102 (19.8%) | $119,583 |
| 5-Person Families | 66 (12.8%) | $150,125 |
| 6-Person Families | 17 (3.3%) | $0 |
| 7+ Person Families | 10 (1.9%) | $0 |
| Total | 516 (100.0%) | $112,000 |
Family Income by Number of Earners in Clancy
The median family income in Clancy is $112,000, with families comprising 2 earners (233) having the highest median family income of $144,115, while families with no earners (79) have the lowest median family income of $34,345, accounting for 45.2% and 15.3% of families, respectively.
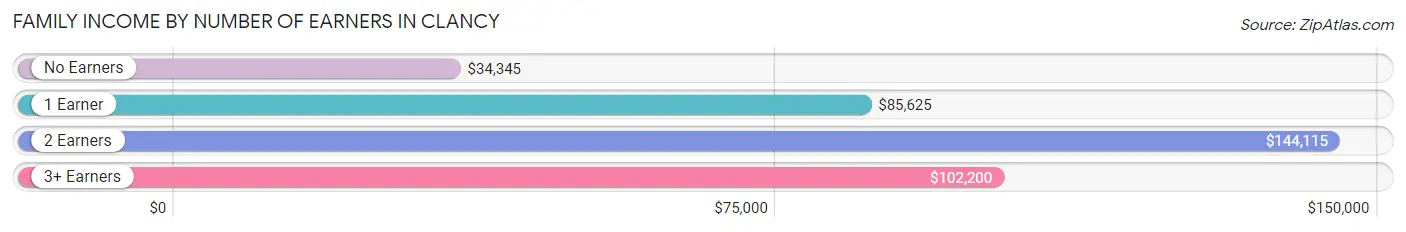
| Number of Earners | # Families | Median Income |
| No Earners | 79 (15.3%) | $34,345 |
| 1 Earner | 160 (31.0%) | $85,625 |
| 2 Earners | 233 (45.2%) | $144,115 |
| 3+ Earners | 44 (8.5%) | $102,200 |
| Total | 516 (100.0%) | $112,000 |
Household Income in Clancy
Household Income Brackets in Clancy
With 200 households falling in the category, the $100,000 to $149,999 income range is the most frequent in Clancy, accounting for 30.7% of all households.
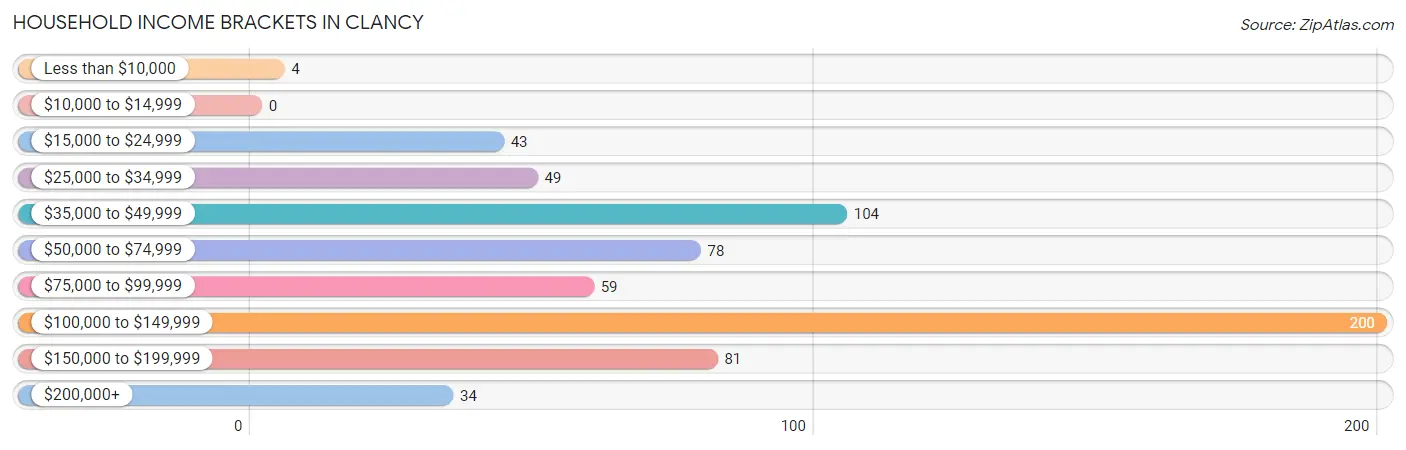
| Income Bracket | # Households | % Households |
| Less than $10,000 | 4 | 0.6% |
| $10,000 to $14,999 | 0 | 0.0% |
| $15,000 to $24,999 | 43 | 6.6% |
| $25,000 to $34,999 | 49 | 7.5% |
| $35,000 to $49,999 | 104 | 16.0% |
| $50,000 to $74,999 | 78 | 12.0% |
| $75,000 to $99,999 | 59 | 9.0% |
| $100,000 to $149,999 | 200 | 30.7% |
| $150,000 to $199,999 | 81 | 12.4% |
| $200,000+ | 34 | 5.2% |
Household Income by Householder Age in Clancy
The median household income in Clancy is $95,357, with the highest median household income of $142,898 found in the 25 to 44 years age bracket for the primary householder. A total of 159 households (24.4%) fall into this category. Meanwhile, the 15 to 24 years age bracket for the primary householder has the lowest median household income of $0, with 5 households (0.8%) in this group.
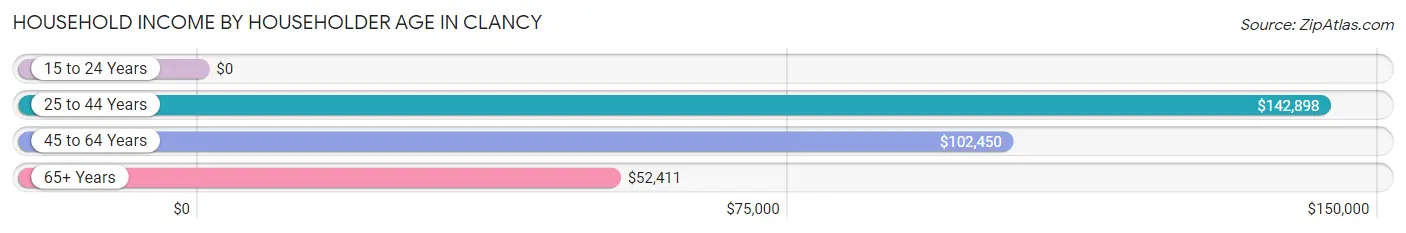
| Income Bracket | # Households | Median Income |
| 15 to 24 Years | 5 (0.8%) | $0 |
| 25 to 44 Years | 159 (24.4%) | $142,898 |
| 45 to 64 Years | 161 (24.7%) | $102,450 |
| 65+ Years | 327 (50.1%) | $52,411 |
| Total | 652 (100.0%) | $95,357 |
Poverty in Clancy
Income Below Poverty by Sex and Age in Clancy
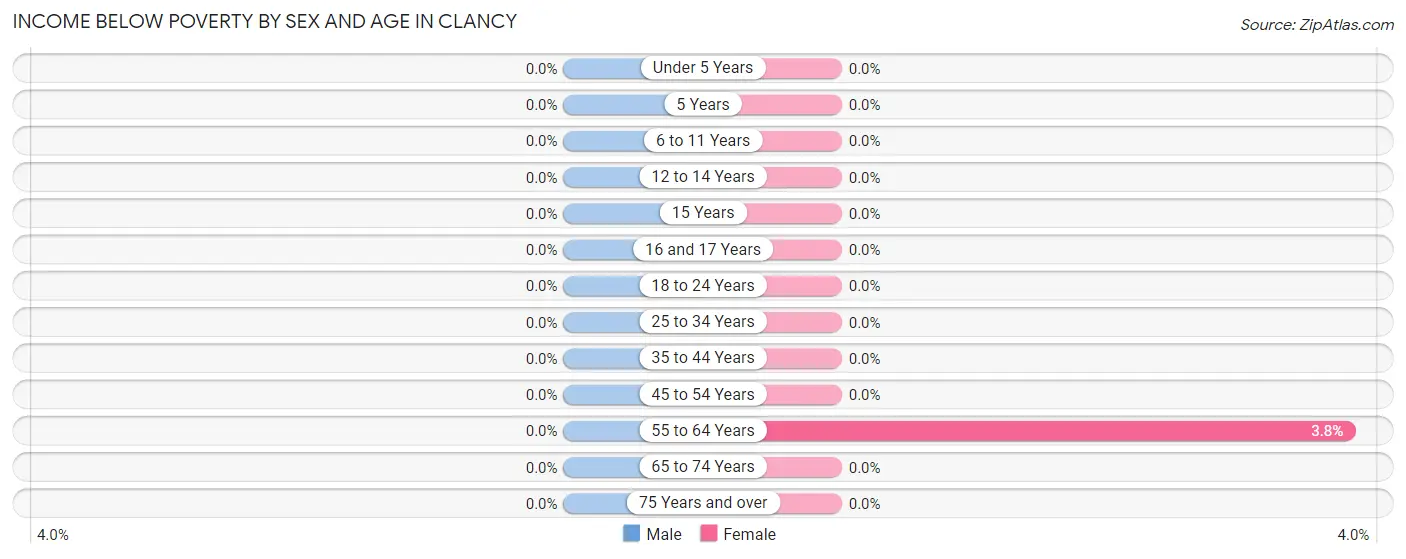
| Age Bracket | Male | Female |
| Under 5 Years | 0 (0.0%) | 0 (0.0%) |
| 5 Years | 0 (0.0%) | 0 (0.0%) |
| 6 to 11 Years | 0 (0.0%) | 0 (0.0%) |
| 12 to 14 Years | 0 (0.0%) | 0 (0.0%) |
| 15 Years | 0 (0.0%) | 0 (0.0%) |
| 16 and 17 Years | 0 (0.0%) | 0 (0.0%) |
| 18 to 24 Years | 0 (0.0%) | 0 (0.0%) |
| 25 to 34 Years | 0 (0.0%) | 0 (0.0%) |
| 35 to 44 Years | 0 (0.0%) | 0 (0.0%) |
| 45 to 54 Years | 0 (0.0%) | 0 (0.0%) |
| 55 to 64 Years | 0 (0.0%) | 4 (3.8%) |
| 65 to 74 Years | 0 (0.0%) | 0 (0.0%) |
| 75 Years and over | 0 (0.0%) | 0 (0.0%) |
| Total | 0 (0.0%) | 4 (0.4%) |
Income Above Poverty by Sex and Age in Clancy
According to the poverty statistics in Clancy, males aged under 5 years and females aged under 5 years are the age groups that are most secure financially, with 100.0% of males and 100.0% of females in these age groups living above the poverty line.
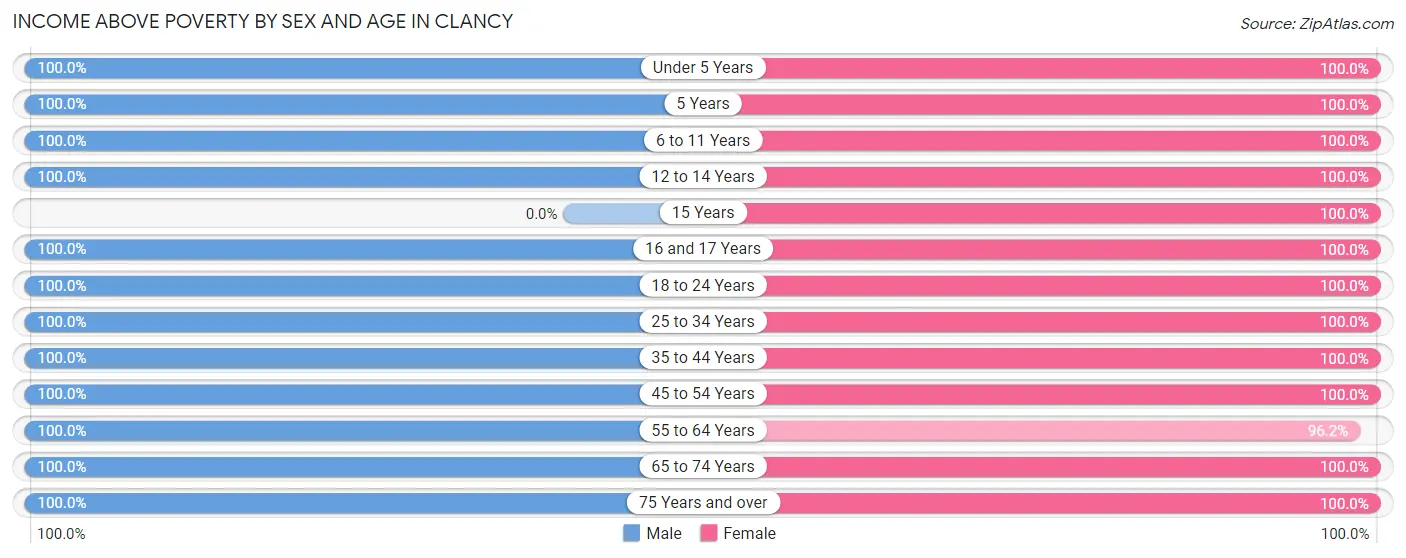
| Age Bracket | Male | Female |
| Under 5 Years | 73 (100.0%) | 69 (100.0%) |
| 5 Years | 30 (100.0%) | 16 (100.0%) |
| 6 to 11 Years | 86 (100.0%) | 76 (100.0%) |
| 12 to 14 Years | 42 (100.0%) | 21 (100.0%) |
| 15 Years | 0 (0.0%) | 20 (100.0%) |
| 16 and 17 Years | 50 (100.0%) | 23 (100.0%) |
| 18 to 24 Years | 31 (100.0%) | 127 (100.0%) |
| 25 to 34 Years | 90 (100.0%) | 108 (100.0%) |
| 35 to 44 Years | 105 (100.0%) | 107 (100.0%) |
| 45 to 54 Years | 62 (100.0%) | 69 (100.0%) |
| 55 to 64 Years | 84 (100.0%) | 101 (96.2%) |
| 65 to 74 Years | 169 (100.0%) | 201 (100.0%) |
| 75 Years and over | 64 (100.0%) | 79 (100.0%) |
| Total | 886 (100.0%) | 1,017 (99.6%) |
Income Below Poverty Among Married-Couple Families in Clancy
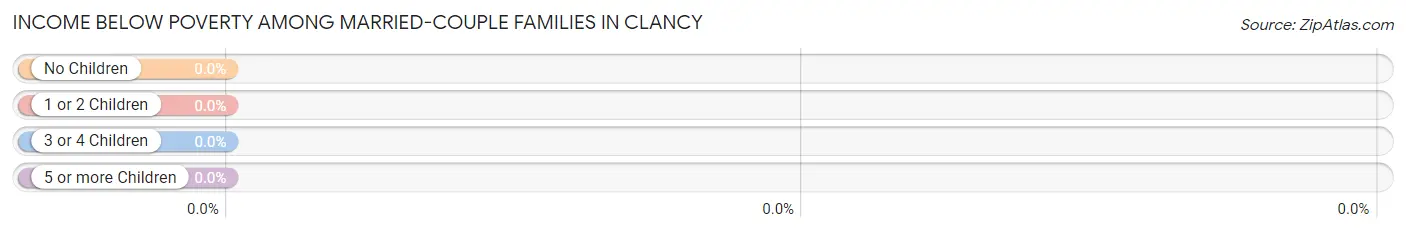
| Children | Above Poverty | Below Poverty |
| No Children | 285 (100.0%) | 0 (0.0%) |
| 1 or 2 Children | 110 (100.0%) | 0 (0.0%) |
| 3 or 4 Children | 78 (100.0%) | 0 (0.0%) |
| 5 or more Children | 10 (100.0%) | 0 (0.0%) |
| Total | 483 (100.0%) | 0 (0.0%) |
Income Below Poverty Among Single-Parent Households in Clancy
| Children | Single Father | Single Mother |
| No Children | 0 (0.0%) | 0 (0.0%) |
| 1 or 2 Children | 0 (0.0%) | 0 (0.0%) |
| 3 or 4 Children | 0 (0.0%) | 0 (0.0%) |
| 5 or more Children | 0 (0.0%) | 0 (0.0%) |
| Total | 0 (0.0%) | 0 (0.0%) |
Income Below Poverty Among Married-Couple vs Single-Parent Households in Clancy
| Children | Married-Couple Families | Single-Parent Households |
| No Children | 0 (0.0%) | 0 (0.0%) |
| 1 or 2 Children | 0 (0.0%) | 0 (0.0%) |
| 3 or 4 Children | 0 (0.0%) | 0 (0.0%) |
| 5 or more Children | 0 (0.0%) | 0 (0.0%) |
| Total | 0 (0.0%) | 0 (0.0%) |
Race in Clancy
The most populous races in Clancy are White / Caucasian (1,766 | 89.6%), Two or more Races (159 | 8.1%), and Native / Alaskan (45 | 2.3%).
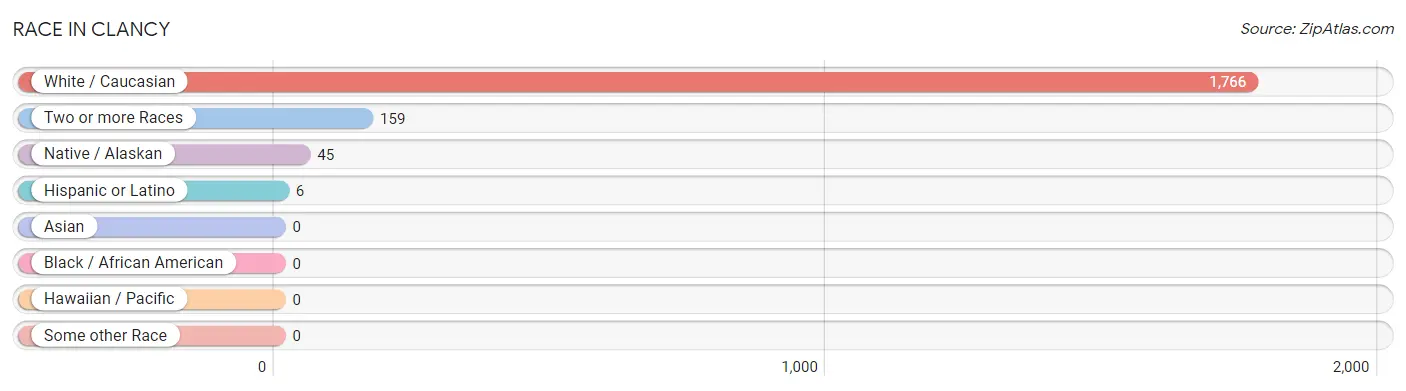
| Race | # Population | % Population |
| Asian | 0 | 0.0% |
| Black / African American | 0 | 0.0% |
| Hawaiian / Pacific | 0 | 0.0% |
| Hispanic or Latino | 6 | 0.3% |
| Native / Alaskan | 45 | 2.3% |
| White / Caucasian | 1,766 | 89.6% |
| Two or more Races | 159 | 8.1% |
| Some other Race | 0 | 0.0% |
| Total | 1,970 | 100.0% |
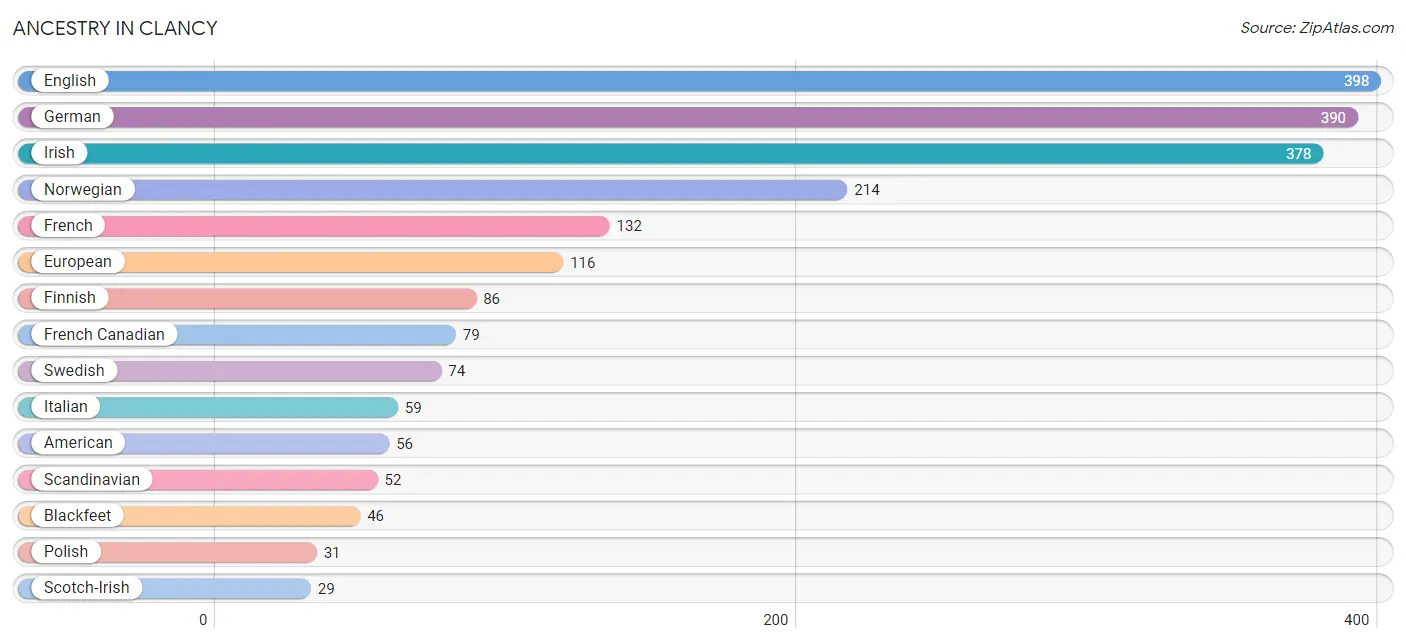
Ancestry in Clancy
The most populous ancestries reported in Clancy are English (398 | 20.2%), German (390 | 19.8%), Irish (378 | 19.2%), Norwegian (214 | 10.9%), and French (132 | 6.7%), together accounting for 76.8% of all Clancy residents.
| Ancestry | # Population | % Population |
| Alaska Native | 4 | 0.2% |
| American | 56 | 2.8% |
| Arab | 5 | 0.3% |
| Austrian | 11 | 0.6% |
| Basque | 4 | 0.2% |
| Blackfeet | 46 | 2.3% |
| British | 4 | 0.2% |
| Burmese | 5 | 0.3% |
| Cherokee | 8 | 0.4% |
| Chippewa | 7 | 0.4% |
| Comanche | 11 | 0.6% |
| Croatian | 15 | 0.8% |
| Czech | 19 | 1.0% |
| Dutch | 26 | 1.3% |
| English | 398 | 20.2% |
| European | 116 | 5.9% |
| Finnish | 86 | 4.4% |
| French | 132 | 6.7% |
| French Canadian | 79 | 4.0% |
| German | 390 | 19.8% |
| Greek | 5 | 0.3% |
| Hungarian | 11 | 0.6% |
| Irish | 378 | 19.2% |
| Italian | 59 | 3.0% |
| Lithuanian | 7 | 0.4% |
| Mexican | 3 | 0.2% |
| Northern European | 19 | 1.0% |
| Norwegian | 214 | 10.9% |
| Polish | 31 | 1.6% |
| Potawatomi | 8 | 0.4% |
| Romanian | 5 | 0.3% |
| Scandinavian | 52 | 2.6% |
| Scotch-Irish | 29 | 1.5% |
| Scottish | 23 | 1.2% |
| Sioux | 14 | 0.7% |
| Slovak | 3 | 0.2% |
| Slovene | 6 | 0.3% |
| Spanish | 3 | 0.2% |
| Swedish | 74 | 3.8% |
| Yaqui | 4 | 0.2% | View All 40 Rows |
Immigrants in Clancy
The most numerous immigrant groups reported in Clancy came from , and Canada (13 | 0.7%), together accounting for 0.7% of all Clancy residents.

| Immigration Origin | # Population | % Population |
| Canada | 13 | 0.7% | View All 1 Rows |
Sex and Age in Clancy
Sex and Age in Clancy
The most populous age groups in Clancy are 65 to 69 Years (95 | 10.6%) for men and 65 to 69 Years (139 | 13.0%) for women.
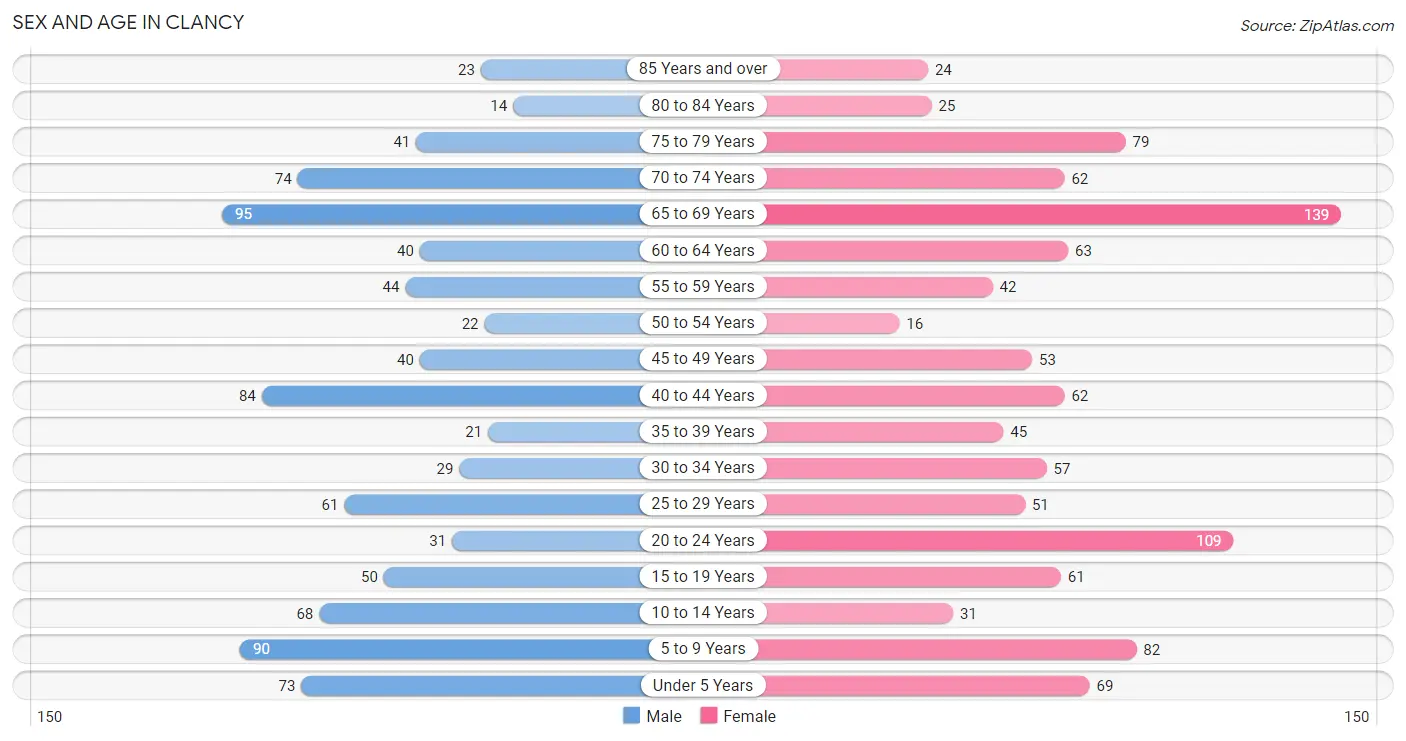
| Age Bracket | Male | Female |
| Under 5 Years | 73 (8.1%) | 69 (6.5%) |
| 5 to 9 Years | 90 (10.0%) | 82 (7.7%) |
| 10 to 14 Years | 68 (7.6%) | 31 (2.9%) |
| 15 to 19 Years | 50 (5.6%) | 61 (5.7%) |
| 20 to 24 Years | 31 (3.4%) | 109 (10.2%) |
| 25 to 29 Years | 61 (6.8%) | 51 (4.8%) |
| 30 to 34 Years | 29 (3.2%) | 57 (5.3%) |
| 35 to 39 Years | 21 (2.3%) | 45 (4.2%) |
| 40 to 44 Years | 84 (9.3%) | 62 (5.8%) |
| 45 to 49 Years | 40 (4.4%) | 53 (5.0%) |
| 50 to 54 Years | 22 (2.4%) | 16 (1.5%) |
| 55 to 59 Years | 44 (4.9%) | 42 (3.9%) |
| 60 to 64 Years | 40 (4.4%) | 63 (5.9%) |
| 65 to 69 Years | 95 (10.6%) | 139 (13.0%) |
| 70 to 74 Years | 74 (8.2%) | 62 (5.8%) |
| 75 to 79 Years | 41 (4.6%) | 79 (7.4%) |
| 80 to 84 Years | 14 (1.6%) | 25 (2.3%) |
| 85 Years and over | 23 (2.6%) | 24 (2.2%) |
| Total | 900 (100.0%) | 1,070 (100.0%) |
Families and Households in Clancy
Median Family Size in Clancy
The median family size in Clancy is 3.40 persons per family, with single female/mother families (29 | 5.6%) accounting for the largest median family size of 4.86 persons per family. On the other hand, single male/father families (4 | 0.8%) represent the smallest median family size with 3.25 persons per family.
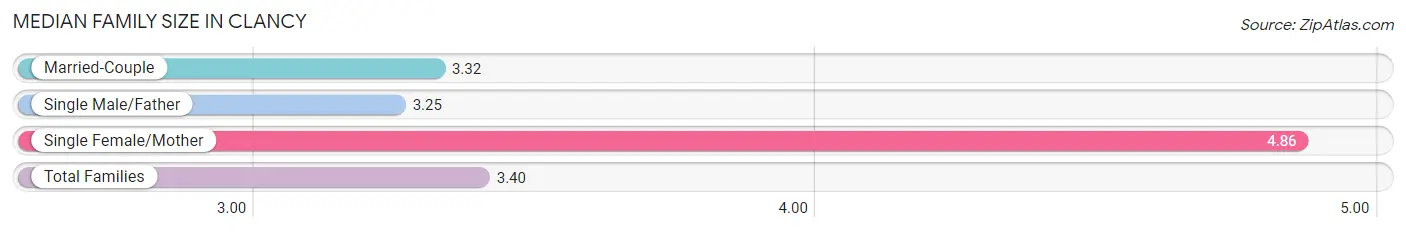
| Family Type | # Families | Family Size |
| Married-Couple | 483 (93.6%) | 3.32 |
| Single Male/Father | 4 (0.8%) | 3.25 |
| Single Female/Mother | 29 (5.6%) | 4.86 |
| Total Families | 516 (100.0%) | 3.40 |
Median Household Size in Clancy
The median household size in Clancy is 2.92 persons per household, with single female/mother households (29 | 4.4%) accounting for the largest median household size of 4.86 persons per household. non-family households (136 | 20.9%) represent the smallest median household size with 1.11 persons per household.
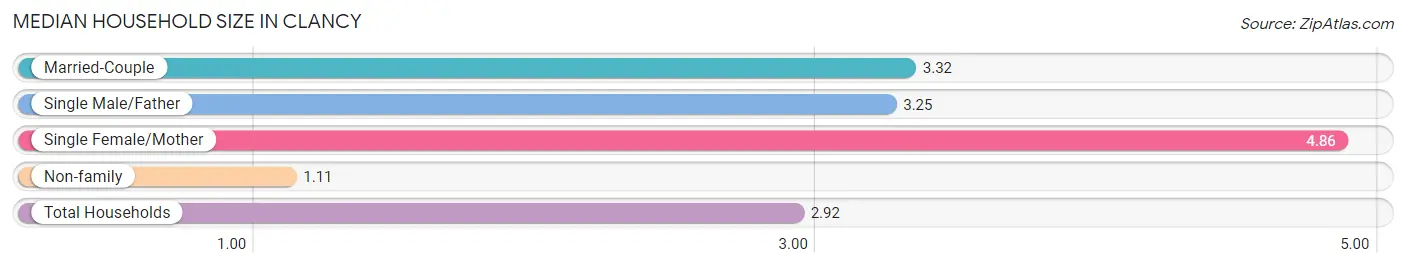
| Household Type | # Households | Household Size |
| Married-Couple | 483 (74.1%) | 3.32 |
| Single Male/Father | 4 (0.6%) | 3.25 |
| Single Female/Mother | 29 (4.4%) | 4.86 |
| Non-family | 136 (20.9%) | 1.11 |
| Total Households | 652 (100.0%) | 2.92 |
Household Size by Marriage Status in Clancy
Out of a total of 652 households in Clancy, 516 (79.1%) are family households, while 136 (20.9%) are nonfamily households. The most numerous type of family households are 2-person households, comprising 245, and the most common type of nonfamily households are 1-person households, comprising 128.
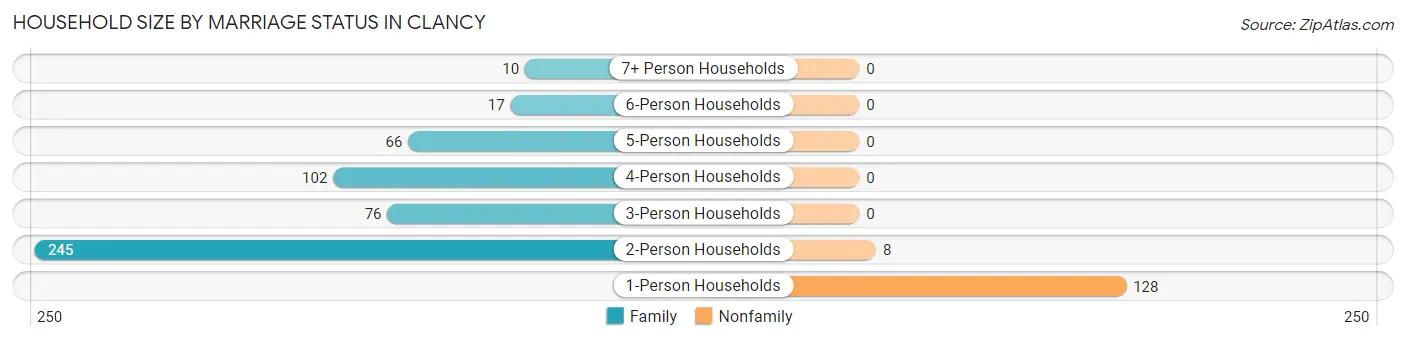
| Household Size | Family Households | Nonfamily Households |
| 1-Person Households | - | 128 (19.6%) |
| 2-Person Households | 245 (37.6%) | 8 (1.2%) |
| 3-Person Households | 76 (11.7%) | 0 (0.0%) |
| 4-Person Households | 102 (15.6%) | 0 (0.0%) |
| 5-Person Households | 66 (10.1%) | 0 (0.0%) |
| 6-Person Households | 17 (2.6%) | 0 (0.0%) |
| 7+ Person Households | 10 (1.5%) | 0 (0.0%) |
| Total | 516 (79.1%) | 136 (20.9%) |
Female Fertility in Clancy
Fertility by Age in Clancy
Average fertility rate in Clancy is 51.0 births per 1,000 women. Women in the age bracket of 20 to 34 years have the highest fertility rate with 78.0 births per 1,000 women. Women in the age bracket of 20 to 34 years acount for 73.9% of all women with births.
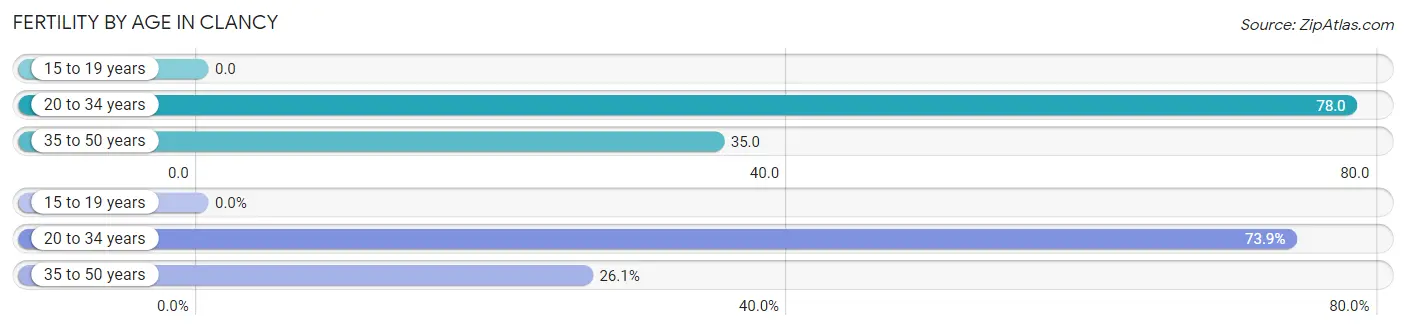
| Age Bracket | Women with Births | Births / 1,000 Women |
| 15 to 19 years | 0 (0.0%) | 0.0 |
| 20 to 34 years | 17 (73.9%) | 78.0 |
| 35 to 50 years | 6 (26.1%) | 35.0 |
| Total | 23 (100.0%) | 51.0 |
Fertility by Age by Marriage Status in Clancy
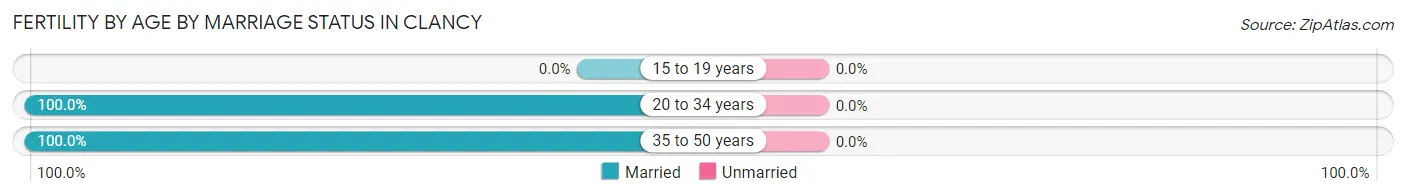
| Age Bracket | Married | Unmarried |
| 15 to 19 years | 0 (0.0%) | 0 (0.0%) |
| 20 to 34 years | 17 (100.0%) | 0 (0.0%) |
| 35 to 50 years | 6 (100.0%) | 0 (0.0%) |
| Total | 23 (100.0%) | 0 (0.0%) |
Fertility by Education in Clancy
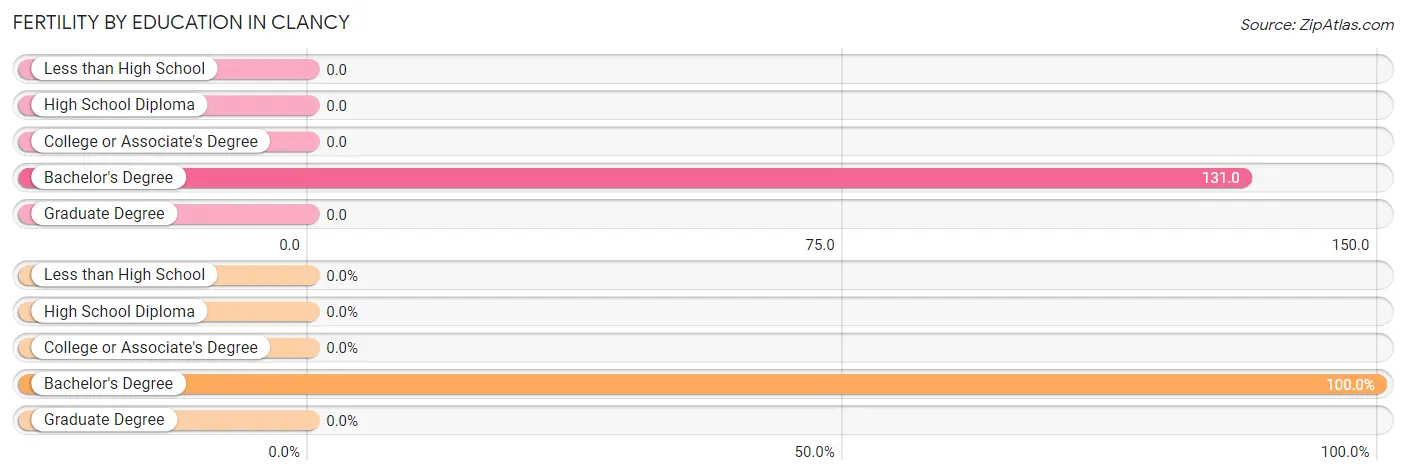
| Educational Attainment | Women with Births | Births / 1,000 Women |
| Less than High School | 0 (0.0%) | 0.0 |
| High School Diploma | 0 (0.0%) | 0.0 |
| College or Associate's Degree | 0 (0.0%) | 0.0 |
| Bachelor's Degree | 23 (100.0%) | 131.0 |
| Graduate Degree | 0 (0.0%) | 0.0 |
| Total | 23 (100.0%) | 51.0 |
Fertility by Education by Marriage Status in Clancy
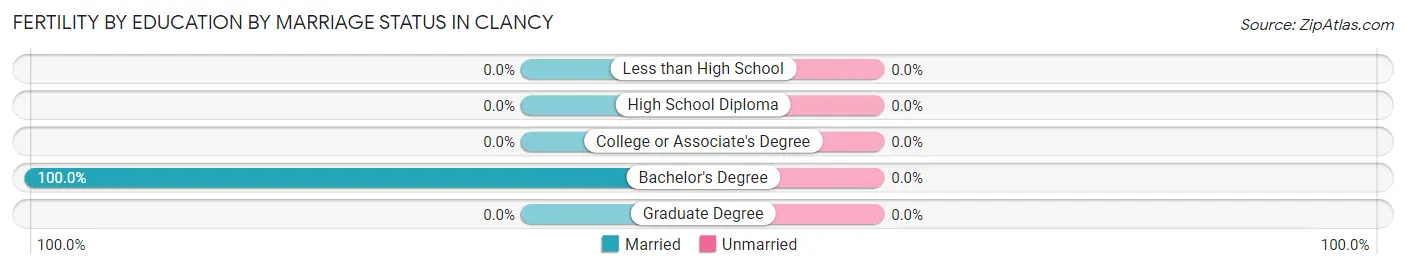
| Educational Attainment | Married | Unmarried |
| Less than High School | 0 (0.0%) | 0 (0.0%) |
| High School Diploma | 0 (0.0%) | 0 (0.0%) |
| College or Associate's Degree | 0 (0.0%) | 0 (0.0%) |
| Bachelor's Degree | 23 (100.0%) | 0 (0.0%) |
| Graduate Degree | 0 (0.0%) | 0 (0.0%) |
| Total | 23 (100.0%) | 0 (0.0%) |
Employment Characteristics in Clancy
Employment by Class of Employer in Clancy
Among the 845 employed individuals in Clancy, private company employees (397 | 47.0%), state government employees (125 | 14.8%), and local government employees (97 | 11.5%) make up the most common classes of employment.
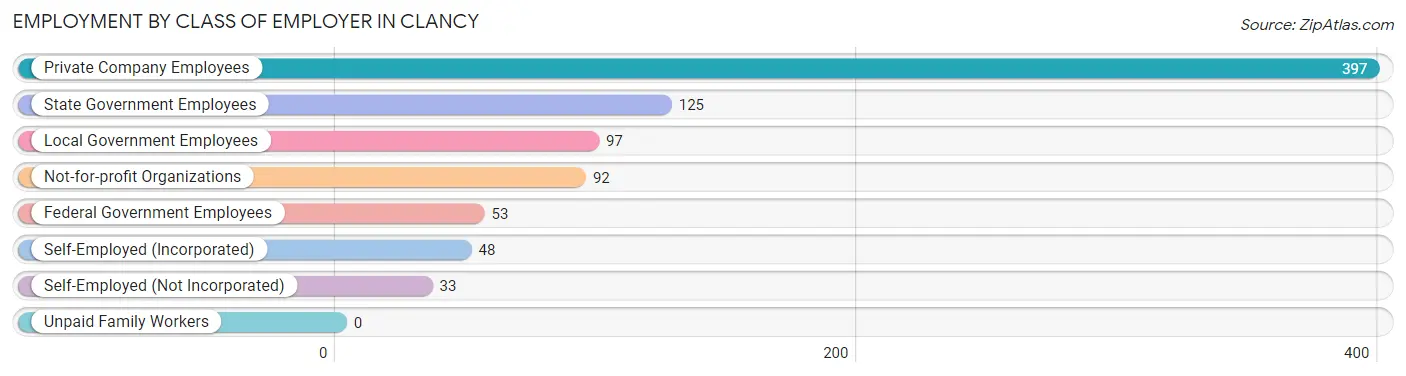
| Employer Class | # Employees | % Employees |
| Private Company Employees | 397 | 47.0% |
| Self-Employed (Incorporated) | 48 | 5.7% |
| Self-Employed (Not Incorporated) | 33 | 3.9% |
| Not-for-profit Organizations | 92 | 10.9% |
| Local Government Employees | 97 | 11.5% |
| State Government Employees | 125 | 14.8% |
| Federal Government Employees | 53 | 6.3% |
| Unpaid Family Workers | 0 | 0.0% |
| Total | 845 | 100.0% |
Employment Status by Age in Clancy
According to the labor force statistics for Clancy, out of the total population over 16 years of age (1,537), 55.8% or 858 individuals are in the labor force, with 1.4% or 12 of them unemployed. The age group with the highest labor force participation rate is 30 to 34 years, with 100.0% or 86 individuals in the labor force. Within the labor force, the 25 to 29 years age range has the highest percentage of unemployed individuals, with 4.7% or 4 of them being unemployed.
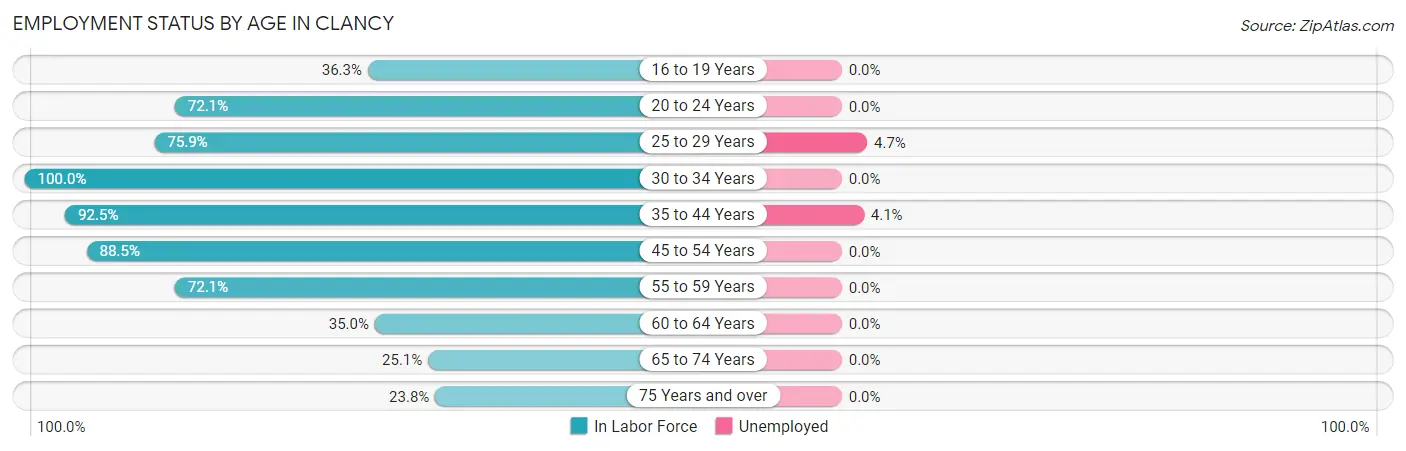
| Age Bracket | In Labor Force | Unemployed |
| 16 to 19 Years | 33 (36.3%) | 0 (0.0%) |
| 20 to 24 Years | 101 (72.1%) | 0 (0.0%) |
| 25 to 29 Years | 85 (75.9%) | 4 (4.7%) |
| 30 to 34 Years | 86 (100.0%) | 0 (0.0%) |
| 35 to 44 Years | 196 (92.5%) | 8 (4.1%) |
| 45 to 54 Years | 116 (88.5%) | 0 (0.0%) |
| 55 to 59 Years | 62 (72.1%) | 0 (0.0%) |
| 60 to 64 Years | 36 (35.0%) | 0 (0.0%) |
| 65 to 74 Years | 93 (25.1%) | 0 (0.0%) |
| 75 Years and over | 49 (23.8%) | 0 (0.0%) |
| Total | 858 (55.8%) | 12 (1.4%) |
Employment Status by Educational Attainment in Clancy
According to labor force statistics for Clancy, 79.6% of individuals (581) out of the total population between 25 and 64 years of age (730) are in the labor force, with 2.1% or 12 of them being unemployed. The group with the highest labor force participation rate are those with the educational attainment of bachelor's degree or higher, with 83.8% or 248 individuals in the labor force. Within the labor force, individuals with bachelor's degree or higher education have the highest percentage of unemployment, with 3.2% or 8 of them being unemployed.
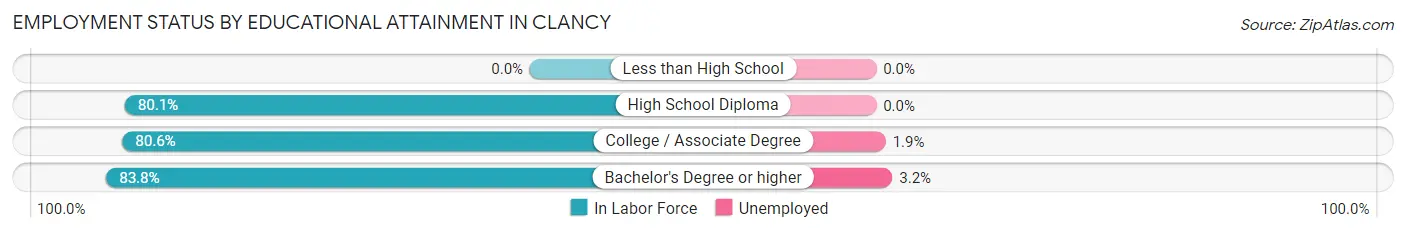
| Educational Attainment | In Labor Force | Unemployed |
| Less than High School | 0 (0.0%) | 0 (0.0%) |
| High School Diploma | 121 (80.1%) | 0 (0.0%) |
| College / Associate Degree | 212 (80.6%) | 5 (1.9%) |
| Bachelor's Degree or higher | 248 (83.8%) | 9 (3.2%) |
| Total | 581 (79.6%) | 15 (2.1%) |
Employment Occupations by Sex in Clancy
Management, Business, Science and Arts Occupations
The most common Management, Business, Science and Arts occupations in Clancy are Community & Social Service (105 | 12.4%), Health Diagnosing & Treating (92 | 10.9%), Health Technologists (87 | 10.3%), Computers, Engineering & Science (73 | 8.6%), and Business & Financial (64 | 7.6%).
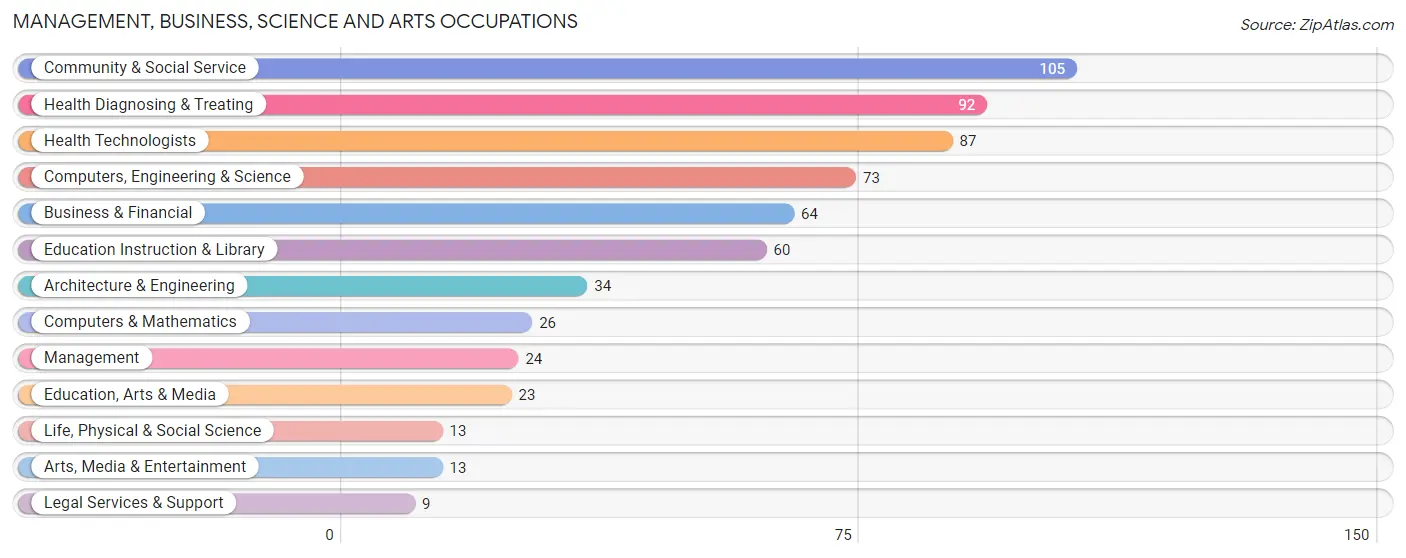
Management, Business, Science and Arts Occupations by Sex
Within the Management, Business, Science and Arts occupations in Clancy, the most male-oriented occupations are Management (87.5%), Architecture & Engineering (82.4%), and Education, Arts & Media (69.6%), while the most female-oriented occupations are Life, Physical & Social Science (100.0%), Education Instruction & Library (100.0%), and Arts, Media & Entertainment (100.0%).
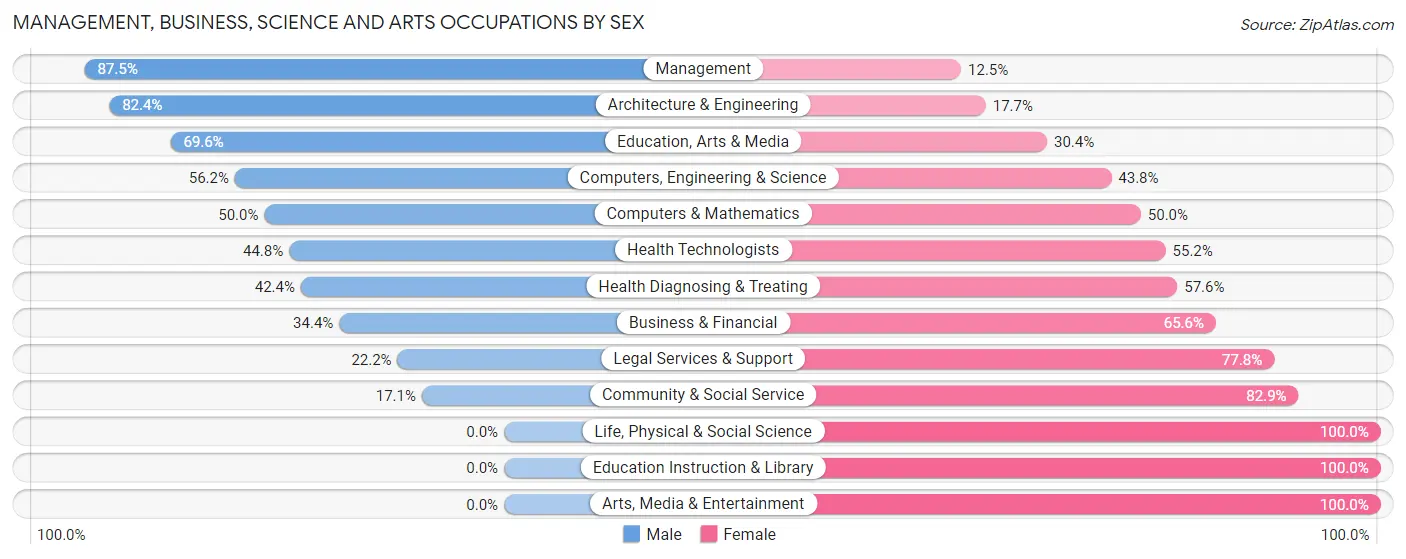
| Occupation | Male | Female |
| Management | 21 (87.5%) | 3 (12.5%) |
| Business & Financial | 22 (34.4%) | 42 (65.6%) |
| Computers, Engineering & Science | 41 (56.2%) | 32 (43.8%) |
| Computers & Mathematics | 13 (50.0%) | 13 (50.0%) |
| Architecture & Engineering | 28 (82.4%) | 6 (17.6%) |
| Life, Physical & Social Science | 0 (0.0%) | 13 (100.0%) |
| Community & Social Service | 18 (17.1%) | 87 (82.9%) |
| Education, Arts & Media | 16 (69.6%) | 7 (30.4%) |
| Legal Services & Support | 2 (22.2%) | 7 (77.8%) |
| Education Instruction & Library | 0 (0.0%) | 60 (100.0%) |
| Arts, Media & Entertainment | 0 (0.0%) | 13 (100.0%) |
| Health Diagnosing & Treating | 39 (42.4%) | 53 (57.6%) |
| Health Technologists | 39 (44.8%) | 48 (55.2%) |
| Total (Category) | 141 (39.4%) | 217 (60.6%) |
| Total (Overall) | 360 (42.6%) | 485 (57.4%) |
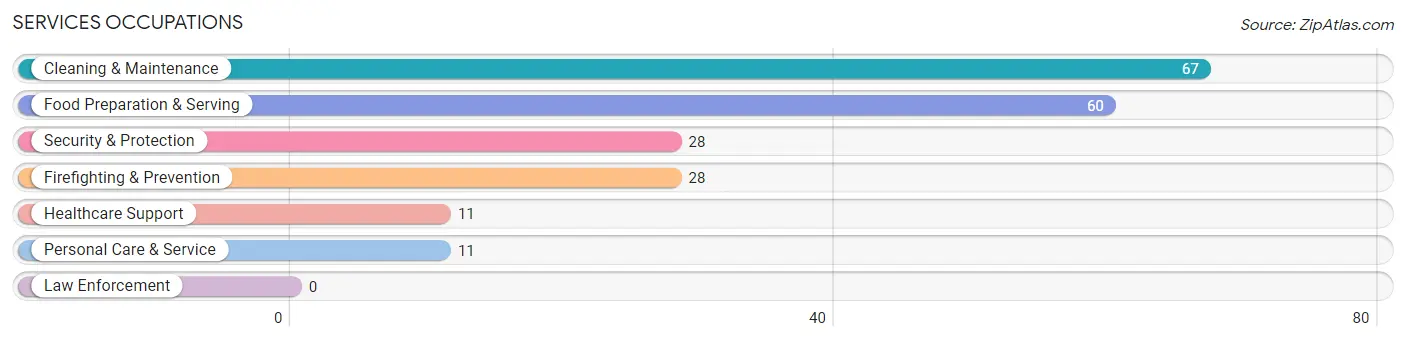
Services Occupations
The most common Services occupations in Clancy are Cleaning & Maintenance (67 | 7.9%), Food Preparation & Serving (60 | 7.1%), Security & Protection (28 | 3.3%), Firefighting & Prevention (28 | 3.3%), and Healthcare Support (11 | 1.3%).
Services Occupations by Sex
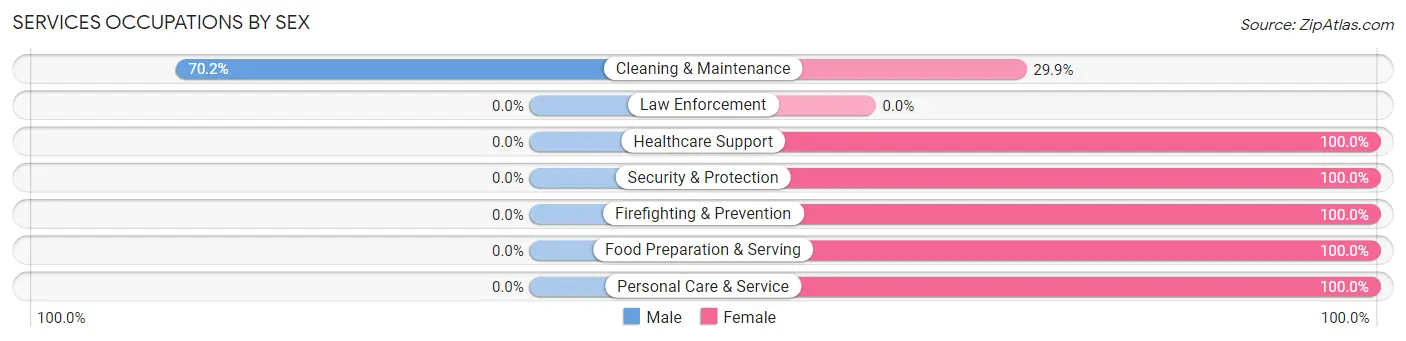
| Occupation | Male | Female |
| Healthcare Support | 0 (0.0%) | 11 (100.0%) |
| Security & Protection | 0 (0.0%) | 28 (100.0%) |
| Firefighting & Prevention | 0 (0.0%) | 28 (100.0%) |
| Law Enforcement | 0 (0.0%) | 0 (0.0%) |
| Food Preparation & Serving | 0 (0.0%) | 60 (100.0%) |
| Cleaning & Maintenance | 47 (70.2%) | 20 (29.8%) |
| Personal Care & Service | 0 (0.0%) | 11 (100.0%) |
| Total (Category) | 47 (26.6%) | 130 (73.5%) |
| Total (Overall) | 360 (42.6%) | 485 (57.4%) |
Sales and Office Occupations
The most common Sales and Office occupations in Clancy are Office & Administration (120 | 14.2%), and Sales & Related (52 | 6.1%).
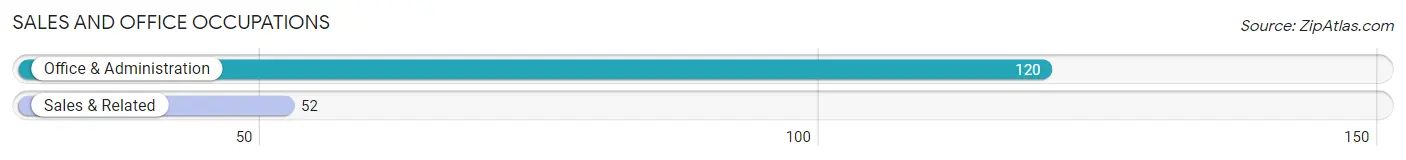
Sales and Office Occupations by Sex
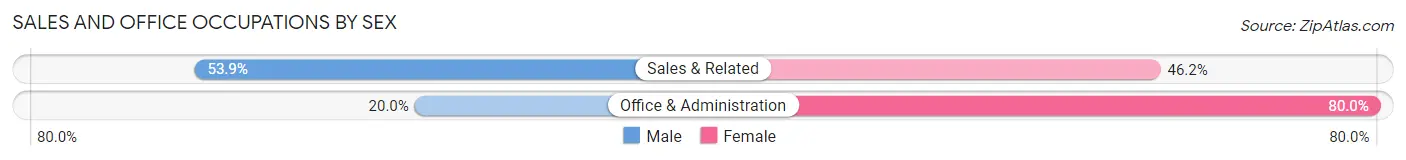
| Occupation | Male | Female |
| Sales & Related | 28 (53.8%) | 24 (46.2%) |
| Office & Administration | 24 (20.0%) | 96 (80.0%) |
| Total (Category) | 52 (30.2%) | 120 (69.8%) |
| Total (Overall) | 360 (42.6%) | 485 (57.4%) |
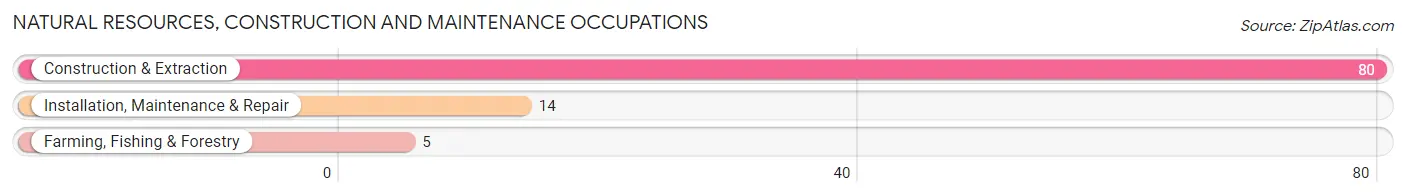
Natural Resources, Construction and Maintenance Occupations
The most common Natural Resources, Construction and Maintenance occupations in Clancy are Construction & Extraction (80 | 9.5%), Installation, Maintenance & Repair (14 | 1.7%), and Farming, Fishing & Forestry (5 | 0.6%).
Natural Resources, Construction and Maintenance Occupations by Sex
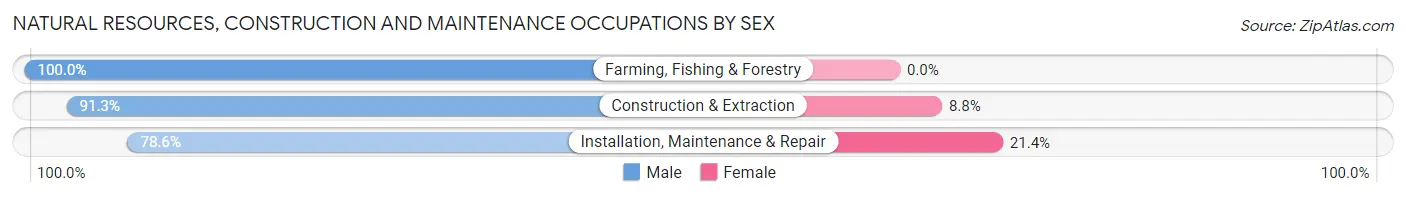
| Occupation | Male | Female |
| Farming, Fishing & Forestry | 5 (100.0%) | 0 (0.0%) |
| Construction & Extraction | 73 (91.2%) | 7 (8.7%) |
| Installation, Maintenance & Repair | 11 (78.6%) | 3 (21.4%) |
| Total (Category) | 89 (89.9%) | 10 (10.1%) |
| Total (Overall) | 360 (42.6%) | 485 (57.4%) |
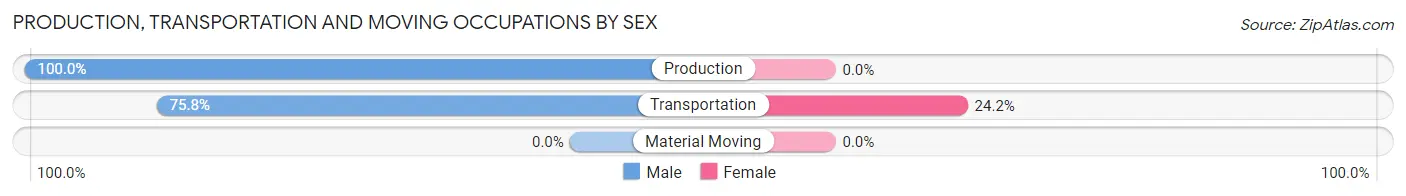
Production, Transportation and Moving Occupations
The most common Production, Transportation and Moving occupations in Clancy are Transportation (33 | 3.9%), and Production (6 | 0.7%).
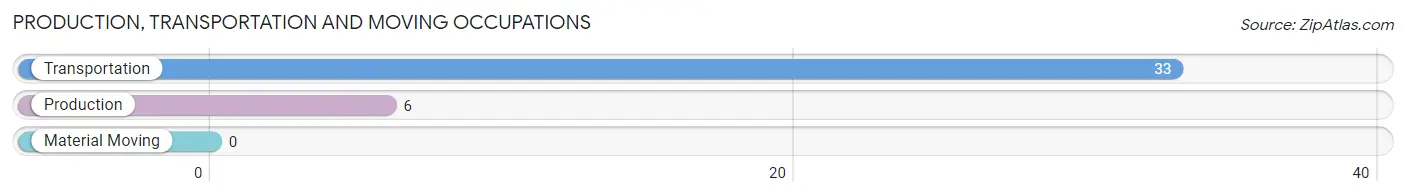
Production, Transportation and Moving Occupations by Sex
| Occupation | Male | Female |
| Production | 6 (100.0%) | 0 (0.0%) |
| Transportation | 25 (75.8%) | 8 (24.2%) |
| Material Moving | 0 (0.0%) | 0 (0.0%) |
| Total (Category) | 31 (79.5%) | 8 (20.5%) |
| Total (Overall) | 360 (42.6%) | 485 (57.4%) |
Employment Industries by Sex in Clancy
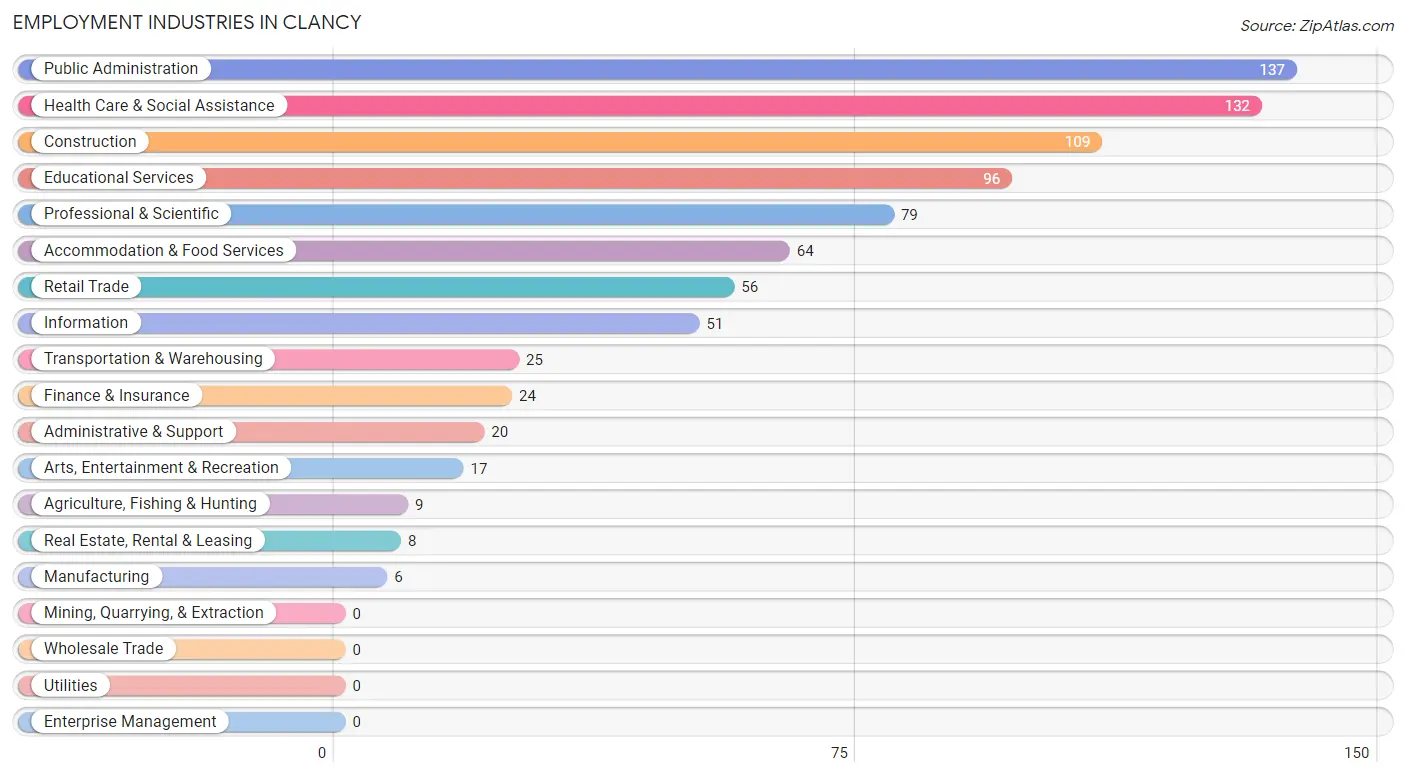
Employment Industries in Clancy
The major employment industries in Clancy include Public Administration (137 | 16.2%), Health Care & Social Assistance (132 | 15.6%), Construction (109 | 12.9%), Educational Services (96 | 11.4%), and Professional & Scientific (79 | 9.3%).
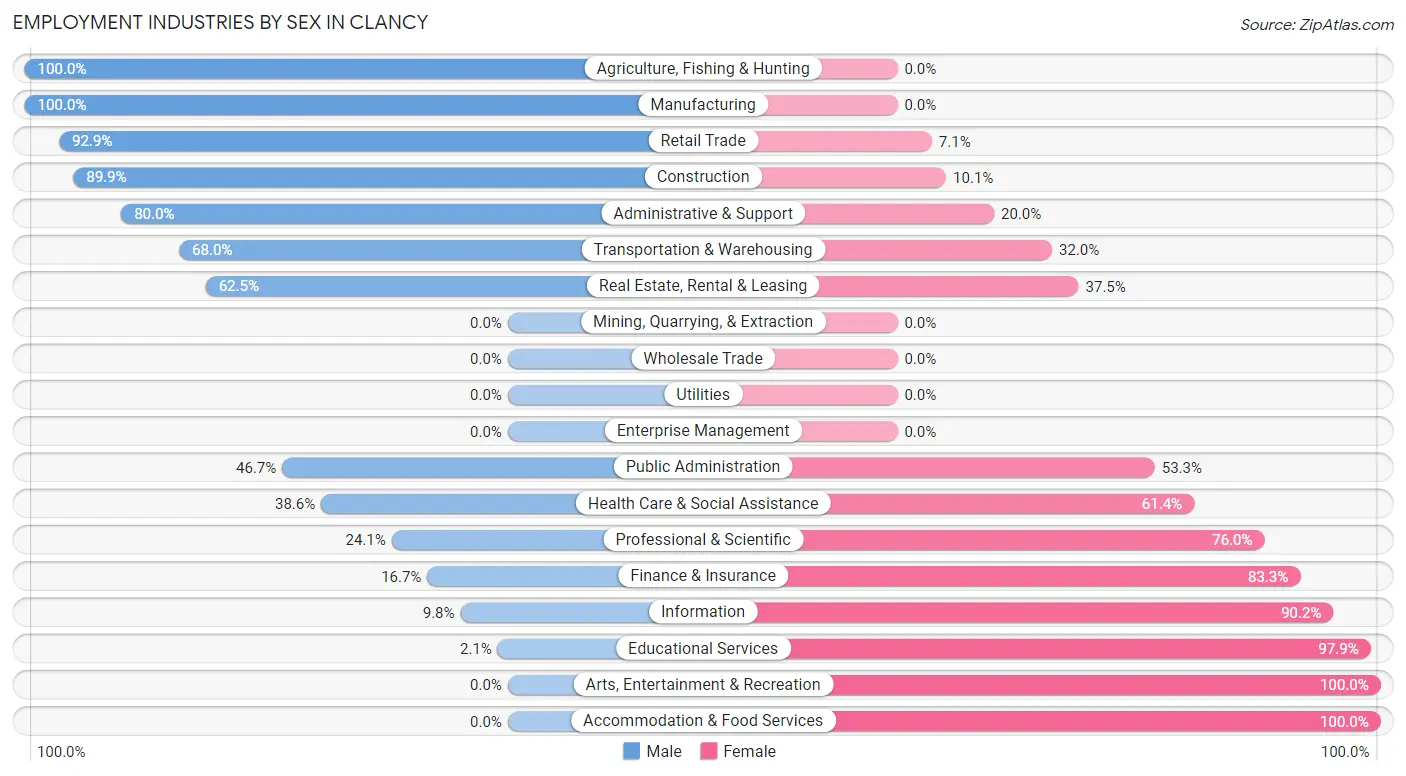
Employment Industries by Sex in Clancy
The Clancy industries that see more men than women are Agriculture, Fishing & Hunting (100.0%), Manufacturing (100.0%), and Retail Trade (92.9%), whereas the industries that tend to have a higher number of women are Arts, Entertainment & Recreation (100.0%), Accommodation & Food Services (100.0%), and Educational Services (97.9%).
| Industry | Male | Female |
| Agriculture, Fishing & Hunting | 9 (100.0%) | 0 (0.0%) |
| Mining, Quarrying, & Extraction | 0 (0.0%) | 0 (0.0%) |
| Construction | 98 (89.9%) | 11 (10.1%) |
| Manufacturing | 6 (100.0%) | 0 (0.0%) |
| Wholesale Trade | 0 (0.0%) | 0 (0.0%) |
| Retail Trade | 52 (92.9%) | 4 (7.1%) |
| Transportation & Warehousing | 17 (68.0%) | 8 (32.0%) |
| Utilities | 0 (0.0%) | 0 (0.0%) |
| Information | 5 (9.8%) | 46 (90.2%) |
| Finance & Insurance | 4 (16.7%) | 20 (83.3%) |
| Real Estate, Rental & Leasing | 5 (62.5%) | 3 (37.5%) |
| Professional & Scientific | 19 (24.0%) | 60 (75.9%) |
| Enterprise Management | 0 (0.0%) | 0 (0.0%) |
| Administrative & Support | 16 (80.0%) | 4 (20.0%) |
| Educational Services | 2 (2.1%) | 94 (97.9%) |
| Health Care & Social Assistance | 51 (38.6%) | 81 (61.4%) |
| Arts, Entertainment & Recreation | 0 (0.0%) | 17 (100.0%) |
| Accommodation & Food Services | 0 (0.0%) | 64 (100.0%) |
| Public Administration | 64 (46.7%) | 73 (53.3%) |
| Total | 360 (42.6%) | 485 (57.4%) |
Education in Clancy
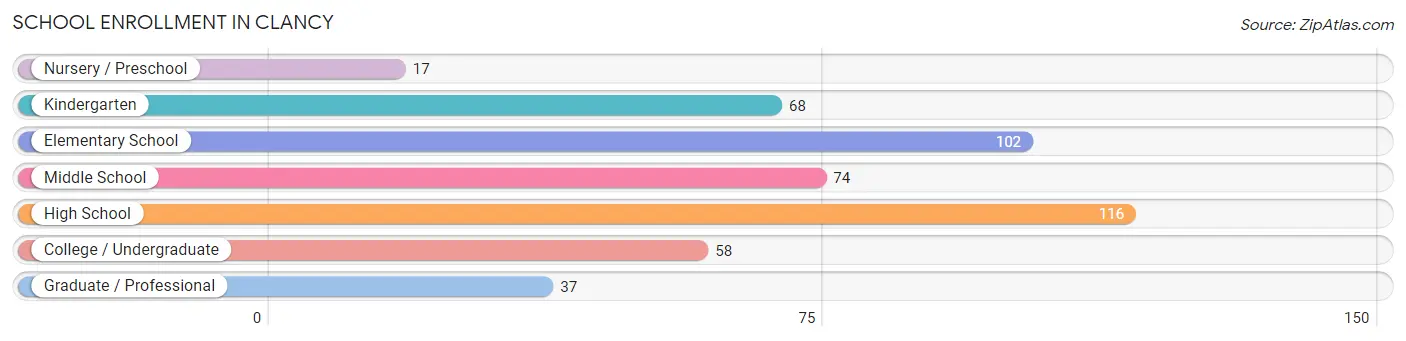
School Enrollment in Clancy
The most common levels of schooling among the 472 students in Clancy are high school (116 | 24.6%), elementary school (102 | 21.6%), and middle school (74 | 15.7%).
| School Level | # Students | % Students |
| Nursery / Preschool | 17 | 3.6% |
| Kindergarten | 68 | 14.4% |
| Elementary School | 102 | 21.6% |
| Middle School | 74 | 15.7% |
| High School | 116 | 24.6% |
| College / Undergraduate | 58 | 12.3% |
| Graduate / Professional | 37 | 7.8% |
| Total | 472 | 100.0% |
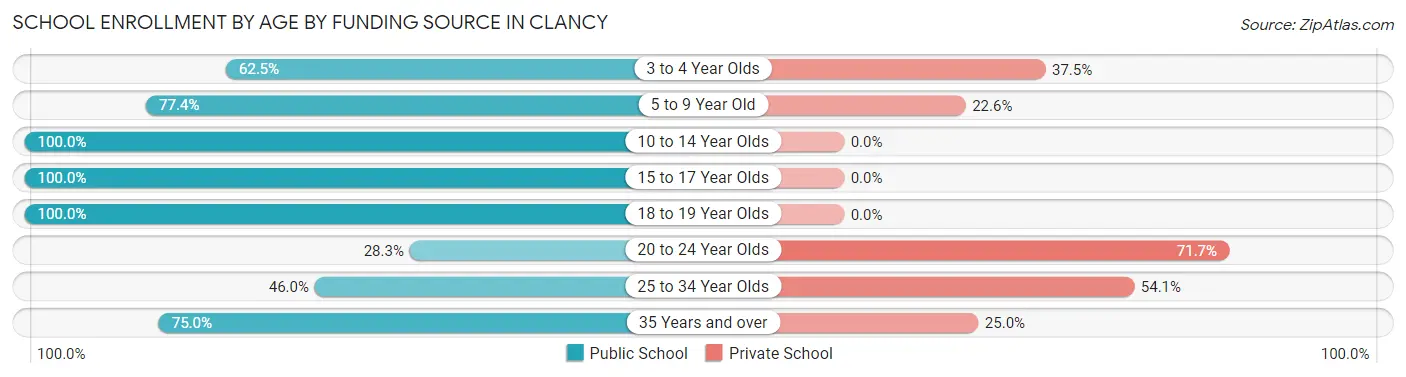
School Enrollment by Age by Funding Source in Clancy
Out of a total of 472 students who are enrolled in schools in Clancy, 95 (20.1%) attend a private institution, while the remaining 377 (79.9%) are enrolled in public schools. The age group of 20 to 24 year olds has the highest likelihood of being enrolled in private schools, with 33 (71.7% in the age bracket) enrolled. Conversely, the age group of 10 to 14 year olds has the lowest likelihood of being enrolled in a private school, with 99 (100.0% in the age bracket) attending a public institution.
| Age Bracket | Public School | Private School |
| 3 to 4 Year Olds | 5 (62.5%) | 3 (37.5%) |
| 5 to 9 Year Old | 123 (77.4%) | 36 (22.6%) |
| 10 to 14 Year Olds | 99 (100.0%) | 0 (0.0%) |
| 15 to 17 Year Olds | 93 (100.0%) | 0 (0.0%) |
| 18 to 19 Year Olds | 18 (100.0%) | 0 (0.0%) |
| 20 to 24 Year Olds | 13 (28.3%) | 33 (71.7%) |
| 25 to 34 Year Olds | 17 (46.0%) | 20 (54.0%) |
| 35 Years and over | 9 (75.0%) | 3 (25.0%) |
| Total | 377 (79.9%) | 95 (20.1%) |
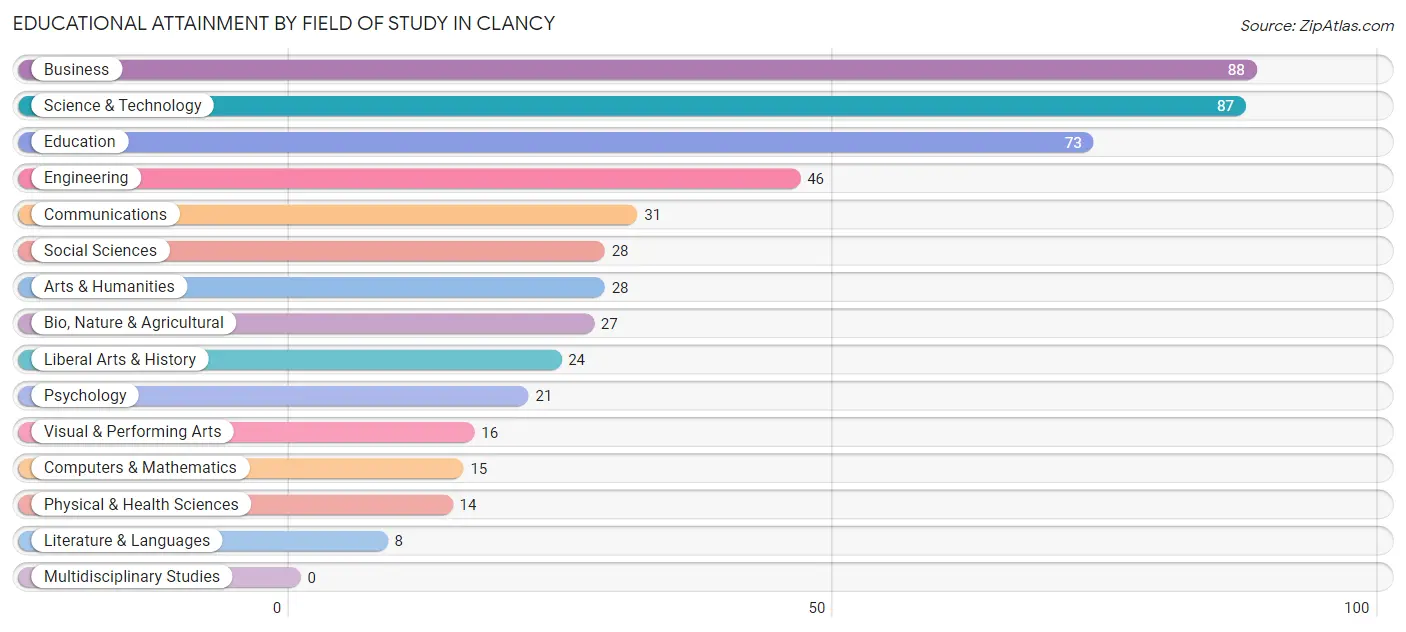
Educational Attainment by Field of Study in Clancy
Business (88 | 17.4%), science & technology (87 | 17.2%), education (73 | 14.4%), engineering (46 | 9.1%), and communications (31 | 6.1%) are the most common fields of study among 506 individuals in Clancy who have obtained a bachelor's degree or higher.
| Field of Study | # Graduates | % Graduates |
| Computers & Mathematics | 15 | 3.0% |
| Bio, Nature & Agricultural | 27 | 5.3% |
| Physical & Health Sciences | 14 | 2.8% |
| Psychology | 21 | 4.2% |
| Social Sciences | 28 | 5.5% |
| Engineering | 46 | 9.1% |
| Multidisciplinary Studies | 0 | 0.0% |
| Science & Technology | 87 | 17.2% |
| Business | 88 | 17.4% |
| Education | 73 | 14.4% |
| Literature & Languages | 8 | 1.6% |
| Liberal Arts & History | 24 | 4.7% |
| Visual & Performing Arts | 16 | 3.2% |
| Communications | 31 | 6.1% |
| Arts & Humanities | 28 | 5.5% |
| Total | 506 | 100.0% |
Transportation & Commute in Clancy
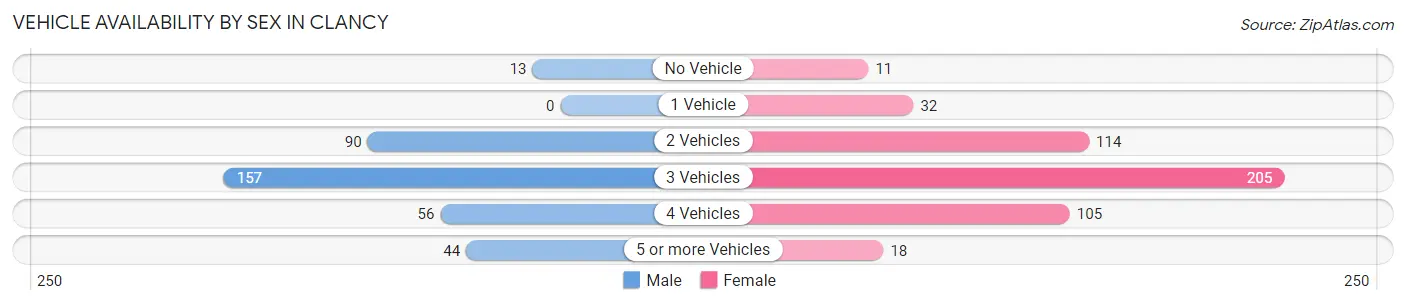
Vehicle Availability by Sex in Clancy
The most prevalent vehicle ownership categories in Clancy are males with 3 vehicles (157, accounting for 43.6%) and females with 3 vehicles (205, making up 32.4%).
| Vehicles Available | Male | Female |
| No Vehicle | 13 (3.6%) | 11 (2.3%) |
| 1 Vehicle | 0 (0.0%) | 32 (6.6%) |
| 2 Vehicles | 90 (25.0%) | 114 (23.5%) |
| 3 Vehicles | 157 (43.6%) | 205 (42.3%) |
| 4 Vehicles | 56 (15.6%) | 105 (21.6%) |
| 5 or more Vehicles | 44 (12.2%) | 18 (3.7%) |
| Total | 360 (100.0%) | 485 (100.0%) |
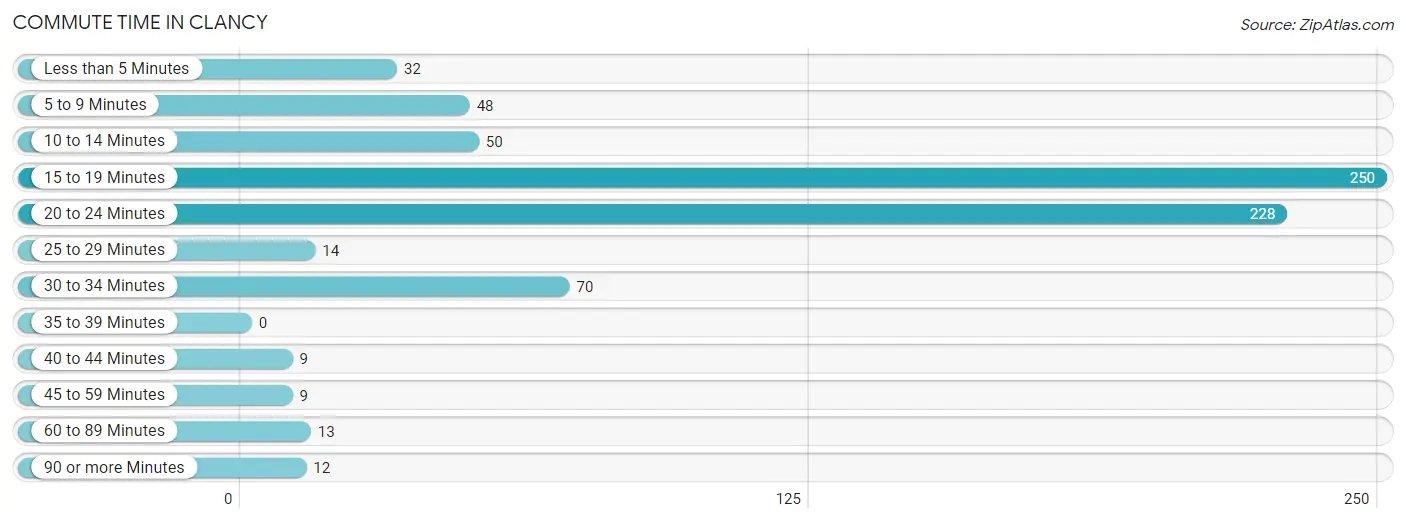
Commute Time in Clancy
The most frequently occuring commute durations in Clancy are 15 to 19 minutes (250 commuters, 34.0%), 20 to 24 minutes (228 commuters, 31.0%), and 30 to 34 minutes (70 commuters, 9.5%).
| Commute Time | # Commuters | % Commuters |
| Less than 5 Minutes | 32 | 4.3% |
| 5 to 9 Minutes | 48 | 6.5% |
| 10 to 14 Minutes | 50 | 6.8% |
| 15 to 19 Minutes | 250 | 34.0% |
| 20 to 24 Minutes | 228 | 31.0% |
| 25 to 29 Minutes | 14 | 1.9% |
| 30 to 34 Minutes | 70 | 9.5% |
| 35 to 39 Minutes | 0 | 0.0% |
| 40 to 44 Minutes | 9 | 1.2% |
| 45 to 59 Minutes | 9 | 1.2% |
| 60 to 89 Minutes | 13 | 1.8% |
| 90 or more Minutes | 12 | 1.6% |
Commute Time by Sex in Clancy
The most common commute times in Clancy are 20 to 24 minutes (154 commuters, 46.7%) for males and 15 to 19 minutes (195 commuters, 48.1%) for females.
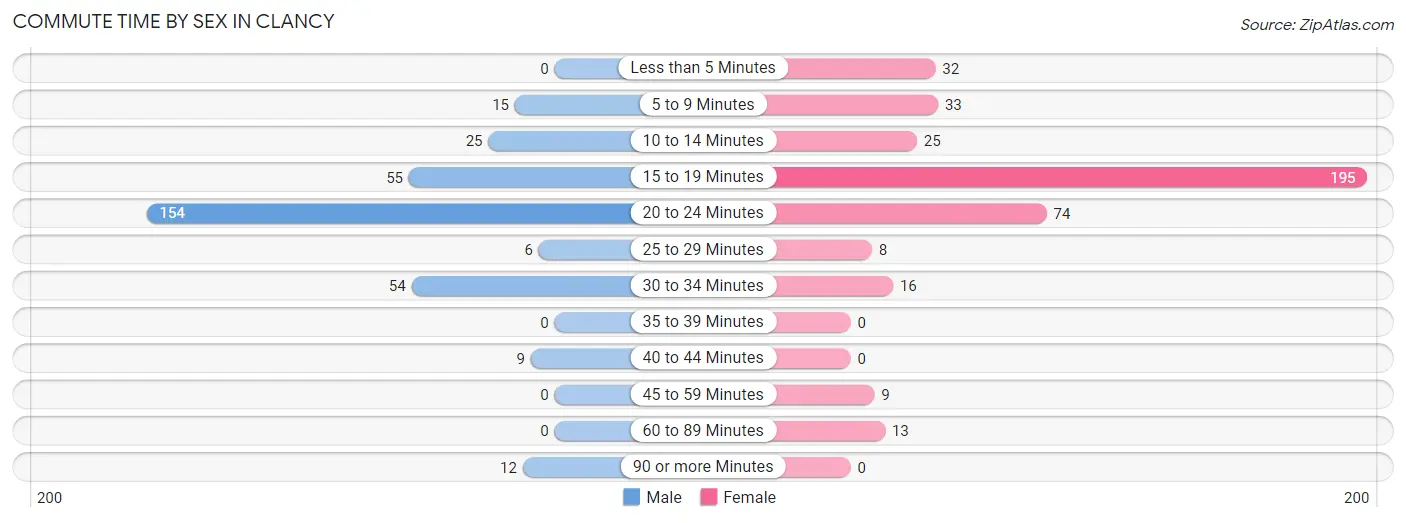
| Commute Time | Male | Female |
| Less than 5 Minutes | 0 (0.0%) | 32 (7.9%) |
| 5 to 9 Minutes | 15 (4.5%) | 33 (8.2%) |
| 10 to 14 Minutes | 25 (7.6%) | 25 (6.2%) |
| 15 to 19 Minutes | 55 (16.7%) | 195 (48.1%) |
| 20 to 24 Minutes | 154 (46.7%) | 74 (18.3%) |
| 25 to 29 Minutes | 6 (1.8%) | 8 (2.0%) |
| 30 to 34 Minutes | 54 (16.4%) | 16 (4.0%) |
| 35 to 39 Minutes | 0 (0.0%) | 0 (0.0%) |
| 40 to 44 Minutes | 9 (2.7%) | 0 (0.0%) |
| 45 to 59 Minutes | 0 (0.0%) | 9 (2.2%) |
| 60 to 89 Minutes | 0 (0.0%) | 13 (3.2%) |
| 90 or more Minutes | 12 (3.6%) | 0 (0.0%) |
Time of Departure to Work by Sex in Clancy
The most frequent times of departure to work in Clancy are 7:00 AM to 7:29 AM (102, 30.9%) for males and 7:00 AM to 7:29 AM (75, 18.5%) for females.
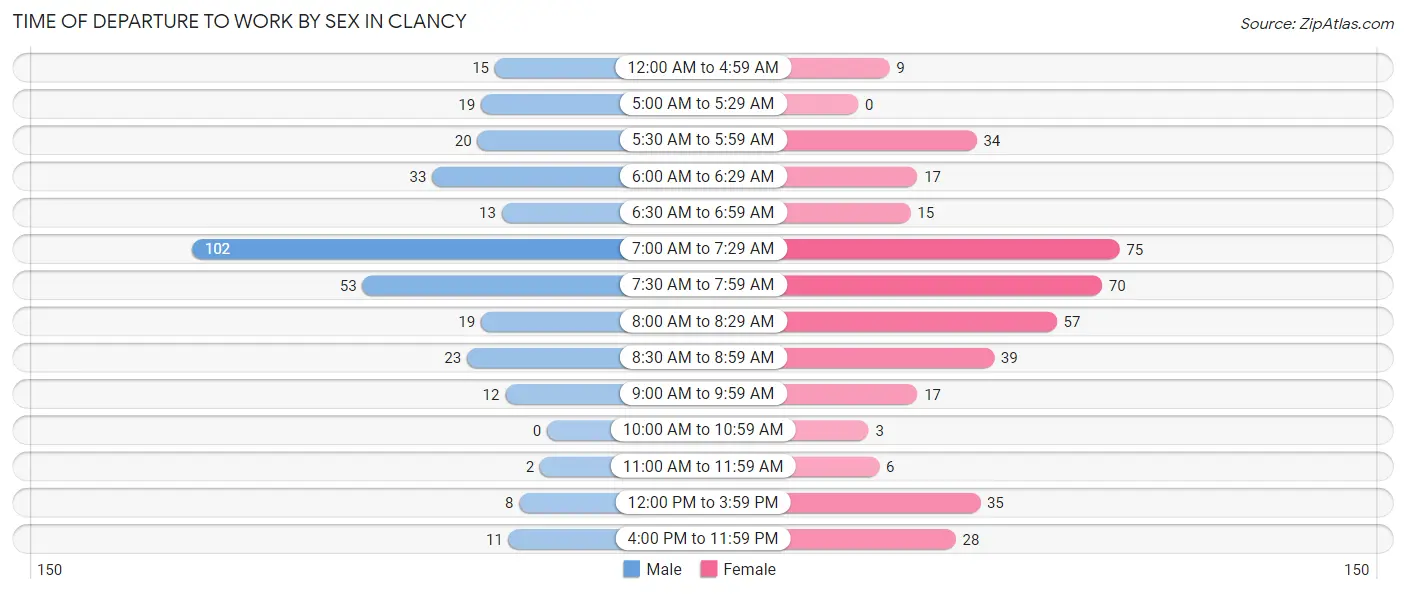
| Time of Departure | Male | Female |
| 12:00 AM to 4:59 AM | 15 (4.5%) | 9 (2.2%) |
| 5:00 AM to 5:29 AM | 19 (5.8%) | 0 (0.0%) |
| 5:30 AM to 5:59 AM | 20 (6.1%) | 34 (8.4%) |
| 6:00 AM to 6:29 AM | 33 (10.0%) | 17 (4.2%) |
| 6:30 AM to 6:59 AM | 13 (3.9%) | 15 (3.7%) |
| 7:00 AM to 7:29 AM | 102 (30.9%) | 75 (18.5%) |
| 7:30 AM to 7:59 AM | 53 (16.1%) | 70 (17.3%) |
| 8:00 AM to 8:29 AM | 19 (5.8%) | 57 (14.1%) |
| 8:30 AM to 8:59 AM | 23 (7.0%) | 39 (9.6%) |
| 9:00 AM to 9:59 AM | 12 (3.6%) | 17 (4.2%) |
| 10:00 AM to 10:59 AM | 0 (0.0%) | 3 (0.7%) |
| 11:00 AM to 11:59 AM | 2 (0.6%) | 6 (1.5%) |
| 12:00 PM to 3:59 PM | 8 (2.4%) | 35 (8.6%) |
| 4:00 PM to 11:59 PM | 11 (3.3%) | 28 (6.9%) |
| Total | 330 (100.0%) | 405 (100.0%) |
Housing Occupancy in Clancy
Occupancy by Ownership in Clancy
Of the total 652 dwellings in Clancy, owner-occupied units account for 558 (85.6%), while renter-occupied units make up 94 (14.4%).
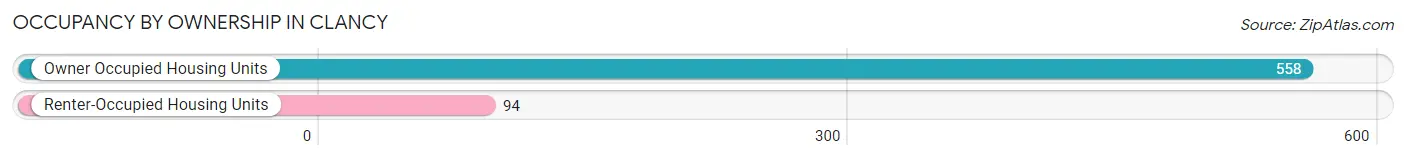
| Occupancy | # Housing Units | % Housing Units |
| Owner Occupied Housing Units | 558 | 85.6% |
| Renter-Occupied Housing Units | 94 | 14.4% |
| Total Occupied Housing Units | 652 | 100.0% |
Occupancy by Household Size in Clancy
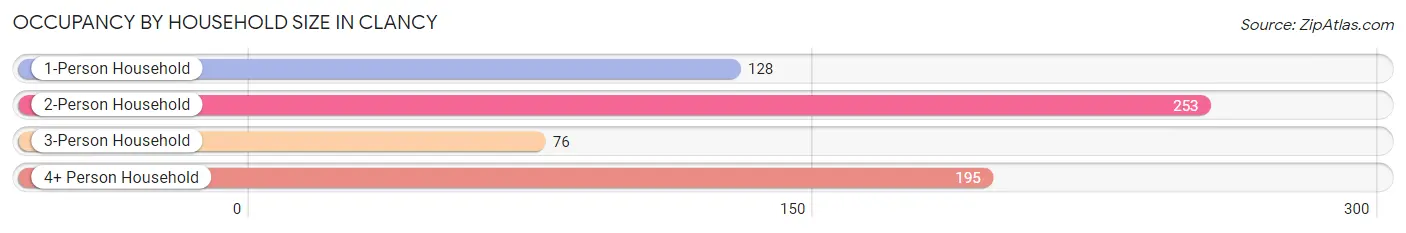
| Household Size | # Housing Units | % Housing Units |
| 1-Person Household | 128 | 19.6% |
| 2-Person Household | 253 | 38.8% |
| 3-Person Household | 76 | 11.7% |
| 4+ Person Household | 195 | 29.9% |
| Total Housing Units | 652 | 100.0% |
Occupancy by Ownership by Household Size in Clancy
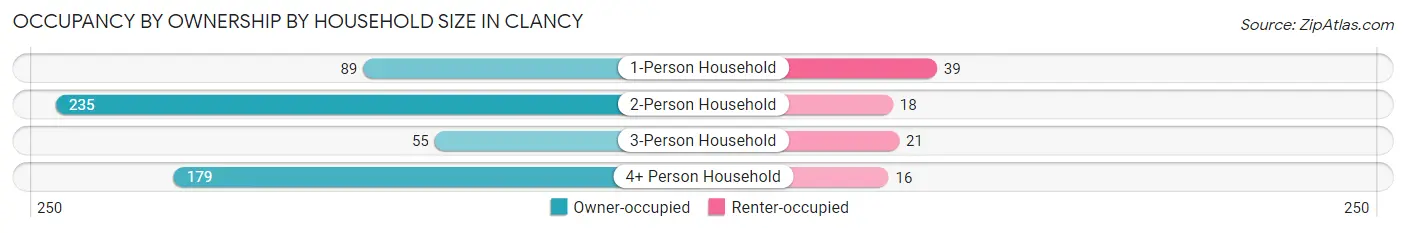
| Household Size | Owner-occupied | Renter-occupied |
| 1-Person Household | 89 (69.5%) | 39 (30.5%) |
| 2-Person Household | 235 (92.9%) | 18 (7.1%) |
| 3-Person Household | 55 (72.4%) | 21 (27.6%) |
| 4+ Person Household | 179 (91.8%) | 16 (8.2%) |
| Total Housing Units | 558 (85.6%) | 94 (14.4%) |
Occupancy by Educational Attainment in Clancy
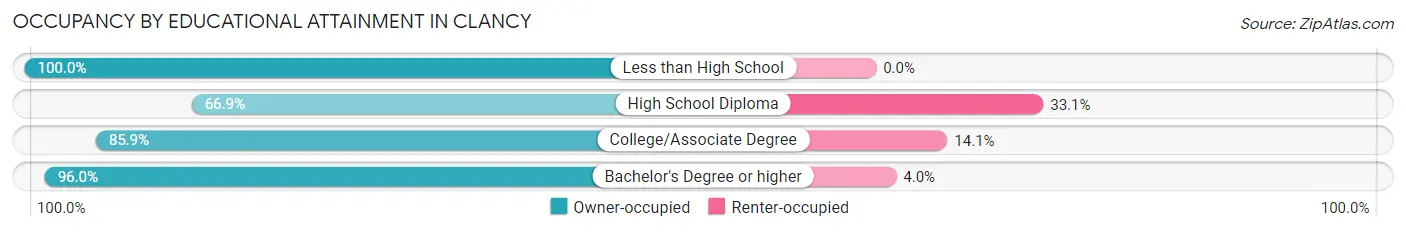
| Household Size | Owner-occupied | Renter-occupied |
| Less than High School | 7 (100.0%) | 0 (0.0%) |
| High School Diploma | 117 (66.9%) | 58 (33.1%) |
| College/Associate Degree | 146 (85.9%) | 24 (14.1%) |
| Bachelor's Degree or higher | 288 (96.0%) | 12 (4.0%) |
Occupancy by Age of Householder in Clancy
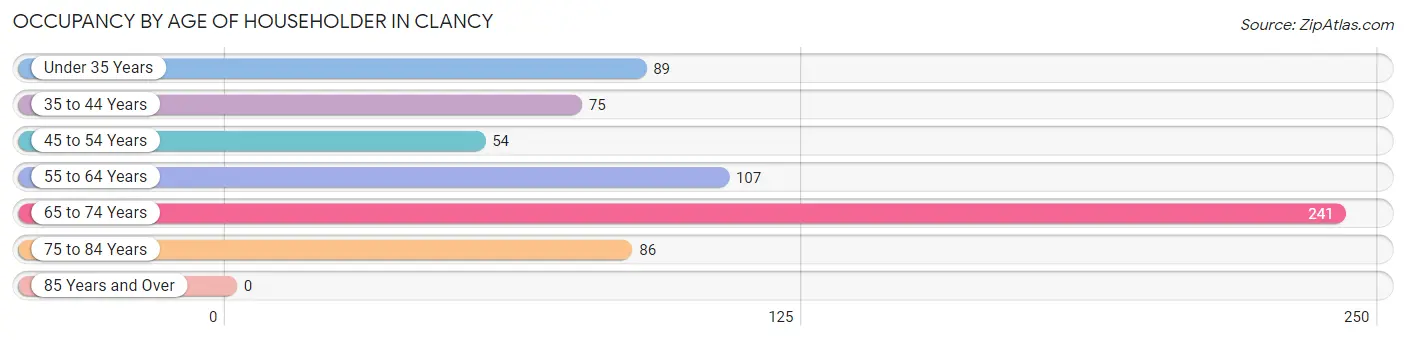
| Age Bracket | # Households | % Households |
| Under 35 Years | 89 | 13.7% |
| 35 to 44 Years | 75 | 11.5% |
| 45 to 54 Years | 54 | 8.3% |
| 55 to 64 Years | 107 | 16.4% |
| 65 to 74 Years | 241 | 37.0% |
| 75 to 84 Years | 86 | 13.2% |
| 85 Years and Over | 0 | 0.0% |
| Total | 652 | 100.0% |
Housing Finances in Clancy
Median Income by Occupancy in Clancy
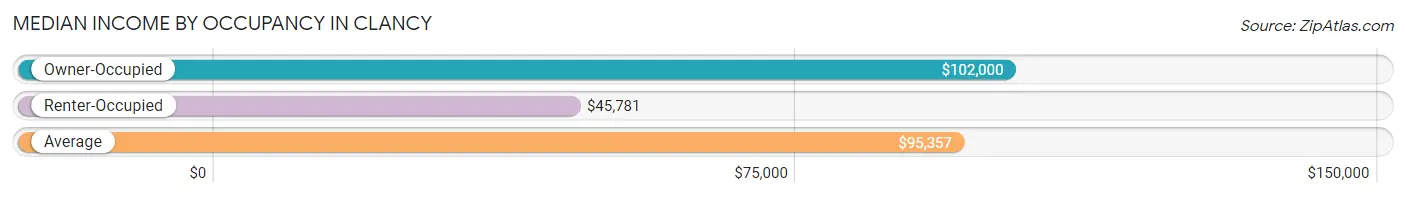
| Occupancy Type | # Households | Median Income |
| Owner-Occupied | 558 (85.6%) | $102,000 |
| Renter-Occupied | 94 (14.4%) | $45,781 |
| Average | 652 (100.0%) | $95,357 |
Occupancy by Householder Income Bracket in Clancy
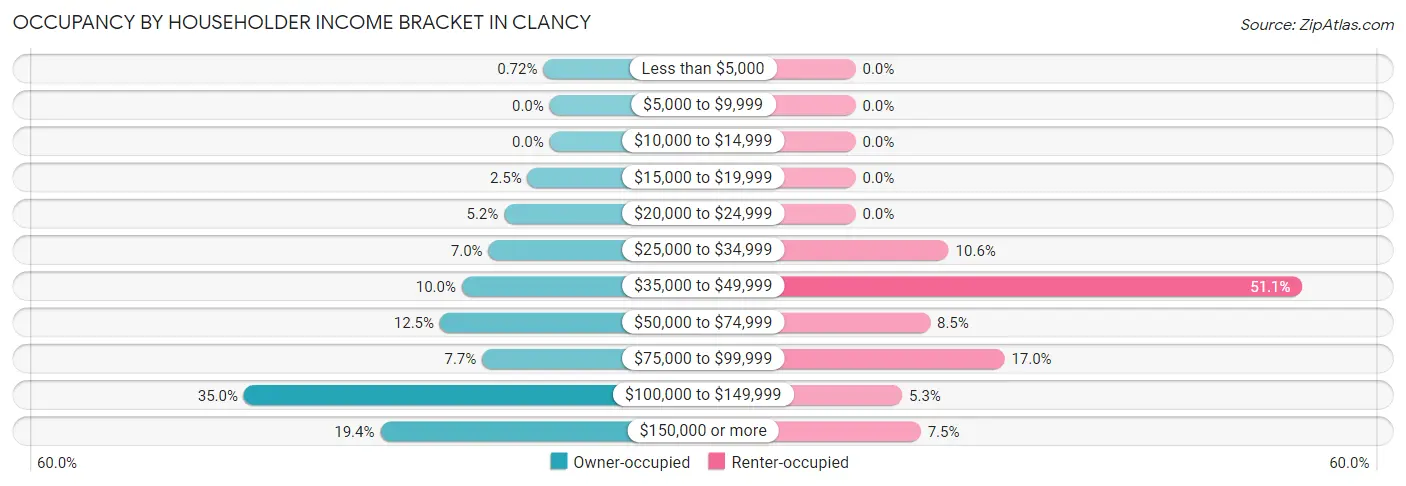
| Income Bracket | Owner-occupied | Renter-occupied |
| Less than $5,000 | 4 (0.7%) | 0 (0.0%) |
| $5,000 to $9,999 | 0 (0.0%) | 0 (0.0%) |
| $10,000 to $14,999 | 0 (0.0%) | 0 (0.0%) |
| $15,000 to $19,999 | 14 (2.5%) | 0 (0.0%) |
| $20,000 to $24,999 | 29 (5.2%) | 0 (0.0%) |
| $25,000 to $34,999 | 39 (7.0%) | 10 (10.6%) |
| $35,000 to $49,999 | 56 (10.0%) | 48 (51.1%) |
| $50,000 to $74,999 | 70 (12.5%) | 8 (8.5%) |
| $75,000 to $99,999 | 43 (7.7%) | 16 (17.0%) |
| $100,000 to $149,999 | 195 (34.9%) | 5 (5.3%) |
| $150,000 or more | 108 (19.4%) | 7 (7.4%) |
| Total | 558 (100.0%) | 94 (100.0%) |
Monthly Housing Cost Tiers in Clancy
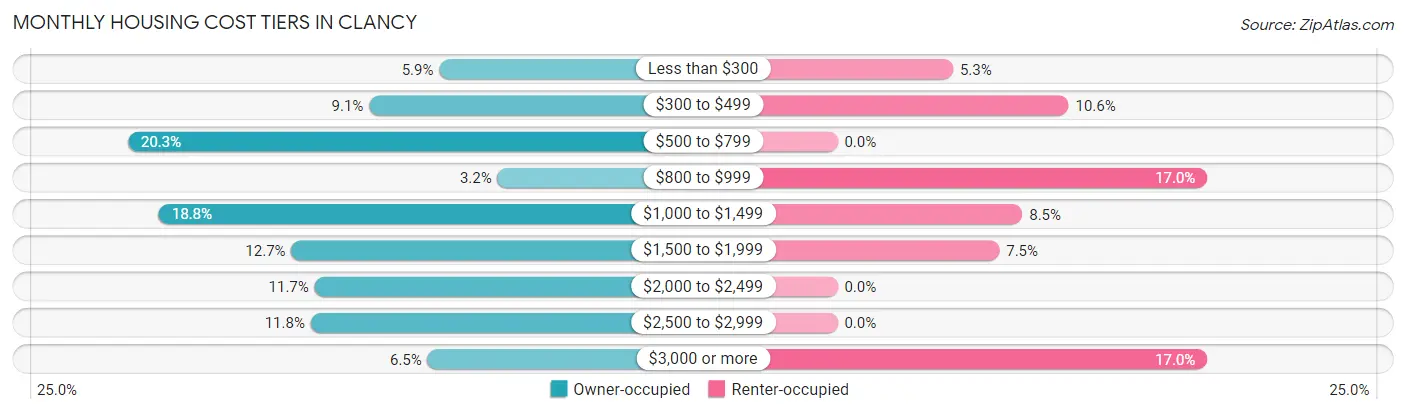
| Monthly Cost | Owner-occupied | Renter-occupied |
| Less than $300 | 33 (5.9%) | 5 (5.3%) |
| $300 to $499 | 51 (9.1%) | 10 (10.6%) |
| $500 to $799 | 113 (20.3%) | 0 (0.0%) |
| $800 to $999 | 18 (3.2%) | 16 (17.0%) |
| $1,000 to $1,499 | 105 (18.8%) | 8 (8.5%) |
| $1,500 to $1,999 | 71 (12.7%) | 7 (7.4%) |
| $2,000 to $2,499 | 65 (11.7%) | 0 (0.0%) |
| $2,500 to $2,999 | 66 (11.8%) | 0 (0.0%) |
| $3,000 or more | 36 (6.5%) | 16 (17.0%) |
| Total | 558 (100.0%) | 94 (100.0%) |
Physical Housing Characteristics in Clancy
Housing Structures in Clancy
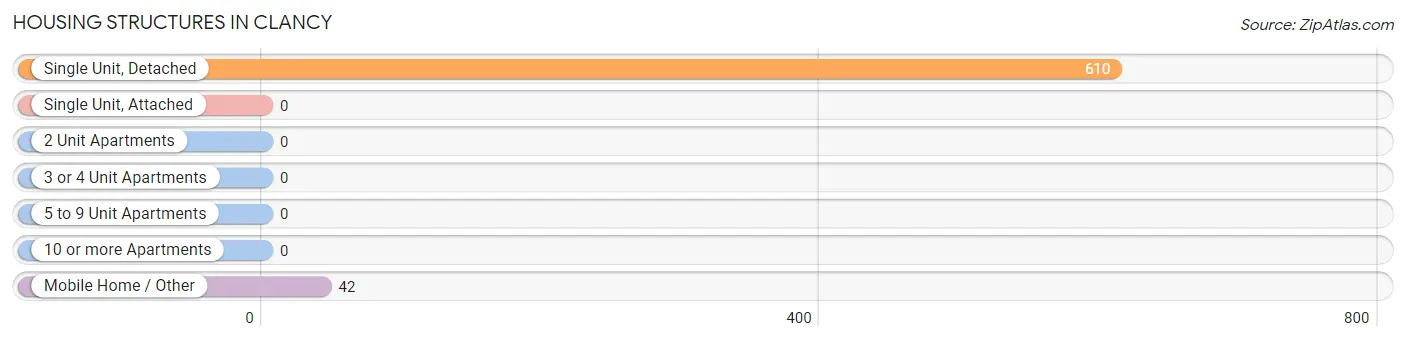
| Structure Type | # Housing Units | % Housing Units |
| Single Unit, Detached | 610 | 93.6% |
| Single Unit, Attached | 0 | 0.0% |
| 2 Unit Apartments | 0 | 0.0% |
| 3 or 4 Unit Apartments | 0 | 0.0% |
| 5 to 9 Unit Apartments | 0 | 0.0% |
| 10 or more Apartments | 0 | 0.0% |
| Mobile Home / Other | 42 | 6.4% |
| Total | 652 | 100.0% |
Housing Structures by Occupancy in Clancy
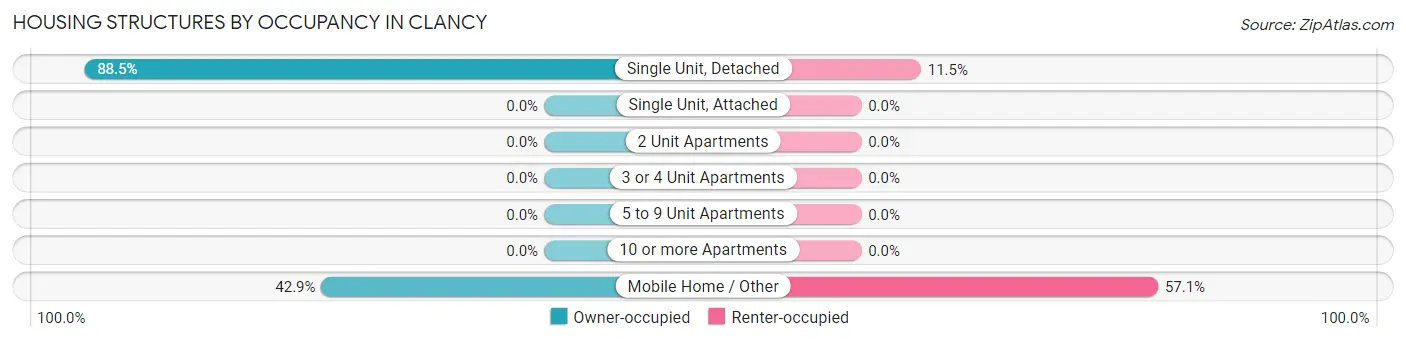
| Structure Type | Owner-occupied | Renter-occupied |
| Single Unit, Detached | 540 (88.5%) | 70 (11.5%) |
| Single Unit, Attached | 0 (0.0%) | 0 (0.0%) |
| 2 Unit Apartments | 0 (0.0%) | 0 (0.0%) |
| 3 or 4 Unit Apartments | 0 (0.0%) | 0 (0.0%) |
| 5 to 9 Unit Apartments | 0 (0.0%) | 0 (0.0%) |
| 10 or more Apartments | 0 (0.0%) | 0 (0.0%) |
| Mobile Home / Other | 18 (42.9%) | 24 (57.1%) |
| Total | 558 (85.6%) | 94 (14.4%) |
Housing Structures by Number of Rooms in Clancy
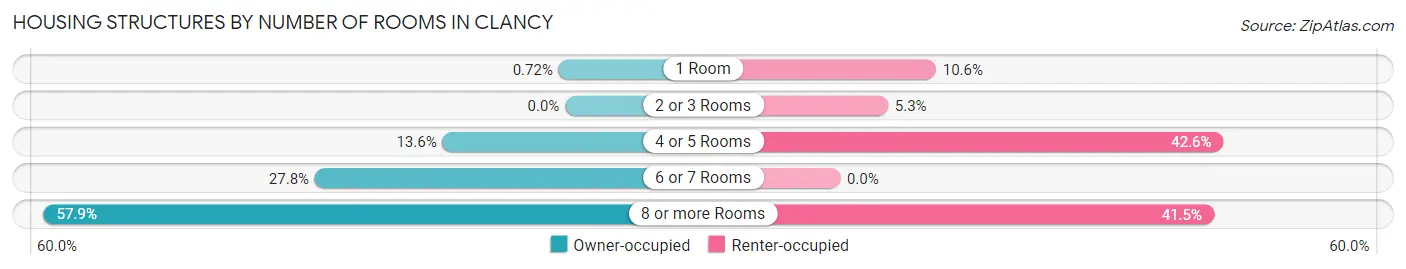
| Number of Rooms | Owner-occupied | Renter-occupied |
| 1 Room | 4 (0.7%) | 10 (10.6%) |
| 2 or 3 Rooms | 0 (0.0%) | 5 (5.3%) |
| 4 or 5 Rooms | 76 (13.6%) | 40 (42.5%) |
| 6 or 7 Rooms | 155 (27.8%) | 0 (0.0%) |
| 8 or more Rooms | 323 (57.9%) | 39 (41.5%) |
| Total | 558 (100.0%) | 94 (100.0%) |
Housing Structure by Heating Type in Clancy
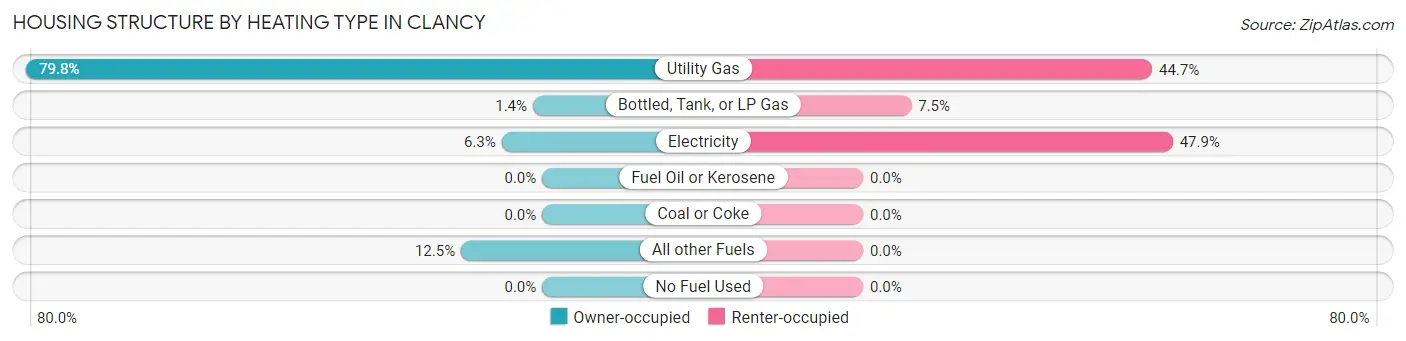
| Heating Type | Owner-occupied | Renter-occupied |
| Utility Gas | 445 (79.7%) | 42 (44.7%) |
| Bottled, Tank, or LP Gas | 8 (1.4%) | 7 (7.4%) |
| Electricity | 35 (6.3%) | 45 (47.9%) |
| Fuel Oil or Kerosene | 0 (0.0%) | 0 (0.0%) |
| Coal or Coke | 0 (0.0%) | 0 (0.0%) |
| All other Fuels | 70 (12.5%) | 0 (0.0%) |
| No Fuel Used | 0 (0.0%) | 0 (0.0%) |
| Total | 558 (100.0%) | 94 (100.0%) |
Household Vehicle Usage in Clancy
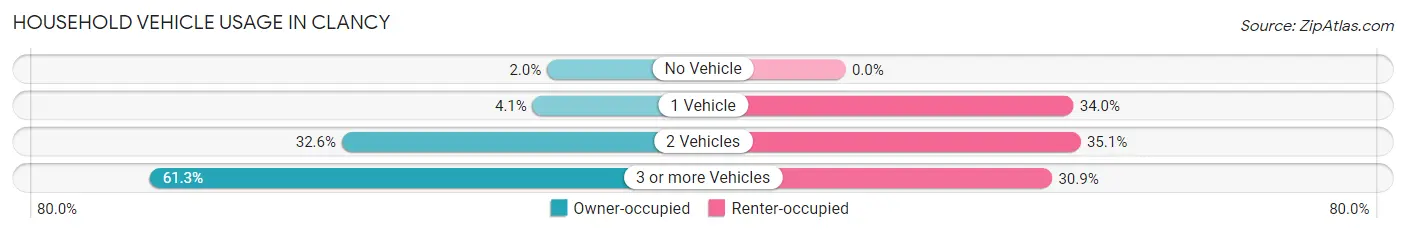
| Vehicles per Household | Owner-occupied | Renter-occupied |
| No Vehicle | 11 (2.0%) | 0 (0.0%) |
| 1 Vehicle | 23 (4.1%) | 32 (34.0%) |
| 2 Vehicles | 182 (32.6%) | 33 (35.1%) |
| 3 or more Vehicles | 342 (61.3%) | 29 (30.8%) |
| Total | 558 (100.0%) | 94 (100.0%) |
Real Estate & Mortgages in Clancy
Real Estate and Mortgage Overview in Clancy
| Characteristic | Without Mortgage | With Mortgage |
| Housing Units | 211 | 347 |
| Median Property Value | $387,300 | $371,100 |
| Median Household Income | $62,292 | $76 |
| Monthly Housing Costs | $555 | $36 |
| Real Estate Taxes | $2,505 | $10 |
Property Value by Mortgage Status in Clancy
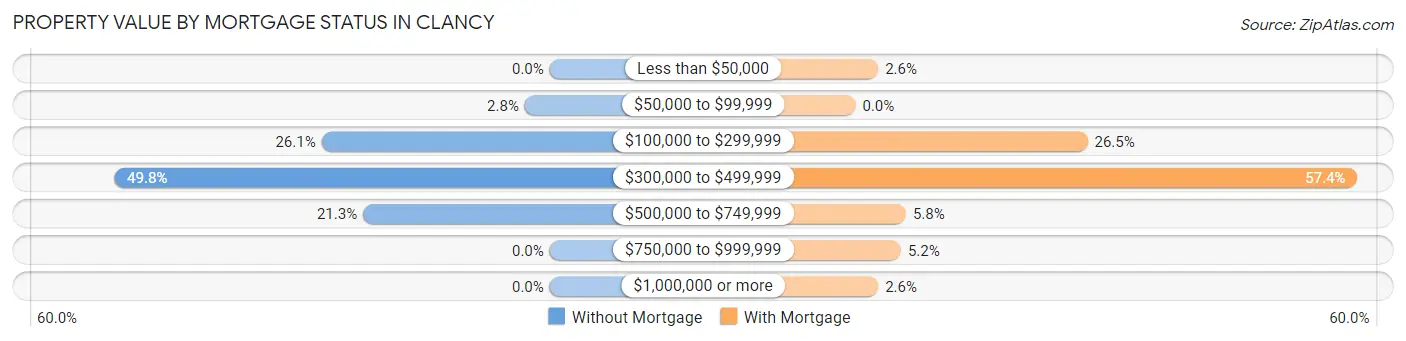
| Property Value | Without Mortgage | With Mortgage |
| Less than $50,000 | 0 (0.0%) | 9 (2.6%) |
| $50,000 to $99,999 | 6 (2.8%) | 0 (0.0%) |
| $100,000 to $299,999 | 55 (26.1%) | 92 (26.5%) |
| $300,000 to $499,999 | 105 (49.8%) | 199 (57.4%) |
| $500,000 to $749,999 | 45 (21.3%) | 20 (5.8%) |
| $750,000 to $999,999 | 0 (0.0%) | 18 (5.2%) |
| $1,000,000 or more | 0 (0.0%) | 9 (2.6%) |
| Total | 211 (100.0%) | 347 (100.0%) |
Household Income by Mortgage Status in Clancy
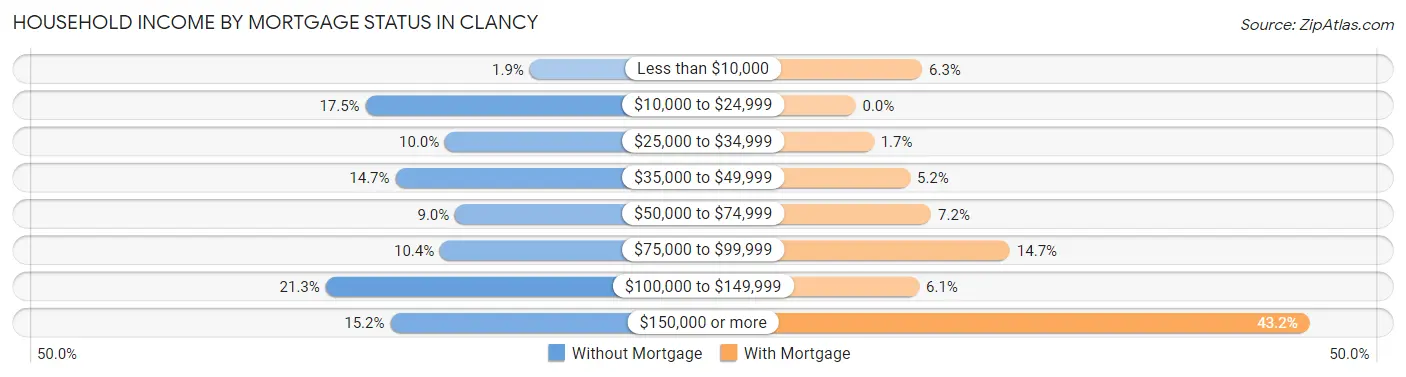
| Household Income | Without Mortgage | With Mortgage |
| Less than $10,000 | 4 (1.9%) | 22 (6.3%) |
| $10,000 to $24,999 | 37 (17.5%) | 0 (0.0%) |
| $25,000 to $34,999 | 21 (10.0%) | 6 (1.7%) |
| $35,000 to $49,999 | 31 (14.7%) | 18 (5.2%) |
| $50,000 to $74,999 | 19 (9.0%) | 25 (7.2%) |
| $75,000 to $99,999 | 22 (10.4%) | 51 (14.7%) |
| $100,000 to $149,999 | 45 (21.3%) | 21 (6.0%) |
| $150,000 or more | 32 (15.2%) | 150 (43.2%) |
| Total | 211 (100.0%) | 347 (100.0%) |
Property Value to Household Income Ratio in Clancy
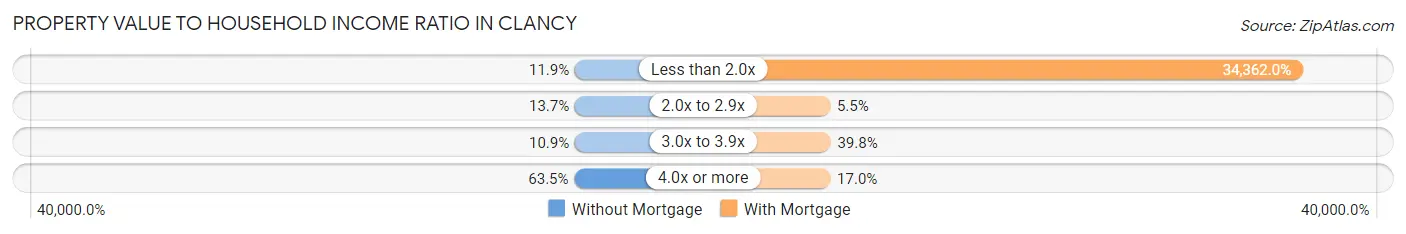
| Value-to-Income Ratio | Without Mortgage | With Mortgage |
| Less than 2.0x | 25 (11.8%) | 119,236 (34,362.0%) |
| 2.0x to 2.9x | 29 (13.7%) | 19 (5.5%) |
| 3.0x to 3.9x | 23 (10.9%) | 138 (39.8%) |
| 4.0x or more | 134 (63.5%) | 59 (17.0%) |
| Total | 211 (100.0%) | 347 (100.0%) |
Real Estate Taxes by Mortgage Status in Clancy
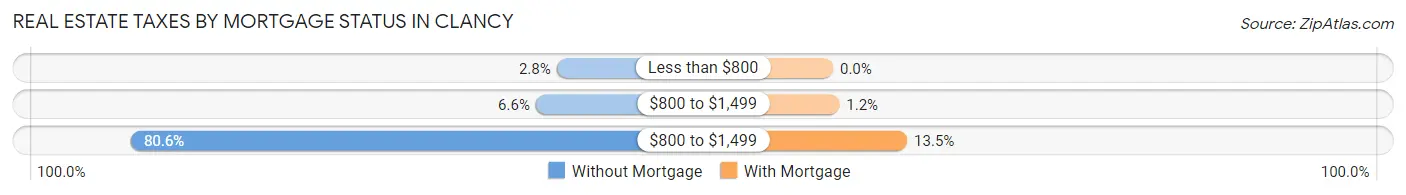
| Property Taxes | Without Mortgage | With Mortgage |
| Less than $800 | 6 (2.8%) | 0 (0.0%) |
| $800 to $1,499 | 14 (6.6%) | 4 (1.1%) |
| $800 to $1,499 | 170 (80.6%) | 47 (13.5%) |
| Total | 211 (100.0%) | 347 (100.0%) |
Health & Disability in Clancy
Health Insurance Coverage by Age in Clancy
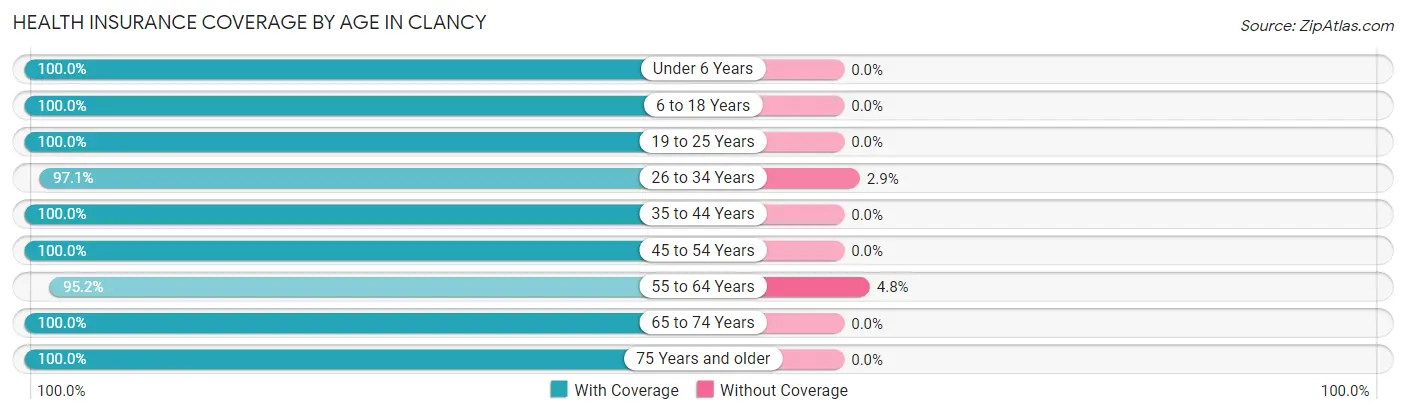
| Age Bracket | With Coverage | Without Coverage |
| Under 6 Years | 188 (100.0%) | 0 (0.0%) |
| 6 to 18 Years | 336 (100.0%) | 0 (0.0%) |
| 19 to 25 Years | 166 (100.0%) | 0 (0.0%) |
| 26 to 34 Years | 167 (97.1%) | 5 (2.9%) |
| 35 to 44 Years | 212 (100.0%) | 0 (0.0%) |
| 45 to 54 Years | 131 (100.0%) | 0 (0.0%) |
| 55 to 64 Years | 180 (95.2%) | 9 (4.8%) |
| 65 to 74 Years | 370 (100.0%) | 0 (0.0%) |
| 75 Years and older | 143 (100.0%) | 0 (0.0%) |
| Total | 1,893 (99.3%) | 14 (0.7%) |
Health Insurance Coverage by Citizenship Status in Clancy
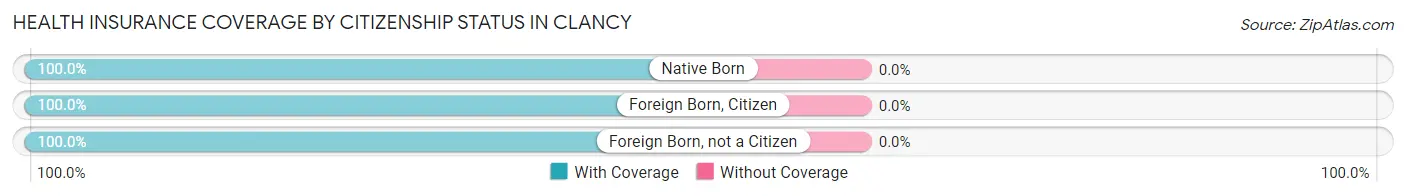
| Citizenship Status | With Coverage | Without Coverage |
| Native Born | 188 (100.0%) | 0 (0.0%) |
| Foreign Born, Citizen | 336 (100.0%) | 0 (0.0%) |
| Foreign Born, not a Citizen | 166 (100.0%) | 0 (0.0%) |
Health Insurance Coverage by Household Income in Clancy
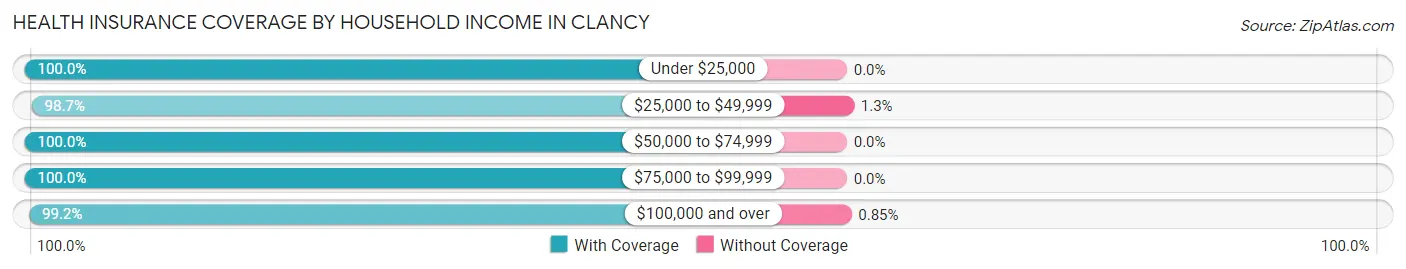
| Household Income | With Coverage | Without Coverage |
| Under $25,000 | 62 (100.0%) | 0 (0.0%) |
| $25,000 to $49,999 | 299 (98.7%) | 4 (1.3%) |
| $50,000 to $74,999 | 193 (100.0%) | 0 (0.0%) |
| $75,000 to $99,999 | 168 (100.0%) | 0 (0.0%) |
| $100,000 and over | 1,171 (99.2%) | 10 (0.9%) |
Public vs Private Health Insurance Coverage by Age in Clancy
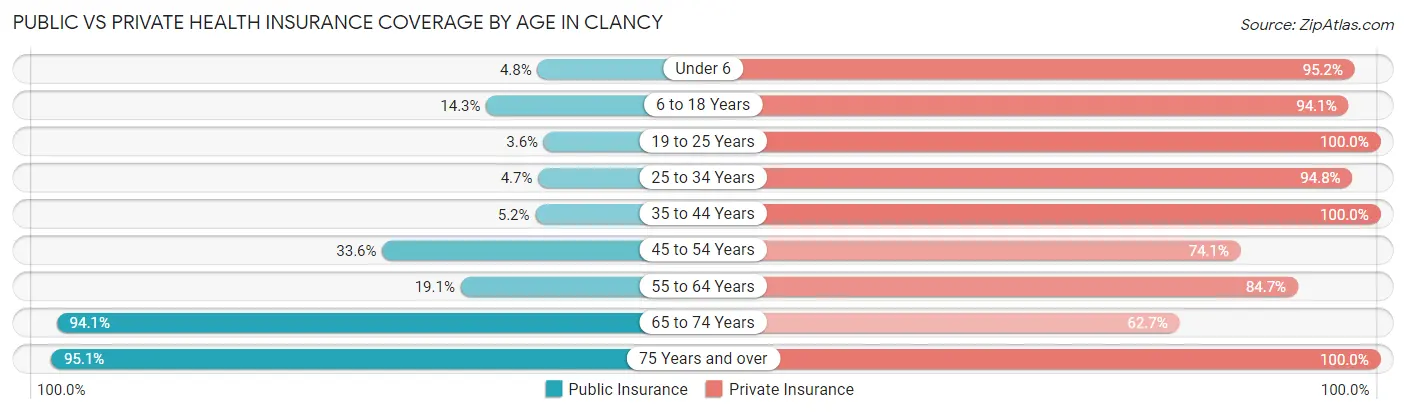
| Age Bracket | Public Insurance | Private Insurance |
| Under 6 | 9 (4.8%) | 179 (95.2%) |
| 6 to 18 Years | 48 (14.3%) | 316 (94.1%) |
| 19 to 25 Years | 6 (3.6%) | 166 (100.0%) |
| 25 to 34 Years | 8 (4.6%) | 163 (94.8%) |
| 35 to 44 Years | 11 (5.2%) | 212 (100.0%) |
| 45 to 54 Years | 44 (33.6%) | 97 (74.1%) |
| 55 to 64 Years | 36 (19.1%) | 160 (84.7%) |
| 65 to 74 Years | 348 (94.1%) | 232 (62.7%) |
| 75 Years and over | 136 (95.1%) | 143 (100.0%) |
| Total | 646 (33.9%) | 1,668 (87.5%) |
Disability Status by Sex by Age in Clancy
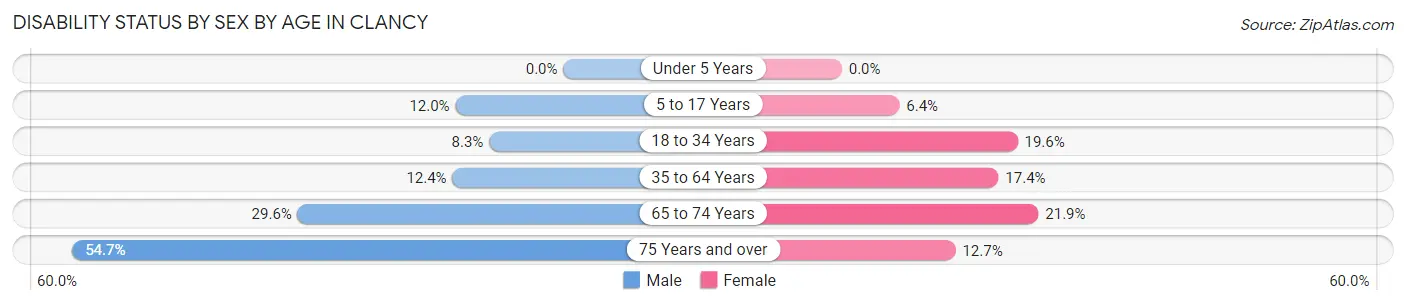
| Age Bracket | Male | Female |
| Under 5 Years | 0 (0.0%) | 0 (0.0%) |
| 5 to 17 Years | 25 (12.0%) | 10 (6.4%) |
| 18 to 34 Years | 10 (8.3%) | 46 (19.6%) |
| 35 to 64 Years | 31 (12.3%) | 49 (17.4%) |
| 65 to 74 Years | 50 (29.6%) | 44 (21.9%) |
| 75 Years and over | 35 (54.7%) | 10 (12.7%) |
Disability Class by Sex by Age in Clancy
Disability Class: Hearing Difficulty
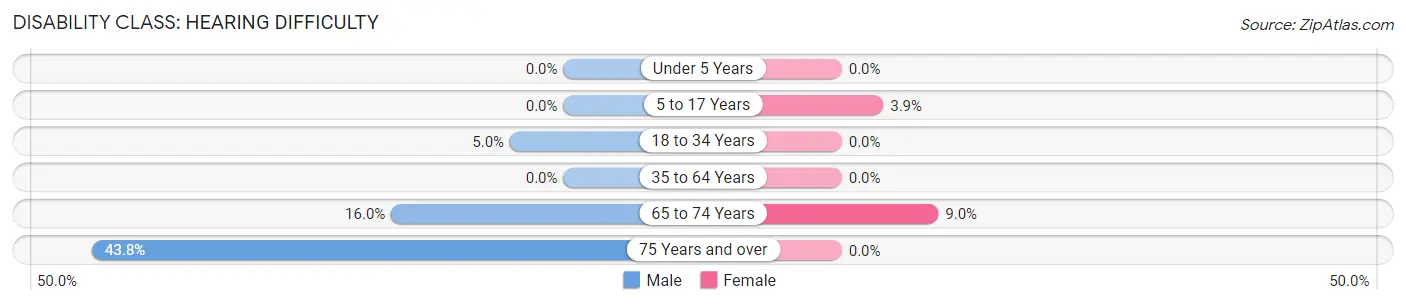
| Age Bracket | Male | Female |
| Under 5 Years | 0 (0.0%) | 0 (0.0%) |
| 5 to 17 Years | 0 (0.0%) | 6 (3.8%) |
| 18 to 34 Years | 6 (5.0%) | 0 (0.0%) |
| 35 to 64 Years | 0 (0.0%) | 0 (0.0%) |
| 65 to 74 Years | 27 (16.0%) | 18 (9.0%) |
| 75 Years and over | 28 (43.8%) | 0 (0.0%) |
Disability Class: Vision Difficulty
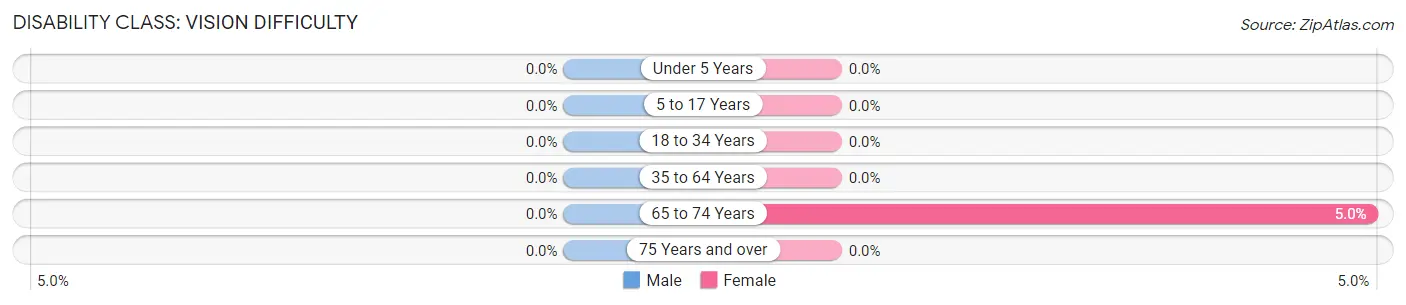
| Age Bracket | Male | Female |
| Under 5 Years | 0 (0.0%) | 0 (0.0%) |
| 5 to 17 Years | 0 (0.0%) | 0 (0.0%) |
| 18 to 34 Years | 0 (0.0%) | 0 (0.0%) |
| 35 to 64 Years | 0 (0.0%) | 0 (0.0%) |
| 65 to 74 Years | 0 (0.0%) | 10 (5.0%) |
| 75 Years and over | 0 (0.0%) | 0 (0.0%) |
Disability Class: Cognitive Difficulty
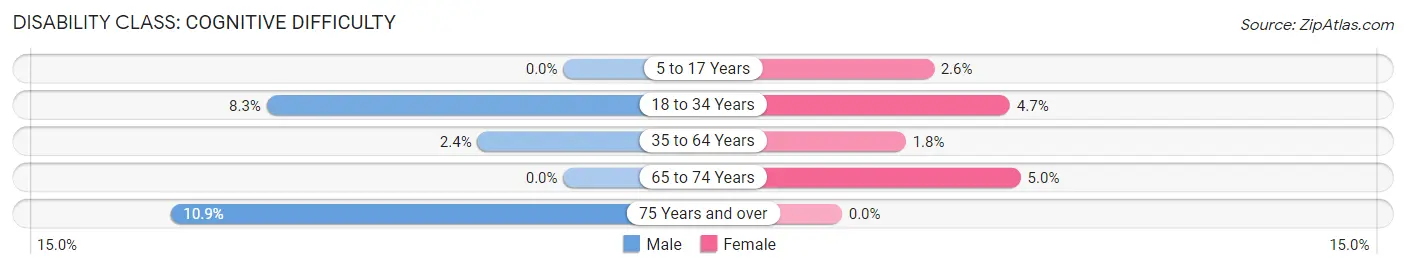
| Age Bracket | Male | Female |
| 5 to 17 Years | 0 (0.0%) | 4 (2.6%) |
| 18 to 34 Years | 10 (8.3%) | 11 (4.7%) |
| 35 to 64 Years | 6 (2.4%) | 5 (1.8%) |
| 65 to 74 Years | 0 (0.0%) | 10 (5.0%) |
| 75 Years and over | 7 (10.9%) | 0 (0.0%) |
Disability Class: Ambulatory Difficulty
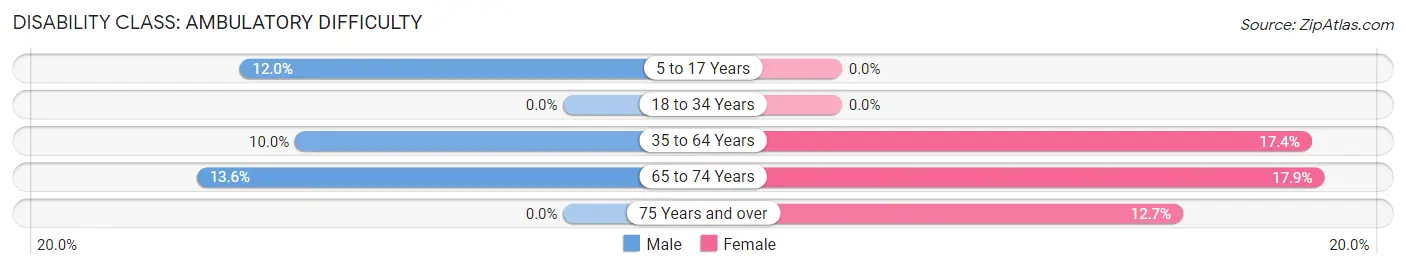
| Age Bracket | Male | Female |
| 5 to 17 Years | 25 (12.0%) | 0 (0.0%) |
| 18 to 34 Years | 0 (0.0%) | 0 (0.0%) |
| 35 to 64 Years | 25 (10.0%) | 49 (17.4%) |
| 65 to 74 Years | 23 (13.6%) | 36 (17.9%) |
| 75 Years and over | 0 (0.0%) | 10 (12.7%) |
Disability Class: Self-Care Difficulty
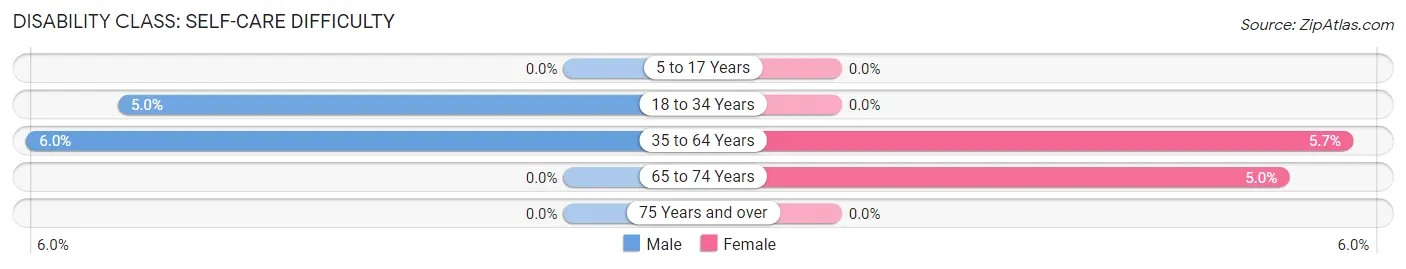
| Age Bracket | Male | Female |
| 5 to 17 Years | 0 (0.0%) | 0 (0.0%) |
| 18 to 34 Years | 6 (5.0%) | 0 (0.0%) |
| 35 to 64 Years | 15 (6.0%) | 16 (5.7%) |
| 65 to 74 Years | 0 (0.0%) | 10 (5.0%) |
| 75 Years and over | 0 (0.0%) | 0 (0.0%) |
Technology Access in Clancy
Computing Device Access in Clancy
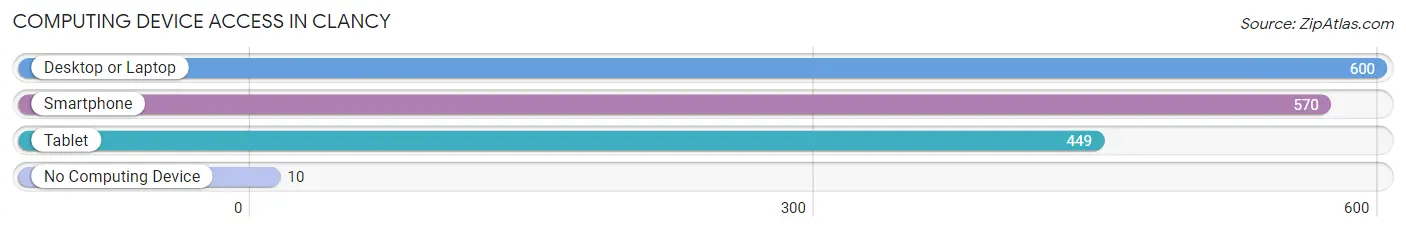
| Device Type | # Households | % Households |
| Desktop or Laptop | 600 | 92.0% |
| Smartphone | 570 | 87.4% |
| Tablet | 449 | 68.9% |
| No Computing Device | 10 | 1.5% |
| Total | 652 | 100.0% |
Internet Access in Clancy
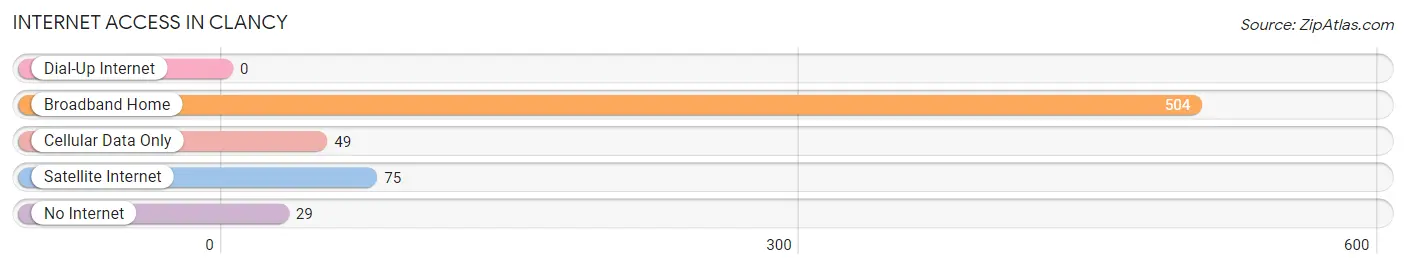
| Internet Type | # Households | % Households |
| Dial-Up Internet | 0 | 0.0% |
| Broadband Home | 504 | 77.3% |
| Cellular Data Only | 49 | 7.5% |
| Satellite Internet | 75 | 11.5% |
| No Internet | 29 | 4.4% |
| Total | 652 | 100.0% |
Clancy Summary
Clancy is a small town located in the state of Montana, in the United States. It is situated in the southwestern part of the state, in Jefferson County, and is part of the Helena Micropolitan Statistical Area. The town has a population of approximately 1,000 people, and is located about 20 miles east of the state capital, Helena.
History
Clancy was founded in 1883 by a group of settlers from the Midwest. The town was named after the Clancy family, who were among the first settlers. The town was originally a farming community, and the main crops grown were wheat, barley, and oats. In the early 1900s, the town began to grow and develop, and by the 1920s, it had become a thriving community.
In the 1950s, the town began to experience a decline in population, as many of the younger residents moved away to pursue better opportunities in larger cities. However, in the late 1970s, the town began to experience a resurgence, as many people moved back to the area to take advantage of the area’s natural beauty and recreational opportunities.
Geography
Clancy is located in the southwestern part of Montana, in Jefferson County. The town is situated in the foothills of the Rocky Mountains, and is surrounded by rolling hills and grasslands. The town is located about 20 miles east of the state capital, Helena. The town is located at an elevation of 4,000 feet, and has a total area of 1.2 square miles.
The climate in Clancy is generally mild, with warm summers and cold winters. The average annual temperature is around 50 degrees Fahrenheit, and the average annual precipitation is around 16 inches.
Economy
The economy of Clancy is largely based on agriculture and tourism. The town is home to several farms, which produce a variety of crops, including wheat, barley, oats, and hay. The town is also home to several small businesses, including restaurants, shops, and other services.
Tourism is also an important part of the local economy. The town is home to several recreational areas, including the Clancy State Park, which offers camping, fishing, and hiking opportunities. The town is also home to several historic sites, including the Clancy Museum, which houses artifacts from the town’s history.
Demographics
As of the 2010 census, the population of Clancy was 1,000 people. The racial makeup of the town was 97.2% White, 0.7% Native American, 0.3% Asian, 0.2% from other races, and 1.6% from two or more races. The median household income was $41,250, and the median family income was $50,000. The per capita income was $20,000.
Clancy is a small town with a rich history and a vibrant economy. The town is home to a diverse population, and offers a variety of recreational and cultural opportunities. The town is a great place to live, work, and raise a family.
Common Questions
What is Per Capita Income in Clancy?
Per Capita income in Clancy is $36,303.
What is the Median Family Income in Clancy?
Median Family Income in Clancy is $112,000.
What is the Median Household income in Clancy?
Median Household Income in Clancy is $95,357.
What is Income or Wage Gap in Clancy?
Income or Wage Gap in Clancy is 54.5%.
Women in Clancy earn 45.5 cents for every dollar earned by a man.
What is Inequality or Gini Index in Clancy?
Inequality or Gini Index in Clancy is 0.39.
What is the Total Population of Clancy?
Total Population of Clancy is 1,970.
What is the Total Male Population of Clancy?
Total Male Population of Clancy is 900.
What is the Total Female Population of Clancy?
Total Female Population of Clancy is 1,070.
What is the Ratio of Males per 100 Females in Clancy?
There are 84.11 Males per 100 Females in Clancy.
What is the Ratio of Females per 100 Males in Clancy?
There are 118.89 Females per 100 Males in Clancy.
What is the Median Population Age in Clancy?
Median Population Age in Clancy is 42.2 Years.
What is the Average Family Size in Clancy
Average Family Size in Clancy is 3.4 People.
What is the Average Household Size in Clancy
Average Household Size in Clancy is 2.9 People.
How Large is the Labor Force in Clancy?
There are 858 People in the Labor Forcein in Clancy.
What is the Percentage of People in the Labor Force in Clancy?
55.8% of People are in the Labor Force in Clancy.
What is the Unemployment Rate in Clancy?
Unemployment Rate in Clancy is 1.4%.