Belgrade, MT Map & Demographics
Belgrade Map
Belgrade Overview
$42,094
PER CAPITA INCOME
$101,736
AVG FAMILY INCOME
$82,769
AVG HOUSEHOLD INCOME
27.0%
WAGE / INCOME GAP [ % ]
73.0¢/ $1
WAGE / INCOME GAP [ $ ]
0.45
INEQUALITY / GINI INDEX
10,941
TOTAL POPULATION
5,388
MALE POPULATION
5,553
FEMALE POPULATION
97.03
MALES / 100 FEMALES
103.06
FEMALES / 100 MALES
33.4
MEDIAN AGE
3.3
AVG FAMILY SIZE
2.5
AVG HOUSEHOLD SIZE
6,594
LABOR FORCE [ PEOPLE ]
77.6%
PERCENT IN LABOR FORCE
1.2%
UNEMPLOYMENT RATE
Belgrade Zip Codes
Belgrade Area Codes
Income in Belgrade
Income Overview in Belgrade
Per Capita Income in Belgrade is $42,094, while median incomes of families and households are $101,736 and $82,769 respectively.
| Characteristic | Number | Measure |
| Per Capita Income | 10,941 | $42,094 |
| Median Family Income | 2,537 | $101,736 |
| Mean Family Income | 2,537 | $131,661 |
| Median Household Income | 4,402 | $82,769 |
| Mean Household Income | 4,402 | $103,860 |
| Income Deficit | 2,537 | $0 |
| Wage / Income Gap (%) | 10,941 | 26.95% |
| Wage / Income Gap ($) | 10,941 | 73.05¢ per $1 |
| Gini / Inequality Index | 10,941 | 0.45 |
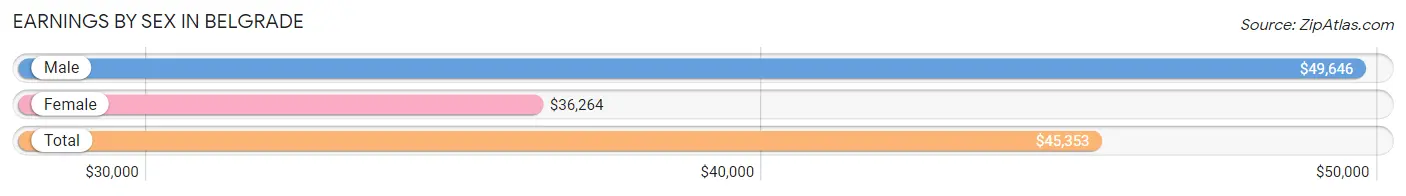
Earnings by Sex in Belgrade
Average Earnings in Belgrade are $45,353, $49,646 for men and $36,264 for women, a difference of 27.0%.
| Sex | Number | Average Earnings |
| Male | 3,853 (55.5%) | $49,646 |
| Female | 3,085 (44.5%) | $36,264 |
| Total | 6,938 (100.0%) | $45,353 |
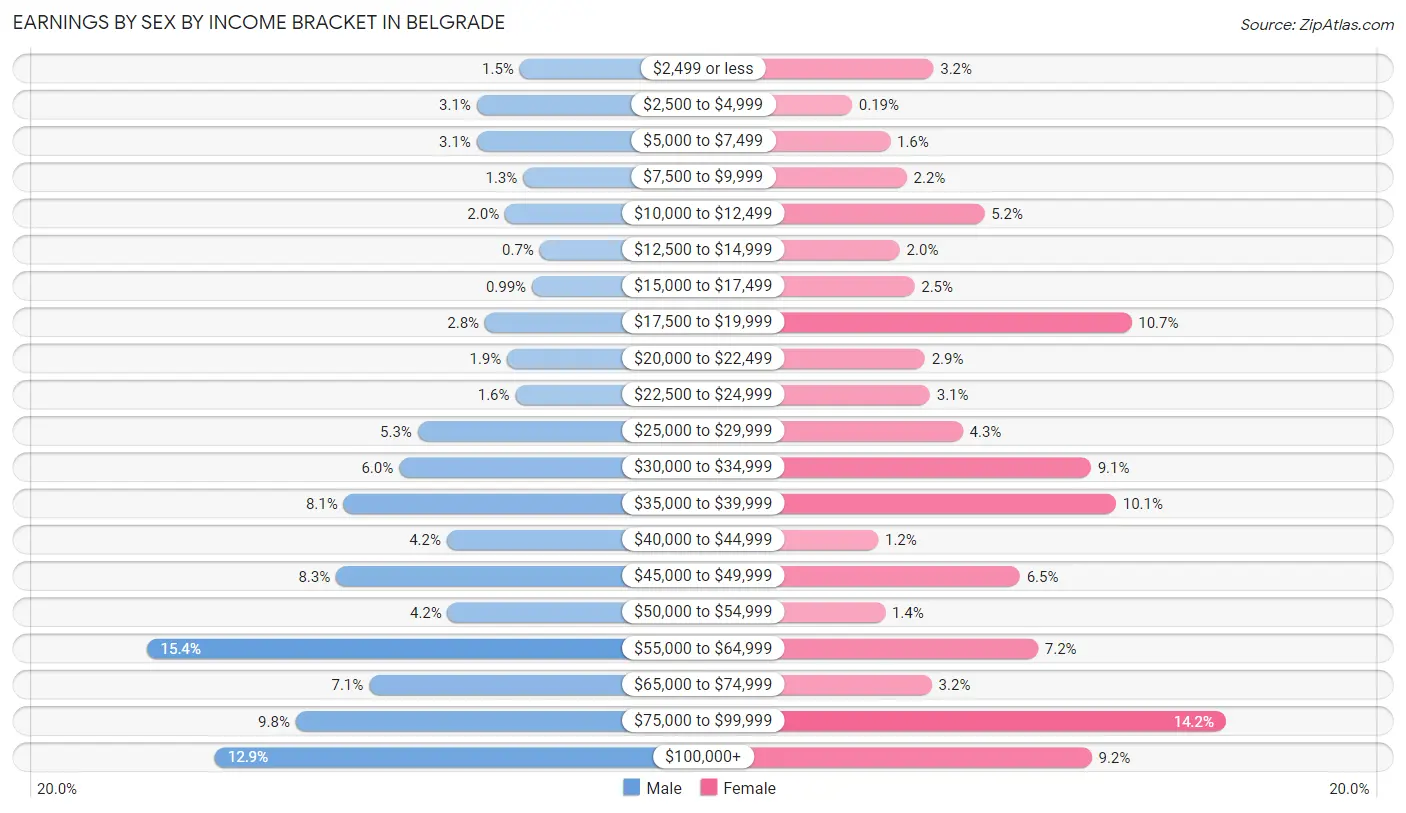
Earnings by Sex by Income Bracket in Belgrade
The most common earnings brackets in Belgrade are $55,000 to $64,999 for men (593 | 15.4%) and $75,000 to $99,999 for women (438 | 14.2%).
| Income | Male | Female |
| $2,499 or less | 56 (1.5%) | 100 (3.2%) |
| $2,500 to $4,999 | 118 (3.1%) | 6 (0.2%) |
| $5,000 to $7,499 | 118 (3.1%) | 50 (1.6%) |
| $7,500 to $9,999 | 51 (1.3%) | 69 (2.2%) |
| $10,000 to $12,499 | 77 (2.0%) | 159 (5.1%) |
| $12,500 to $14,999 | 27 (0.7%) | 61 (2.0%) |
| $15,000 to $17,499 | 38 (1.0%) | 78 (2.5%) |
| $17,500 to $19,999 | 106 (2.8%) | 329 (10.7%) |
| $20,000 to $22,499 | 74 (1.9%) | 90 (2.9%) |
| $22,500 to $24,999 | 62 (1.6%) | 96 (3.1%) |
| $25,000 to $29,999 | 203 (5.3%) | 134 (4.3%) |
| $30,000 to $34,999 | 230 (6.0%) | 282 (9.1%) |
| $35,000 to $39,999 | 310 (8.1%) | 311 (10.1%) |
| $40,000 to $44,999 | 161 (4.2%) | 36 (1.2%) |
| $45,000 to $49,999 | 321 (8.3%) | 200 (6.5%) |
| $50,000 to $54,999 | 160 (4.2%) | 44 (1.4%) |
| $55,000 to $64,999 | 593 (15.4%) | 221 (7.2%) |
| $65,000 to $74,999 | 273 (7.1%) | 98 (3.2%) |
| $75,000 to $99,999 | 379 (9.8%) | 438 (14.2%) |
| $100,000+ | 496 (12.9%) | 283 (9.2%) |
| Total | 3,853 (100.0%) | 3,085 (100.0%) |
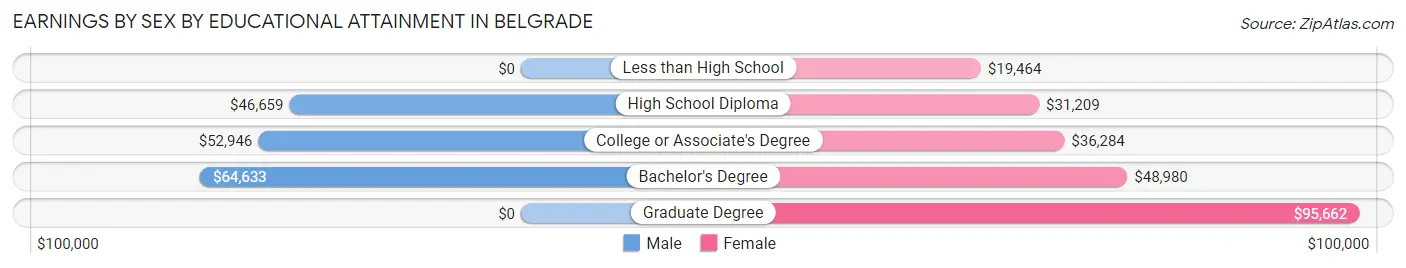
Earnings by Sex by Educational Attainment in Belgrade
Average earnings in Belgrade are $55,687 for men and $39,789 for women, a difference of 28.5%. Men with an educational attainment of bachelor's degree enjoy the highest average annual earnings of $64,633, while those with high school diploma education earn the least with $46,659. Women with an educational attainment of graduate degree earn the most with the average annual earnings of $95,662, while those with less than high school education have the smallest earnings of $19,464.
| Educational Attainment | Male Income | Female Income |
| Less than High School | - | - |
| High School Diploma | $46,659 | $31,209 |
| College or Associate's Degree | $52,946 | $36,284 |
| Bachelor's Degree | $64,633 | $48,980 |
| Graduate Degree | - | - |
| Total | $55,687 | $39,789 |
Family Income in Belgrade
Family Income Brackets in Belgrade
According to the Belgrade family income data, there are 830 families falling into the $100,000 to $149,999 income range, which is the most common income bracket and makes up 32.7% of all families.
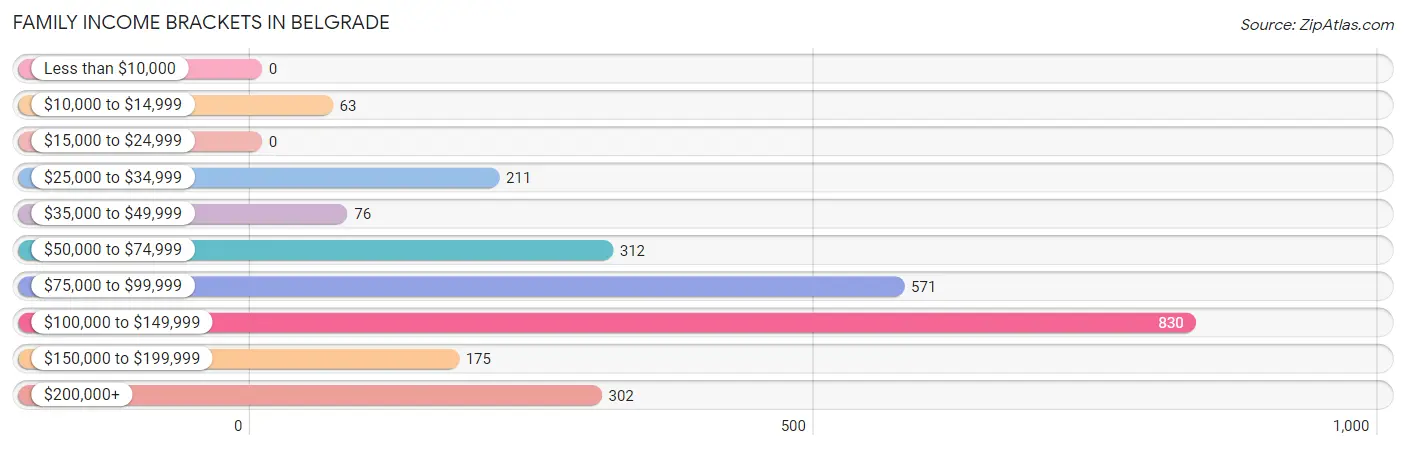
| Income Bracket | # Families | % Families |
| Less than $10,000 | 0 | 0.0% |
| $10,000 to $14,999 | 63 | 2.5% |
| $15,000 to $24,999 | 0 | 0.0% |
| $25,000 to $34,999 | 211 | 8.3% |
| $35,000 to $49,999 | 76 | 3.0% |
| $50,000 to $74,999 | 312 | 12.3% |
| $75,000 to $99,999 | 571 | 22.5% |
| $100,000 to $149,999 | 830 | 32.7% |
| $150,000 to $199,999 | 175 | 6.9% |
| $200,000+ | 302 | 11.9% |
Family Income by Famaliy Size in Belgrade
4-person families (422 | 16.6%) account for the highest median family income in Belgrade with $113,750 per family, while 2-person families (1,278 | 50.4%) have the highest median income of $51,302 per family member.
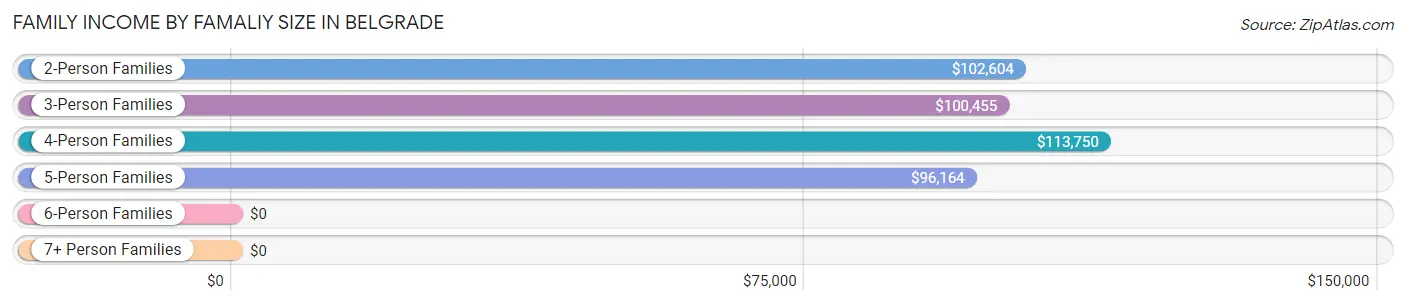
| Income Bracket | # Families | Median Income |
| 2-Person Families | 1,278 (50.4%) | $102,604 |
| 3-Person Families | 442 (17.4%) | $100,455 |
| 4-Person Families | 422 (16.6%) | $113,750 |
| 5-Person Families | 141 (5.6%) | $96,164 |
| 6-Person Families | 108 (4.3%) | $0 |
| 7+ Person Families | 146 (5.8%) | $0 |
| Total | 2,537 (100.0%) | $101,736 |
Family Income by Number of Earners in Belgrade
The median family income in Belgrade is $101,736, with families comprising 3+ earners (418) having the highest median family income of $120,167, while families with 1 earner (657) have the lowest median family income of $71,924, accounting for 16.5% and 25.9% of families, respectively.
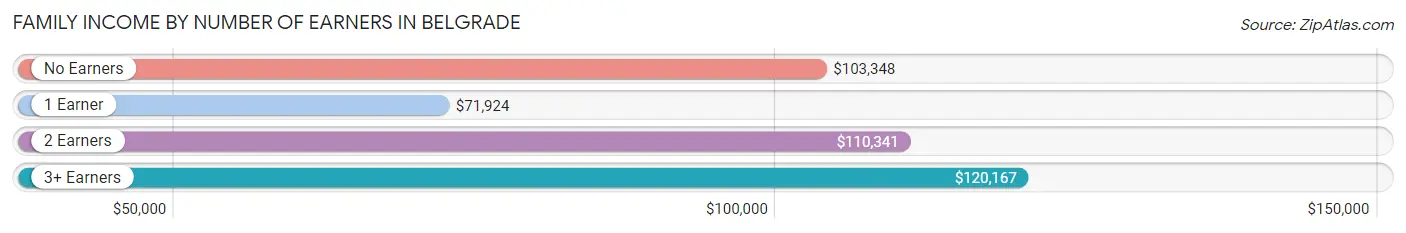
| Number of Earners | # Families | Median Income |
| No Earners | 105 (4.1%) | $103,348 |
| 1 Earner | 657 (25.9%) | $71,924 |
| 2 Earners | 1,357 (53.5%) | $110,341 |
| 3+ Earners | 418 (16.5%) | $120,167 |
| Total | 2,537 (100.0%) | $101,736 |
Household Income in Belgrade
Household Income Brackets in Belgrade
With 1,056 households falling in the category, the $100,000 to $149,999 income range is the most frequent in Belgrade, accounting for 24.0% of all households. In contrast, only 136 households (3.1%) fall into the $15,000 to $24,999 income bracket, making it the least populous group.
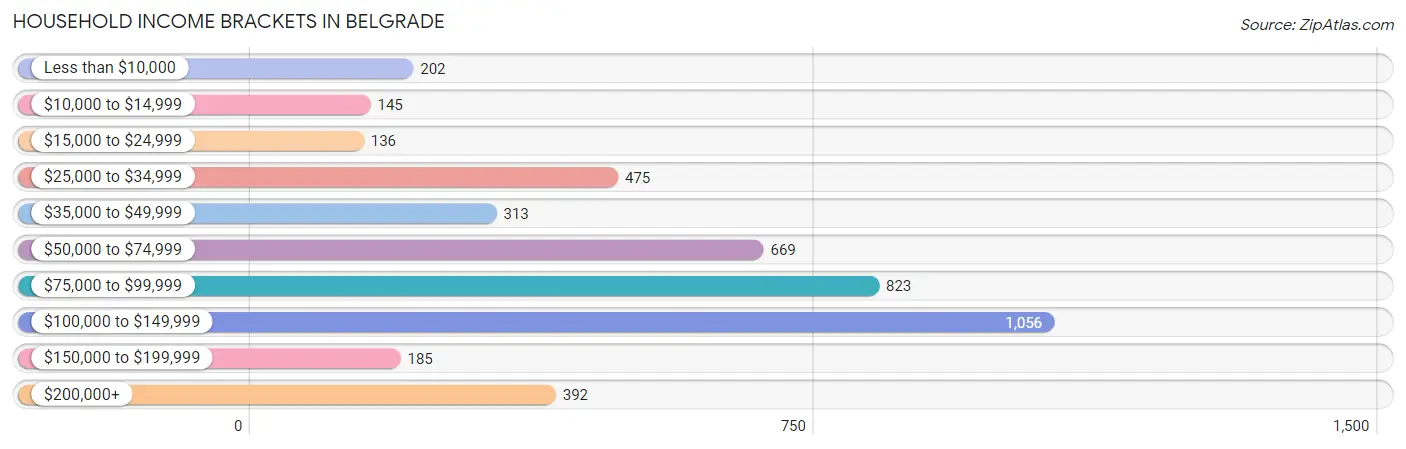
| Income Bracket | # Households | % Households |
| Less than $10,000 | 202 | 4.6% |
| $10,000 to $14,999 | 145 | 3.3% |
| $15,000 to $24,999 | 136 | 3.1% |
| $25,000 to $34,999 | 475 | 10.8% |
| $35,000 to $49,999 | 313 | 7.1% |
| $50,000 to $74,999 | 669 | 15.2% |
| $75,000 to $99,999 | 823 | 18.7% |
| $100,000 to $149,999 | 1,056 | 24.0% |
| $150,000 to $199,999 | 185 | 4.2% |
| $200,000+ | 392 | 8.9% |
Household Income by Householder Age in Belgrade
The median household income in Belgrade is $82,769, with the highest median household income of $95,286 found in the 25 to 44 years age bracket for the primary householder. A total of 2,326 households (52.8%) fall into this category. Meanwhile, the 65+ years age bracket for the primary householder has the lowest median household income of $0, with 403 households (9.1%) in this group.
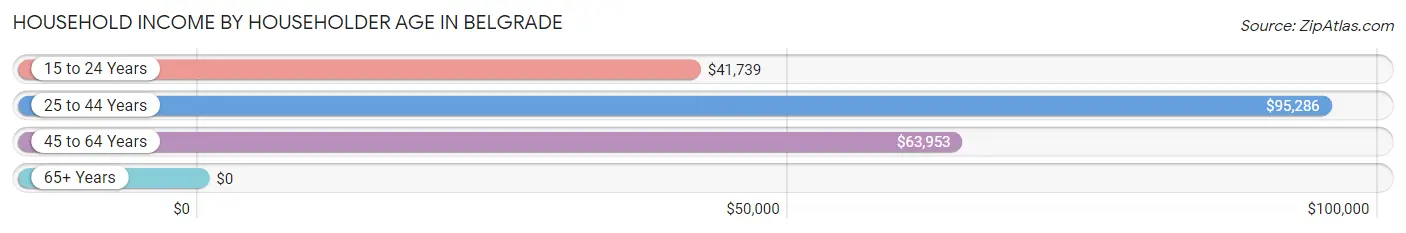
| Income Bracket | # Households | Median Income |
| 15 to 24 Years | 250 (5.7%) | $41,739 |
| 25 to 44 Years | 2,326 (52.8%) | $95,286 |
| 45 to 64 Years | 1,423 (32.3%) | $63,953 |
| 65+ Years | 403 (9.1%) | $0 |
| Total | 4,402 (100.0%) | $82,769 |
Poverty in Belgrade
Income Below Poverty by Sex and Age in Belgrade
With 12.1% poverty level for males and 13.2% for females among the residents of Belgrade, 12 to 14 year old males and 55 to 64 year old females are the most vulnerable to poverty, with 86 males (54.4%) and 175 females (25.0%) in their respective age groups living below the poverty level.
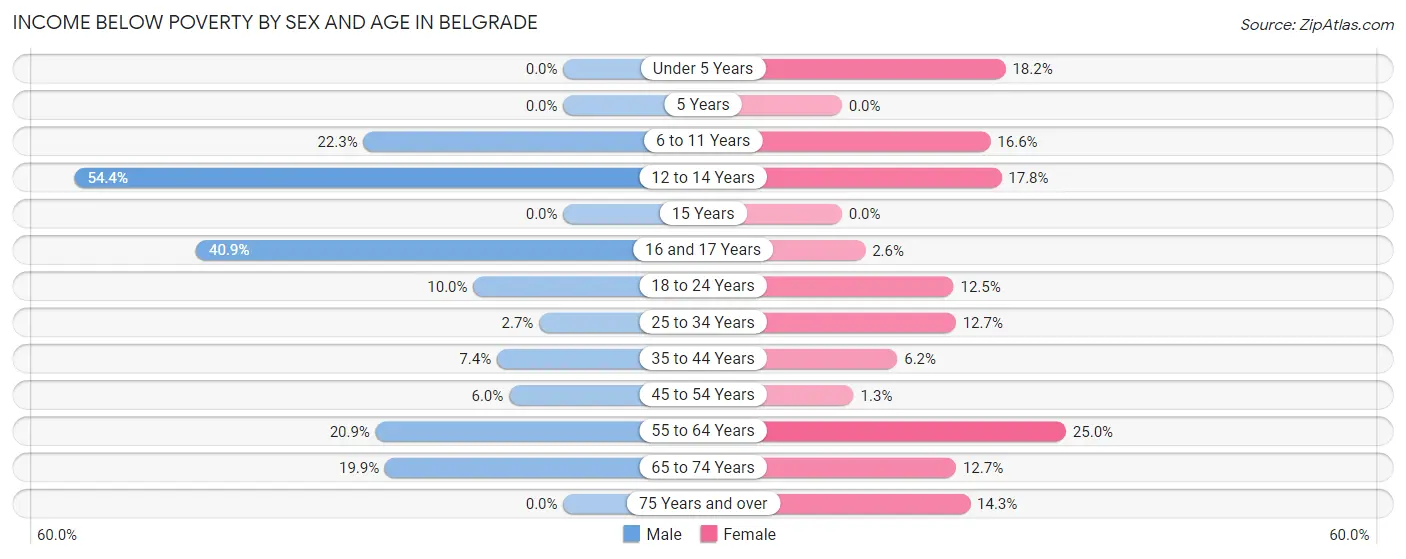
| Age Bracket | Male | Female |
| Under 5 Years | 0 (0.0%) | 103 (18.2%) |
| 5 Years | 0 (0.0%) | 0 (0.0%) |
| 6 to 11 Years | 59 (22.3%) | 69 (16.6%) |
| 12 to 14 Years | 86 (54.4%) | 83 (17.8%) |
| 15 Years | 0 (0.0%) | 0 (0.0%) |
| 16 and 17 Years | 146 (40.9%) | 3 (2.6%) |
| 18 to 24 Years | 41 (10.0%) | 62 (12.4%) |
| 25 to 34 Years | 27 (2.7%) | 114 (12.7%) |
| 35 to 44 Years | 84 (7.4%) | 75 (6.2%) |
| 45 to 54 Years | 39 (6.0%) | 4 (1.3%) |
| 55 to 64 Years | 116 (20.9%) | 175 (25.0%) |
| 65 to 74 Years | 55 (19.9%) | 29 (12.7%) |
| 75 Years and over | 0 (0.0%) | 13 (14.3%) |
| Total | 653 (12.1%) | 730 (13.2%) |
Income Above Poverty by Sex and Age in Belgrade
According to the poverty statistics in Belgrade, males aged under 5 years and females aged 5 years are the age groups that are most secure financially, with 100.0% of males and 100.0% of females in these age groups living above the poverty line.
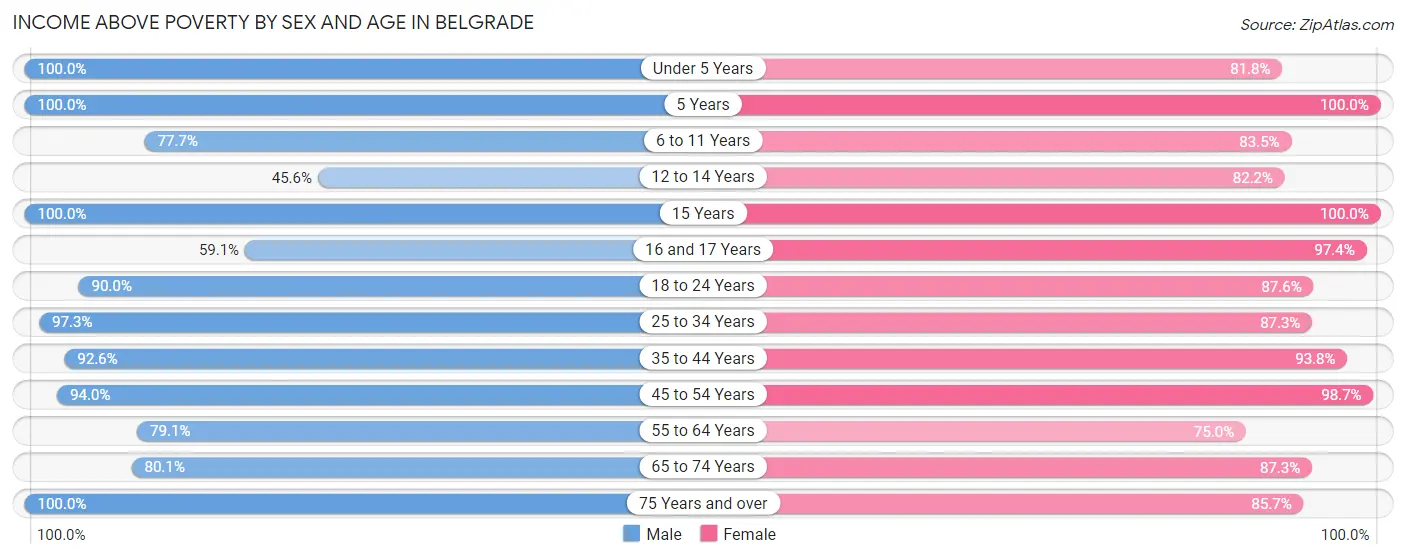
| Age Bracket | Male | Female |
| Under 5 Years | 362 (100.0%) | 462 (81.8%) |
| 5 Years | 121 (100.0%) | 35 (100.0%) |
| 6 to 11 Years | 206 (77.7%) | 348 (83.5%) |
| 12 to 14 Years | 72 (45.6%) | 384 (82.2%) |
| 15 Years | 32 (100.0%) | 21 (100.0%) |
| 16 and 17 Years | 211 (59.1%) | 112 (97.4%) |
| 18 to 24 Years | 368 (90.0%) | 436 (87.5%) |
| 25 to 34 Years | 976 (97.3%) | 784 (87.3%) |
| 35 to 44 Years | 1,052 (92.6%) | 1,138 (93.8%) |
| 45 to 54 Years | 607 (94.0%) | 300 (98.7%) |
| 55 to 64 Years | 439 (79.1%) | 526 (75.0%) |
| 65 to 74 Years | 222 (80.1%) | 199 (87.3%) |
| 75 Years and over | 67 (100.0%) | 78 (85.7%) |
| Total | 4,735 (87.9%) | 4,823 (86.9%) |
Income Below Poverty Among Married-Couple Families in Belgrade
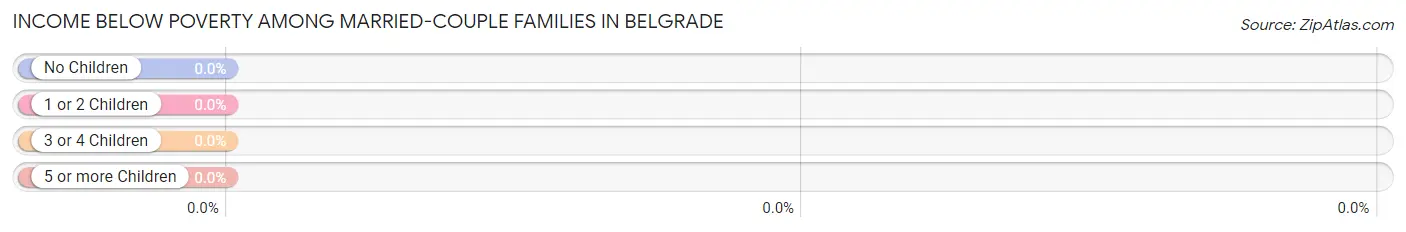
| Children | Above Poverty | Below Poverty |
| No Children | 996 (100.0%) | 0 (0.0%) |
| 1 or 2 Children | 752 (100.0%) | 0 (0.0%) |
| 3 or 4 Children | 149 (100.0%) | 0 (0.0%) |
| 5 or more Children | 39 (100.0%) | 0 (0.0%) |
| Total | 1,936 (100.0%) | 0 (0.0%) |
Income Below Poverty Among Single-Parent Households in Belgrade
According to the poverty data in Belgrade, 8.9% or 16 single-father households and 32.3% or 136 single-mother households are living below the poverty line. Among single-father households, those with 1 or 2 children have the highest poverty rate, with 16 households (13.6%) experiencing poverty. Likewise, among single-mother households, those with 5 or more children have the highest poverty rate, with 89 households (100.0%) falling below the poverty line.
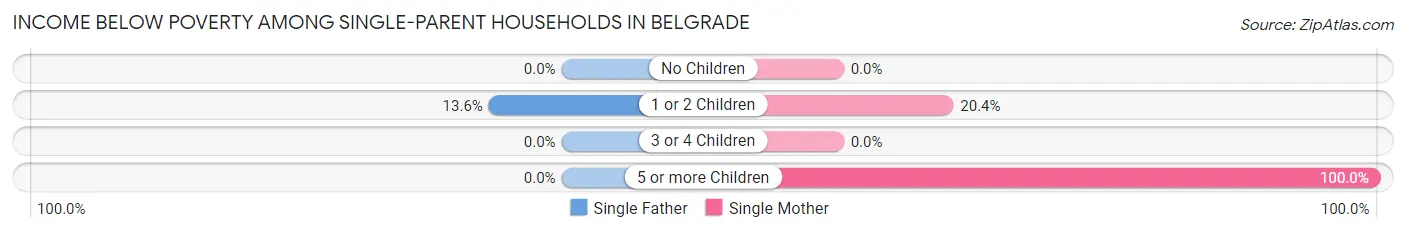
| Children | Single Father | Single Mother |
| No Children | 0 (0.0%) | 0 (0.0%) |
| 1 or 2 Children | 16 (13.6%) | 47 (20.4%) |
| 3 or 4 Children | 0 (0.0%) | 0 (0.0%) |
| 5 or more Children | 0 (0.0%) | 89 (100.0%) |
| Total | 16 (8.9%) | 136 (32.3%) |
Income Below Poverty Among Married-Couple vs Single-Parent Households in Belgrade
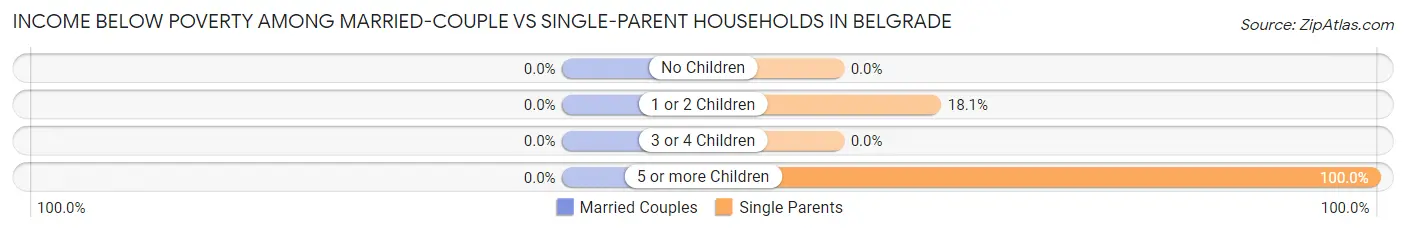
| Children | Married-Couple Families | Single-Parent Households |
| No Children | 0 (0.0%) | 0 (0.0%) |
| 1 or 2 Children | 0 (0.0%) | 63 (18.1%) |
| 3 or 4 Children | 0 (0.0%) | 0 (0.0%) |
| 5 or more Children | 0 (0.0%) | 89 (100.0%) |
| Total | 0 (0.0%) | 152 (25.3%) |
Race in Belgrade
The most populous races in Belgrade are White / Caucasian (10,051 | 91.9%), Two or more Races (394 | 3.6%), and Hispanic or Latino (272 | 2.5%).
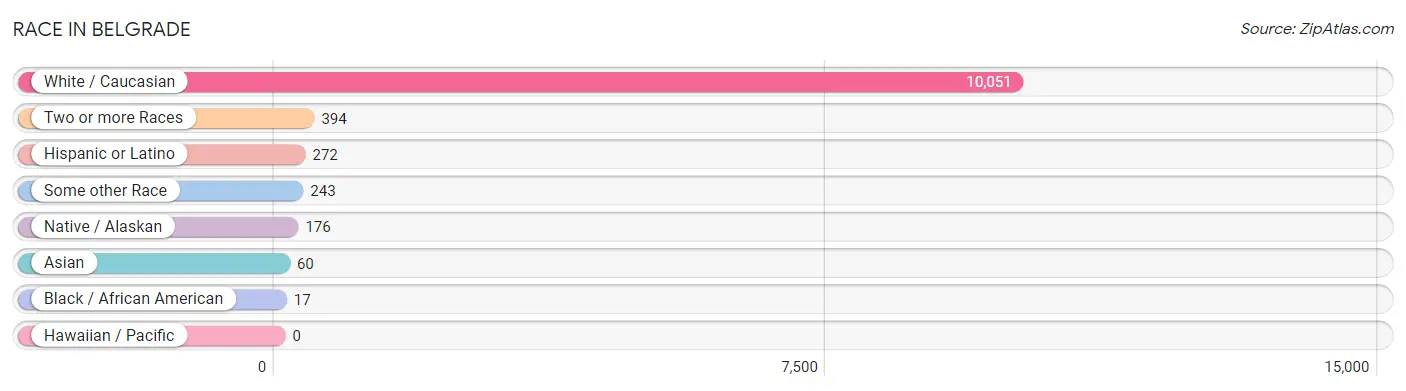
| Race | # Population | % Population |
| Asian | 60 | 0.5% |
| Black / African American | 17 | 0.2% |
| Hawaiian / Pacific | 0 | 0.0% |
| Hispanic or Latino | 272 | 2.5% |
| Native / Alaskan | 176 | 1.6% |
| White / Caucasian | 10,051 | 91.9% |
| Two or more Races | 394 | 3.6% |
| Some other Race | 243 | 2.2% |
| Total | 10,941 | 100.0% |
Ancestry in Belgrade
The most populous ancestries reported in Belgrade are German (2,850 | 26.1%), English (2,210 | 20.2%), Irish (1,702 | 15.6%), American (575 | 5.3%), and Dutch (476 | 4.3%), together accounting for 71.4% of all Belgrade residents.
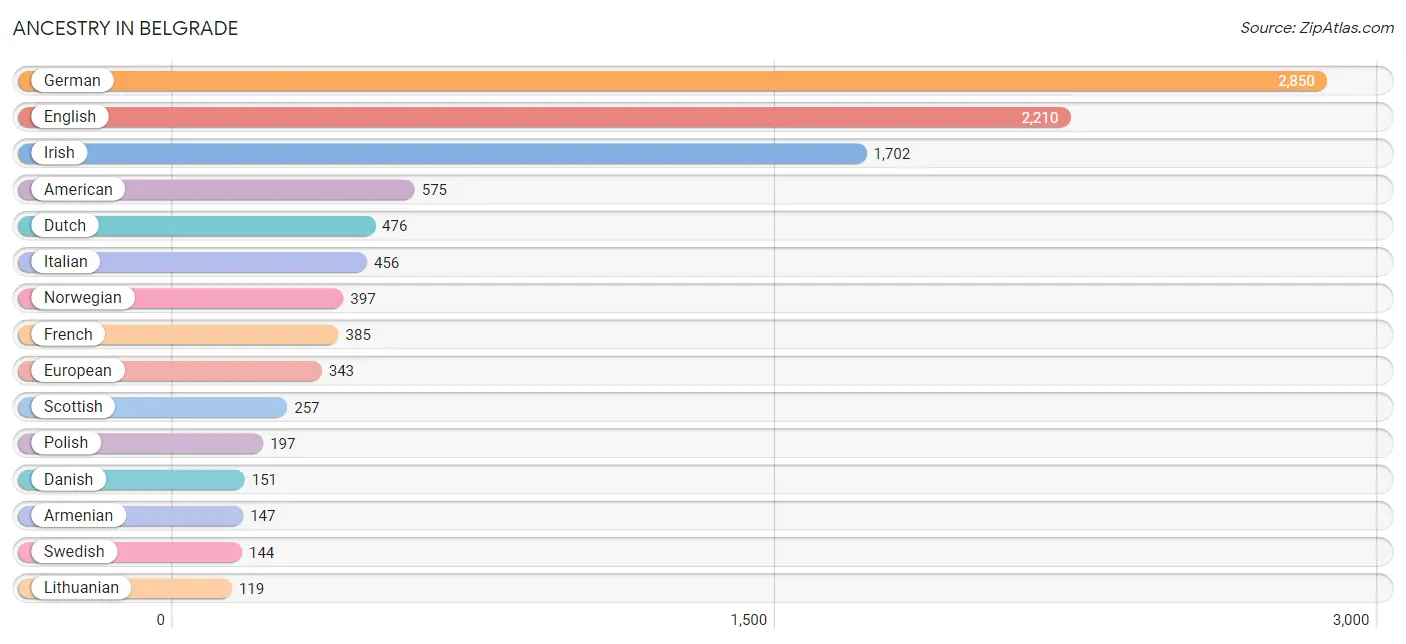
| Ancestry | # Population | % Population |
| American | 575 | 5.3% |
| Armenian | 147 | 1.3% |
| Australian | 22 | 0.2% |
| Austrian | 38 | 0.4% |
| Bhutanese | 70 | 0.6% |
| British | 38 | 0.4% |
| Burmese | 68 | 0.6% |
| Cambodian | 34 | 0.3% |
| Canadian | 2 | 0.0% |
| Central American Indian | 10 | 0.1% |
| Cherokee | 12 | 0.1% |
| Chippewa | 32 | 0.3% |
| Colombian | 17 | 0.2% |
| Crow | 20 | 0.2% |
| Cuban | 22 | 0.2% |
| Czech | 84 | 0.8% |
| Danish | 151 | 1.4% |
| Dutch | 476 | 4.3% |
| English | 2,210 | 20.2% |
| European | 343 | 3.1% |
| Finnish | 22 | 0.2% |
| French | 385 | 3.5% |
| French Canadian | 16 | 0.2% |
| German | 2,850 | 26.1% |
| Greek | 14 | 0.1% |
| Hungarian | 14 | 0.1% |
| Icelander | 9 | 0.1% |
| Indian (Asian) | 34 | 0.3% |
| Irish | 1,702 | 15.6% |
| Italian | 456 | 4.2% |
| Lithuanian | 119 | 1.1% |
| Mexican | 98 | 0.9% |
| Navajo | 34 | 0.3% |
| Northern European | 39 | 0.4% |
| Norwegian | 397 | 3.6% |
| Pennsylvania German | 2 | 0.0% |
| Polish | 197 | 1.8% |
| Potawatomi | 100 | 0.9% |
| Puerto Rican | 10 | 0.1% |
| Romanian | 102 | 0.9% |
| Russian | 52 | 0.5% |
| Scandinavian | 97 | 0.9% |
| Scotch-Irish | 75 | 0.7% |
| Scottish | 257 | 2.4% |
| Slovak | 20 | 0.2% |
| South American | 17 | 0.2% |
| Spaniard | 47 | 0.4% |
| Spanish | 13 | 0.1% |
| Sri Lankan | 65 | 0.6% |
| Swedish | 144 | 1.3% |
| Swiss | 15 | 0.1% |
| Ukrainian | 43 | 0.4% |
| Welsh | 86 | 0.8% | View All 53 Rows |
Immigrants in Belgrade
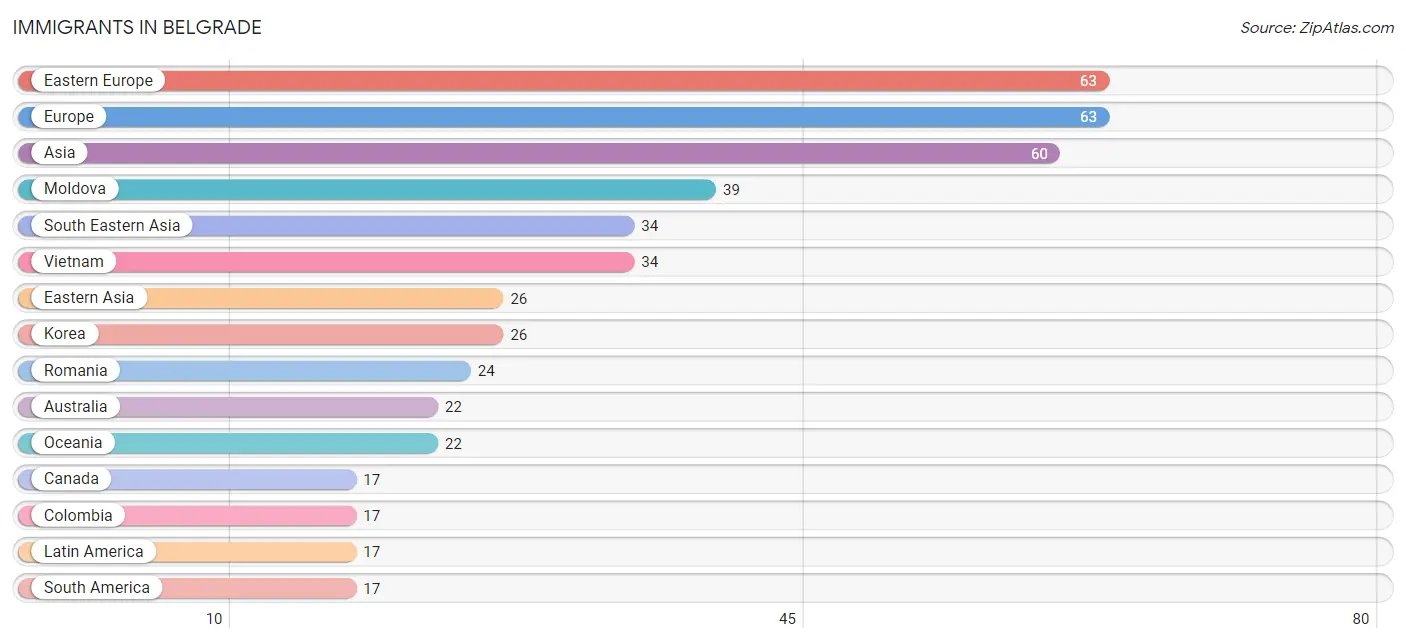
The most numerous immigrant groups reported in Belgrade came from Eastern Europe (63 | 0.6%), Europe (63 | 0.6%), Asia (60 | 0.5%), Moldova (39 | 0.4%), and South Eastern Asia (34 | 0.3%), together accounting for 2.4% of all Belgrade residents.
| Immigration Origin | # Population | % Population |
| Asia | 60 | 0.5% |
| Australia | 22 | 0.2% |
| Canada | 17 | 0.2% |
| Colombia | 17 | 0.2% |
| Eastern Asia | 26 | 0.2% |
| Eastern Europe | 63 | 0.6% |
| Europe | 63 | 0.6% |
| Korea | 26 | 0.2% |
| Latin America | 17 | 0.2% |
| Moldova | 39 | 0.4% |
| Oceania | 22 | 0.2% |
| Romania | 24 | 0.2% |
| South America | 17 | 0.2% |
| South Eastern Asia | 34 | 0.3% |
| Vietnam | 34 | 0.3% | View All 15 Rows |
Sex and Age in Belgrade
Sex and Age in Belgrade
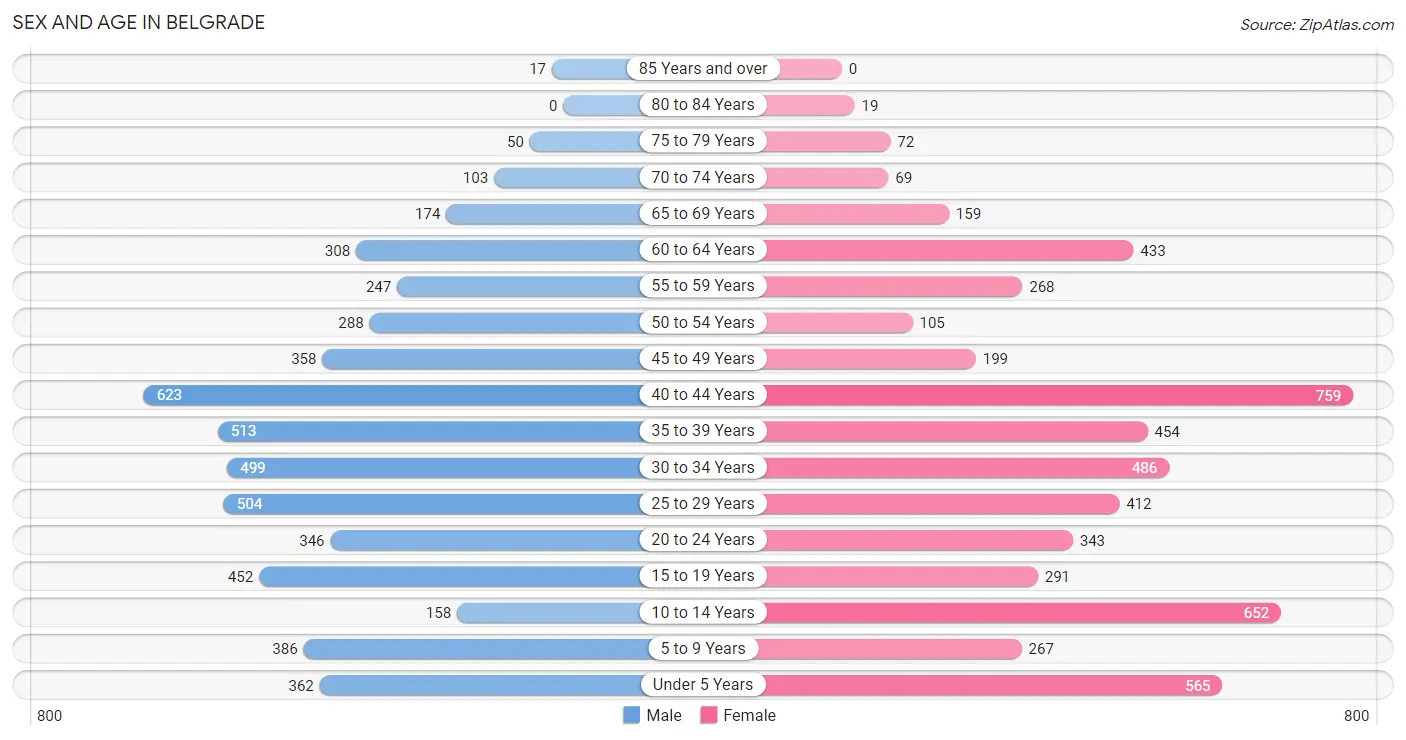
The most populous age groups in Belgrade are 40 to 44 Years (623 | 11.6%) for men and 40 to 44 Years (759 | 13.7%) for women.
| Age Bracket | Male | Female |
| Under 5 Years | 362 (6.7%) | 565 (10.2%) |
| 5 to 9 Years | 386 (7.2%) | 267 (4.8%) |
| 10 to 14 Years | 158 (2.9%) | 652 (11.7%) |
| 15 to 19 Years | 452 (8.4%) | 291 (5.2%) |
| 20 to 24 Years | 346 (6.4%) | 343 (6.2%) |
| 25 to 29 Years | 504 (9.3%) | 412 (7.4%) |
| 30 to 34 Years | 499 (9.3%) | 486 (8.7%) |
| 35 to 39 Years | 513 (9.5%) | 454 (8.2%) |
| 40 to 44 Years | 623 (11.6%) | 759 (13.7%) |
| 45 to 49 Years | 358 (6.6%) | 199 (3.6%) |
| 50 to 54 Years | 288 (5.3%) | 105 (1.9%) |
| 55 to 59 Years | 247 (4.6%) | 268 (4.8%) |
| 60 to 64 Years | 308 (5.7%) | 433 (7.8%) |
| 65 to 69 Years | 174 (3.2%) | 159 (2.9%) |
| 70 to 74 Years | 103 (1.9%) | 69 (1.2%) |
| 75 to 79 Years | 50 (0.9%) | 72 (1.3%) |
| 80 to 84 Years | 0 (0.0%) | 19 (0.3%) |
| 85 Years and over | 17 (0.3%) | 0 (0.0%) |
| Total | 5,388 (100.0%) | 5,553 (100.0%) |
Families and Households in Belgrade
Median Family Size in Belgrade
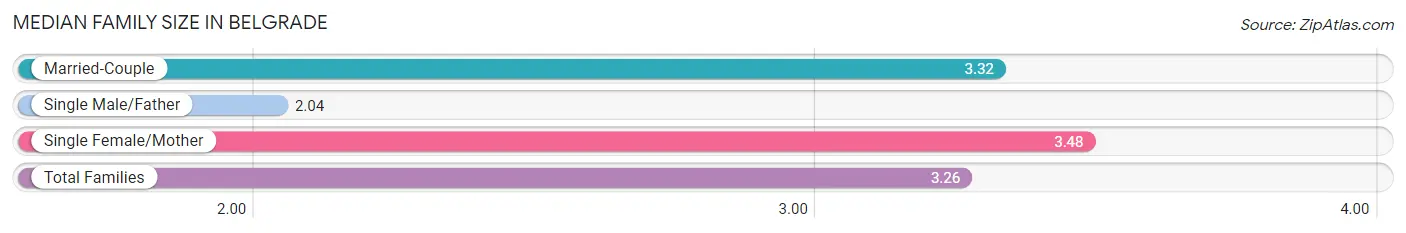
The median family size in Belgrade is 3.26 persons per family, with single female/mother families (421 | 16.6%) accounting for the largest median family size of 3.48 persons per family. On the other hand, single male/father families (180 | 7.1%) represent the smallest median family size with 2.04 persons per family.
| Family Type | # Families | Family Size |
| Married-Couple | 1,936 (76.3%) | 3.32 |
| Single Male/Father | 180 (7.1%) | 2.04 |
| Single Female/Mother | 421 (16.6%) | 3.48 |
| Total Families | 2,537 (100.0%) | 3.26 |
Median Household Size in Belgrade
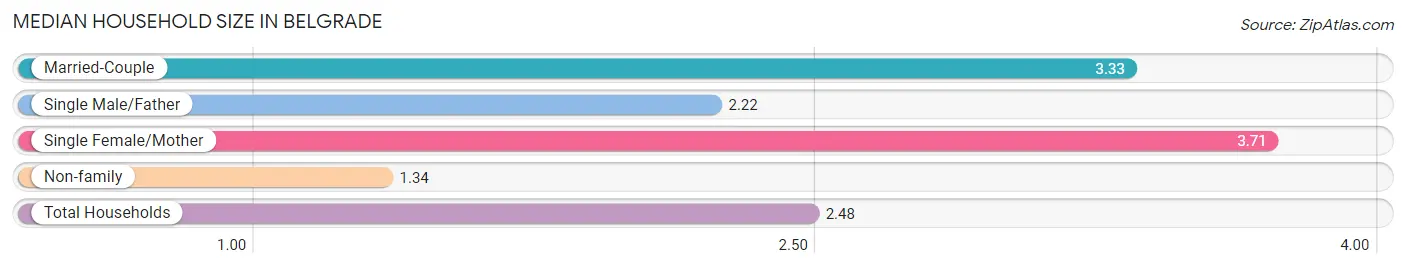
The median household size in Belgrade is 2.48 persons per household, with single female/mother households (421 | 9.6%) accounting for the largest median household size of 3.71 persons per household. non-family households (1,865 | 42.4%) represent the smallest median household size with 1.34 persons per household.
| Household Type | # Households | Household Size |
| Married-Couple | 1,936 (44.0%) | 3.33 |
| Single Male/Father | 180 (4.1%) | 2.22 |
| Single Female/Mother | 421 (9.6%) | 3.71 |
| Non-family | 1,865 (42.4%) | 1.34 |
| Total Households | 4,402 (100.0%) | 2.48 |
Household Size by Marriage Status in Belgrade
Out of a total of 4,402 households in Belgrade, 2,537 (57.6%) are family households, while 1,865 (42.4%) are nonfamily households. The most numerous type of family households are 2-person households, comprising 1,144, and the most common type of nonfamily households are 1-person households, comprising 1,248.
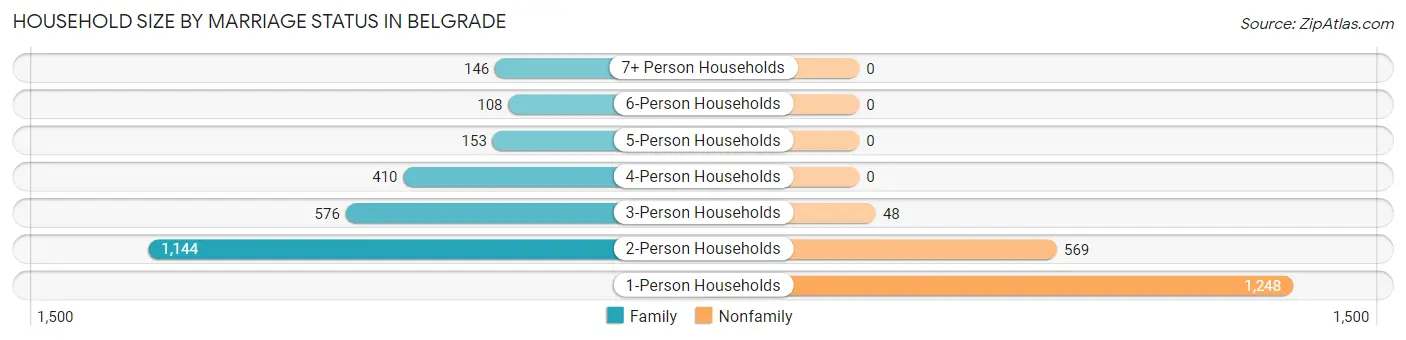
| Household Size | Family Households | Nonfamily Households |
| 1-Person Households | - | 1,248 (28.3%) |
| 2-Person Households | 1,144 (26.0%) | 569 (12.9%) |
| 3-Person Households | 576 (13.1%) | 48 (1.1%) |
| 4-Person Households | 410 (9.3%) | 0 (0.0%) |
| 5-Person Households | 153 (3.5%) | 0 (0.0%) |
| 6-Person Households | 108 (2.5%) | 0 (0.0%) |
| 7+ Person Households | 146 (3.3%) | 0 (0.0%) |
| Total | 2,537 (57.6%) | 1,865 (42.4%) |
Female Fertility in Belgrade
Fertility by Age in Belgrade
Average fertility rate in Belgrade is 51.0 births per 1,000 women. Women in the age bracket of 20 to 34 years have the highest fertility rate with 85.0 births per 1,000 women. Women in the age bracket of 20 to 34 years acount for 69.1% of all women with births.
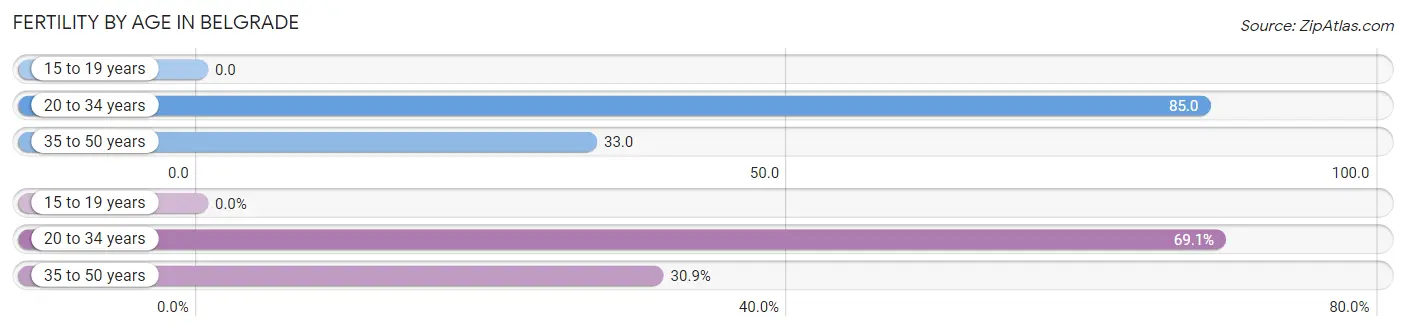
| Age Bracket | Women with Births | Births / 1,000 Women |
| 15 to 19 years | 0 (0.0%) | 0.0 |
| 20 to 34 years | 105 (69.1%) | 85.0 |
| 35 to 50 years | 47 (30.9%) | 33.0 |
| Total | 152 (100.0%) | 51.0 |
Fertility by Age by Marriage Status in Belgrade
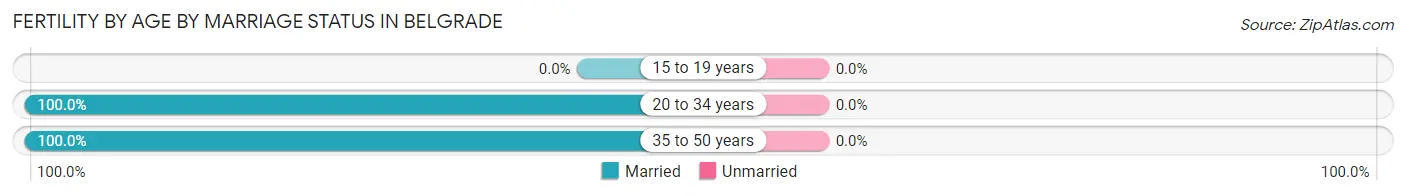
| Age Bracket | Married | Unmarried |
| 15 to 19 years | 0 (0.0%) | 0 (0.0%) |
| 20 to 34 years | 105 (100.0%) | 0 (0.0%) |
| 35 to 50 years | 47 (100.0%) | 0 (0.0%) |
| Total | 152 (100.0%) | 0 (0.0%) |
Fertility by Education in Belgrade
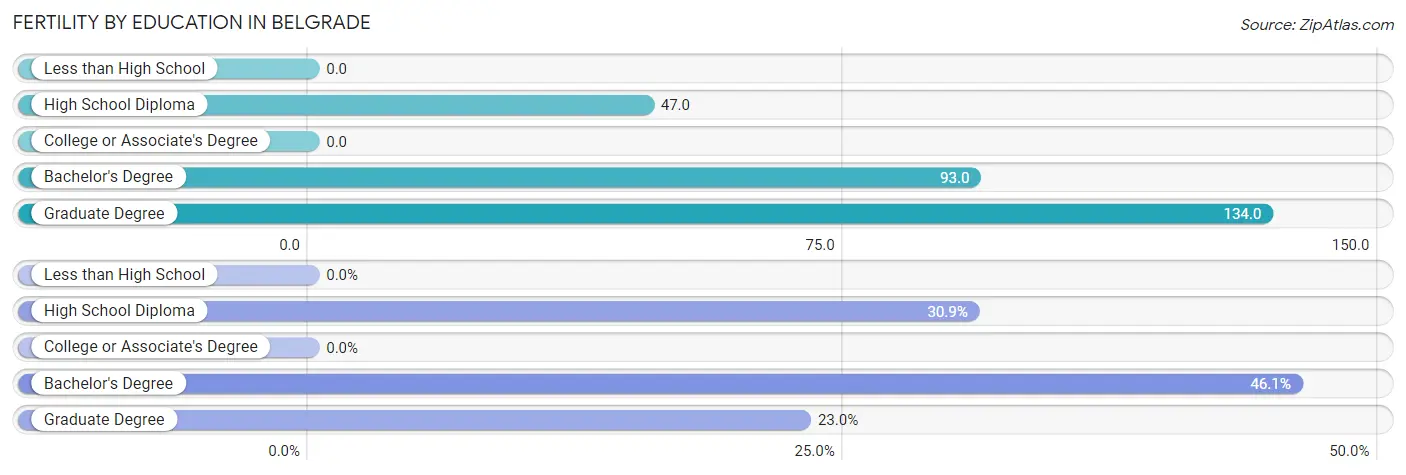
| Educational Attainment | Women with Births | Births / 1,000 Women |
| Less than High School | 0 (0.0%) | 0.0 |
| High School Diploma | 47 (30.9%) | 47.0 |
| College or Associate's Degree | 0 (0.0%) | 0.0 |
| Bachelor's Degree | 70 (46.1%) | 93.0 |
| Graduate Degree | 35 (23.0%) | 134.0 |
| Total | 152 (100.0%) | 51.0 |
Fertility by Education by Marriage Status in Belgrade
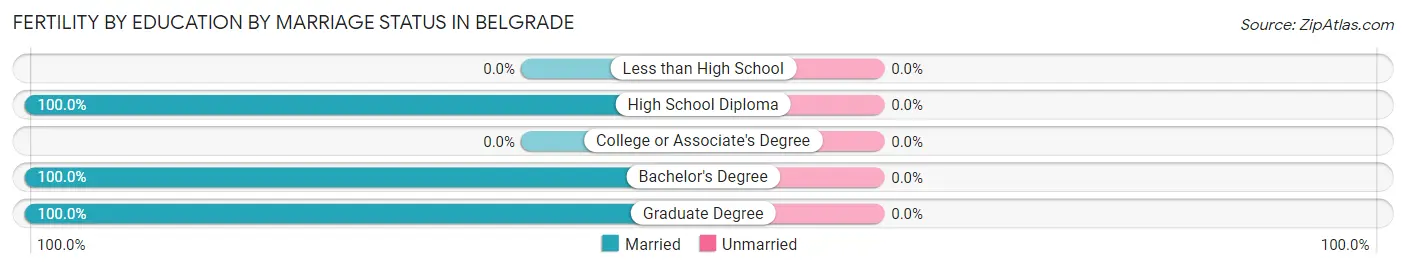
| Educational Attainment | Married | Unmarried |
| Less than High School | 0 (0.0%) | 0 (0.0%) |
| High School Diploma | 47 (100.0%) | 0 (0.0%) |
| College or Associate's Degree | 0 (0.0%) | 0 (0.0%) |
| Bachelor's Degree | 70 (100.0%) | 0 (0.0%) |
| Graduate Degree | 35 (100.0%) | 0 (0.0%) |
| Total | 152 (100.0%) | 0 (0.0%) |
Employment Characteristics in Belgrade
Employment by Class of Employer in Belgrade
Among the 6,380 employed individuals in Belgrade, private company employees (4,697 | 73.6%), not-for-profit organizations (546 | 8.6%), and self-employed (not incorporated) (489 | 7.7%) make up the most common classes of employment.
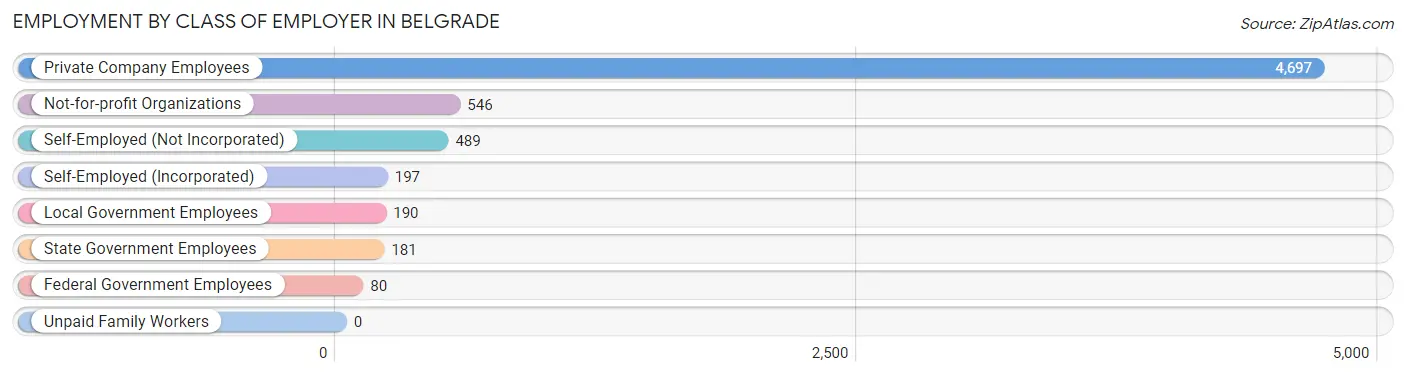
| Employer Class | # Employees | % Employees |
| Private Company Employees | 4,697 | 73.6% |
| Self-Employed (Incorporated) | 197 | 3.1% |
| Self-Employed (Not Incorporated) | 489 | 7.7% |
| Not-for-profit Organizations | 546 | 8.6% |
| Local Government Employees | 190 | 3.0% |
| State Government Employees | 181 | 2.8% |
| Federal Government Employees | 80 | 1.3% |
| Unpaid Family Workers | 0 | 0.0% |
| Total | 6,380 | 100.0% |
Employment Status by Age in Belgrade
According to the labor force statistics for Belgrade, out of the total population over 16 years of age (8,498), 77.6% or 6,594 individuals are in the labor force, with 1.2% or 79 of them unemployed. The age group with the highest labor force participation rate is 25 to 29 years, with 94.3% or 864 individuals in the labor force. Within the labor force, the 60 to 64 years age range has the highest percentage of unemployed individuals, with 5.6% or 24 of them being unemployed.
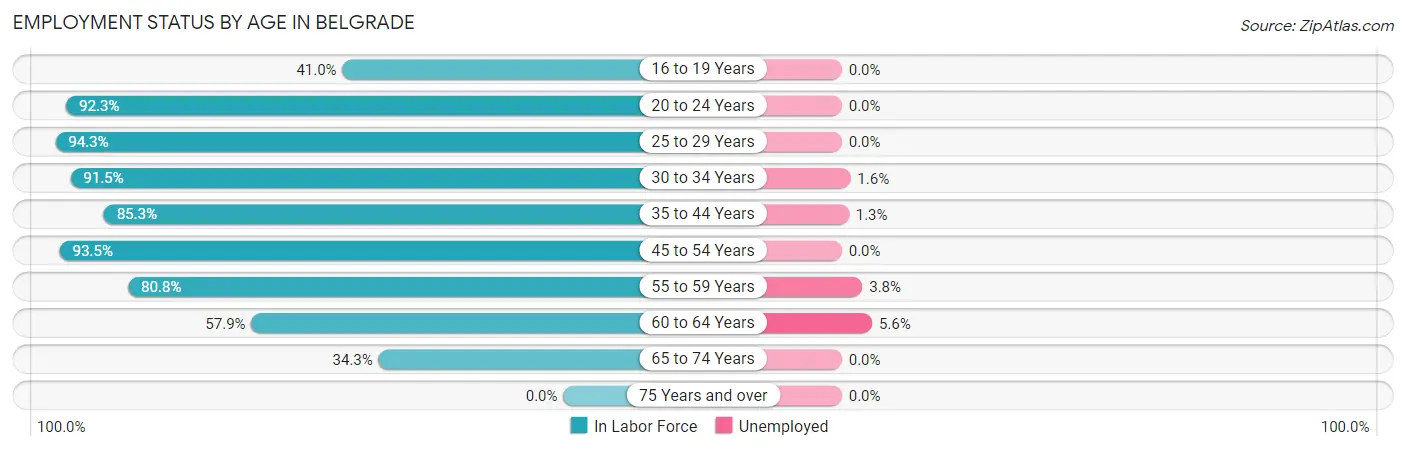
| Age Bracket | In Labor Force | Unemployed |
| 16 to 19 Years | 283 (41.0%) | 0 (0.0%) |
| 20 to 24 Years | 636 (92.3%) | 0 (0.0%) |
| 25 to 29 Years | 864 (94.3%) | 0 (0.0%) |
| 30 to 34 Years | 901 (91.5%) | 14 (1.6%) |
| 35 to 44 Years | 2,004 (85.3%) | 26 (1.3%) |
| 45 to 54 Years | 888 (93.5%) | 0 (0.0%) |
| 55 to 59 Years | 416 (80.8%) | 16 (3.8%) |
| 60 to 64 Years | 429 (57.9%) | 24 (5.6%) |
| 65 to 74 Years | 173 (34.3%) | 0 (0.0%) |
| 75 Years and over | 0 (0.0%) | 0 (0.0%) |
| Total | 6,594 (77.6%) | 79 (1.2%) |
Employment Status by Educational Attainment in Belgrade
According to labor force statistics for Belgrade, 85.2% of individuals (5,501) out of the total population between 25 and 64 years of age (6,456) are in the labor force, with 1.5% or 83 of them being unemployed. The group with the highest labor force participation rate are those with the educational attainment of bachelor's degree or higher, with 87.3% or 2,167 individuals in the labor force. Within the labor force, individuals with less than high school education have the highest percentage of unemployment, with 12.2% or 14 of them being unemployed.
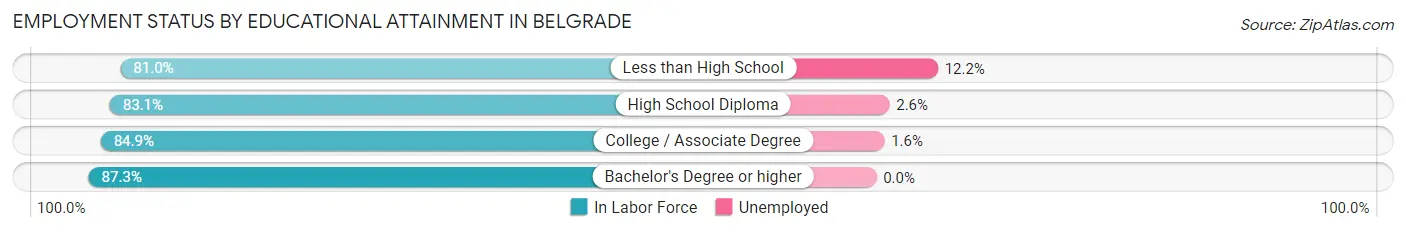
| Educational Attainment | In Labor Force | Unemployed |
| Less than High School | 115 (81.0%) | 17 (12.2%) |
| High School Diploma | 1,541 (83.1%) | 48 (2.6%) |
| College / Associate Degree | 1,679 (84.9%) | 32 (1.6%) |
| Bachelor's Degree or higher | 2,167 (87.3%) | 0 (0.0%) |
| Total | 5,501 (85.2%) | 97 (1.5%) |
Employment Occupations by Sex in Belgrade
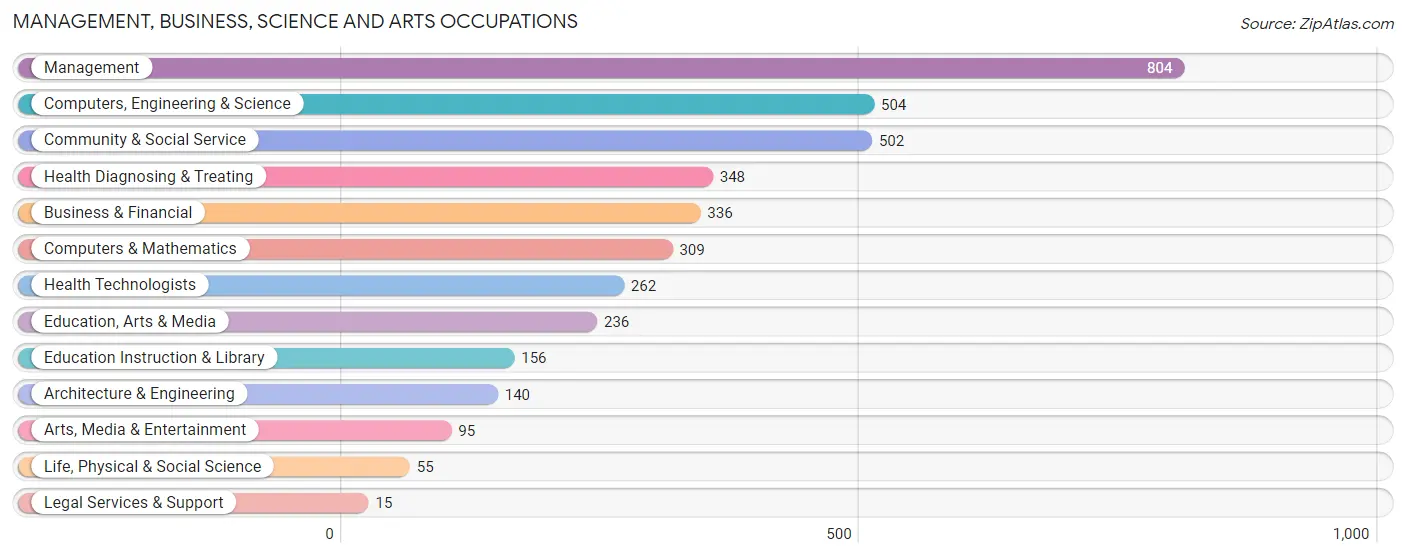
Management, Business, Science and Arts Occupations
The most common Management, Business, Science and Arts occupations in Belgrade are Management (804 | 12.4%), Computers, Engineering & Science (504 | 7.8%), Community & Social Service (502 | 7.7%), Health Diagnosing & Treating (348 | 5.4%), and Business & Financial (336 | 5.2%).
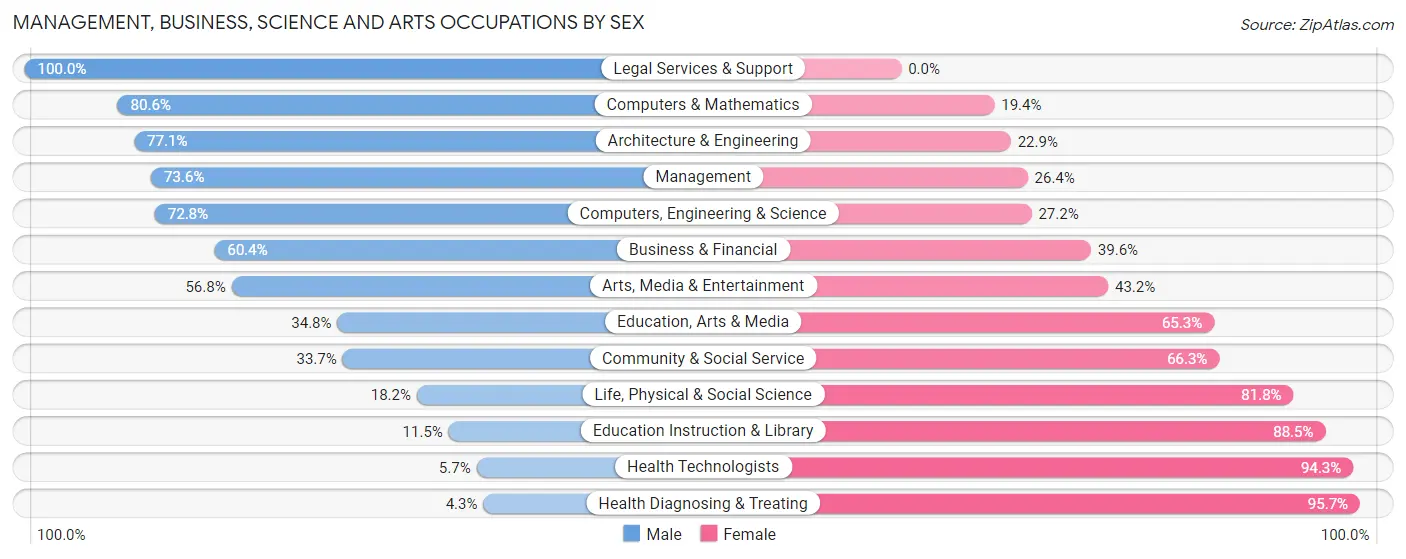
Management, Business, Science and Arts Occupations by Sex
Within the Management, Business, Science and Arts occupations in Belgrade, the most male-oriented occupations are Legal Services & Support (100.0%), Computers & Mathematics (80.6%), and Architecture & Engineering (77.1%), while the most female-oriented occupations are Health Diagnosing & Treating (95.7%), Health Technologists (94.3%), and Education Instruction & Library (88.5%).
| Occupation | Male | Female |
| Management | 592 (73.6%) | 212 (26.4%) |
| Business & Financial | 203 (60.4%) | 133 (39.6%) |
| Computers, Engineering & Science | 367 (72.8%) | 137 (27.2%) |
| Computers & Mathematics | 249 (80.6%) | 60 (19.4%) |
| Architecture & Engineering | 108 (77.1%) | 32 (22.9%) |
| Life, Physical & Social Science | 10 (18.2%) | 45 (81.8%) |
| Community & Social Service | 169 (33.7%) | 333 (66.3%) |
| Education, Arts & Media | 82 (34.7%) | 154 (65.2%) |
| Legal Services & Support | 15 (100.0%) | 0 (0.0%) |
| Education Instruction & Library | 18 (11.5%) | 138 (88.5%) |
| Arts, Media & Entertainment | 54 (56.8%) | 41 (43.2%) |
| Health Diagnosing & Treating | 15 (4.3%) | 333 (95.7%) |
| Health Technologists | 15 (5.7%) | 247 (94.3%) |
| Total (Category) | 1,346 (54.0%) | 1,148 (46.0%) |
| Total (Overall) | 3,676 (56.6%) | 2,815 (43.4%) |
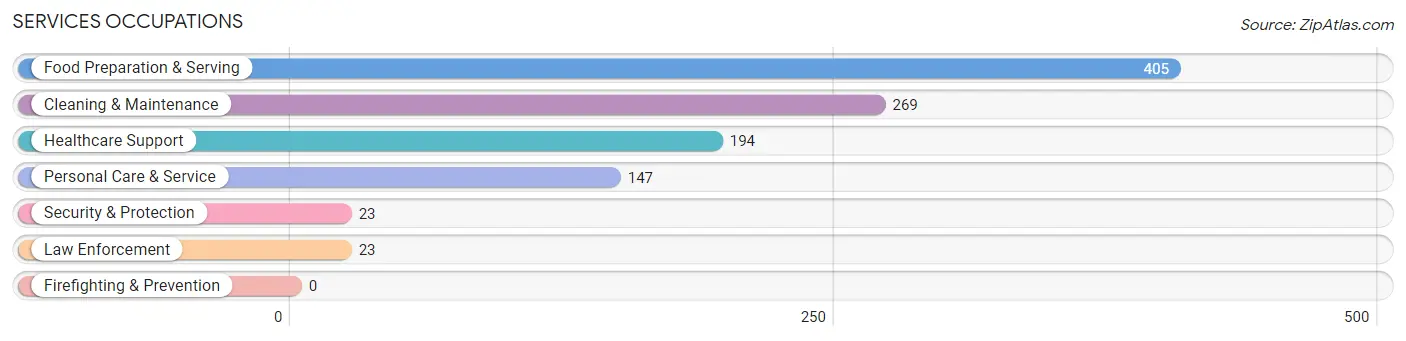
Services Occupations
The most common Services occupations in Belgrade are Food Preparation & Serving (405 | 6.2%), Cleaning & Maintenance (269 | 4.1%), Healthcare Support (194 | 3.0%), Personal Care & Service (147 | 2.3%), and Security & Protection (23 | 0.4%).
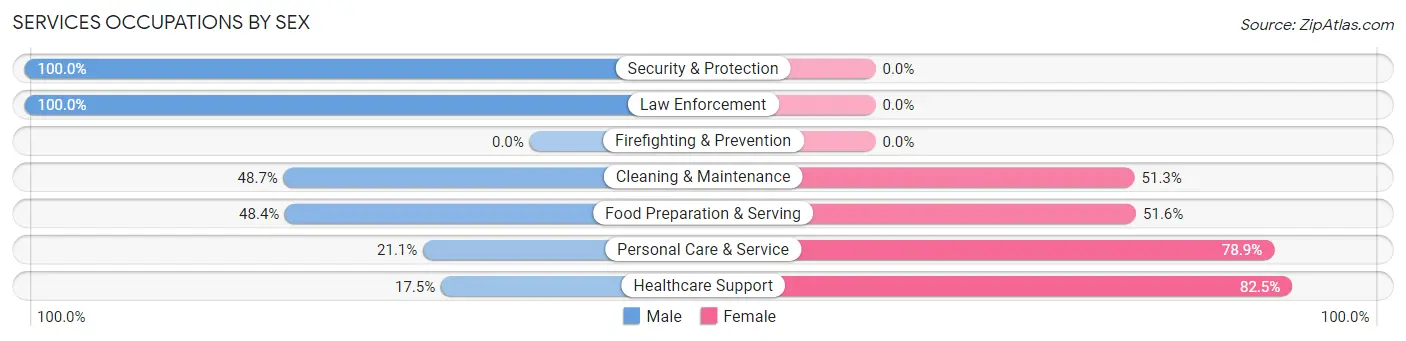
Services Occupations by Sex
Within the Services occupations in Belgrade, the most male-oriented occupations are Security & Protection (100.0%), Law Enforcement (100.0%), and Cleaning & Maintenance (48.7%), while the most female-oriented occupations are Healthcare Support (82.5%), Personal Care & Service (78.9%), and Food Preparation & Serving (51.6%).
| Occupation | Male | Female |
| Healthcare Support | 34 (17.5%) | 160 (82.5%) |
| Security & Protection | 23 (100.0%) | 0 (0.0%) |
| Firefighting & Prevention | 0 (0.0%) | 0 (0.0%) |
| Law Enforcement | 23 (100.0%) | 0 (0.0%) |
| Food Preparation & Serving | 196 (48.4%) | 209 (51.6%) |
| Cleaning & Maintenance | 131 (48.7%) | 138 (51.3%) |
| Personal Care & Service | 31 (21.1%) | 116 (78.9%) |
| Total (Category) | 415 (40.0%) | 623 (60.0%) |
| Total (Overall) | 3,676 (56.6%) | 2,815 (43.4%) |
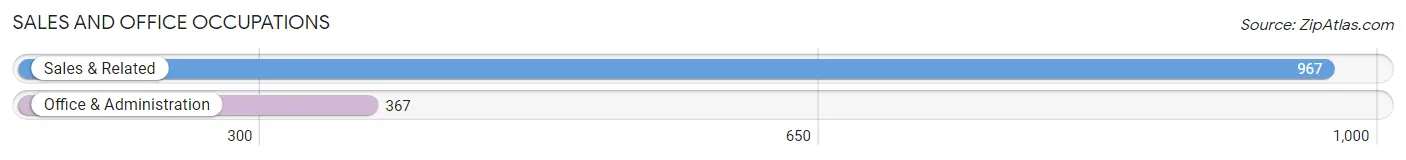
Sales and Office Occupations
The most common Sales and Office occupations in Belgrade are Sales & Related (967 | 14.9%), and Office & Administration (367 | 5.7%).
Sales and Office Occupations by Sex
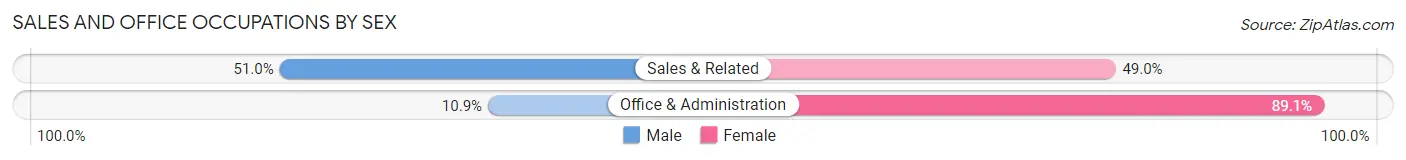
| Occupation | Male | Female |
| Sales & Related | 493 (51.0%) | 474 (49.0%) |
| Office & Administration | 40 (10.9%) | 327 (89.1%) |
| Total (Category) | 533 (40.0%) | 801 (60.0%) |
| Total (Overall) | 3,676 (56.6%) | 2,815 (43.4%) |
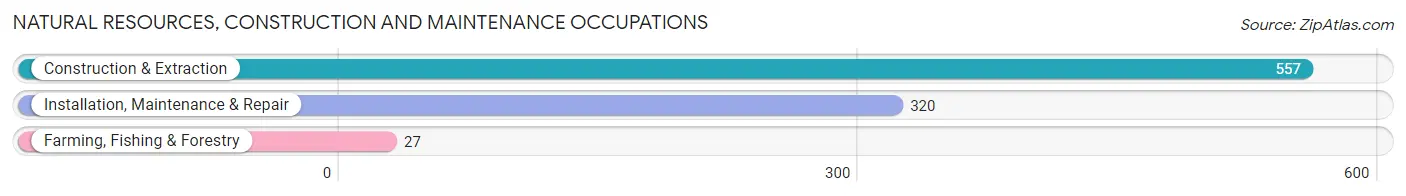
Natural Resources, Construction and Maintenance Occupations
The most common Natural Resources, Construction and Maintenance occupations in Belgrade are Construction & Extraction (557 | 8.6%), Installation, Maintenance & Repair (320 | 4.9%), and Farming, Fishing & Forestry (27 | 0.4%).
Natural Resources, Construction and Maintenance Occupations by Sex
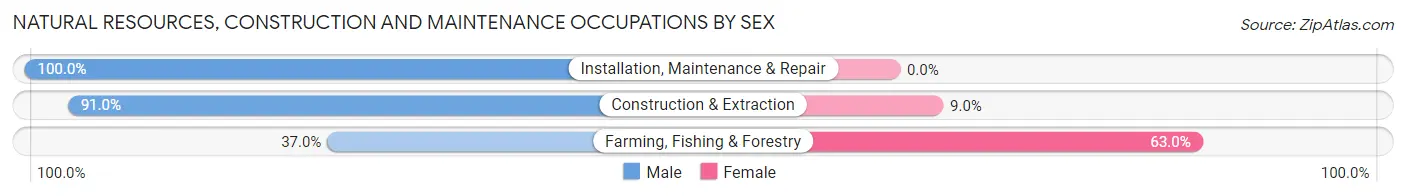
| Occupation | Male | Female |
| Farming, Fishing & Forestry | 10 (37.0%) | 17 (63.0%) |
| Construction & Extraction | 507 (91.0%) | 50 (9.0%) |
| Installation, Maintenance & Repair | 320 (100.0%) | 0 (0.0%) |
| Total (Category) | 837 (92.6%) | 67 (7.4%) |
| Total (Overall) | 3,676 (56.6%) | 2,815 (43.4%) |
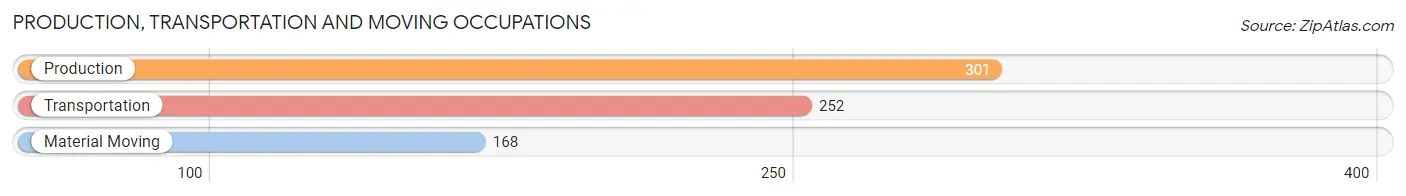
Production, Transportation and Moving Occupations
The most common Production, Transportation and Moving occupations in Belgrade are Production (301 | 4.6%), Transportation (252 | 3.9%), and Material Moving (168 | 2.6%).
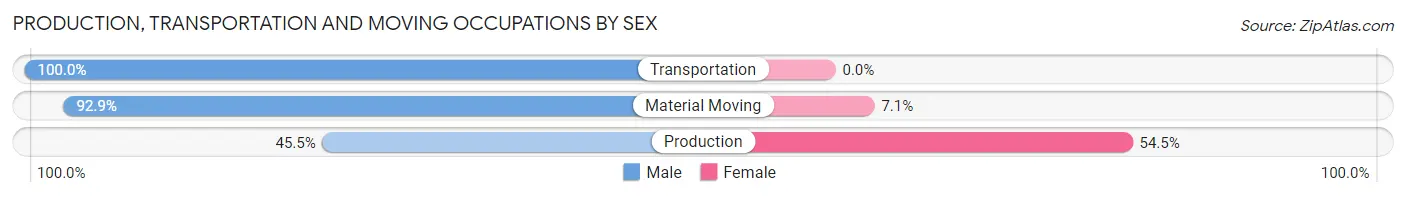
Production, Transportation and Moving Occupations by Sex
| Occupation | Male | Female |
| Production | 137 (45.5%) | 164 (54.5%) |
| Transportation | 252 (100.0%) | 0 (0.0%) |
| Material Moving | 156 (92.9%) | 12 (7.1%) |
| Total (Category) | 545 (75.6%) | 176 (24.4%) |
| Total (Overall) | 3,676 (56.6%) | 2,815 (43.4%) |
Employment Industries by Sex in Belgrade
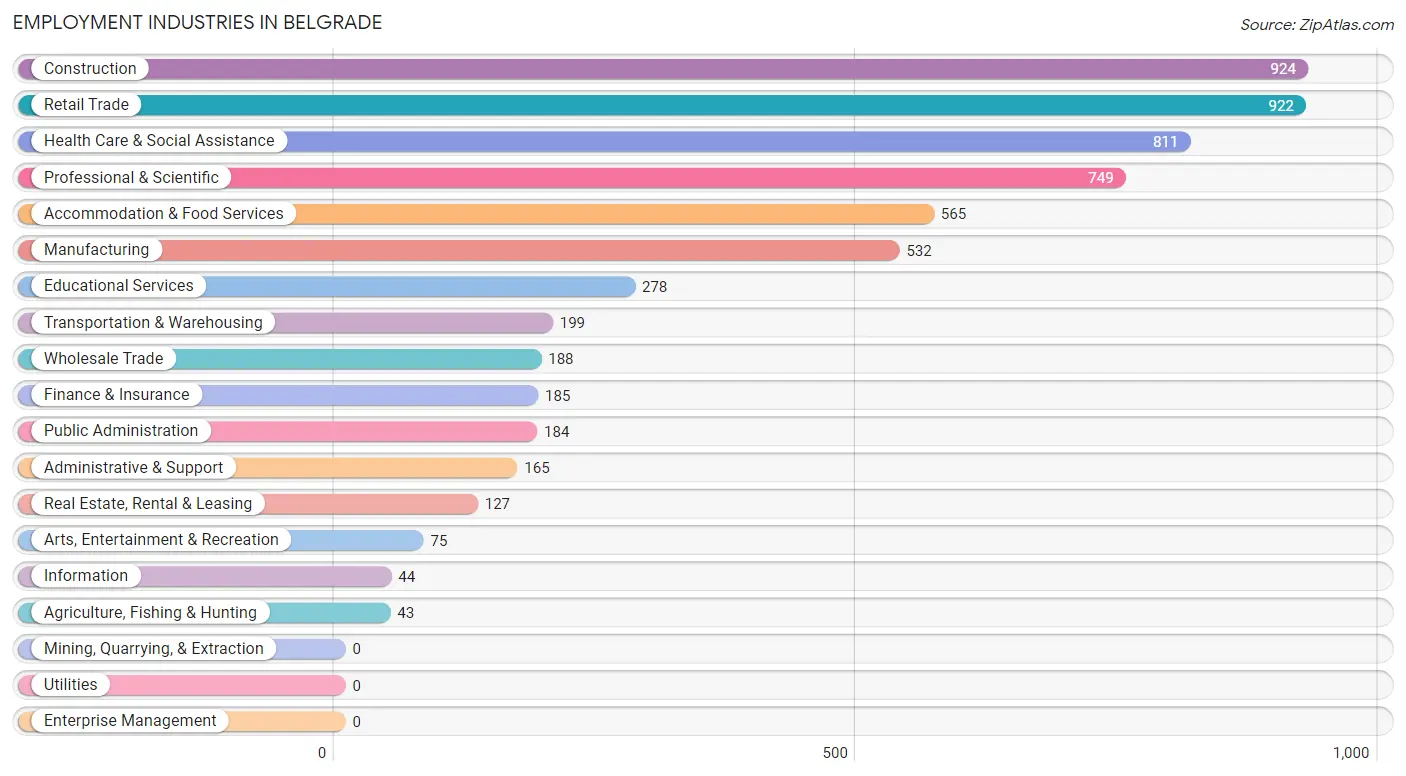
Employment Industries in Belgrade
The major employment industries in Belgrade include Construction (924 | 14.2%), Retail Trade (922 | 14.2%), Health Care & Social Assistance (811 | 12.5%), Professional & Scientific (749 | 11.5%), and Accommodation & Food Services (565 | 8.7%).
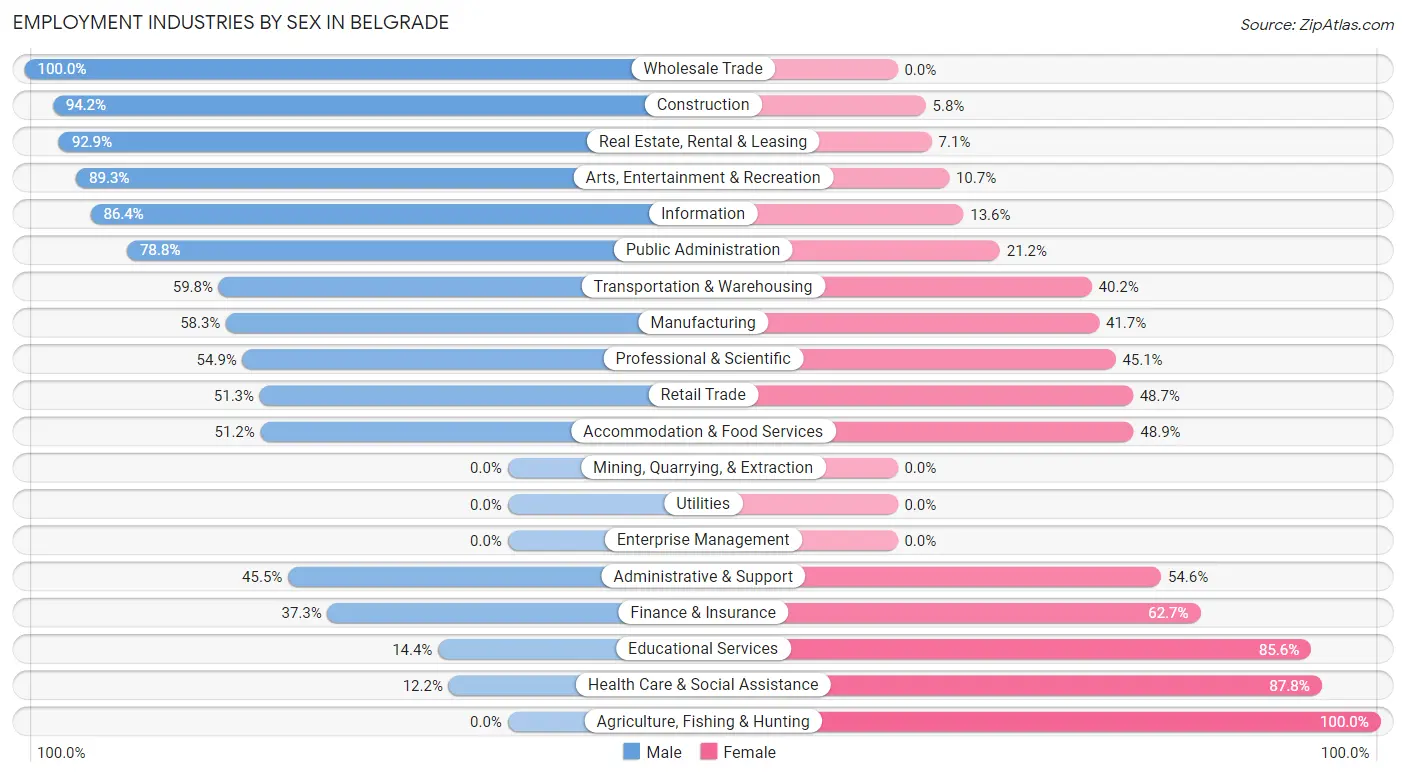
Employment Industries by Sex in Belgrade
The Belgrade industries that see more men than women are Wholesale Trade (100.0%), Construction (94.2%), and Real Estate, Rental & Leasing (92.9%), whereas the industries that tend to have a higher number of women are Agriculture, Fishing & Hunting (100.0%), Health Care & Social Assistance (87.8%), and Educational Services (85.6%).
| Industry | Male | Female |
| Agriculture, Fishing & Hunting | 0 (0.0%) | 43 (100.0%) |
| Mining, Quarrying, & Extraction | 0 (0.0%) | 0 (0.0%) |
| Construction | 870 (94.2%) | 54 (5.8%) |
| Manufacturing | 310 (58.3%) | 222 (41.7%) |
| Wholesale Trade | 188 (100.0%) | 0 (0.0%) |
| Retail Trade | 473 (51.3%) | 449 (48.7%) |
| Transportation & Warehousing | 119 (59.8%) | 80 (40.2%) |
| Utilities | 0 (0.0%) | 0 (0.0%) |
| Information | 38 (86.4%) | 6 (13.6%) |
| Finance & Insurance | 69 (37.3%) | 116 (62.7%) |
| Real Estate, Rental & Leasing | 118 (92.9%) | 9 (7.1%) |
| Professional & Scientific | 411 (54.9%) | 338 (45.1%) |
| Enterprise Management | 0 (0.0%) | 0 (0.0%) |
| Administrative & Support | 75 (45.5%) | 90 (54.5%) |
| Educational Services | 40 (14.4%) | 238 (85.6%) |
| Health Care & Social Assistance | 99 (12.2%) | 712 (87.8%) |
| Arts, Entertainment & Recreation | 67 (89.3%) | 8 (10.7%) |
| Accommodation & Food Services | 289 (51.1%) | 276 (48.8%) |
| Public Administration | 145 (78.8%) | 39 (21.2%) |
| Total | 3,676 (56.6%) | 2,815 (43.4%) |
Education in Belgrade
School Enrollment in Belgrade
The most common levels of schooling among the 2,620 students in Belgrade are middle school (794 | 30.3%), high school (533 | 20.3%), and elementary school (475 | 18.1%).
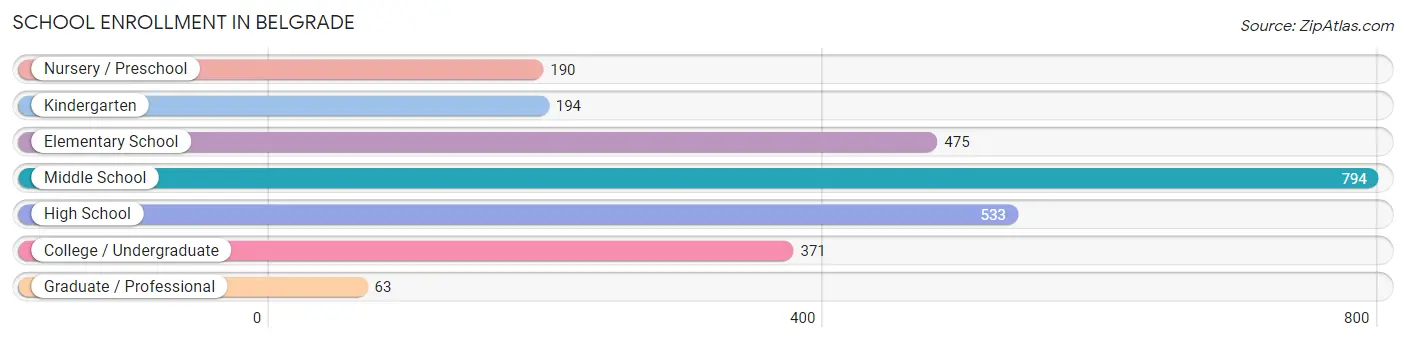
| School Level | # Students | % Students |
| Nursery / Preschool | 190 | 7.2% |
| Kindergarten | 194 | 7.4% |
| Elementary School | 475 | 18.1% |
| Middle School | 794 | 30.3% |
| High School | 533 | 20.3% |
| College / Undergraduate | 371 | 14.2% |
| Graduate / Professional | 63 | 2.4% |
| Total | 2,620 | 100.0% |
School Enrollment by Age by Funding Source in Belgrade
Out of a total of 2,620 students who are enrolled in schools in Belgrade, 972 (37.1%) attend a private institution, while the remaining 1,648 (62.9%) are enrolled in public schools. The age group of 3 to 4 year olds has the highest likelihood of being enrolled in private schools, with 121 (80.1% in the age bracket) enrolled. Conversely, the age group of 18 to 19 year olds has the lowest likelihood of being enrolled in a private school, with 138 (100.0% in the age bracket) attending a public institution.
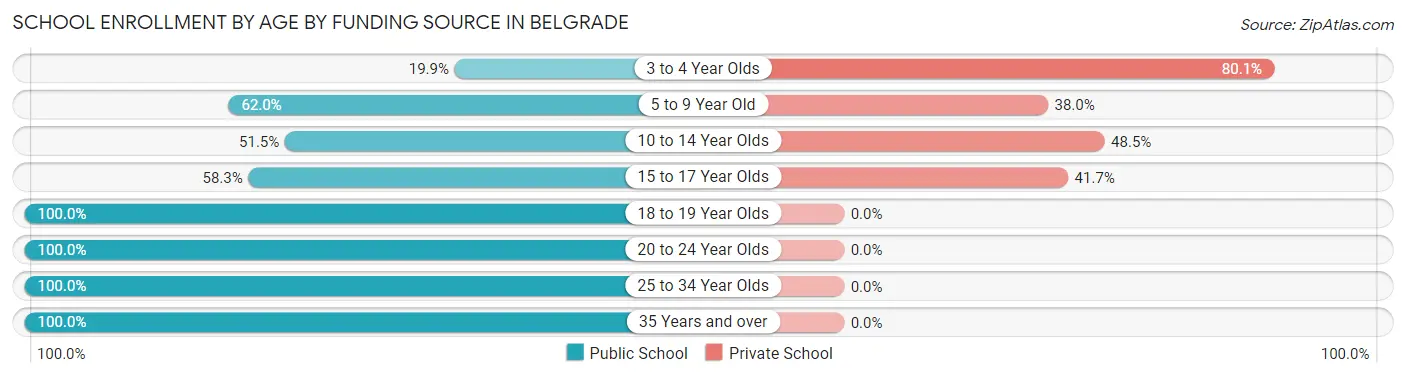
| Age Bracket | Public School | Private School |
| 3 to 4 Year Olds | 30 (19.9%) | 121 (80.1%) |
| 5 to 9 Year Old | 405 (62.0%) | 248 (38.0%) |
| 10 to 14 Year Olds | 417 (51.5%) | 393 (48.5%) |
| 15 to 17 Year Olds | 292 (58.3%) | 209 (41.7%) |
| 18 to 19 Year Olds | 138 (100.0%) | 0 (0.0%) |
| 20 to 24 Year Olds | 84 (100.0%) | 0 (0.0%) |
| 25 to 34 Year Olds | 114 (100.0%) | 0 (0.0%) |
| 35 Years and over | 169 (100.0%) | 0 (0.0%) |
| Total | 1,648 (62.9%) | 972 (37.1%) |
Educational Attainment by Field of Study in Belgrade
Bio, nature & agricultural (651 | 21.1%), business (453 | 14.7%), science & technology (351 | 11.4%), arts & humanities (321 | 10.4%), and social sciences (297 | 9.6%) are the most common fields of study among 3,083 individuals in Belgrade who have obtained a bachelor's degree or higher.
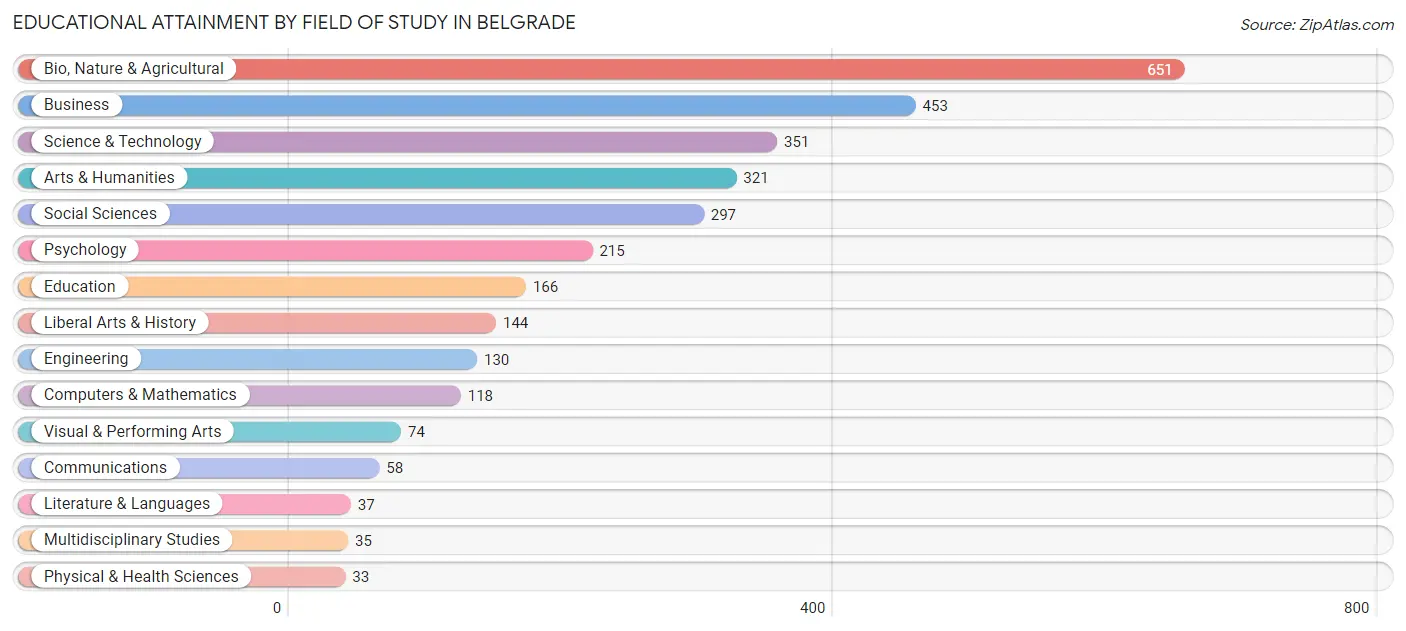
| Field of Study | # Graduates | % Graduates |
| Computers & Mathematics | 118 | 3.8% |
| Bio, Nature & Agricultural | 651 | 21.1% |
| Physical & Health Sciences | 33 | 1.1% |
| Psychology | 215 | 7.0% |
| Social Sciences | 297 | 9.6% |
| Engineering | 130 | 4.2% |
| Multidisciplinary Studies | 35 | 1.1% |
| Science & Technology | 351 | 11.4% |
| Business | 453 | 14.7% |
| Education | 166 | 5.4% |
| Literature & Languages | 37 | 1.2% |
| Liberal Arts & History | 144 | 4.7% |
| Visual & Performing Arts | 74 | 2.4% |
| Communications | 58 | 1.9% |
| Arts & Humanities | 321 | 10.4% |
| Total | 3,083 | 100.0% |
Transportation & Commute in Belgrade
Vehicle Availability by Sex in Belgrade
The most prevalent vehicle ownership categories in Belgrade are males with 2 vehicles (1,439, accounting for 39.7%) and females with 2 vehicles (1,209, making up 52.5%).
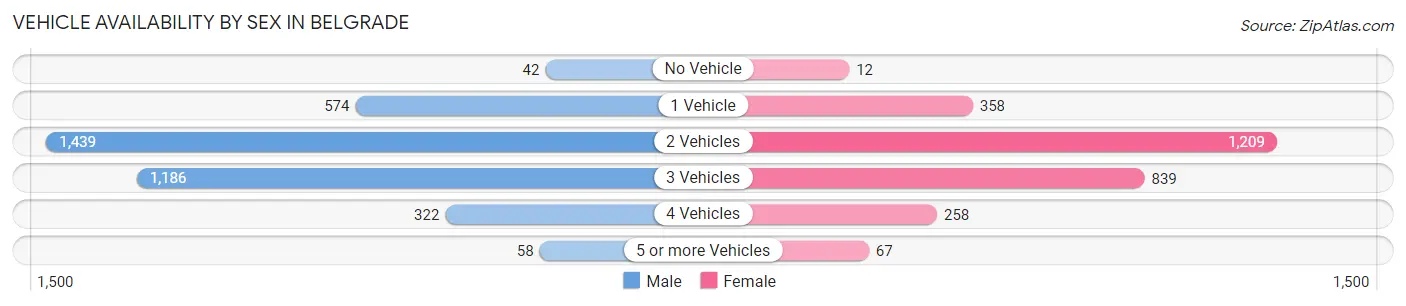
| Vehicles Available | Male | Female |
| No Vehicle | 42 (1.2%) | 12 (0.4%) |
| 1 Vehicle | 574 (15.9%) | 358 (13.1%) |
| 2 Vehicles | 1,439 (39.7%) | 1,209 (44.1%) |
| 3 Vehicles | 1,186 (32.8%) | 839 (30.6%) |
| 4 Vehicles | 322 (8.9%) | 258 (9.4%) |
| 5 or more Vehicles | 58 (1.6%) | 67 (2.4%) |
| Total | 3,621 (100.0%) | 2,743 (100.0%) |
Commute Time in Belgrade
The most frequently occuring commute durations in Belgrade are 20 to 24 minutes (1,197 commuters, 20.9%), 15 to 19 minutes (975 commuters, 17.0%), and 5 to 9 minutes (799 commuters, 13.9%).
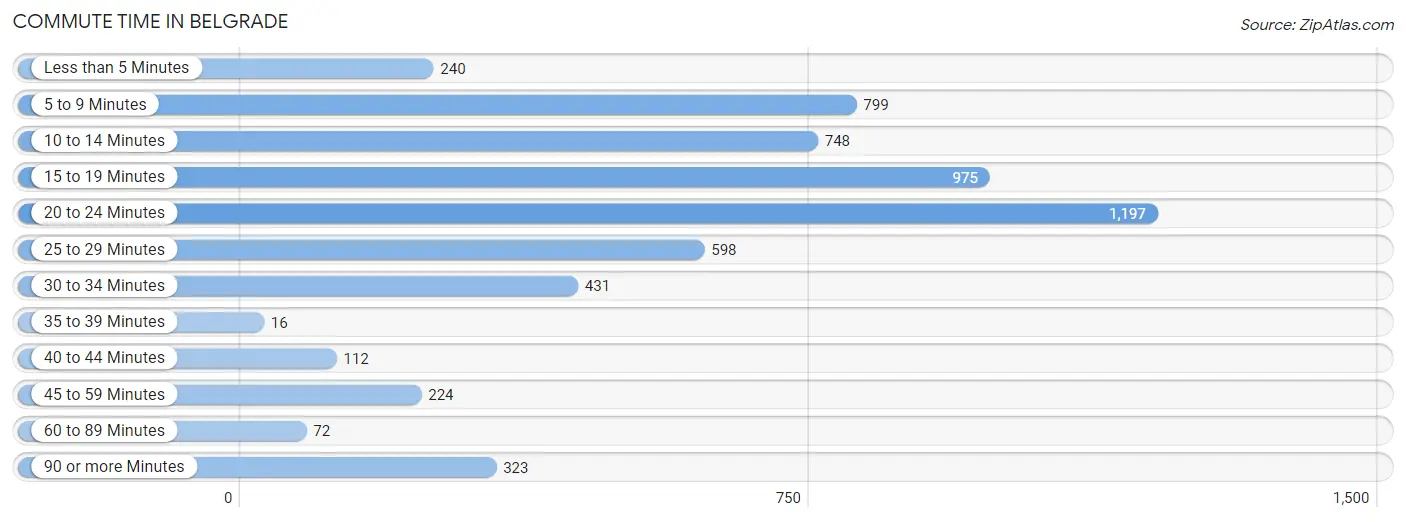
| Commute Time | # Commuters | % Commuters |
| Less than 5 Minutes | 240 | 4.2% |
| 5 to 9 Minutes | 799 | 13.9% |
| 10 to 14 Minutes | 748 | 13.0% |
| 15 to 19 Minutes | 975 | 17.0% |
| 20 to 24 Minutes | 1,197 | 20.9% |
| 25 to 29 Minutes | 598 | 10.4% |
| 30 to 34 Minutes | 431 | 7.5% |
| 35 to 39 Minutes | 16 | 0.3% |
| 40 to 44 Minutes | 112 | 1.9% |
| 45 to 59 Minutes | 224 | 3.9% |
| 60 to 89 Minutes | 72 | 1.3% |
| 90 or more Minutes | 323 | 5.6% |
Commute Time by Sex in Belgrade
The most common commute times in Belgrade are 20 to 24 minutes (654 commuters, 20.3%) for males and 20 to 24 minutes (543 commuters, 21.6%) for females.
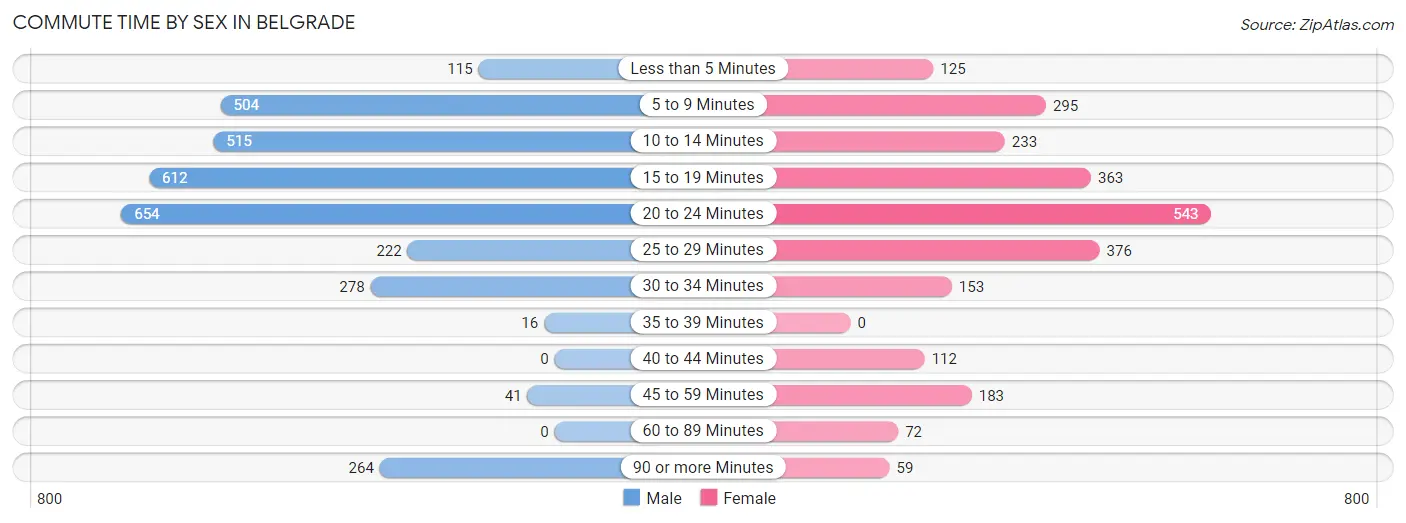
| Commute Time | Male | Female |
| Less than 5 Minutes | 115 (3.6%) | 125 (5.0%) |
| 5 to 9 Minutes | 504 (15.7%) | 295 (11.7%) |
| 10 to 14 Minutes | 515 (16.0%) | 233 (9.3%) |
| 15 to 19 Minutes | 612 (19.0%) | 363 (14.4%) |
| 20 to 24 Minutes | 654 (20.3%) | 543 (21.6%) |
| 25 to 29 Minutes | 222 (6.9%) | 376 (15.0%) |
| 30 to 34 Minutes | 278 (8.6%) | 153 (6.1%) |
| 35 to 39 Minutes | 16 (0.5%) | 0 (0.0%) |
| 40 to 44 Minutes | 0 (0.0%) | 112 (4.5%) |
| 45 to 59 Minutes | 41 (1.3%) | 183 (7.3%) |
| 60 to 89 Minutes | 0 (0.0%) | 72 (2.9%) |
| 90 or more Minutes | 264 (8.2%) | 59 (2.4%) |
Time of Departure to Work by Sex in Belgrade
The most frequent times of departure to work in Belgrade are 7:30 AM to 7:59 AM (658, 20.4%) for males and 7:30 AM to 7:59 AM (511, 20.3%) for females.
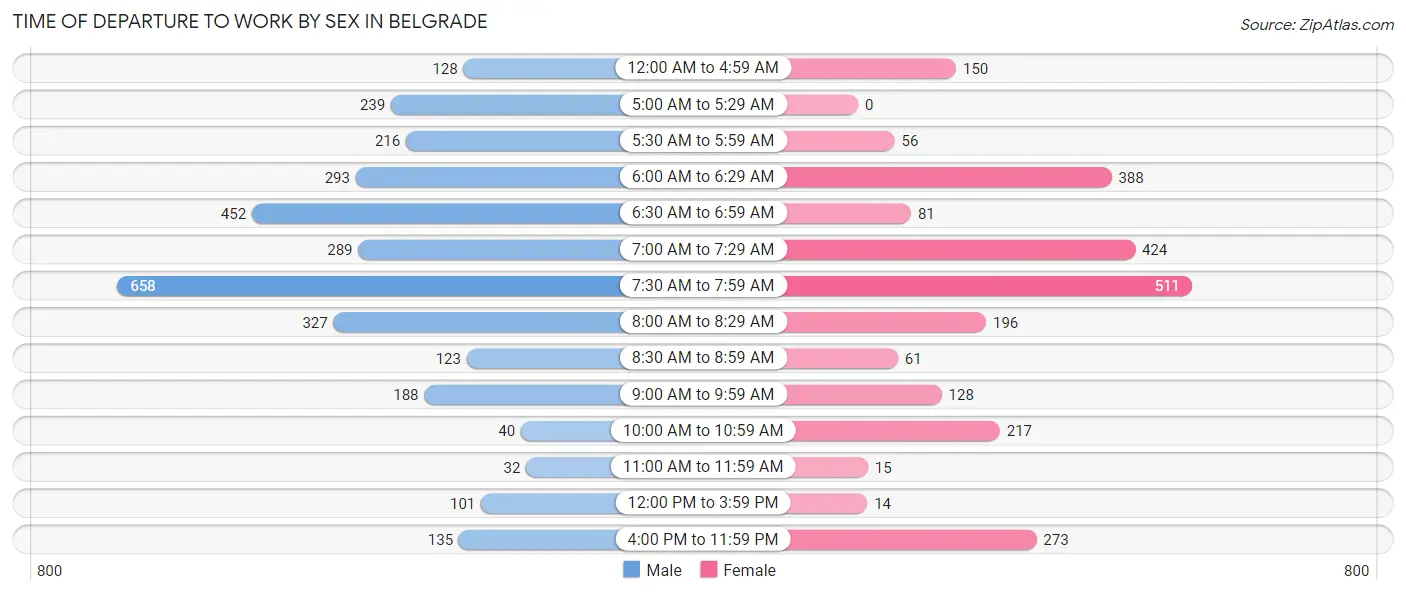
| Time of Departure | Male | Female |
| 12:00 AM to 4:59 AM | 128 (4.0%) | 150 (6.0%) |
| 5:00 AM to 5:29 AM | 239 (7.4%) | 0 (0.0%) |
| 5:30 AM to 5:59 AM | 216 (6.7%) | 56 (2.2%) |
| 6:00 AM to 6:29 AM | 293 (9.1%) | 388 (15.4%) |
| 6:30 AM to 6:59 AM | 452 (14.0%) | 81 (3.2%) |
| 7:00 AM to 7:29 AM | 289 (9.0%) | 424 (16.9%) |
| 7:30 AM to 7:59 AM | 658 (20.4%) | 511 (20.3%) |
| 8:00 AM to 8:29 AM | 327 (10.2%) | 196 (7.8%) |
| 8:30 AM to 8:59 AM | 123 (3.8%) | 61 (2.4%) |
| 9:00 AM to 9:59 AM | 188 (5.8%) | 128 (5.1%) |
| 10:00 AM to 10:59 AM | 40 (1.2%) | 217 (8.6%) |
| 11:00 AM to 11:59 AM | 32 (1.0%) | 15 (0.6%) |
| 12:00 PM to 3:59 PM | 101 (3.1%) | 14 (0.6%) |
| 4:00 PM to 11:59 PM | 135 (4.2%) | 273 (10.9%) |
| Total | 3,221 (100.0%) | 2,514 (100.0%) |
Housing Occupancy in Belgrade
Occupancy by Ownership in Belgrade
Of the total 4,402 dwellings in Belgrade, owner-occupied units account for 2,505 (56.9%), while renter-occupied units make up 1,897 (43.1%).
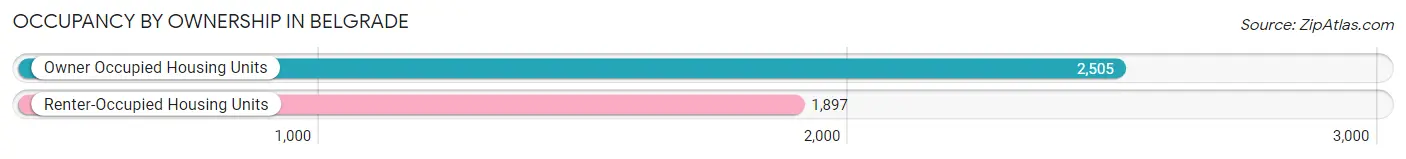
| Occupancy | # Housing Units | % Housing Units |
| Owner Occupied Housing Units | 2,505 | 56.9% |
| Renter-Occupied Housing Units | 1,897 | 43.1% |
| Total Occupied Housing Units | 4,402 | 100.0% |
Occupancy by Household Size in Belgrade
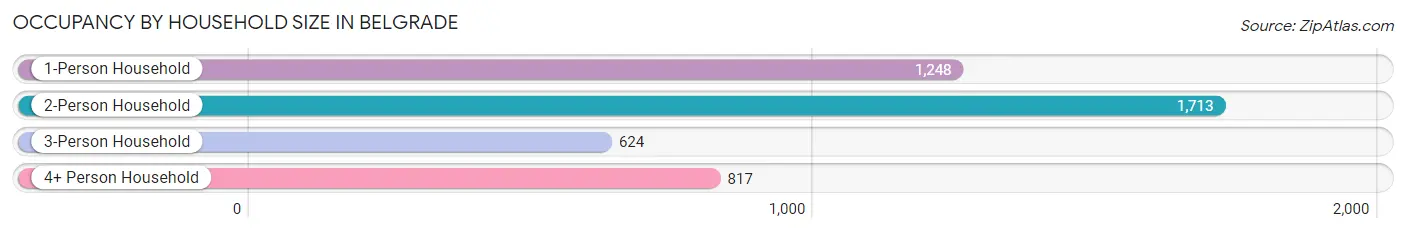
| Household Size | # Housing Units | % Housing Units |
| 1-Person Household | 1,248 | 28.3% |
| 2-Person Household | 1,713 | 38.9% |
| 3-Person Household | 624 | 14.2% |
| 4+ Person Household | 817 | 18.6% |
| Total Housing Units | 4,402 | 100.0% |
Occupancy by Ownership by Household Size in Belgrade
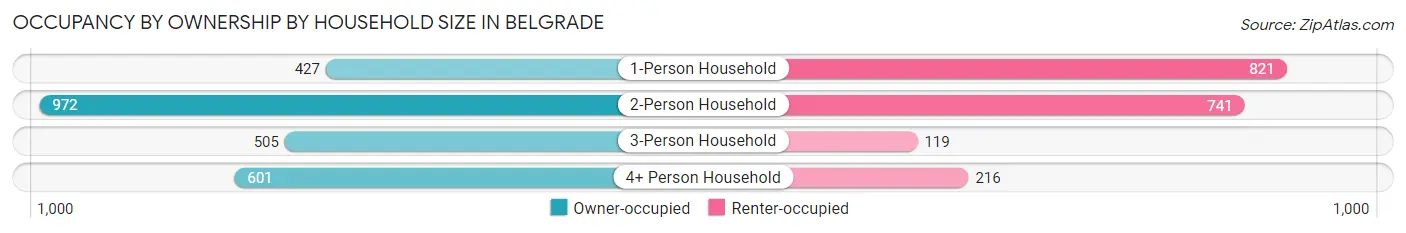
| Household Size | Owner-occupied | Renter-occupied |
| 1-Person Household | 427 (34.2%) | 821 (65.8%) |
| 2-Person Household | 972 (56.7%) | 741 (43.3%) |
| 3-Person Household | 505 (80.9%) | 119 (19.1%) |
| 4+ Person Household | 601 (73.6%) | 216 (26.4%) |
| Total Housing Units | 2,505 (56.9%) | 1,897 (43.1%) |
Occupancy by Educational Attainment in Belgrade
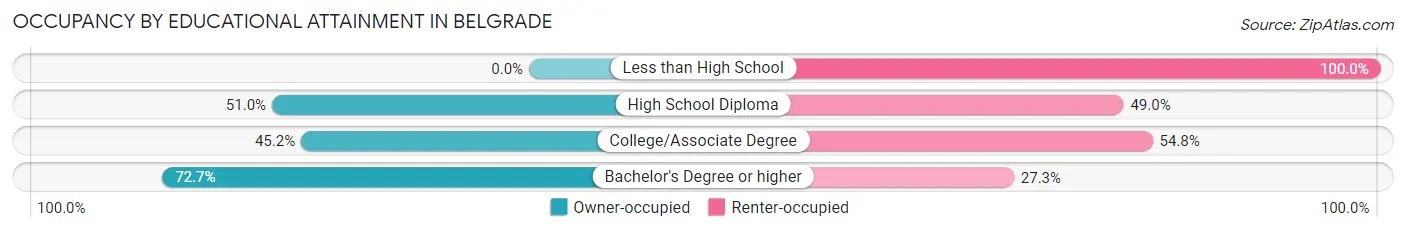
| Household Size | Owner-occupied | Renter-occupied |
| Less than High School | 0 (0.0%) | 76 (100.0%) |
| High School Diploma | 708 (51.0%) | 681 (49.0%) |
| College/Associate Degree | 556 (45.2%) | 674 (54.8%) |
| Bachelor's Degree or higher | 1,241 (72.7%) | 466 (27.3%) |
Occupancy by Age of Householder in Belgrade
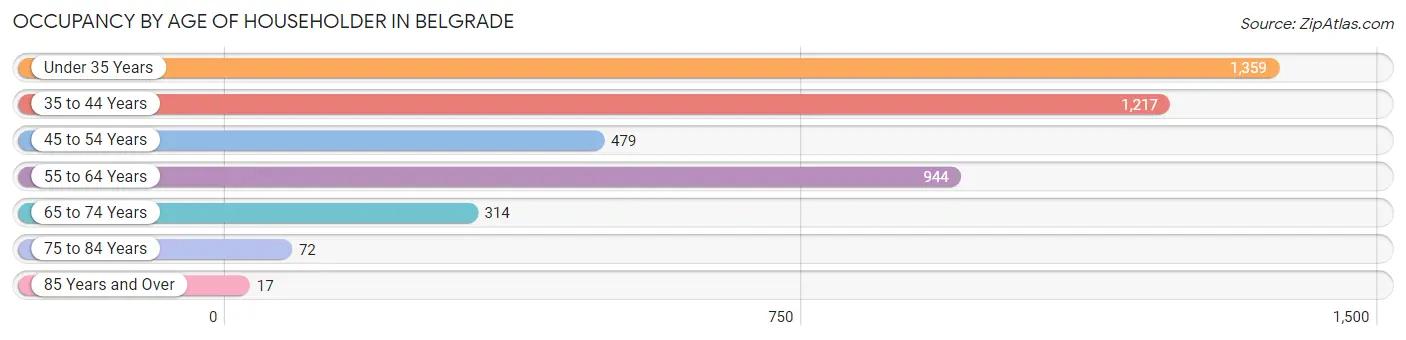
| Age Bracket | # Households | % Households |
| Under 35 Years | 1,359 | 30.9% |
| 35 to 44 Years | 1,217 | 27.7% |
| 45 to 54 Years | 479 | 10.9% |
| 55 to 64 Years | 944 | 21.4% |
| 65 to 74 Years | 314 | 7.1% |
| 75 to 84 Years | 72 | 1.6% |
| 85 Years and Over | 17 | 0.4% |
| Total | 4,402 | 100.0% |
Housing Finances in Belgrade
Median Income by Occupancy in Belgrade
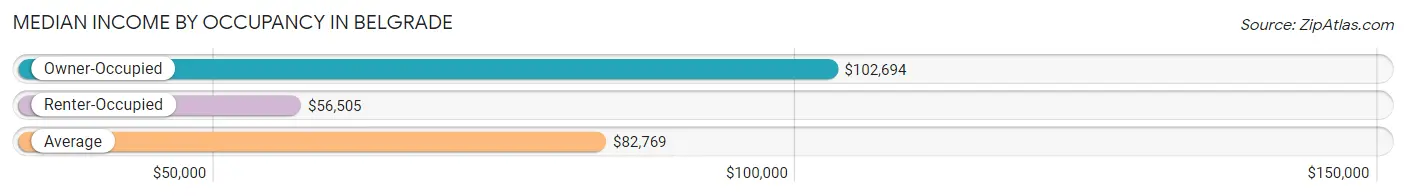
| Occupancy Type | # Households | Median Income |
| Owner-Occupied | 2,505 (56.9%) | $102,694 |
| Renter-Occupied | 1,897 (43.1%) | $56,505 |
| Average | 4,402 (100.0%) | $82,769 |
Occupancy by Householder Income Bracket in Belgrade
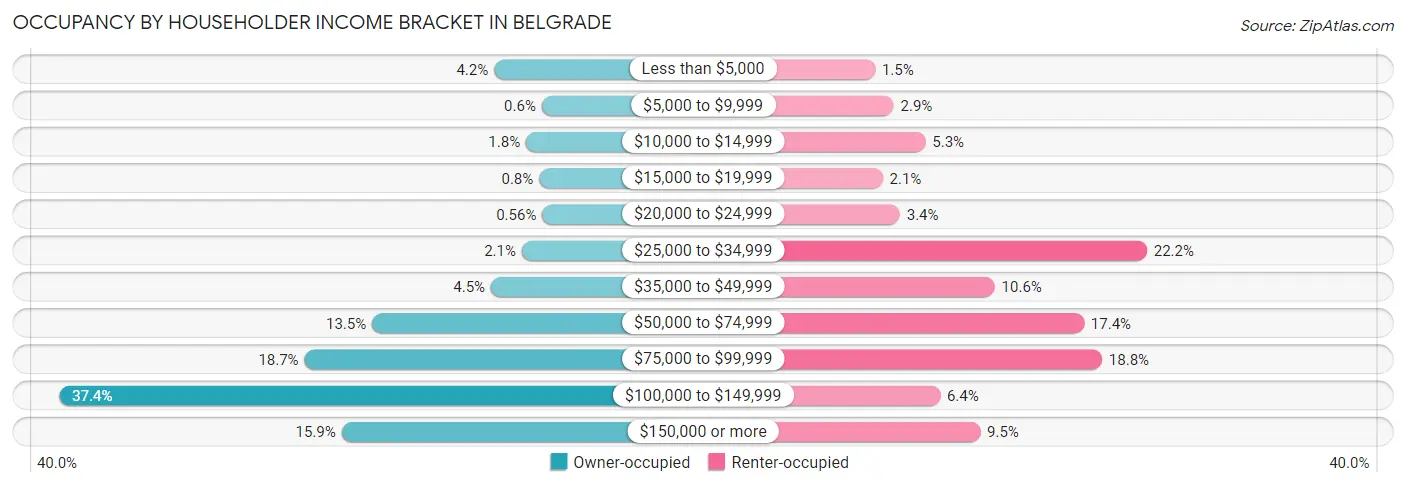
| Income Bracket | Owner-occupied | Renter-occupied |
| Less than $5,000 | 106 (4.2%) | 28 (1.5%) |
| $5,000 to $9,999 | 15 (0.6%) | 55 (2.9%) |
| $10,000 to $14,999 | 45 (1.8%) | 101 (5.3%) |
| $15,000 to $19,999 | 20 (0.8%) | 39 (2.1%) |
| $20,000 to $24,999 | 14 (0.6%) | 64 (3.4%) |
| $25,000 to $34,999 | 53 (2.1%) | 421 (22.2%) |
| $35,000 to $49,999 | 112 (4.5%) | 201 (10.6%) |
| $50,000 to $74,999 | 339 (13.5%) | 330 (17.4%) |
| $75,000 to $99,999 | 468 (18.7%) | 356 (18.8%) |
| $100,000 to $149,999 | 936 (37.4%) | 122 (6.4%) |
| $150,000 or more | 397 (15.9%) | 180 (9.5%) |
| Total | 2,505 (100.0%) | 1,897 (100.0%) |
Monthly Housing Cost Tiers in Belgrade
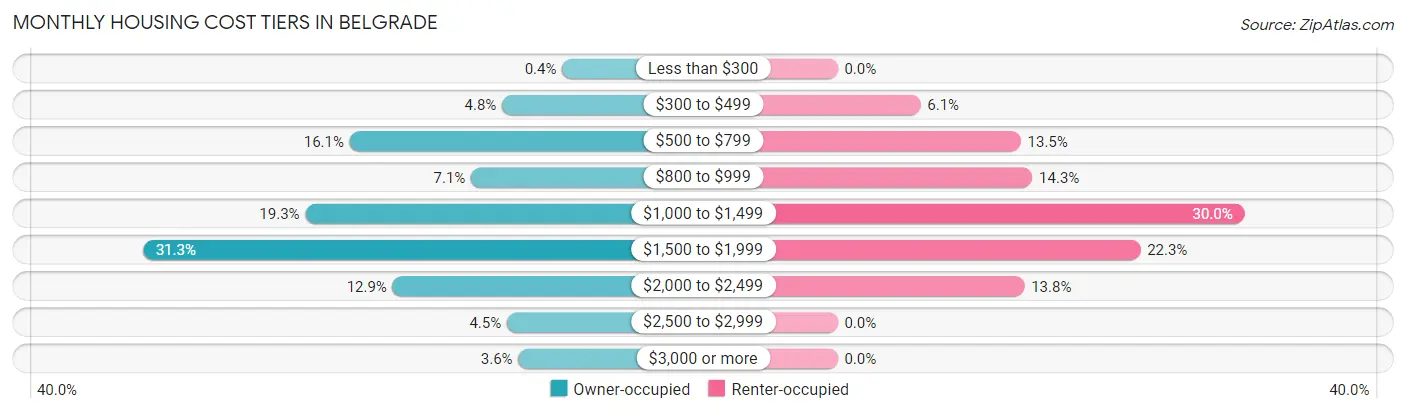
| Monthly Cost | Owner-occupied | Renter-occupied |
| Less than $300 | 10 (0.4%) | 0 (0.0%) |
| $300 to $499 | 121 (4.8%) | 116 (6.1%) |
| $500 to $799 | 402 (16.1%) | 256 (13.5%) |
| $800 to $999 | 178 (7.1%) | 272 (14.3%) |
| $1,000 to $1,499 | 484 (19.3%) | 569 (30.0%) |
| $1,500 to $1,999 | 784 (31.3%) | 423 (22.3%) |
| $2,000 to $2,499 | 323 (12.9%) | 261 (13.8%) |
| $2,500 to $2,999 | 112 (4.5%) | 0 (0.0%) |
| $3,000 or more | 91 (3.6%) | 0 (0.0%) |
| Total | 2,505 (100.0%) | 1,897 (100.0%) |
Physical Housing Characteristics in Belgrade
Housing Structures in Belgrade
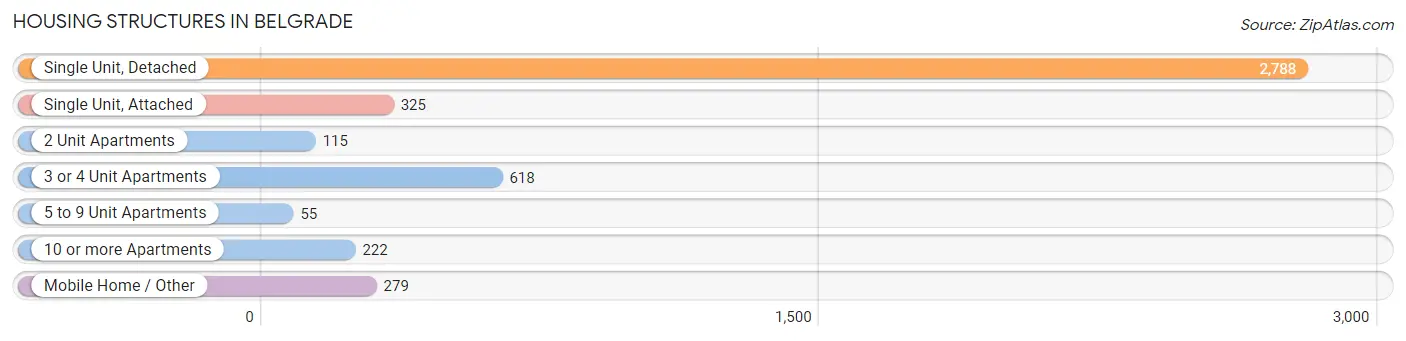
| Structure Type | # Housing Units | % Housing Units |
| Single Unit, Detached | 2,788 | 63.3% |
| Single Unit, Attached | 325 | 7.4% |
| 2 Unit Apartments | 115 | 2.6% |
| 3 or 4 Unit Apartments | 618 | 14.0% |
| 5 to 9 Unit Apartments | 55 | 1.3% |
| 10 or more Apartments | 222 | 5.0% |
| Mobile Home / Other | 279 | 6.3% |
| Total | 4,402 | 100.0% |
Housing Structures by Occupancy in Belgrade
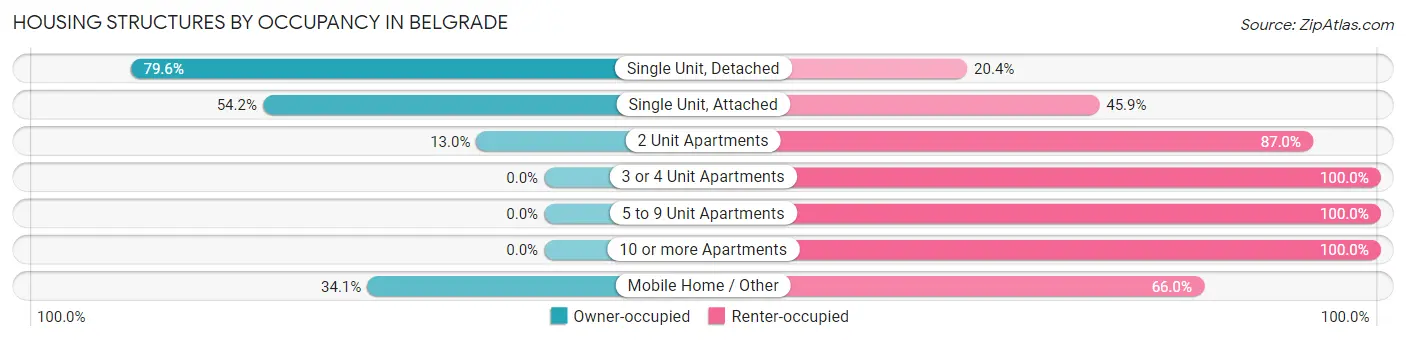
| Structure Type | Owner-occupied | Renter-occupied |
| Single Unit, Detached | 2,219 (79.6%) | 569 (20.4%) |
| Single Unit, Attached | 176 (54.1%) | 149 (45.9%) |
| 2 Unit Apartments | 15 (13.0%) | 100 (87.0%) |
| 3 or 4 Unit Apartments | 0 (0.0%) | 618 (100.0%) |
| 5 to 9 Unit Apartments | 0 (0.0%) | 55 (100.0%) |
| 10 or more Apartments | 0 (0.0%) | 222 (100.0%) |
| Mobile Home / Other | 95 (34.1%) | 184 (65.9%) |
| Total | 2,505 (56.9%) | 1,897 (43.1%) |
Housing Structures by Number of Rooms in Belgrade
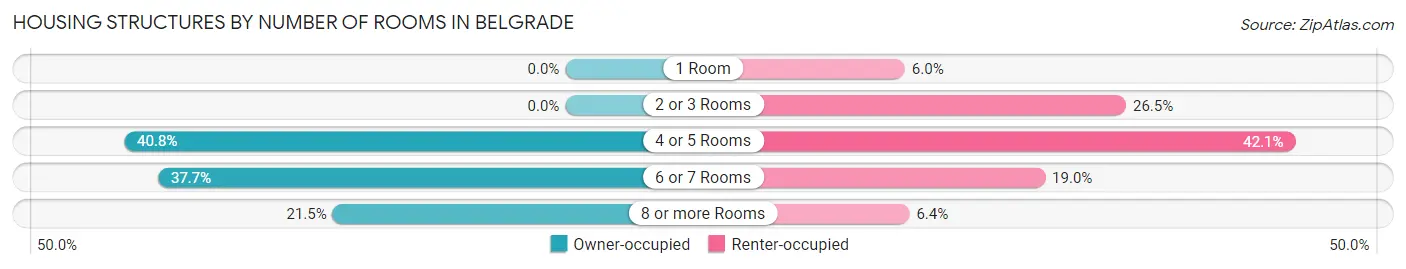
| Number of Rooms | Owner-occupied | Renter-occupied |
| 1 Room | 0 (0.0%) | 114 (6.0%) |
| 2 or 3 Rooms | 0 (0.0%) | 502 (26.5%) |
| 4 or 5 Rooms | 1,022 (40.8%) | 799 (42.1%) |
| 6 or 7 Rooms | 944 (37.7%) | 360 (19.0%) |
| 8 or more Rooms | 539 (21.5%) | 122 (6.4%) |
| Total | 2,505 (100.0%) | 1,897 (100.0%) |
Housing Structure by Heating Type in Belgrade
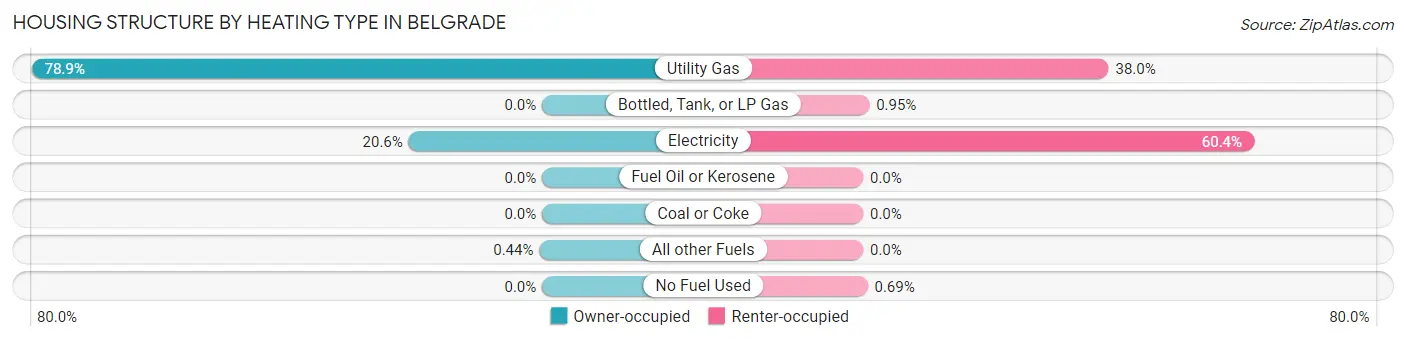
| Heating Type | Owner-occupied | Renter-occupied |
| Utility Gas | 1,977 (78.9%) | 720 (38.0%) |
| Bottled, Tank, or LP Gas | 0 (0.0%) | 18 (0.9%) |
| Electricity | 517 (20.6%) | 1,146 (60.4%) |
| Fuel Oil or Kerosene | 0 (0.0%) | 0 (0.0%) |
| Coal or Coke | 0 (0.0%) | 0 (0.0%) |
| All other Fuels | 11 (0.4%) | 0 (0.0%) |
| No Fuel Used | 0 (0.0%) | 13 (0.7%) |
| Total | 2,505 (100.0%) | 1,897 (100.0%) |
Household Vehicle Usage in Belgrade
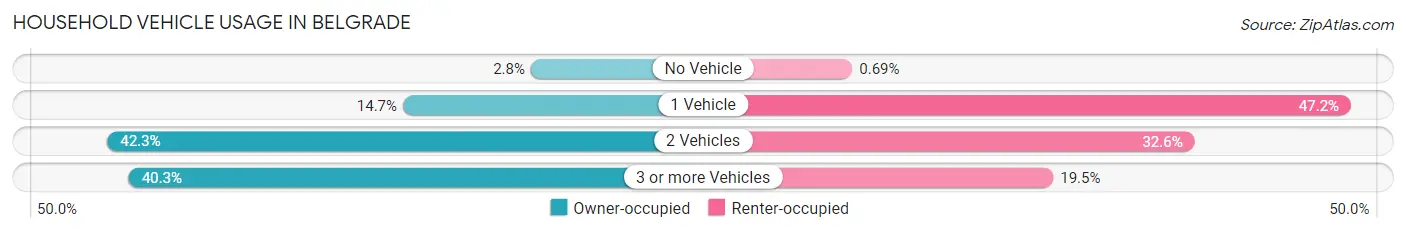
| Vehicles per Household | Owner-occupied | Renter-occupied |
| No Vehicle | 69 (2.8%) | 13 (0.7%) |
| 1 Vehicle | 368 (14.7%) | 896 (47.2%) |
| 2 Vehicles | 1,059 (42.3%) | 619 (32.6%) |
| 3 or more Vehicles | 1,009 (40.3%) | 369 (19.5%) |
| Total | 2,505 (100.0%) | 1,897 (100.0%) |
Real Estate & Mortgages in Belgrade
Real Estate and Mortgage Overview in Belgrade
| Characteristic | Without Mortgage | With Mortgage |
| Housing Units | 604 | 1,901 |
| Median Property Value | $322,000 | $403,800 |
| Median Household Income | $83,774 | $313 |
| Monthly Housing Costs | $583 | $91 |
| Real Estate Taxes | $2,415 | $69 |
Property Value by Mortgage Status in Belgrade
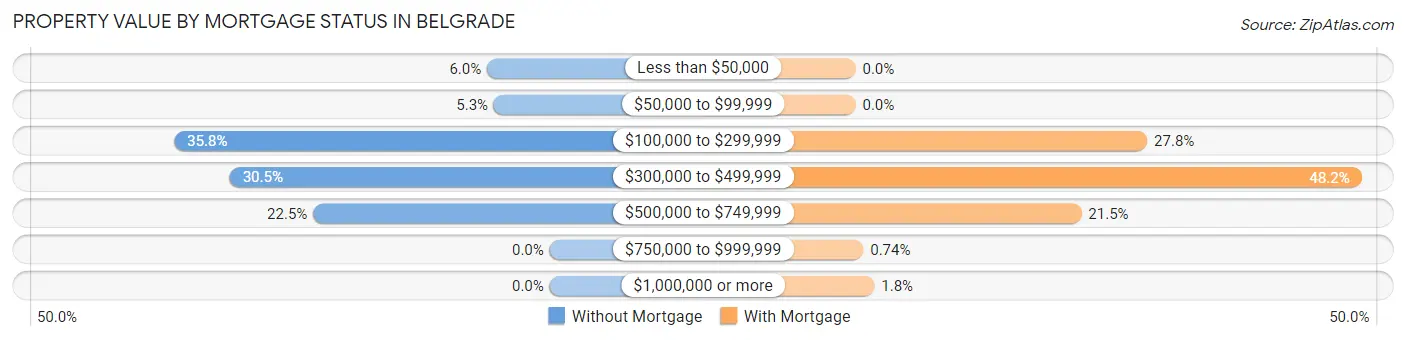
| Property Value | Without Mortgage | With Mortgage |
| Less than $50,000 | 36 (6.0%) | 0 (0.0%) |
| $50,000 to $99,999 | 32 (5.3%) | 0 (0.0%) |
| $100,000 to $299,999 | 216 (35.8%) | 528 (27.8%) |
| $300,000 to $499,999 | 184 (30.5%) | 916 (48.2%) |
| $500,000 to $749,999 | 136 (22.5%) | 409 (21.5%) |
| $750,000 to $999,999 | 0 (0.0%) | 14 (0.7%) |
| $1,000,000 or more | 0 (0.0%) | 34 (1.8%) |
| Total | 604 (100.0%) | 1,901 (100.0%) |
Household Income by Mortgage Status in Belgrade
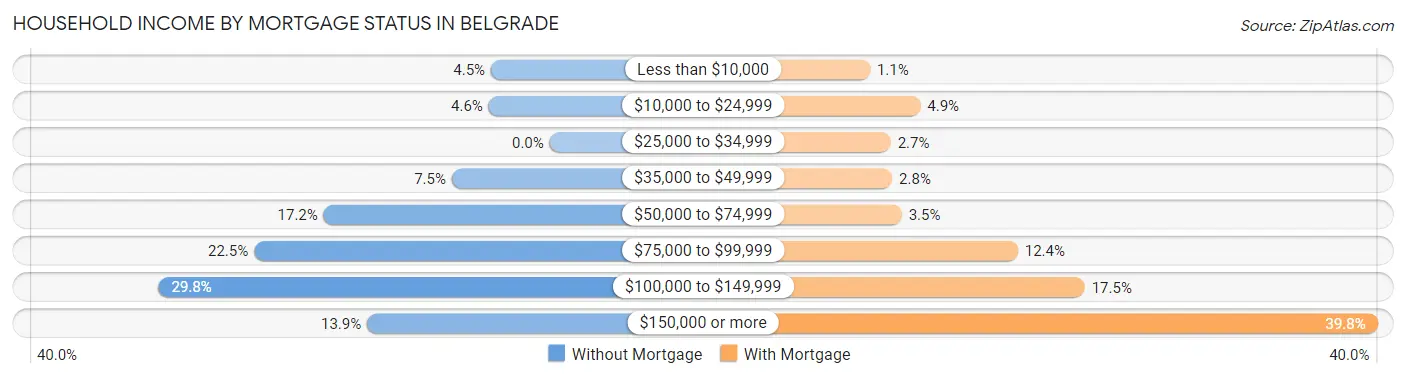
| Household Income | Without Mortgage | With Mortgage |
| Less than $10,000 | 27 (4.5%) | 21 (1.1%) |
| $10,000 to $24,999 | 28 (4.6%) | 94 (4.9%) |
| $25,000 to $34,999 | 0 (0.0%) | 51 (2.7%) |
| $35,000 to $49,999 | 45 (7.4%) | 53 (2.8%) |
| $50,000 to $74,999 | 104 (17.2%) | 67 (3.5%) |
| $75,000 to $99,999 | 136 (22.5%) | 235 (12.4%) |
| $100,000 to $149,999 | 180 (29.8%) | 332 (17.5%) |
| $150,000 or more | 84 (13.9%) | 756 (39.8%) |
| Total | 604 (100.0%) | 1,901 (100.0%) |
Property Value to Household Income Ratio in Belgrade
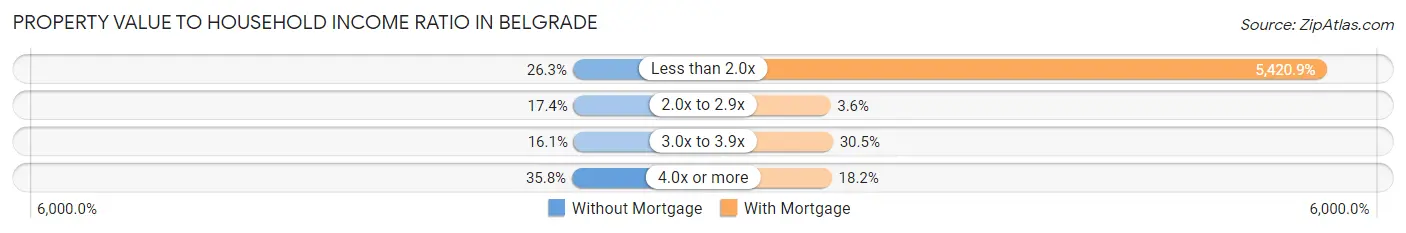
| Value-to-Income Ratio | Without Mortgage | With Mortgage |
| Less than 2.0x | 159 (26.3%) | 103,052 (5,420.9%) |
| 2.0x to 2.9x | 105 (17.4%) | 69 (3.6%) |
| 3.0x to 3.9x | 97 (16.1%) | 579 (30.5%) |
| 4.0x or more | 216 (35.8%) | 345 (18.1%) |
| Total | 604 (100.0%) | 1,901 (100.0%) |
Real Estate Taxes by Mortgage Status in Belgrade
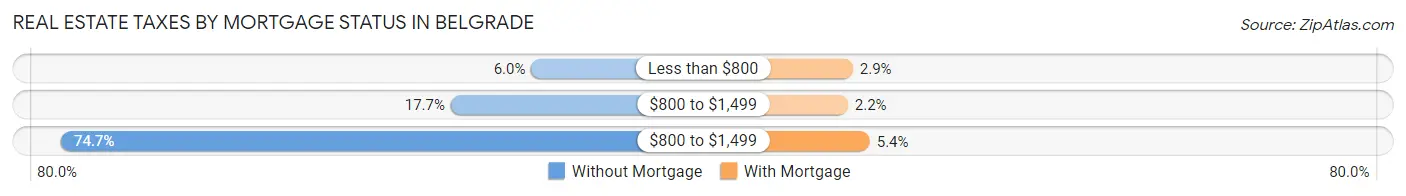
| Property Taxes | Without Mortgage | With Mortgage |
| Less than $800 | 36 (6.0%) | 55 (2.9%) |
| $800 to $1,499 | 107 (17.7%) | 41 (2.2%) |
| $800 to $1,499 | 451 (74.7%) | 102 (5.4%) |
| Total | 604 (100.0%) | 1,901 (100.0%) |
Health & Disability in Belgrade
Health Insurance Coverage by Age in Belgrade
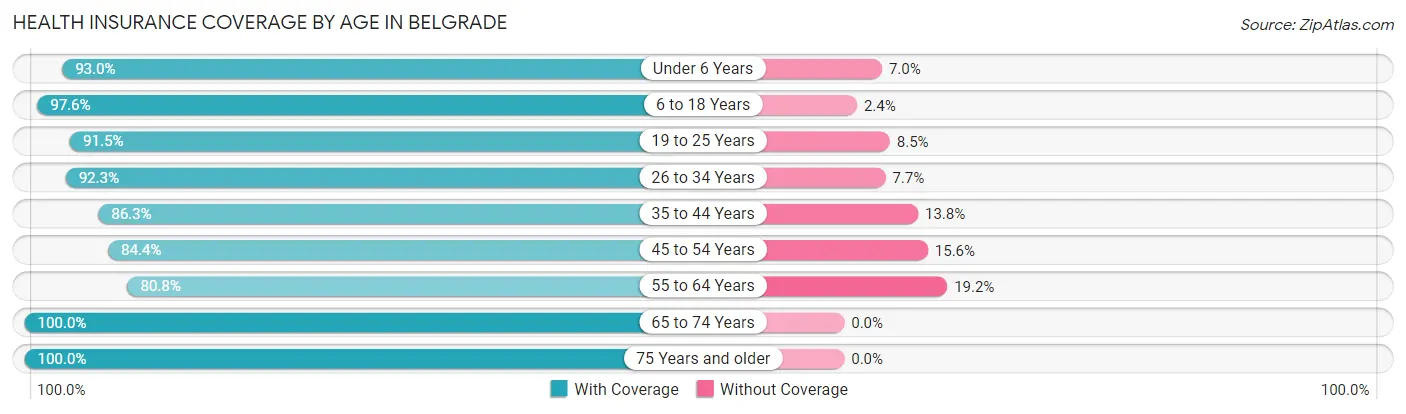
| Age Bracket | With Coverage | Without Coverage |
| Under 6 Years | 1,007 (93.0%) | 76 (7.0%) |
| 6 to 18 Years | 1,894 (97.6%) | 46 (2.4%) |
| 19 to 25 Years | 807 (91.5%) | 75 (8.5%) |
| 26 to 34 Years | 1,658 (92.3%) | 138 (7.7%) |
| 35 to 44 Years | 2,026 (86.3%) | 323 (13.8%) |
| 45 to 54 Years | 802 (84.4%) | 148 (15.6%) |
| 55 to 64 Years | 1,015 (80.8%) | 241 (19.2%) |
| 65 to 74 Years | 505 (100.0%) | 0 (0.0%) |
| 75 Years and older | 158 (100.0%) | 0 (0.0%) |
| Total | 9,872 (90.4%) | 1,047 (9.6%) |
Health Insurance Coverage by Citizenship Status in Belgrade
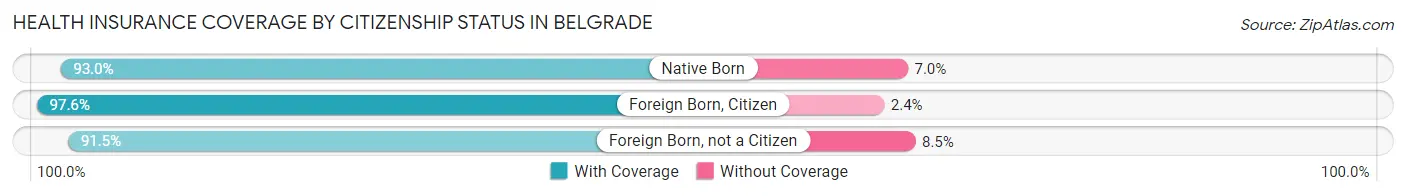
| Citizenship Status | With Coverage | Without Coverage |
| Native Born | 1,007 (93.0%) | 76 (7.0%) |
| Foreign Born, Citizen | 1,894 (97.6%) | 46 (2.4%) |
| Foreign Born, not a Citizen | 807 (91.5%) | 75 (8.5%) |
Health Insurance Coverage by Household Income in Belgrade
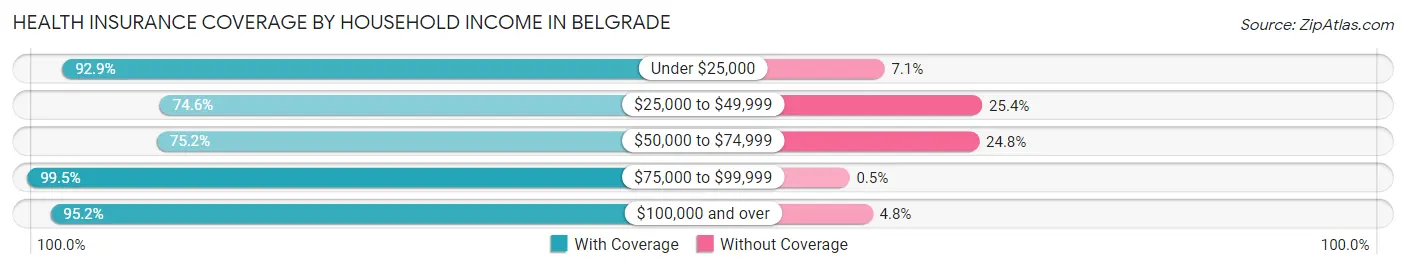
| Household Income | With Coverage | Without Coverage |
| Under $25,000 | 579 (92.9%) | 44 (7.1%) |
| $25,000 to $49,999 | 1,260 (74.6%) | 428 (25.4%) |
| $50,000 to $74,999 | 980 (75.2%) | 323 (24.8%) |
| $75,000 to $99,999 | 2,381 (99.5%) | 12 (0.5%) |
| $100,000 and over | 4,654 (95.2%) | 236 (4.8%) |
Public vs Private Health Insurance Coverage by Age in Belgrade
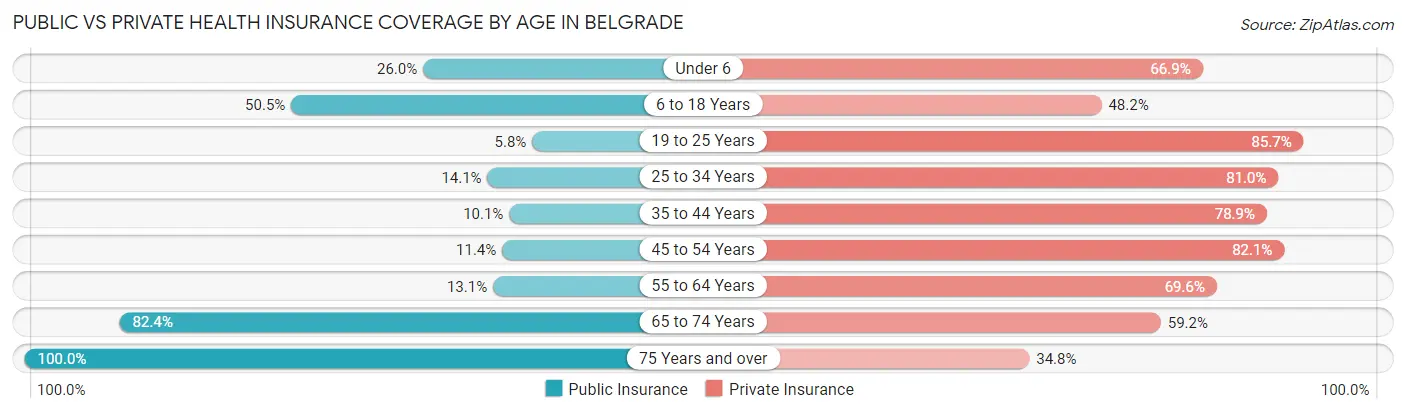
| Age Bracket | Public Insurance | Private Insurance |
| Under 6 | 282 (26.0%) | 725 (66.9%) |
| 6 to 18 Years | 980 (50.5%) | 935 (48.2%) |
| 19 to 25 Years | 51 (5.8%) | 756 (85.7%) |
| 25 to 34 Years | 253 (14.1%) | 1,455 (81.0%) |
| 35 to 44 Years | 236 (10.1%) | 1,853 (78.9%) |
| 45 to 54 Years | 108 (11.4%) | 780 (82.1%) |
| 55 to 64 Years | 164 (13.1%) | 874 (69.6%) |
| 65 to 74 Years | 416 (82.4%) | 299 (59.2%) |
| 75 Years and over | 158 (100.0%) | 55 (34.8%) |
| Total | 2,648 (24.2%) | 7,732 (70.8%) |
Disability Status by Sex by Age in Belgrade
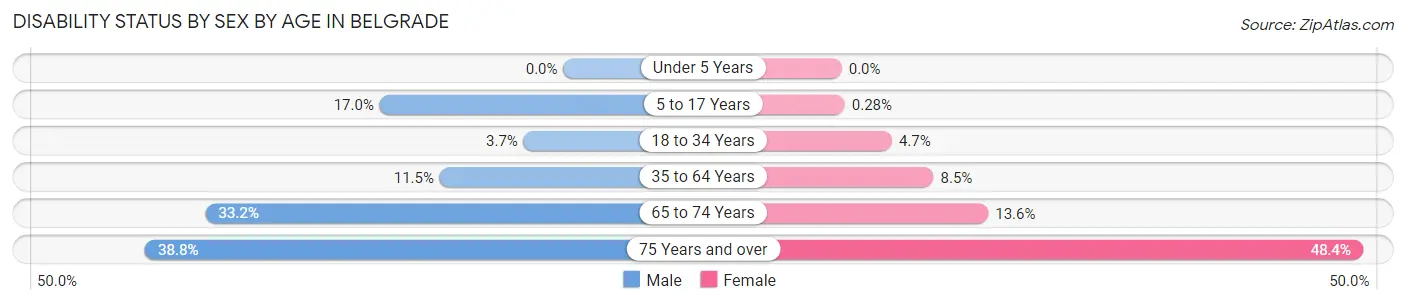
| Age Bracket | Male | Female |
| Under 5 Years | 0 (0.0%) | 0 (0.0%) |
| 5 to 17 Years | 159 (17.0%) | 3 (0.3%) |
| 18 to 34 Years | 52 (3.7%) | 64 (4.7%) |
| 35 to 64 Years | 268 (11.5%) | 189 (8.5%) |
| 65 to 74 Years | 92 (33.2%) | 31 (13.6%) |
| 75 Years and over | 26 (38.8%) | 44 (48.3%) |
Disability Class by Sex by Age in Belgrade
Disability Class: Hearing Difficulty
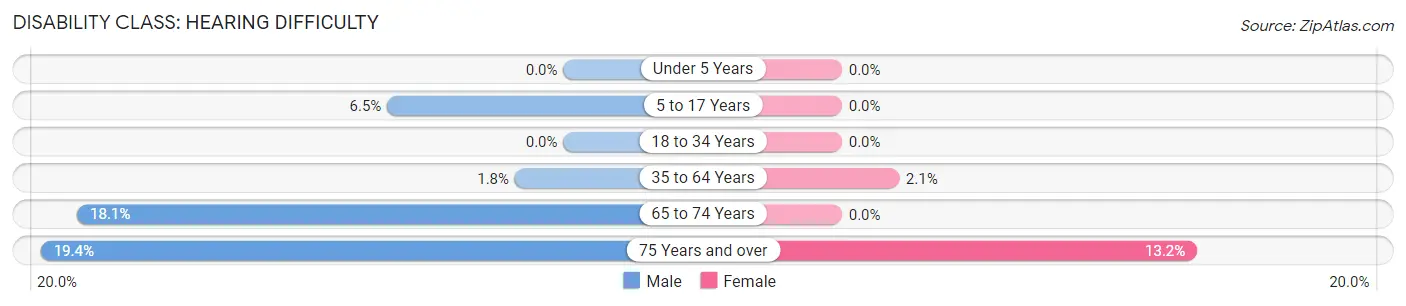
| Age Bracket | Male | Female |
| Under 5 Years | 0 (0.0%) | 0 (0.0%) |
| 5 to 17 Years | 61 (6.5%) | 0 (0.0%) |
| 18 to 34 Years | 0 (0.0%) | 0 (0.0%) |
| 35 to 64 Years | 42 (1.8%) | 47 (2.1%) |
| 65 to 74 Years | 50 (18.0%) | 0 (0.0%) |
| 75 Years and over | 13 (19.4%) | 12 (13.2%) |
Disability Class: Vision Difficulty
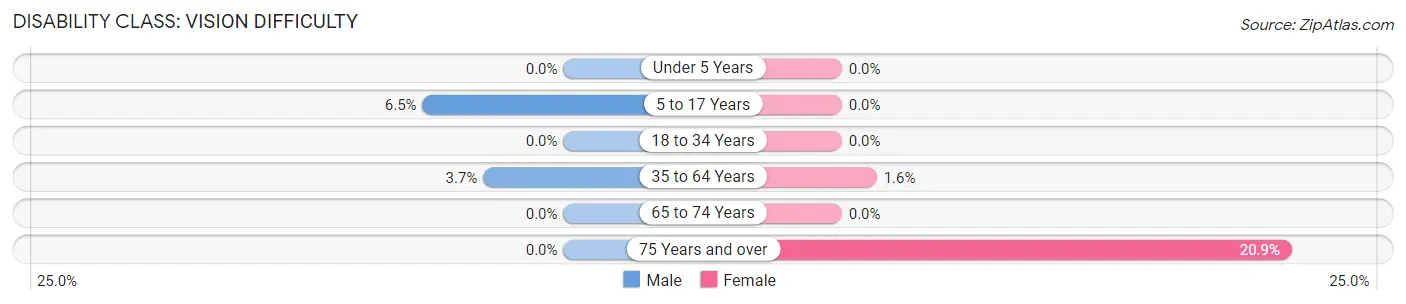
| Age Bracket | Male | Female |
| Under 5 Years | 0 (0.0%) | 0 (0.0%) |
| 5 to 17 Years | 61 (6.5%) | 0 (0.0%) |
| 18 to 34 Years | 0 (0.0%) | 0 (0.0%) |
| 35 to 64 Years | 87 (3.7%) | 36 (1.6%) |
| 65 to 74 Years | 0 (0.0%) | 0 (0.0%) |
| 75 Years and over | 0 (0.0%) | 19 (20.9%) |
Disability Class: Cognitive Difficulty
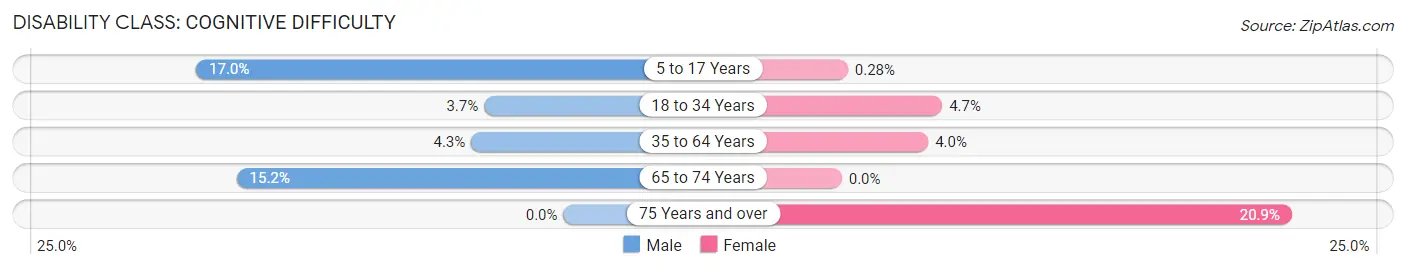
| Age Bracket | Male | Female |
| 5 to 17 Years | 159 (17.0%) | 3 (0.3%) |
| 18 to 34 Years | 52 (3.7%) | 64 (4.7%) |
| 35 to 64 Years | 100 (4.3%) | 89 (4.0%) |
| 65 to 74 Years | 42 (15.2%) | 0 (0.0%) |
| 75 Years and over | 0 (0.0%) | 19 (20.9%) |
Disability Class: Ambulatory Difficulty
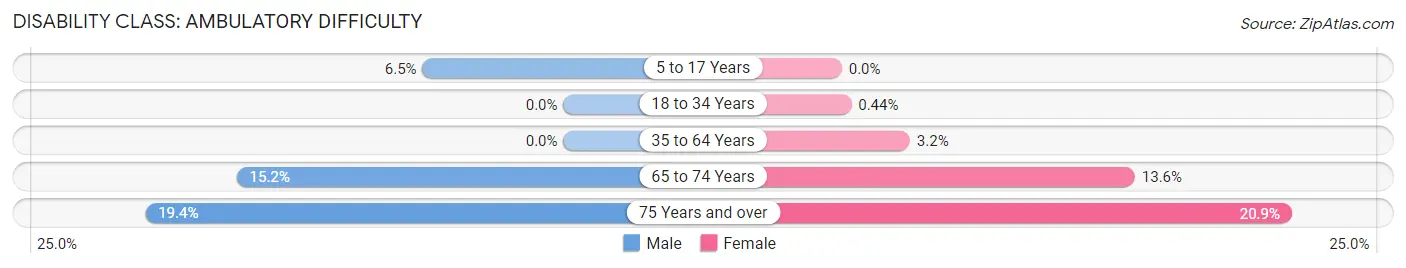
| Age Bracket | Male | Female |
| 5 to 17 Years | 61 (6.5%) | 0 (0.0%) |
| 18 to 34 Years | 0 (0.0%) | 6 (0.4%) |
| 35 to 64 Years | 0 (0.0%) | 70 (3.2%) |
| 65 to 74 Years | 42 (15.2%) | 31 (13.6%) |
| 75 Years and over | 13 (19.4%) | 19 (20.9%) |
Disability Class: Self-Care Difficulty
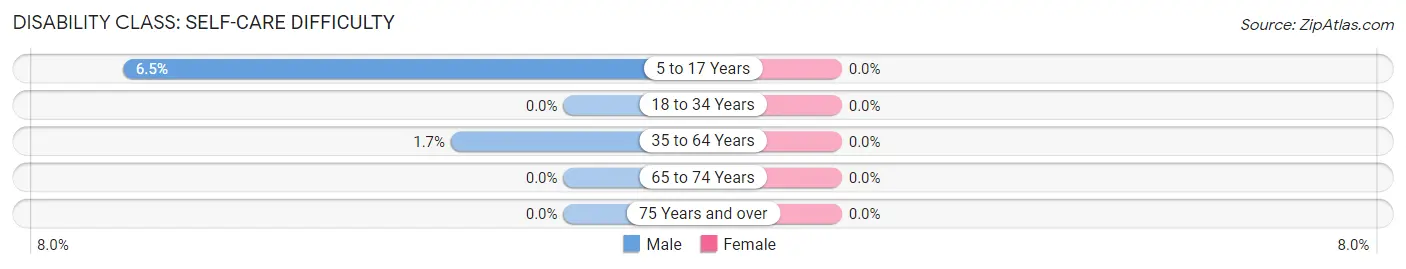
| Age Bracket | Male | Female |
| 5 to 17 Years | 61 (6.5%) | 0 (0.0%) |
| 18 to 34 Years | 0 (0.0%) | 0 (0.0%) |
| 35 to 64 Years | 39 (1.7%) | 0 (0.0%) |
| 65 to 74 Years | 0 (0.0%) | 0 (0.0%) |
| 75 Years and over | 0 (0.0%) | 0 (0.0%) |
Technology Access in Belgrade
Computing Device Access in Belgrade
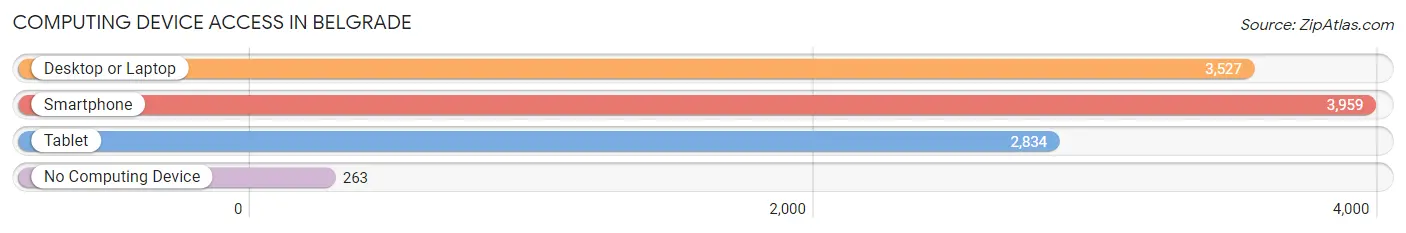
| Device Type | # Households | % Households |
| Desktop or Laptop | 3,527 | 80.1% |
| Smartphone | 3,959 | 89.9% |
| Tablet | 2,834 | 64.4% |
| No Computing Device | 263 | 6.0% |
| Total | 4,402 | 100.0% |
Internet Access in Belgrade
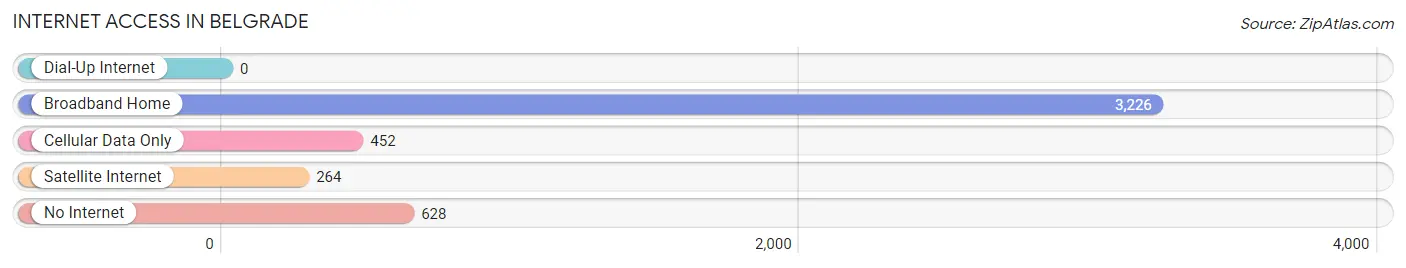
| Internet Type | # Households | % Households |
| Dial-Up Internet | 0 | 0.0% |
| Broadband Home | 3,226 | 73.3% |
| Cellular Data Only | 452 | 10.3% |
| Satellite Internet | 264 | 6.0% |
| No Internet | 628 | 14.3% |
| Total | 4,402 | 100.0% |
Belgrade Summary
History
The city of Belgrade, Montana is located in the Gallatin Valley, just north of the city of Bozeman. The area was first inhabited by the Salish and Kootenai tribes, who were later joined by the Crow and Blackfeet tribes. The first European settlers arrived in the area in the early 1800s, and the town of Belgrade was officially founded in 1881.
The town was named after Belgrade, Serbia, which was the hometown of one of the first settlers, John J. Bielenberg. The town quickly grew, and by the early 1900s, it had become a major agricultural center, with a population of over 1,000 people.
The town continued to grow throughout the 20th century, and by the year 2000, it had a population of over 5,000 people. The town is now a popular destination for tourists, and it is home to a variety of businesses, including a number of wineries, breweries, and distilleries.
Geography
Belgrade is located in the Gallatin Valley, which is part of the larger Yellowstone River Valley. The city is situated at an elevation of 4,400 feet, and it is surrounded by the Bridger, Gallatin, and Madison mountain ranges. The city is located just north of the city of Bozeman, and it is about an hour’s drive from Yellowstone National Park.
The city is located in a semi-arid climate, with hot summers and cold winters. The average annual temperature is around 45 degrees Fahrenheit, and the average annual precipitation is around 15 inches.
Economy
Belgrade’s economy is largely based on agriculture and tourism. The city is home to a number of wineries, breweries, and distilleries, and it is also home to a number of agricultural businesses, including cattle ranches, hay farms, and vegetable farms.
The city is also home to a number of manufacturing businesses, including a number of food processing plants. The city is also home to a number of retail businesses, including a number of antique stores, clothing stores, and gift shops.
Demographics
As of the year 2000, the population of Belgrade was 5,072 people. The population was made up of a variety of ethnic and racial backgrounds, including White (90.2%), Native American (3.2%), African American (1.2%), Asian (1.1%), and Hispanic (2.3%).
The median household income in Belgrade was $37,941, and the median family income was $45,941. The median age of the population was 33.7 years, and the median home value was $127,000.
Conclusion
Belgrade, Montana is a small city located in the Gallatin Valley, just north of the city of Bozeman. The city has a long history, and it has grown to become a popular destination for tourists. The city’s economy is largely based on agriculture and tourism, and it is home to a variety of businesses, including wineries, breweries, and distilleries. The population of Belgrade is made up of a variety of ethnic and racial backgrounds, and the median household income is $37,941.
Common Questions
What is Per Capita Income in Belgrade?
Per Capita income in Belgrade is $42,094.
What is the Median Family Income in Belgrade?
Median Family Income in Belgrade is $101,736.
What is the Median Household income in Belgrade?
Median Household Income in Belgrade is $82,769.
What is Income or Wage Gap in Belgrade?
Income or Wage Gap in Belgrade is 27.0%.
Women in Belgrade earn 73.0 cents for every dollar earned by a man.
What is Inequality or Gini Index in Belgrade?
Inequality or Gini Index in Belgrade is 0.45.
What is the Total Population of Belgrade?
Total Population of Belgrade is 10,941.
What is the Total Male Population of Belgrade?
Total Male Population of Belgrade is 5,388.
What is the Total Female Population of Belgrade?
Total Female Population of Belgrade is 5,553.
What is the Ratio of Males per 100 Females in Belgrade?
There are 97.03 Males per 100 Females in Belgrade.
What is the Ratio of Females per 100 Males in Belgrade?
There are 103.06 Females per 100 Males in Belgrade.
What is the Median Population Age in Belgrade?
Median Population Age in Belgrade is 33.4 Years.
What is the Average Family Size in Belgrade
Average Family Size in Belgrade is 3.3 People.
What is the Average Household Size in Belgrade
Average Household Size in Belgrade is 2.5 People.
How Large is the Labor Force in Belgrade?
There are 6,594 People in the Labor Forcein in Belgrade.
What is the Percentage of People in the Labor Force in Belgrade?
77.6% of People are in the Labor Force in Belgrade.
What is the Unemployment Rate in Belgrade?
Unemployment Rate in Belgrade is 1.2%.