Colstrip, MT Map & Demographics
Colstrip Map
Colstrip Overview
$40,380
PER CAPITA INCOME
$110,110
AVG FAMILY INCOME
$87,321
AVG HOUSEHOLD INCOME
48.5%
WAGE / INCOME GAP [ % ]
51.5¢/ $1
WAGE / INCOME GAP [ $ ]
0.38
INEQUALITY / GINI INDEX
2,327
TOTAL POPULATION
1,161
MALE POPULATION
1,166
FEMALE POPULATION
99.57
MALES / 100 FEMALES
100.43
FEMALES / 100 MALES
41.8
MEDIAN AGE
3.2
AVG FAMILY SIZE
2.5
AVG HOUSEHOLD SIZE
1,229
LABOR FORCE [ PEOPLE ]
70.7%
PERCENT IN LABOR FORCE
5.0%
UNEMPLOYMENT RATE
Colstrip Zip Codes
Colstrip Area Codes
Income in Colstrip
Income Overview in Colstrip
Per Capita Income in Colstrip is $40,380, while median incomes of families and households are $110,110 and $87,321 respectively.
| Characteristic | Number | Measure |
| Per Capita Income | 2,327 | $40,380 |
| Median Family Income | 593 | $110,110 |
| Mean Family Income | 593 | $108,918 |
| Median Household Income | 941 | $87,321 |
| Mean Household Income | 941 | $93,118 |
| Income Deficit | 593 | $0 |
| Wage / Income Gap (%) | 2,327 | 48.46% |
| Wage / Income Gap ($) | 2,327 | 51.54¢ per $1 |
| Gini / Inequality Index | 2,327 | 0.38 |
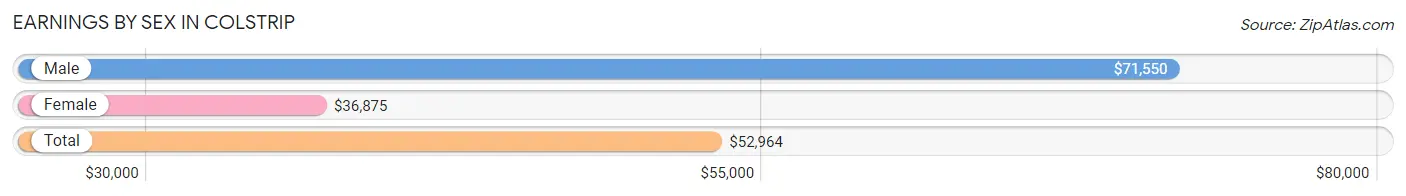
Earnings by Sex in Colstrip
Average Earnings in Colstrip are $52,964, $71,550 for men and $36,875 for women, a difference of 48.5%.
| Sex | Number | Average Earnings |
| Male | 683 (54.8%) | $71,550 |
| Female | 564 (45.2%) | $36,875 |
| Total | 1,247 (100.0%) | $52,964 |
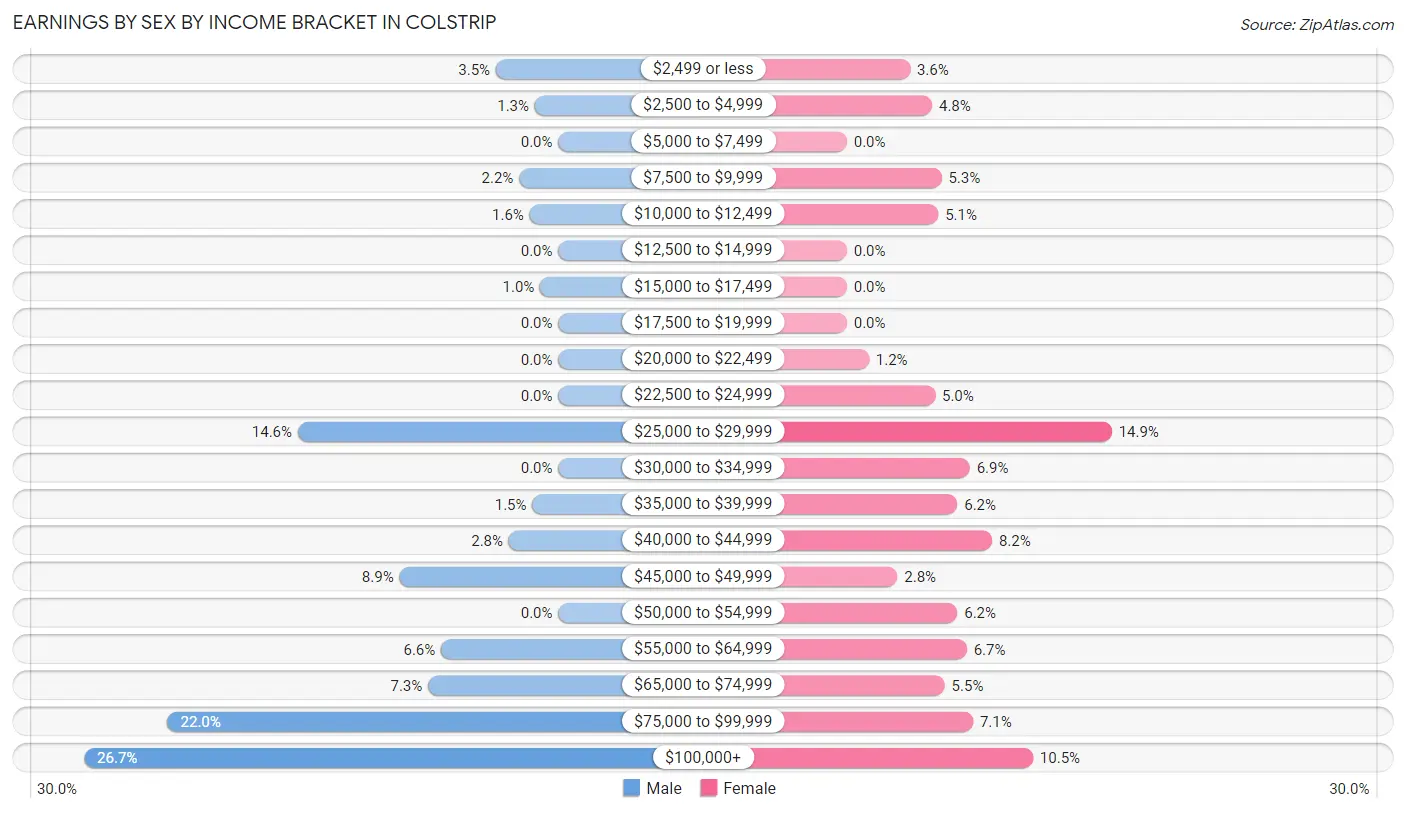
Earnings by Sex by Income Bracket in Colstrip
The most common earnings brackets in Colstrip are $100,000+ for men (182 | 26.7%) and $25,000 to $29,999 for women (84 | 14.9%).
| Income | Male | Female |
| $2,499 or less | 24 (3.5%) | 20 (3.5%) |
| $2,500 to $4,999 | 9 (1.3%) | 27 (4.8%) |
| $5,000 to $7,499 | 0 (0.0%) | 0 (0.0%) |
| $7,500 to $9,999 | 15 (2.2%) | 30 (5.3%) |
| $10,000 to $12,499 | 11 (1.6%) | 29 (5.1%) |
| $12,500 to $14,999 | 0 (0.0%) | 0 (0.0%) |
| $15,000 to $17,499 | 7 (1.0%) | 0 (0.0%) |
| $17,500 to $19,999 | 0 (0.0%) | 0 (0.0%) |
| $20,000 to $22,499 | 0 (0.0%) | 7 (1.2%) |
| $22,500 to $24,999 | 0 (0.0%) | 28 (5.0%) |
| $25,000 to $29,999 | 100 (14.6%) | 84 (14.9%) |
| $30,000 to $34,999 | 0 (0.0%) | 39 (6.9%) |
| $35,000 to $39,999 | 10 (1.5%) | 35 (6.2%) |
| $40,000 to $44,999 | 19 (2.8%) | 46 (8.2%) |
| $45,000 to $49,999 | 61 (8.9%) | 16 (2.8%) |
| $50,000 to $54,999 | 0 (0.0%) | 35 (6.2%) |
| $55,000 to $64,999 | 45 (6.6%) | 38 (6.7%) |
| $65,000 to $74,999 | 50 (7.3%) | 31 (5.5%) |
| $75,000 to $99,999 | 150 (22.0%) | 40 (7.1%) |
| $100,000+ | 182 (26.7%) | 59 (10.5%) |
| Total | 683 (100.0%) | 564 (100.0%) |
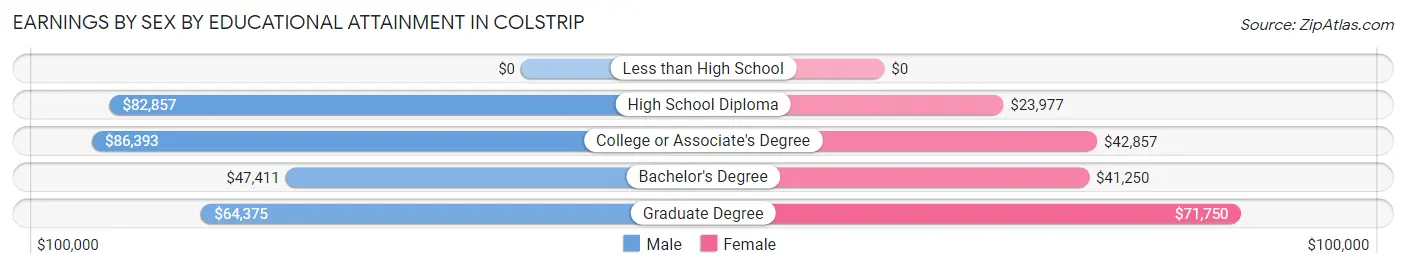
Earnings by Sex by Educational Attainment in Colstrip
Average earnings in Colstrip are $81,923 for men and $42,596 for women, a difference of 48.0%. Men with an educational attainment of college or associate's degree enjoy the highest average annual earnings of $86,393, while those with bachelor's degree education earn the least with $47,411. Women with an educational attainment of graduate degree earn the most with the average annual earnings of $71,750, while those with high school diploma education have the smallest earnings of $23,977.
| Educational Attainment | Male Income | Female Income |
| Less than High School | - | - |
| High School Diploma | $82,857 | $23,977 |
| College or Associate's Degree | $86,393 | $42,857 |
| Bachelor's Degree | $47,411 | $41,250 |
| Graduate Degree | $64,375 | $71,750 |
| Total | $81,923 | $42,596 |
Family Income in Colstrip
Family Income Brackets in Colstrip
According to the Colstrip family income data, there are 204 families falling into the $100,000 to $149,999 income range, which is the most common income bracket and makes up 34.4% of all families.
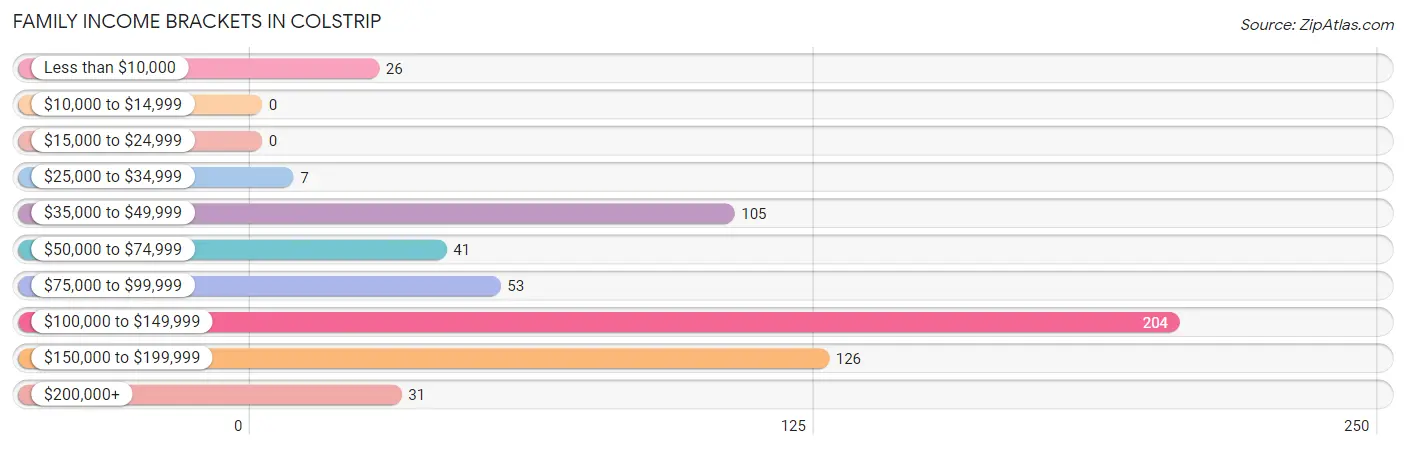
| Income Bracket | # Families | % Families |
| Less than $10,000 | 26 | 4.4% |
| $10,000 to $14,999 | 0 | 0.0% |
| $15,000 to $24,999 | 0 | 0.0% |
| $25,000 to $34,999 | 7 | 1.2% |
| $35,000 to $49,999 | 105 | 17.7% |
| $50,000 to $74,999 | 41 | 6.9% |
| $75,000 to $99,999 | 53 | 8.9% |
| $100,000 to $149,999 | 204 | 34.4% |
| $150,000 to $199,999 | 126 | 21.2% |
| $200,000+ | 31 | 5.2% |
Family Income by Famaliy Size in Colstrip
3-person families (151 | 25.5%) account for the highest median family income in Colstrip with $145,982 per family, while 3-person families (151 | 25.5%) have the highest median income of $48,661 per family member.
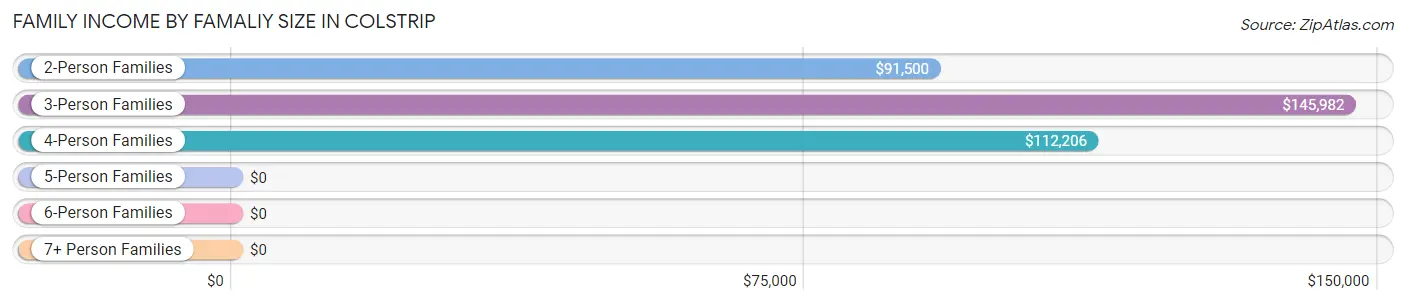
| Income Bracket | # Families | Median Income |
| 2-Person Families | 244 (41.1%) | $91,500 |
| 3-Person Families | 151 (25.5%) | $145,982 |
| 4-Person Families | 120 (20.2%) | $112,206 |
| 5-Person Families | 52 (8.8%) | $0 |
| 6-Person Families | 0 (0.0%) | $0 |
| 7+ Person Families | 26 (4.4%) | $0 |
| Total | 593 (100.0%) | $110,110 |
Family Income by Number of Earners in Colstrip
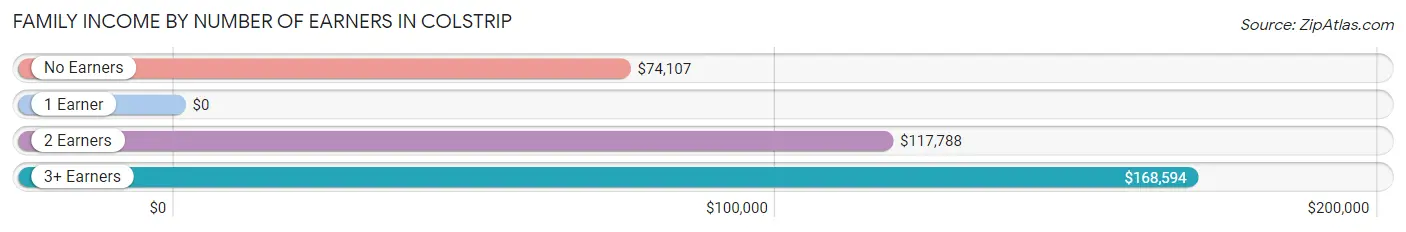
| Number of Earners | # Families | Median Income |
| No Earners | 115 (19.4%) | $74,107 |
| 1 Earner | 146 (24.6%) | $0 |
| 2 Earners | 251 (42.3%) | $117,788 |
| 3+ Earners | 81 (13.7%) | $168,594 |
| Total | 593 (100.0%) | $110,110 |
Household Income in Colstrip
Household Income Brackets in Colstrip
With 228 households falling in the category, the $100,000 to $149,999 income range is the most frequent in Colstrip, accounting for 24.2% of all households.
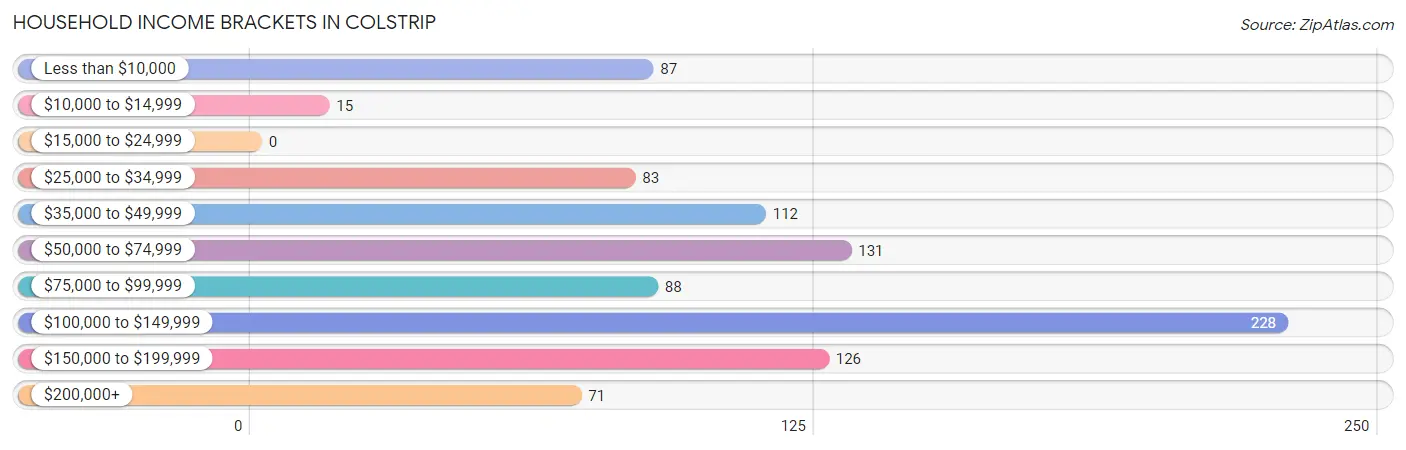
| Income Bracket | # Households | % Households |
| Less than $10,000 | 87 | 9.2% |
| $10,000 to $14,999 | 15 | 1.6% |
| $15,000 to $24,999 | 0 | 0.0% |
| $25,000 to $34,999 | 83 | 8.8% |
| $35,000 to $49,999 | 112 | 11.9% |
| $50,000 to $74,999 | 131 | 13.9% |
| $75,000 to $99,999 | 88 | 9.4% |
| $100,000 to $149,999 | 228 | 24.2% |
| $150,000 to $199,999 | 126 | 13.4% |
| $200,000+ | 71 | 7.5% |
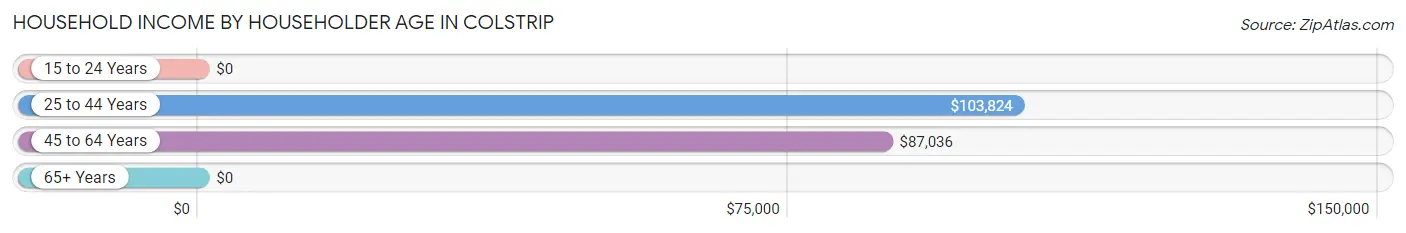
Household Income by Householder Age in Colstrip
The median household income in Colstrip is $87,321, with the highest median household income of $103,824 found in the 25 to 44 years age bracket for the primary householder. A total of 336 households (35.7%) fall into this category.
| Income Bracket | # Households | Median Income |
| 15 to 24 Years | 0 (0.0%) | $0 |
| 25 to 44 Years | 336 (35.7%) | $103,824 |
| 45 to 64 Years | 457 (48.6%) | $87,036 |
| 65+ Years | 148 (15.7%) | $0 |
| Total | 941 (100.0%) | $87,321 |
Poverty in Colstrip
Income Below Poverty by Sex and Age in Colstrip
With 5.5% poverty level for males and 9.7% for females among the residents of Colstrip, 75 year old and over males and 12 to 14 year old females are the most vulnerable to poverty, with 36 males (100.0%) and 28 females (26.4%) in their respective age groups living below the poverty level.
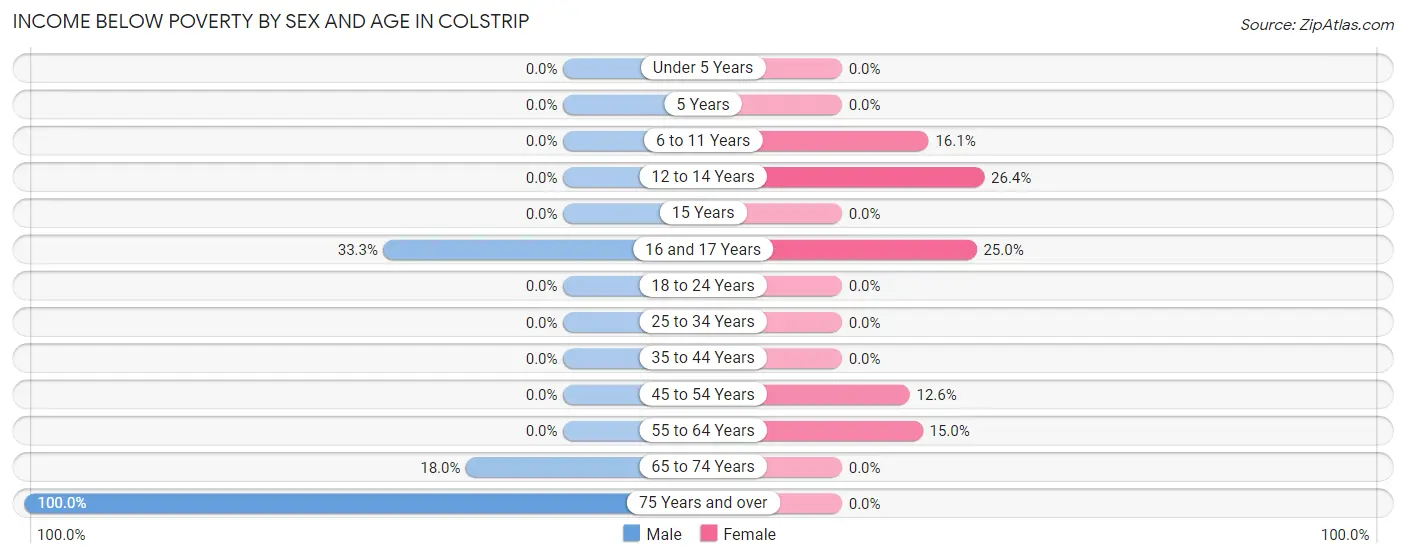
| Age Bracket | Male | Female |
| Under 5 Years | 0 (0.0%) | 0 (0.0%) |
| 5 Years | 0 (0.0%) | 0 (0.0%) |
| 6 to 11 Years | 0 (0.0%) | 14 (16.1%) |
| 12 to 14 Years | 0 (0.0%) | 28 (26.4%) |
| 15 Years | 0 (0.0%) | 0 (0.0%) |
| 16 and 17 Years | 8 (33.3%) | 20 (25.0%) |
| 18 to 24 Years | 0 (0.0%) | 0 (0.0%) |
| 25 to 34 Years | 0 (0.0%) | 0 (0.0%) |
| 35 to 44 Years | 0 (0.0%) | 0 (0.0%) |
| 45 to 54 Years | 0 (0.0%) | 20 (12.6%) |
| 55 to 64 Years | 0 (0.0%) | 31 (15.0%) |
| 65 to 74 Years | 20 (18.0%) | 0 (0.0%) |
| 75 Years and over | 36 (100.0%) | 0 (0.0%) |
| Total | 64 (5.5%) | 113 (9.7%) |
Income Above Poverty by Sex and Age in Colstrip
According to the poverty statistics in Colstrip, males aged under 5 years and females aged under 5 years are the age groups that are most secure financially, with 100.0% of males and 100.0% of females in these age groups living above the poverty line.
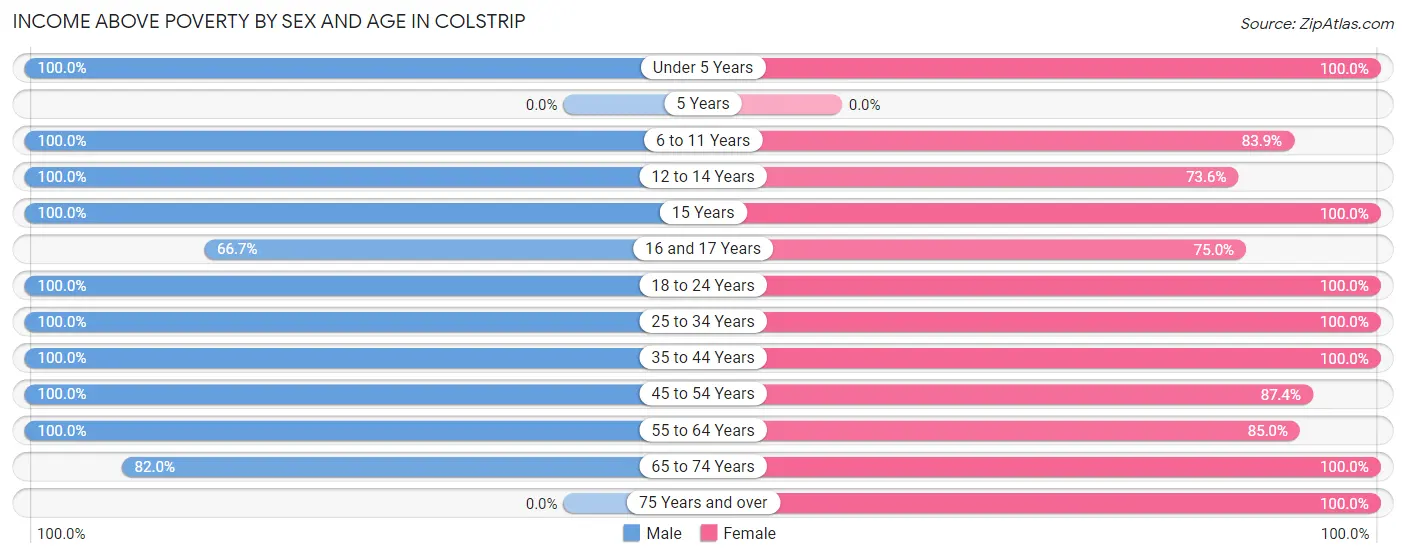
| Age Bracket | Male | Female |
| Under 5 Years | 84 (100.0%) | 76 (100.0%) |
| 5 Years | 0 (0.0%) | 0 (0.0%) |
| 6 to 11 Years | 136 (100.0%) | 73 (83.9%) |
| 12 to 14 Years | 84 (100.0%) | 78 (73.6%) |
| 15 Years | 8 (100.0%) | 7 (100.0%) |
| 16 and 17 Years | 16 (66.7%) | 60 (75.0%) |
| 18 to 24 Years | 15 (100.0%) | 73 (100.0%) |
| 25 to 34 Years | 48 (100.0%) | 58 (100.0%) |
| 35 to 44 Years | 158 (100.0%) | 240 (100.0%) |
| 45 to 54 Years | 208 (100.0%) | 139 (87.4%) |
| 55 to 64 Years | 249 (100.0%) | 176 (85.0%) |
| 65 to 74 Years | 91 (82.0%) | 54 (100.0%) |
| 75 Years and over | 0 (0.0%) | 18 (100.0%) |
| Total | 1,097 (94.5%) | 1,052 (90.3%) |
Income Below Poverty Among Married-Couple Families in Colstrip
The poverty statistics for married-couple families in Colstrip show that 1.1% or 6 of the total 523 families live below the poverty line. Families with no children have the highest poverty rate of 2.2%, comprising of 6 families. On the other hand, families with 1 or 2 children have the lowest poverty rate of 0.0%, which includes 0 families.
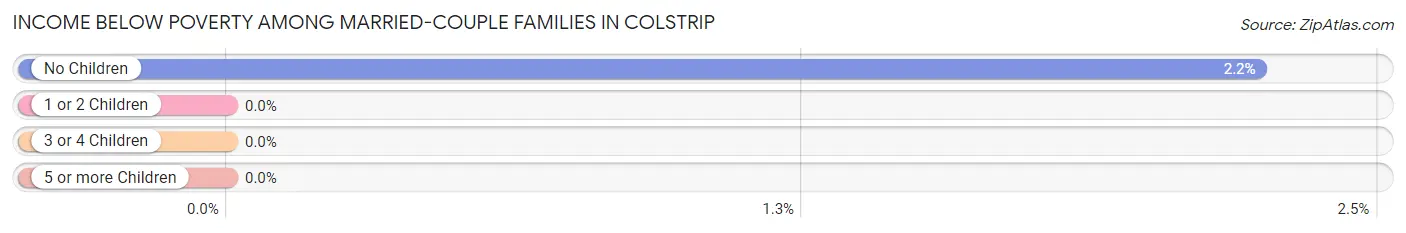
| Children | Above Poverty | Below Poverty |
| No Children | 262 (97.8%) | 6 (2.2%) |
| 1 or 2 Children | 197 (100.0%) | 0 (0.0%) |
| 3 or 4 Children | 32 (100.0%) | 0 (0.0%) |
| 5 or more Children | 26 (100.0%) | 0 (0.0%) |
| Total | 517 (98.9%) | 6 (1.1%) |
Income Below Poverty Among Single-Parent Households in Colstrip
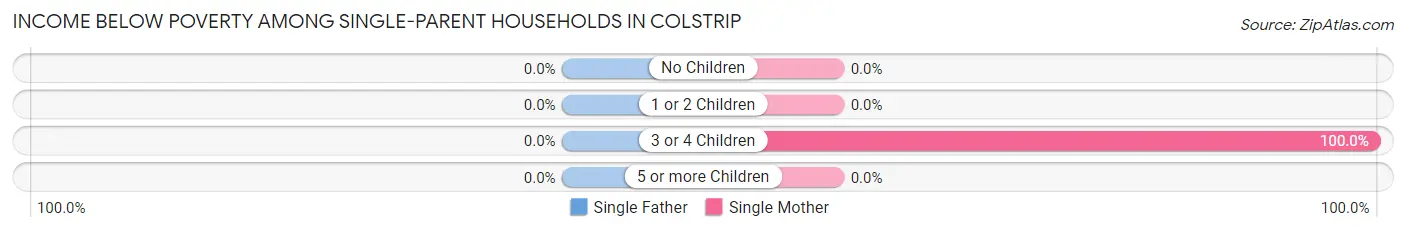
| Children | Single Father | Single Mother |
| No Children | 0 (0.0%) | 0 (0.0%) |
| 1 or 2 Children | 0 (0.0%) | 0 (0.0%) |
| 3 or 4 Children | 0 (0.0%) | 20 (100.0%) |
| 5 or more Children | 0 (0.0%) | 0 (0.0%) |
| Total | 0 (0.0%) | 20 (40.8%) |
Income Below Poverty Among Married-Couple vs Single-Parent Households in Colstrip
The poverty data for Colstrip shows that 6 of the married-couple family households (1.1%) and 20 of the single-parent households (28.6%) are living below the poverty level. Within the married-couple family households, those with no children have the highest poverty rate, with 6 households (2.2%) falling below the poverty line. Among the single-parent households, those with 3 or 4 children have the highest poverty rate, with 20 household (74.1%) living below poverty.
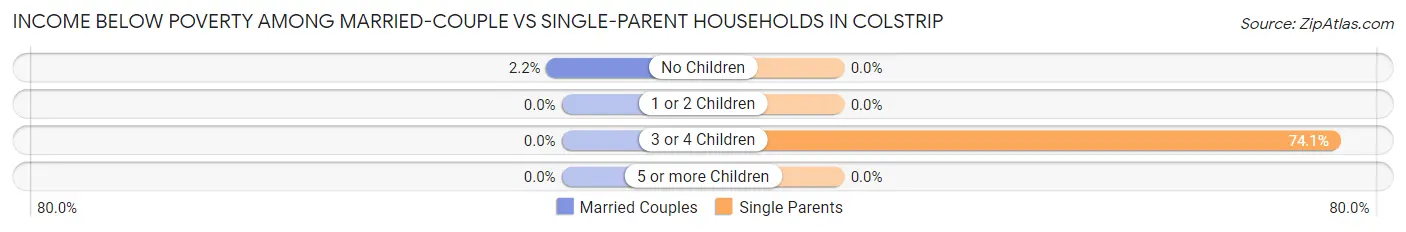
| Children | Married-Couple Families | Single-Parent Households |
| No Children | 6 (2.2%) | 0 (0.0%) |
| 1 or 2 Children | 0 (0.0%) | 0 (0.0%) |
| 3 or 4 Children | 0 (0.0%) | 20 (74.1%) |
| 5 or more Children | 0 (0.0%) | 0 (0.0%) |
| Total | 6 (1.1%) | 20 (28.6%) |
Race in Colstrip
The most populous races in Colstrip are White / Caucasian (1,799 | 77.3%), Native / Alaskan (300 | 12.9%), and Hispanic or Latino (253 | 10.9%).
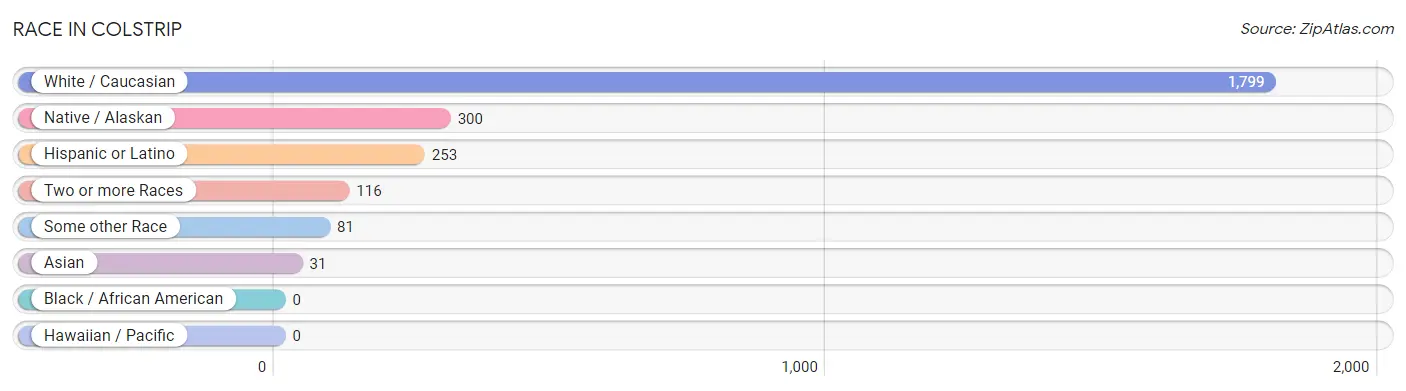
| Race | # Population | % Population |
| Asian | 31 | 1.3% |
| Black / African American | 0 | 0.0% |
| Hawaiian / Pacific | 0 | 0.0% |
| Hispanic or Latino | 253 | 10.9% |
| Native / Alaskan | 300 | 12.9% |
| White / Caucasian | 1,799 | 77.3% |
| Two or more Races | 116 | 5.0% |
| Some other Race | 81 | 3.5% |
| Total | 2,327 | 100.0% |
Ancestry in Colstrip
The most populous ancestries reported in Colstrip are German (459 | 19.7%), English (382 | 16.4%), Norwegian (288 | 12.4%), Irish (279 | 12.0%), and Mexican (253 | 10.9%), together accounting for 71.4% of all Colstrip residents.
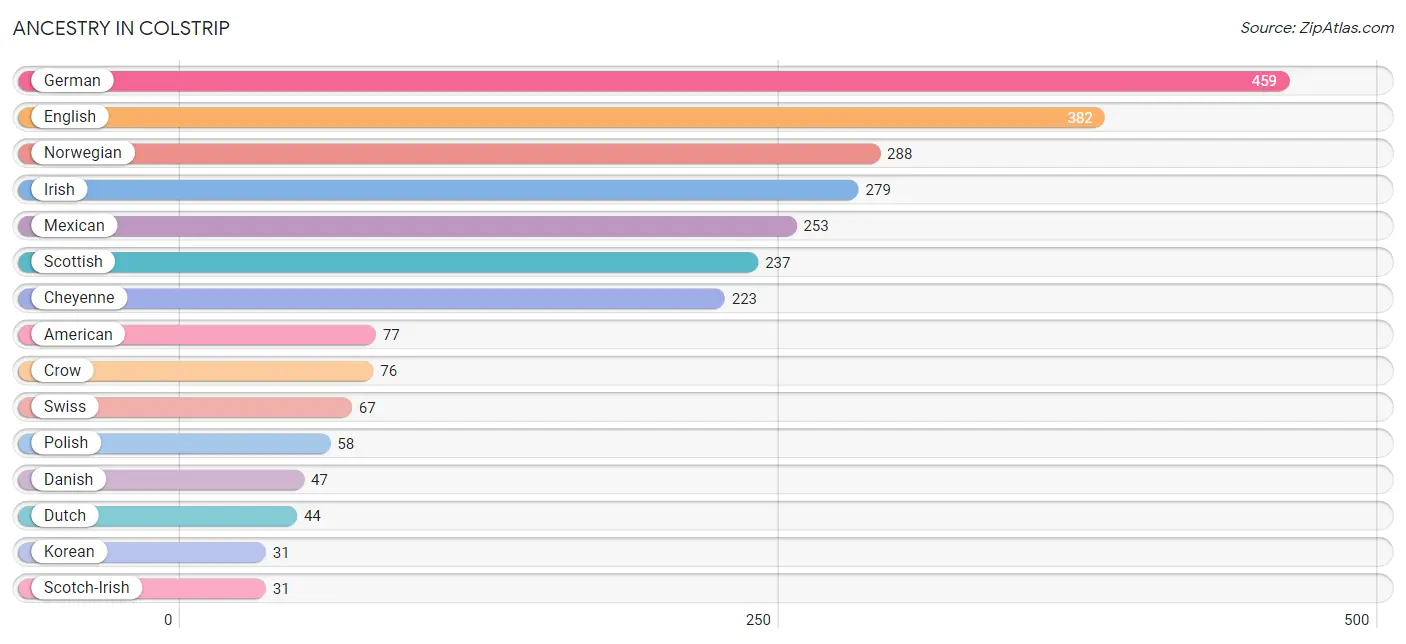
| Ancestry | # Population | % Population |
| American | 77 | 3.3% |
| Belgian | 7 | 0.3% |
| Blackfeet | 1 | 0.0% |
| Cheyenne | 223 | 9.6% |
| Chippewa | 14 | 0.6% |
| Creek | 13 | 0.6% |
| Croatian | 8 | 0.3% |
| Crow | 76 | 3.3% |
| Danish | 47 | 2.0% |
| Dutch | 44 | 1.9% |
| English | 382 | 16.4% |
| Finnish | 8 | 0.3% |
| French | 11 | 0.5% |
| French Canadian | 21 | 0.9% |
| German | 459 | 19.7% |
| German Russian | 19 | 0.8% |
| Irish | 279 | 12.0% |
| Italian | 29 | 1.3% |
| Korean | 31 | 1.3% |
| Mexican | 253 | 10.9% |
| Norwegian | 288 | 12.4% |
| Polish | 58 | 2.5% |
| Scotch-Irish | 31 | 1.3% |
| Scottish | 237 | 10.2% |
| Sioux | 21 | 0.9% |
| Slavic | 24 | 1.0% |
| Swiss | 67 | 2.9% |
| Welsh | 17 | 0.7% | View All 28 Rows |
Immigrants in Colstrip
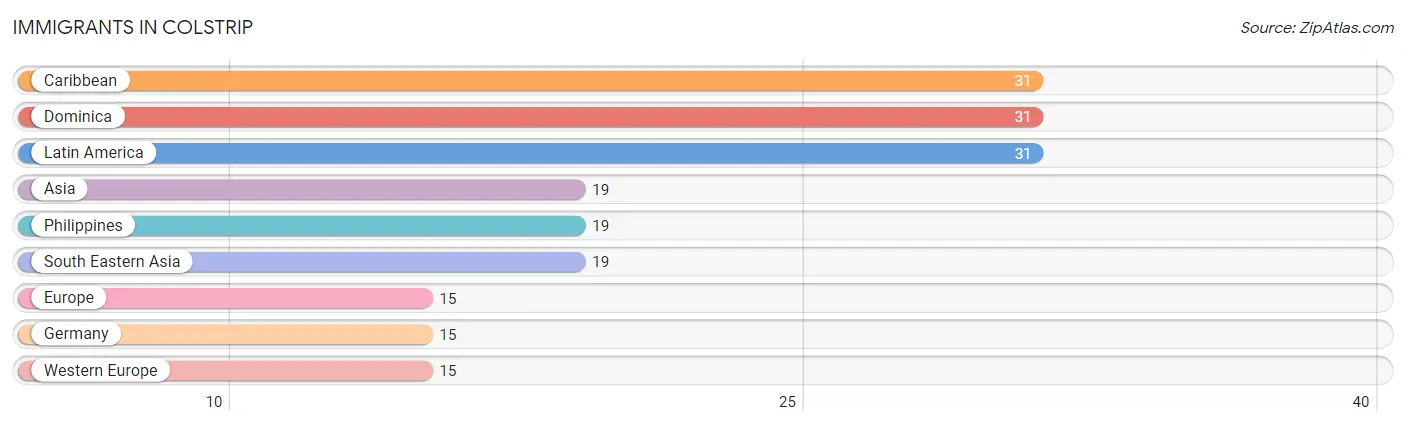
The most numerous immigrant groups reported in Colstrip came from Caribbean (31 | 1.3%), Dominica (31 | 1.3%), Latin America (31 | 1.3%), Asia (19 | 0.8%), and Philippines (19 | 0.8%), together accounting for 5.6% of all Colstrip residents.
| Immigration Origin | # Population | % Population |
| Asia | 19 | 0.8% |
| Caribbean | 31 | 1.3% |
| Dominica | 31 | 1.3% |
| Europe | 15 | 0.6% |
| Germany | 15 | 0.6% |
| Latin America | 31 | 1.3% |
| Philippines | 19 | 0.8% |
| South Eastern Asia | 19 | 0.8% |
| Western Europe | 15 | 0.6% | View All 9 Rows |
Sex and Age in Colstrip
Sex and Age in Colstrip
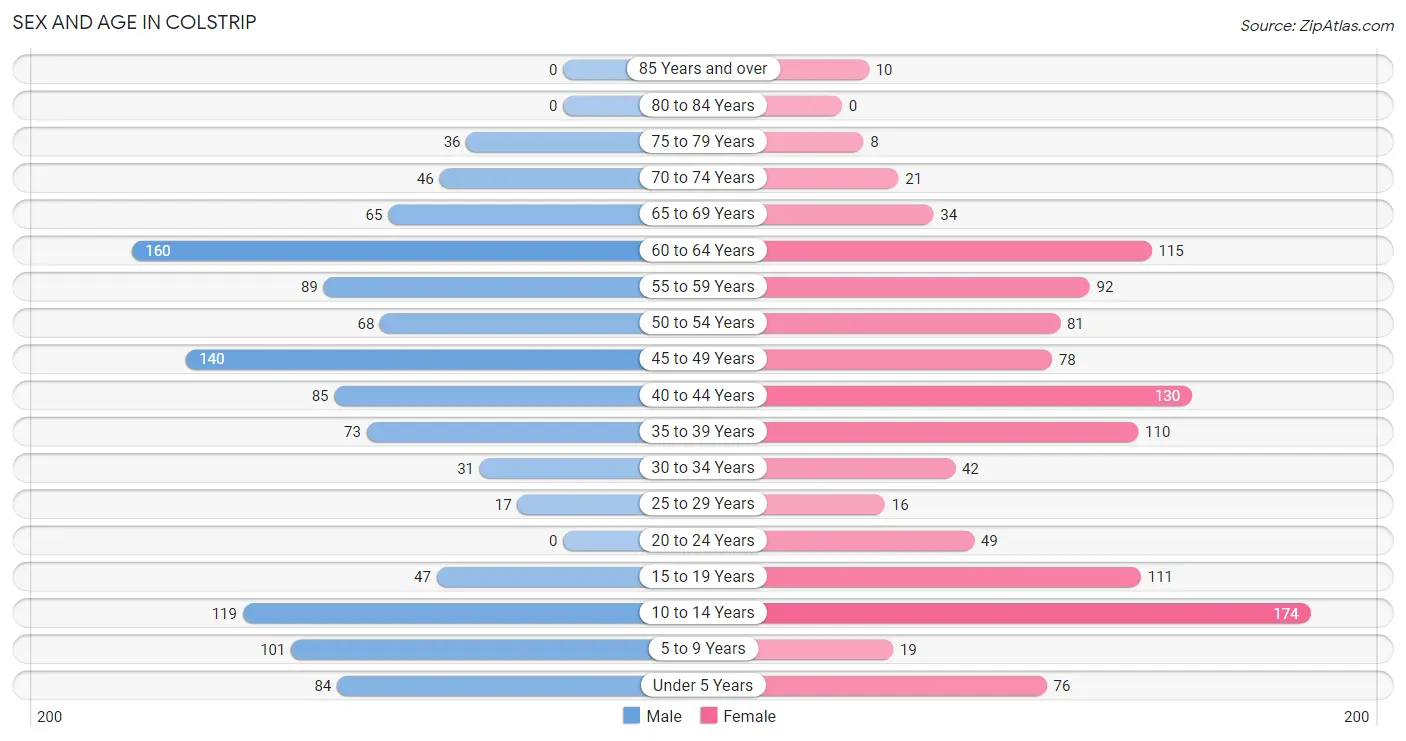
The most populous age groups in Colstrip are 60 to 64 Years (160 | 13.8%) for men and 10 to 14 Years (174 | 14.9%) for women.
| Age Bracket | Male | Female |
| Under 5 Years | 84 (7.2%) | 76 (6.5%) |
| 5 to 9 Years | 101 (8.7%) | 19 (1.6%) |
| 10 to 14 Years | 119 (10.2%) | 174 (14.9%) |
| 15 to 19 Years | 47 (4.1%) | 111 (9.5%) |
| 20 to 24 Years | 0 (0.0%) | 49 (4.2%) |
| 25 to 29 Years | 17 (1.5%) | 16 (1.4%) |
| 30 to 34 Years | 31 (2.7%) | 42 (3.6%) |
| 35 to 39 Years | 73 (6.3%) | 110 (9.4%) |
| 40 to 44 Years | 85 (7.3%) | 130 (11.2%) |
| 45 to 49 Years | 140 (12.1%) | 78 (6.7%) |
| 50 to 54 Years | 68 (5.9%) | 81 (7.0%) |
| 55 to 59 Years | 89 (7.7%) | 92 (7.9%) |
| 60 to 64 Years | 160 (13.8%) | 115 (9.9%) |
| 65 to 69 Years | 65 (5.6%) | 34 (2.9%) |
| 70 to 74 Years | 46 (4.0%) | 21 (1.8%) |
| 75 to 79 Years | 36 (3.1%) | 8 (0.7%) |
| 80 to 84 Years | 0 (0.0%) | 0 (0.0%) |
| 85 Years and over | 0 (0.0%) | 10 (0.9%) |
| Total | 1,161 (100.0%) | 1,166 (100.0%) |
Families and Households in Colstrip
Median Family Size in Colstrip
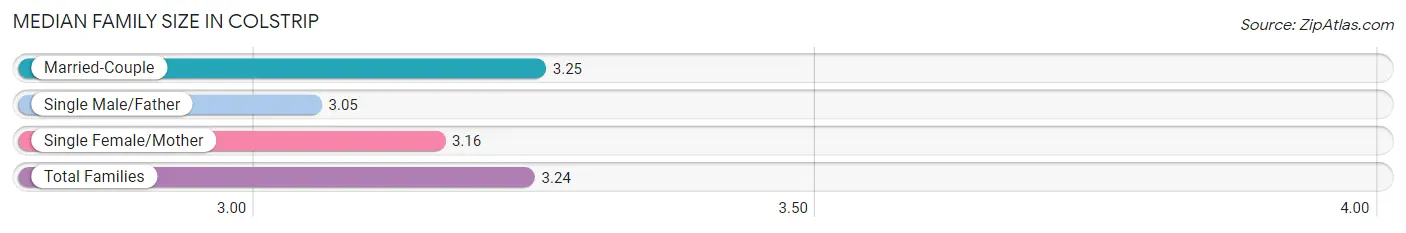
The median family size in Colstrip is 3.24 persons per family, with married-couple families (523 | 88.2%) accounting for the largest median family size of 3.25 persons per family. On the other hand, single male/father families (21 | 3.5%) represent the smallest median family size with 3.05 persons per family.
| Family Type | # Families | Family Size |
| Married-Couple | 523 (88.2%) | 3.25 |
| Single Male/Father | 21 (3.5%) | 3.05 |
| Single Female/Mother | 49 (8.3%) | 3.16 |
| Total Families | 593 (100.0%) | 3.24 |
Median Household Size in Colstrip
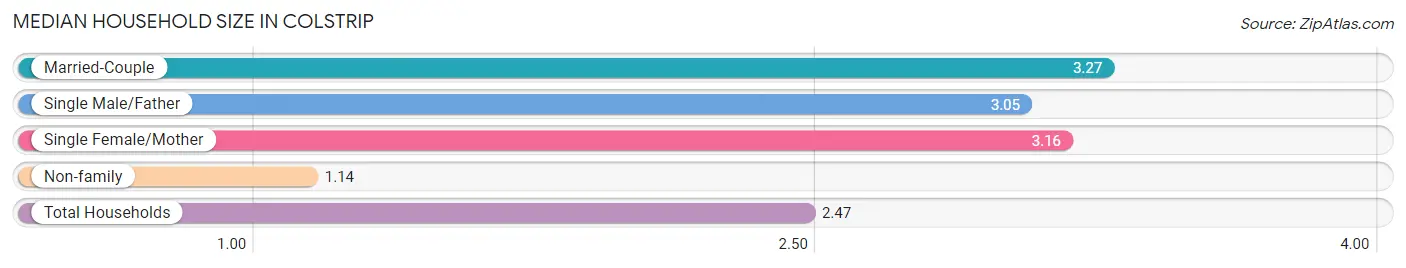
The median household size in Colstrip is 2.47 persons per household, with married-couple households (523 | 55.6%) accounting for the largest median household size of 3.27 persons per household. non-family households (348 | 37.0%) represent the smallest median household size with 1.14 persons per household.
| Household Type | # Households | Household Size |
| Married-Couple | 523 (55.6%) | 3.27 |
| Single Male/Father | 21 (2.2%) | 3.05 |
| Single Female/Mother | 49 (5.2%) | 3.16 |
| Non-family | 348 (37.0%) | 1.14 |
| Total Households | 941 (100.0%) | 2.47 |
Household Size by Marriage Status in Colstrip
Out of a total of 941 households in Colstrip, 593 (63.0%) are family households, while 348 (37.0%) are nonfamily households. The most numerous type of family households are 2-person households, comprising 244, and the most common type of nonfamily households are 1-person households, comprising 317.
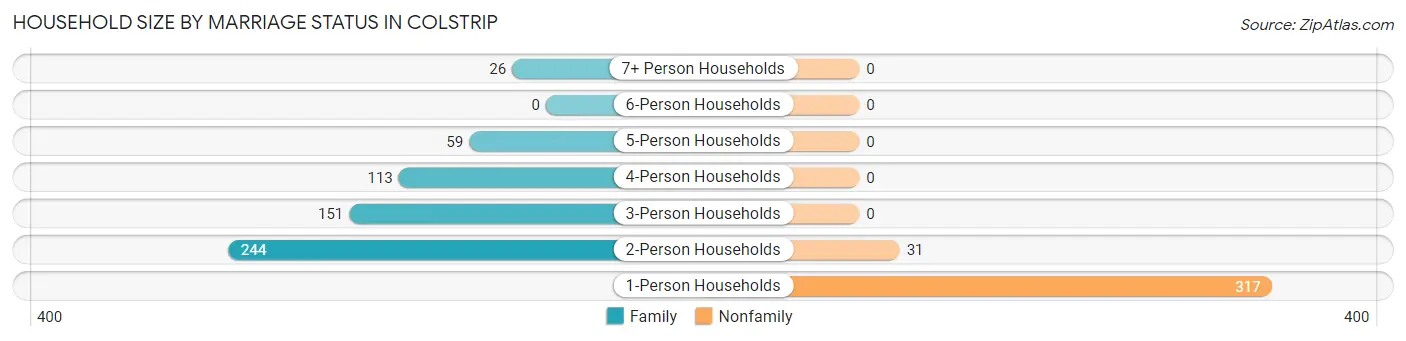
| Household Size | Family Households | Nonfamily Households |
| 1-Person Households | - | 317 (33.7%) |
| 2-Person Households | 244 (25.9%) | 31 (3.3%) |
| 3-Person Households | 151 (16.1%) | 0 (0.0%) |
| 4-Person Households | 113 (12.0%) | 0 (0.0%) |
| 5-Person Households | 59 (6.3%) | 0 (0.0%) |
| 6-Person Households | 0 (0.0%) | 0 (0.0%) |
| 7+ Person Households | 26 (2.8%) | 0 (0.0%) |
| Total | 593 (63.0%) | 348 (37.0%) |
Female Fertility in Colstrip
Fertility by Age in Colstrip
Average fertility rate in Colstrip is 40.0 births per 1,000 women. Women in the age bracket of 20 to 34 years have the highest fertility rate with 215.0 births per 1,000 women. Women in the age bracket of 20 to 34 years acount for 100.0% of all women with births.
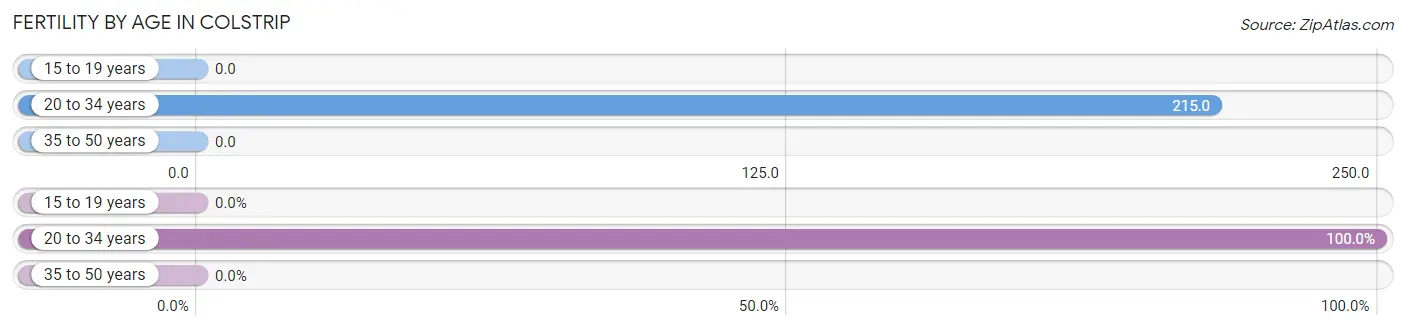
| Age Bracket | Women with Births | Births / 1,000 Women |
| 15 to 19 years | 0 (0.0%) | 0.0 |
| 20 to 34 years | 23 (100.0%) | 215.0 |
| 35 to 50 years | 0 (0.0%) | 0.0 |
| Total | 23 (100.0%) | 40.0 |
Fertility by Age by Marriage Status in Colstrip
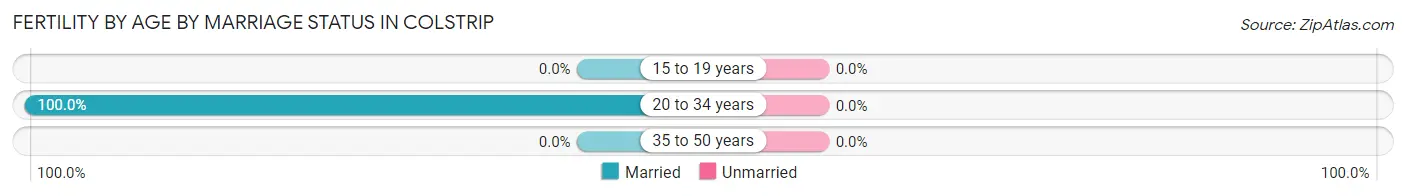
| Age Bracket | Married | Unmarried |
| 15 to 19 years | 0 (0.0%) | 0 (0.0%) |
| 20 to 34 years | 23 (100.0%) | 0 (0.0%) |
| 35 to 50 years | 0 (0.0%) | 0 (0.0%) |
| Total | 23 (100.0%) | 0 (0.0%) |
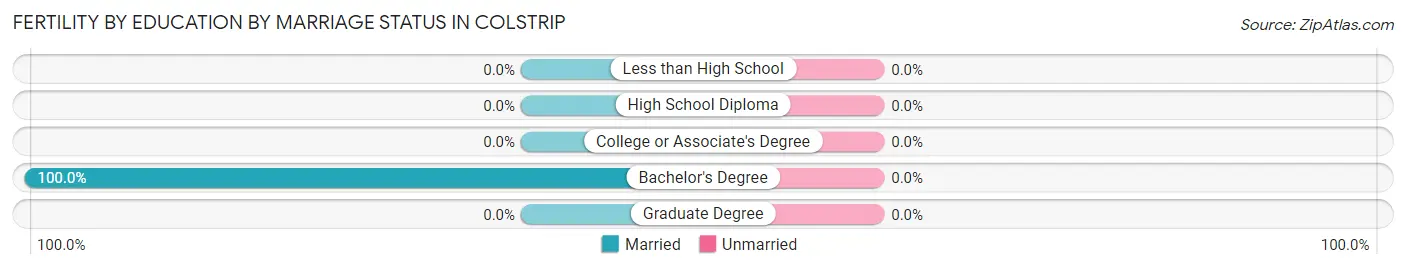
Fertility by Education in Colstrip
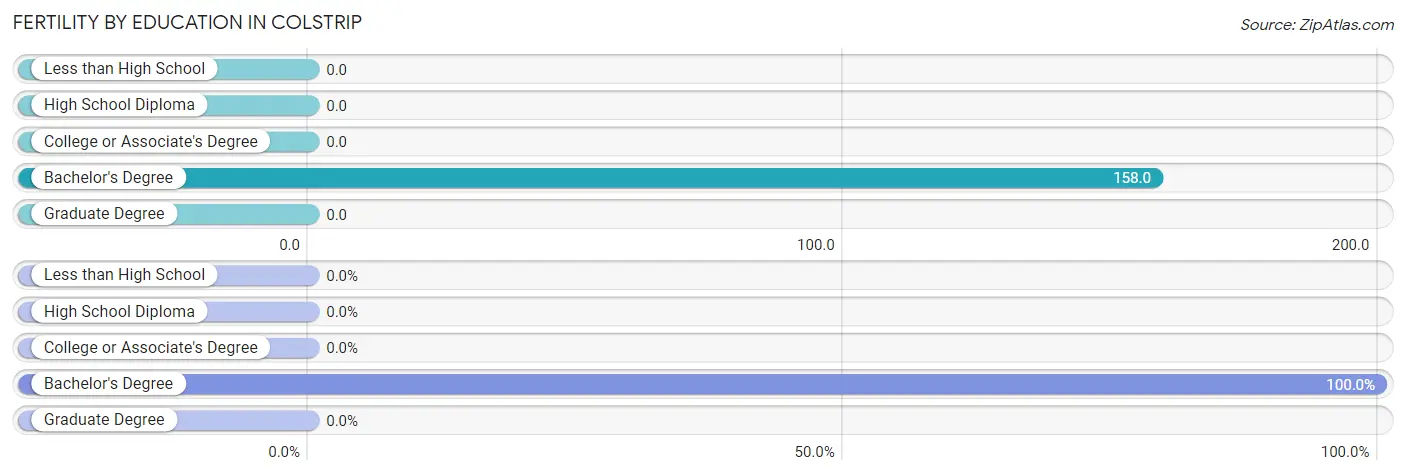
| Educational Attainment | Women with Births | Births / 1,000 Women |
| Less than High School | 0 (0.0%) | 0.0 |
| High School Diploma | 0 (0.0%) | 0.0 |
| College or Associate's Degree | 0 (0.0%) | 0.0 |
| Bachelor's Degree | 23 (100.0%) | 158.0 |
| Graduate Degree | 0 (0.0%) | 0.0 |
| Total | 23 (100.0%) | 40.0 |
Fertility by Education by Marriage Status in Colstrip
| Educational Attainment | Married | Unmarried |
| Less than High School | 0 (0.0%) | 0 (0.0%) |
| High School Diploma | 0 (0.0%) | 0 (0.0%) |
| College or Associate's Degree | 0 (0.0%) | 0 (0.0%) |
| Bachelor's Degree | 23 (100.0%) | 0 (0.0%) |
| Graduate Degree | 0 (0.0%) | 0 (0.0%) |
| Total | 23 (100.0%) | 0 (0.0%) |
Employment Characteristics in Colstrip
Employment by Class of Employer in Colstrip
Among the 1,139 employed individuals in Colstrip, private company employees (584 | 51.3%), local government employees (197 | 17.3%), and not-for-profit organizations (111 | 9.8%) make up the most common classes of employment.
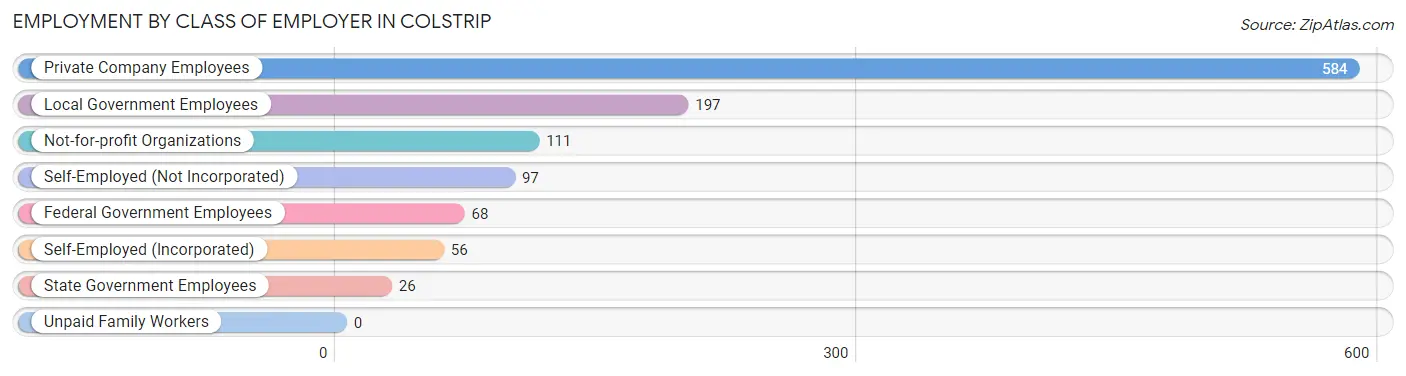
| Employer Class | # Employees | % Employees |
| Private Company Employees | 584 | 51.3% |
| Self-Employed (Incorporated) | 56 | 4.9% |
| Self-Employed (Not Incorporated) | 97 | 8.5% |
| Not-for-profit Organizations | 111 | 9.8% |
| Local Government Employees | 197 | 17.3% |
| State Government Employees | 26 | 2.3% |
| Federal Government Employees | 68 | 6.0% |
| Unpaid Family Workers | 0 | 0.0% |
| Total | 1,139 | 100.0% |
Employment Status by Age in Colstrip
According to the labor force statistics for Colstrip, out of the total population over 16 years of age (1,739), 70.7% or 1,229 individuals are in the labor force, with 5.0% or 61 of them unemployed. The age group with the highest labor force participation rate is 20 to 24 years, with 100.0% or 49 individuals in the labor force. Within the labor force, the 16 to 19 years age range has the highest percentage of unemployed individuals, with 22.4% or 15 of them being unemployed.
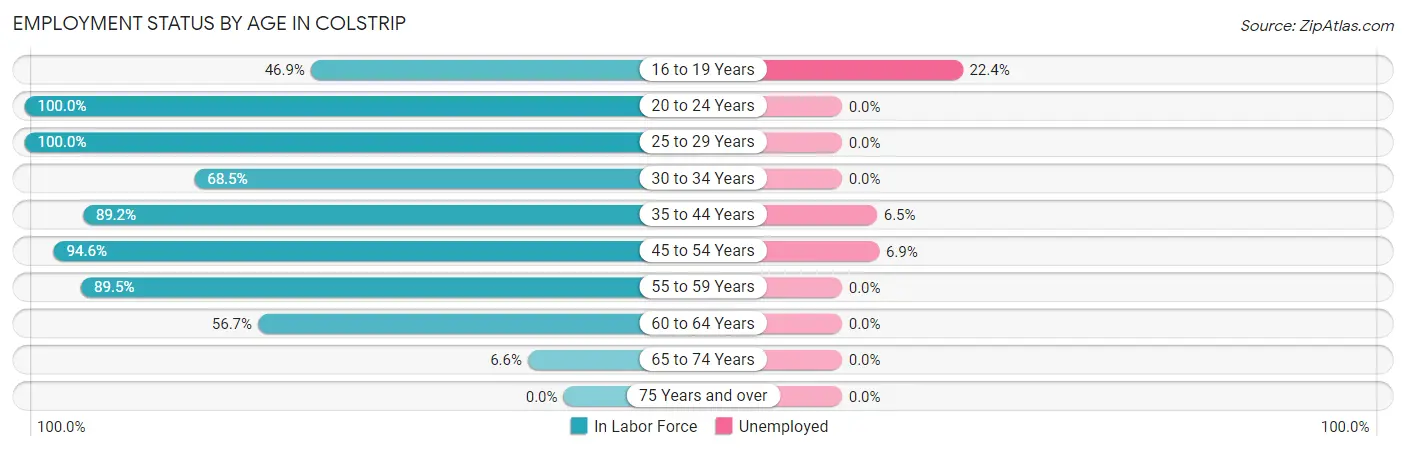
| Age Bracket | In Labor Force | Unemployed |
| 16 to 19 Years | 67 (46.9%) | 15 (22.4%) |
| 20 to 24 Years | 49 (100.0%) | 0 (0.0%) |
| 25 to 29 Years | 33 (100.0%) | 0 (0.0%) |
| 30 to 34 Years | 50 (68.5%) | 0 (0.0%) |
| 35 to 44 Years | 355 (89.2%) | 23 (6.5%) |
| 45 to 54 Years | 347 (94.6%) | 24 (6.9%) |
| 55 to 59 Years | 162 (89.5%) | 0 (0.0%) |
| 60 to 64 Years | 156 (56.7%) | 0 (0.0%) |
| 65 to 74 Years | 11 (6.6%) | 0 (0.0%) |
| 75 Years and over | 0 (0.0%) | 0 (0.0%) |
| Total | 1,229 (70.7%) | 61 (5.0%) |
Employment Status by Educational Attainment in Colstrip
According to labor force statistics for Colstrip, 83.1% of individuals (1,103) out of the total population between 25 and 64 years of age (1,327) are in the labor force, with 4.3% or 47 of them being unemployed. The group with the highest labor force participation rate are those with the educational attainment of less than high school, with 100.0% or 39 individuals in the labor force. Within the labor force, individuals with bachelor's degree or higher education have the highest percentage of unemployment, with 7.5% or 24 of them being unemployed.
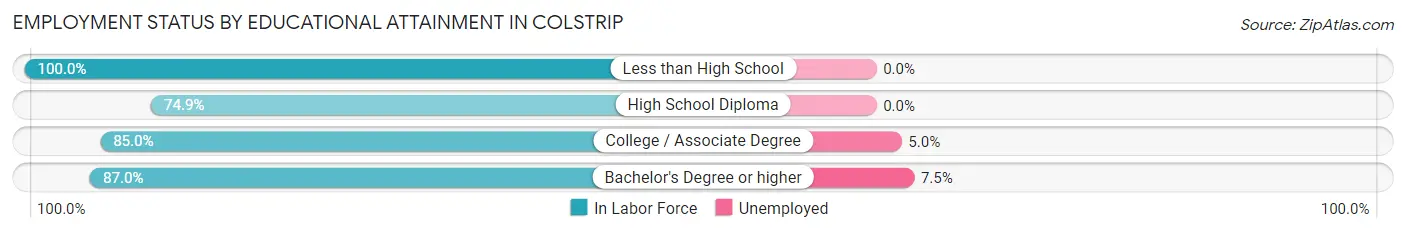
| Educational Attainment | In Labor Force | Unemployed |
| Less than High School | 39 (100.0%) | 0 (0.0%) |
| High School Diploma | 283 (74.9%) | 0 (0.0%) |
| College / Associate Degree | 459 (85.0%) | 27 (5.0%) |
| Bachelor's Degree or higher | 322 (87.0%) | 28 (7.5%) |
| Total | 1,103 (83.1%) | 57 (4.3%) |
Employment Occupations by Sex in Colstrip
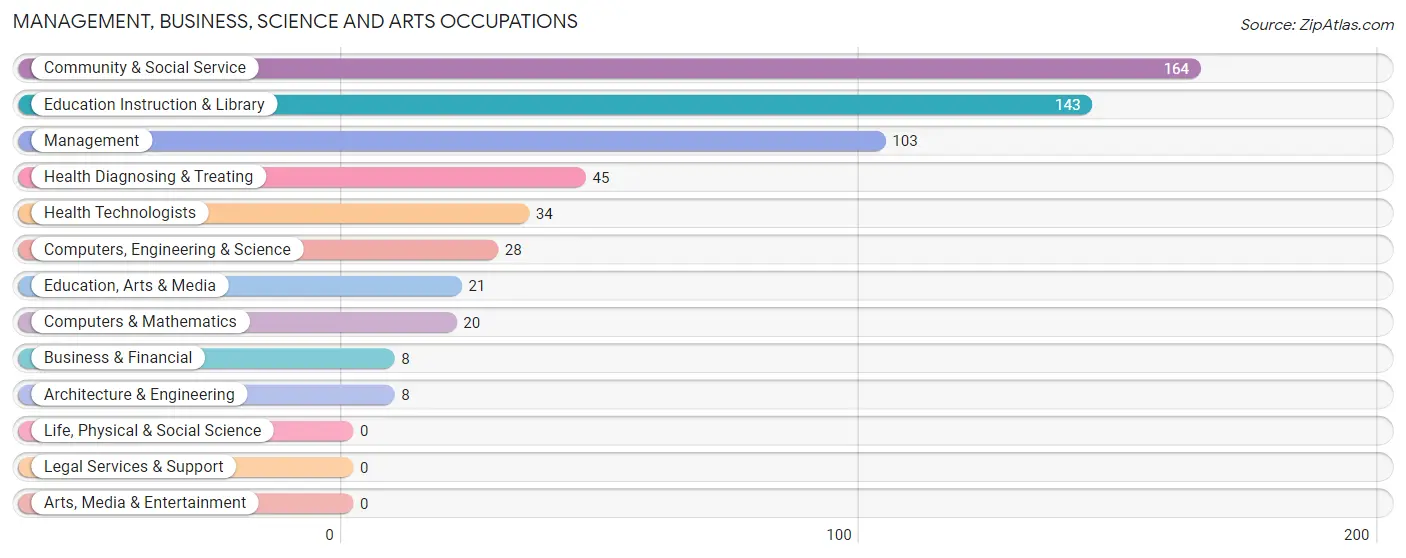
Management, Business, Science and Arts Occupations
The most common Management, Business, Science and Arts occupations in Colstrip are Community & Social Service (164 | 14.0%), Education Instruction & Library (143 | 12.2%), Management (103 | 8.8%), Health Diagnosing & Treating (45 | 3.8%), and Health Technologists (34 | 2.9%).
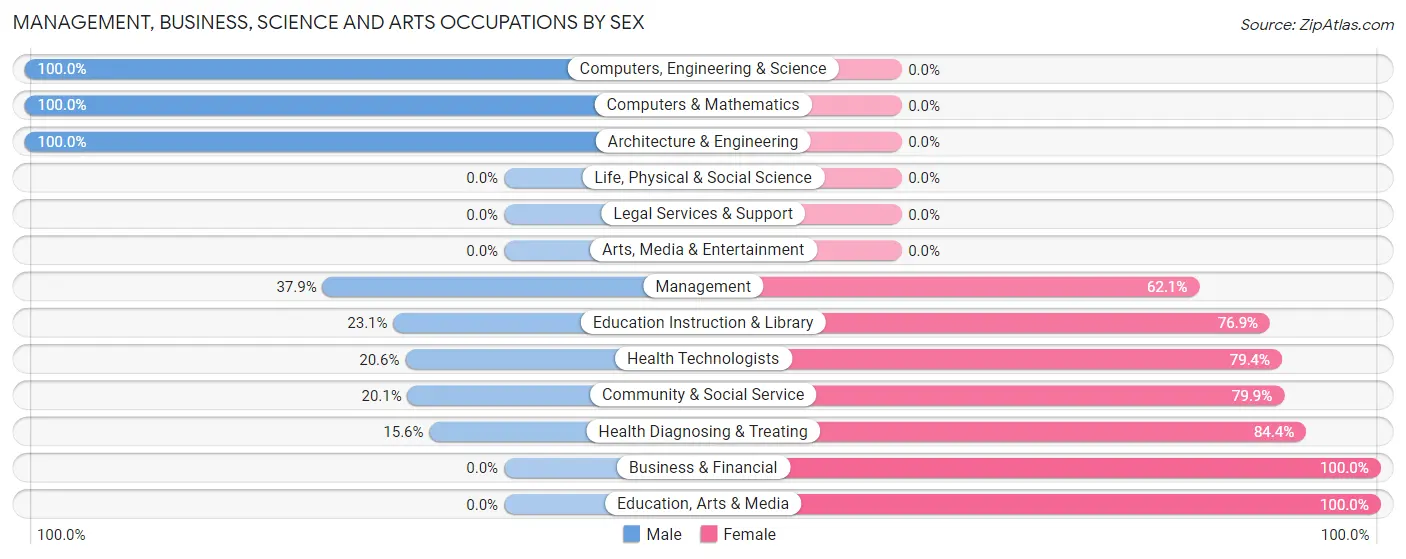
Management, Business, Science and Arts Occupations by Sex
Within the Management, Business, Science and Arts occupations in Colstrip, the most male-oriented occupations are Computers, Engineering & Science (100.0%), Computers & Mathematics (100.0%), and Architecture & Engineering (100.0%), while the most female-oriented occupations are Business & Financial (100.0%), Education, Arts & Media (100.0%), and Health Diagnosing & Treating (84.4%).
| Occupation | Male | Female |
| Management | 39 (37.9%) | 64 (62.1%) |
| Business & Financial | 0 (0.0%) | 8 (100.0%) |
| Computers, Engineering & Science | 28 (100.0%) | 0 (0.0%) |
| Computers & Mathematics | 20 (100.0%) | 0 (0.0%) |
| Architecture & Engineering | 8 (100.0%) | 0 (0.0%) |
| Life, Physical & Social Science | 0 (0.0%) | 0 (0.0%) |
| Community & Social Service | 33 (20.1%) | 131 (79.9%) |
| Education, Arts & Media | 0 (0.0%) | 21 (100.0%) |
| Legal Services & Support | 0 (0.0%) | 0 (0.0%) |
| Education Instruction & Library | 33 (23.1%) | 110 (76.9%) |
| Arts, Media & Entertainment | 0 (0.0%) | 0 (0.0%) |
| Health Diagnosing & Treating | 7 (15.6%) | 38 (84.4%) |
| Health Technologists | 7 (20.6%) | 27 (79.4%) |
| Total (Category) | 107 (30.7%) | 241 (69.3%) |
| Total (Overall) | 635 (54.4%) | 533 (45.6%) |
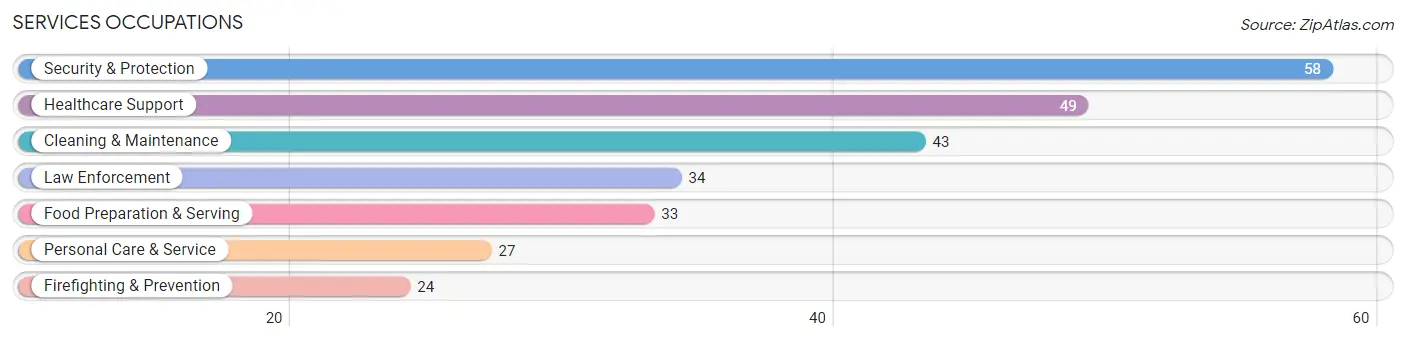
Services Occupations
The most common Services occupations in Colstrip are Security & Protection (58 | 5.0%), Healthcare Support (49 | 4.2%), Cleaning & Maintenance (43 | 3.7%), Law Enforcement (34 | 2.9%), and Food Preparation & Serving (33 | 2.8%).
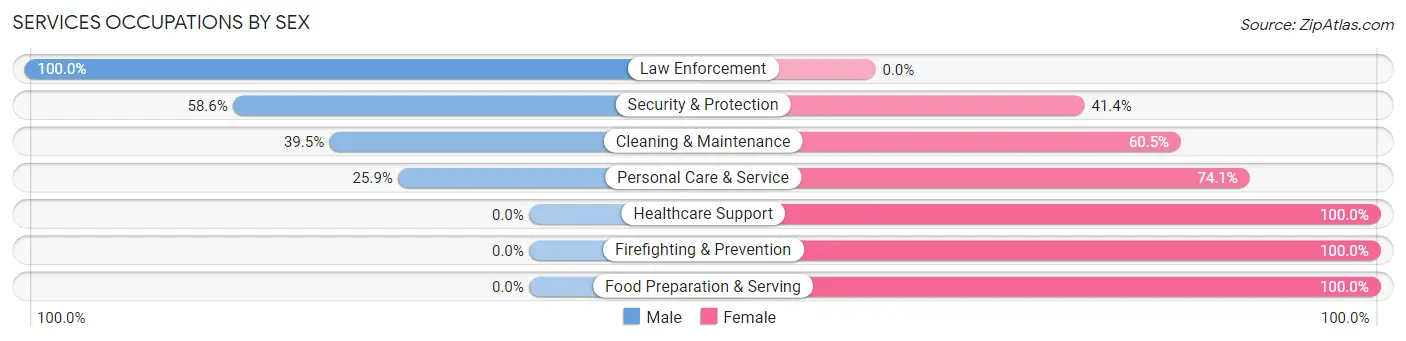
Services Occupations by Sex
Within the Services occupations in Colstrip, the most male-oriented occupations are Law Enforcement (100.0%), Security & Protection (58.6%), and Cleaning & Maintenance (39.5%), while the most female-oriented occupations are Healthcare Support (100.0%), Firefighting & Prevention (100.0%), and Food Preparation & Serving (100.0%).
| Occupation | Male | Female |
| Healthcare Support | 0 (0.0%) | 49 (100.0%) |
| Security & Protection | 34 (58.6%) | 24 (41.4%) |
| Firefighting & Prevention | 0 (0.0%) | 24 (100.0%) |
| Law Enforcement | 34 (100.0%) | 0 (0.0%) |
| Food Preparation & Serving | 0 (0.0%) | 33 (100.0%) |
| Cleaning & Maintenance | 17 (39.5%) | 26 (60.5%) |
| Personal Care & Service | 7 (25.9%) | 20 (74.1%) |
| Total (Category) | 58 (27.6%) | 152 (72.4%) |
| Total (Overall) | 635 (54.4%) | 533 (45.6%) |
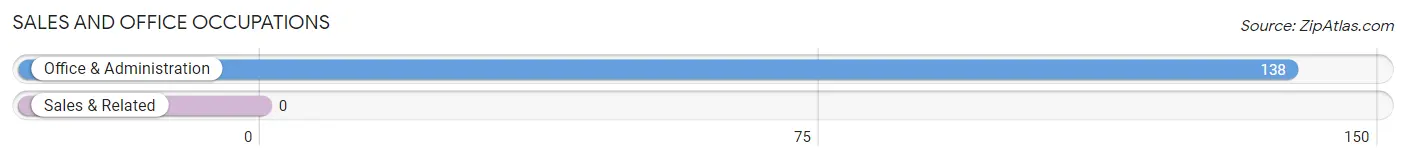
Sales and Office Occupations
The most common Sales and Office occupations in Colstrip are , and Office & Administration (138 | 11.8%).
Sales and Office Occupations by Sex
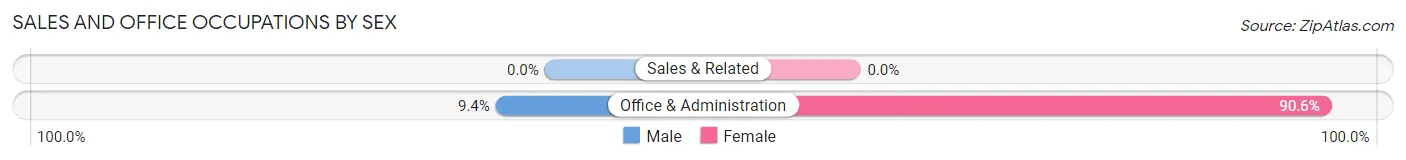
| Occupation | Male | Female |
| Sales & Related | 0 (0.0%) | 0 (0.0%) |
| Office & Administration | 13 (9.4%) | 125 (90.6%) |
| Total (Category) | 13 (9.4%) | 125 (90.6%) |
| Total (Overall) | 635 (54.4%) | 533 (45.6%) |
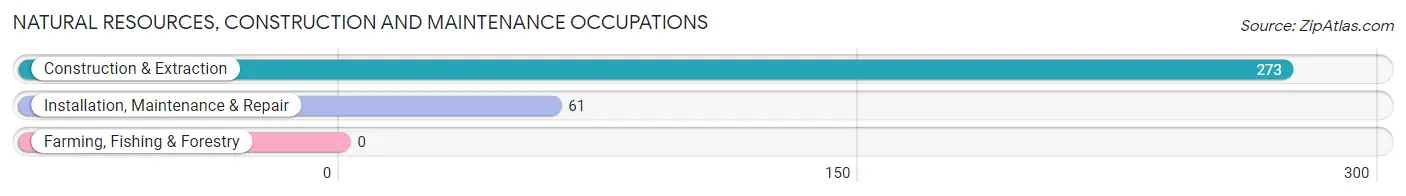
Natural Resources, Construction and Maintenance Occupations
The most common Natural Resources, Construction and Maintenance occupations in Colstrip are Construction & Extraction (273 | 23.4%), and Installation, Maintenance & Repair (61 | 5.2%).
Natural Resources, Construction and Maintenance Occupations by Sex
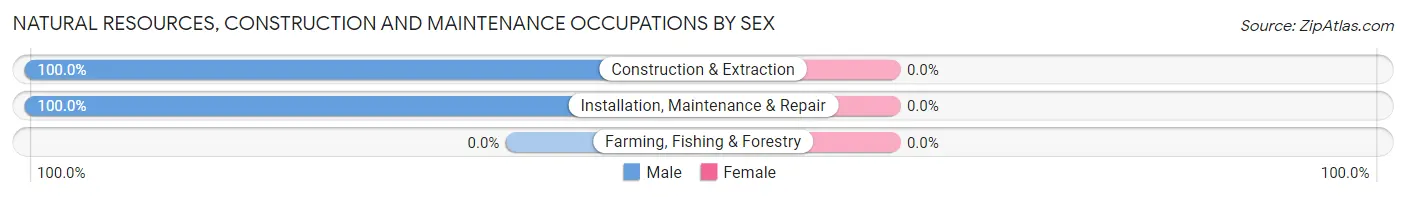
| Occupation | Male | Female |
| Farming, Fishing & Forestry | 0 (0.0%) | 0 (0.0%) |
| Construction & Extraction | 273 (100.0%) | 0 (0.0%) |
| Installation, Maintenance & Repair | 61 (100.0%) | 0 (0.0%) |
| Total (Category) | 334 (100.0%) | 0 (0.0%) |
| Total (Overall) | 635 (54.4%) | 533 (45.6%) |
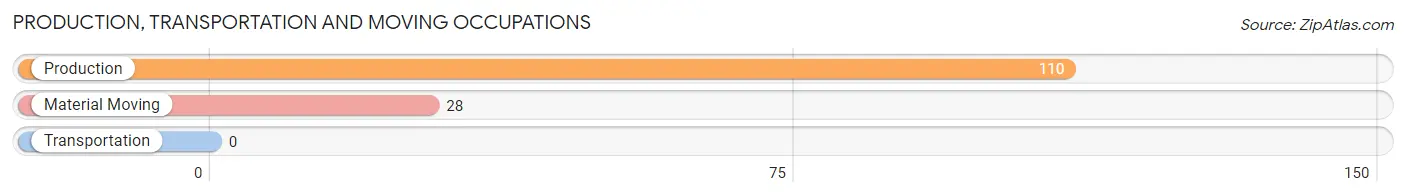
Production, Transportation and Moving Occupations
The most common Production, Transportation and Moving occupations in Colstrip are Production (110 | 9.4%), and Material Moving (28 | 2.4%).
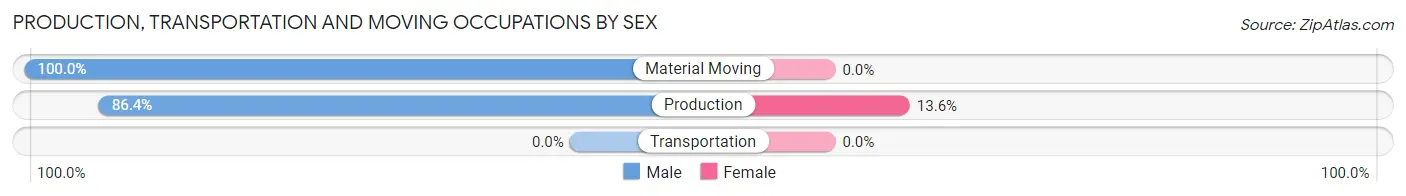
Production, Transportation and Moving Occupations by Sex
| Occupation | Male | Female |
| Production | 95 (86.4%) | 15 (13.6%) |
| Transportation | 0 (0.0%) | 0 (0.0%) |
| Material Moving | 28 (100.0%) | 0 (0.0%) |
| Total (Category) | 123 (89.1%) | 15 (10.9%) |
| Total (Overall) | 635 (54.4%) | 533 (45.6%) |
Employment Industries by Sex in Colstrip
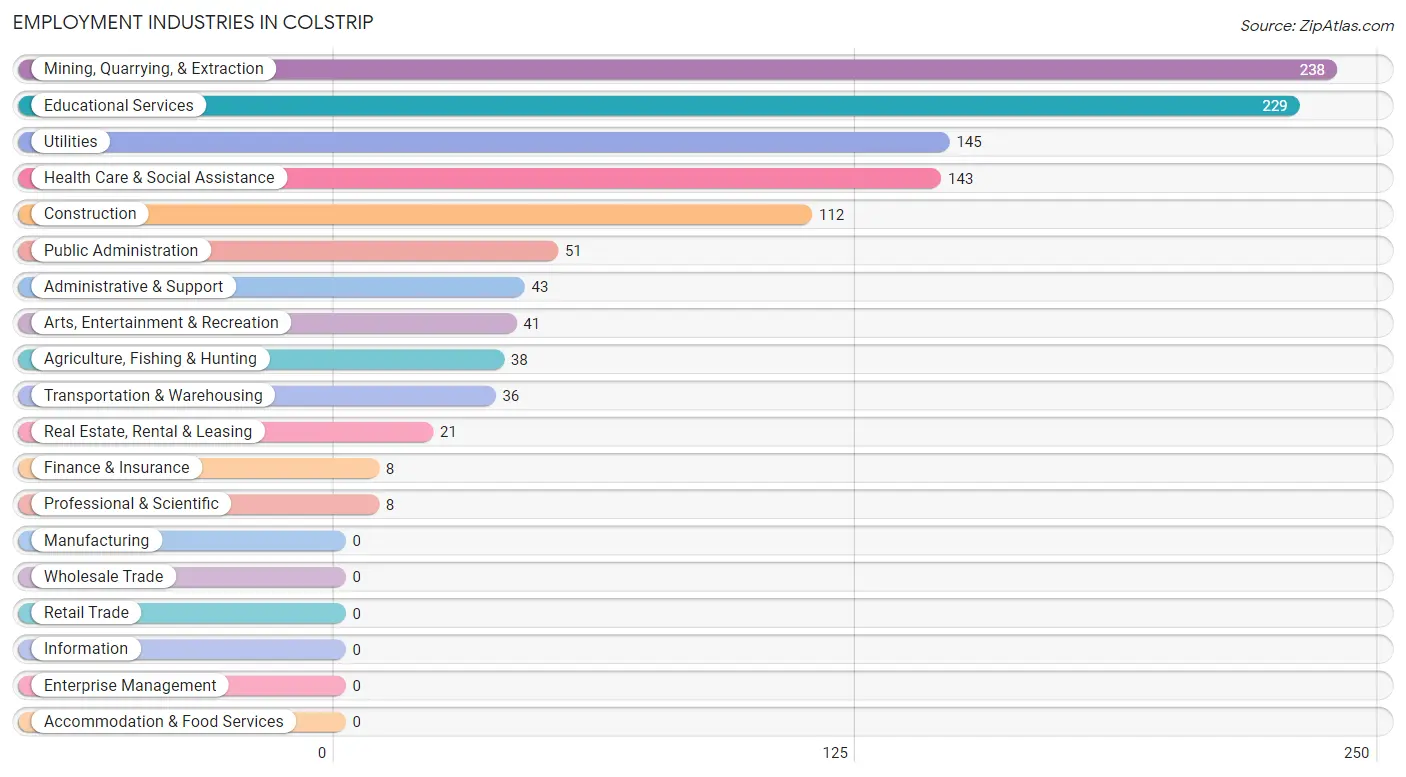
Employment Industries in Colstrip
The major employment industries in Colstrip include Mining, Quarrying, & Extraction (238 | 20.4%), Educational Services (229 | 19.6%), Utilities (145 | 12.4%), Health Care & Social Assistance (143 | 12.2%), and Construction (112 | 9.6%).
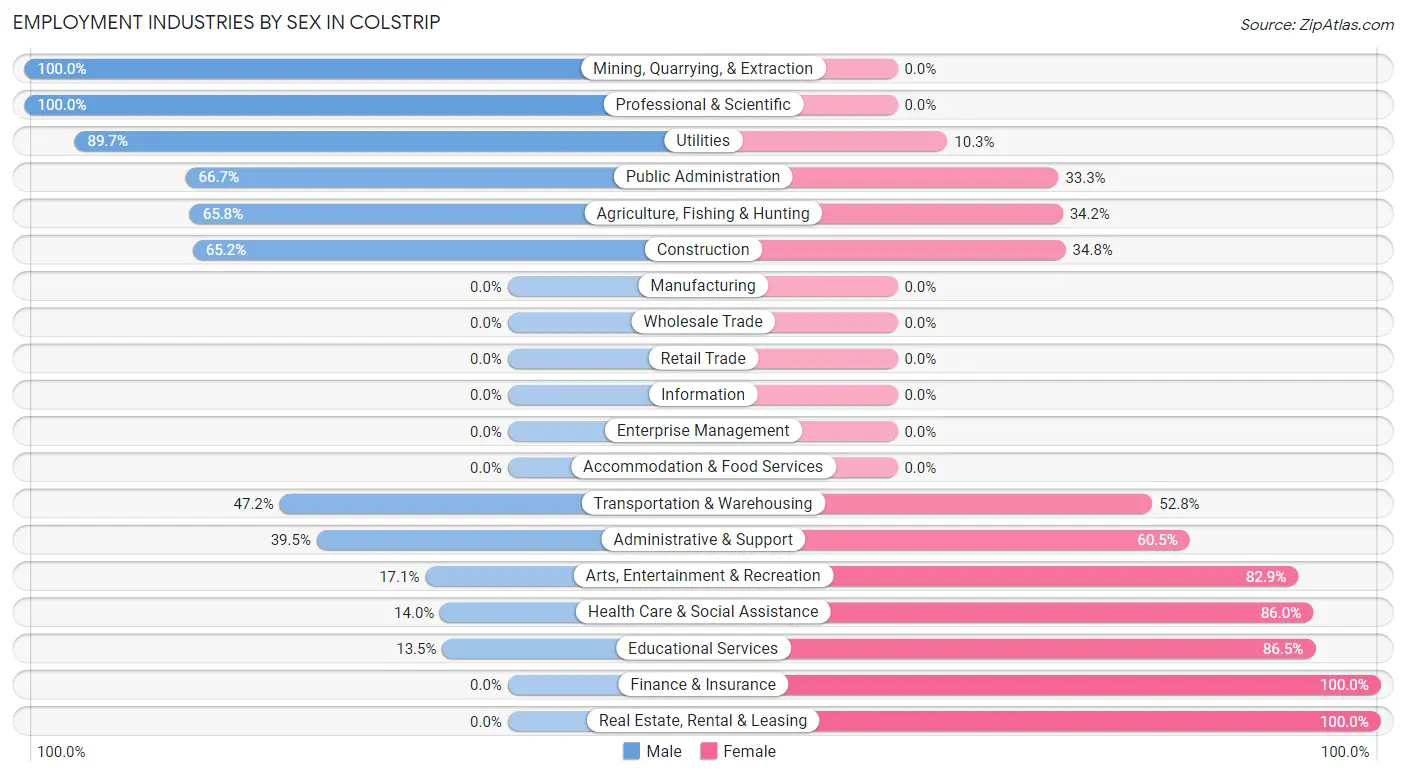
Employment Industries by Sex in Colstrip
The Colstrip industries that see more men than women are Mining, Quarrying, & Extraction (100.0%), Professional & Scientific (100.0%), and Utilities (89.7%), whereas the industries that tend to have a higher number of women are Finance & Insurance (100.0%), Real Estate, Rental & Leasing (100.0%), and Educational Services (86.5%).
| Industry | Male | Female |
| Agriculture, Fishing & Hunting | 25 (65.8%) | 13 (34.2%) |
| Mining, Quarrying, & Extraction | 238 (100.0%) | 0 (0.0%) |
| Construction | 73 (65.2%) | 39 (34.8%) |
| Manufacturing | 0 (0.0%) | 0 (0.0%) |
| Wholesale Trade | 0 (0.0%) | 0 (0.0%) |
| Retail Trade | 0 (0.0%) | 0 (0.0%) |
| Transportation & Warehousing | 17 (47.2%) | 19 (52.8%) |
| Utilities | 130 (89.7%) | 15 (10.3%) |
| Information | 0 (0.0%) | 0 (0.0%) |
| Finance & Insurance | 0 (0.0%) | 8 (100.0%) |
| Real Estate, Rental & Leasing | 0 (0.0%) | 21 (100.0%) |
| Professional & Scientific | 8 (100.0%) | 0 (0.0%) |
| Enterprise Management | 0 (0.0%) | 0 (0.0%) |
| Administrative & Support | 17 (39.5%) | 26 (60.5%) |
| Educational Services | 31 (13.5%) | 198 (86.5%) |
| Health Care & Social Assistance | 20 (14.0%) | 123 (86.0%) |
| Arts, Entertainment & Recreation | 7 (17.1%) | 34 (82.9%) |
| Accommodation & Food Services | 0 (0.0%) | 0 (0.0%) |
| Public Administration | 34 (66.7%) | 17 (33.3%) |
| Total | 635 (54.4%) | 533 (45.6%) |
Education in Colstrip
School Enrollment in Colstrip
The most common levels of schooling among the 633 students in Colstrip are middle school (218 | 34.4%), high school (143 | 22.6%), and elementary school (124 | 19.6%).
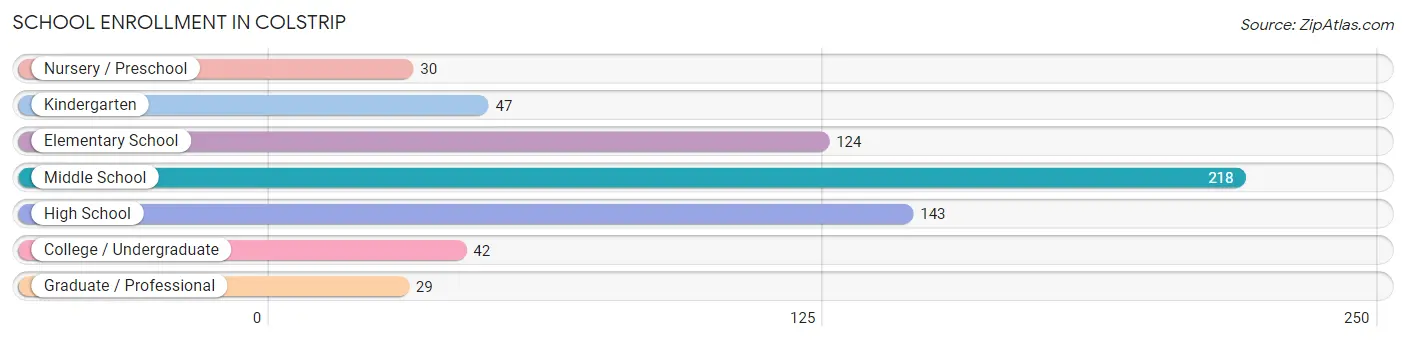
| School Level | # Students | % Students |
| Nursery / Preschool | 30 | 4.7% |
| Kindergarten | 47 | 7.4% |
| Elementary School | 124 | 19.6% |
| Middle School | 218 | 34.4% |
| High School | 143 | 22.6% |
| College / Undergraduate | 42 | 6.6% |
| Graduate / Professional | 29 | 4.6% |
| Total | 633 | 100.0% |
School Enrollment by Age by Funding Source in Colstrip
Out of a total of 633 students who are enrolled in schools in Colstrip, 93 (14.7%) attend a private institution, while the remaining 540 (85.3%) are enrolled in public schools. The age group of 3 to 4 year olds has the highest likelihood of being enrolled in private schools, with 30 (100.0% in the age bracket) enrolled. Conversely, the age group of 5 to 9 year old has the lowest likelihood of being enrolled in a private school, with 120 (100.0% in the age bracket) attending a public institution.
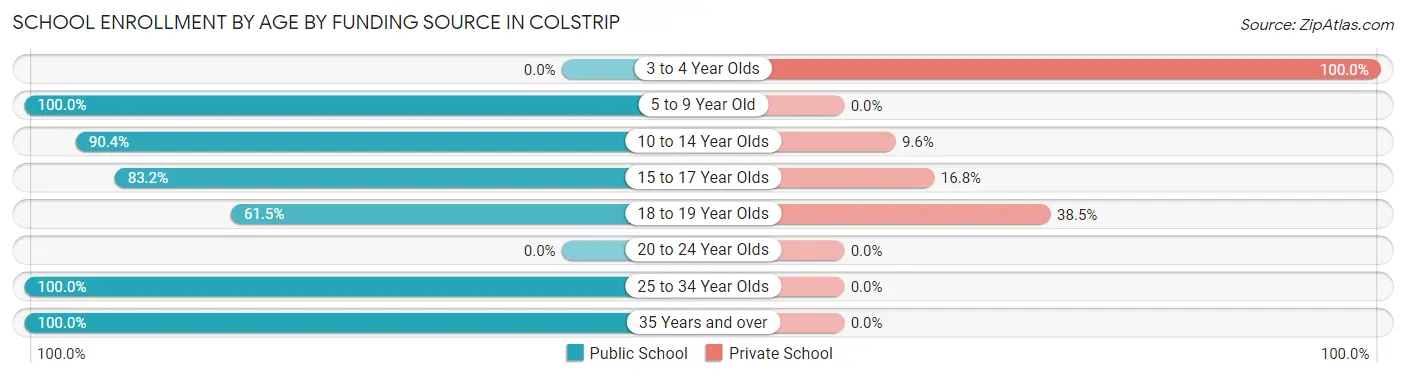
| Age Bracket | Public School | Private School |
| 3 to 4 Year Olds | 0 (0.0%) | 30 (100.0%) |
| 5 to 9 Year Old | 120 (100.0%) | 0 (0.0%) |
| 10 to 14 Year Olds | 265 (90.4%) | 28 (9.6%) |
| 15 to 17 Year Olds | 99 (83.2%) | 20 (16.8%) |
| 18 to 19 Year Olds | 24 (61.5%) | 15 (38.5%) |
| 20 to 24 Year Olds | 0 (0.0%) | 0 (0.0%) |
| 25 to 34 Year Olds | 17 (100.0%) | 0 (0.0%) |
| 35 Years and over | 15 (100.0%) | 0 (0.0%) |
| Total | 540 (85.3%) | 93 (14.7%) |
Educational Attainment by Field of Study in Colstrip
Education (137 | 32.5%), science & technology (84 | 20.0%), business (81 | 19.2%), liberal arts & history (42 | 10.0%), and bio, nature & agricultural (25 | 5.9%) are the most common fields of study among 421 individuals in Colstrip who have obtained a bachelor's degree or higher.
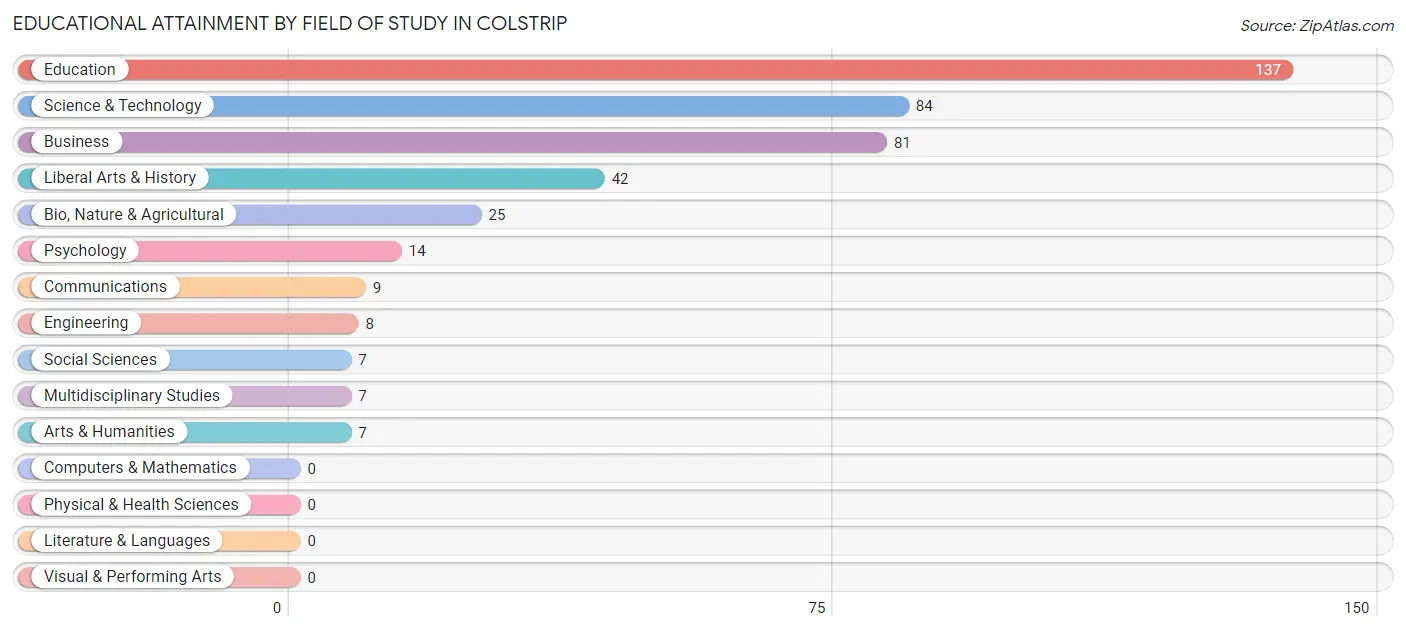
| Field of Study | # Graduates | % Graduates |
| Computers & Mathematics | 0 | 0.0% |
| Bio, Nature & Agricultural | 25 | 5.9% |
| Physical & Health Sciences | 0 | 0.0% |
| Psychology | 14 | 3.3% |
| Social Sciences | 7 | 1.7% |
| Engineering | 8 | 1.9% |
| Multidisciplinary Studies | 7 | 1.7% |
| Science & Technology | 84 | 20.0% |
| Business | 81 | 19.2% |
| Education | 137 | 32.5% |
| Literature & Languages | 0 | 0.0% |
| Liberal Arts & History | 42 | 10.0% |
| Visual & Performing Arts | 0 | 0.0% |
| Communications | 9 | 2.1% |
| Arts & Humanities | 7 | 1.7% |
| Total | 421 | 100.0% |
Transportation & Commute in Colstrip
Vehicle Availability by Sex in Colstrip
The most prevalent vehicle ownership categories in Colstrip are males with 4 vehicles (224, accounting for 36.1%) and females with 4 vehicles (209, making up 43.2%).
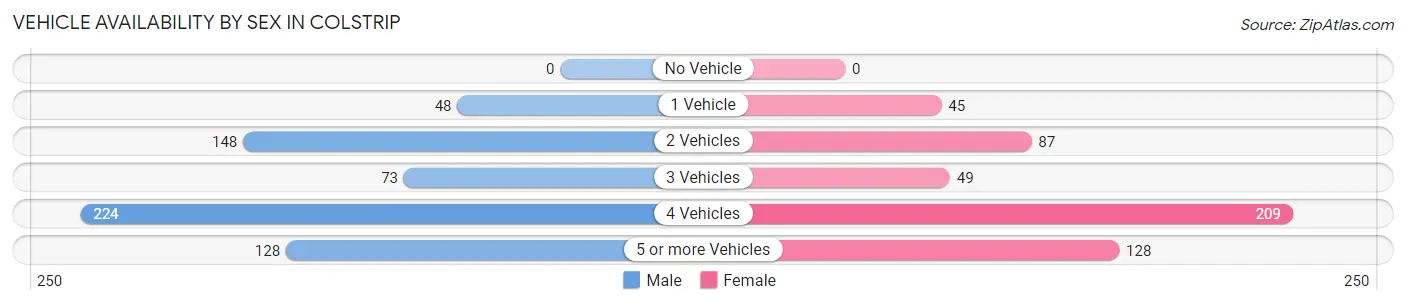
| Vehicles Available | Male | Female |
| No Vehicle | 0 (0.0%) | 0 (0.0%) |
| 1 Vehicle | 48 (7.7%) | 45 (8.7%) |
| 2 Vehicles | 148 (23.8%) | 87 (16.8%) |
| 3 Vehicles | 73 (11.8%) | 49 (9.5%) |
| 4 Vehicles | 224 (36.1%) | 209 (40.4%) |
| 5 or more Vehicles | 128 (20.6%) | 128 (24.7%) |
| Total | 621 (100.0%) | 518 (100.0%) |
Commute Time in Colstrip
The most frequently occuring commute durations in Colstrip are 5 to 9 minutes (608 commuters, 53.4%), 10 to 14 minutes (158 commuters, 13.9%), and 20 to 24 minutes (105 commuters, 9.2%).
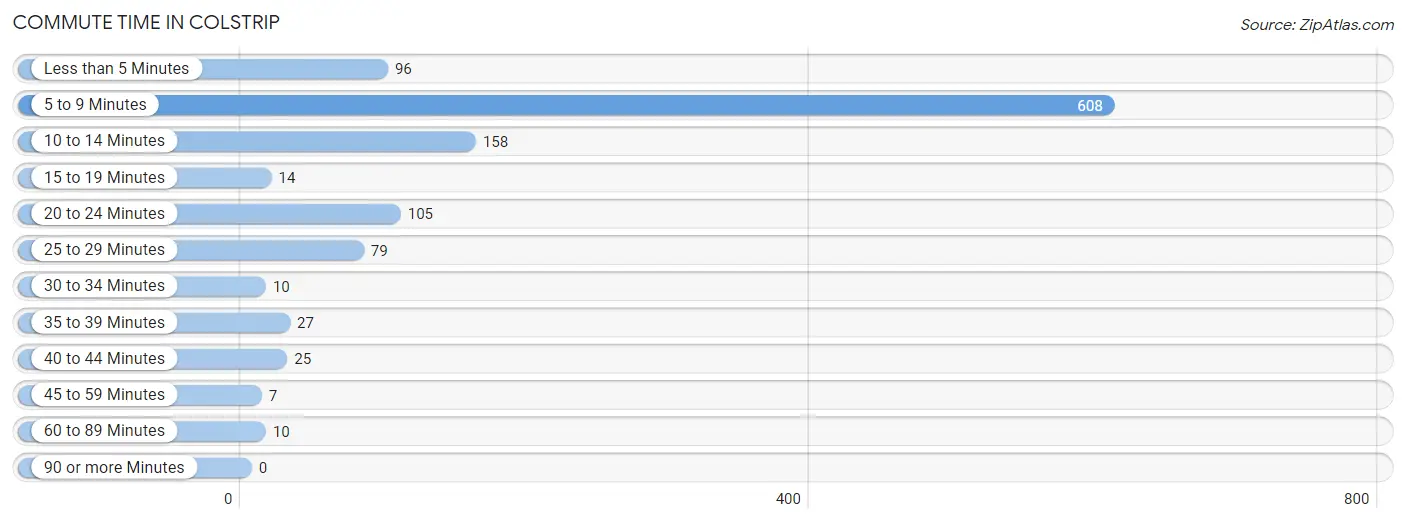
| Commute Time | # Commuters | % Commuters |
| Less than 5 Minutes | 96 | 8.4% |
| 5 to 9 Minutes | 608 | 53.4% |
| 10 to 14 Minutes | 158 | 13.9% |
| 15 to 19 Minutes | 14 | 1.2% |
| 20 to 24 Minutes | 105 | 9.2% |
| 25 to 29 Minutes | 79 | 6.9% |
| 30 to 34 Minutes | 10 | 0.9% |
| 35 to 39 Minutes | 27 | 2.4% |
| 40 to 44 Minutes | 25 | 2.2% |
| 45 to 59 Minutes | 7 | 0.6% |
| 60 to 89 Minutes | 10 | 0.9% |
| 90 or more Minutes | 0 | 0.0% |
Commute Time by Sex in Colstrip
The most common commute times in Colstrip are 5 to 9 minutes (357 commuters, 57.5%) for males and 5 to 9 minutes (251 commuters, 48.5%) for females.
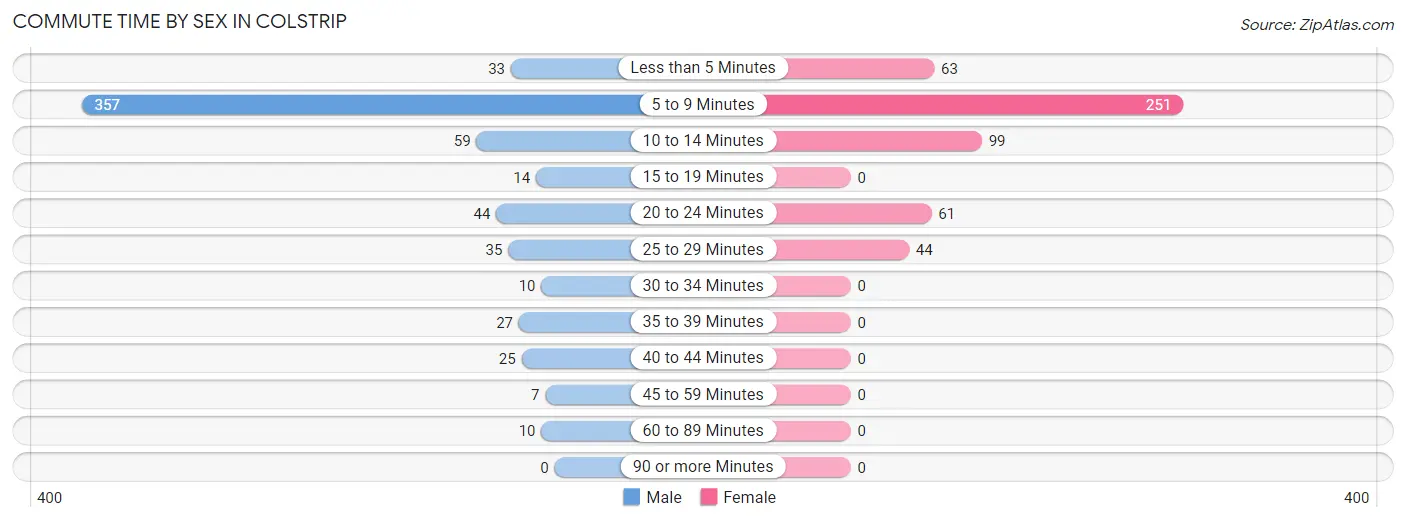
| Commute Time | Male | Female |
| Less than 5 Minutes | 33 (5.3%) | 63 (12.2%) |
| 5 to 9 Minutes | 357 (57.5%) | 251 (48.5%) |
| 10 to 14 Minutes | 59 (9.5%) | 99 (19.1%) |
| 15 to 19 Minutes | 14 (2.2%) | 0 (0.0%) |
| 20 to 24 Minutes | 44 (7.1%) | 61 (11.8%) |
| 25 to 29 Minutes | 35 (5.6%) | 44 (8.5%) |
| 30 to 34 Minutes | 10 (1.6%) | 0 (0.0%) |
| 35 to 39 Minutes | 27 (4.3%) | 0 (0.0%) |
| 40 to 44 Minutes | 25 (4.0%) | 0 (0.0%) |
| 45 to 59 Minutes | 7 (1.1%) | 0 (0.0%) |
| 60 to 89 Minutes | 10 (1.6%) | 0 (0.0%) |
| 90 or more Minutes | 0 (0.0%) | 0 (0.0%) |
Time of Departure to Work by Sex in Colstrip
The most frequent times of departure to work in Colstrip are 5:30 AM to 5:59 AM (164, 26.4%) for males and 7:30 AM to 7:59 AM (286, 55.2%) for females.
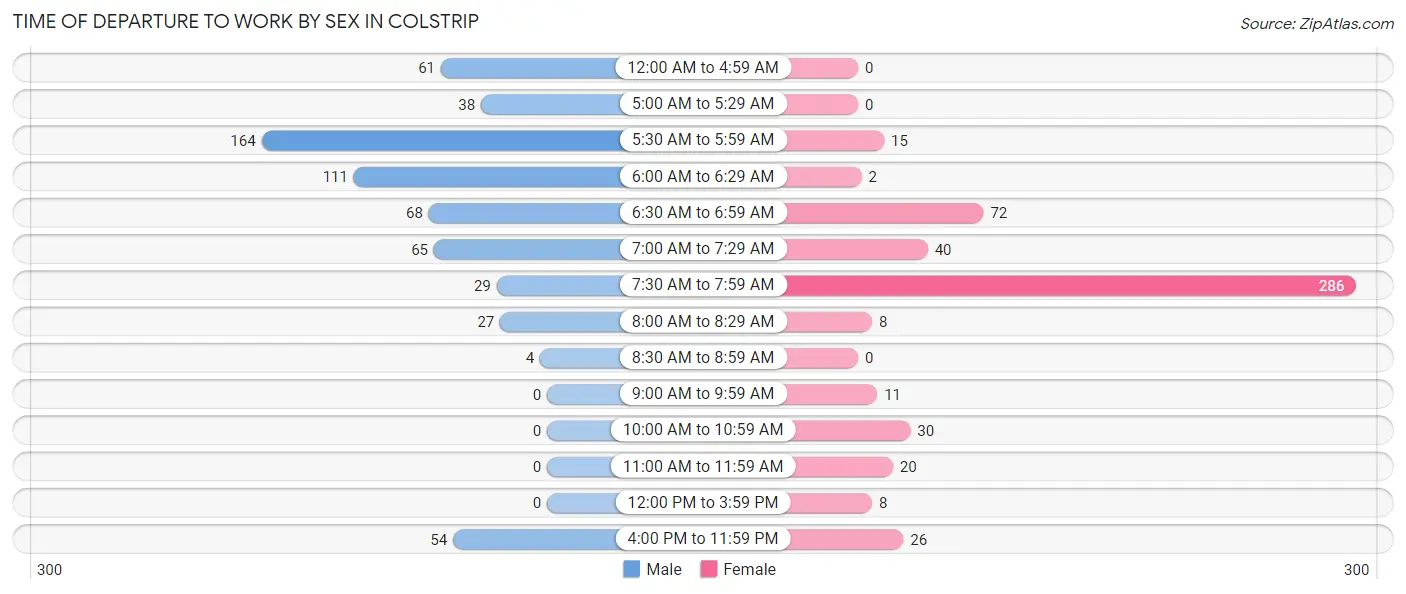
| Time of Departure | Male | Female |
| 12:00 AM to 4:59 AM | 61 (9.8%) | 0 (0.0%) |
| 5:00 AM to 5:29 AM | 38 (6.1%) | 0 (0.0%) |
| 5:30 AM to 5:59 AM | 164 (26.4%) | 15 (2.9%) |
| 6:00 AM to 6:29 AM | 111 (17.9%) | 2 (0.4%) |
| 6:30 AM to 6:59 AM | 68 (11.0%) | 72 (13.9%) |
| 7:00 AM to 7:29 AM | 65 (10.5%) | 40 (7.7%) |
| 7:30 AM to 7:59 AM | 29 (4.7%) | 286 (55.2%) |
| 8:00 AM to 8:29 AM | 27 (4.3%) | 8 (1.5%) |
| 8:30 AM to 8:59 AM | 4 (0.6%) | 0 (0.0%) |
| 9:00 AM to 9:59 AM | 0 (0.0%) | 11 (2.1%) |
| 10:00 AM to 10:59 AM | 0 (0.0%) | 30 (5.8%) |
| 11:00 AM to 11:59 AM | 0 (0.0%) | 20 (3.9%) |
| 12:00 PM to 3:59 PM | 0 (0.0%) | 8 (1.5%) |
| 4:00 PM to 11:59 PM | 54 (8.7%) | 26 (5.0%) |
| Total | 621 (100.0%) | 518 (100.0%) |
Housing Occupancy in Colstrip
Occupancy by Ownership in Colstrip
Of the total 941 dwellings in Colstrip, owner-occupied units account for 787 (83.6%), while renter-occupied units make up 154 (16.4%).
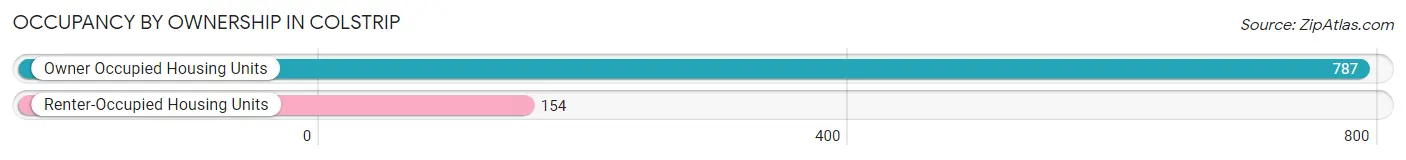
| Occupancy | # Housing Units | % Housing Units |
| Owner Occupied Housing Units | 787 | 83.6% |
| Renter-Occupied Housing Units | 154 | 16.4% |
| Total Occupied Housing Units | 941 | 100.0% |
Occupancy by Household Size in Colstrip
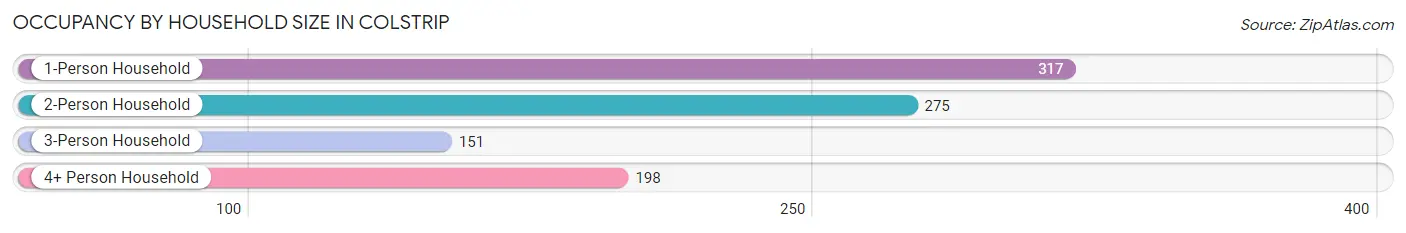
| Household Size | # Housing Units | % Housing Units |
| 1-Person Household | 317 | 33.7% |
| 2-Person Household | 275 | 29.2% |
| 3-Person Household | 151 | 16.1% |
| 4+ Person Household | 198 | 21.0% |
| Total Housing Units | 941 | 100.0% |
Occupancy by Ownership by Household Size in Colstrip
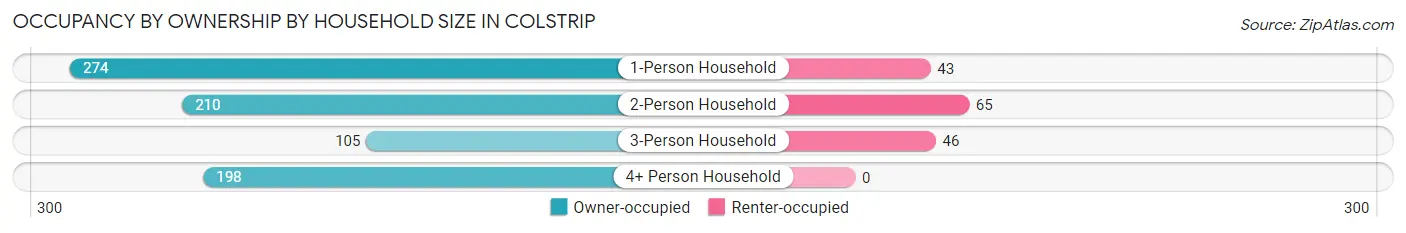
| Household Size | Owner-occupied | Renter-occupied |
| 1-Person Household | 274 (86.4%) | 43 (13.6%) |
| 2-Person Household | 210 (76.4%) | 65 (23.6%) |
| 3-Person Household | 105 (69.5%) | 46 (30.5%) |
| 4+ Person Household | 198 (100.0%) | 0 (0.0%) |
| Total Housing Units | 787 (83.6%) | 154 (16.4%) |
Occupancy by Educational Attainment in Colstrip
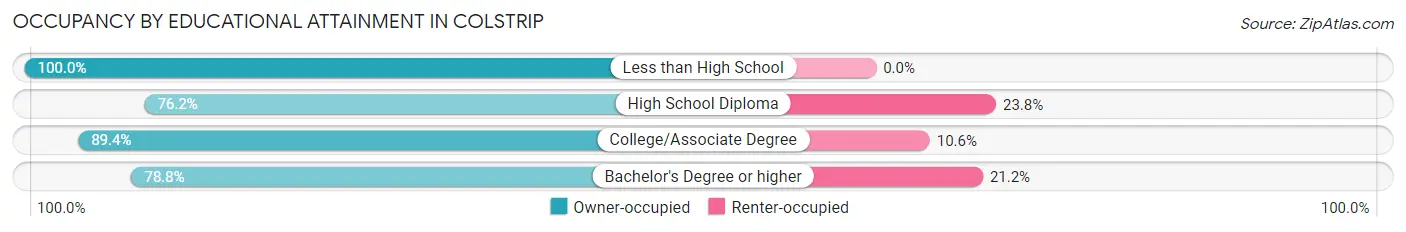
| Household Size | Owner-occupied | Renter-occupied |
| Less than High School | 40 (100.0%) | 0 (0.0%) |
| High School Diploma | 202 (76.2%) | 63 (23.8%) |
| College/Associate Degree | 370 (89.4%) | 44 (10.6%) |
| Bachelor's Degree or higher | 175 (78.8%) | 47 (21.2%) |
Occupancy by Age of Householder in Colstrip
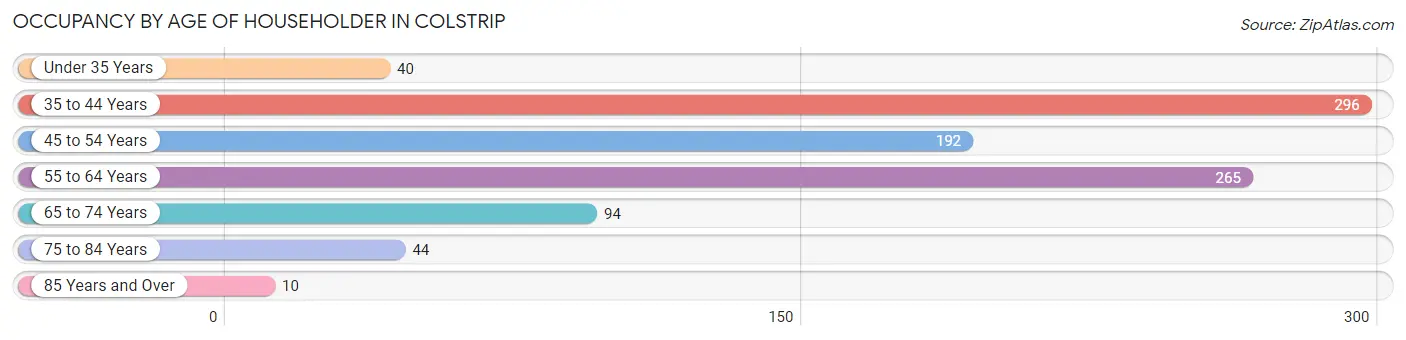
| Age Bracket | # Households | % Households |
| Under 35 Years | 40 | 4.3% |
| 35 to 44 Years | 296 | 31.5% |
| 45 to 54 Years | 192 | 20.4% |
| 55 to 64 Years | 265 | 28.2% |
| 65 to 74 Years | 94 | 10.0% |
| 75 to 84 Years | 44 | 4.7% |
| 85 Years and Over | 10 | 1.1% |
| Total | 941 | 100.0% |
Housing Finances in Colstrip
Median Income by Occupancy in Colstrip
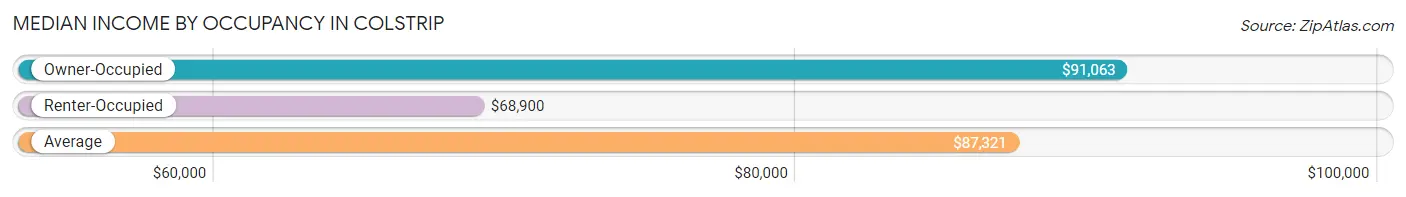
| Occupancy Type | # Households | Median Income |
| Owner-Occupied | 787 (83.6%) | $91,063 |
| Renter-Occupied | 154 (16.4%) | $68,900 |
| Average | 941 (100.0%) | $87,321 |
Occupancy by Householder Income Bracket in Colstrip
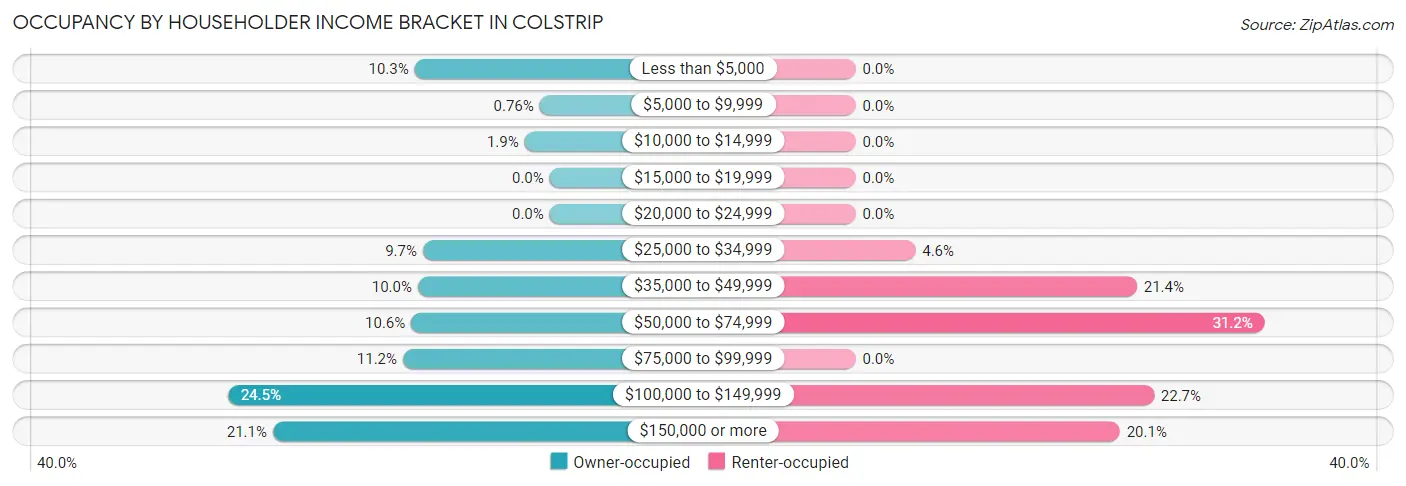
| Income Bracket | Owner-occupied | Renter-occupied |
| Less than $5,000 | 81 (10.3%) | 0 (0.0%) |
| $5,000 to $9,999 | 6 (0.8%) | 0 (0.0%) |
| $10,000 to $14,999 | 15 (1.9%) | 0 (0.0%) |
| $15,000 to $19,999 | 0 (0.0%) | 0 (0.0%) |
| $20,000 to $24,999 | 0 (0.0%) | 0 (0.0%) |
| $25,000 to $34,999 | 76 (9.7%) | 7 (4.5%) |
| $35,000 to $49,999 | 79 (10.0%) | 33 (21.4%) |
| $50,000 to $74,999 | 83 (10.5%) | 48 (31.2%) |
| $75,000 to $99,999 | 88 (11.2%) | 0 (0.0%) |
| $100,000 to $149,999 | 193 (24.5%) | 35 (22.7%) |
| $150,000 or more | 166 (21.1%) | 31 (20.1%) |
| Total | 787 (100.0%) | 154 (100.0%) |
Monthly Housing Cost Tiers in Colstrip
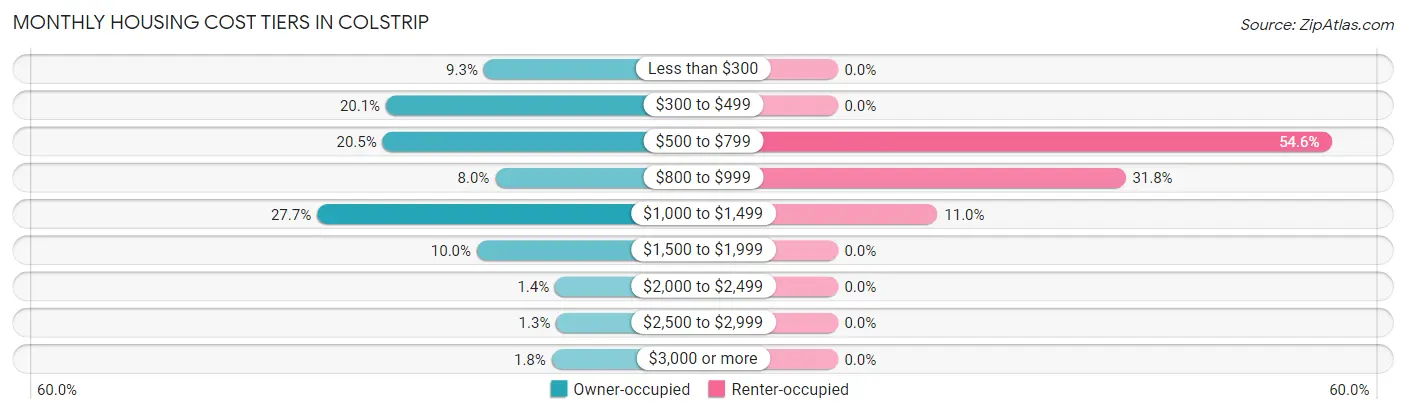
| Monthly Cost | Owner-occupied | Renter-occupied |
| Less than $300 | 73 (9.3%) | 0 (0.0%) |
| $300 to $499 | 158 (20.1%) | 0 (0.0%) |
| $500 to $799 | 161 (20.5%) | 84 (54.5%) |
| $800 to $999 | 63 (8.0%) | 49 (31.8%) |
| $1,000 to $1,499 | 218 (27.7%) | 17 (11.0%) |
| $1,500 to $1,999 | 79 (10.0%) | 0 (0.0%) |
| $2,000 to $2,499 | 11 (1.4%) | 0 (0.0%) |
| $2,500 to $2,999 | 10 (1.3%) | 0 (0.0%) |
| $3,000 or more | 14 (1.8%) | 0 (0.0%) |
| Total | 787 (100.0%) | 154 (100.0%) |
Physical Housing Characteristics in Colstrip
Housing Structures in Colstrip
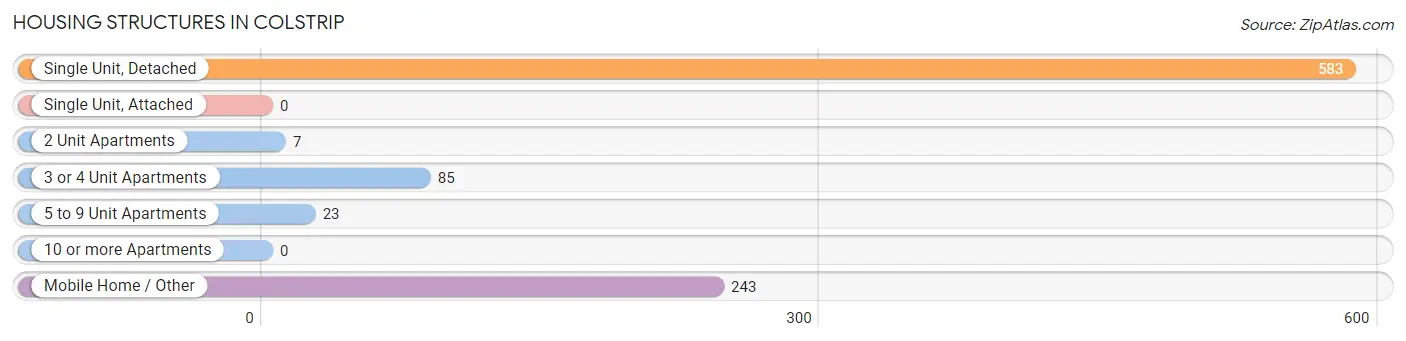
| Structure Type | # Housing Units | % Housing Units |
| Single Unit, Detached | 583 | 62.0% |
| Single Unit, Attached | 0 | 0.0% |
| 2 Unit Apartments | 7 | 0.7% |
| 3 or 4 Unit Apartments | 85 | 9.0% |
| 5 to 9 Unit Apartments | 23 | 2.4% |
| 10 or more Apartments | 0 | 0.0% |
| Mobile Home / Other | 243 | 25.8% |
| Total | 941 | 100.0% |
Housing Structures by Occupancy in Colstrip
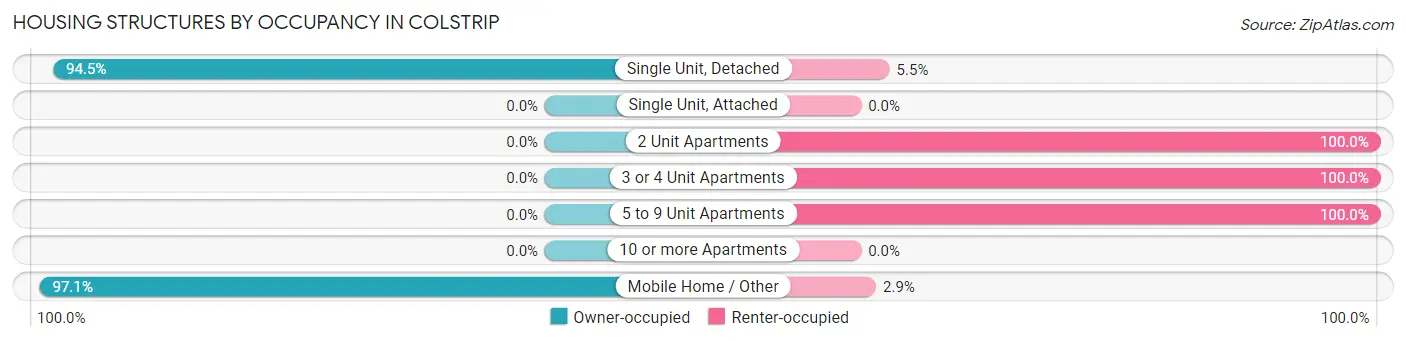
| Structure Type | Owner-occupied | Renter-occupied |
| Single Unit, Detached | 551 (94.5%) | 32 (5.5%) |
| Single Unit, Attached | 0 (0.0%) | 0 (0.0%) |
| 2 Unit Apartments | 0 (0.0%) | 7 (100.0%) |
| 3 or 4 Unit Apartments | 0 (0.0%) | 85 (100.0%) |
| 5 to 9 Unit Apartments | 0 (0.0%) | 23 (100.0%) |
| 10 or more Apartments | 0 (0.0%) | 0 (0.0%) |
| Mobile Home / Other | 236 (97.1%) | 7 (2.9%) |
| Total | 787 (83.6%) | 154 (16.4%) |
Housing Structures by Number of Rooms in Colstrip
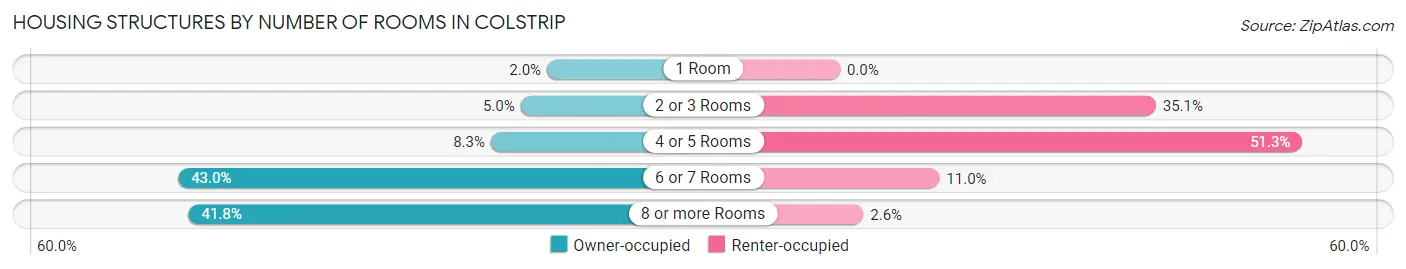
| Number of Rooms | Owner-occupied | Renter-occupied |
| 1 Room | 16 (2.0%) | 0 (0.0%) |
| 2 or 3 Rooms | 39 (5.0%) | 54 (35.1%) |
| 4 or 5 Rooms | 65 (8.3%) | 79 (51.3%) |
| 6 or 7 Rooms | 338 (42.9%) | 17 (11.0%) |
| 8 or more Rooms | 329 (41.8%) | 4 (2.6%) |
| Total | 787 (100.0%) | 154 (100.0%) |
Housing Structure by Heating Type in Colstrip
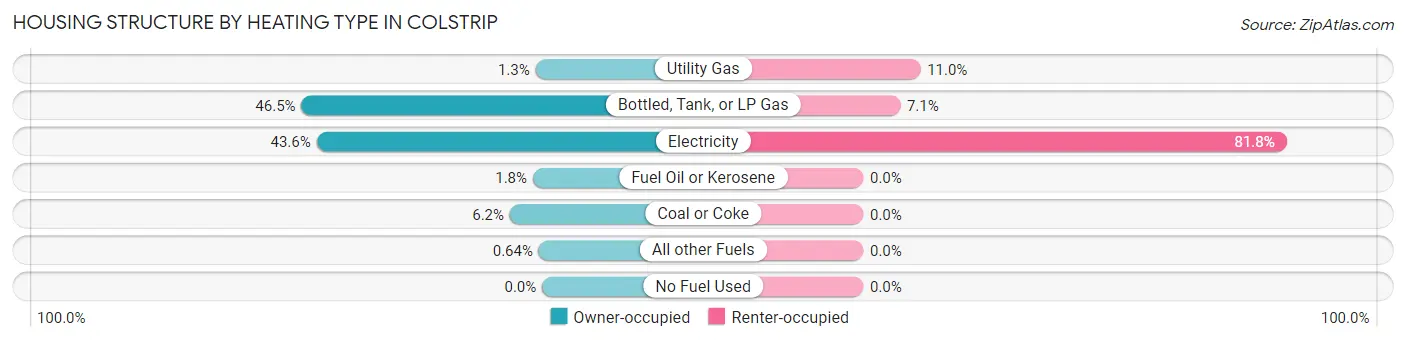
| Heating Type | Owner-occupied | Renter-occupied |
| Utility Gas | 10 (1.3%) | 17 (11.0%) |
| Bottled, Tank, or LP Gas | 366 (46.5%) | 11 (7.1%) |
| Electricity | 343 (43.6%) | 126 (81.8%) |
| Fuel Oil or Kerosene | 14 (1.8%) | 0 (0.0%) |
| Coal or Coke | 49 (6.2%) | 0 (0.0%) |
| All other Fuels | 5 (0.6%) | 0 (0.0%) |
| No Fuel Used | 0 (0.0%) | 0 (0.0%) |
| Total | 787 (100.0%) | 154 (100.0%) |
Household Vehicle Usage in Colstrip
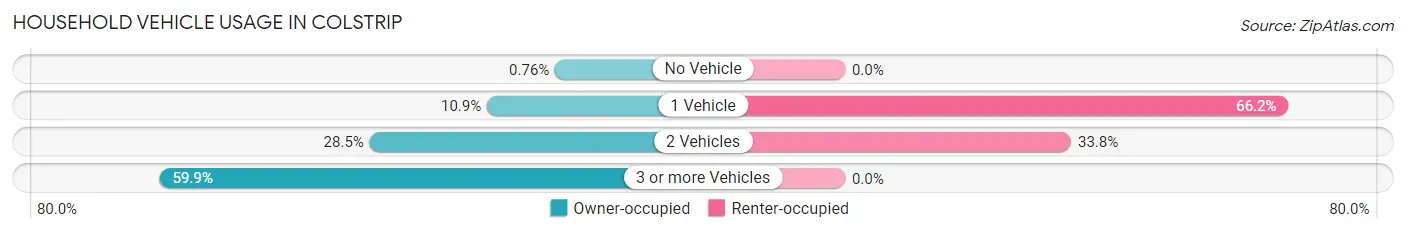
| Vehicles per Household | Owner-occupied | Renter-occupied |
| No Vehicle | 6 (0.8%) | 0 (0.0%) |
| 1 Vehicle | 86 (10.9%) | 102 (66.2%) |
| 2 Vehicles | 224 (28.5%) | 52 (33.8%) |
| 3 or more Vehicles | 471 (59.9%) | 0 (0.0%) |
| Total | 787 (100.0%) | 154 (100.0%) |
Real Estate & Mortgages in Colstrip
Real Estate and Mortgage Overview in Colstrip
| Characteristic | Without Mortgage | With Mortgage |
| Housing Units | 429 | 358 |
| Median Property Value | $78,700 | $177,400 |
| Median Household Income | - | - |
| Monthly Housing Costs | $483 | $14 |
| Real Estate Taxes | $667 | $14 |
Property Value by Mortgage Status in Colstrip
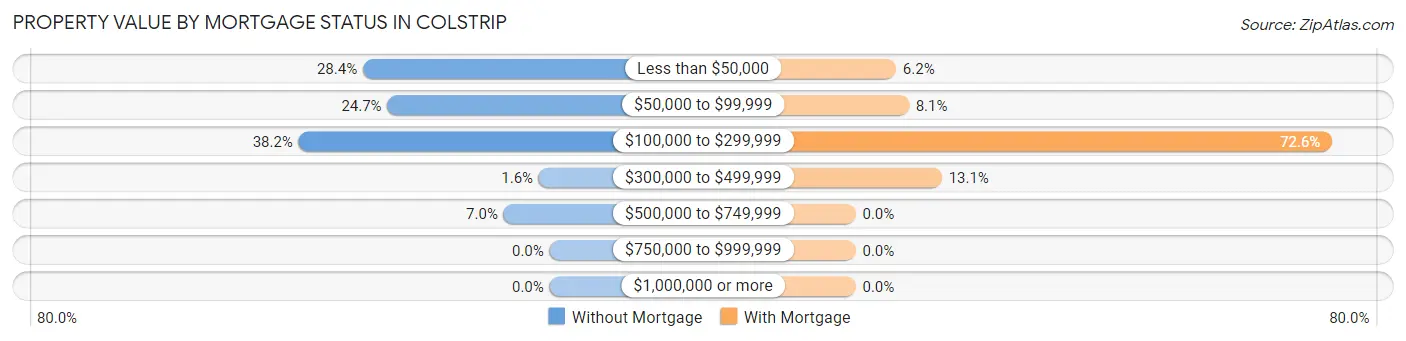
| Property Value | Without Mortgage | With Mortgage |
| Less than $50,000 | 122 (28.4%) | 22 (6.1%) |
| $50,000 to $99,999 | 106 (24.7%) | 29 (8.1%) |
| $100,000 to $299,999 | 164 (38.2%) | 260 (72.6%) |
| $300,000 to $499,999 | 7 (1.6%) | 47 (13.1%) |
| $500,000 to $749,999 | 30 (7.0%) | 0 (0.0%) |
| $750,000 to $999,999 | 0 (0.0%) | 0 (0.0%) |
| $1,000,000 or more | 0 (0.0%) | 0 (0.0%) |
| Total | 429 (100.0%) | 358 (100.0%) |
Household Income by Mortgage Status in Colstrip
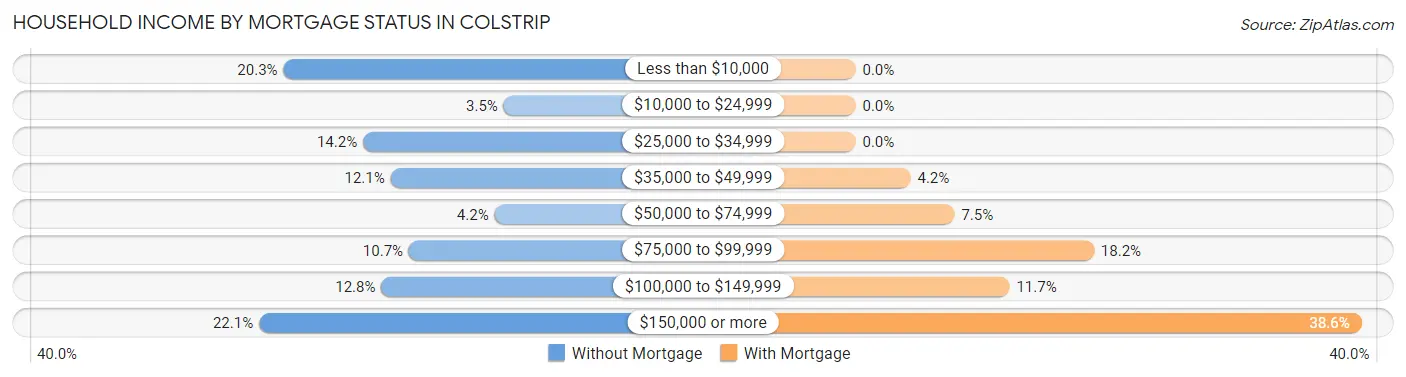
| Household Income | Without Mortgage | With Mortgage |
| Less than $10,000 | 87 (20.3%) | 0 (0.0%) |
| $10,000 to $24,999 | 15 (3.5%) | 0 (0.0%) |
| $25,000 to $34,999 | 61 (14.2%) | 0 (0.0%) |
| $35,000 to $49,999 | 52 (12.1%) | 15 (4.2%) |
| $50,000 to $74,999 | 18 (4.2%) | 27 (7.5%) |
| $75,000 to $99,999 | 46 (10.7%) | 65 (18.2%) |
| $100,000 to $149,999 | 55 (12.8%) | 42 (11.7%) |
| $150,000 or more | 95 (22.1%) | 138 (38.6%) |
| Total | 429 (100.0%) | 358 (100.0%) |
Property Value to Household Income Ratio in Colstrip
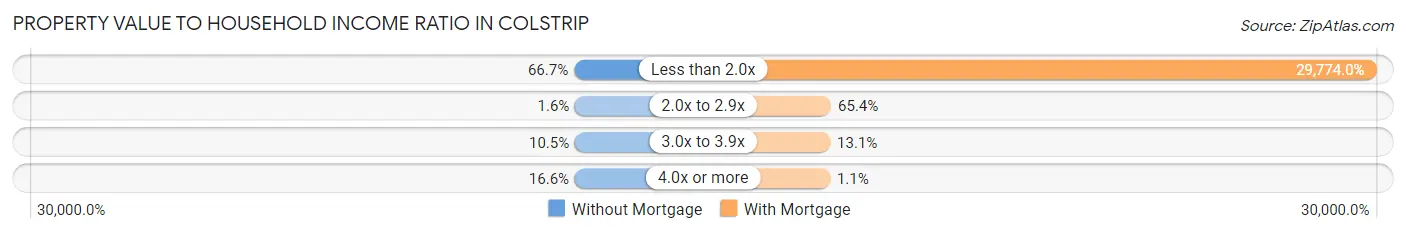
| Value-to-Income Ratio | Without Mortgage | With Mortgage |
| Less than 2.0x | 286 (66.7%) | 106,591 (29,774.0%) |
| 2.0x to 2.9x | 7 (1.6%) | 234 (65.4%) |
| 3.0x to 3.9x | 45 (10.5%) | 47 (13.1%) |
| 4.0x or more | 71 (16.6%) | 4 (1.1%) |
| Total | 429 (100.0%) | 358 (100.0%) |
Real Estate Taxes by Mortgage Status in Colstrip
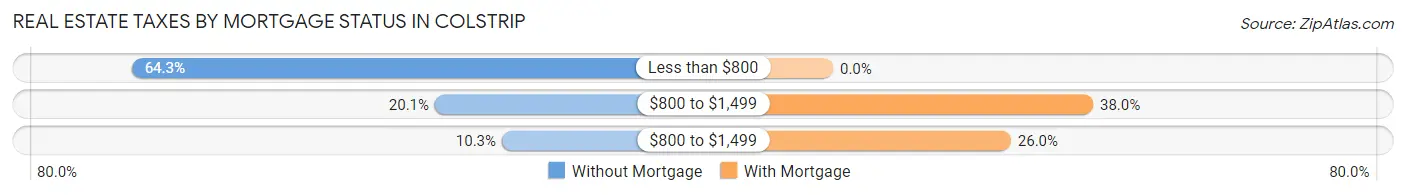
| Property Taxes | Without Mortgage | With Mortgage |
| Less than $800 | 276 (64.3%) | 0 (0.0%) |
| $800 to $1,499 | 86 (20.1%) | 136 (38.0%) |
| $800 to $1,499 | 44 (10.3%) | 93 (26.0%) |
| Total | 429 (100.0%) | 358 (100.0%) |
Health & Disability in Colstrip
Health Insurance Coverage by Age in Colstrip
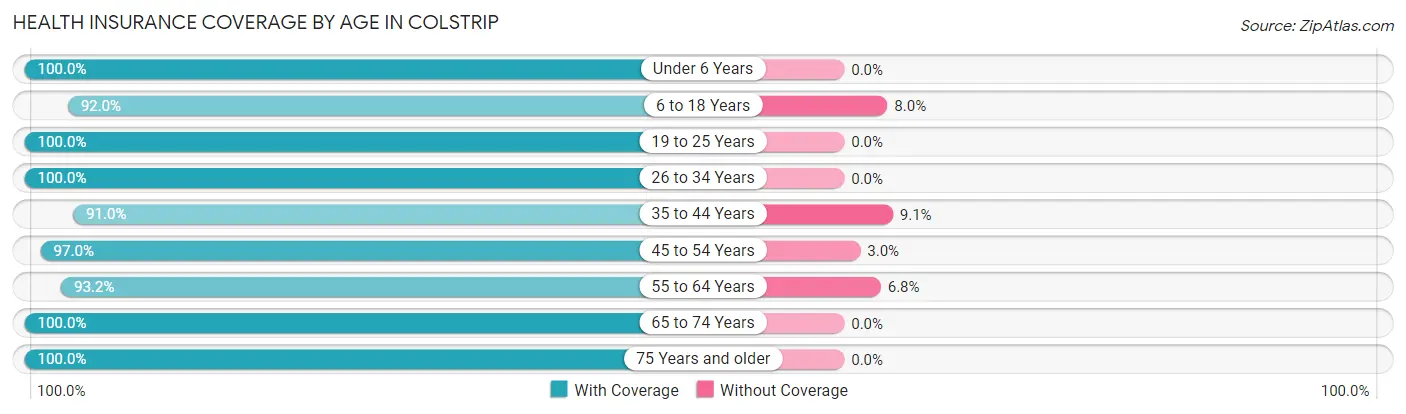
| Age Bracket | With Coverage | Without Coverage |
| Under 6 Years | 160 (100.0%) | 0 (0.0%) |
| 6 to 18 Years | 503 (92.0%) | 44 (8.0%) |
| 19 to 25 Years | 90 (100.0%) | 0 (0.0%) |
| 26 to 34 Years | 89 (100.0%) | 0 (0.0%) |
| 35 to 44 Years | 362 (90.9%) | 36 (9.0%) |
| 45 to 54 Years | 356 (97.0%) | 11 (3.0%) |
| 55 to 64 Years | 425 (93.2%) | 31 (6.8%) |
| 65 to 74 Years | 165 (100.0%) | 0 (0.0%) |
| 75 Years and older | 54 (100.0%) | 0 (0.0%) |
| Total | 2,204 (94.8%) | 122 (5.2%) |
Health Insurance Coverage by Citizenship Status in Colstrip
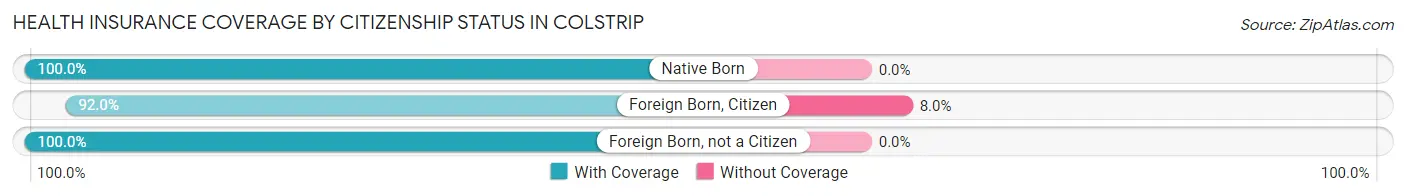
| Citizenship Status | With Coverage | Without Coverage |
| Native Born | 160 (100.0%) | 0 (0.0%) |
| Foreign Born, Citizen | 503 (92.0%) | 44 (8.0%) |
| Foreign Born, not a Citizen | 90 (100.0%) | 0 (0.0%) |
Health Insurance Coverage by Household Income in Colstrip
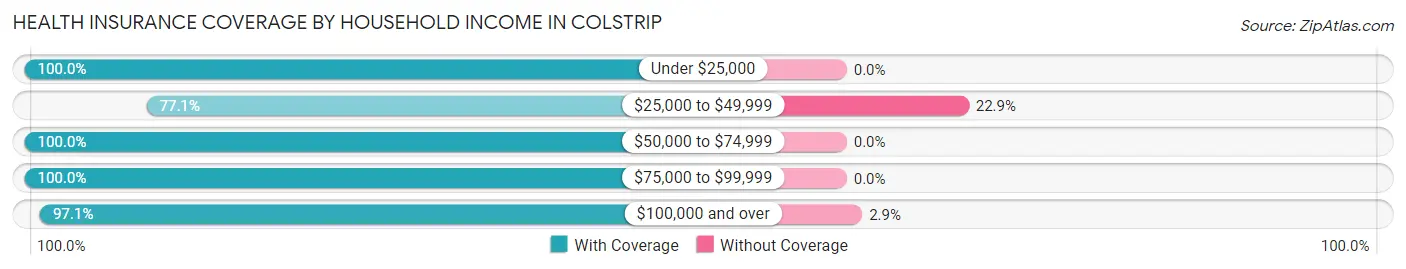
| Household Income | With Coverage | Without Coverage |
| Under $25,000 | 169 (100.0%) | 0 (0.0%) |
| $25,000 to $49,999 | 270 (77.1%) | 80 (22.9%) |
| $50,000 to $74,999 | 208 (100.0%) | 0 (0.0%) |
| $75,000 to $99,999 | 147 (100.0%) | 0 (0.0%) |
| $100,000 and over | 1,410 (97.1%) | 42 (2.9%) |
Public vs Private Health Insurance Coverage by Age in Colstrip
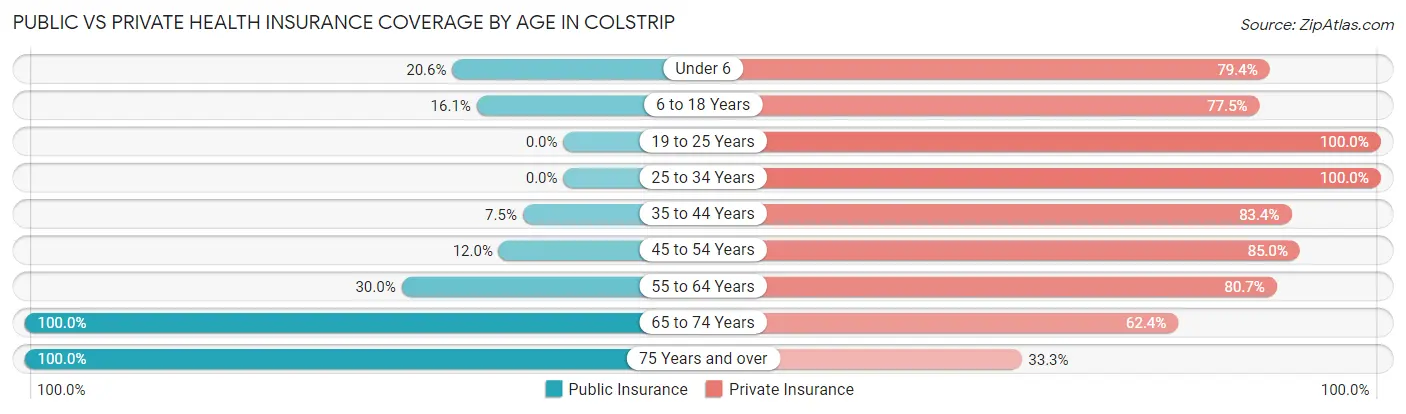
| Age Bracket | Public Insurance | Private Insurance |
| Under 6 | 33 (20.6%) | 127 (79.4%) |
| 6 to 18 Years | 88 (16.1%) | 424 (77.5%) |
| 19 to 25 Years | 0 (0.0%) | 90 (100.0%) |
| 25 to 34 Years | 0 (0.0%) | 89 (100.0%) |
| 35 to 44 Years | 30 (7.5%) | 332 (83.4%) |
| 45 to 54 Years | 44 (12.0%) | 312 (85.0%) |
| 55 to 64 Years | 137 (30.0%) | 368 (80.7%) |
| 65 to 74 Years | 165 (100.0%) | 103 (62.4%) |
| 75 Years and over | 54 (100.0%) | 18 (33.3%) |
| Total | 551 (23.7%) | 1,863 (80.1%) |
Disability Status by Sex by Age in Colstrip
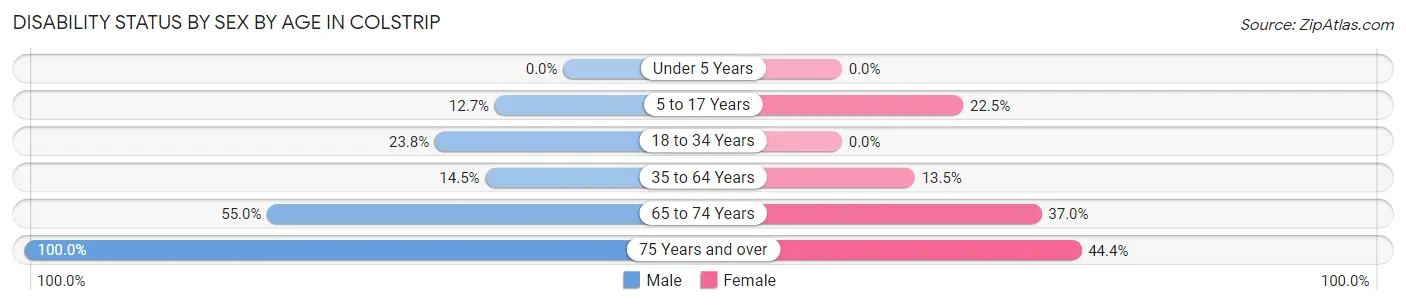
| Age Bracket | Male | Female |
| Under 5 Years | 0 (0.0%) | 0 (0.0%) |
| 5 to 17 Years | 32 (12.7%) | 63 (22.5%) |
| 18 to 34 Years | 15 (23.8%) | 0 (0.0%) |
| 35 to 64 Years | 89 (14.5%) | 82 (13.5%) |
| 65 to 74 Years | 61 (54.9%) | 20 (37.0%) |
| 75 Years and over | 36 (100.0%) | 8 (44.4%) |
Disability Class by Sex by Age in Colstrip
Disability Class: Hearing Difficulty
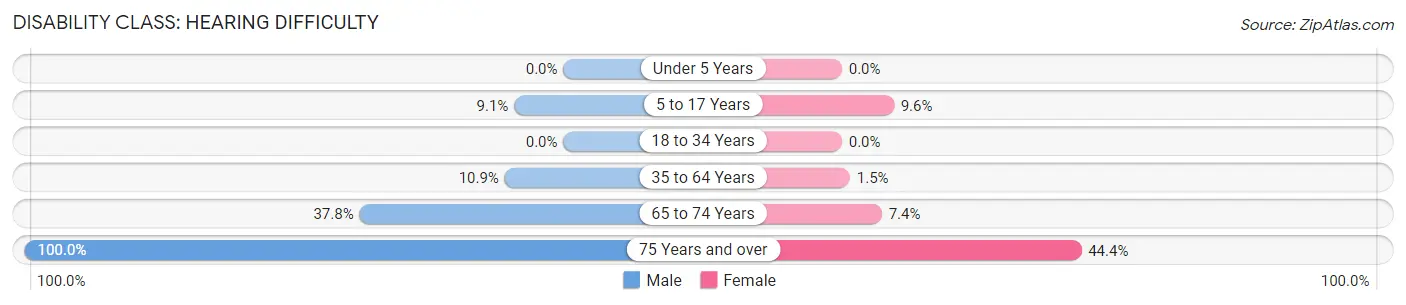
| Age Bracket | Male | Female |
| Under 5 Years | 0 (0.0%) | 0 (0.0%) |
| 5 to 17 Years | 23 (9.1%) | 27 (9.6%) |
| 18 to 34 Years | 0 (0.0%) | 0 (0.0%) |
| 35 to 64 Years | 67 (10.9%) | 9 (1.5%) |
| 65 to 74 Years | 42 (37.8%) | 4 (7.4%) |
| 75 Years and over | 36 (100.0%) | 8 (44.4%) |
Disability Class: Vision Difficulty
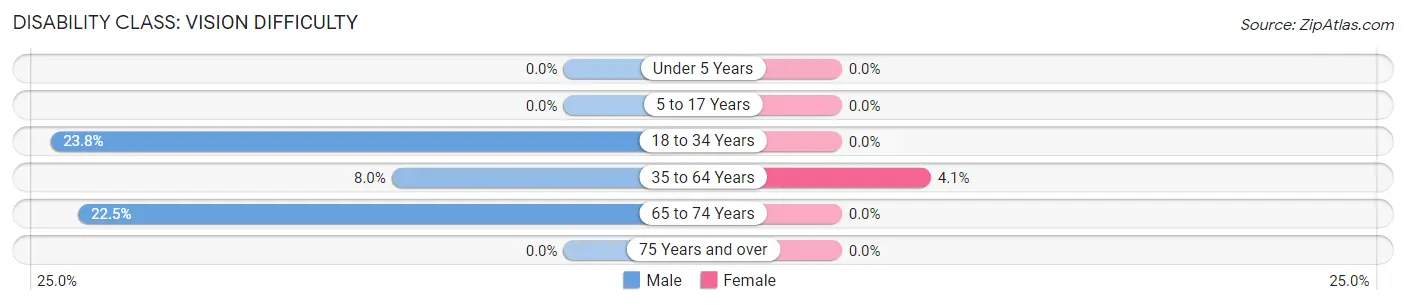
| Age Bracket | Male | Female |
| Under 5 Years | 0 (0.0%) | 0 (0.0%) |
| 5 to 17 Years | 0 (0.0%) | 0 (0.0%) |
| 18 to 34 Years | 15 (23.8%) | 0 (0.0%) |
| 35 to 64 Years | 49 (8.0%) | 25 (4.1%) |
| 65 to 74 Years | 25 (22.5%) | 0 (0.0%) |
| 75 Years and over | 0 (0.0%) | 0 (0.0%) |
Disability Class: Cognitive Difficulty
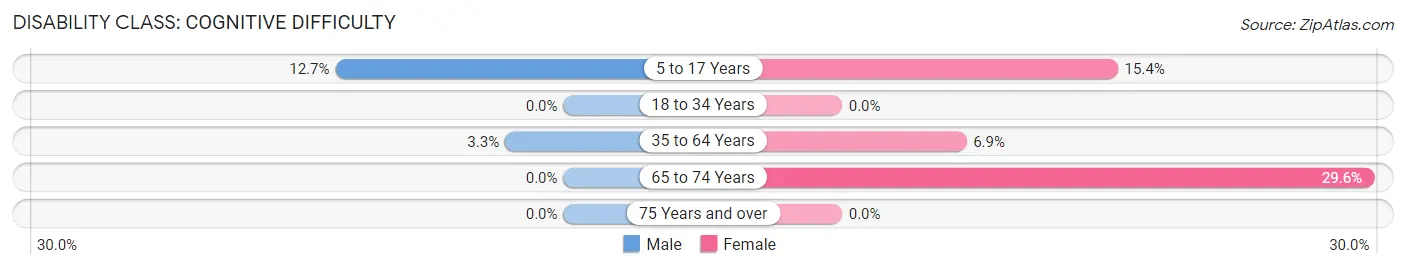
| Age Bracket | Male | Female |
| 5 to 17 Years | 32 (12.7%) | 43 (15.4%) |
| 18 to 34 Years | 0 (0.0%) | 0 (0.0%) |
| 35 to 64 Years | 20 (3.3%) | 42 (6.9%) |
| 65 to 74 Years | 0 (0.0%) | 16 (29.6%) |
| 75 Years and over | 0 (0.0%) | 0 (0.0%) |
Disability Class: Ambulatory Difficulty
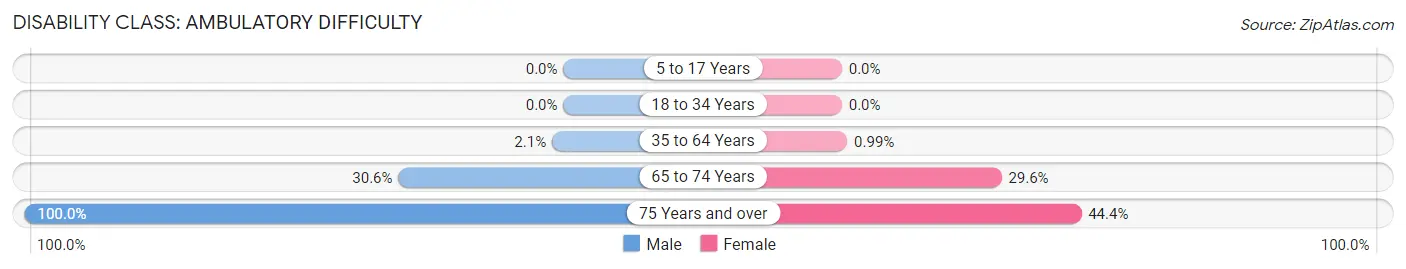
| Age Bracket | Male | Female |
| 5 to 17 Years | 0 (0.0%) | 0 (0.0%) |
| 18 to 34 Years | 0 (0.0%) | 0 (0.0%) |
| 35 to 64 Years | 13 (2.1%) | 6 (1.0%) |
| 65 to 74 Years | 34 (30.6%) | 16 (29.6%) |
| 75 Years and over | 36 (100.0%) | 8 (44.4%) |
Disability Class: Self-Care Difficulty
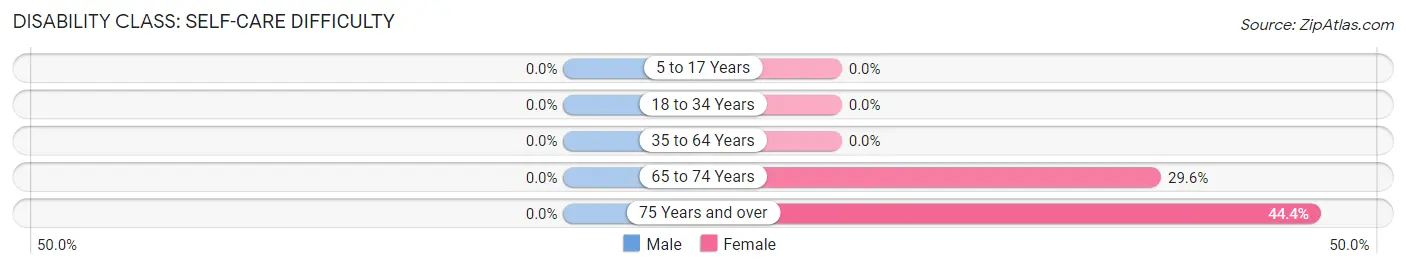
| Age Bracket | Male | Female |
| 5 to 17 Years | 0 (0.0%) | 0 (0.0%) |
| 18 to 34 Years | 0 (0.0%) | 0 (0.0%) |
| 35 to 64 Years | 0 (0.0%) | 0 (0.0%) |
| 65 to 74 Years | 0 (0.0%) | 16 (29.6%) |
| 75 Years and over | 0 (0.0%) | 8 (44.4%) |
Technology Access in Colstrip
Computing Device Access in Colstrip
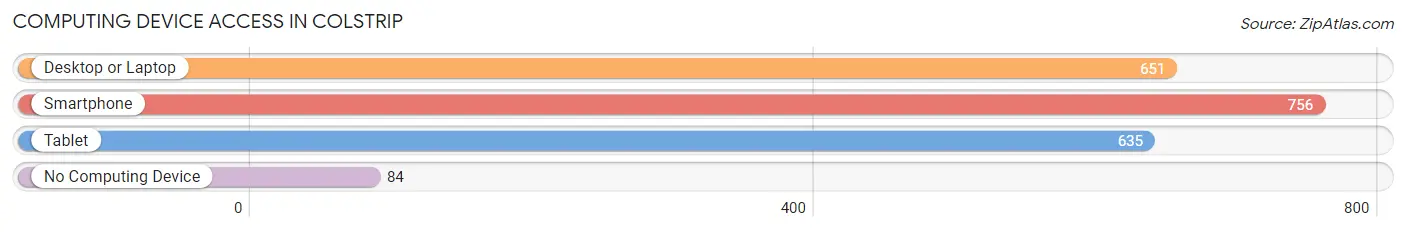
| Device Type | # Households | % Households |
| Desktop or Laptop | 651 | 69.2% |
| Smartphone | 756 | 80.3% |
| Tablet | 635 | 67.5% |
| No Computing Device | 84 | 8.9% |
| Total | 941 | 100.0% |
Internet Access in Colstrip
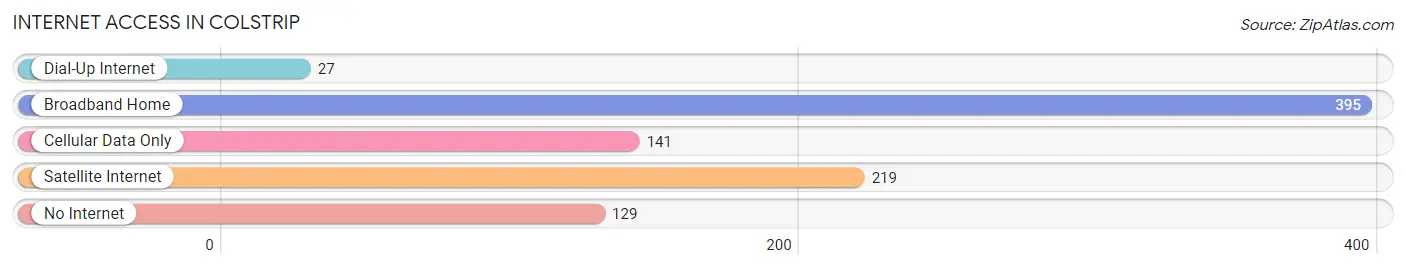
| Internet Type | # Households | % Households |
| Dial-Up Internet | 27 | 2.9% |
| Broadband Home | 395 | 42.0% |
| Cellular Data Only | 141 | 15.0% |
| Satellite Internet | 219 | 23.3% |
| No Internet | 129 | 13.7% |
| Total | 941 | 100.0% |
Colstrip Summary
Colstrip, Montana is a small town located in the southeastern corner of the state, about 40 miles from the Wyoming border. It is situated in the Powder River Basin, an area known for its coal mining and energy production. The town was founded in 1924 by the Northern Pacific Railway, and was named after the nearby Colstrip Creek.
Colstrip is located in Rosebud County, and has a population of 2,214 as of the 2010 census. The town is located at an elevation of 3,400 feet, and has a total area of 1.7 square miles. The climate is semi-arid, with hot summers and cold winters.
The economy of Colstrip is largely based on coal mining and energy production. The town is home to two large coal-fired power plants, the Colstrip Power Plant and the Rosebud Power Plant. The Colstrip Power Plant is the largest coal-fired power plant in the state, and is owned by the Montana Power Company. The Rosebud Power Plant is owned by the Rosebud Mining Company. Both plants provide electricity to the region, and employ a large number of people in the area.
In addition to the power plants, Colstrip is home to several other businesses, including a lumber mill, a grain elevator, and a variety of retail stores. The town also has a small airport, and is served by the Burlington Northern Santa Fe Railroad.
The demographics of Colstrip are largely white, with a small percentage of Native Americans and African Americans. The median household income is $41,000, and the median age is 38. The town has a high school, and a number of churches.
Colstrip is a small town with a rich history and a bright future. The town is home to a variety of businesses, and is a major source of energy for the region. The town is also home to a diverse population, and is a great place to live and work.
Common Questions
What is Per Capita Income in Colstrip?
Per Capita income in Colstrip is $40,380.
What is the Median Family Income in Colstrip?
Median Family Income in Colstrip is $110,110.
What is the Median Household income in Colstrip?
Median Household Income in Colstrip is $87,321.
What is Income or Wage Gap in Colstrip?
Income or Wage Gap in Colstrip is 48.5%.
Women in Colstrip earn 51.5 cents for every dollar earned by a man.
What is Inequality or Gini Index in Colstrip?
Inequality or Gini Index in Colstrip is 0.38.
What is the Total Population of Colstrip?
Total Population of Colstrip is 2,327.
What is the Total Male Population of Colstrip?
Total Male Population of Colstrip is 1,161.
What is the Total Female Population of Colstrip?
Total Female Population of Colstrip is 1,166.
What is the Ratio of Males per 100 Females in Colstrip?
There are 99.57 Males per 100 Females in Colstrip.
What is the Ratio of Females per 100 Males in Colstrip?
There are 100.43 Females per 100 Males in Colstrip.
What is the Median Population Age in Colstrip?
Median Population Age in Colstrip is 41.8 Years.
What is the Average Family Size in Colstrip
Average Family Size in Colstrip is 3.2 People.
What is the Average Household Size in Colstrip
Average Household Size in Colstrip is 2.5 People.
How Large is the Labor Force in Colstrip?
There are 1,229 People in the Labor Forcein in Colstrip.
What is the Percentage of People in the Labor Force in Colstrip?
70.7% of People are in the Labor Force in Colstrip.
What is the Unemployment Rate in Colstrip?
Unemployment Rate in Colstrip is 5.0%.