Lakeside, MT Map & Demographics
Lakeside Map
Lakeside Overview
$41,790
PER CAPITA INCOME
$75,118
AVG FAMILY INCOME
$71,006
AVG HOUSEHOLD INCOME
45.3%
WAGE / INCOME GAP [ % ]
54.7¢/ $1
WAGE / INCOME GAP [ $ ]
$5,321
FAMILY INCOME DEFICIT
0.43
INEQUALITY / GINI INDEX
2,564
TOTAL POPULATION
1,159
MALE POPULATION
1,405
FEMALE POPULATION
82.49
MALES / 100 FEMALES
121.23
FEMALES / 100 MALES
53.6
MEDIAN AGE
3.0
AVG FAMILY SIZE
2.2
AVG HOUSEHOLD SIZE
1,317
LABOR FORCE [ PEOPLE ]
65.4%
PERCENT IN LABOR FORCE
Lakeside Zip Codes
Lakeside Area Codes
Income in Lakeside
Income Overview in Lakeside
Per Capita Income in Lakeside is $41,790, while median incomes of families and households are $75,118 and $71,006 respectively.
| Characteristic | Number | Measure |
| Per Capita Income | 2,564 | $41,790 |
| Median Family Income | 685 | $75,118 |
| Mean Family Income | 685 | $112,227 |
| Median Household Income | 1,123 | $71,006 |
| Mean Household Income | 1,123 | $92,430 |
| Income Deficit | 685 | $5,321 |
| Wage / Income Gap (%) | 2,564 | 45.31% |
| Wage / Income Gap ($) | 2,564 | 54.69¢ per $1 |
| Gini / Inequality Index | 2,564 | 0.43 |
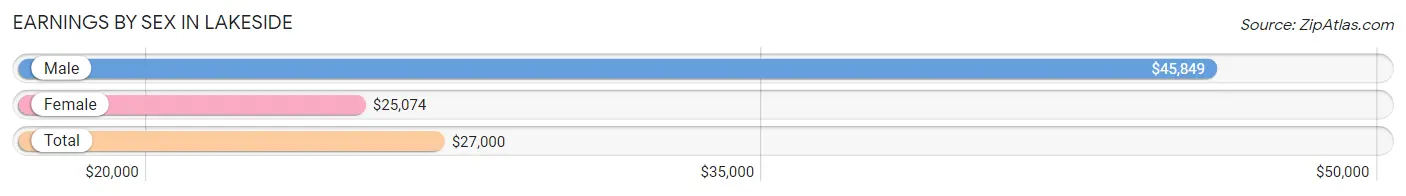
Earnings by Sex in Lakeside
Average Earnings in Lakeside are $27,000, $45,849 for men and $25,074 for women, a difference of 45.3%.
| Sex | Number | Average Earnings |
| Male | 674 (47.2%) | $45,849 |
| Female | 754 (52.8%) | $25,074 |
| Total | 1,428 (100.0%) | $27,000 |
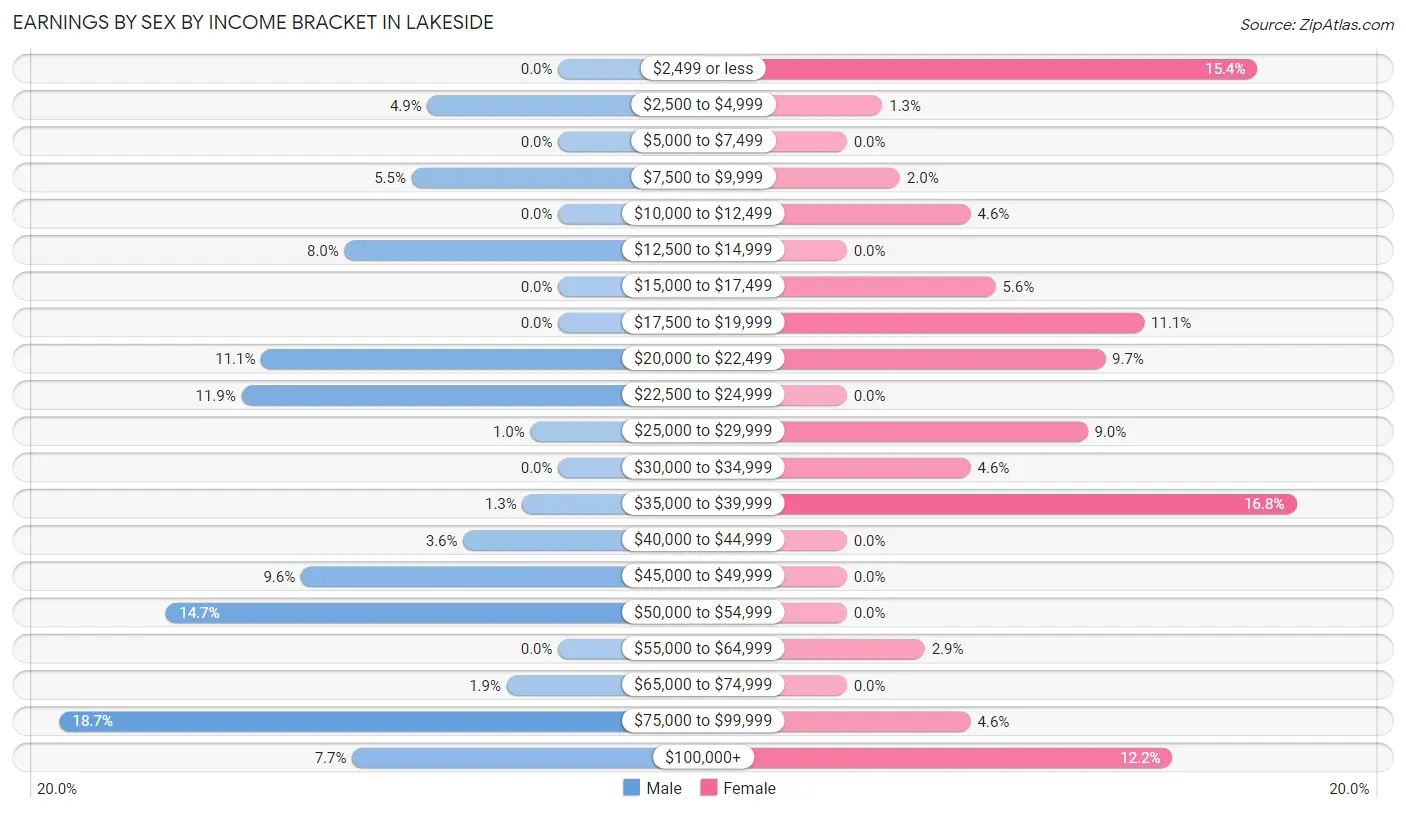
Earnings by Sex by Income Bracket in Lakeside
The most common earnings brackets in Lakeside are $75,000 to $99,999 for men (126 | 18.7%) and $35,000 to $39,999 for women (127 | 16.8%).
| Income | Male | Female |
| $2,499 or less | 0 (0.0%) | 116 (15.4%) |
| $2,500 to $4,999 | 33 (4.9%) | 10 (1.3%) |
| $5,000 to $7,499 | 0 (0.0%) | 0 (0.0%) |
| $7,500 to $9,999 | 37 (5.5%) | 15 (2.0%) |
| $10,000 to $12,499 | 0 (0.0%) | 35 (4.6%) |
| $12,500 to $14,999 | 54 (8.0%) | 0 (0.0%) |
| $15,000 to $17,499 | 0 (0.0%) | 42 (5.6%) |
| $17,500 to $19,999 | 0 (0.0%) | 84 (11.1%) |
| $20,000 to $22,499 | 75 (11.1%) | 73 (9.7%) |
| $22,500 to $24,999 | 80 (11.9%) | 0 (0.0%) |
| $25,000 to $29,999 | 7 (1.0%) | 68 (9.0%) |
| $30,000 to $34,999 | 0 (0.0%) | 35 (4.6%) |
| $35,000 to $39,999 | 9 (1.3%) | 127 (16.8%) |
| $40,000 to $44,999 | 24 (3.6%) | 0 (0.0%) |
| $45,000 to $49,999 | 65 (9.6%) | 0 (0.0%) |
| $50,000 to $54,999 | 99 (14.7%) | 0 (0.0%) |
| $55,000 to $64,999 | 0 (0.0%) | 22 (2.9%) |
| $65,000 to $74,999 | 13 (1.9%) | 0 (0.0%) |
| $75,000 to $99,999 | 126 (18.7%) | 35 (4.6%) |
| $100,000+ | 52 (7.7%) | 92 (12.2%) |
| Total | 674 (100.0%) | 754 (100.0%) |
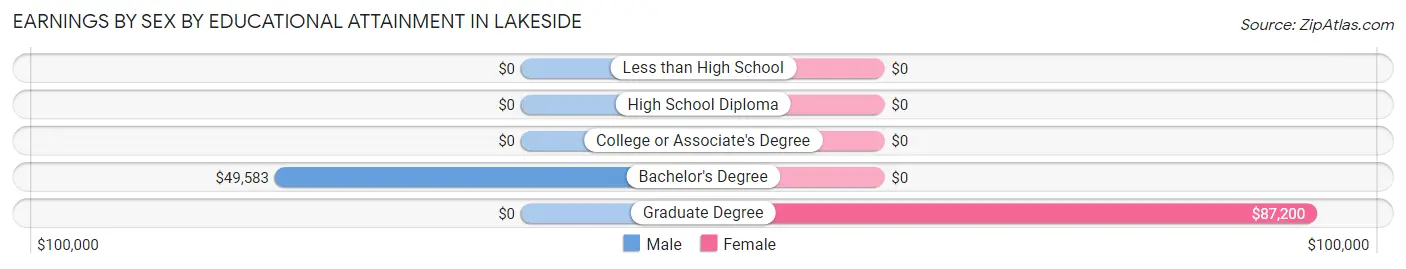
Earnings by Sex by Educational Attainment in Lakeside
Average earnings in Lakeside are $45,849 for men and $26,618 for women, a difference of 41.9%. Men with an educational attainment of bachelor's degree enjoy the highest average annual earnings of $49,583, while those with bachelor's degree education earn the least with $49,583. Women with an educational attainment of graduate degree earn the most with the average annual earnings of $87,200, while those with graduate degree education have the smallest earnings of $87,200.
| Educational Attainment | Male Income | Female Income |
| Less than High School | - | - |
| High School Diploma | - | - |
| College or Associate's Degree | - | - |
| Bachelor's Degree | $49,583 | $0 |
| Graduate Degree | - | - |
| Total | $45,849 | $26,618 |
Family Income in Lakeside
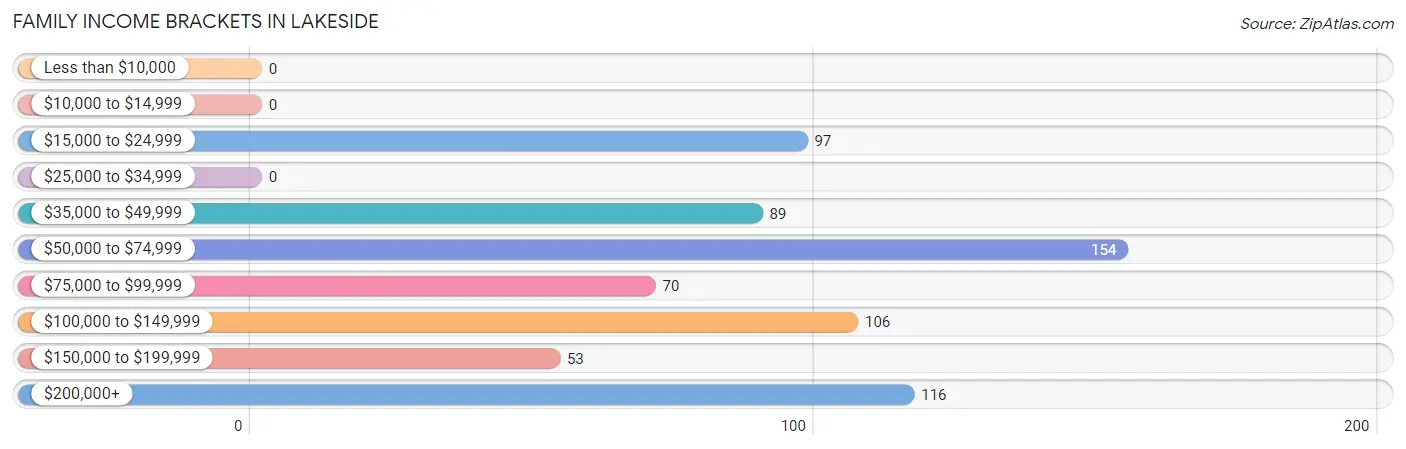
Family Income Brackets in Lakeside
According to the Lakeside family income data, there are 154 families falling into the $50,000 to $74,999 income range, which is the most common income bracket and makes up 22.5% of all families.
| Income Bracket | # Families | % Families |
| Less than $10,000 | 0 | 0.0% |
| $10,000 to $14,999 | 0 | 0.0% |
| $15,000 to $24,999 | 97 | 14.2% |
| $25,000 to $34,999 | 0 | 0.0% |
| $35,000 to $49,999 | 89 | 13.0% |
| $50,000 to $74,999 | 154 | 22.5% |
| $75,000 to $99,999 | 70 | 10.2% |
| $100,000 to $149,999 | 106 | 15.5% |
| $150,000 to $199,999 | 53 | 7.7% |
| $200,000+ | 116 | 16.9% |
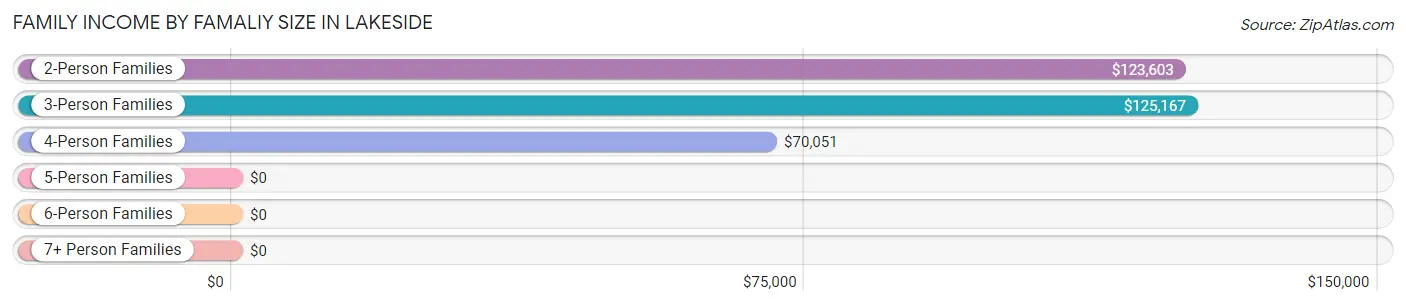
Family Income by Famaliy Size in Lakeside
3-person families (98 | 14.3%) account for the highest median family income in Lakeside with $125,167 per family, while 2-person families (395 | 57.7%) have the highest median income of $61,802 per family member.
| Income Bracket | # Families | Median Income |
| 2-Person Families | 395 (57.7%) | $123,603 |
| 3-Person Families | 98 (14.3%) | $125,167 |
| 4-Person Families | 163 (23.8%) | $70,051 |
| 5-Person Families | 20 (2.9%) | $0 |
| 6-Person Families | 0 (0.0%) | $0 |
| 7+ Person Families | 9 (1.3%) | $0 |
| Total | 685 (100.0%) | $75,118 |
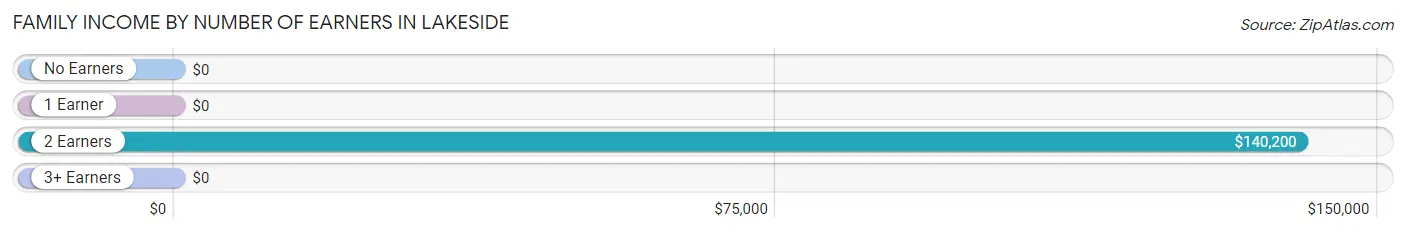
Family Income by Number of Earners in Lakeside
| Number of Earners | # Families | Median Income |
| No Earners | 94 (13.7%) | $0 |
| 1 Earner | 135 (19.7%) | $0 |
| 2 Earners | 376 (54.9%) | $140,200 |
| 3+ Earners | 80 (11.7%) | $0 |
| Total | 685 (100.0%) | $75,118 |
Household Income in Lakeside
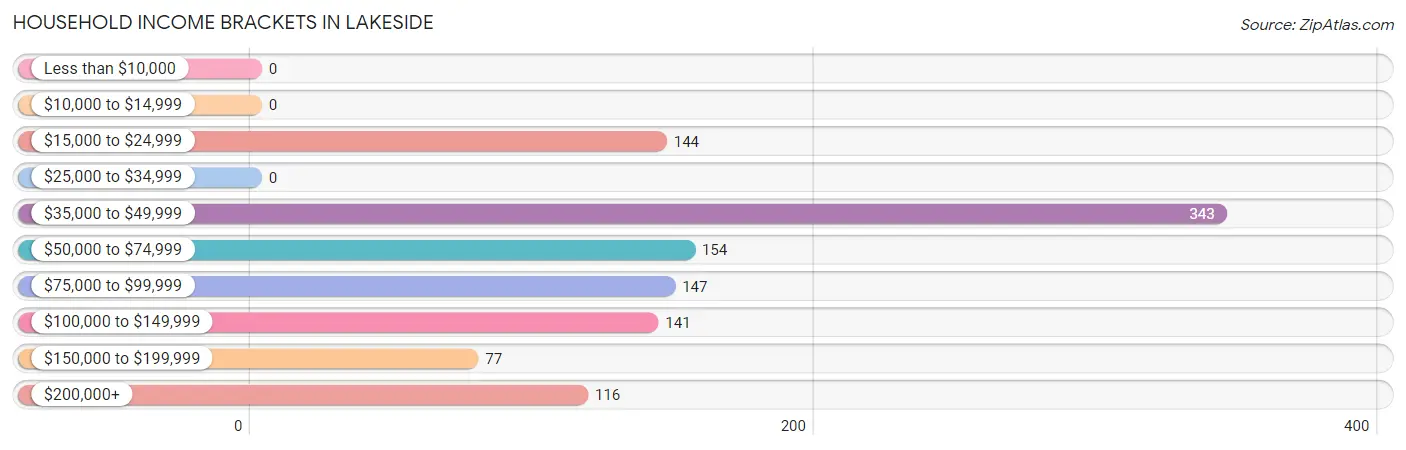
Household Income Brackets in Lakeside
With 343 households falling in the category, the $35,000 to $49,999 income range is the most frequent in Lakeside, accounting for 30.5% of all households.
| Income Bracket | # Households | % Households |
| Less than $10,000 | 0 | 0.0% |
| $10,000 to $14,999 | 0 | 0.0% |
| $15,000 to $24,999 | 144 | 12.8% |
| $25,000 to $34,999 | 0 | 0.0% |
| $35,000 to $49,999 | 343 | 30.5% |
| $50,000 to $74,999 | 154 | 13.7% |
| $75,000 to $99,999 | 147 | 13.1% |
| $100,000 to $149,999 | 141 | 12.6% |
| $150,000 to $199,999 | 77 | 6.9% |
| $200,000+ | 116 | 10.3% |
Household Income by Householder Age in Lakeside
The median household income in Lakeside is $71,006, with the highest median household income of $86,324 found in the 65+ years age bracket for the primary householder. A total of 380 households (33.8%) fall into this category.
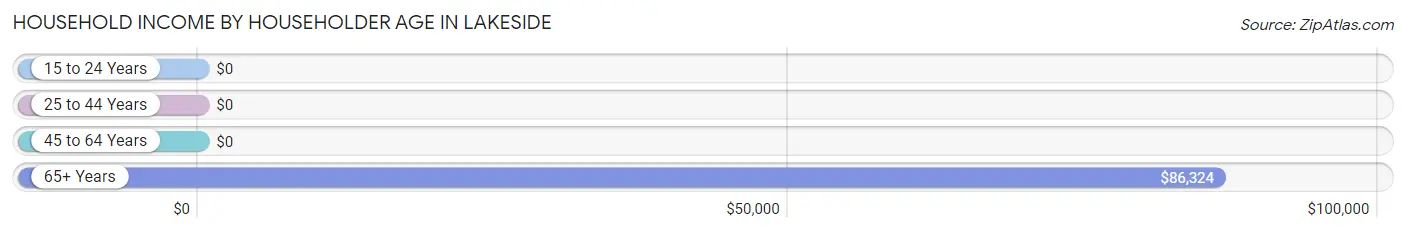
| Income Bracket | # Households | Median Income |
| 15 to 24 Years | 0 (0.0%) | $0 |
| 25 to 44 Years | 282 (25.1%) | $0 |
| 45 to 64 Years | 461 (41.0%) | $0 |
| 65+ Years | 380 (33.8%) | $86,324 |
| Total | 1,123 (100.0%) | $71,006 |
Poverty in Lakeside
Income Below Poverty by Sex and Age in Lakeside
With 22.2% poverty level for males and 12.9% for females among the residents of Lakeside, 5 year old males and under 5 year old females are the most vulnerable to poverty, with 17 males (100.0%) and 41 females (34.2%) in their respective age groups living below the poverty level.
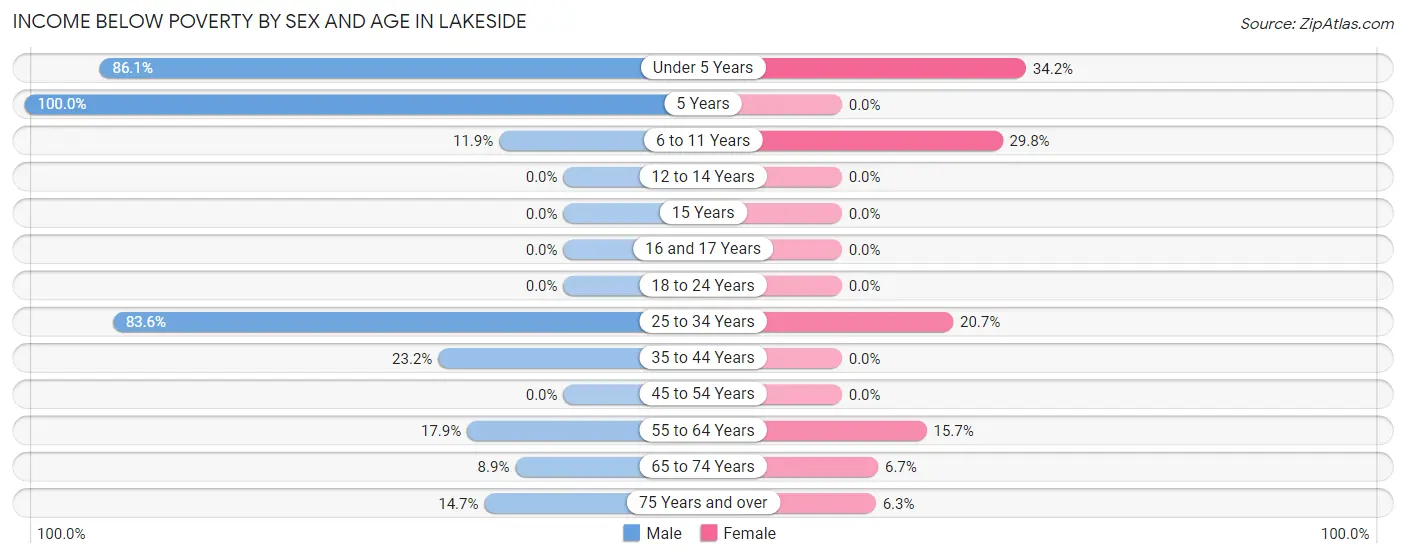
| Age Bracket | Male | Female |
| Under 5 Years | 68 (86.1%) | 41 (34.2%) |
| 5 Years | 17 (100.0%) | 0 (0.0%) |
| 6 to 11 Years | 13 (11.9%) | 34 (29.8%) |
| 12 to 14 Years | 0 (0.0%) | 0 (0.0%) |
| 15 Years | 0 (0.0%) | 0 (0.0%) |
| 16 and 17 Years | 0 (0.0%) | 0 (0.0%) |
| 18 to 24 Years | 0 (0.0%) | 0 (0.0%) |
| 25 to 34 Years | 46 (83.6%) | 38 (20.6%) |
| 35 to 44 Years | 33 (23.2%) | 0 (0.0%) |
| 45 to 54 Years | 0 (0.0%) | 0 (0.0%) |
| 55 to 64 Years | 54 (17.9%) | 45 (15.7%) |
| 65 to 74 Years | 15 (8.9%) | 14 (6.7%) |
| 75 Years and over | 11 (14.7%) | 9 (6.3%) |
| Total | 257 (22.2%) | 181 (12.9%) |
Income Above Poverty by Sex and Age in Lakeside
According to the poverty statistics in Lakeside, males aged 15 years and females aged 12 to 14 years are the age groups that are most secure financially, with 100.0% of males and 100.0% of females in these age groups living above the poverty line.
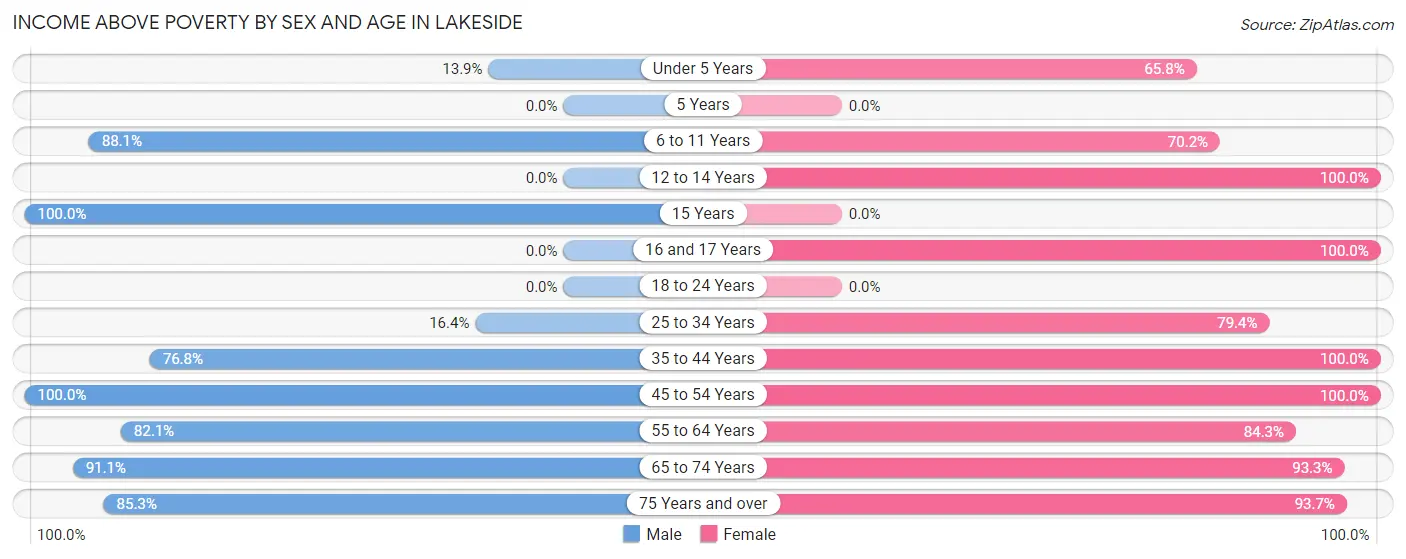
| Age Bracket | Male | Female |
| Under 5 Years | 11 (13.9%) | 79 (65.8%) |
| 5 Years | 0 (0.0%) | 0 (0.0%) |
| 6 to 11 Years | 96 (88.1%) | 80 (70.2%) |
| 12 to 14 Years | 0 (0.0%) | 86 (100.0%) |
| 15 Years | 26 (100.0%) | 0 (0.0%) |
| 16 and 17 Years | 0 (0.0%) | 84 (100.0%) |
| 18 to 24 Years | 0 (0.0%) | 0 (0.0%) |
| 25 to 34 Years | 9 (16.4%) | 146 (79.3%) |
| 35 to 44 Years | 109 (76.8%) | 83 (100.0%) |
| 45 to 54 Years | 186 (100.0%) | 97 (100.0%) |
| 55 to 64 Years | 248 (82.1%) | 241 (84.3%) |
| 65 to 74 Years | 153 (91.1%) | 194 (93.3%) |
| 75 Years and over | 64 (85.3%) | 134 (93.7%) |
| Total | 902 (77.8%) | 1,224 (87.1%) |
Income Below Poverty Among Married-Couple Families in Lakeside
The poverty statistics for married-couple families in Lakeside show that 15.5% or 106 of the total 685 families live below the poverty line. Families with 3 or 4 children have the highest poverty rate of 100.0%, comprising of 20 families. On the other hand, families with 1 or 2 children have the lowest poverty rate of 0.0%, which includes 0 families.
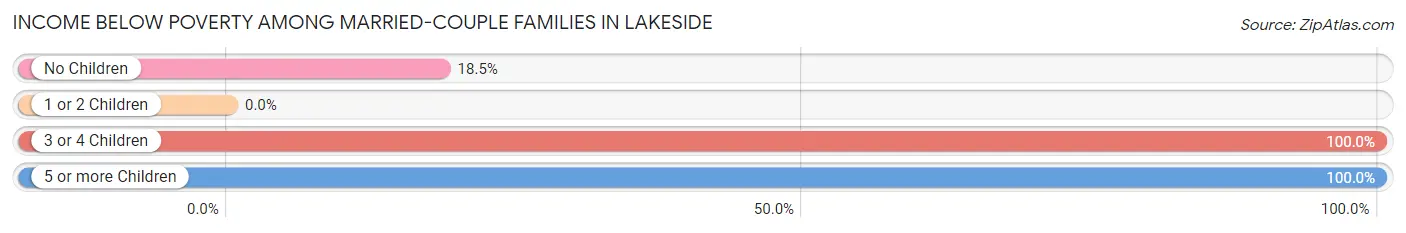
| Children | Above Poverty | Below Poverty |
| No Children | 339 (81.5%) | 77 (18.5%) |
| 1 or 2 Children | 240 (100.0%) | 0 (0.0%) |
| 3 or 4 Children | 0 (0.0%) | 20 (100.0%) |
| 5 or more Children | 0 (0.0%) | 9 (100.0%) |
| Total | 579 (84.5%) | 106 (15.5%) |
Income Below Poverty Among Single-Parent Households in Lakeside
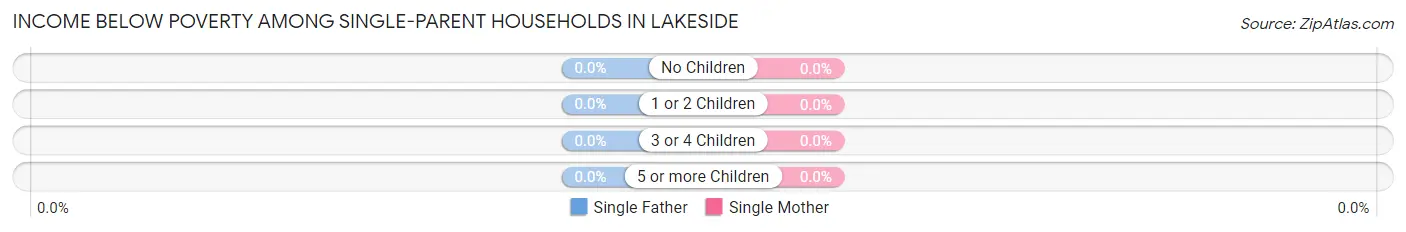
| Children | Single Father | Single Mother |
| No Children | 0 (0.0%) | 0 (0.0%) |
| 1 or 2 Children | 0 (0.0%) | 0 (0.0%) |
| 3 or 4 Children | 0 (0.0%) | 0 (0.0%) |
| 5 or more Children | 0 (0.0%) | 0 (0.0%) |
| Total | 0 (0.0%) | 0 (0.0%) |
Income Below Poverty Among Married-Couple vs Single-Parent Households in Lakeside
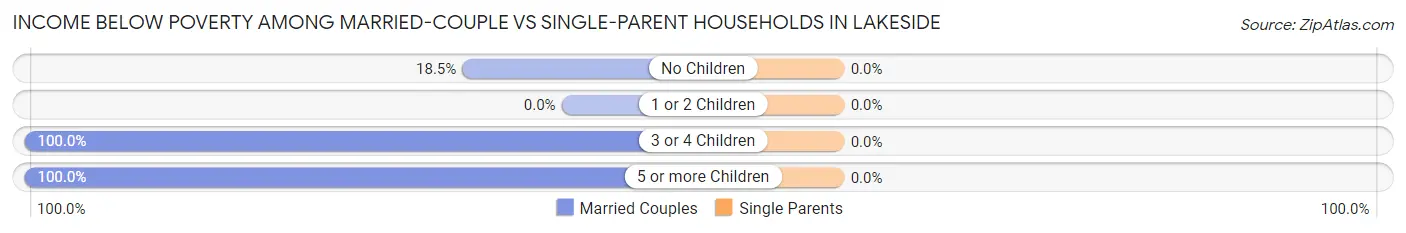
| Children | Married-Couple Families | Single-Parent Households |
| No Children | 77 (18.5%) | 0 (0.0%) |
| 1 or 2 Children | 0 (0.0%) | 0 (0.0%) |
| 3 or 4 Children | 20 (100.0%) | 0 (0.0%) |
| 5 or more Children | 9 (100.0%) | 0 (0.0%) |
| Total | 106 (15.5%) | 0 (0.0%) |
Race in Lakeside
The most populous races in Lakeside are White / Caucasian (2,435 | 95.0%), Two or more Races (88 | 3.4%), and Hispanic or Latino (57 | 2.2%).
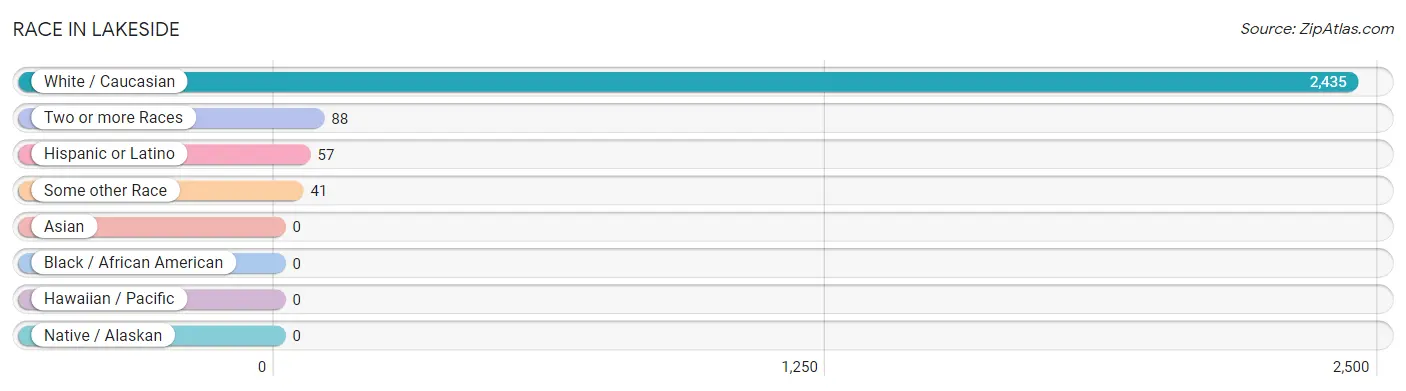
| Race | # Population | % Population |
| Asian | 0 | 0.0% |
| Black / African American | 0 | 0.0% |
| Hawaiian / Pacific | 0 | 0.0% |
| Hispanic or Latino | 57 | 2.2% |
| Native / Alaskan | 0 | 0.0% |
| White / Caucasian | 2,435 | 95.0% |
| Two or more Races | 88 | 3.4% |
| Some other Race | 41 | 1.6% |
| Total | 2,564 | 100.0% |
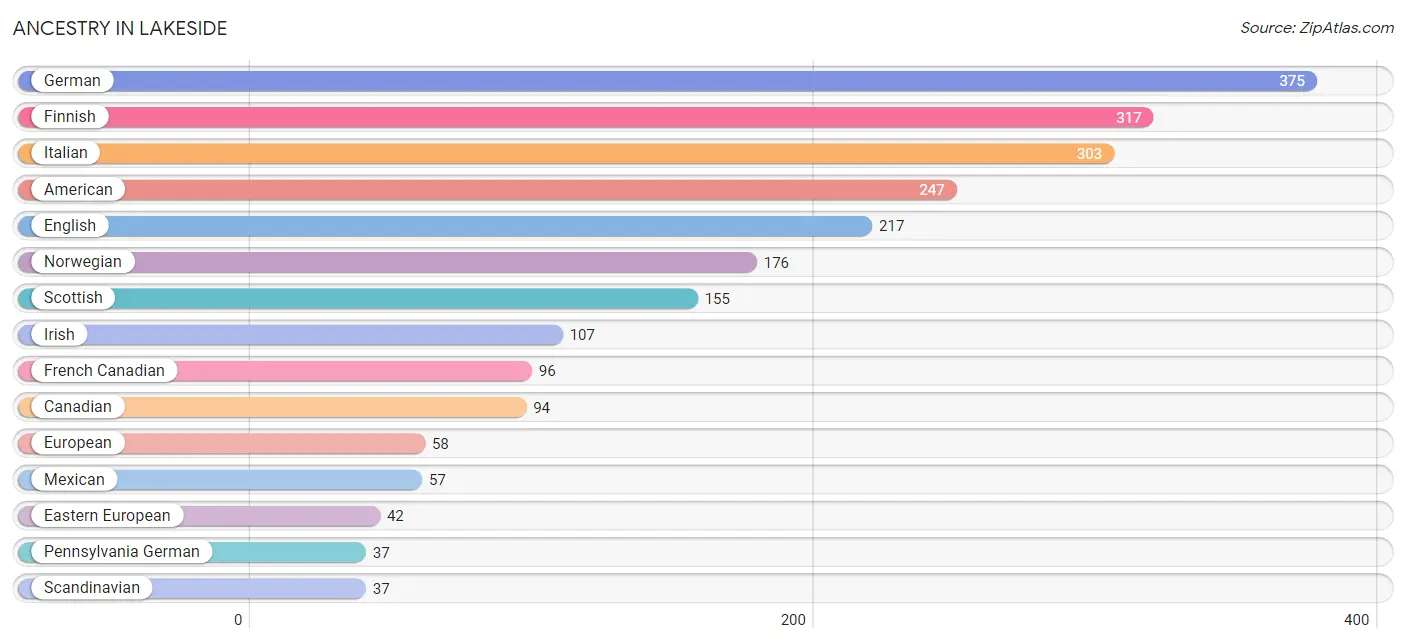
Ancestry in Lakeside
The most populous ancestries reported in Lakeside are German (375 | 14.6%), Finnish (317 | 12.4%), Italian (303 | 11.8%), American (247 | 9.6%), and English (217 | 8.5%), together accounting for 56.9% of all Lakeside residents.
| Ancestry | # Population | % Population |
| American | 247 | 9.6% |
| Austrian | 6 | 0.2% |
| Canadian | 94 | 3.7% |
| Croatian | 31 | 1.2% |
| Czech | 16 | 0.6% |
| Danish | 17 | 0.7% |
| Dutch | 12 | 0.5% |
| Eastern European | 42 | 1.6% |
| English | 217 | 8.5% |
| European | 58 | 2.3% |
| Finnish | 317 | 12.4% |
| French Canadian | 96 | 3.7% |
| German | 375 | 14.6% |
| Greek | 13 | 0.5% |
| Irish | 107 | 4.2% |
| Italian | 303 | 11.8% |
| Mexican | 57 | 2.2% |
| Northern European | 12 | 0.5% |
| Norwegian | 176 | 6.9% |
| Pennsylvania German | 37 | 1.4% |
| Polish | 6 | 0.2% |
| Russian | 9 | 0.4% |
| Scandinavian | 37 | 1.4% |
| Scotch-Irish | 12 | 0.5% |
| Scottish | 155 | 6.0% |
| Slovak | 17 | 0.7% |
| Swedish | 32 | 1.3% | View All 27 Rows |
Immigrants in Lakeside
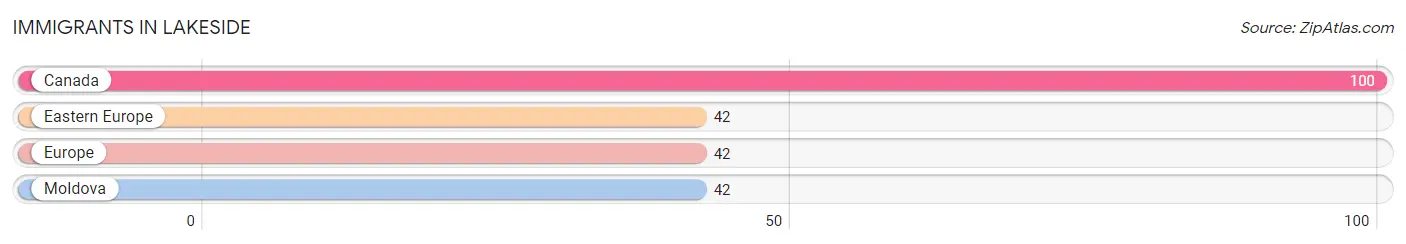
The most numerous immigrant groups reported in Lakeside came from Canada (100 | 3.9%), Eastern Europe (42 | 1.6%), Europe (42 | 1.6%), and Moldova (42 | 1.6%), together accounting for 8.8% of all Lakeside residents.
| Immigration Origin | # Population | % Population |
| Canada | 100 | 3.9% |
| Eastern Europe | 42 | 1.6% |
| Europe | 42 | 1.6% |
| Moldova | 42 | 1.6% | View All 4 Rows |
Sex and Age in Lakeside
Sex and Age in Lakeside
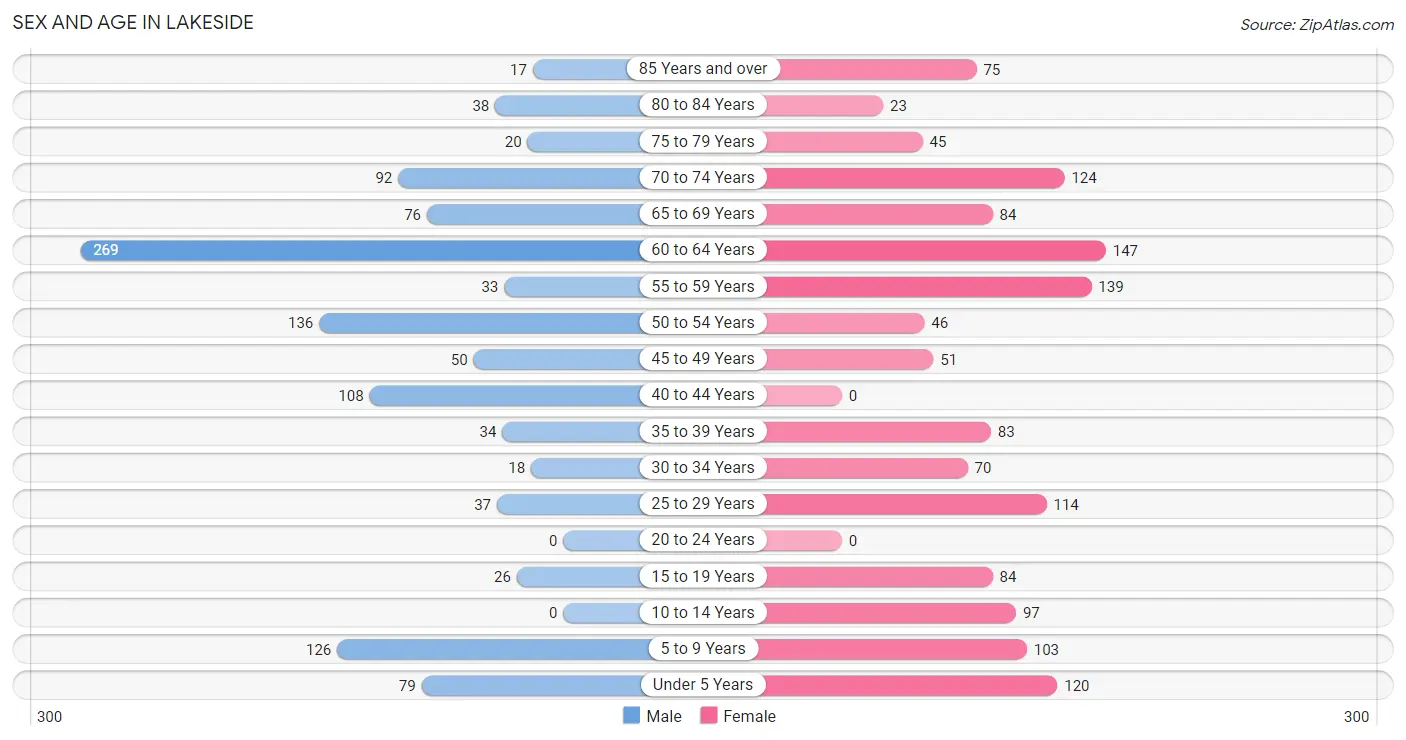
The most populous age groups in Lakeside are 60 to 64 Years (269 | 23.2%) for men and 60 to 64 Years (147 | 10.5%) for women.
| Age Bracket | Male | Female |
| Under 5 Years | 79 (6.8%) | 120 (8.5%) |
| 5 to 9 Years | 126 (10.9%) | 103 (7.3%) |
| 10 to 14 Years | 0 (0.0%) | 97 (6.9%) |
| 15 to 19 Years | 26 (2.2%) | 84 (6.0%) |
| 20 to 24 Years | 0 (0.0%) | 0 (0.0%) |
| 25 to 29 Years | 37 (3.2%) | 114 (8.1%) |
| 30 to 34 Years | 18 (1.5%) | 70 (5.0%) |
| 35 to 39 Years | 34 (2.9%) | 83 (5.9%) |
| 40 to 44 Years | 108 (9.3%) | 0 (0.0%) |
| 45 to 49 Years | 50 (4.3%) | 51 (3.6%) |
| 50 to 54 Years | 136 (11.7%) | 46 (3.3%) |
| 55 to 59 Years | 33 (2.9%) | 139 (9.9%) |
| 60 to 64 Years | 269 (23.2%) | 147 (10.5%) |
| 65 to 69 Years | 76 (6.6%) | 84 (6.0%) |
| 70 to 74 Years | 92 (7.9%) | 124 (8.8%) |
| 75 to 79 Years | 20 (1.7%) | 45 (3.2%) |
| 80 to 84 Years | 38 (3.3%) | 23 (1.6%) |
| 85 Years and over | 17 (1.5%) | 75 (5.3%) |
| Total | 1,159 (100.0%) | 1,405 (100.0%) |
Families and Households in Lakeside
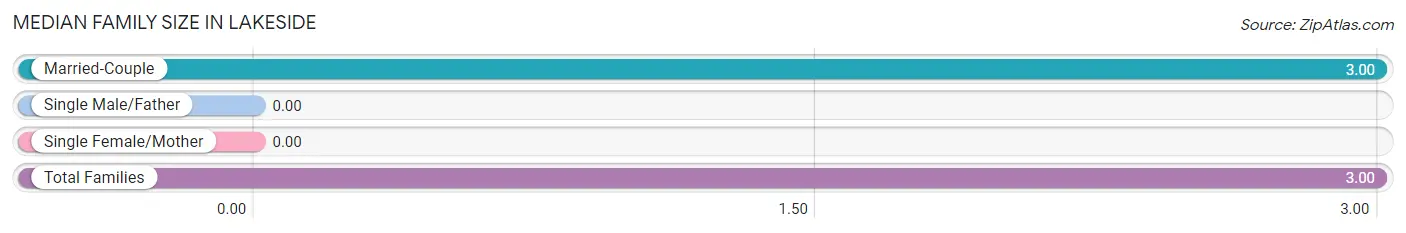
Median Family Size in Lakeside
| Family Type | # Families | Family Size |
| Married-Couple | 685 (100.0%) | 3.00 |
| Single Male/Father | 0 (0.0%) | - |
| Single Female/Mother | 0 (0.0%) | - |
| Total Families | 685 (100.0%) | 3.00 |
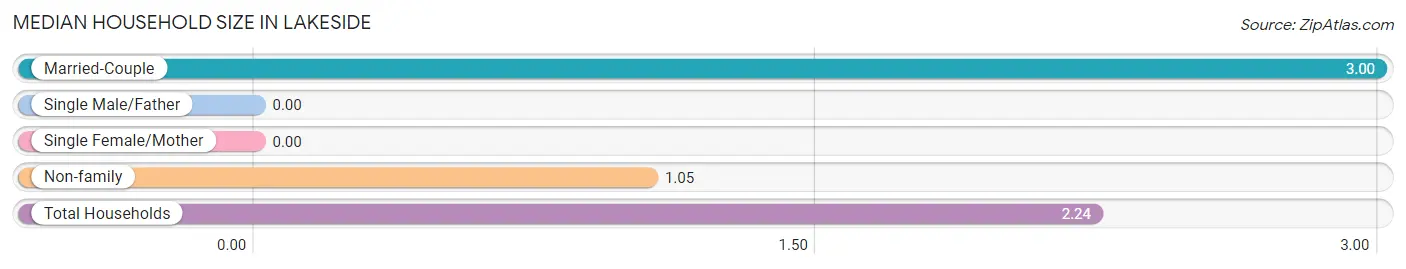
Median Household Size in Lakeside
| Household Type | # Households | Household Size |
| Married-Couple | 685 (61.0%) | 3.00 |
| Single Male/Father | 0 (0.0%) | - |
| Single Female/Mother | 0 (0.0%) | - |
| Non-family | 438 (39.0%) | 1.05 |
| Total Households | 1,123 (100.0%) | 2.24 |
Household Size by Marriage Status in Lakeside
Out of a total of 1,123 households in Lakeside, 685 (61.0%) are family households, while 438 (39.0%) are nonfamily households. The most numerous type of family households are 2-person households, comprising 395, and the most common type of nonfamily households are 1-person households, comprising 417.
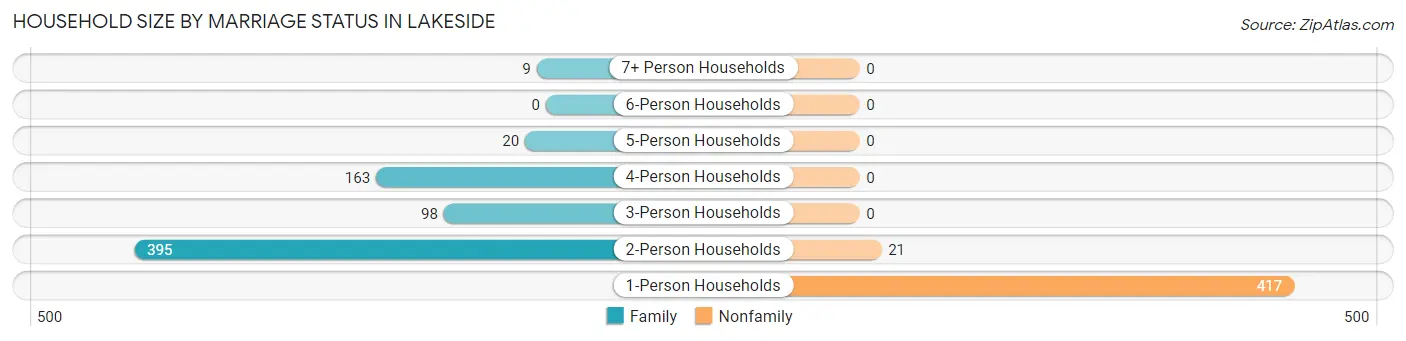
| Household Size | Family Households | Nonfamily Households |
| 1-Person Households | - | 417 (37.1%) |
| 2-Person Households | 395 (35.2%) | 21 (1.9%) |
| 3-Person Households | 98 (8.7%) | 0 (0.0%) |
| 4-Person Households | 163 (14.5%) | 0 (0.0%) |
| 5-Person Households | 20 (1.8%) | 0 (0.0%) |
| 6-Person Households | 0 (0.0%) | 0 (0.0%) |
| 7+ Person Households | 9 (0.8%) | 0 (0.0%) |
| Total | 685 (61.0%) | 438 (39.0%) |
Female Fertility in Lakeside
Fertility by Age in Lakeside
Average fertility rate in Lakeside is 75.0 births per 1,000 women. Women in the age bracket of 20 to 34 years have the highest fertility rate with 109.0 births per 1,000 women. Women in the age bracket of 20 to 34 years acount for 66.7% of all women with births.
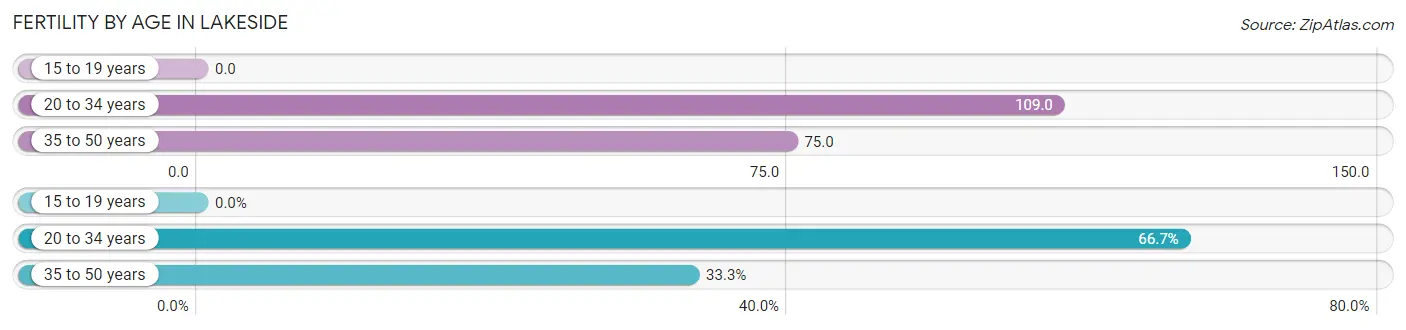
| Age Bracket | Women with Births | Births / 1,000 Women |
| 15 to 19 years | 0 (0.0%) | 0.0 |
| 20 to 34 years | 20 (66.7%) | 109.0 |
| 35 to 50 years | 10 (33.3%) | 75.0 |
| Total | 30 (100.0%) | 75.0 |
Fertility by Age by Marriage Status in Lakeside
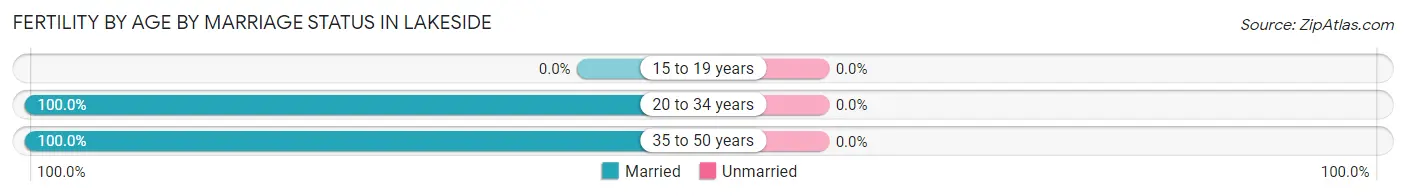
| Age Bracket | Married | Unmarried |
| 15 to 19 years | 0 (0.0%) | 0 (0.0%) |
| 20 to 34 years | 20 (100.0%) | 0 (0.0%) |
| 35 to 50 years | 10 (100.0%) | 0 (0.0%) |
| Total | 30 (100.0%) | 0 (0.0%) |
Fertility by Education in Lakeside
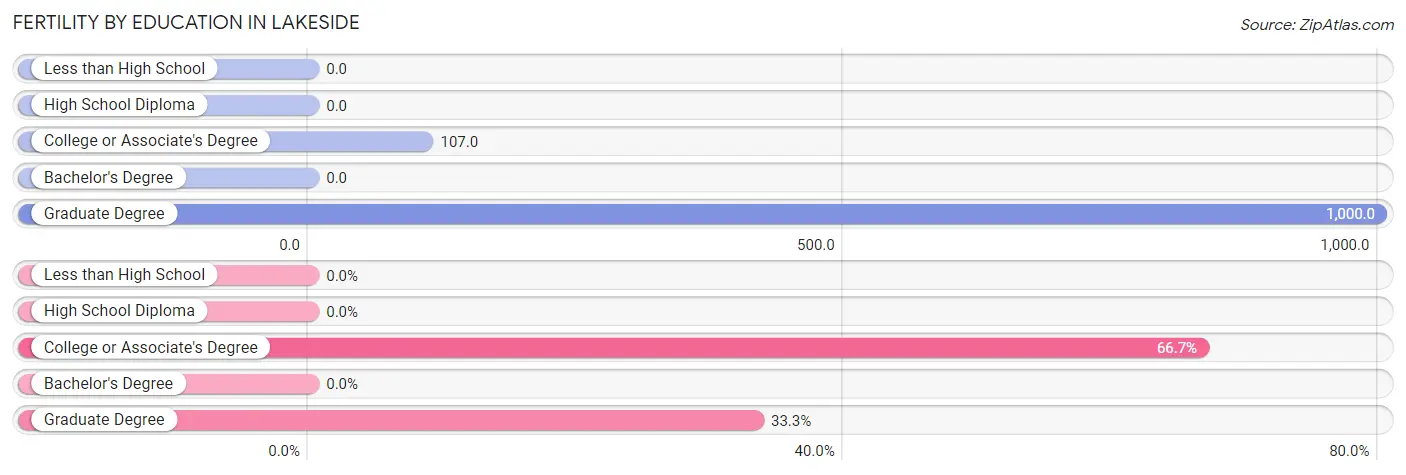
| Educational Attainment | Women with Births | Births / 1,000 Women |
| Less than High School | 0 (0.0%) | 0.0 |
| High School Diploma | 0 (0.0%) | 0.0 |
| College or Associate's Degree | 20 (66.7%) | 107.0 |
| Bachelor's Degree | 0 (0.0%) | 0.0 |
| Graduate Degree | 10 (33.3%) | 1,000.0 |
| Total | 30 (100.0%) | 75.0 |
Fertility by Education by Marriage Status in Lakeside
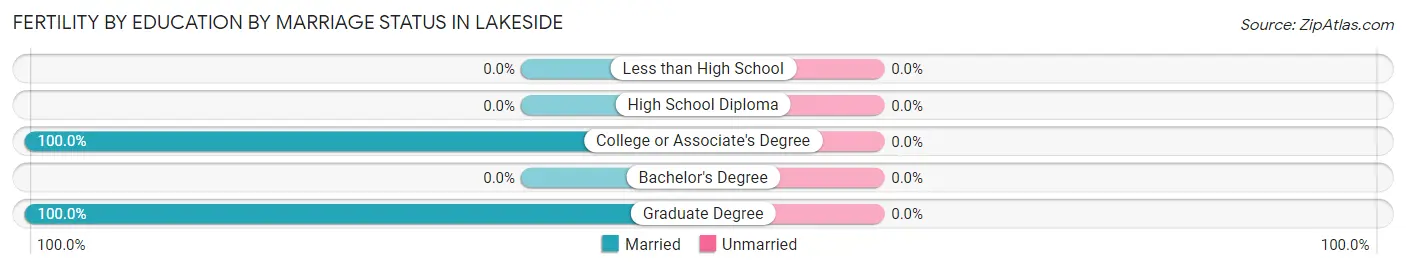
| Educational Attainment | Married | Unmarried |
| Less than High School | 0 (0.0%) | 0 (0.0%) |
| High School Diploma | 0 (0.0%) | 0 (0.0%) |
| College or Associate's Degree | 20 (100.0%) | 0 (0.0%) |
| Bachelor's Degree | 0 (0.0%) | 0 (0.0%) |
| Graduate Degree | 10 (100.0%) | 0 (0.0%) |
| Total | 30 (100.0%) | 0 (0.0%) |
Employment Characteristics in Lakeside
Employment by Class of Employer in Lakeside
Among the 1,306 employed individuals in Lakeside, private company employees (832 | 63.7%), self-employed (not incorporated) (186 | 14.2%), and self-employed (incorporated) (77 | 5.9%) make up the most common classes of employment.
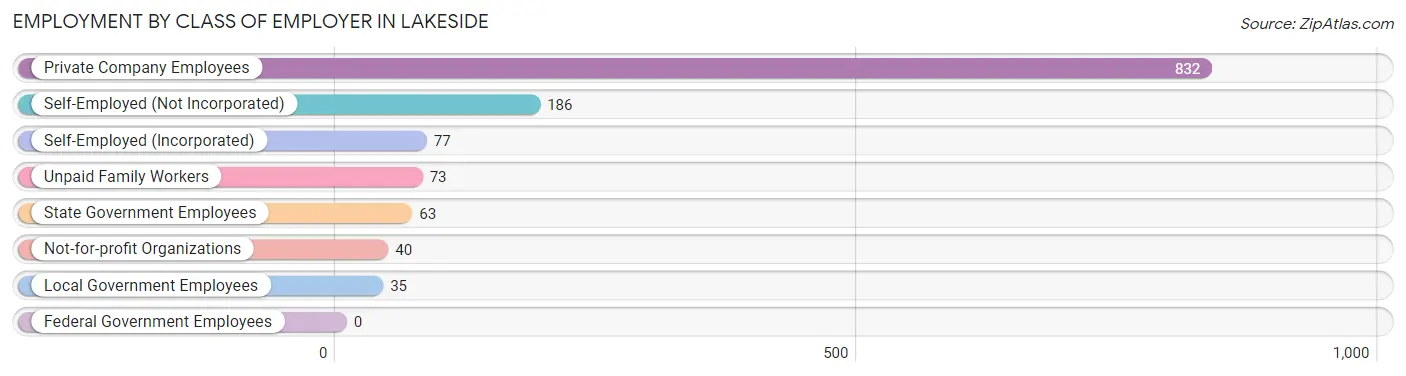
| Employer Class | # Employees | % Employees |
| Private Company Employees | 832 | 63.7% |
| Self-Employed (Incorporated) | 77 | 5.9% |
| Self-Employed (Not Incorporated) | 186 | 14.2% |
| Not-for-profit Organizations | 40 | 3.1% |
| Local Government Employees | 35 | 2.7% |
| State Government Employees | 63 | 4.8% |
| Federal Government Employees | 0 | 0.0% |
| Unpaid Family Workers | 73 | 5.6% |
| Total | 1,306 | 100.0% |
Employment Status by Age in Lakeside
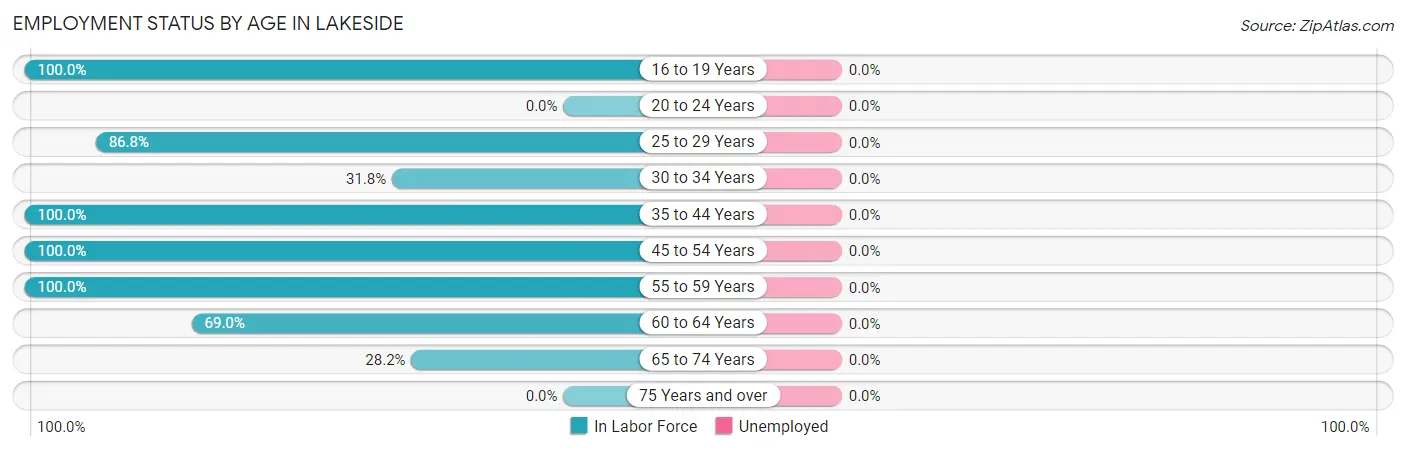
| Age Bracket | In Labor Force | Unemployed |
| 16 to 19 Years | 84 (100.0%) | 0 (0.0%) |
| 20 to 24 Years | 0 (0.0%) | 0 (0.0%) |
| 25 to 29 Years | 131 (86.8%) | 0 (0.0%) |
| 30 to 34 Years | 28 (31.8%) | 0 (0.0%) |
| 35 to 44 Years | 225 (100.0%) | 0 (0.0%) |
| 45 to 54 Years | 283 (100.0%) | 0 (0.0%) |
| 55 to 59 Years | 172 (100.0%) | 0 (0.0%) |
| 60 to 64 Years | 287 (69.0%) | 0 (0.0%) |
| 65 to 74 Years | 106 (28.2%) | 0 (0.0%) |
| 75 Years and over | 0 (0.0%) | 0 (0.0%) |
| Total | 1,317 (65.4%) | 0 (0.0%) |
Employment Status by Educational Attainment in Lakeside
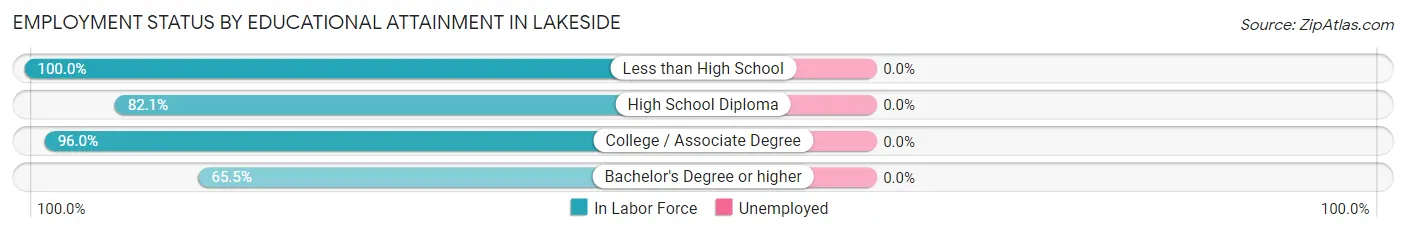
| Educational Attainment | In Labor Force | Unemployed |
| Less than High School | 76 (100.0%) | 0 (0.0%) |
| High School Diploma | 371 (82.1%) | 0 (0.0%) |
| College / Associate Degree | 474 (96.0%) | 0 (0.0%) |
| Bachelor's Degree or higher | 205 (65.5%) | 0 (0.0%) |
| Total | 1,125 (84.3%) | 0 (0.0%) |
Employment Occupations by Sex in Lakeside
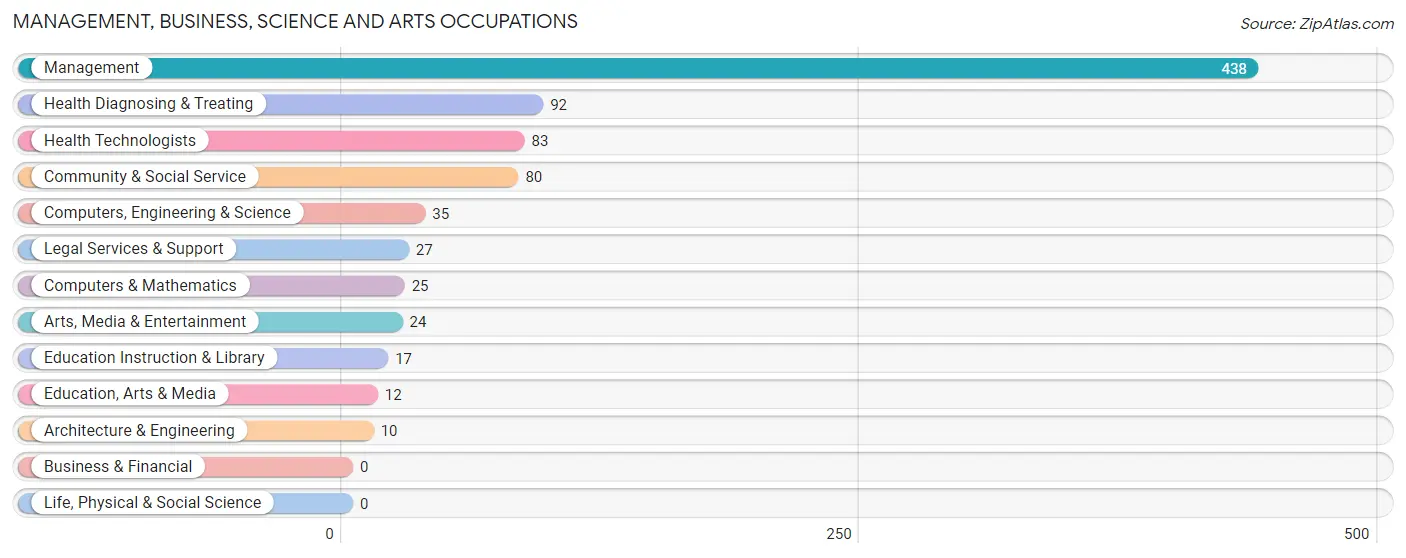
Management, Business, Science and Arts Occupations
The most common Management, Business, Science and Arts occupations in Lakeside are Management (438 | 33.3%), Health Diagnosing & Treating (92 | 7.0%), Health Technologists (83 | 6.3%), Community & Social Service (80 | 6.1%), and Computers, Engineering & Science (35 | 2.7%).
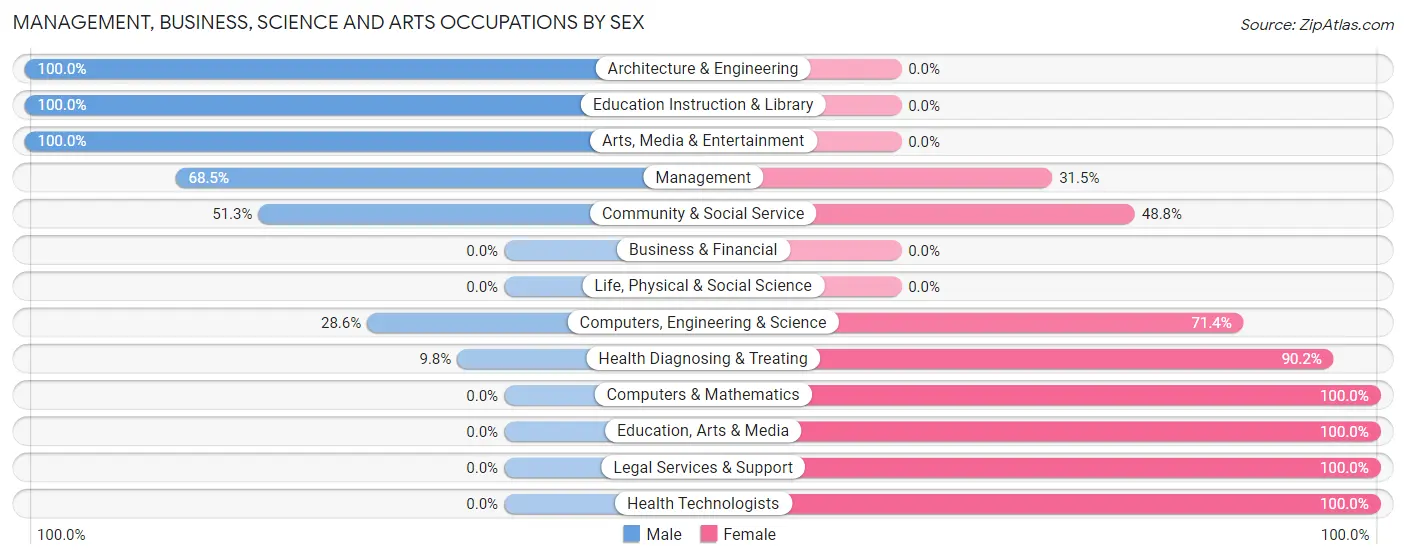
Management, Business, Science and Arts Occupations by Sex
Within the Management, Business, Science and Arts occupations in Lakeside, the most male-oriented occupations are Architecture & Engineering (100.0%), Education Instruction & Library (100.0%), and Arts, Media & Entertainment (100.0%), while the most female-oriented occupations are Computers & Mathematics (100.0%), Education, Arts & Media (100.0%), and Legal Services & Support (100.0%).
| Occupation | Male | Female |
| Management | 300 (68.5%) | 138 (31.5%) |
| Business & Financial | 0 (0.0%) | 0 (0.0%) |
| Computers, Engineering & Science | 10 (28.6%) | 25 (71.4%) |
| Computers & Mathematics | 0 (0.0%) | 25 (100.0%) |
| Architecture & Engineering | 10 (100.0%) | 0 (0.0%) |
| Life, Physical & Social Science | 0 (0.0%) | 0 (0.0%) |
| Community & Social Service | 41 (51.2%) | 39 (48.7%) |
| Education, Arts & Media | 0 (0.0%) | 12 (100.0%) |
| Legal Services & Support | 0 (0.0%) | 27 (100.0%) |
| Education Instruction & Library | 17 (100.0%) | 0 (0.0%) |
| Arts, Media & Entertainment | 24 (100.0%) | 0 (0.0%) |
| Health Diagnosing & Treating | 9 (9.8%) | 83 (90.2%) |
| Health Technologists | 0 (0.0%) | 83 (100.0%) |
| Total (Category) | 360 (55.8%) | 285 (44.2%) |
| Total (Overall) | 662 (50.3%) | 654 (49.7%) |
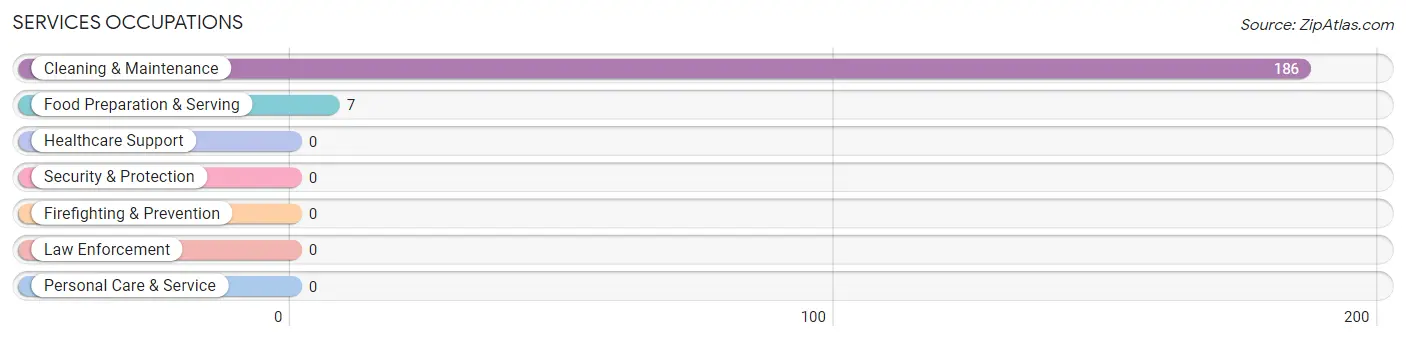
Services Occupations
The most common Services occupations in Lakeside are Cleaning & Maintenance (186 | 14.1%), and Food Preparation & Serving (7 | 0.5%).
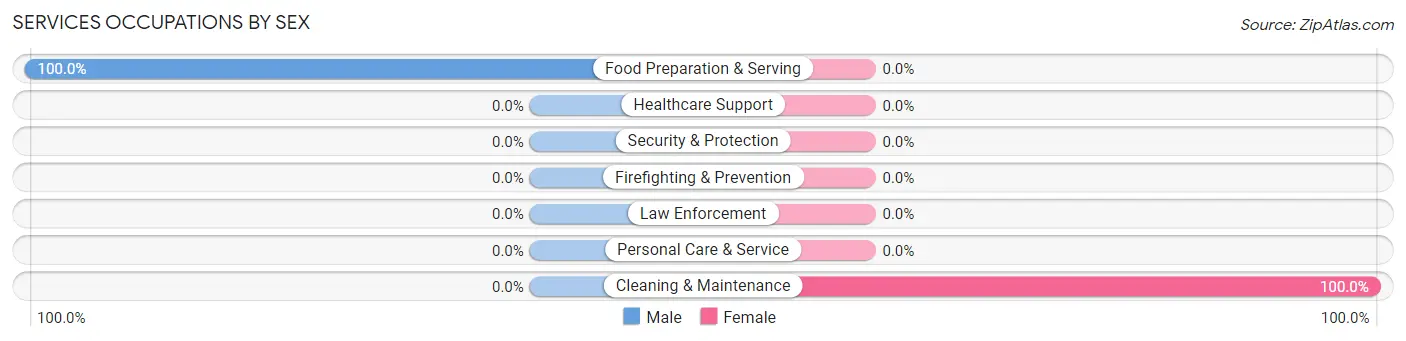
Services Occupations by Sex
| Occupation | Male | Female |
| Healthcare Support | 0 (0.0%) | 0 (0.0%) |
| Security & Protection | 0 (0.0%) | 0 (0.0%) |
| Firefighting & Prevention | 0 (0.0%) | 0 (0.0%) |
| Law Enforcement | 0 (0.0%) | 0 (0.0%) |
| Food Preparation & Serving | 7 (100.0%) | 0 (0.0%) |
| Cleaning & Maintenance | 0 (0.0%) | 186 (100.0%) |
| Personal Care & Service | 0 (0.0%) | 0 (0.0%) |
| Total (Category) | 7 (3.6%) | 186 (96.4%) |
| Total (Overall) | 662 (50.3%) | 654 (49.7%) |
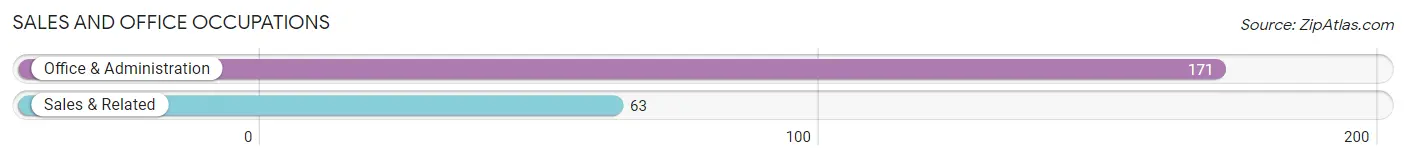
Sales and Office Occupations
The most common Sales and Office occupations in Lakeside are Office & Administration (171 | 13.0%), and Sales & Related (63 | 4.8%).
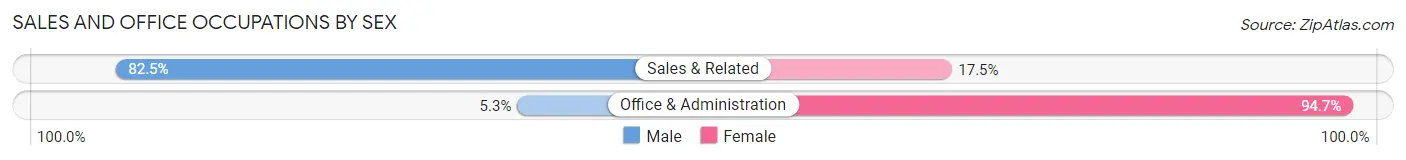
Sales and Office Occupations by Sex
| Occupation | Male | Female |
| Sales & Related | 52 (82.5%) | 11 (17.5%) |
| Office & Administration | 9 (5.3%) | 162 (94.7%) |
| Total (Category) | 61 (26.1%) | 173 (73.9%) |
| Total (Overall) | 662 (50.3%) | 654 (49.7%) |
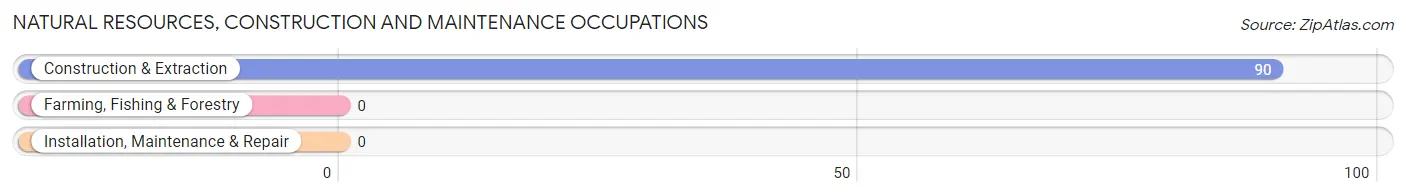
Natural Resources, Construction and Maintenance Occupations
The most common Natural Resources, Construction and Maintenance occupations in Lakeside are , and Construction & Extraction (90 | 6.8%).
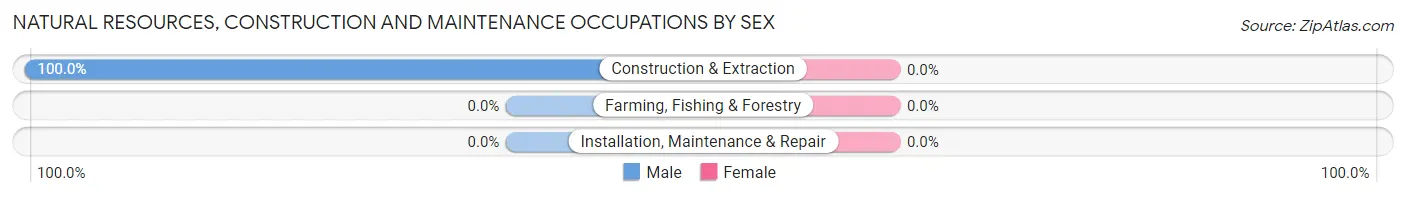
Natural Resources, Construction and Maintenance Occupations by Sex
| Occupation | Male | Female |
| Farming, Fishing & Forestry | 0 (0.0%) | 0 (0.0%) |
| Construction & Extraction | 90 (100.0%) | 0 (0.0%) |
| Installation, Maintenance & Repair | 0 (0.0%) | 0 (0.0%) |
| Total (Category) | 90 (100.0%) | 0 (0.0%) |
| Total (Overall) | 662 (50.3%) | 654 (49.7%) |
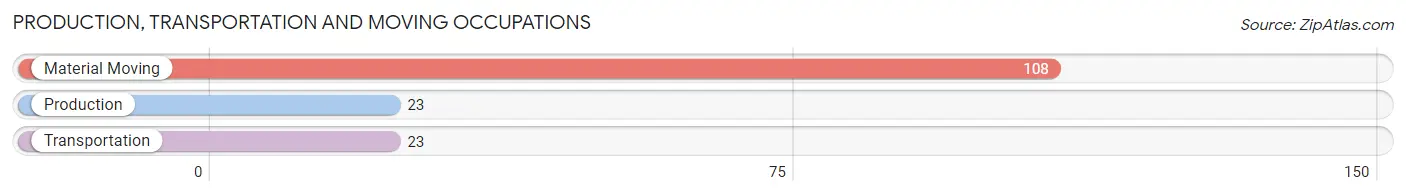
Production, Transportation and Moving Occupations
The most common Production, Transportation and Moving occupations in Lakeside are Material Moving (108 | 8.2%), Production (23 | 1.8%), and Transportation (23 | 1.8%).
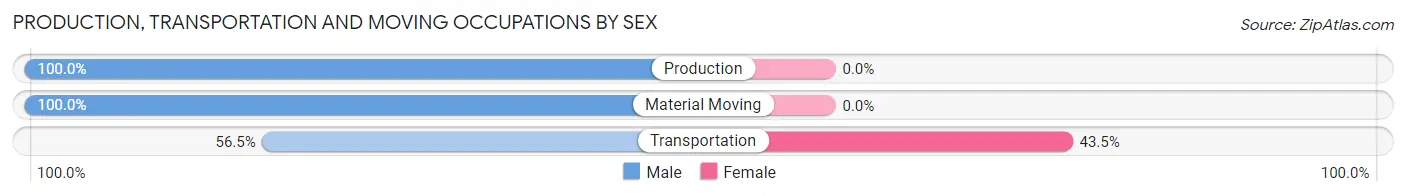
Production, Transportation and Moving Occupations by Sex
| Occupation | Male | Female |
| Production | 23 (100.0%) | 0 (0.0%) |
| Transportation | 13 (56.5%) | 10 (43.5%) |
| Material Moving | 108 (100.0%) | 0 (0.0%) |
| Total (Category) | 144 (93.5%) | 10 (6.5%) |
| Total (Overall) | 662 (50.3%) | 654 (49.7%) |
Employment Industries by Sex in Lakeside
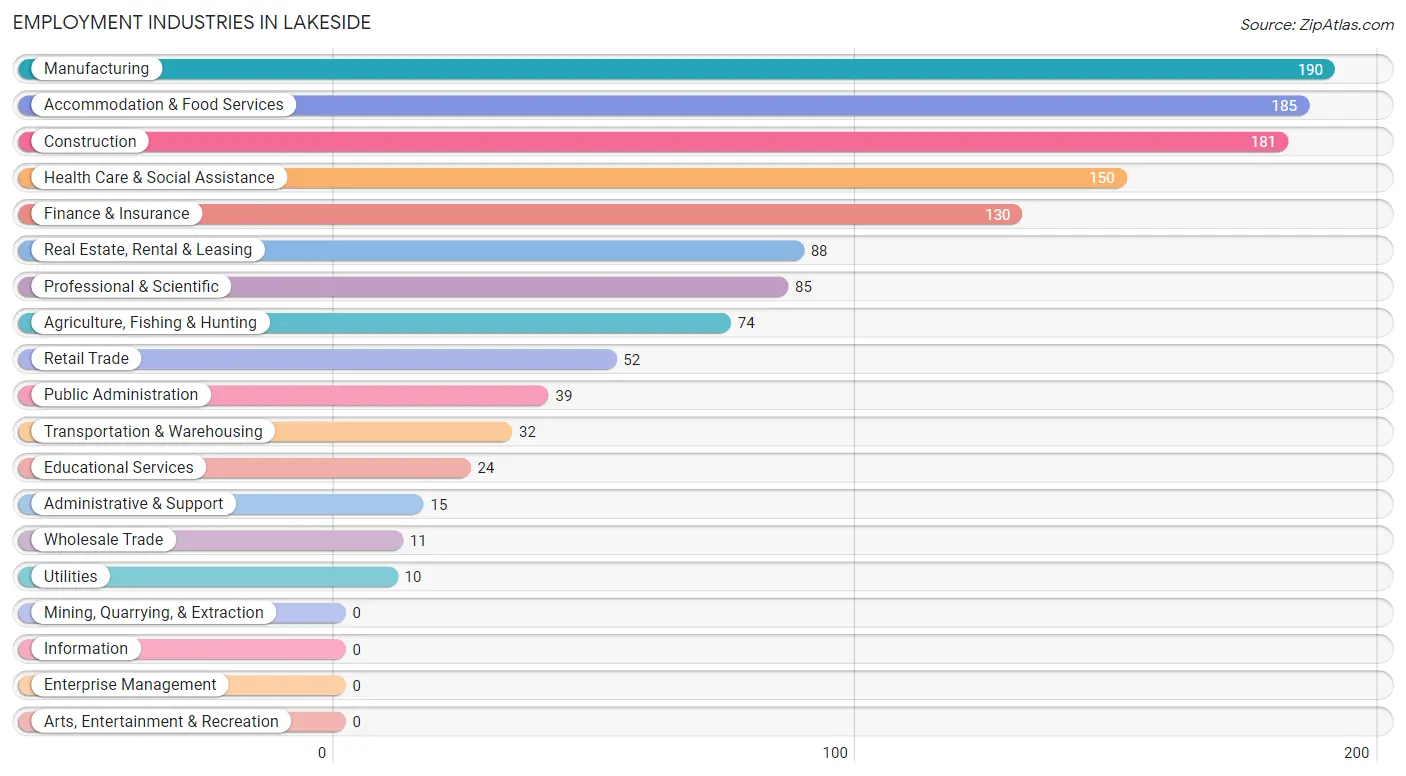
Employment Industries in Lakeside
The major employment industries in Lakeside include Manufacturing (190 | 14.4%), Accommodation & Food Services (185 | 14.1%), Construction (181 | 13.8%), Health Care & Social Assistance (150 | 11.4%), and Finance & Insurance (130 | 9.9%).
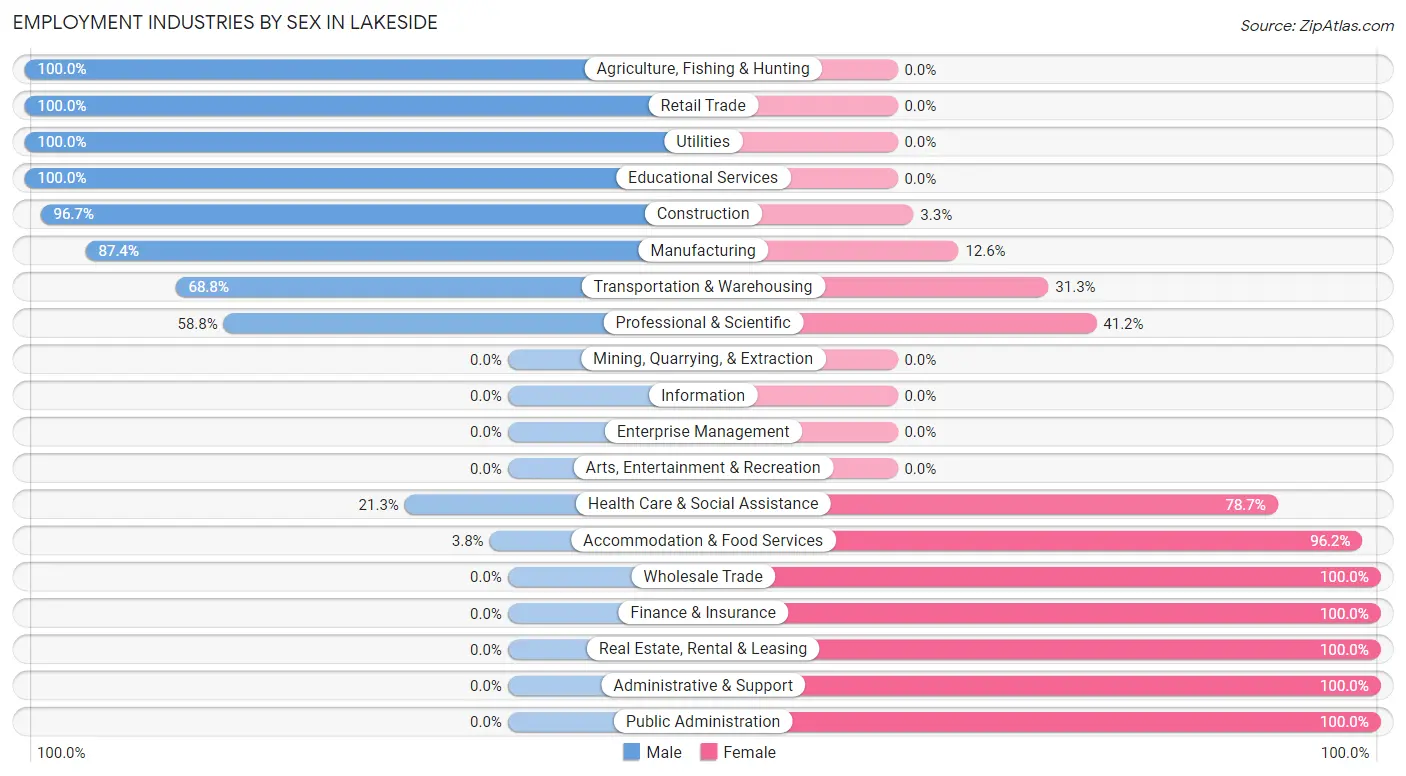
Employment Industries by Sex in Lakeside
The Lakeside industries that see more men than women are Agriculture, Fishing & Hunting (100.0%), Retail Trade (100.0%), and Utilities (100.0%), whereas the industries that tend to have a higher number of women are Wholesale Trade (100.0%), Finance & Insurance (100.0%), and Real Estate, Rental & Leasing (100.0%).
| Industry | Male | Female |
| Agriculture, Fishing & Hunting | 74 (100.0%) | 0 (0.0%) |
| Mining, Quarrying, & Extraction | 0 (0.0%) | 0 (0.0%) |
| Construction | 175 (96.7%) | 6 (3.3%) |
| Manufacturing | 166 (87.4%) | 24 (12.6%) |
| Wholesale Trade | 0 (0.0%) | 11 (100.0%) |
| Retail Trade | 52 (100.0%) | 0 (0.0%) |
| Transportation & Warehousing | 22 (68.8%) | 10 (31.2%) |
| Utilities | 10 (100.0%) | 0 (0.0%) |
| Information | 0 (0.0%) | 0 (0.0%) |
| Finance & Insurance | 0 (0.0%) | 130 (100.0%) |
| Real Estate, Rental & Leasing | 0 (0.0%) | 88 (100.0%) |
| Professional & Scientific | 50 (58.8%) | 35 (41.2%) |
| Enterprise Management | 0 (0.0%) | 0 (0.0%) |
| Administrative & Support | 0 (0.0%) | 15 (100.0%) |
| Educational Services | 24 (100.0%) | 0 (0.0%) |
| Health Care & Social Assistance | 32 (21.3%) | 118 (78.7%) |
| Arts, Entertainment & Recreation | 0 (0.0%) | 0 (0.0%) |
| Accommodation & Food Services | 7 (3.8%) | 178 (96.2%) |
| Public Administration | 0 (0.0%) | 39 (100.0%) |
| Total | 662 (50.3%) | 654 (49.7%) |
Education in Lakeside
School Enrollment in Lakeside
The most common levels of schooling among the 365 students in Lakeside are high school (110 | 30.1%), middle school (97 | 26.6%), and elementary school (52 | 14.2%).
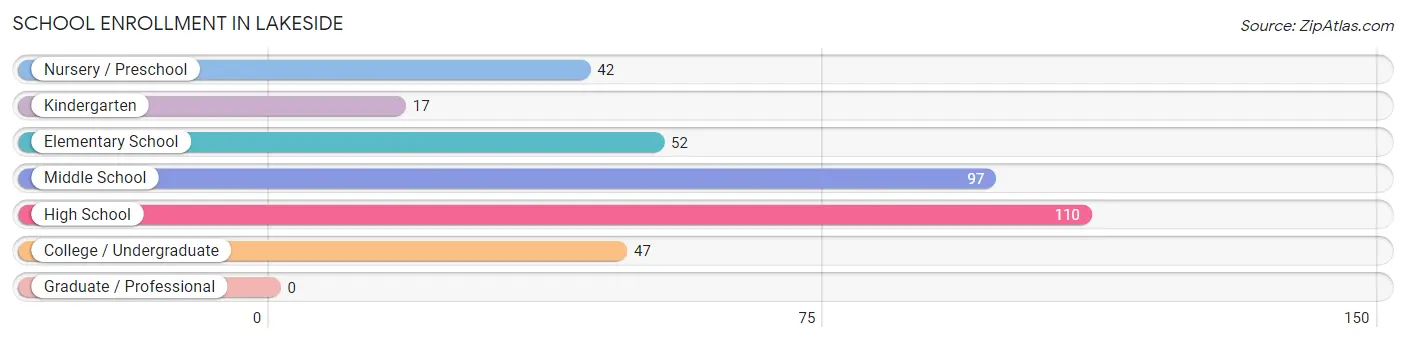
| School Level | # Students | % Students |
| Nursery / Preschool | 42 | 11.5% |
| Kindergarten | 17 | 4.7% |
| Elementary School | 52 | 14.2% |
| Middle School | 97 | 26.6% |
| High School | 110 | 30.1% |
| College / Undergraduate | 47 | 12.9% |
| Graduate / Professional | 0 | 0.0% |
| Total | 365 | 100.0% |
School Enrollment by Age by Funding Source in Lakeside
Out of a total of 365 students who are enrolled in schools in Lakeside, 106 (29.0%) attend a private institution, while the remaining 259 (71.0%) are enrolled in public schools. The age group of 3 to 4 year olds has the highest likelihood of being enrolled in private schools, with 42 (100.0% in the age bracket) enrolled. Conversely, the age group of 15 to 17 year olds has the lowest likelihood of being enrolled in a private school, with 110 (100.0% in the age bracket) attending a public institution.
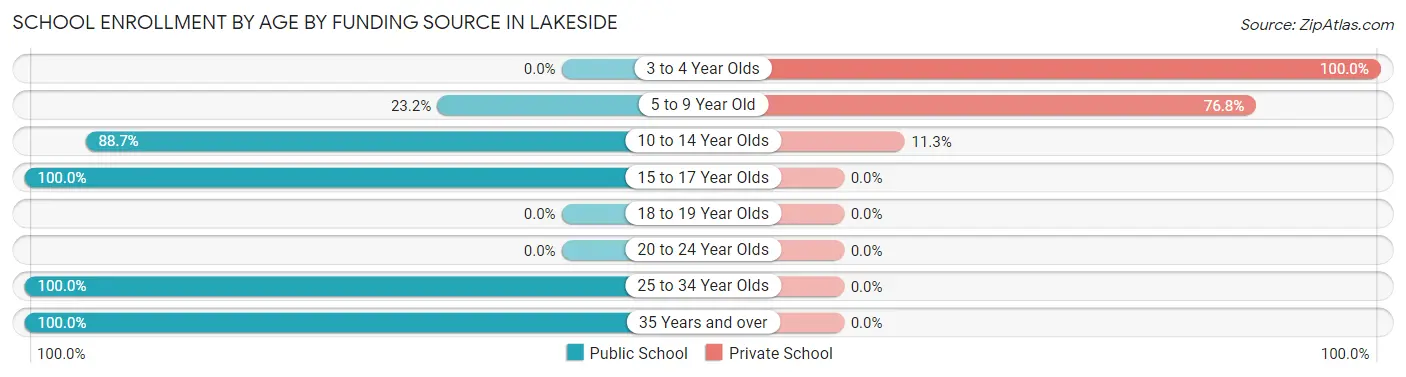
| Age Bracket | Public School | Private School |
| 3 to 4 Year Olds | 0 (0.0%) | 42 (100.0%) |
| 5 to 9 Year Old | 16 (23.2%) | 53 (76.8%) |
| 10 to 14 Year Olds | 86 (88.7%) | 11 (11.3%) |
| 15 to 17 Year Olds | 110 (100.0%) | 0 (0.0%) |
| 18 to 19 Year Olds | 0 (0.0%) | 0 (0.0%) |
| 20 to 24 Year Olds | 0 (0.0%) | 0 (0.0%) |
| 25 to 34 Year Olds | 20 (100.0%) | 0 (0.0%) |
| 35 Years and over | 27 (100.0%) | 0 (0.0%) |
| Total | 259 (71.0%) | 106 (29.0%) |
Educational Attainment by Field of Study in Lakeside
Business (172 | 29.3%), literature & languages (66 | 11.2%), social sciences (53 | 9.0%), education (52 | 8.9%), and arts & humanities (51 | 8.7%) are the most common fields of study among 587 individuals in Lakeside who have obtained a bachelor's degree or higher.
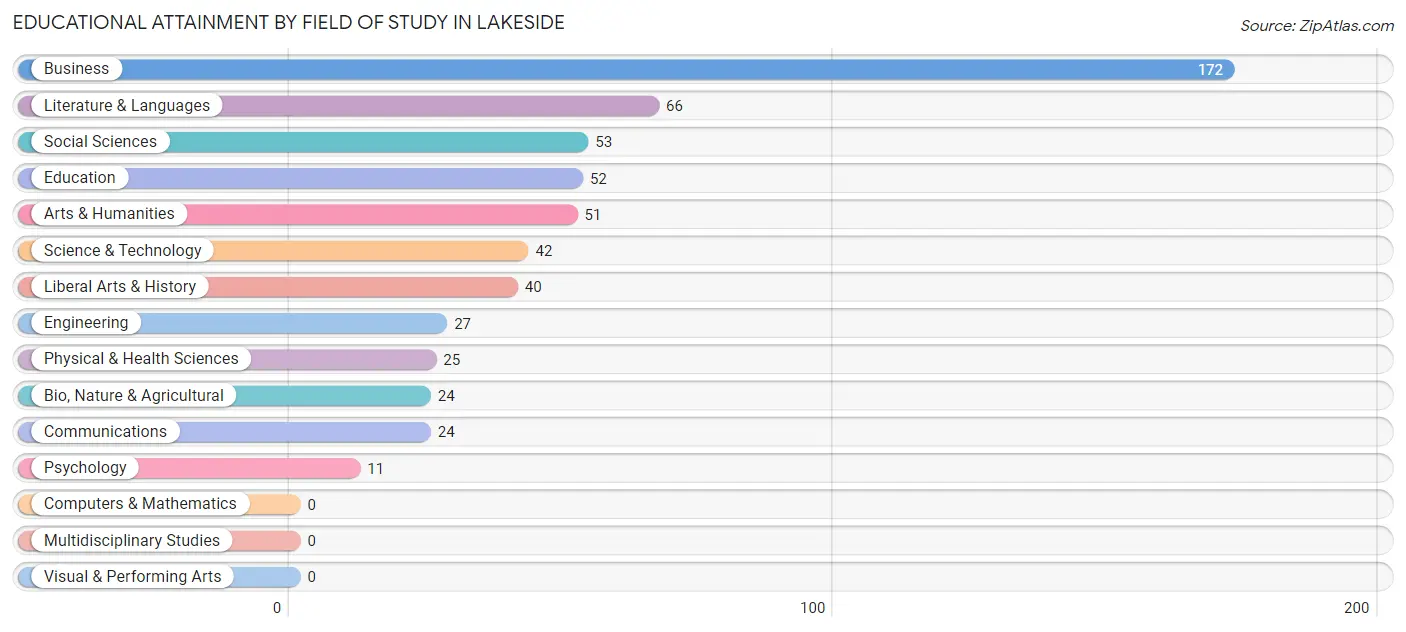
| Field of Study | # Graduates | % Graduates |
| Computers & Mathematics | 0 | 0.0% |
| Bio, Nature & Agricultural | 24 | 4.1% |
| Physical & Health Sciences | 25 | 4.3% |
| Psychology | 11 | 1.9% |
| Social Sciences | 53 | 9.0% |
| Engineering | 27 | 4.6% |
| Multidisciplinary Studies | 0 | 0.0% |
| Science & Technology | 42 | 7.2% |
| Business | 172 | 29.3% |
| Education | 52 | 8.9% |
| Literature & Languages | 66 | 11.2% |
| Liberal Arts & History | 40 | 6.8% |
| Visual & Performing Arts | 0 | 0.0% |
| Communications | 24 | 4.1% |
| Arts & Humanities | 51 | 8.7% |
| Total | 587 | 100.0% |
Transportation & Commute in Lakeside
Vehicle Availability by Sex in Lakeside
The most prevalent vehicle ownership categories in Lakeside are males with 3 vehicles (226, accounting for 37.1%) and females with 3 vehicles (289, making up 35.1%).
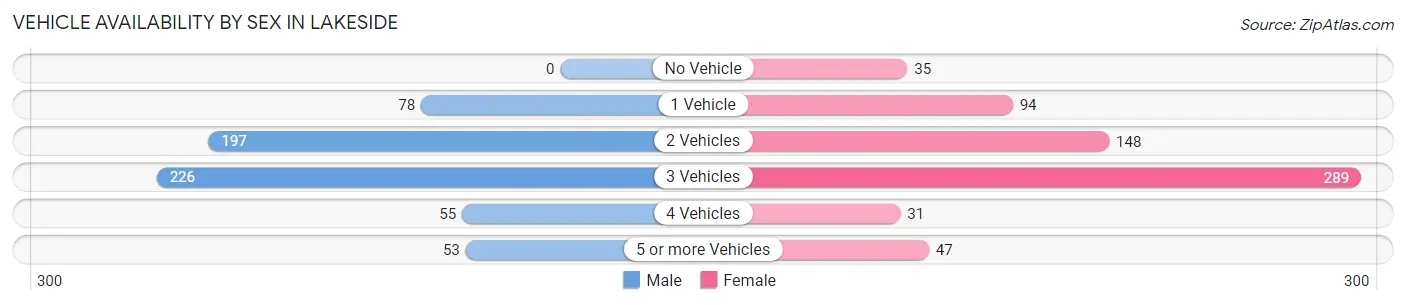
| Vehicles Available | Male | Female |
| No Vehicle | 0 (0.0%) | 35 (5.4%) |
| 1 Vehicle | 78 (12.8%) | 94 (14.6%) |
| 2 Vehicles | 197 (32.4%) | 148 (23.0%) |
| 3 Vehicles | 226 (37.1%) | 289 (44.9%) |
| 4 Vehicles | 55 (9.0%) | 31 (4.8%) |
| 5 or more Vehicles | 53 (8.7%) | 47 (7.3%) |
| Total | 609 (100.0%) | 644 (100.0%) |
Commute Time in Lakeside
The most frequently occuring commute durations in Lakeside are 25 to 29 minutes (231 commuters, 20.6%), 20 to 24 minutes (225 commuters, 20.1%), and less than 5 minutes (202 commuters, 18.0%).
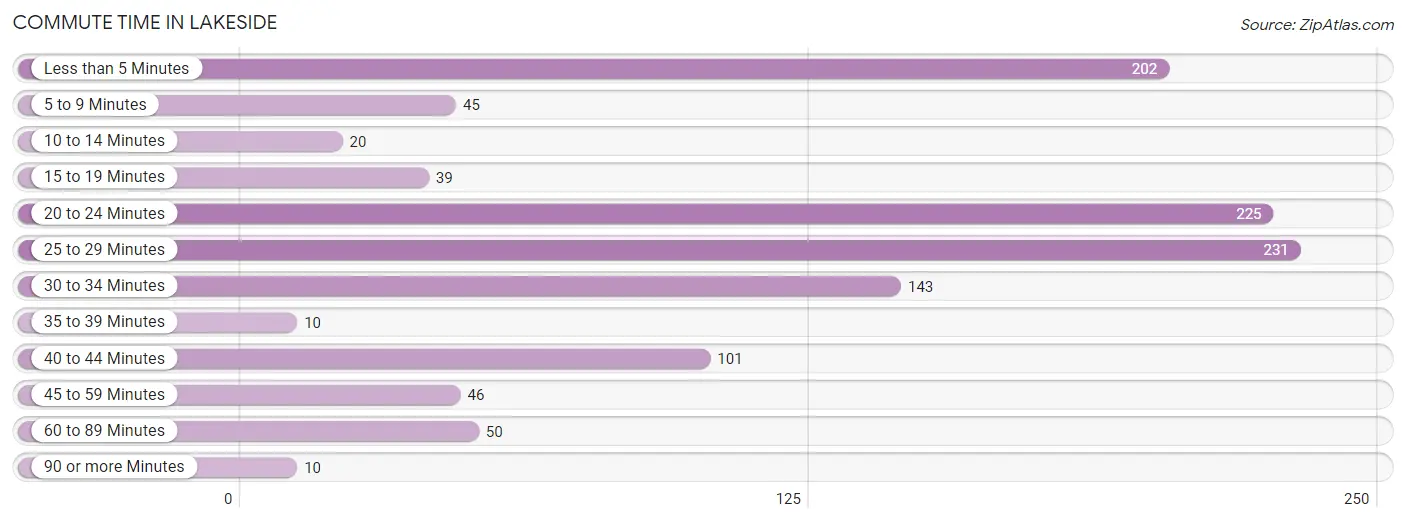
| Commute Time | # Commuters | % Commuters |
| Less than 5 Minutes | 202 | 18.0% |
| 5 to 9 Minutes | 45 | 4.0% |
| 10 to 14 Minutes | 20 | 1.8% |
| 15 to 19 Minutes | 39 | 3.5% |
| 20 to 24 Minutes | 225 | 20.1% |
| 25 to 29 Minutes | 231 | 20.6% |
| 30 to 34 Minutes | 143 | 12.8% |
| 35 to 39 Minutes | 10 | 0.9% |
| 40 to 44 Minutes | 101 | 9.0% |
| 45 to 59 Minutes | 46 | 4.1% |
| 60 to 89 Minutes | 50 | 4.5% |
| 90 or more Minutes | 10 | 0.9% |
Commute Time by Sex in Lakeside
The most common commute times in Lakeside are 20 to 24 minutes (151 commuters, 25.8%) for males and less than 5 minutes (202 commuters, 37.6%) for females.
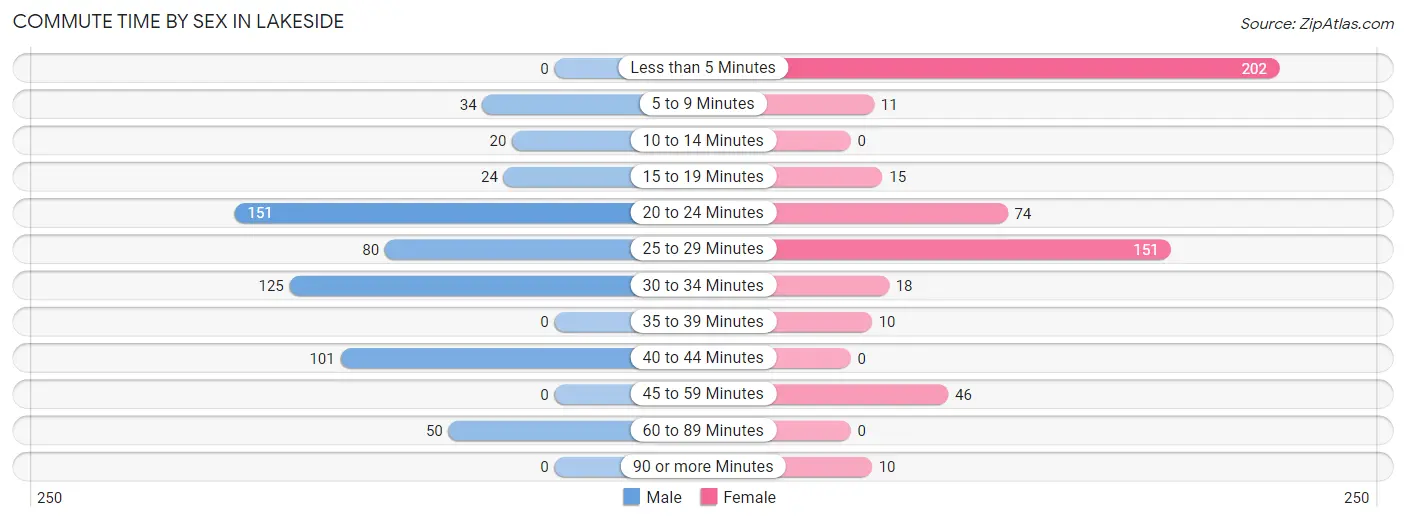
| Commute Time | Male | Female |
| Less than 5 Minutes | 0 (0.0%) | 202 (37.6%) |
| 5 to 9 Minutes | 34 (5.8%) | 11 (2.1%) |
| 10 to 14 Minutes | 20 (3.4%) | 0 (0.0%) |
| 15 to 19 Minutes | 24 (4.1%) | 15 (2.8%) |
| 20 to 24 Minutes | 151 (25.8%) | 74 (13.8%) |
| 25 to 29 Minutes | 80 (13.7%) | 151 (28.1%) |
| 30 to 34 Minutes | 125 (21.4%) | 18 (3.4%) |
| 35 to 39 Minutes | 0 (0.0%) | 10 (1.9%) |
| 40 to 44 Minutes | 101 (17.3%) | 0 (0.0%) |
| 45 to 59 Minutes | 0 (0.0%) | 46 (8.6%) |
| 60 to 89 Minutes | 50 (8.6%) | 0 (0.0%) |
| 90 or more Minutes | 0 (0.0%) | 10 (1.9%) |
Time of Departure to Work by Sex in Lakeside
The most frequent times of departure to work in Lakeside are 7:00 AM to 7:29 AM (159, 27.2%) for males and 7:30 AM to 7:59 AM (156, 29.0%) for females.
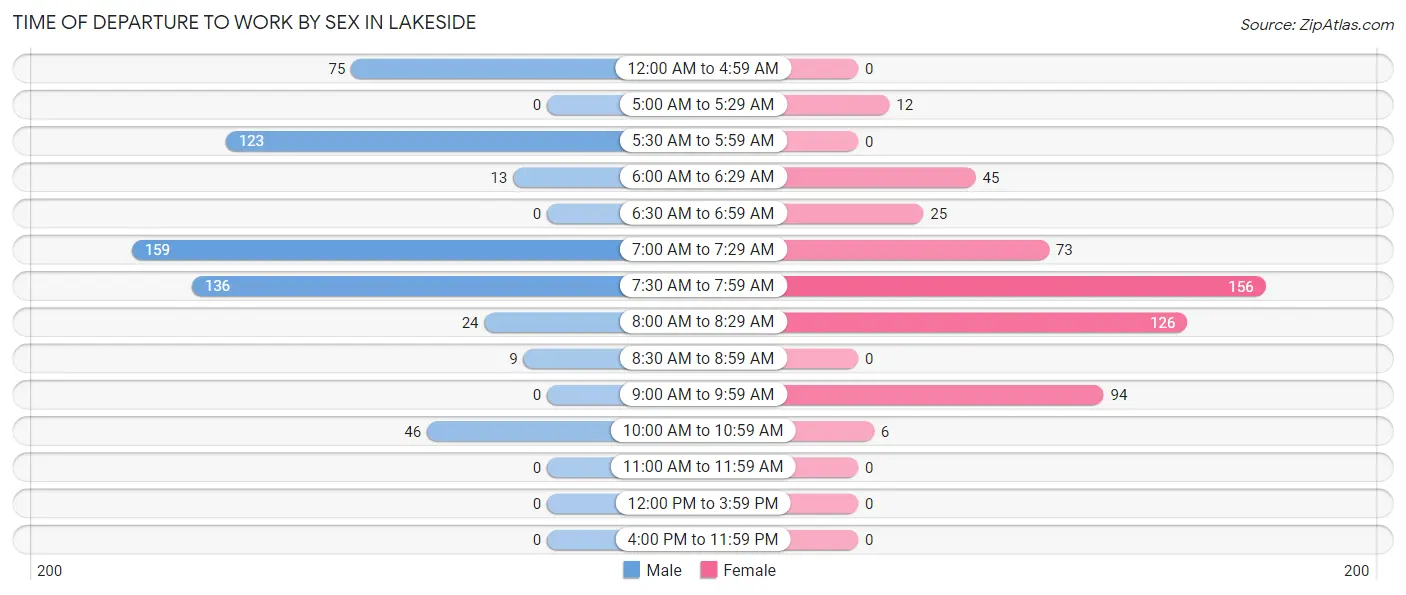
| Time of Departure | Male | Female |
| 12:00 AM to 4:59 AM | 75 (12.8%) | 0 (0.0%) |
| 5:00 AM to 5:29 AM | 0 (0.0%) | 12 (2.2%) |
| 5:30 AM to 5:59 AM | 123 (21.0%) | 0 (0.0%) |
| 6:00 AM to 6:29 AM | 13 (2.2%) | 45 (8.4%) |
| 6:30 AM to 6:59 AM | 0 (0.0%) | 25 (4.7%) |
| 7:00 AM to 7:29 AM | 159 (27.2%) | 73 (13.6%) |
| 7:30 AM to 7:59 AM | 136 (23.3%) | 156 (29.0%) |
| 8:00 AM to 8:29 AM | 24 (4.1%) | 126 (23.5%) |
| 8:30 AM to 8:59 AM | 9 (1.5%) | 0 (0.0%) |
| 9:00 AM to 9:59 AM | 0 (0.0%) | 94 (17.5%) |
| 10:00 AM to 10:59 AM | 46 (7.9%) | 6 (1.1%) |
| 11:00 AM to 11:59 AM | 0 (0.0%) | 0 (0.0%) |
| 12:00 PM to 3:59 PM | 0 (0.0%) | 0 (0.0%) |
| 4:00 PM to 11:59 PM | 0 (0.0%) | 0 (0.0%) |
| Total | 585 (100.0%) | 537 (100.0%) |
Housing Occupancy in Lakeside
Occupancy by Ownership in Lakeside
Of the total 1,123 dwellings in Lakeside, owner-occupied units account for 855 (76.1%), while renter-occupied units make up 268 (23.9%).
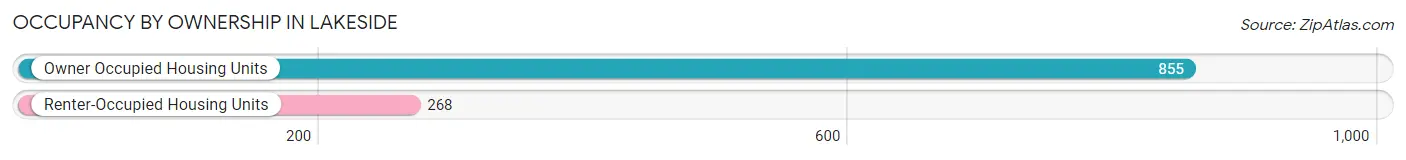
| Occupancy | # Housing Units | % Housing Units |
| Owner Occupied Housing Units | 855 | 76.1% |
| Renter-Occupied Housing Units | 268 | 23.9% |
| Total Occupied Housing Units | 1,123 | 100.0% |
Occupancy by Household Size in Lakeside
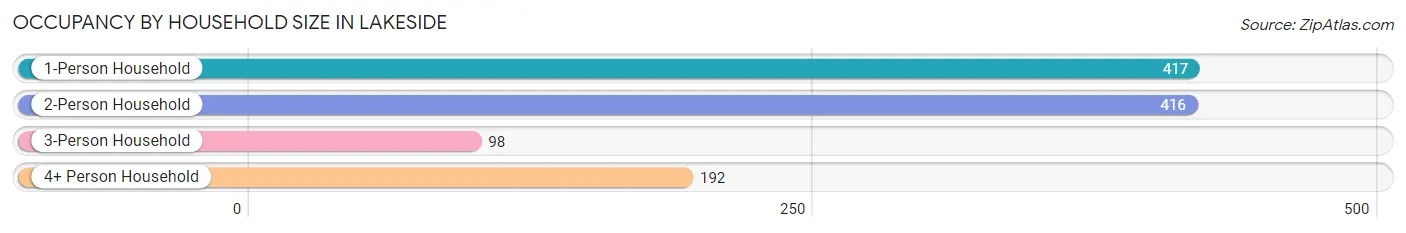
| Household Size | # Housing Units | % Housing Units |
| 1-Person Household | 417 | 37.1% |
| 2-Person Household | 416 | 37.0% |
| 3-Person Household | 98 | 8.7% |
| 4+ Person Household | 192 | 17.1% |
| Total Housing Units | 1,123 | 100.0% |
Occupancy by Ownership by Household Size in Lakeside
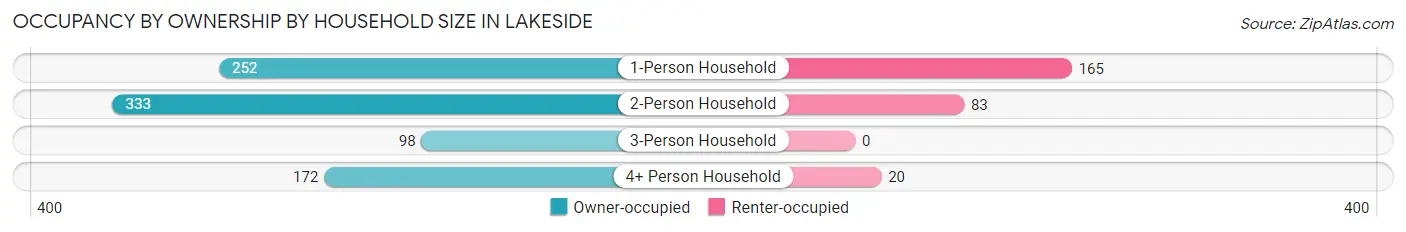
| Household Size | Owner-occupied | Renter-occupied |
| 1-Person Household | 252 (60.4%) | 165 (39.6%) |
| 2-Person Household | 333 (80.0%) | 83 (20.0%) |
| 3-Person Household | 98 (100.0%) | 0 (0.0%) |
| 4+ Person Household | 172 (89.6%) | 20 (10.4%) |
| Total Housing Units | 855 (76.1%) | 268 (23.9%) |
Occupancy by Educational Attainment in Lakeside
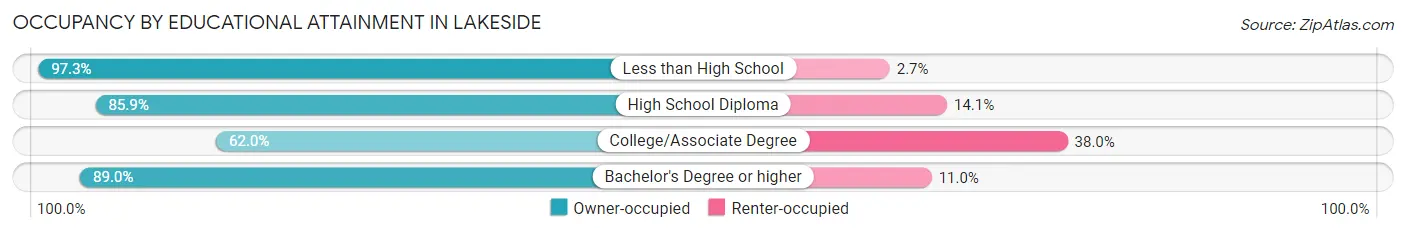
| Household Size | Owner-occupied | Renter-occupied |
| Less than High School | 36 (97.3%) | 1 (2.7%) |
| High School Diploma | 214 (85.9%) | 35 (14.1%) |
| College/Associate Degree | 322 (62.0%) | 197 (38.0%) |
| Bachelor's Degree or higher | 283 (89.0%) | 35 (11.0%) |
Occupancy by Age of Householder in Lakeside
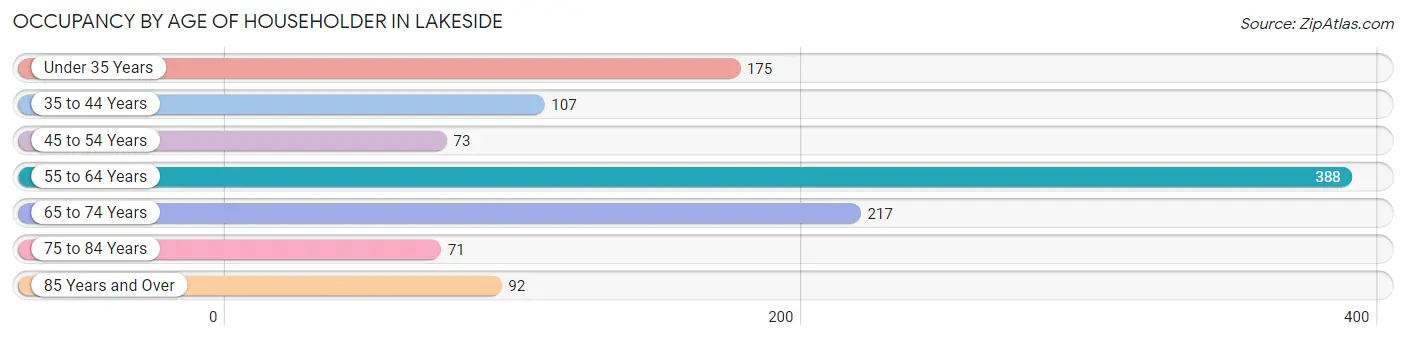
| Age Bracket | # Households | % Households |
| Under 35 Years | 175 | 15.6% |
| 35 to 44 Years | 107 | 9.5% |
| 45 to 54 Years | 73 | 6.5% |
| 55 to 64 Years | 388 | 34.5% |
| 65 to 74 Years | 217 | 19.3% |
| 75 to 84 Years | 71 | 6.3% |
| 85 Years and Over | 92 | 8.2% |
| Total | 1,123 | 100.0% |
Housing Finances in Lakeside
Median Income by Occupancy in Lakeside
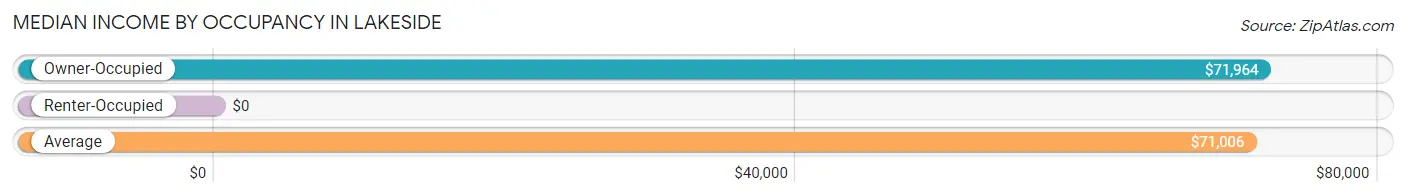
| Occupancy Type | # Households | Median Income |
| Owner-Occupied | 855 (76.1%) | $71,964 |
| Renter-Occupied | 268 (23.9%) | $0 |
| Average | 1,123 (100.0%) | $71,006 |
Occupancy by Householder Income Bracket in Lakeside
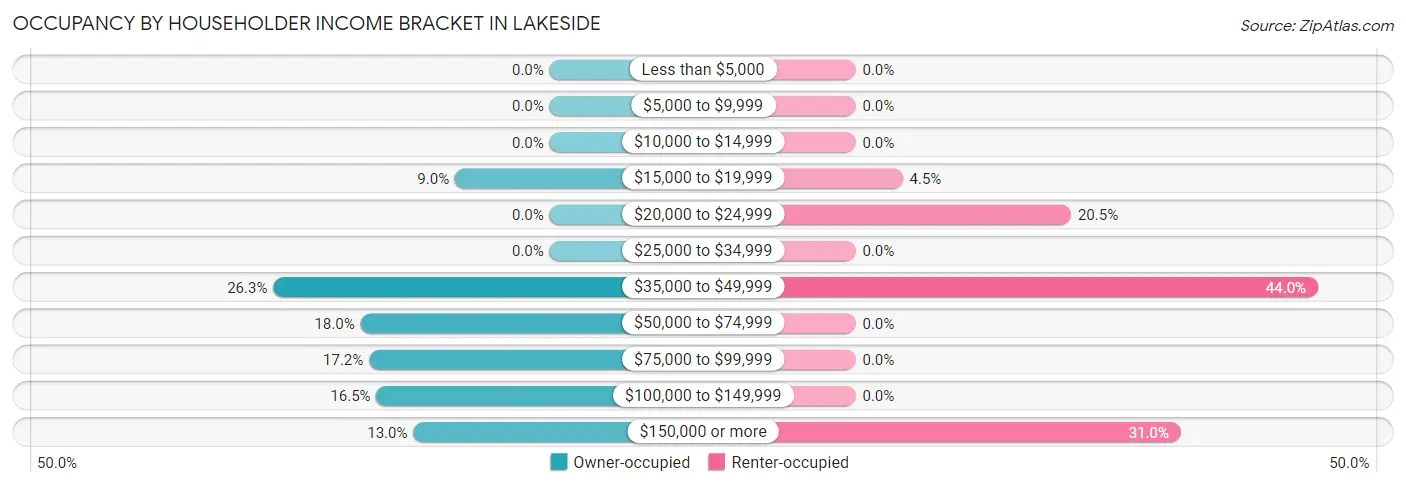
| Income Bracket | Owner-occupied | Renter-occupied |
| Less than $5,000 | 0 (0.0%) | 0 (0.0%) |
| $5,000 to $9,999 | 0 (0.0%) | 0 (0.0%) |
| $10,000 to $14,999 | 0 (0.0%) | 0 (0.0%) |
| $15,000 to $19,999 | 77 (9.0%) | 12 (4.5%) |
| $20,000 to $24,999 | 0 (0.0%) | 55 (20.5%) |
| $25,000 to $34,999 | 0 (0.0%) | 0 (0.0%) |
| $35,000 to $49,999 | 225 (26.3%) | 118 (44.0%) |
| $50,000 to $74,999 | 154 (18.0%) | 0 (0.0%) |
| $75,000 to $99,999 | 147 (17.2%) | 0 (0.0%) |
| $100,000 to $149,999 | 141 (16.5%) | 0 (0.0%) |
| $150,000 or more | 111 (13.0%) | 83 (31.0%) |
| Total | 855 (100.0%) | 268 (100.0%) |
Monthly Housing Cost Tiers in Lakeside
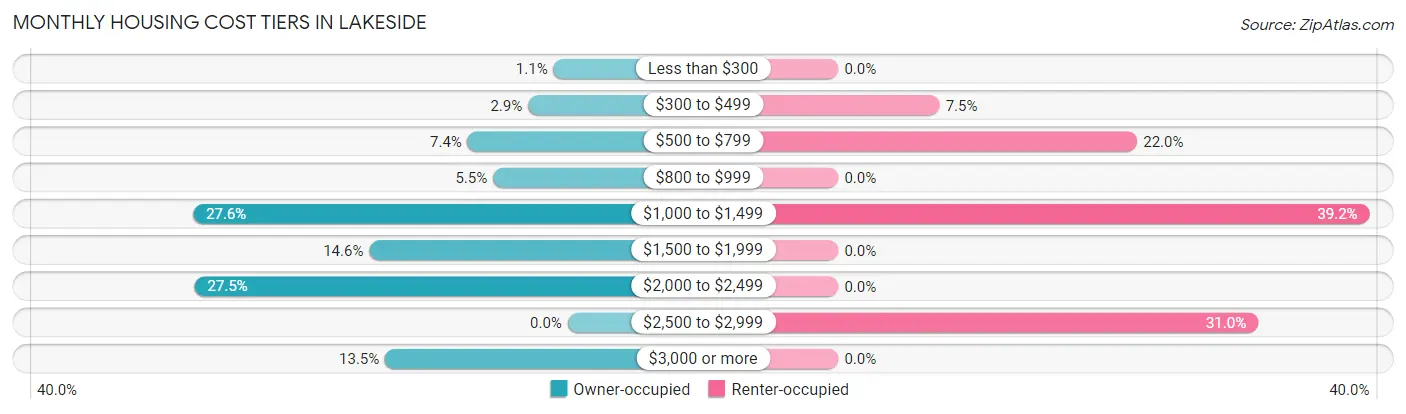
| Monthly Cost | Owner-occupied | Renter-occupied |
| Less than $300 | 9 (1.1%) | 0 (0.0%) |
| $300 to $499 | 25 (2.9%) | 20 (7.5%) |
| $500 to $799 | 63 (7.4%) | 59 (22.0%) |
| $800 to $999 | 47 (5.5%) | 0 (0.0%) |
| $1,000 to $1,499 | 236 (27.6%) | 105 (39.2%) |
| $1,500 to $1,999 | 125 (14.6%) | 0 (0.0%) |
| $2,000 to $2,499 | 235 (27.5%) | 0 (0.0%) |
| $2,500 to $2,999 | 0 (0.0%) | 83 (31.0%) |
| $3,000 or more | 115 (13.5%) | 0 (0.0%) |
| Total | 855 (100.0%) | 268 (100.0%) |
Physical Housing Characteristics in Lakeside
Housing Structures in Lakeside
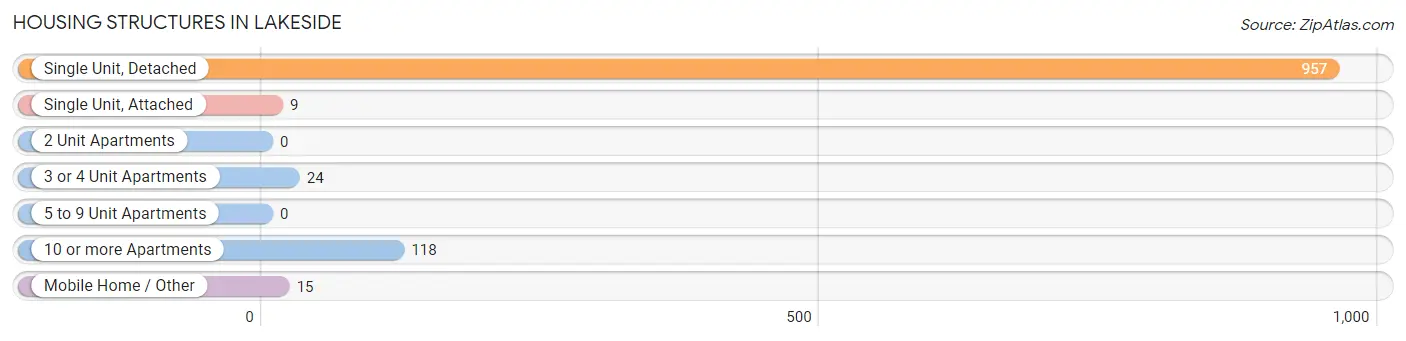
| Structure Type | # Housing Units | % Housing Units |
| Single Unit, Detached | 957 | 85.2% |
| Single Unit, Attached | 9 | 0.8% |
| 2 Unit Apartments | 0 | 0.0% |
| 3 or 4 Unit Apartments | 24 | 2.1% |
| 5 to 9 Unit Apartments | 0 | 0.0% |
| 10 or more Apartments | 118 | 10.5% |
| Mobile Home / Other | 15 | 1.3% |
| Total | 1,123 | 100.0% |
Housing Structures by Occupancy in Lakeside
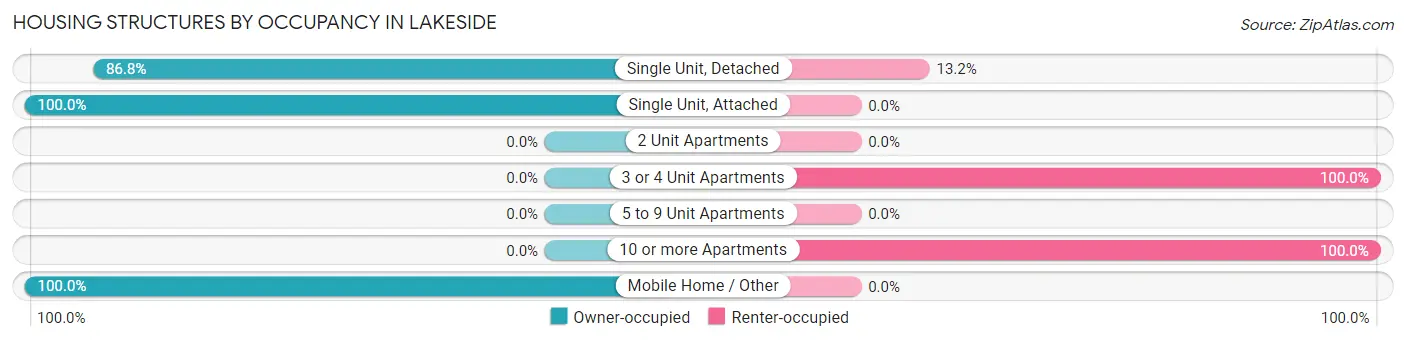
| Structure Type | Owner-occupied | Renter-occupied |
| Single Unit, Detached | 831 (86.8%) | 126 (13.2%) |
| Single Unit, Attached | 9 (100.0%) | 0 (0.0%) |
| 2 Unit Apartments | 0 (0.0%) | 0 (0.0%) |
| 3 or 4 Unit Apartments | 0 (0.0%) | 24 (100.0%) |
| 5 to 9 Unit Apartments | 0 (0.0%) | 0 (0.0%) |
| 10 or more Apartments | 0 (0.0%) | 118 (100.0%) |
| Mobile Home / Other | 15 (100.0%) | 0 (0.0%) |
| Total | 855 (76.1%) | 268 (23.9%) |
Housing Structures by Number of Rooms in Lakeside
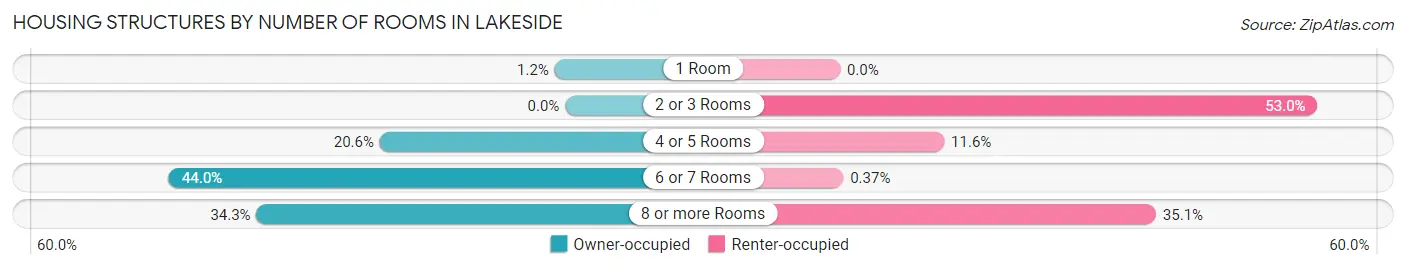
| Number of Rooms | Owner-occupied | Renter-occupied |
| 1 Room | 10 (1.2%) | 0 (0.0%) |
| 2 or 3 Rooms | 0 (0.0%) | 142 (53.0%) |
| 4 or 5 Rooms | 176 (20.6%) | 31 (11.6%) |
| 6 or 7 Rooms | 376 (44.0%) | 1 (0.4%) |
| 8 or more Rooms | 293 (34.3%) | 94 (35.1%) |
| Total | 855 (100.0%) | 268 (100.0%) |
Housing Structure by Heating Type in Lakeside
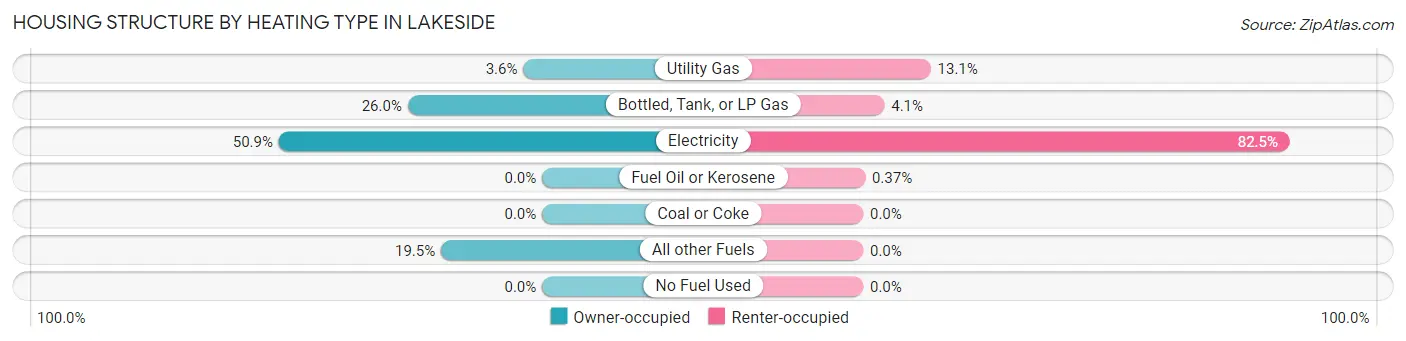
| Heating Type | Owner-occupied | Renter-occupied |
| Utility Gas | 31 (3.6%) | 35 (13.1%) |
| Bottled, Tank, or LP Gas | 222 (26.0%) | 11 (4.1%) |
| Electricity | 435 (50.9%) | 221 (82.5%) |
| Fuel Oil or Kerosene | 0 (0.0%) | 1 (0.4%) |
| Coal or Coke | 0 (0.0%) | 0 (0.0%) |
| All other Fuels | 167 (19.5%) | 0 (0.0%) |
| No Fuel Used | 0 (0.0%) | 0 (0.0%) |
| Total | 855 (100.0%) | 268 (100.0%) |
Household Vehicle Usage in Lakeside
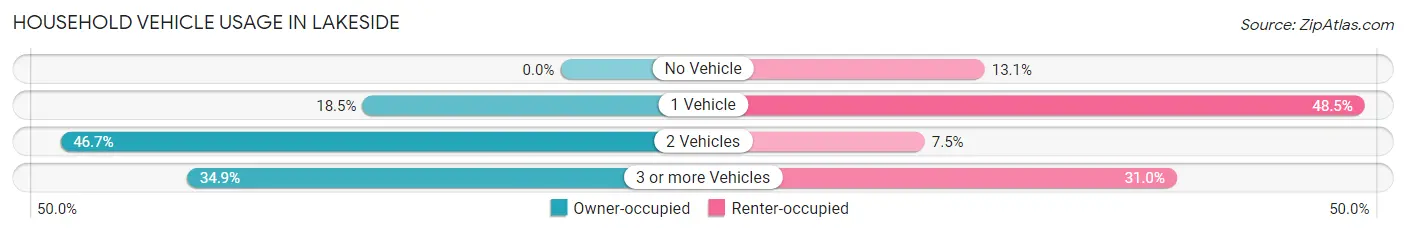
| Vehicles per Household | Owner-occupied | Renter-occupied |
| No Vehicle | 0 (0.0%) | 35 (13.1%) |
| 1 Vehicle | 158 (18.5%) | 130 (48.5%) |
| 2 Vehicles | 399 (46.7%) | 20 (7.5%) |
| 3 or more Vehicles | 298 (34.8%) | 83 (31.0%) |
| Total | 855 (100.0%) | 268 (100.0%) |
Real Estate & Mortgages in Lakeside
Real Estate and Mortgage Overview in Lakeside
| Characteristic | Without Mortgage | With Mortgage |
| Housing Units | 245 | 610 |
| Median Property Value | $930,600 | $491,600 |
| Median Household Income | - | - |
| Monthly Housing Costs | $1,001 | $115 |
| Real Estate Taxes | $7,308 | $73 |
Property Value by Mortgage Status in Lakeside
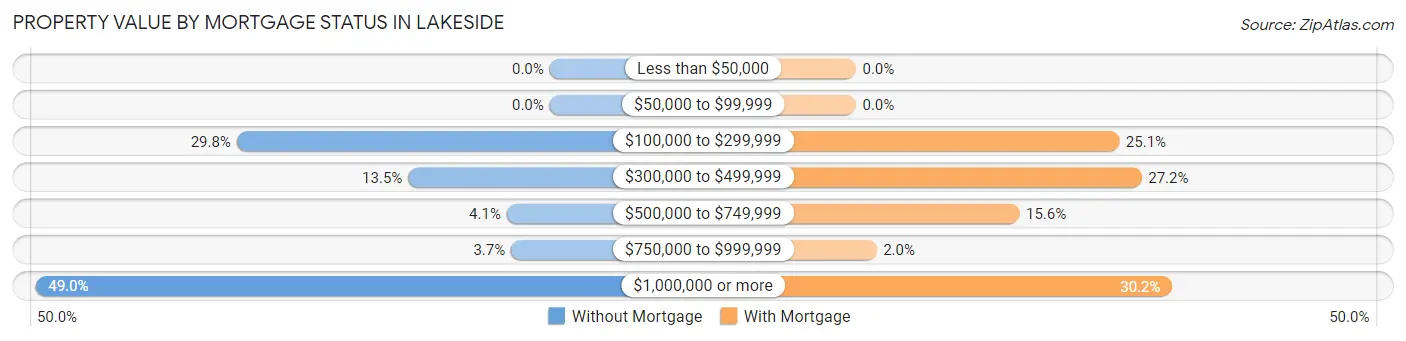
| Property Value | Without Mortgage | With Mortgage |
| Less than $50,000 | 0 (0.0%) | 0 (0.0%) |
| $50,000 to $99,999 | 0 (0.0%) | 0 (0.0%) |
| $100,000 to $299,999 | 73 (29.8%) | 153 (25.1%) |
| $300,000 to $499,999 | 33 (13.5%) | 166 (27.2%) |
| $500,000 to $749,999 | 10 (4.1%) | 95 (15.6%) |
| $750,000 to $999,999 | 9 (3.7%) | 12 (2.0%) |
| $1,000,000 or more | 120 (49.0%) | 184 (30.2%) |
| Total | 245 (100.0%) | 610 (100.0%) |
Household Income by Mortgage Status in Lakeside
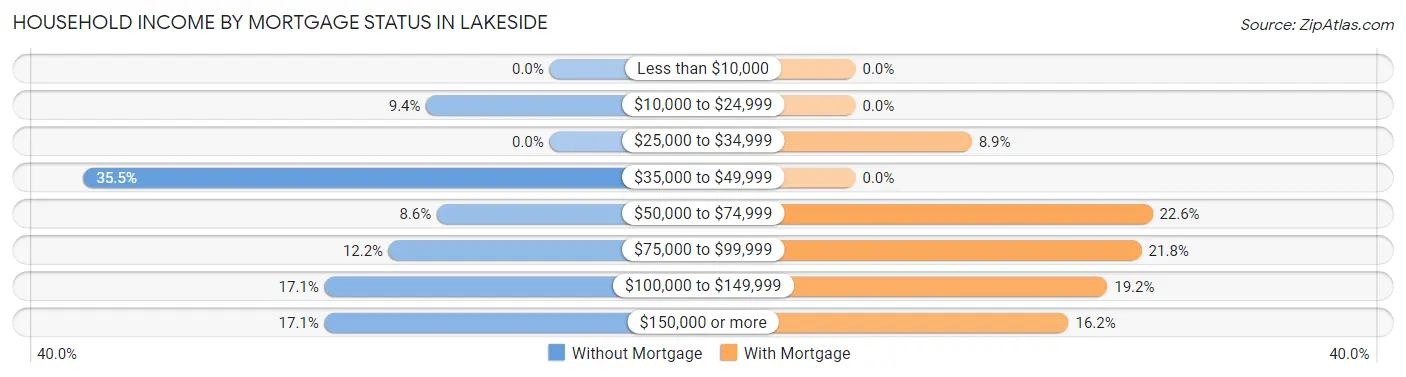
| Household Income | Without Mortgage | With Mortgage |
| Less than $10,000 | 0 (0.0%) | 0 (0.0%) |
| $10,000 to $24,999 | 23 (9.4%) | 0 (0.0%) |
| $25,000 to $34,999 | 0 (0.0%) | 54 (8.8%) |
| $35,000 to $49,999 | 87 (35.5%) | 0 (0.0%) |
| $50,000 to $74,999 | 21 (8.6%) | 138 (22.6%) |
| $75,000 to $99,999 | 30 (12.2%) | 133 (21.8%) |
| $100,000 to $149,999 | 42 (17.1%) | 117 (19.2%) |
| $150,000 or more | 42 (17.1%) | 99 (16.2%) |
| Total | 245 (100.0%) | 610 (100.0%) |
Property Value to Household Income Ratio in Lakeside
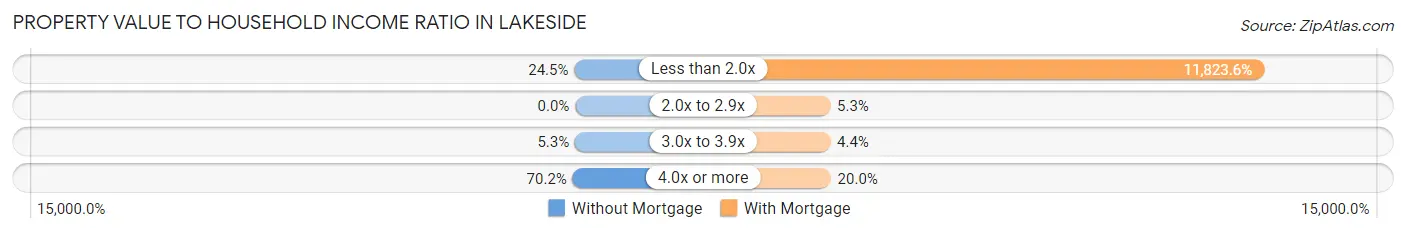
| Value-to-Income Ratio | Without Mortgage | With Mortgage |
| Less than 2.0x | 60 (24.5%) | 72,124 (11,823.6%) |
| 2.0x to 2.9x | 0 (0.0%) | 32 (5.2%) |
| 3.0x to 3.9x | 13 (5.3%) | 27 (4.4%) |
| 4.0x or more | 172 (70.2%) | 122 (20.0%) |
| Total | 245 (100.0%) | 610 (100.0%) |
Real Estate Taxes by Mortgage Status in Lakeside
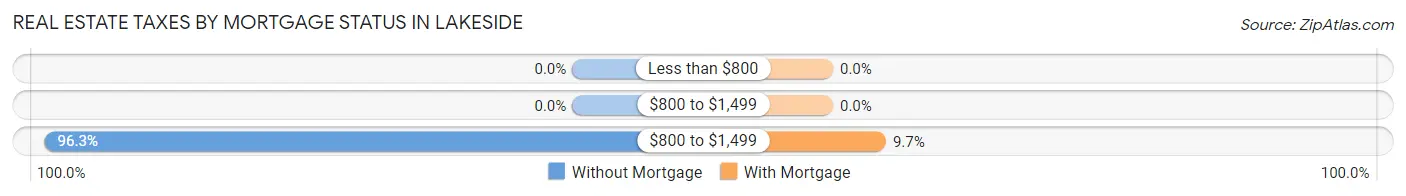
| Property Taxes | Without Mortgage | With Mortgage |
| Less than $800 | 0 (0.0%) | 0 (0.0%) |
| $800 to $1,499 | 0 (0.0%) | 0 (0.0%) |
| $800 to $1,499 | 236 (96.3%) | 59 (9.7%) |
| Total | 245 (100.0%) | 610 (100.0%) |
Health & Disability in Lakeside
Health Insurance Coverage by Age in Lakeside
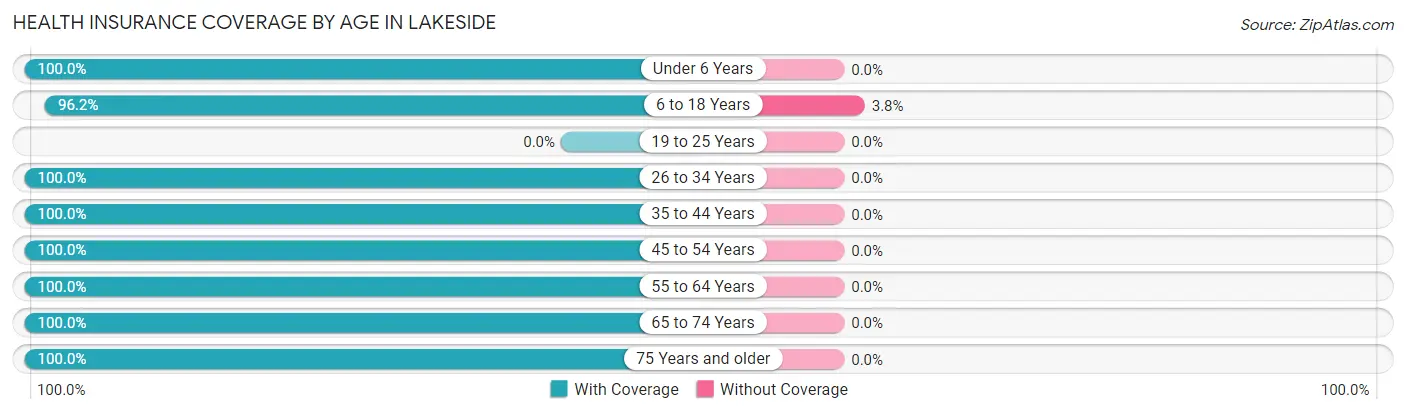
| Age Bracket | With Coverage | Without Coverage |
| Under 6 Years | 216 (100.0%) | 0 (0.0%) |
| 6 to 18 Years | 403 (96.2%) | 16 (3.8%) |
| 19 to 25 Years | 0 (0.0%) | 0 (0.0%) |
| 26 to 34 Years | 239 (100.0%) | 0 (0.0%) |
| 35 to 44 Years | 225 (100.0%) | 0 (0.0%) |
| 45 to 54 Years | 283 (100.0%) | 0 (0.0%) |
| 55 to 64 Years | 588 (100.0%) | 0 (0.0%) |
| 65 to 74 Years | 376 (100.0%) | 0 (0.0%) |
| 75 Years and older | 218 (100.0%) | 0 (0.0%) |
| Total | 2,548 (99.4%) | 16 (0.6%) |
Health Insurance Coverage by Citizenship Status in Lakeside
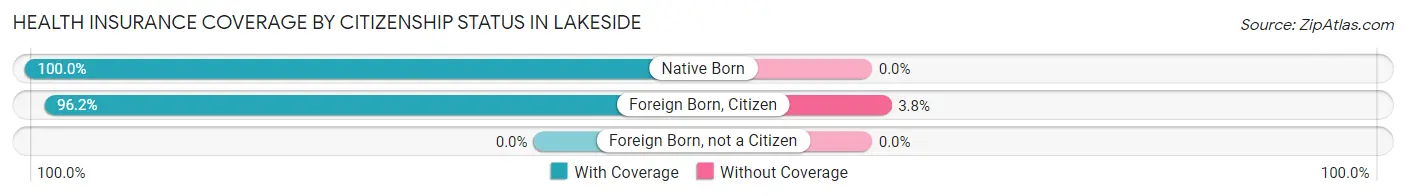
| Citizenship Status | With Coverage | Without Coverage |
| Native Born | 216 (100.0%) | 0 (0.0%) |
| Foreign Born, Citizen | 403 (96.2%) | 16 (3.8%) |
| Foreign Born, not a Citizen | 0 (0.0%) | 0 (0.0%) |
Health Insurance Coverage by Household Income in Lakeside
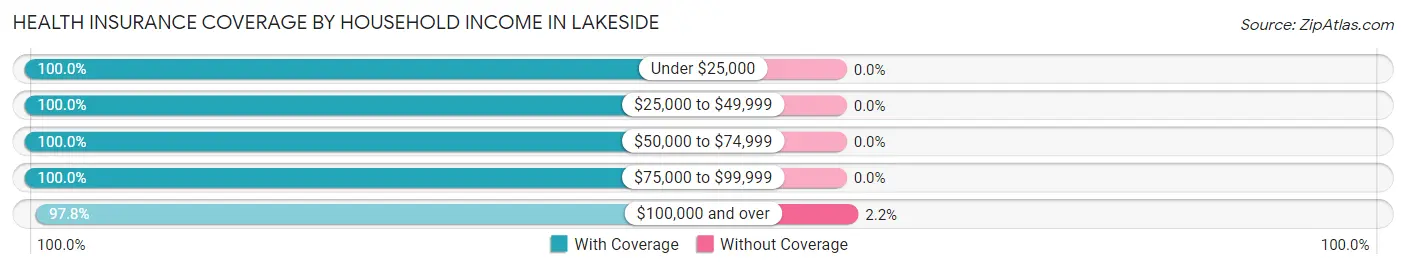
| Household Income | With Coverage | Without Coverage |
| Under $25,000 | 290 (100.0%) | 0 (0.0%) |
| $25,000 to $49,999 | 713 (100.0%) | 0 (0.0%) |
| $50,000 to $74,999 | 542 (100.0%) | 0 (0.0%) |
| $75,000 to $99,999 | 226 (100.0%) | 0 (0.0%) |
| $100,000 and over | 724 (97.8%) | 16 (2.2%) |
Public vs Private Health Insurance Coverage by Age in Lakeside
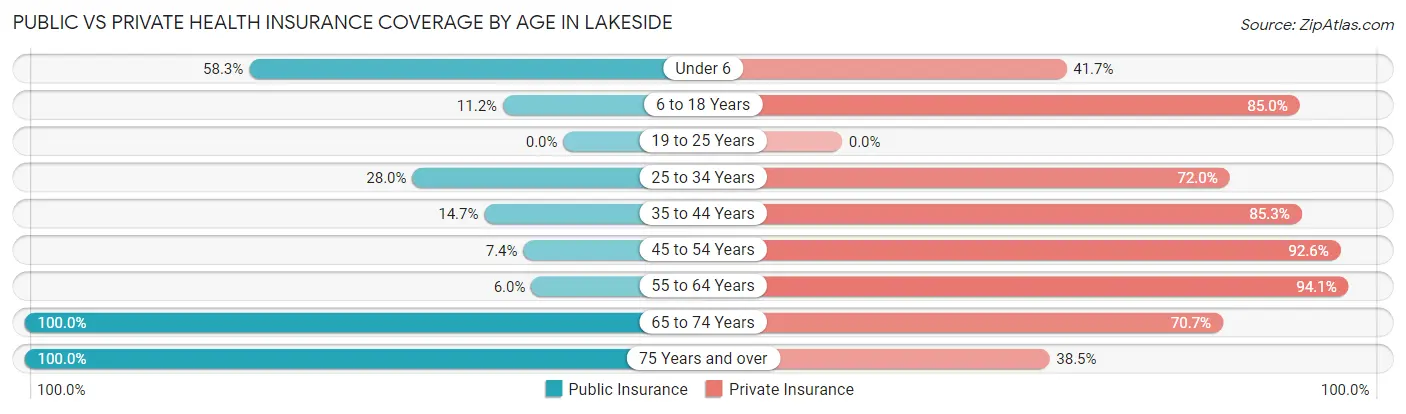
| Age Bracket | Public Insurance | Private Insurance |
| Under 6 | 126 (58.3%) | 90 (41.7%) |
| 6 to 18 Years | 47 (11.2%) | 356 (85.0%) |
| 19 to 25 Years | 0 (0.0%) | 0 (0.0%) |
| 25 to 34 Years | 67 (28.0%) | 172 (72.0%) |
| 35 to 44 Years | 33 (14.7%) | 192 (85.3%) |
| 45 to 54 Years | 21 (7.4%) | 262 (92.6%) |
| 55 to 64 Years | 35 (5.9%) | 553 (94.1%) |
| 65 to 74 Years | 376 (100.0%) | 266 (70.7%) |
| 75 Years and over | 218 (100.0%) | 84 (38.5%) |
| Total | 923 (36.0%) | 1,975 (77.0%) |
Disability Status by Sex by Age in Lakeside
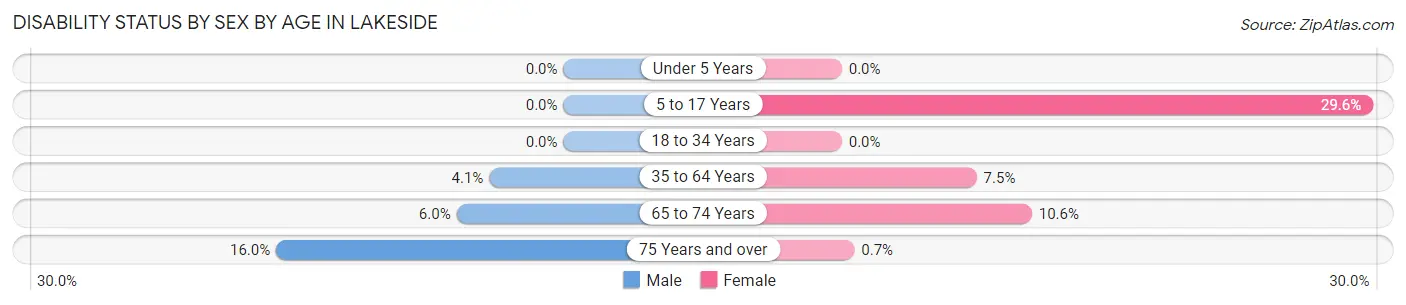
| Age Bracket | Male | Female |
| Under 5 Years | 0 (0.0%) | 0 (0.0%) |
| 5 to 17 Years | 0 (0.0%) | 84 (29.6%) |
| 18 to 34 Years | 0 (0.0%) | 0 (0.0%) |
| 35 to 64 Years | 26 (4.1%) | 35 (7.5%) |
| 65 to 74 Years | 10 (5.9%) | 22 (10.6%) |
| 75 Years and over | 12 (16.0%) | 1 (0.7%) |
Disability Class by Sex by Age in Lakeside
Disability Class: Hearing Difficulty
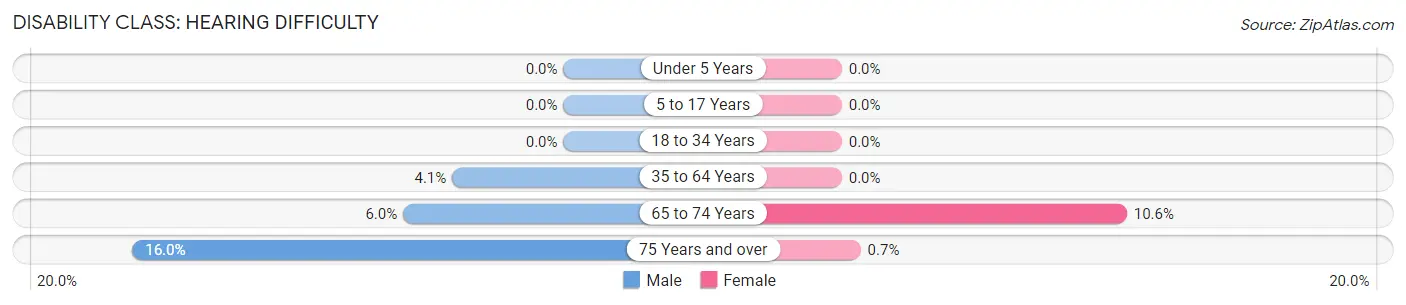
| Age Bracket | Male | Female |
| Under 5 Years | 0 (0.0%) | 0 (0.0%) |
| 5 to 17 Years | 0 (0.0%) | 0 (0.0%) |
| 18 to 34 Years | 0 (0.0%) | 0 (0.0%) |
| 35 to 64 Years | 26 (4.1%) | 0 (0.0%) |
| 65 to 74 Years | 10 (5.9%) | 22 (10.6%) |
| 75 Years and over | 12 (16.0%) | 1 (0.7%) |
Disability Class: Vision Difficulty
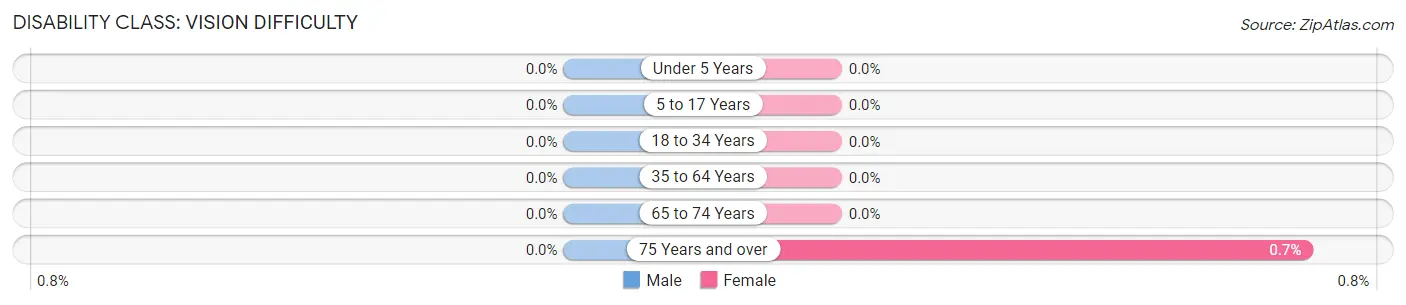
| Age Bracket | Male | Female |
| Under 5 Years | 0 (0.0%) | 0 (0.0%) |
| 5 to 17 Years | 0 (0.0%) | 0 (0.0%) |
| 18 to 34 Years | 0 (0.0%) | 0 (0.0%) |
| 35 to 64 Years | 0 (0.0%) | 0 (0.0%) |
| 65 to 74 Years | 0 (0.0%) | 0 (0.0%) |
| 75 Years and over | 0 (0.0%) | 1 (0.7%) |
Disability Class: Cognitive Difficulty
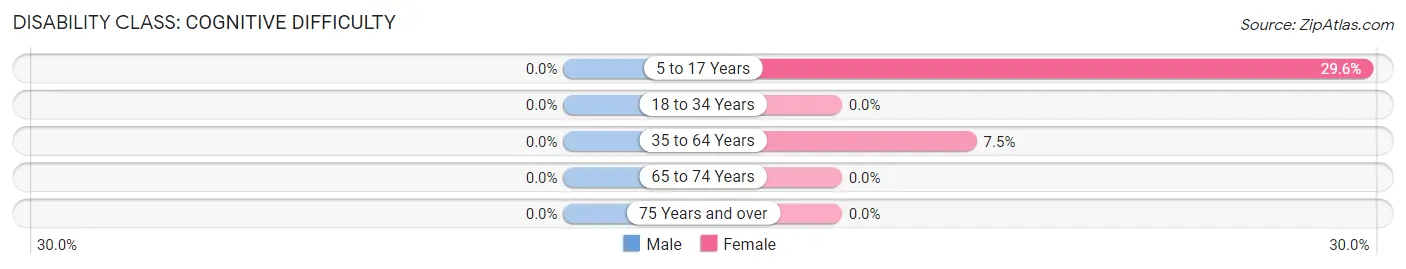
| Age Bracket | Male | Female |
| 5 to 17 Years | 0 (0.0%) | 84 (29.6%) |
| 18 to 34 Years | 0 (0.0%) | 0 (0.0%) |
| 35 to 64 Years | 0 (0.0%) | 35 (7.5%) |
| 65 to 74 Years | 0 (0.0%) | 0 (0.0%) |
| 75 Years and over | 0 (0.0%) | 0 (0.0%) |
Disability Class: Ambulatory Difficulty
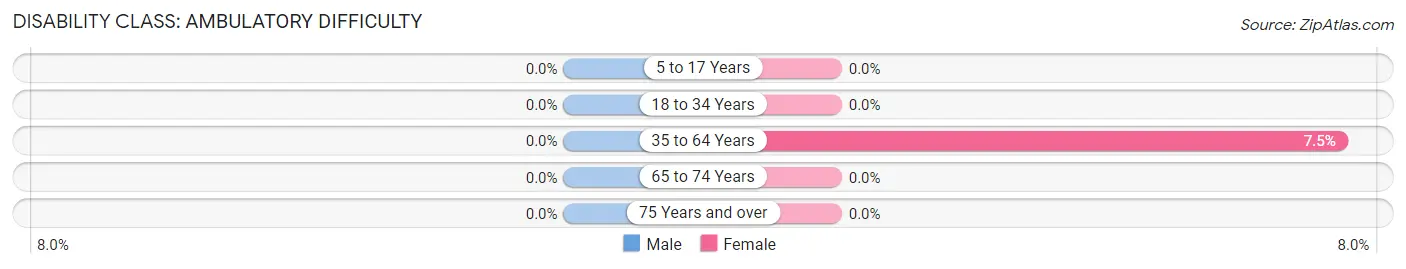
| Age Bracket | Male | Female |
| 5 to 17 Years | 0 (0.0%) | 0 (0.0%) |
| 18 to 34 Years | 0 (0.0%) | 0 (0.0%) |
| 35 to 64 Years | 0 (0.0%) | 35 (7.5%) |
| 65 to 74 Years | 0 (0.0%) | 0 (0.0%) |
| 75 Years and over | 0 (0.0%) | 0 (0.0%) |
Disability Class: Self-Care Difficulty
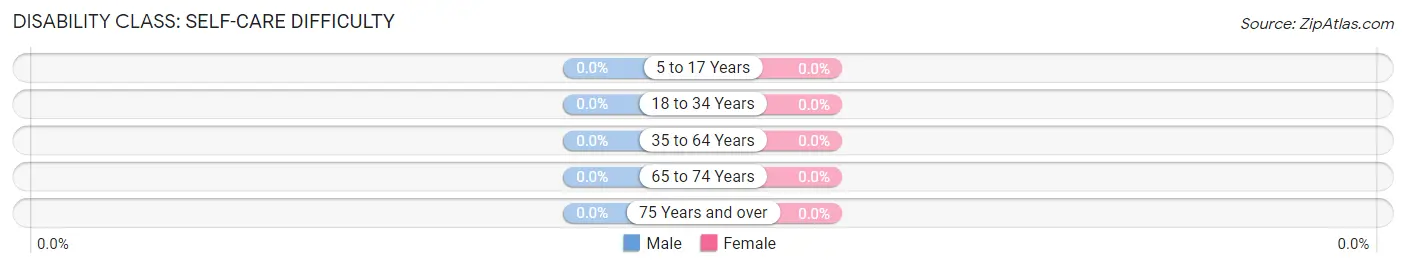
| Age Bracket | Male | Female |
| 5 to 17 Years | 0 (0.0%) | 0 (0.0%) |
| 18 to 34 Years | 0 (0.0%) | 0 (0.0%) |
| 35 to 64 Years | 0 (0.0%) | 0 (0.0%) |
| 65 to 74 Years | 0 (0.0%) | 0 (0.0%) |
| 75 Years and over | 0 (0.0%) | 0 (0.0%) |
Technology Access in Lakeside
Computing Device Access in Lakeside
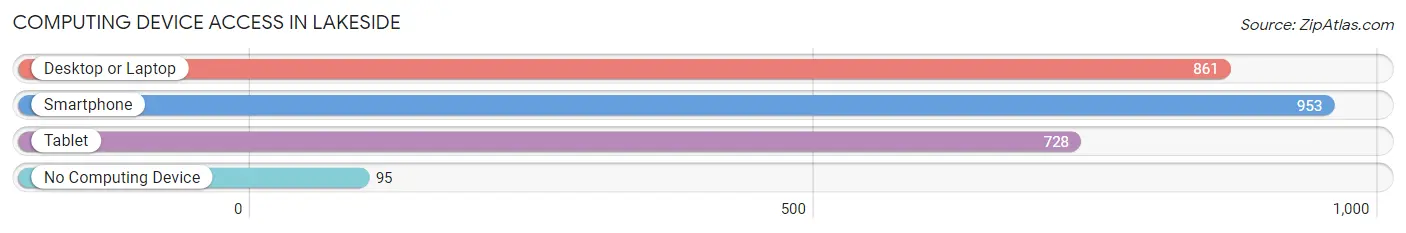
| Device Type | # Households | % Households |
| Desktop or Laptop | 861 | 76.7% |
| Smartphone | 953 | 84.9% |
| Tablet | 728 | 64.8% |
| No Computing Device | 95 | 8.5% |
| Total | 1,123 | 100.0% |
Internet Access in Lakeside
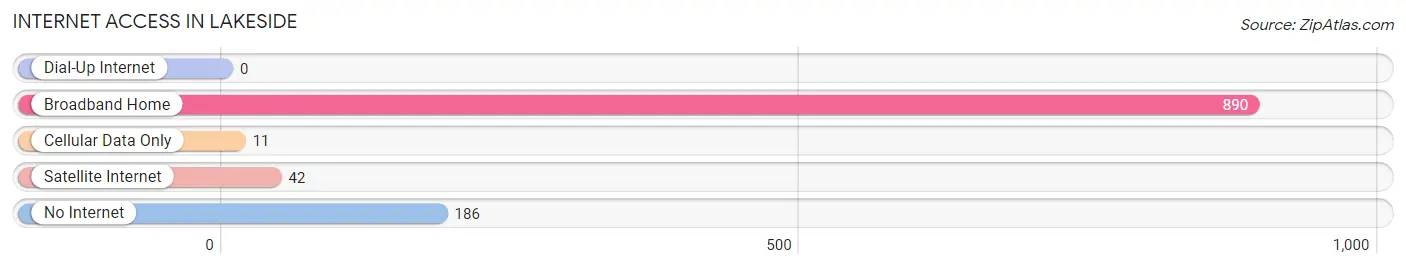
| Internet Type | # Households | % Households |
| Dial-Up Internet | 0 | 0.0% |
| Broadband Home | 890 | 79.2% |
| Cellular Data Only | 11 | 1.0% |
| Satellite Internet | 42 | 3.7% |
| No Internet | 186 | 16.6% |
| Total | 1,123 | 100.0% |
Lakeside Summary
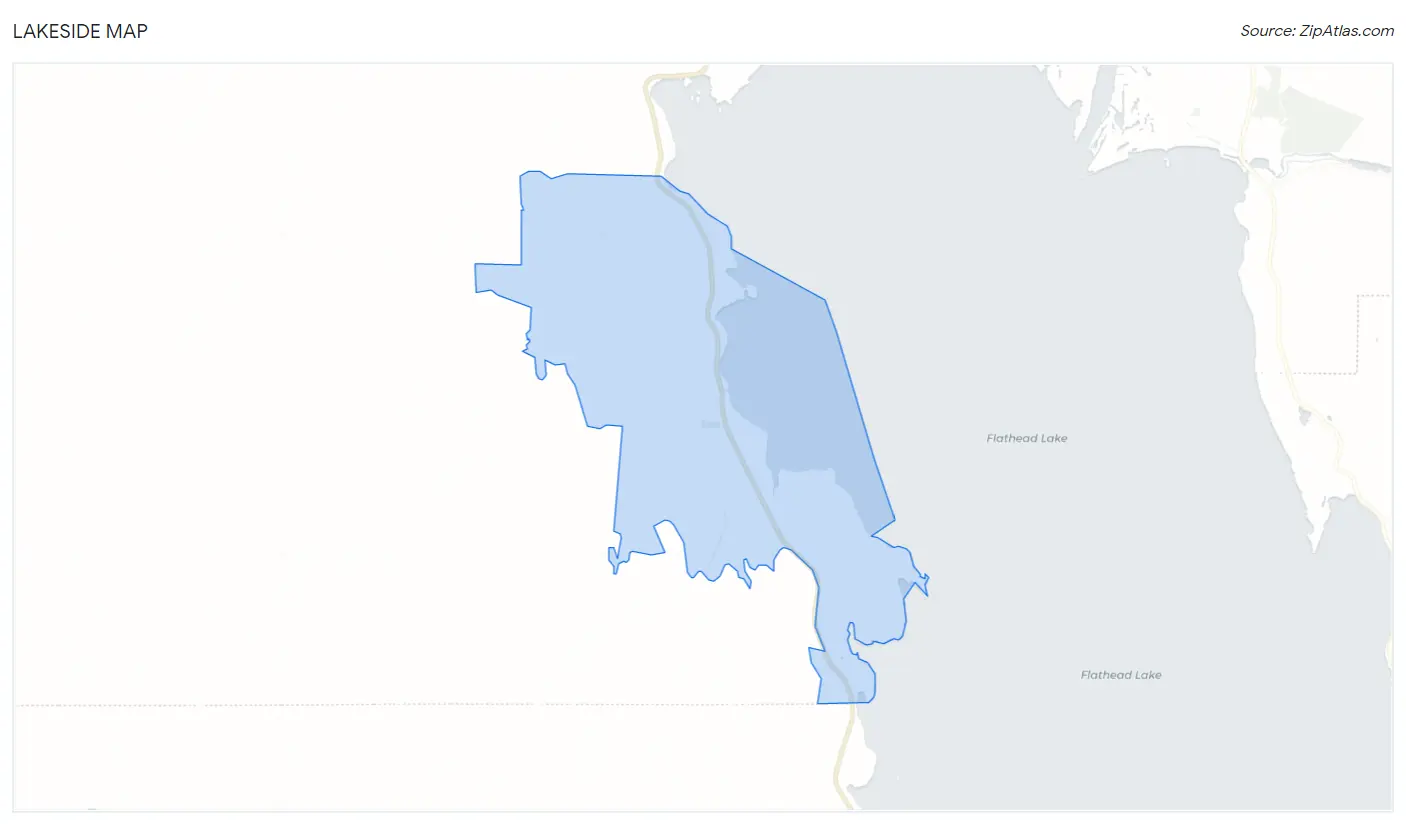
Lakeside, Montana is a small town located in Flathead County, Montana, United States. It is situated on the western shore of Flathead Lake, the largest natural freshwater lake in the western United States. The town has a population of approximately 1,500 people and is a popular tourist destination due to its proximity to Glacier National Park and Flathead Lake.
History
The area around Lakeside was first inhabited by the Salish-Kootenai people, who lived in the area for thousands of years before the arrival of European settlers. The first European settlers arrived in the area in the late 1800s, and the town of Lakeside was officially founded in 1902. The town was named after the nearby lake, which was named by explorer David Thompson in 1808.
The town grew slowly over the next few decades, and by the 1950s it had become a popular tourist destination. The town was incorporated in 1959, and the population has grown steadily since then.
Geography
Lakeside is located in Flathead County, Montana, on the western shore of Flathead Lake. The town is situated at an elevation of 2,845 feet (867 m) and has a total area of 1.2 square miles (3.2 km2). The town is surrounded by mountains and forests, and is located approximately 25 miles (40 km) north of Kalispell, Montana.
Climate
Lakeside has a humid continental climate, with cold winters and warm summers. The average annual temperature is 44.3 °F (6.8 °C), and the average annual precipitation is 17.3 inches (440 mm).
Economy
Lakeside’s economy is largely based on tourism, as the town is a popular destination for visitors to Glacier National Park and Flathead Lake. The town also has a number of small businesses, including restaurants, shops, and lodging.
Demographics
As of the 2010 census, the population of Lakeside was 1,521. The racial makeup of the town was 94.2% White, 0.3% African American, 1.2% Native American, 0.7% Asian, 0.1% Pacific Islander, 0.7% from other races, and 2.8% from two or more races. The median household income was $41,250, and the median family income was $48,750.
Conclusion
Lakeside, Montana is a small town located on the western shore of Flathead Lake. The town has a population of approximately 1,500 people and is a popular tourist destination due to its proximity to Glacier National Park and Flathead Lake. The town’s economy is largely based on tourism, and the population is mostly white. Lakeside has a humid continental climate, with cold winters and warm summers.
Common Questions
What is Per Capita Income in Lakeside?
Per Capita income in Lakeside is $41,790.
What is the Median Family Income in Lakeside?
Median Family Income in Lakeside is $75,118.
What is the Median Household income in Lakeside?
Median Household Income in Lakeside is $71,006.
What is Income or Wage Gap in Lakeside?
Income or Wage Gap in Lakeside is 45.3%.
Women in Lakeside earn 54.7 cents for every dollar earned by a man.
What is Family Income Deficit in Lakeside?
Family Income Deficit in Lakeside is $5,321.
Families that are below poverty line in Lakeside earn $5,321 less on average than the poverty threshold level.
What is Inequality or Gini Index in Lakeside?
Inequality or Gini Index in Lakeside is 0.43.
What is the Total Population of Lakeside?
Total Population of Lakeside is 2,564.
What is the Total Male Population of Lakeside?
Total Male Population of Lakeside is 1,159.
What is the Total Female Population of Lakeside?
Total Female Population of Lakeside is 1,405.
What is the Ratio of Males per 100 Females in Lakeside?
There are 82.49 Males per 100 Females in Lakeside.
What is the Ratio of Females per 100 Males in Lakeside?
There are 121.23 Females per 100 Males in Lakeside.
What is the Median Population Age in Lakeside?
Median Population Age in Lakeside is 53.6 Years.
What is the Average Family Size in Lakeside
Average Family Size in Lakeside is 3.0 People.
What is the Average Household Size in Lakeside
Average Household Size in Lakeside is 2.2 People.
How Large is the Labor Force in Lakeside?
There are 1,317 People in the Labor Forcein in Lakeside.
What is the Percentage of People in the Labor Force in Lakeside?
65.4% of People are in the Labor Force in Lakeside.