Bridger, MT Map & Demographics
Bridger Map
Bridger Overview
$108,141
PER CAPITA INCOME
$130,583
AVG FAMILY INCOME
$116,818
AVG HOUSEHOLD INCOME
0.54
INEQUALITY / GINI INDEX
169
TOTAL POPULATION
105
MALE POPULATION
64
FEMALE POPULATION
164.06
MALES / 100 FEMALES
60.95
FEMALES / 100 MALES
38.5
MEDIAN AGE
3.5
AVG FAMILY SIZE
2.5
AVG HOUSEHOLD SIZE
108
LABOR FORCE [ PEOPLE ]
77.7%
PERCENT IN LABOR FORCE
Bridger Zip Codes
Bridger Area Codes
Income in Bridger
Income Overview in Bridger
Per Capita Income in Bridger is $108,141, while median incomes of families and households are $130,583 and $116,818 respectively.
| Characteristic | Number | Measure |
| Per Capita Income | 169 | $108,141 |
| Median Family Income | 29 | $130,583 |
| Mean Family Income | 29 | $424,910 |
| Median Household Income | 68 | $116,818 |
| Mean Household Income | 68 | $263,837 |
| Income Deficit | 29 | $0 |
| Wage / Income Gap (%) | 169 | 0.00% |
| Wage / Income Gap ($) | 169 | 100.00¢ per $1 |
| Gini / Inequality Index | 169 | 0.54 |
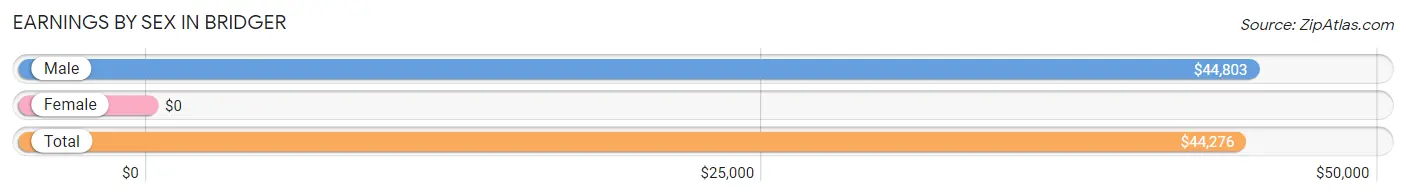
Earnings by Sex in Bridger
| Sex | Number | Average Earnings |
| Male | 71 (61.7%) | $44,803 |
| Female | 44 (38.3%) | $0 |
| Total | 115 (100.0%) | $44,276 |
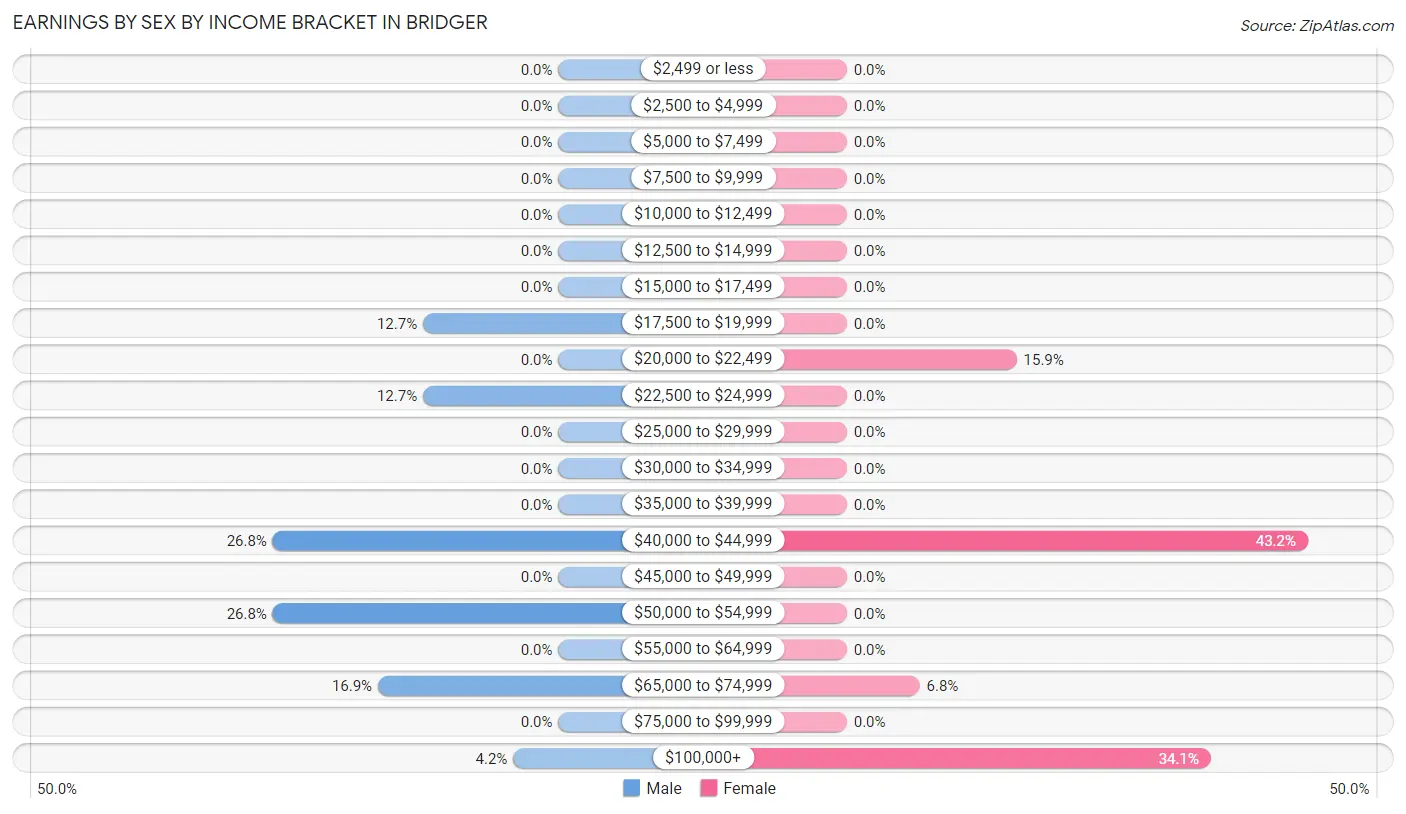
Earnings by Sex by Income Bracket in Bridger
The most common earnings brackets in Bridger are $40,000 to $44,999 for men (19 | 26.8%) and $40,000 to $44,999 for women (19 | 43.2%).
| Income | Male | Female |
| $2,499 or less | 0 (0.0%) | 0 (0.0%) |
| $2,500 to $4,999 | 0 (0.0%) | 0 (0.0%) |
| $5,000 to $7,499 | 0 (0.0%) | 0 (0.0%) |
| $7,500 to $9,999 | 0 (0.0%) | 0 (0.0%) |
| $10,000 to $12,499 | 0 (0.0%) | 0 (0.0%) |
| $12,500 to $14,999 | 0 (0.0%) | 0 (0.0%) |
| $15,000 to $17,499 | 0 (0.0%) | 0 (0.0%) |
| $17,500 to $19,999 | 9 (12.7%) | 0 (0.0%) |
| $20,000 to $22,499 | 0 (0.0%) | 7 (15.9%) |
| $22,500 to $24,999 | 9 (12.7%) | 0 (0.0%) |
| $25,000 to $29,999 | 0 (0.0%) | 0 (0.0%) |
| $30,000 to $34,999 | 0 (0.0%) | 0 (0.0%) |
| $35,000 to $39,999 | 0 (0.0%) | 0 (0.0%) |
| $40,000 to $44,999 | 19 (26.8%) | 19 (43.2%) |
| $45,000 to $49,999 | 0 (0.0%) | 0 (0.0%) |
| $50,000 to $54,999 | 19 (26.8%) | 0 (0.0%) |
| $55,000 to $64,999 | 0 (0.0%) | 0 (0.0%) |
| $65,000 to $74,999 | 12 (16.9%) | 3 (6.8%) |
| $75,000 to $99,999 | 0 (0.0%) | 0 (0.0%) |
| $100,000+ | 3 (4.2%) | 15 (34.1%) |
| Total | 71 (100.0%) | 44 (100.0%) |
Earnings by Sex by Educational Attainment in Bridger
| Educational Attainment | Male Income | Female Income |
| Less than High School | - | - |
| High School Diploma | - | - |
| College or Associate's Degree | - | - |
| Bachelor's Degree | - | - |
| Graduate Degree | - | - |
| Total | $44,803 | $0 |
Family Income in Bridger
Family Income Brackets in Bridger
According to the Bridger family income data, there are 26 families falling into the $100,000 to $149,999 income range, which is the most common income bracket and makes up 89.7% of all families.
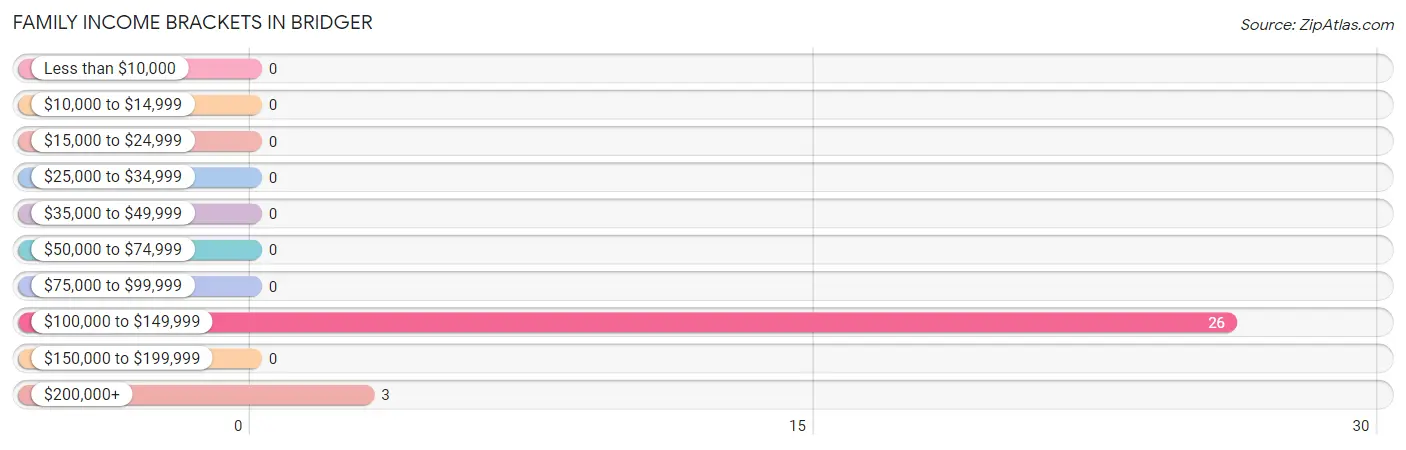
| Income Bracket | # Families | % Families |
| Less than $10,000 | 0 | 0.0% |
| $10,000 to $14,999 | 0 | 0.0% |
| $15,000 to $24,999 | 0 | 0.0% |
| $25,000 to $34,999 | 0 | 0.0% |
| $35,000 to $49,999 | 0 | 0.0% |
| $50,000 to $74,999 | 0 | 0.0% |
| $75,000 to $99,999 | 0 | 0.0% |
| $100,000 to $149,999 | 26 | 89.7% |
| $150,000 to $199,999 | 0 | 0.0% |
| $200,000+ | 3 | 10.3% |
Family Income by Famaliy Size in Bridger

| Income Bracket | # Families | Median Income |
| 2-Person Families | 3 (10.3%) | $0 |
| 3-Person Families | 11 (37.9%) | $0 |
| 4-Person Families | 0 (0.0%) | $0 |
| 5-Person Families | 15 (51.7%) | $0 |
| 6-Person Families | 0 (0.0%) | $0 |
| 7+ Person Families | 0 (0.0%) | $0 |
| Total | 29 (100.0%) | $130,583 |
Family Income by Number of Earners in Bridger
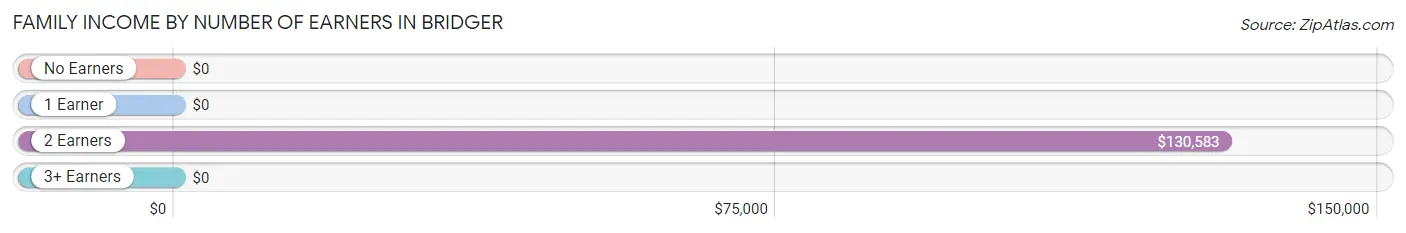
| Number of Earners | # Families | Median Income |
| No Earners | 0 (0.0%) | $0 |
| 1 Earner | 0 (0.0%) | $0 |
| 2 Earners | 29 (100.0%) | $130,583 |
| 3+ Earners | 0 (0.0%) | $0 |
| Total | 29 (100.0%) | $130,583 |
Household Income in Bridger
Household Income Brackets in Bridger
With 33 households falling in the category, the $100,000 to $149,999 income range is the most frequent in Bridger, accounting for 48.5% of all households.
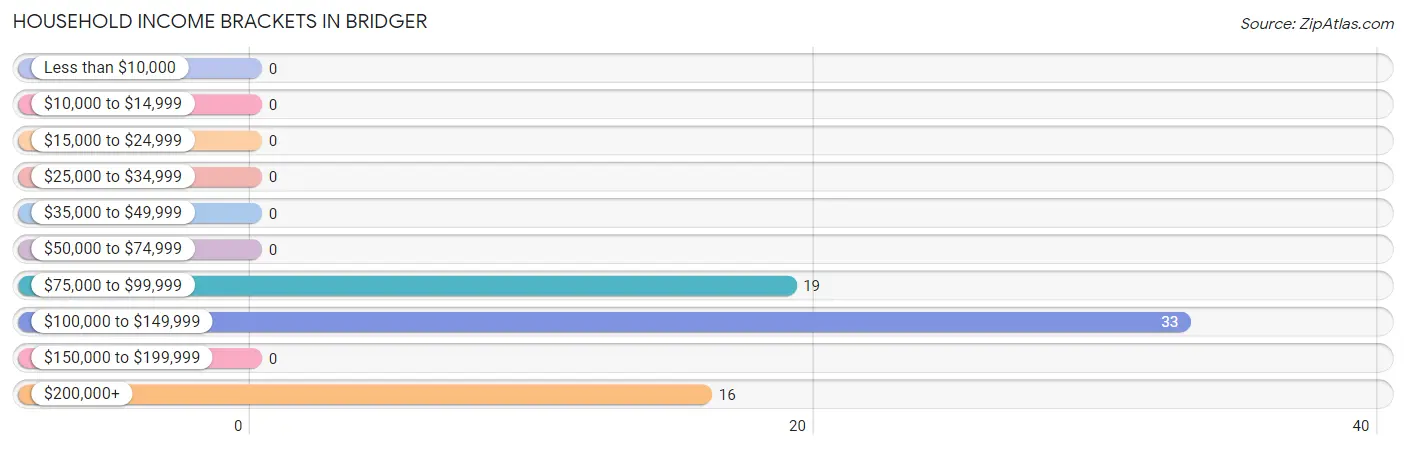
| Income Bracket | # Households | % Households |
| Less than $10,000 | 0 | 0.0% |
| $10,000 to $14,999 | 0 | 0.0% |
| $15,000 to $24,999 | 0 | 0.0% |
| $25,000 to $34,999 | 0 | 0.0% |
| $35,000 to $49,999 | 0 | 0.0% |
| $50,000 to $74,999 | 0 | 0.0% |
| $75,000 to $99,999 | 19 | 27.9% |
| $100,000 to $149,999 | 33 | 48.5% |
| $150,000 to $199,999 | 0 | 0.0% |
| $200,000+ | 16 | 23.5% |
Household Income by Householder Age in Bridger
The median household income in Bridger is $116,818, with the highest median household income of $230,481 found in the 65+ years age bracket for the primary householder. A total of 27 households (39.7%) fall into this category.
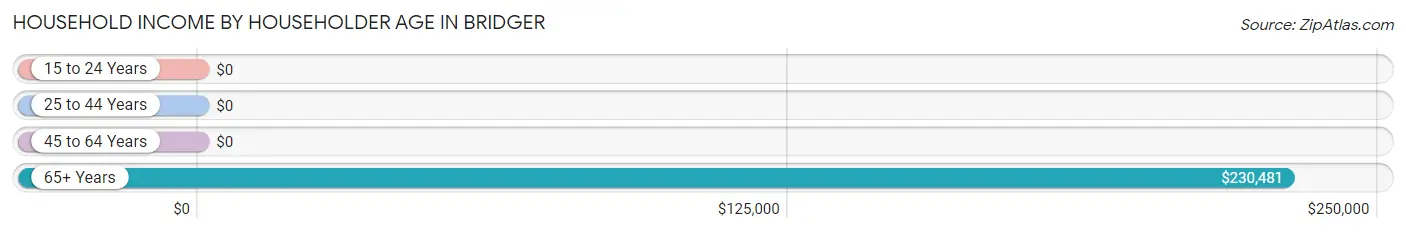
| Income Bracket | # Households | Median Income |
| 15 to 24 Years | 0 (0.0%) | $0 |
| 25 to 44 Years | 34 (50.0%) | $0 |
| 45 to 64 Years | 7 (10.3%) | $0 |
| 65+ Years | 27 (39.7%) | $230,481 |
| Total | 68 (100.0%) | $116,818 |
Poverty in Bridger
Income Below Poverty by Sex and Age in Bridger
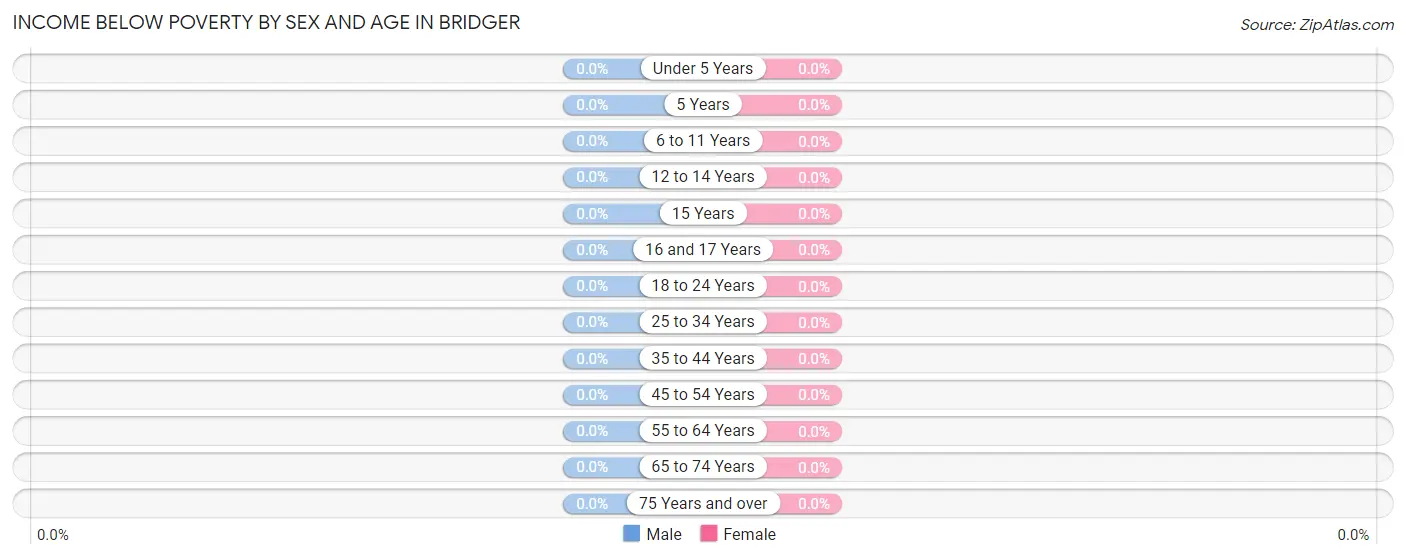
| Age Bracket | Male | Female |
| Under 5 Years | 0 (0.0%) | 0 (0.0%) |
| 5 Years | 0 (0.0%) | 0 (0.0%) |
| 6 to 11 Years | 0 (0.0%) | 0 (0.0%) |
| 12 to 14 Years | 0 (0.0%) | 0 (0.0%) |
| 15 Years | 0 (0.0%) | 0 (0.0%) |
| 16 and 17 Years | 0 (0.0%) | 0 (0.0%) |
| 18 to 24 Years | 0 (0.0%) | 0 (0.0%) |
| 25 to 34 Years | 0 (0.0%) | 0 (0.0%) |
| 35 to 44 Years | 0 (0.0%) | 0 (0.0%) |
| 45 to 54 Years | 0 (0.0%) | 0 (0.0%) |
| 55 to 64 Years | 0 (0.0%) | 0 (0.0%) |
| 65 to 74 Years | 0 (0.0%) | 0 (0.0%) |
| 75 Years and over | 0 (0.0%) | 0 (0.0%) |
| Total | 0 (0.0%) | 0 (0.0%) |
Income Above Poverty by Sex and Age in Bridger
According to the poverty statistics in Bridger, males aged 5 years and females aged 6 to 11 years are the age groups that are most secure financially, with 100.0% of males and 100.0% of females in these age groups living above the poverty line.
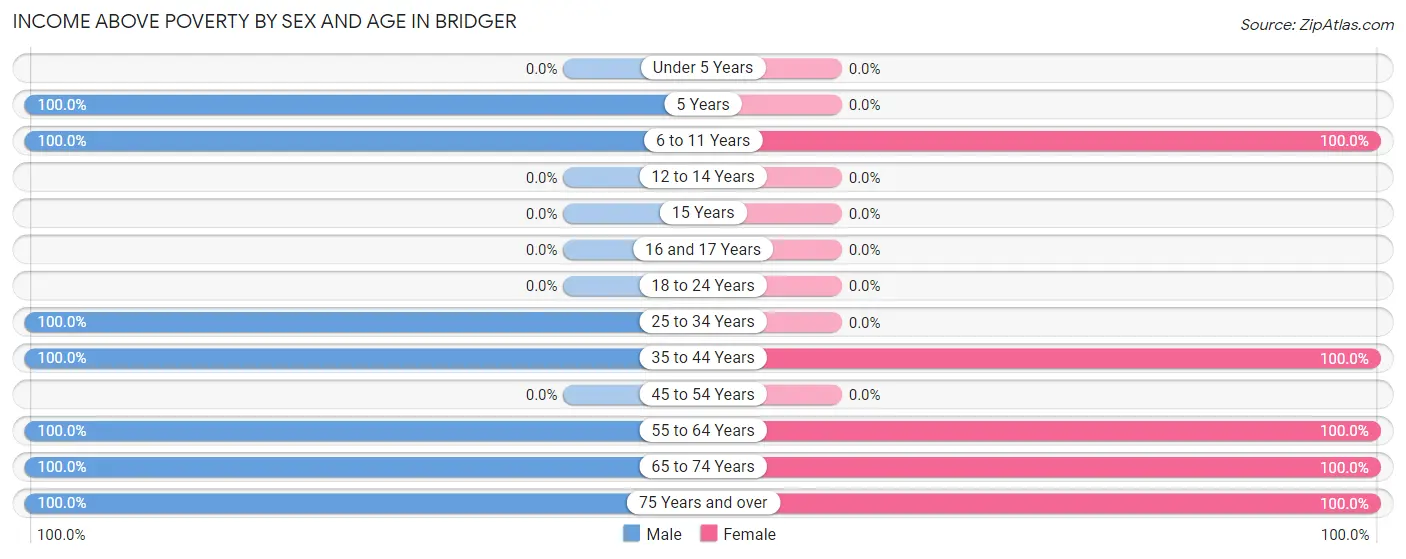
| Age Bracket | Male | Female |
| Under 5 Years | 0 (0.0%) | 0 (0.0%) |
| 5 Years | 10 (100.0%) | 0 (0.0%) |
| 6 to 11 Years | 11 (100.0%) | 9 (100.0%) |
| 12 to 14 Years | 0 (0.0%) | 0 (0.0%) |
| 15 Years | 0 (0.0%) | 0 (0.0%) |
| 16 and 17 Years | 0 (0.0%) | 0 (0.0%) |
| 18 to 24 Years | 0 (0.0%) | 0 (0.0%) |
| 25 to 34 Years | 38 (100.0%) | 0 (0.0%) |
| 35 to 44 Years | 21 (100.0%) | 34 (100.0%) |
| 45 to 54 Years | 0 (0.0%) | 0 (0.0%) |
| 55 to 64 Years | 9 (100.0%) | 7 (100.0%) |
| 65 to 74 Years | 3 (100.0%) | 3 (100.0%) |
| 75 Years and over | 13 (100.0%) | 11 (100.0%) |
| Total | 105 (100.0%) | 64 (100.0%) |
Income Below Poverty Among Married-Couple Families in Bridger
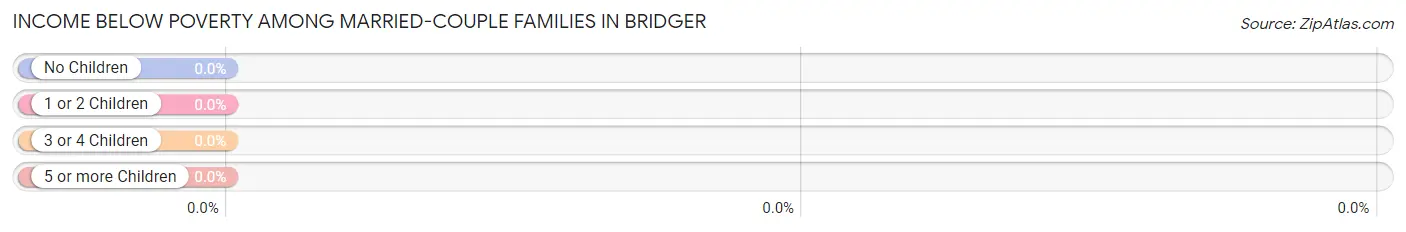
| Children | Above Poverty | Below Poverty |
| No Children | 3 (100.0%) | 0 (0.0%) |
| 1 or 2 Children | 0 (0.0%) | 0 (0.0%) |
| 3 or 4 Children | 15 (100.0%) | 0 (0.0%) |
| 5 or more Children | 0 (0.0%) | 0 (0.0%) |
| Total | 18 (100.0%) | 0 (0.0%) |
Income Below Poverty Among Single-Parent Households in Bridger
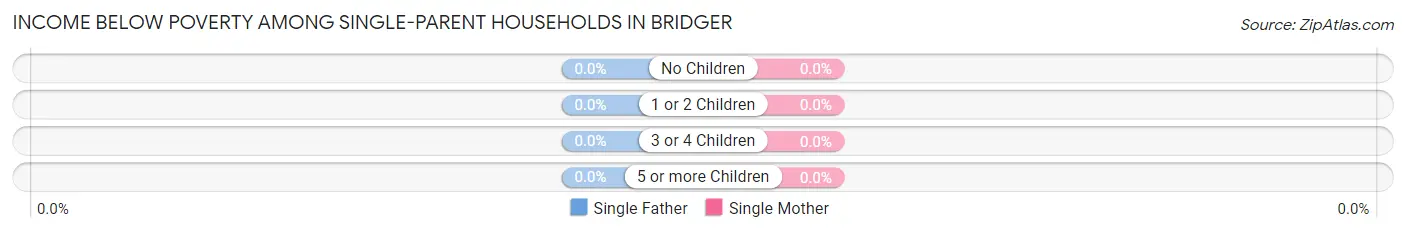
| Children | Single Father | Single Mother |
| No Children | 0 (0.0%) | 0 (0.0%) |
| 1 or 2 Children | 0 (0.0%) | 0 (0.0%) |
| 3 or 4 Children | 0 (0.0%) | 0 (0.0%) |
| 5 or more Children | 0 (0.0%) | 0 (0.0%) |
| Total | 0 (0.0%) | 0 (0.0%) |
Income Below Poverty Among Married-Couple vs Single-Parent Households in Bridger
| Children | Married-Couple Families | Single-Parent Households |
| No Children | 0 (0.0%) | 0 (0.0%) |
| 1 or 2 Children | 0 (0.0%) | 0 (0.0%) |
| 3 or 4 Children | 0 (0.0%) | 0 (0.0%) |
| 5 or more Children | 0 (0.0%) | 0 (0.0%) |
| Total | 0 (0.0%) | 0 (0.0%) |
Race in Bridger
The most populous races in Bridger are White / Caucasian (135 | 79.9%), Asian (19 | 11.2%), and Two or more Races (15 | 8.9%).
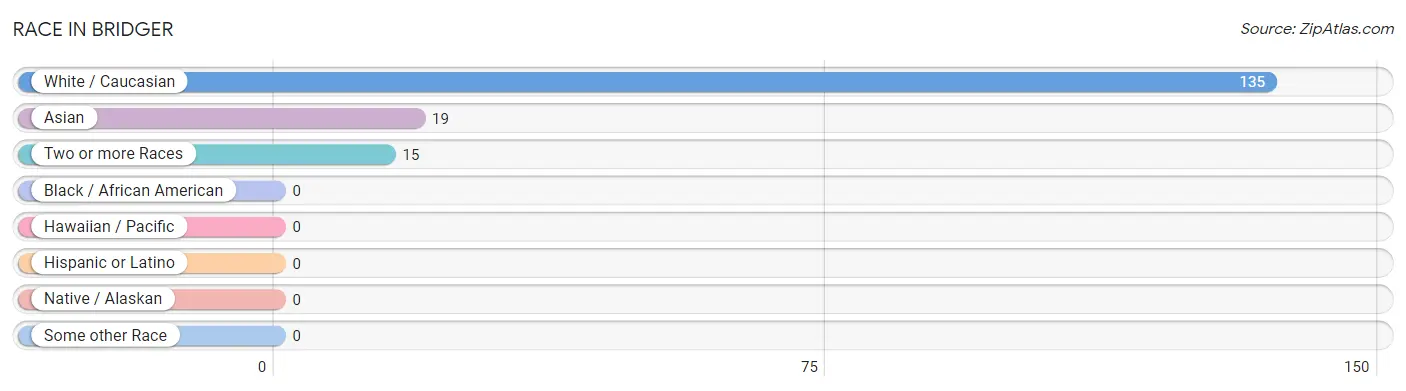
| Race | # Population | % Population |
| Asian | 19 | 11.2% |
| Black / African American | 0 | 0.0% |
| Hawaiian / Pacific | 0 | 0.0% |
| Hispanic or Latino | 0 | 0.0% |
| Native / Alaskan | 0 | 0.0% |
| White / Caucasian | 135 | 79.9% |
| Two or more Races | 15 | 8.9% |
| Some other Race | 0 | 0.0% |
| Total | 169 | 100.0% |
Ancestry in Bridger
The most populous ancestries reported in Bridger are German (39 | 23.1%), Scottish (29 | 17.2%), Swedish (25 | 14.8%), Irish (22 | 13.0%), and English (20 | 11.8%), together accounting for 79.9% of all Bridger residents.
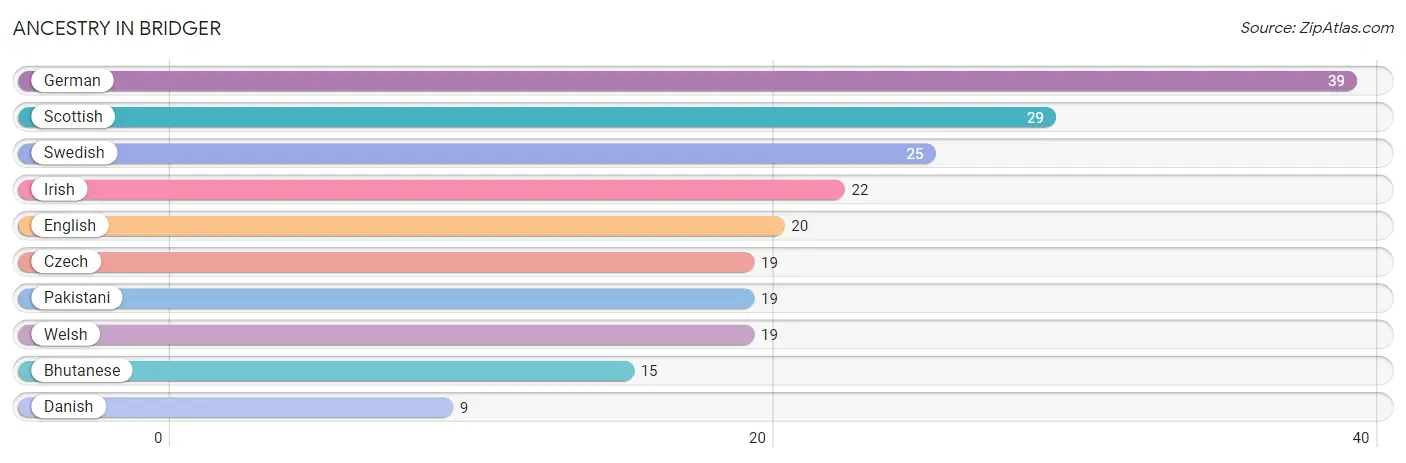
| Ancestry | # Population | % Population |
| Bhutanese | 15 | 8.9% |
| Czech | 19 | 11.2% |
| Danish | 9 | 5.3% |
| English | 20 | 11.8% |
| German | 39 | 23.1% |
| Irish | 22 | 13.0% |
| Pakistani | 19 | 11.2% |
| Scottish | 29 | 17.2% |
| Swedish | 25 | 14.8% |
| Welsh | 19 | 11.2% | View All 10 Rows |
Immigrants in Bridger
The most numerous immigrant groups reported in Bridger came from Asia (19 | 11.2%), South Eastern Asia (19 | 11.2%), and Thailand (19 | 11.2%), together accounting for 33.7% of all Bridger residents.
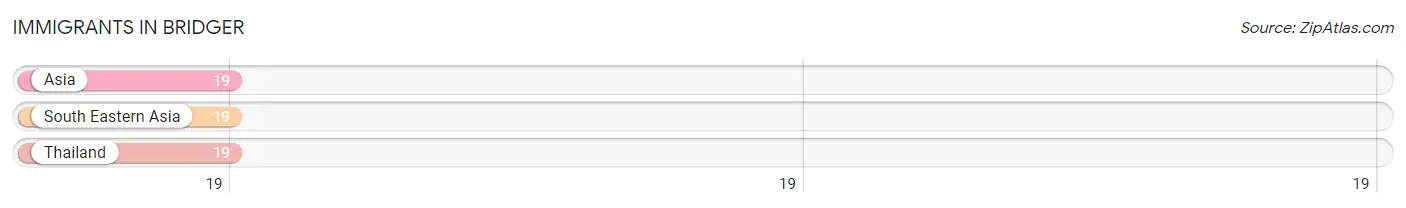
| Immigration Origin | # Population | % Population |
| Asia | 19 | 11.2% |
| South Eastern Asia | 19 | 11.2% |
| Thailand | 19 | 11.2% | View All 3 Rows |
Sex and Age in Bridger
Sex and Age in Bridger
The most populous age groups in Bridger are 25 to 29 Years (38 | 36.2%) for men and 40 to 44 Years (19 | 29.7%) for women.
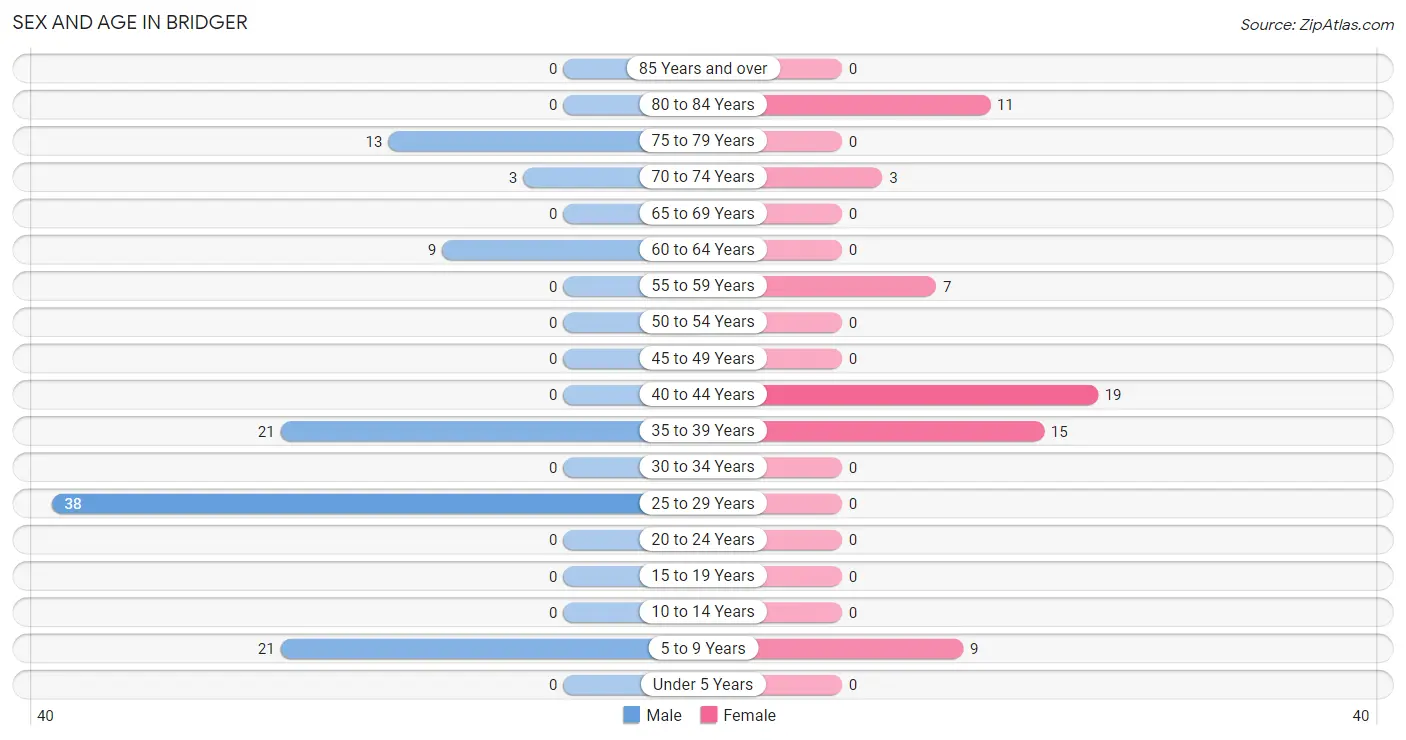
| Age Bracket | Male | Female |
| Under 5 Years | 0 (0.0%) | 0 (0.0%) |
| 5 to 9 Years | 21 (20.0%) | 9 (14.1%) |
| 10 to 14 Years | 0 (0.0%) | 0 (0.0%) |
| 15 to 19 Years | 0 (0.0%) | 0 (0.0%) |
| 20 to 24 Years | 0 (0.0%) | 0 (0.0%) |
| 25 to 29 Years | 38 (36.2%) | 0 (0.0%) |
| 30 to 34 Years | 0 (0.0%) | 0 (0.0%) |
| 35 to 39 Years | 21 (20.0%) | 15 (23.4%) |
| 40 to 44 Years | 0 (0.0%) | 19 (29.7%) |
| 45 to 49 Years | 0 (0.0%) | 0 (0.0%) |
| 50 to 54 Years | 0 (0.0%) | 0 (0.0%) |
| 55 to 59 Years | 0 (0.0%) | 7 (10.9%) |
| 60 to 64 Years | 9 (8.6%) | 0 (0.0%) |
| 65 to 69 Years | 0 (0.0%) | 0 (0.0%) |
| 70 to 74 Years | 3 (2.9%) | 3 (4.7%) |
| 75 to 79 Years | 13 (12.4%) | 0 (0.0%) |
| 80 to 84 Years | 0 (0.0%) | 11 (17.2%) |
| 85 Years and over | 0 (0.0%) | 0 (0.0%) |
| Total | 105 (100.0%) | 64 (100.0%) |
Families and Households in Bridger
Median Family Size in Bridger
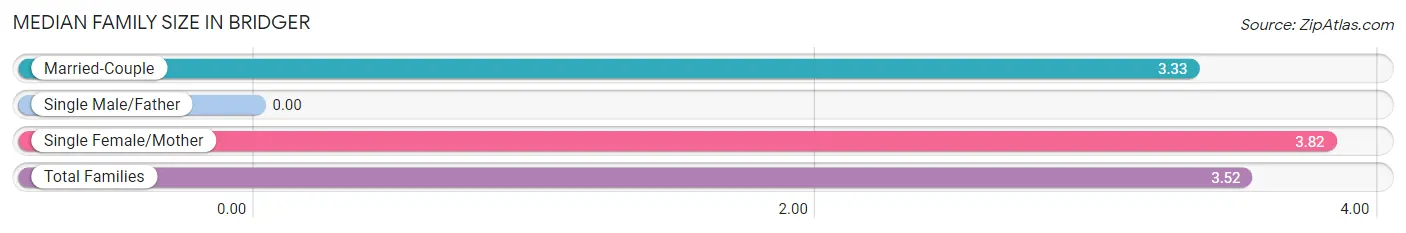
| Family Type | # Families | Family Size |
| Married-Couple | 18 (62.1%) | 3.33 |
| Single Male/Father | 0 (0.0%) | - |
| Single Female/Mother | 11 (37.9%) | 3.82 |
| Total Families | 29 (100.0%) | 3.52 |
Median Household Size in Bridger
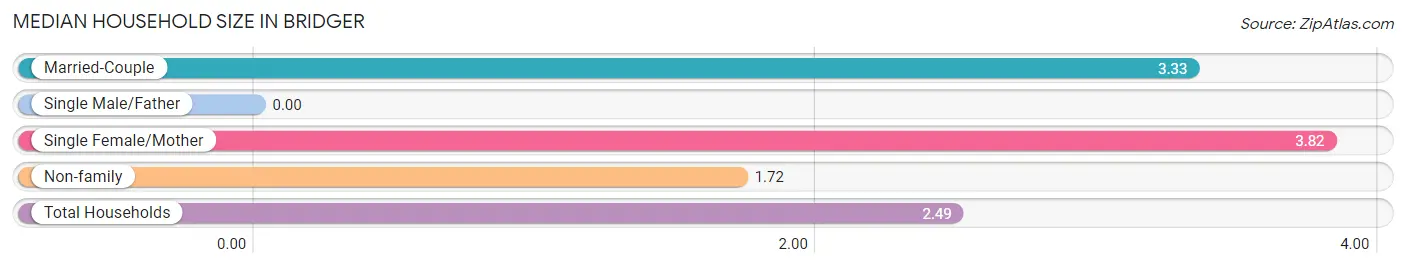
| Household Type | # Households | Household Size |
| Married-Couple | 18 (26.5%) | 3.33 |
| Single Male/Father | 0 (0.0%) | - |
| Single Female/Mother | 11 (16.2%) | 3.82 |
| Non-family | 39 (57.4%) | 1.72 |
| Total Households | 68 (100.0%) | 2.49 |
Household Size by Marriage Status in Bridger
Out of a total of 68 households in Bridger, 29 (42.6%) are family households, while 39 (57.4%) are nonfamily households. The most numerous type of family households are 5-person households, comprising 15, and the most common type of nonfamily households are 2-person households, comprising 26.
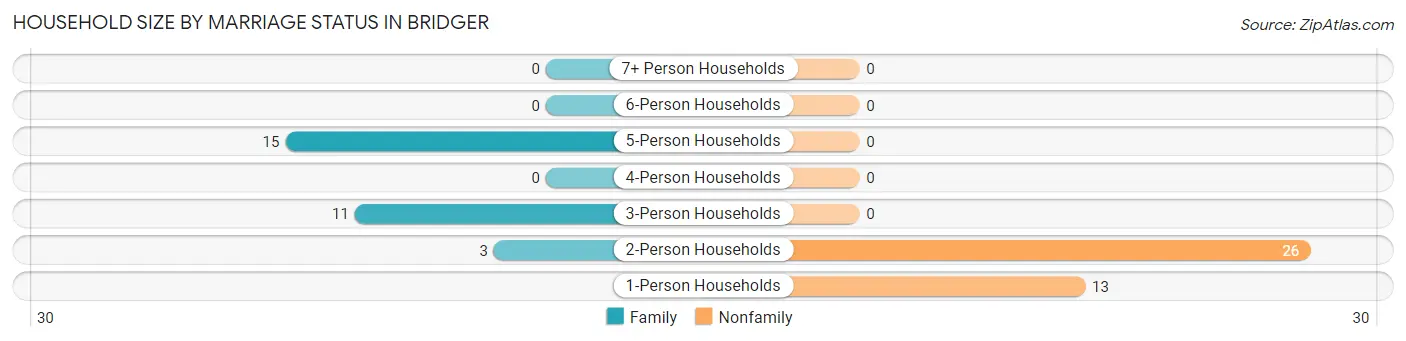
| Household Size | Family Households | Nonfamily Households |
| 1-Person Households | - | 13 (19.1%) |
| 2-Person Households | 3 (4.4%) | 26 (38.2%) |
| 3-Person Households | 11 (16.2%) | 0 (0.0%) |
| 4-Person Households | 0 (0.0%) | 0 (0.0%) |
| 5-Person Households | 15 (22.1%) | 0 (0.0%) |
| 6-Person Households | 0 (0.0%) | 0 (0.0%) |
| 7+ Person Households | 0 (0.0%) | 0 (0.0%) |
| Total | 29 (42.6%) | 39 (57.4%) |
Female Fertility in Bridger
Fertility by Age in Bridger
| Age Bracket | Women with Births | Births / 1,000 Women |
| 15 to 19 years | 0 (0.0%) | 0.0 |
| 20 to 34 years | 0 (0.0%) | 0.0 |
| 35 to 50 years | 0 (0.0%) | 0.0 |
| Total | 0 (0.0%) | 0.0 |
Fertility by Age by Marriage Status in Bridger
| Age Bracket | Married | Unmarried |
| 15 to 19 years | 0 (0.0%) | 0 (0.0%) |
| 20 to 34 years | 0 (0.0%) | 0 (0.0%) |
| 35 to 50 years | 0 (0.0%) | 0 (0.0%) |
| Total | 0 (0.0%) | 0 (0.0%) |
Fertility by Education in Bridger
| Educational Attainment | Women with Births | Births / 1,000 Women |
| Less than High School | 0 (0.0%) | 0.0 |
| High School Diploma | 0 (0.0%) | 0.0 |
| College or Associate's Degree | 0 (0.0%) | 0.0 |
| Bachelor's Degree | 0 (0.0%) | 0.0 |
| Graduate Degree | 0 (0.0%) | 0.0 |
| Total | 0 (0.0%) | 0.0 |
Fertility by Education by Marriage Status in Bridger
| Educational Attainment | Married | Unmarried |
| Less than High School | 0 (0.0%) | 0 (0.0%) |
| High School Diploma | 0 (0.0%) | 0 (0.0%) |
| College or Associate's Degree | 0 (0.0%) | 0 (0.0%) |
| Bachelor's Degree | 0 (0.0%) | 0 (0.0%) |
| Graduate Degree | 0 (0.0%) | 0 (0.0%) |
| Total | 0 (0.0%) | 0 (0.0%) |
Employment Characteristics in Bridger
Employment by Class of Employer in Bridger
Among the 108 employed individuals in Bridger, private company employees (62 | 57.4%), federal government employees (19 | 17.6%), and not-for-profit organizations (15 | 13.9%) make up the most common classes of employment.
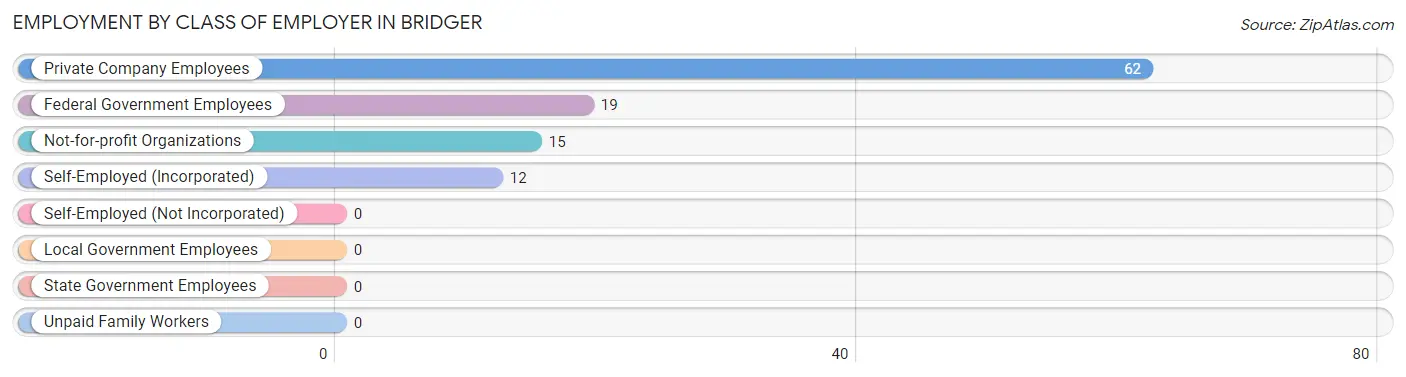
| Employer Class | # Employees | % Employees |
| Private Company Employees | 62 | 57.4% |
| Self-Employed (Incorporated) | 12 | 11.1% |
| Self-Employed (Not Incorporated) | 0 | 0.0% |
| Not-for-profit Organizations | 15 | 13.9% |
| Local Government Employees | 0 | 0.0% |
| State Government Employees | 0 | 0.0% |
| Federal Government Employees | 19 | 17.6% |
| Unpaid Family Workers | 0 | 0.0% |
| Total | 108 | 100.0% |
Employment Status by Age in Bridger
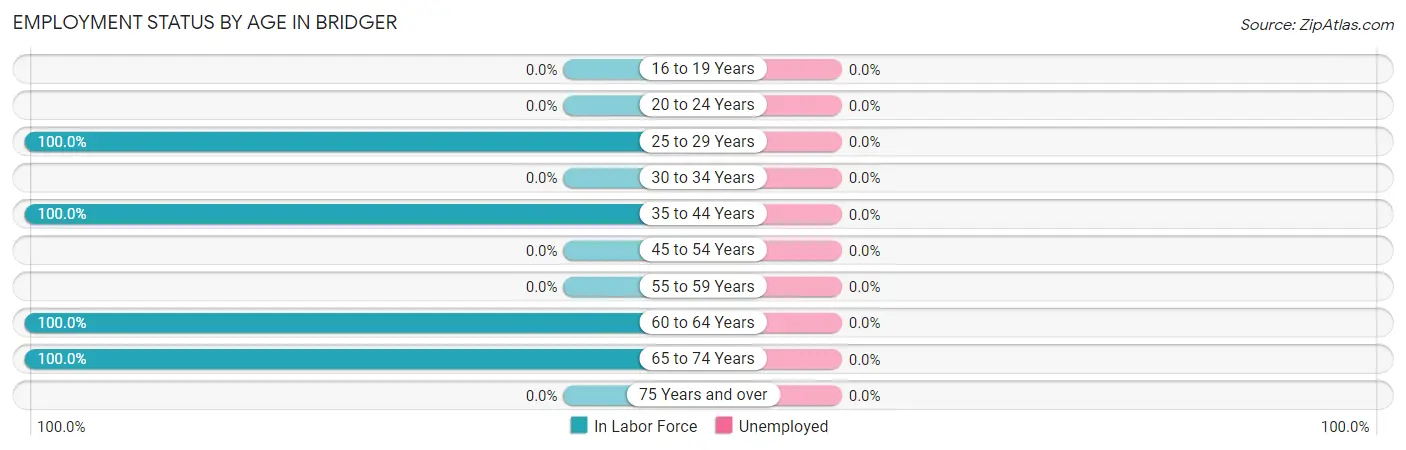
| Age Bracket | In Labor Force | Unemployed |
| 16 to 19 Years | 0 (0.0%) | 0 (0.0%) |
| 20 to 24 Years | 0 (0.0%) | 0 (0.0%) |
| 25 to 29 Years | 38 (100.0%) | 0 (0.0%) |
| 30 to 34 Years | 0 (0.0%) | 0 (0.0%) |
| 35 to 44 Years | 55 (100.0%) | 0 (0.0%) |
| 45 to 54 Years | 0 (0.0%) | 0 (0.0%) |
| 55 to 59 Years | 0 (0.0%) | 0 (0.0%) |
| 60 to 64 Years | 9 (100.0%) | 0 (0.0%) |
| 65 to 74 Years | 6 (100.0%) | 0 (0.0%) |
| 75 Years and over | 0 (0.0%) | 0 (0.0%) |
| Total | 108 (77.7%) | 0 (0.0%) |
Employment Status by Educational Attainment in Bridger
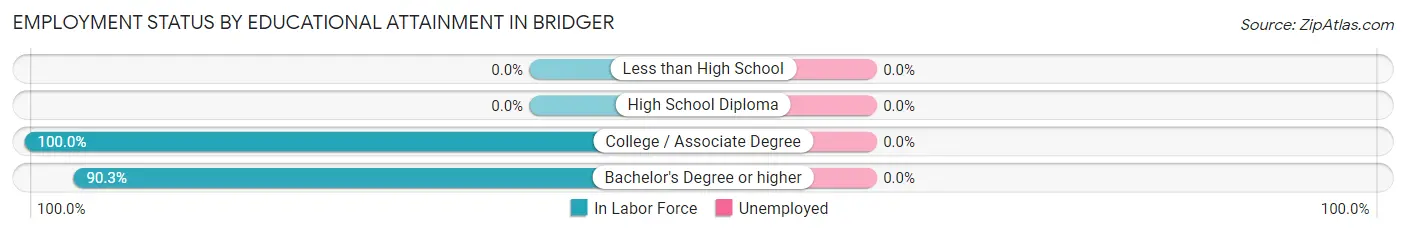
| Educational Attainment | In Labor Force | Unemployed |
| Less than High School | 0 (0.0%) | 0 (0.0%) |
| High School Diploma | 0 (0.0%) | 0 (0.0%) |
| College / Associate Degree | 37 (100.0%) | 0 (0.0%) |
| Bachelor's Degree or higher | 65 (90.3%) | 0 (0.0%) |
| Total | 102 (93.6%) | 0 (0.0%) |
Employment Occupations by Sex in Bridger
Management, Business, Science and Arts Occupations
The most common Management, Business, Science and Arts occupations in Bridger are Management (36 | 33.3%), Business & Financial (19 | 17.6%), Computers, Engineering & Science (19 | 17.6%), Computers & Mathematics (19 | 17.6%), and Community & Social Service (3 | 2.8%).
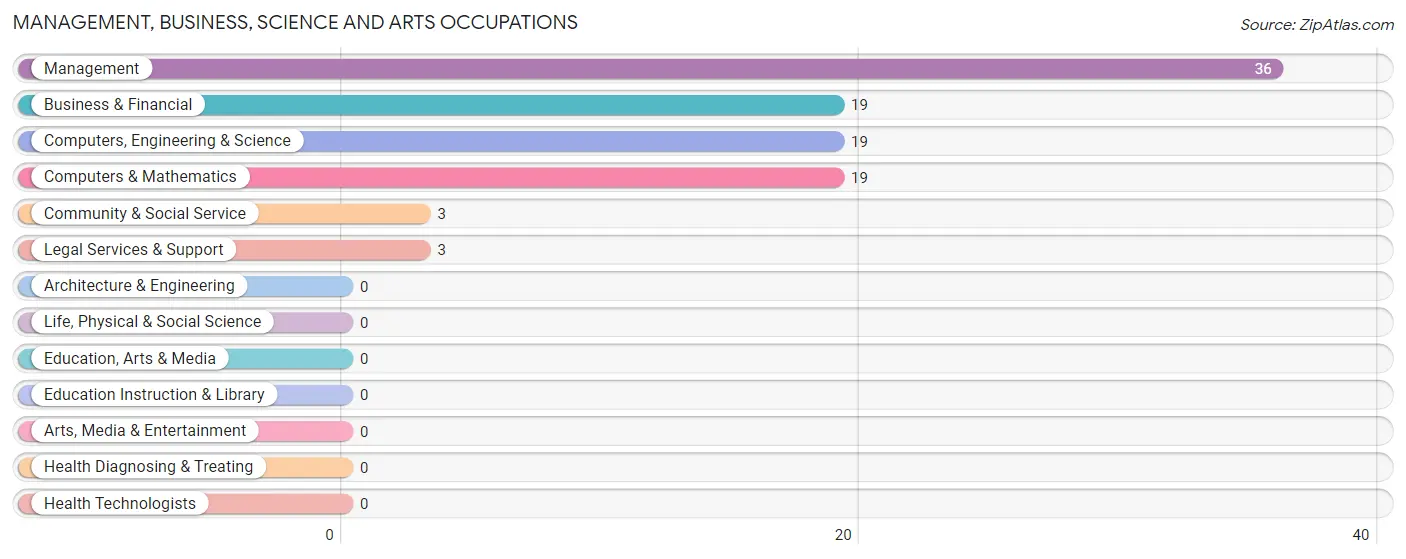
Management, Business, Science and Arts Occupations by Sex
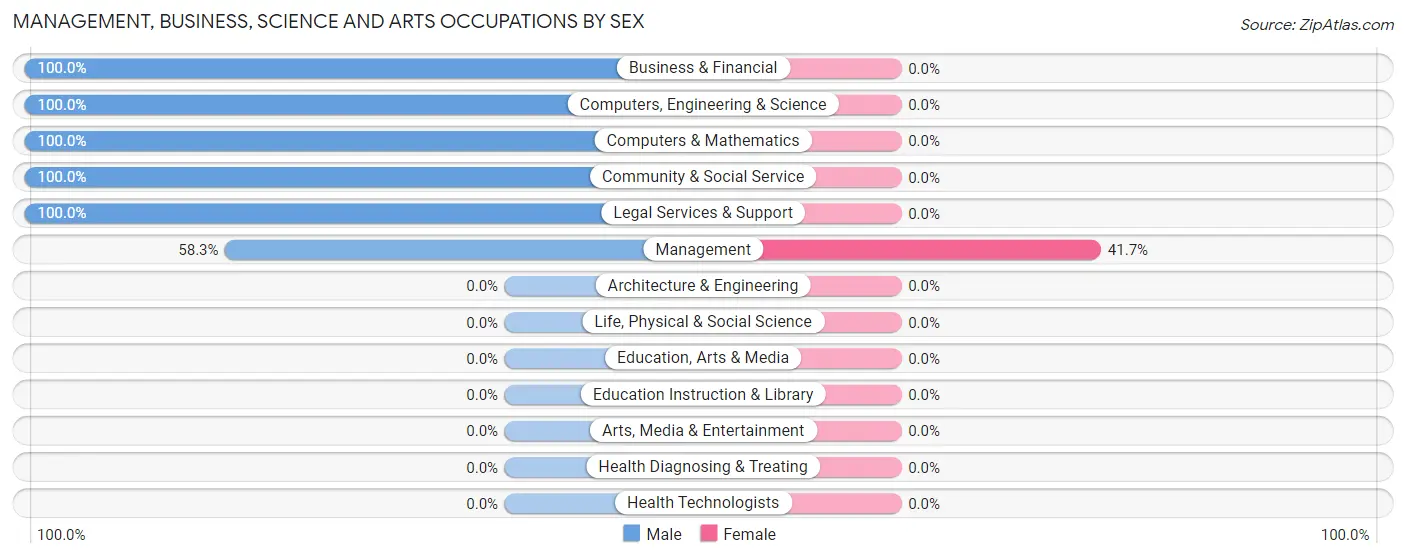
| Occupation | Male | Female |
| Management | 21 (58.3%) | 15 (41.7%) |
| Business & Financial | 19 (100.0%) | 0 (0.0%) |
| Computers, Engineering & Science | 19 (100.0%) | 0 (0.0%) |
| Computers & Mathematics | 19 (100.0%) | 0 (0.0%) |
| Architecture & Engineering | 0 (0.0%) | 0 (0.0%) |
| Life, Physical & Social Science | 0 (0.0%) | 0 (0.0%) |
| Community & Social Service | 3 (100.0%) | 0 (0.0%) |
| Education, Arts & Media | 0 (0.0%) | 0 (0.0%) |
| Legal Services & Support | 3 (100.0%) | 0 (0.0%) |
| Education Instruction & Library | 0 (0.0%) | 0 (0.0%) |
| Arts, Media & Entertainment | 0 (0.0%) | 0 (0.0%) |
| Health Diagnosing & Treating | 0 (0.0%) | 0 (0.0%) |
| Health Technologists | 0 (0.0%) | 0 (0.0%) |
| Total (Category) | 62 (80.5%) | 15 (19.5%) |
| Total (Overall) | 71 (65.7%) | 37 (34.3%) |
Services Occupations
Services Occupations by Sex
| Occupation | Male | Female |
| Healthcare Support | 0 (0.0%) | 0 (0.0%) |
| Security & Protection | 0 (0.0%) | 0 (0.0%) |
| Firefighting & Prevention | 0 (0.0%) | 0 (0.0%) |
| Law Enforcement | 0 (0.0%) | 0 (0.0%) |
| Food Preparation & Serving | 0 (0.0%) | 0 (0.0%) |
| Cleaning & Maintenance | 0 (0.0%) | 0 (0.0%) |
| Personal Care & Service | 0 (0.0%) | 0 (0.0%) |
| Total (Category) | 0 (0.0%) | 0 (0.0%) |
| Total (Overall) | 71 (65.7%) | 37 (34.3%) |
Sales and Office Occupations
The most common Sales and Office occupations in Bridger are , and Office & Administration (22 | 20.4%).
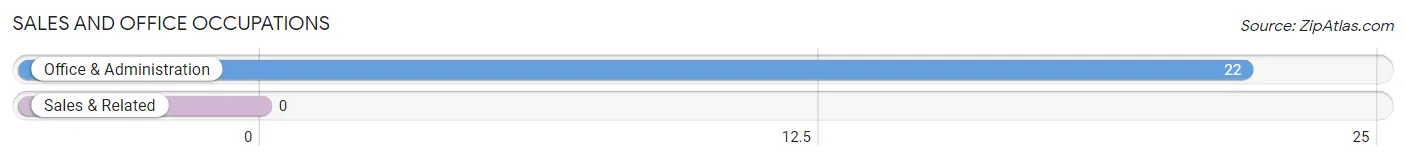
Sales and Office Occupations by Sex
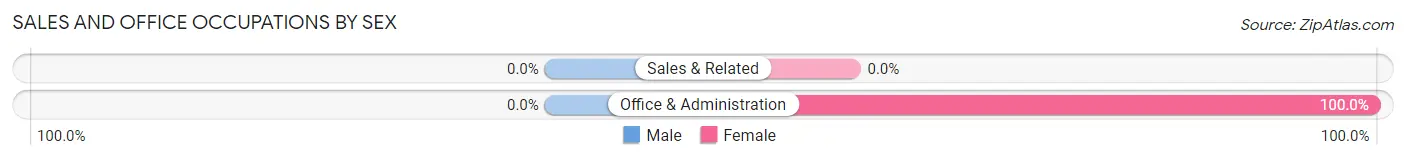
| Occupation | Male | Female |
| Sales & Related | 0 (0.0%) | 0 (0.0%) |
| Office & Administration | 0 (0.0%) | 22 (100.0%) |
| Total (Category) | 0 (0.0%) | 22 (100.0%) |
| Total (Overall) | 71 (65.7%) | 37 (34.3%) |
Natural Resources, Construction and Maintenance Occupations
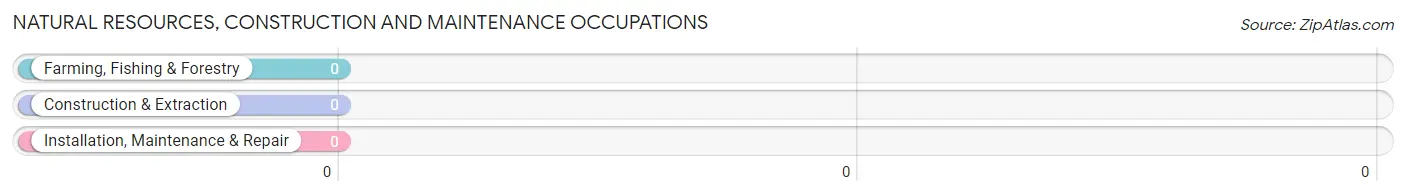
Natural Resources, Construction and Maintenance Occupations by Sex
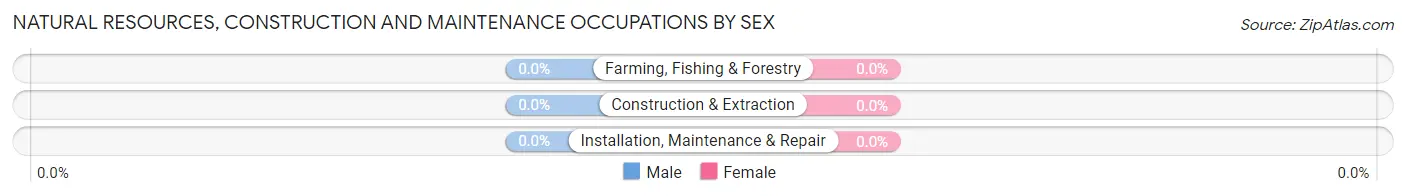
| Occupation | Male | Female |
| Farming, Fishing & Forestry | 0 (0.0%) | 0 (0.0%) |
| Construction & Extraction | 0 (0.0%) | 0 (0.0%) |
| Installation, Maintenance & Repair | 0 (0.0%) | 0 (0.0%) |
| Total (Category) | 0 (0.0%) | 0 (0.0%) |
| Total (Overall) | 71 (65.7%) | 37 (34.3%) |
Production, Transportation and Moving Occupations
The most common Production, Transportation and Moving occupations in Bridger are , and Transportation (9 | 8.3%).
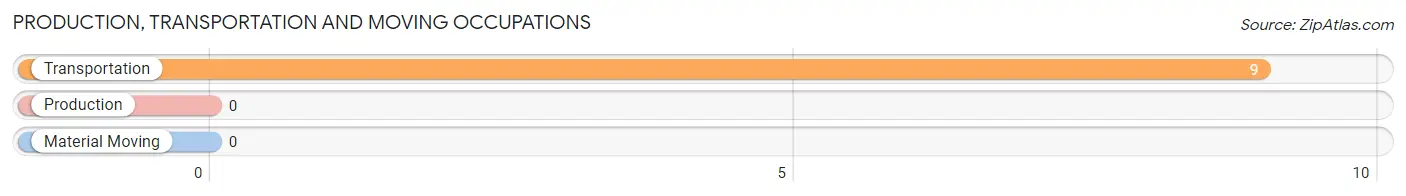
Production, Transportation and Moving Occupations by Sex
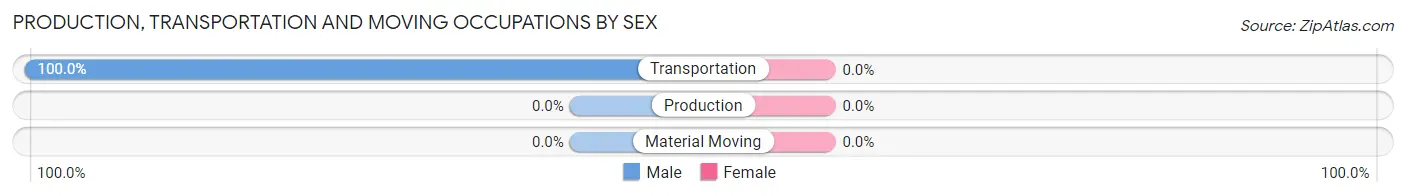
| Occupation | Male | Female |
| Production | 0 (0.0%) | 0 (0.0%) |
| Transportation | 9 (100.0%) | 0 (0.0%) |
| Material Moving | 0 (0.0%) | 0 (0.0%) |
| Total (Category) | 9 (100.0%) | 0 (0.0%) |
| Total (Overall) | 71 (65.7%) | 37 (34.3%) |
Employment Industries by Sex in Bridger
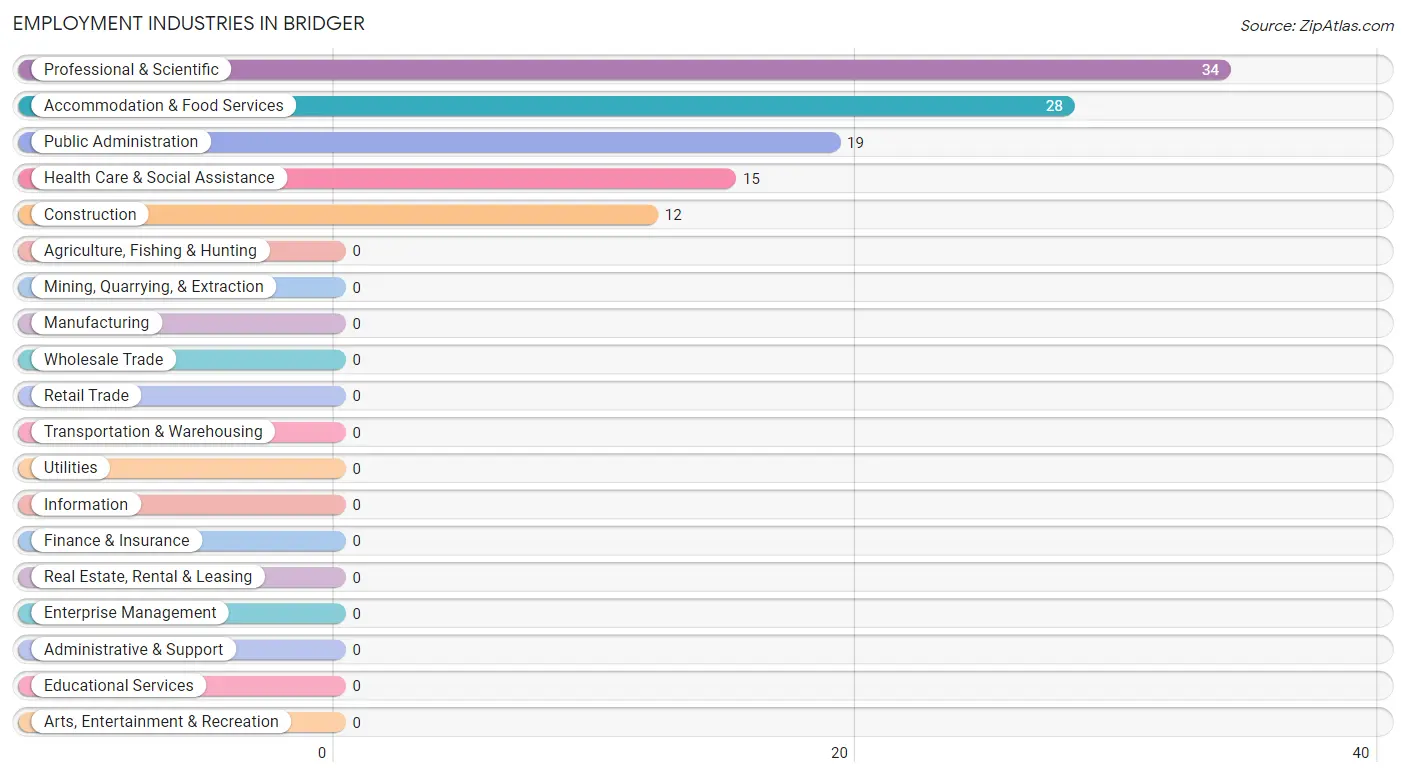
Employment Industries in Bridger
The major employment industries in Bridger include Professional & Scientific (34 | 31.5%), Accommodation & Food Services (28 | 25.9%), Public Administration (19 | 17.6%), Health Care & Social Assistance (15 | 13.9%), and Construction (12 | 11.1%).
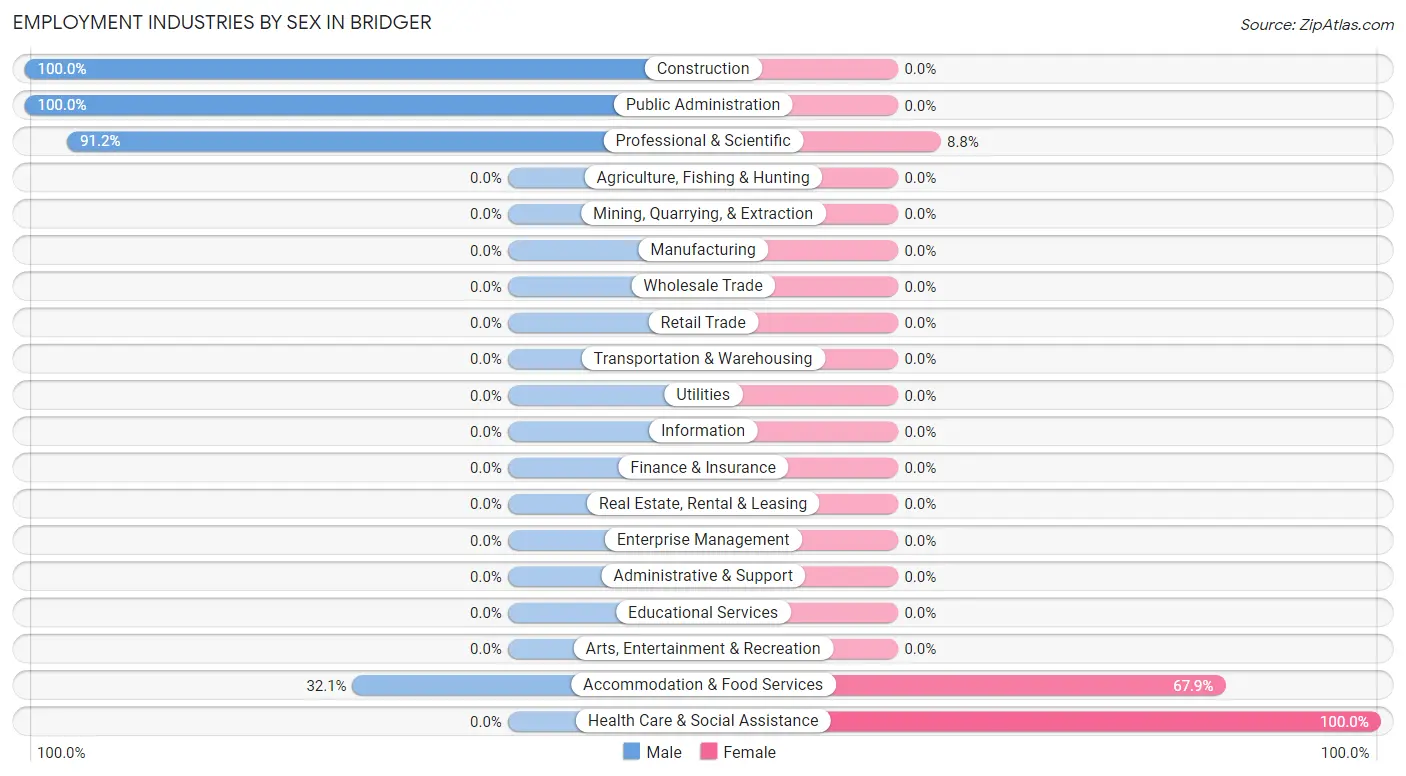
Employment Industries by Sex in Bridger
The Bridger industries that see more men than women are Construction (100.0%), Public Administration (100.0%), and Professional & Scientific (91.2%), whereas the industries that tend to have a higher number of women are Health Care & Social Assistance (100.0%), Accommodation & Food Services (67.9%), and Professional & Scientific (8.8%).
| Industry | Male | Female |
| Agriculture, Fishing & Hunting | 0 (0.0%) | 0 (0.0%) |
| Mining, Quarrying, & Extraction | 0 (0.0%) | 0 (0.0%) |
| Construction | 12 (100.0%) | 0 (0.0%) |
| Manufacturing | 0 (0.0%) | 0 (0.0%) |
| Wholesale Trade | 0 (0.0%) | 0 (0.0%) |
| Retail Trade | 0 (0.0%) | 0 (0.0%) |
| Transportation & Warehousing | 0 (0.0%) | 0 (0.0%) |
| Utilities | 0 (0.0%) | 0 (0.0%) |
| Information | 0 (0.0%) | 0 (0.0%) |
| Finance & Insurance | 0 (0.0%) | 0 (0.0%) |
| Real Estate, Rental & Leasing | 0 (0.0%) | 0 (0.0%) |
| Professional & Scientific | 31 (91.2%) | 3 (8.8%) |
| Enterprise Management | 0 (0.0%) | 0 (0.0%) |
| Administrative & Support | 0 (0.0%) | 0 (0.0%) |
| Educational Services | 0 (0.0%) | 0 (0.0%) |
| Health Care & Social Assistance | 0 (0.0%) | 15 (100.0%) |
| Arts, Entertainment & Recreation | 0 (0.0%) | 0 (0.0%) |
| Accommodation & Food Services | 9 (32.1%) | 19 (67.9%) |
| Public Administration | 19 (100.0%) | 0 (0.0%) |
| Total | 71 (65.7%) | 37 (34.3%) |
Education in Bridger
School Enrollment in Bridger
The most common levels of schooling among the 30 students in Bridger are elementary school (20 | 66.7%), and nursery / preschool (10 | 33.3%).
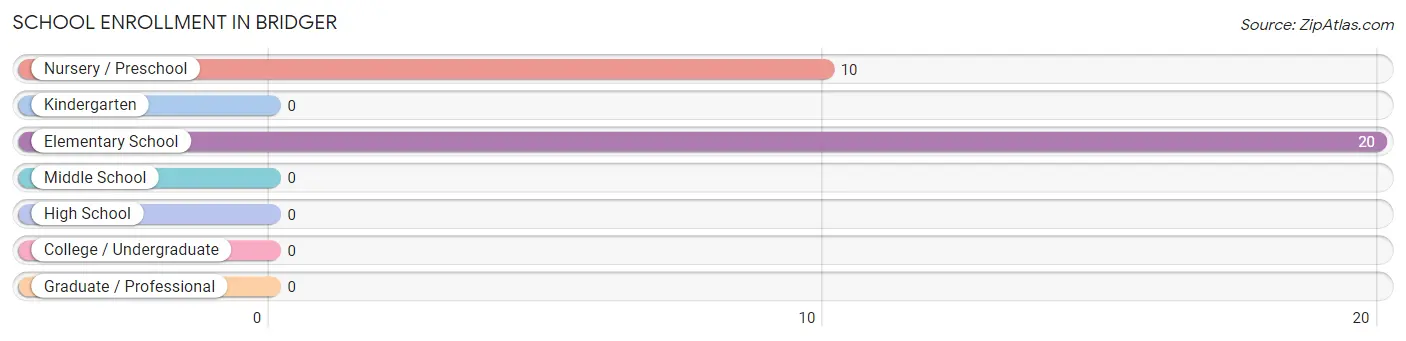
| School Level | # Students | % Students |
| Nursery / Preschool | 10 | 33.3% |
| Kindergarten | 0 | 0.0% |
| Elementary School | 20 | 66.7% |
| Middle School | 0 | 0.0% |
| High School | 0 | 0.0% |
| College / Undergraduate | 0 | 0.0% |
| Graduate / Professional | 0 | 0.0% |
| Total | 30 | 100.0% |
School Enrollment by Age by Funding Source in Bridger
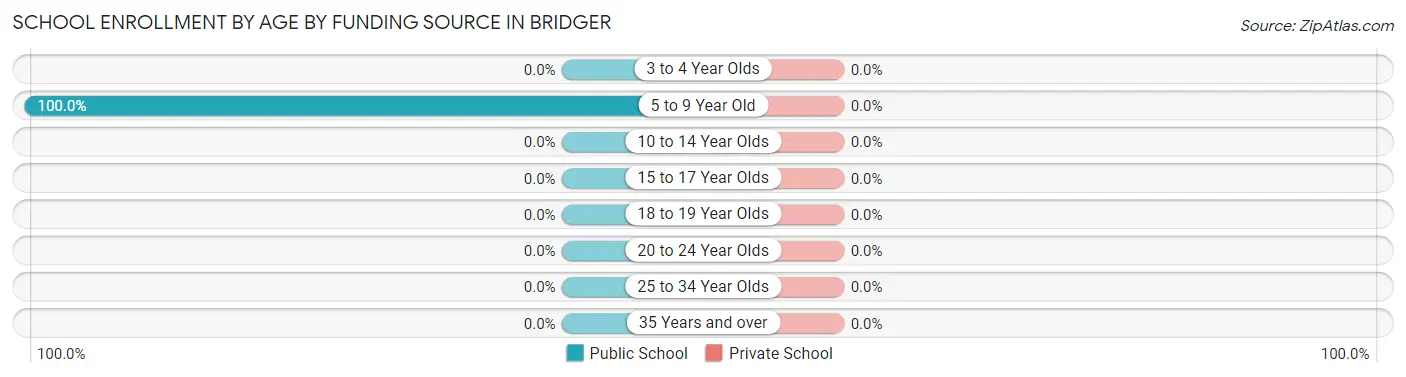
| Age Bracket | Public School | Private School |
| 3 to 4 Year Olds | 0 (0.0%) | 0 (0.0%) |
| 5 to 9 Year Old | 30 (100.0%) | 0 (0.0%) |
| 10 to 14 Year Olds | 0 (0.0%) | 0 (0.0%) |
| 15 to 17 Year Olds | 0 (0.0%) | 0 (0.0%) |
| 18 to 19 Year Olds | 0 (0.0%) | 0 (0.0%) |
| 20 to 24 Year Olds | 0 (0.0%) | 0 (0.0%) |
| 25 to 34 Year Olds | 0 (0.0%) | 0 (0.0%) |
| 35 Years and over | 0 (0.0%) | 0 (0.0%) |
| Total | 30 (100.0%) | 0 (0.0%) |
Educational Attainment by Field of Study in Bridger
Social sciences (37 | 27.8%), physical & health sciences (25 | 18.8%), bio, nature & agricultural (19 | 14.3%), liberal arts & history (19 | 14.3%), and business (12 | 9.0%) are the most common fields of study among 133 individuals in Bridger who have obtained a bachelor's degree or higher.
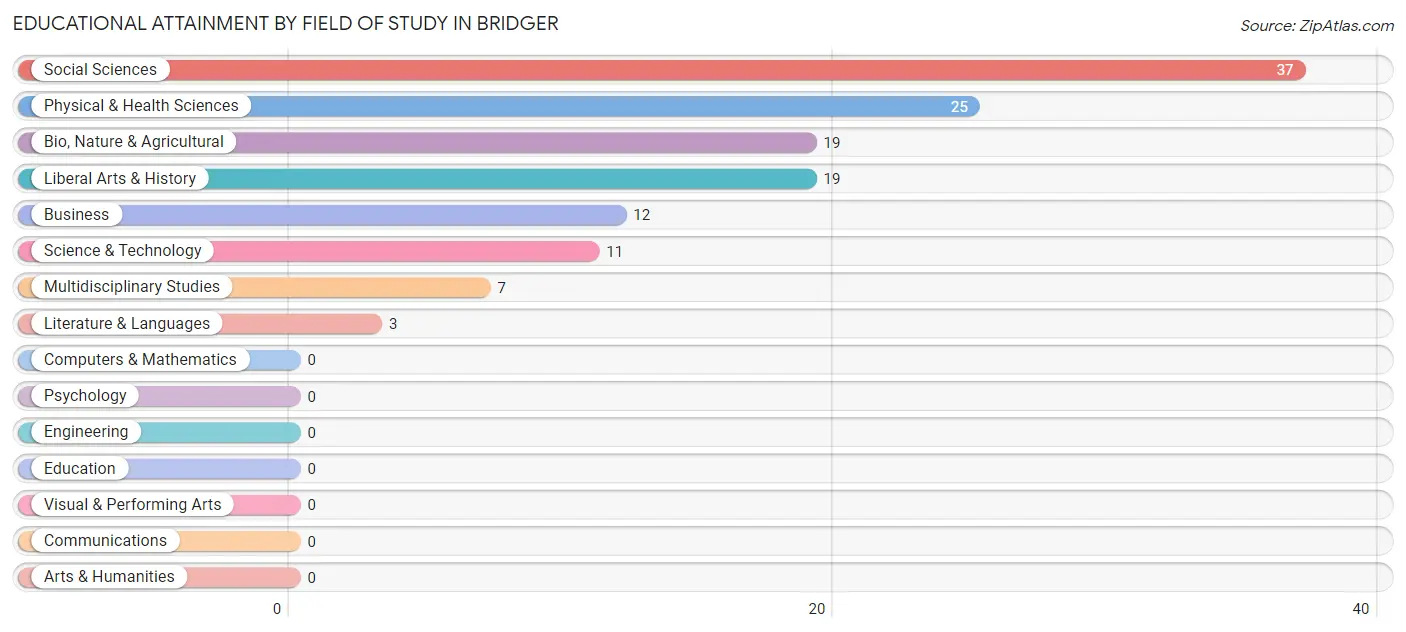
| Field of Study | # Graduates | % Graduates |
| Computers & Mathematics | 0 | 0.0% |
| Bio, Nature & Agricultural | 19 | 14.3% |
| Physical & Health Sciences | 25 | 18.8% |
| Psychology | 0 | 0.0% |
| Social Sciences | 37 | 27.8% |
| Engineering | 0 | 0.0% |
| Multidisciplinary Studies | 7 | 5.3% |
| Science & Technology | 11 | 8.3% |
| Business | 12 | 9.0% |
| Education | 0 | 0.0% |
| Literature & Languages | 3 | 2.3% |
| Liberal Arts & History | 19 | 14.3% |
| Visual & Performing Arts | 0 | 0.0% |
| Communications | 0 | 0.0% |
| Arts & Humanities | 0 | 0.0% |
| Total | 133 | 100.0% |
Transportation & Commute in Bridger
Vehicle Availability by Sex in Bridger
The most prevalent vehicle ownership categories in Bridger are males with 2 vehicles (59, accounting for 83.1%) and females with 2 vehicles (18, making up 159.5%).
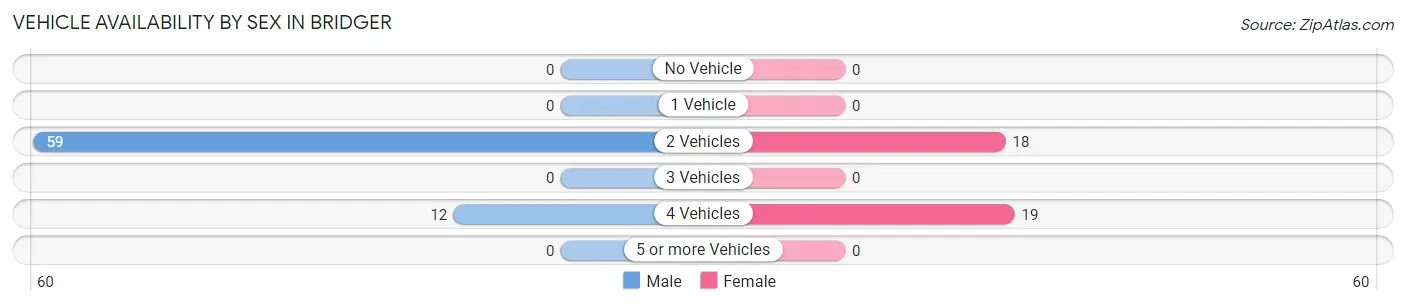
| Vehicles Available | Male | Female |
| No Vehicle | 0 (0.0%) | 0 (0.0%) |
| 1 Vehicle | 0 (0.0%) | 0 (0.0%) |
| 2 Vehicles | 59 (83.1%) | 18 (48.6%) |
| 3 Vehicles | 0 (0.0%) | 0 (0.0%) |
| 4 Vehicles | 12 (16.9%) | 19 (51.3%) |
| 5 or more Vehicles | 0 (0.0%) | 0 (0.0%) |
| Total | 71 (100.0%) | 37 (100.0%) |
Commute Time in Bridger
The most frequently occuring commute durations in Bridger are 40 to 44 minutes (38 commuters, 49.3%), 25 to 29 minutes (18 commuters, 23.4%), and 30 to 34 minutes (12 commuters, 15.6%).
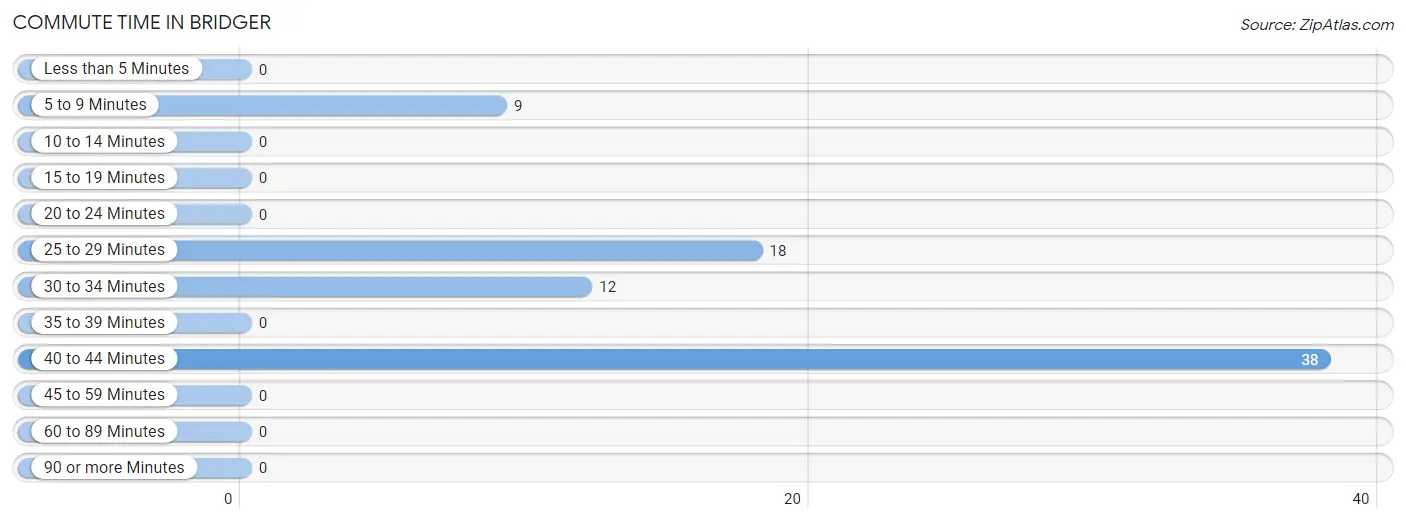
| Commute Time | # Commuters | % Commuters |
| Less than 5 Minutes | 0 | 0.0% |
| 5 to 9 Minutes | 9 | 11.7% |
| 10 to 14 Minutes | 0 | 0.0% |
| 15 to 19 Minutes | 0 | 0.0% |
| 20 to 24 Minutes | 0 | 0.0% |
| 25 to 29 Minutes | 18 | 23.4% |
| 30 to 34 Minutes | 12 | 15.6% |
| 35 to 39 Minutes | 0 | 0.0% |
| 40 to 44 Minutes | 38 | 49.3% |
| 45 to 59 Minutes | 0 | 0.0% |
| 60 to 89 Minutes | 0 | 0.0% |
| 90 or more Minutes | 0 | 0.0% |
Commute Time by Sex in Bridger
The most common commute times in Bridger are 40 to 44 minutes (38 commuters, 64.4%) for males and 25 to 29 minutes (18 commuters, 100.0%) for females.
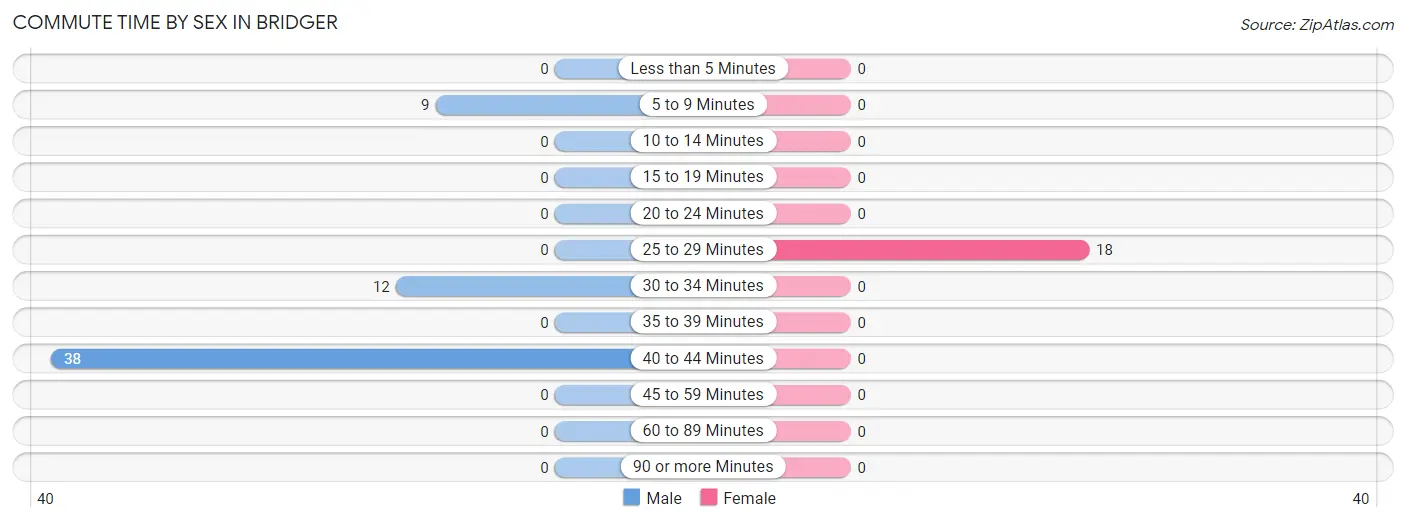
| Commute Time | Male | Female |
| Less than 5 Minutes | 0 (0.0%) | 0 (0.0%) |
| 5 to 9 Minutes | 9 (15.2%) | 0 (0.0%) |
| 10 to 14 Minutes | 0 (0.0%) | 0 (0.0%) |
| 15 to 19 Minutes | 0 (0.0%) | 0 (0.0%) |
| 20 to 24 Minutes | 0 (0.0%) | 0 (0.0%) |
| 25 to 29 Minutes | 0 (0.0%) | 18 (100.0%) |
| 30 to 34 Minutes | 12 (20.3%) | 0 (0.0%) |
| 35 to 39 Minutes | 0 (0.0%) | 0 (0.0%) |
| 40 to 44 Minutes | 38 (64.4%) | 0 (0.0%) |
| 45 to 59 Minutes | 0 (0.0%) | 0 (0.0%) |
| 60 to 89 Minutes | 0 (0.0%) | 0 (0.0%) |
| 90 or more Minutes | 0 (0.0%) | 0 (0.0%) |
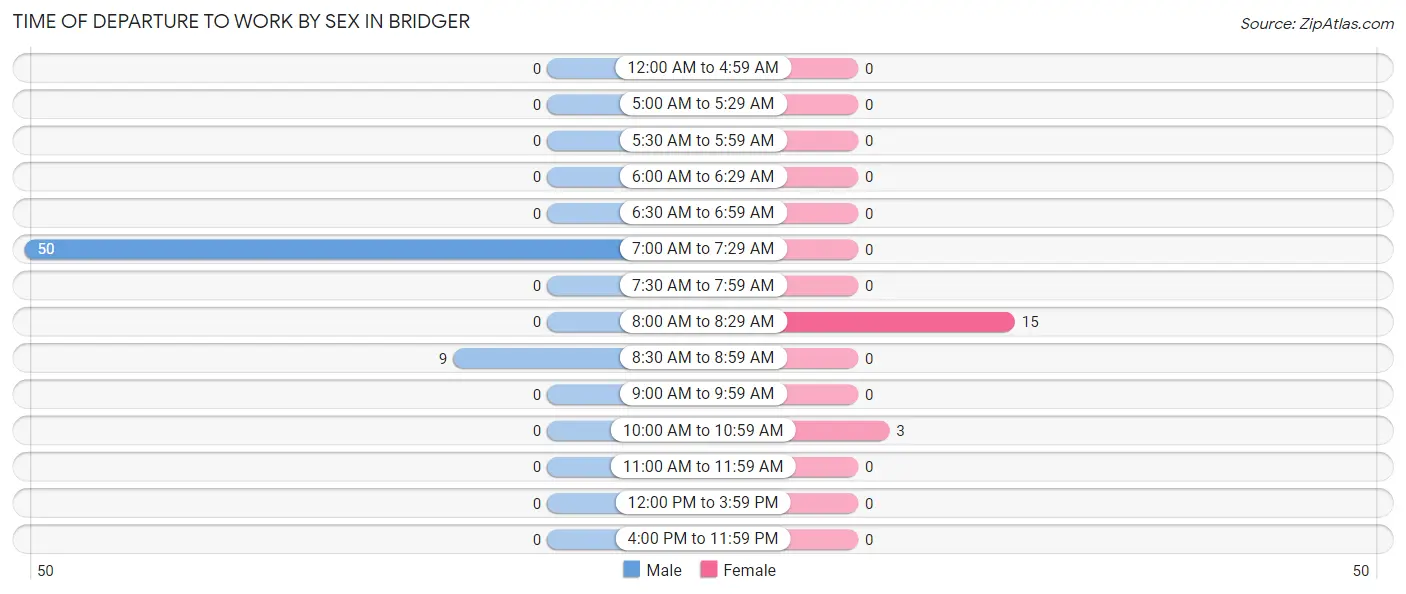
Time of Departure to Work by Sex in Bridger
The most frequent times of departure to work in Bridger are 7:00 AM to 7:29 AM (50, 84.8%) for males and 8:00 AM to 8:29 AM (15, 83.3%) for females.
| Time of Departure | Male | Female |
| 12:00 AM to 4:59 AM | 0 (0.0%) | 0 (0.0%) |
| 5:00 AM to 5:29 AM | 0 (0.0%) | 0 (0.0%) |
| 5:30 AM to 5:59 AM | 0 (0.0%) | 0 (0.0%) |
| 6:00 AM to 6:29 AM | 0 (0.0%) | 0 (0.0%) |
| 6:30 AM to 6:59 AM | 0 (0.0%) | 0 (0.0%) |
| 7:00 AM to 7:29 AM | 50 (84.8%) | 0 (0.0%) |
| 7:30 AM to 7:59 AM | 0 (0.0%) | 0 (0.0%) |
| 8:00 AM to 8:29 AM | 0 (0.0%) | 15 (83.3%) |
| 8:30 AM to 8:59 AM | 9 (15.2%) | 0 (0.0%) |
| 9:00 AM to 9:59 AM | 0 (0.0%) | 0 (0.0%) |
| 10:00 AM to 10:59 AM | 0 (0.0%) | 3 (16.7%) |
| 11:00 AM to 11:59 AM | 0 (0.0%) | 0 (0.0%) |
| 12:00 PM to 3:59 PM | 0 (0.0%) | 0 (0.0%) |
| 4:00 PM to 11:59 PM | 0 (0.0%) | 0 (0.0%) |
| Total | 59 (100.0%) | 18 (100.0%) |
Housing Occupancy in Bridger
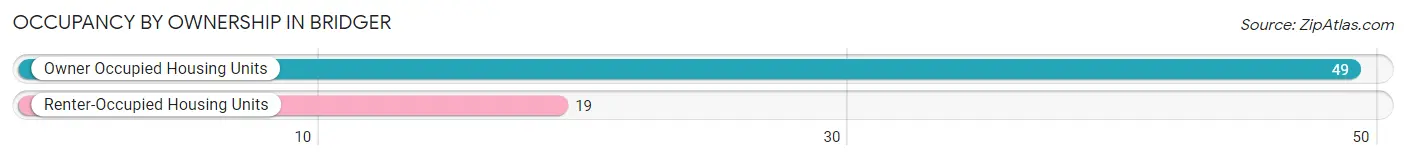
Occupancy by Ownership in Bridger
Of the total 68 dwellings in Bridger, owner-occupied units account for 49 (72.1%), while renter-occupied units make up 19 (27.9%).
| Occupancy | # Housing Units | % Housing Units |
| Owner Occupied Housing Units | 49 | 72.1% |
| Renter-Occupied Housing Units | 19 | 27.9% |
| Total Occupied Housing Units | 68 | 100.0% |
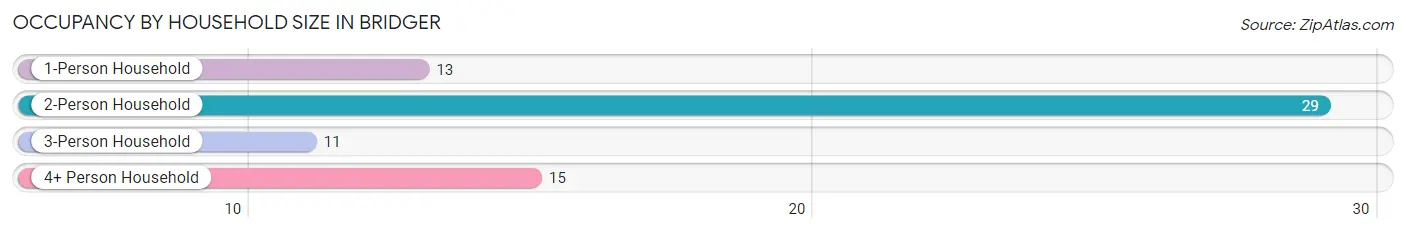
Occupancy by Household Size in Bridger
| Household Size | # Housing Units | % Housing Units |
| 1-Person Household | 13 | 19.1% |
| 2-Person Household | 29 | 42.6% |
| 3-Person Household | 11 | 16.2% |
| 4+ Person Household | 15 | 22.1% |
| Total Housing Units | 68 | 100.0% |
Occupancy by Ownership by Household Size in Bridger
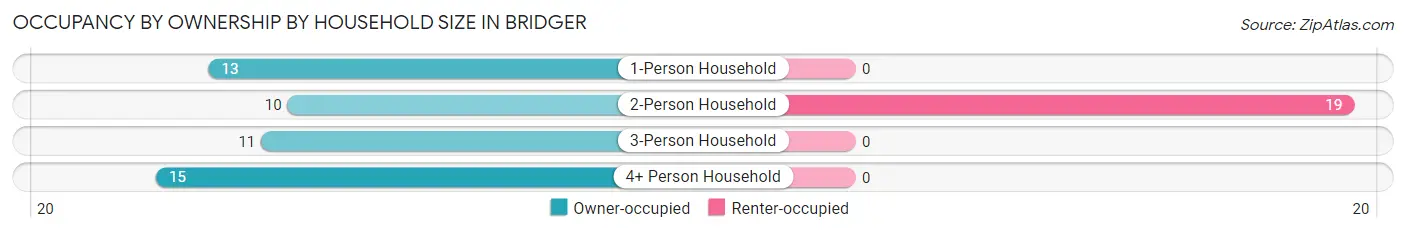
| Household Size | Owner-occupied | Renter-occupied |
| 1-Person Household | 13 (100.0%) | 0 (0.0%) |
| 2-Person Household | 10 (34.5%) | 19 (65.5%) |
| 3-Person Household | 11 (100.0%) | 0 (0.0%) |
| 4+ Person Household | 15 (100.0%) | 0 (0.0%) |
| Total Housing Units | 49 (72.1%) | 19 (27.9%) |
Occupancy by Educational Attainment in Bridger
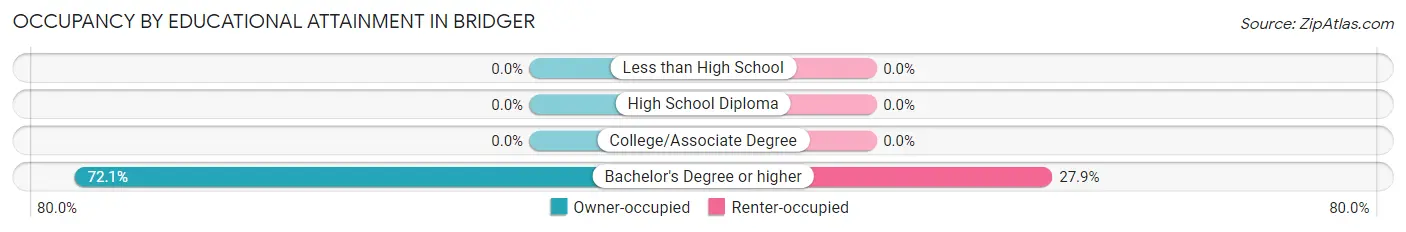
| Household Size | Owner-occupied | Renter-occupied |
| Less than High School | 0 (0.0%) | 0 (0.0%) |
| High School Diploma | 0 (0.0%) | 0 (0.0%) |
| College/Associate Degree | 0 (0.0%) | 0 (0.0%) |
| Bachelor's Degree or higher | 49 (72.1%) | 19 (27.9%) |
Occupancy by Age of Householder in Bridger
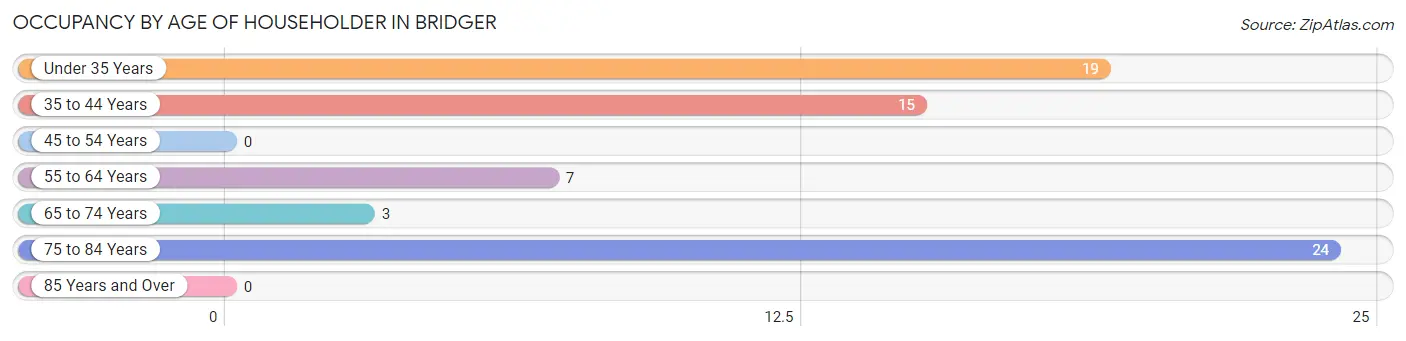
| Age Bracket | # Households | % Households |
| Under 35 Years | 19 | 27.9% |
| 35 to 44 Years | 15 | 22.1% |
| 45 to 54 Years | 0 | 0.0% |
| 55 to 64 Years | 7 | 10.3% |
| 65 to 74 Years | 3 | 4.4% |
| 75 to 84 Years | 24 | 35.3% |
| 85 Years and Over | 0 | 0.0% |
| Total | 68 | 100.0% |
Housing Finances in Bridger
Median Income by Occupancy in Bridger
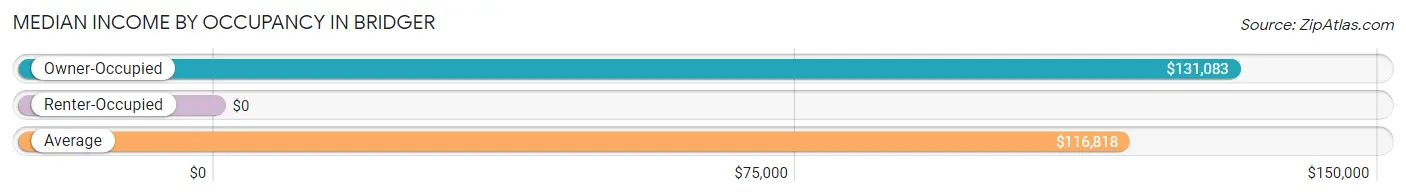
| Occupancy Type | # Households | Median Income |
| Owner-Occupied | 49 (72.1%) | $131,083 |
| Renter-Occupied | 19 (27.9%) | $0 |
| Average | 68 (100.0%) | $116,818 |
Occupancy by Householder Income Bracket in Bridger
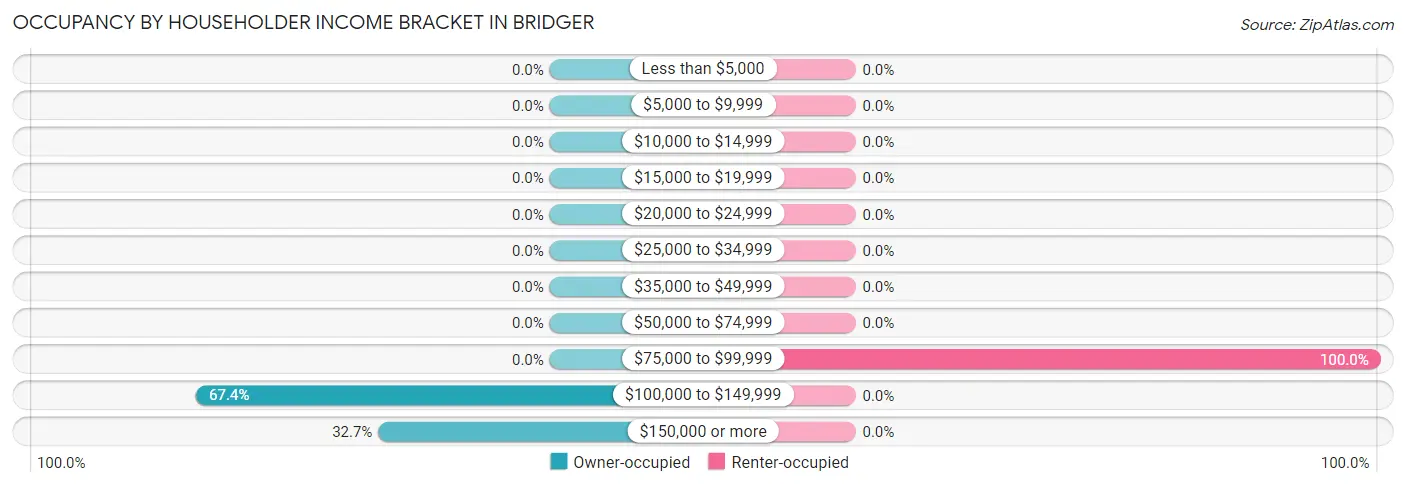
| Income Bracket | Owner-occupied | Renter-occupied |
| Less than $5,000 | 0 (0.0%) | 0 (0.0%) |
| $5,000 to $9,999 | 0 (0.0%) | 0 (0.0%) |
| $10,000 to $14,999 | 0 (0.0%) | 0 (0.0%) |
| $15,000 to $19,999 | 0 (0.0%) | 0 (0.0%) |
| $20,000 to $24,999 | 0 (0.0%) | 0 (0.0%) |
| $25,000 to $34,999 | 0 (0.0%) | 0 (0.0%) |
| $35,000 to $49,999 | 0 (0.0%) | 0 (0.0%) |
| $50,000 to $74,999 | 0 (0.0%) | 0 (0.0%) |
| $75,000 to $99,999 | 0 (0.0%) | 19 (100.0%) |
| $100,000 to $149,999 | 33 (67.3%) | 0 (0.0%) |
| $150,000 or more | 16 (32.7%) | 0 (0.0%) |
| Total | 49 (100.0%) | 19 (100.0%) |
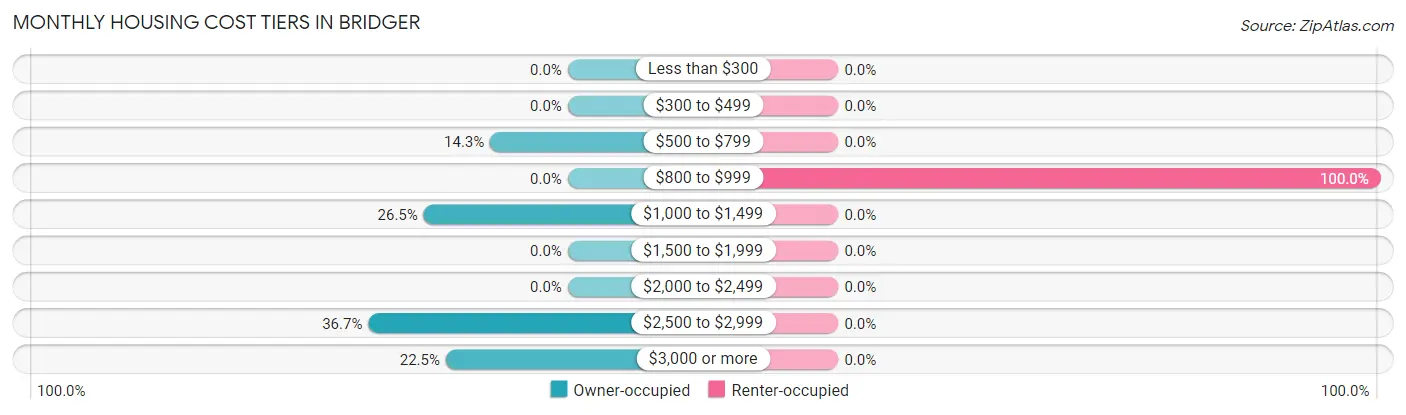
Monthly Housing Cost Tiers in Bridger
| Monthly Cost | Owner-occupied | Renter-occupied |
| Less than $300 | 0 (0.0%) | 0 (0.0%) |
| $300 to $499 | 0 (0.0%) | 0 (0.0%) |
| $500 to $799 | 7 (14.3%) | 0 (0.0%) |
| $800 to $999 | 0 (0.0%) | 19 (100.0%) |
| $1,000 to $1,499 | 13 (26.5%) | 0 (0.0%) |
| $1,500 to $1,999 | 0 (0.0%) | 0 (0.0%) |
| $2,000 to $2,499 | 0 (0.0%) | 0 (0.0%) |
| $2,500 to $2,999 | 18 (36.7%) | 0 (0.0%) |
| $3,000 or more | 11 (22.5%) | 0 (0.0%) |
| Total | 49 (100.0%) | 19 (100.0%) |
Physical Housing Characteristics in Bridger
Housing Structures in Bridger
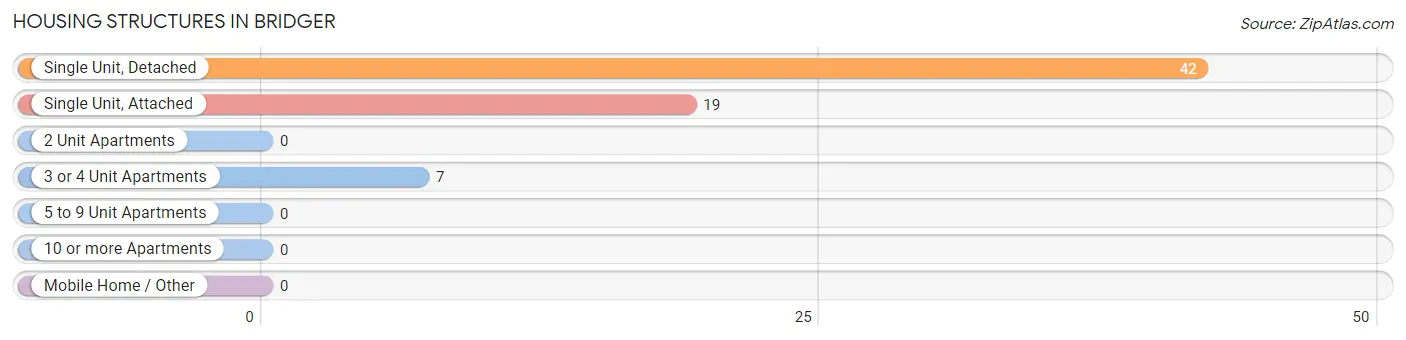
| Structure Type | # Housing Units | % Housing Units |
| Single Unit, Detached | 42 | 61.8% |
| Single Unit, Attached | 19 | 27.9% |
| 2 Unit Apartments | 0 | 0.0% |
| 3 or 4 Unit Apartments | 7 | 10.3% |
| 5 to 9 Unit Apartments | 0 | 0.0% |
| 10 or more Apartments | 0 | 0.0% |
| Mobile Home / Other | 0 | 0.0% |
| Total | 68 | 100.0% |
Housing Structures by Occupancy in Bridger
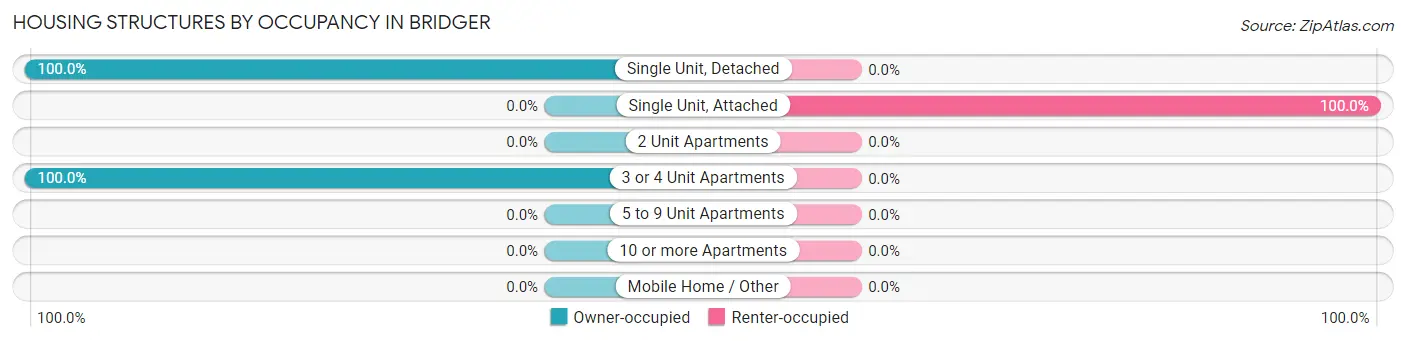
| Structure Type | Owner-occupied | Renter-occupied |
| Single Unit, Detached | 42 (100.0%) | 0 (0.0%) |
| Single Unit, Attached | 0 (0.0%) | 19 (100.0%) |
| 2 Unit Apartments | 0 (0.0%) | 0 (0.0%) |
| 3 or 4 Unit Apartments | 7 (100.0%) | 0 (0.0%) |
| 5 to 9 Unit Apartments | 0 (0.0%) | 0 (0.0%) |
| 10 or more Apartments | 0 (0.0%) | 0 (0.0%) |
| Mobile Home / Other | 0 (0.0%) | 0 (0.0%) |
| Total | 49 (72.1%) | 19 (27.9%) |
Housing Structures by Number of Rooms in Bridger
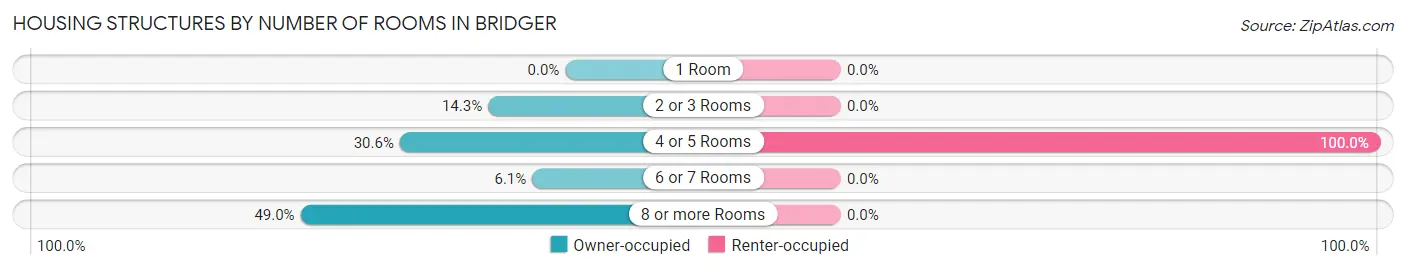
| Number of Rooms | Owner-occupied | Renter-occupied |
| 1 Room | 0 (0.0%) | 0 (0.0%) |
| 2 or 3 Rooms | 7 (14.3%) | 0 (0.0%) |
| 4 or 5 Rooms | 15 (30.6%) | 19 (100.0%) |
| 6 or 7 Rooms | 3 (6.1%) | 0 (0.0%) |
| 8 or more Rooms | 24 (49.0%) | 0 (0.0%) |
| Total | 49 (100.0%) | 19 (100.0%) |
Housing Structure by Heating Type in Bridger
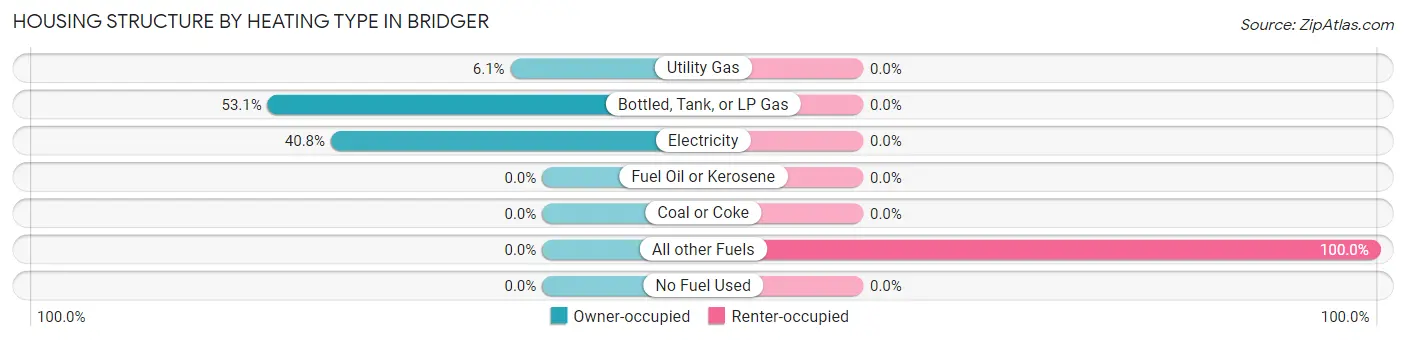
| Heating Type | Owner-occupied | Renter-occupied |
| Utility Gas | 3 (6.1%) | 0 (0.0%) |
| Bottled, Tank, or LP Gas | 26 (53.1%) | 0 (0.0%) |
| Electricity | 20 (40.8%) | 0 (0.0%) |
| Fuel Oil or Kerosene | 0 (0.0%) | 0 (0.0%) |
| Coal or Coke | 0 (0.0%) | 0 (0.0%) |
| All other Fuels | 0 (0.0%) | 19 (100.0%) |
| No Fuel Used | 0 (0.0%) | 0 (0.0%) |
| Total | 49 (100.0%) | 19 (100.0%) |
Household Vehicle Usage in Bridger
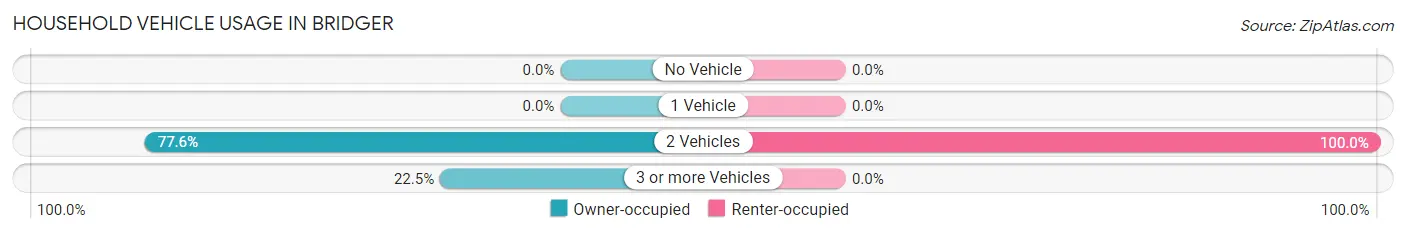
| Vehicles per Household | Owner-occupied | Renter-occupied |
| No Vehicle | 0 (0.0%) | 0 (0.0%) |
| 1 Vehicle | 0 (0.0%) | 0 (0.0%) |
| 2 Vehicles | 38 (77.5%) | 19 (100.0%) |
| 3 or more Vehicles | 11 (22.5%) | 0 (0.0%) |
| Total | 49 (100.0%) | 19 (100.0%) |
Real Estate & Mortgages in Bridger
Real Estate and Mortgage Overview in Bridger
| Characteristic | Without Mortgage | With Mortgage |
| Housing Units | 99 | 26 |
| Median Property Value | $275,000 | $0 |
| Median Household Income | $24,755 | $0 |
| Monthly Housing Costs | $373 | $11 |
| Real Estate Taxes | $2,067 | $0 |
Property Value by Mortgage Status in Bridger
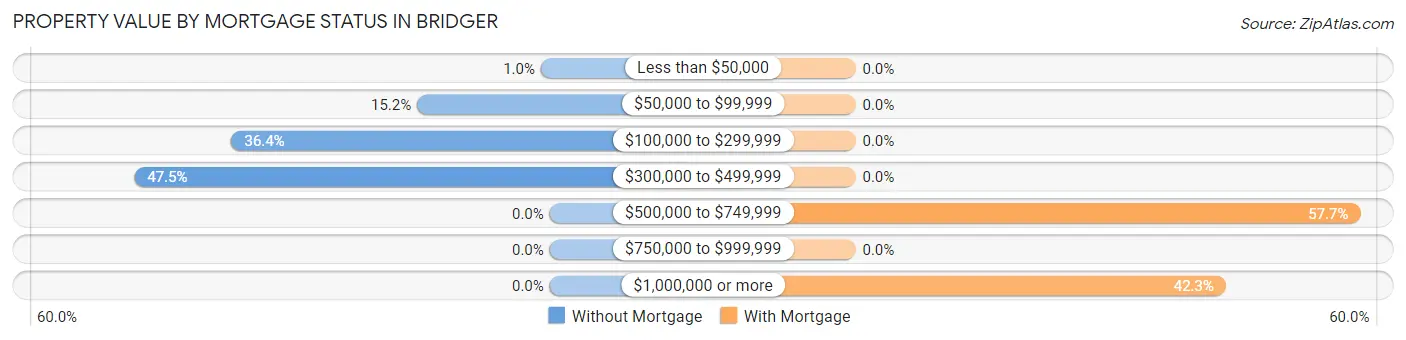
| Property Value | Without Mortgage | With Mortgage |
| Less than $50,000 | 1 (1.0%) | 0 (0.0%) |
| $50,000 to $99,999 | 15 (15.1%) | 0 (0.0%) |
| $100,000 to $299,999 | 36 (36.4%) | 0 (0.0%) |
| $300,000 to $499,999 | 47 (47.5%) | 0 (0.0%) |
| $500,000 to $749,999 | 0 (0.0%) | 15 (57.7%) |
| $750,000 to $999,999 | 0 (0.0%) | 0 (0.0%) |
| $1,000,000 or more | 0 (0.0%) | 11 (42.3%) |
| Total | 99 (100.0%) | 26 (100.0%) |
Household Income by Mortgage Status in Bridger
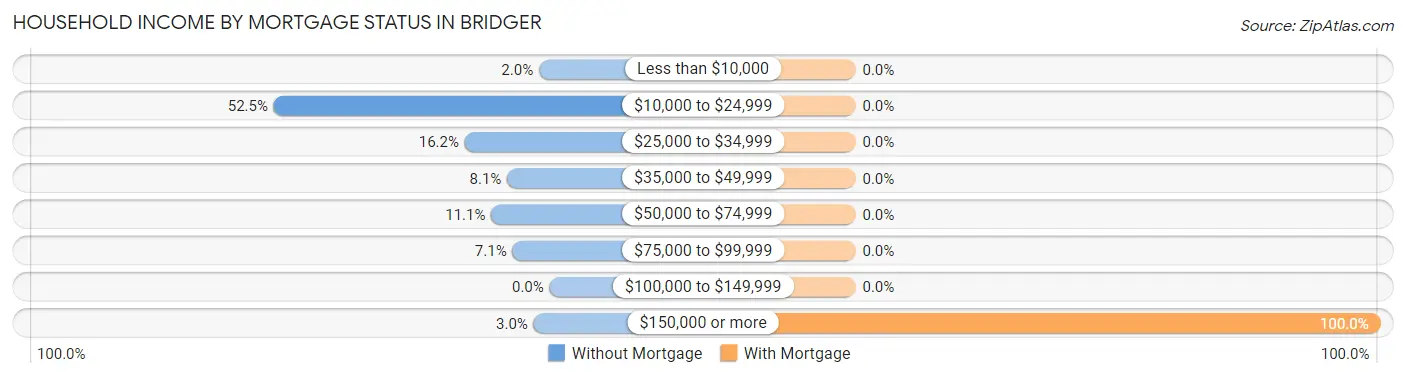
| Household Income | Without Mortgage | With Mortgage |
| Less than $10,000 | 2 (2.0%) | 0 (0.0%) |
| $10,000 to $24,999 | 52 (52.5%) | 0 (0.0%) |
| $25,000 to $34,999 | 16 (16.2%) | 0 (0.0%) |
| $35,000 to $49,999 | 8 (8.1%) | 0 (0.0%) |
| $50,000 to $74,999 | 11 (11.1%) | 0 (0.0%) |
| $75,000 to $99,999 | 7 (7.1%) | 0 (0.0%) |
| $100,000 to $149,999 | 0 (0.0%) | 0 (0.0%) |
| $150,000 or more | 3 (3.0%) | 26 (100.0%) |
| Total | 99 (100.0%) | 26 (100.0%) |
Property Value to Household Income Ratio in Bridger
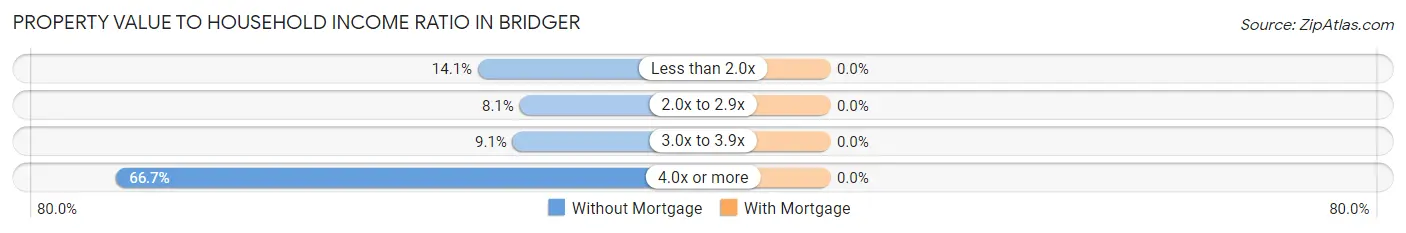
| Value-to-Income Ratio | Without Mortgage | With Mortgage |
| Less than 2.0x | 14 (14.1%) | 0 (0.0%) |
| 2.0x to 2.9x | 8 (8.1%) | 0 (0.0%) |
| 3.0x to 3.9x | 9 (9.1%) | 0 (0.0%) |
| 4.0x or more | 66 (66.7%) | 0 (0.0%) |
| Total | 99 (100.0%) | 26 (100.0%) |
Real Estate Taxes by Mortgage Status in Bridger
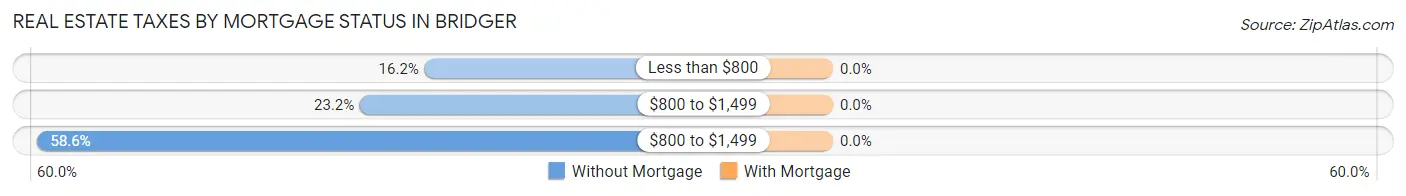
| Property Taxes | Without Mortgage | With Mortgage |
| Less than $800 | 16 (16.2%) | 0 (0.0%) |
| $800 to $1,499 | 23 (23.2%) | 0 (0.0%) |
| $800 to $1,499 | 58 (58.6%) | 0 (0.0%) |
| Total | 99 (100.0%) | 26 (100.0%) |
Health & Disability in Bridger
Health Insurance Coverage by Age in Bridger
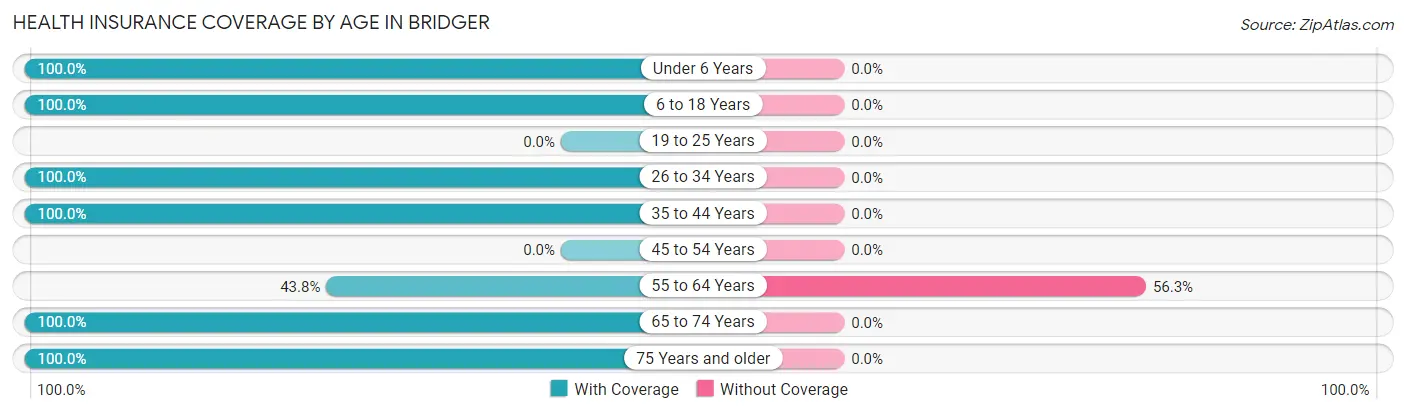
| Age Bracket | With Coverage | Without Coverage |
| Under 6 Years | 10 (100.0%) | 0 (0.0%) |
| 6 to 18 Years | 20 (100.0%) | 0 (0.0%) |
| 19 to 25 Years | 0 (0.0%) | 0 (0.0%) |
| 26 to 34 Years | 38 (100.0%) | 0 (0.0%) |
| 35 to 44 Years | 55 (100.0%) | 0 (0.0%) |
| 45 to 54 Years | 0 (0.0%) | 0 (0.0%) |
| 55 to 64 Years | 7 (43.8%) | 9 (56.2%) |
| 65 to 74 Years | 6 (100.0%) | 0 (0.0%) |
| 75 Years and older | 24 (100.0%) | 0 (0.0%) |
| Total | 160 (94.7%) | 9 (5.3%) |
Health Insurance Coverage by Citizenship Status in Bridger
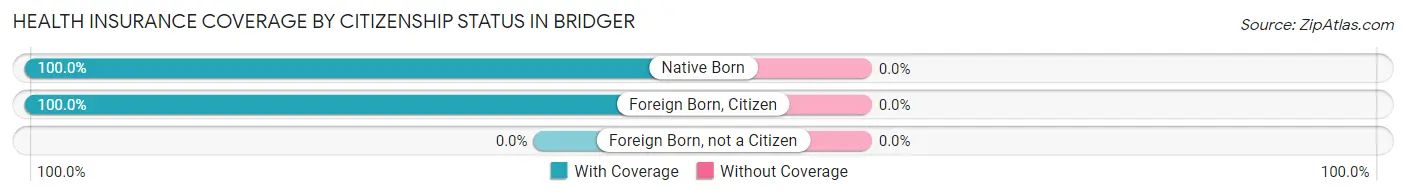
| Citizenship Status | With Coverage | Without Coverage |
| Native Born | 10 (100.0%) | 0 (0.0%) |
| Foreign Born, Citizen | 20 (100.0%) | 0 (0.0%) |
| Foreign Born, not a Citizen | 0 (0.0%) | 0 (0.0%) |
Health Insurance Coverage by Household Income in Bridger
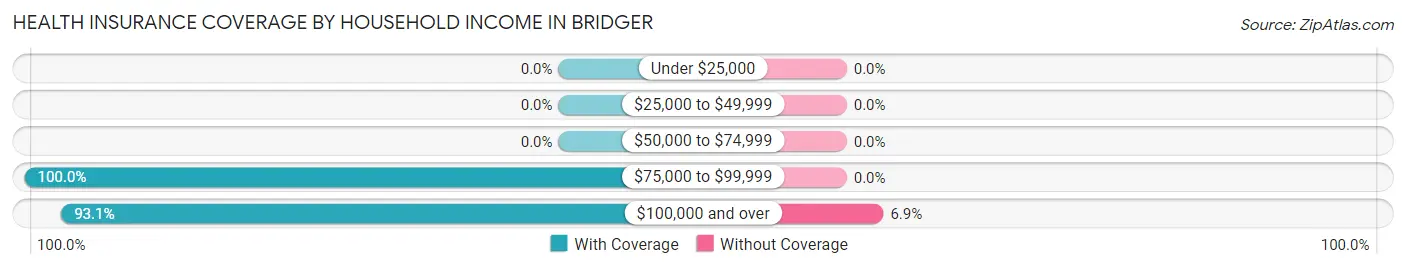
| Household Income | With Coverage | Without Coverage |
| Under $25,000 | 0 (0.0%) | 0 (0.0%) |
| $25,000 to $49,999 | 0 (0.0%) | 0 (0.0%) |
| $50,000 to $74,999 | 0 (0.0%) | 0 (0.0%) |
| $75,000 to $99,999 | 38 (100.0%) | 0 (0.0%) |
| $100,000 and over | 122 (93.1%) | 9 (6.9%) |
Public vs Private Health Insurance Coverage by Age in Bridger
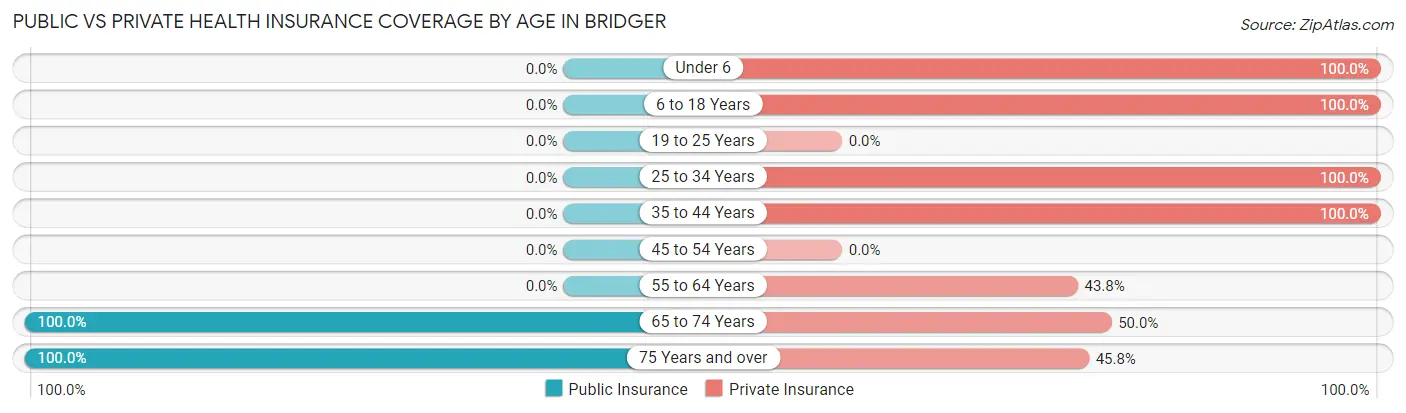
| Age Bracket | Public Insurance | Private Insurance |
| Under 6 | 0 (0.0%) | 10 (100.0%) |
| 6 to 18 Years | 0 (0.0%) | 20 (100.0%) |
| 19 to 25 Years | 0 (0.0%) | 0 (0.0%) |
| 25 to 34 Years | 0 (0.0%) | 38 (100.0%) |
| 35 to 44 Years | 0 (0.0%) | 55 (100.0%) |
| 45 to 54 Years | 0 (0.0%) | 0 (0.0%) |
| 55 to 64 Years | 0 (0.0%) | 7 (43.8%) |
| 65 to 74 Years | 6 (100.0%) | 3 (50.0%) |
| 75 Years and over | 24 (100.0%) | 11 (45.8%) |
| Total | 30 (17.7%) | 144 (85.2%) |
Disability Status by Sex by Age in Bridger
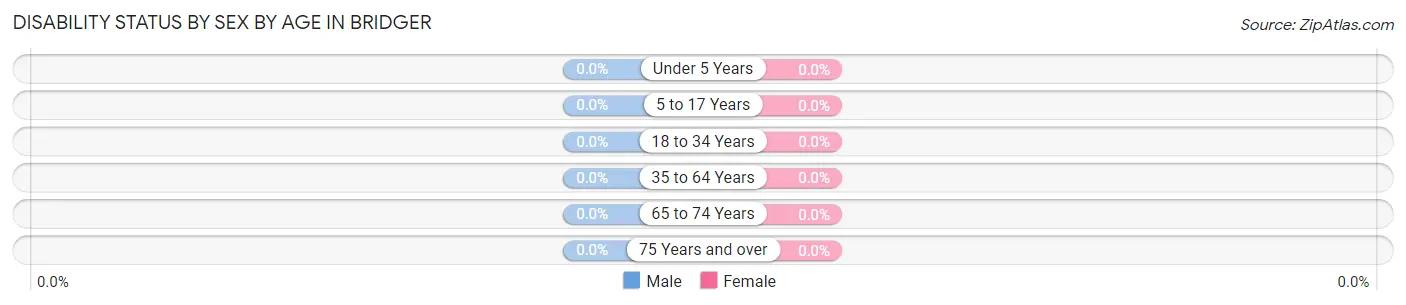
| Age Bracket | Male | Female |
| Under 5 Years | 0 (0.0%) | 0 (0.0%) |
| 5 to 17 Years | 0 (0.0%) | 0 (0.0%) |
| 18 to 34 Years | 0 (0.0%) | 0 (0.0%) |
| 35 to 64 Years | 0 (0.0%) | 0 (0.0%) |
| 65 to 74 Years | 0 (0.0%) | 0 (0.0%) |
| 75 Years and over | 0 (0.0%) | 0 (0.0%) |
Disability Class by Sex by Age in Bridger
Disability Class: Hearing Difficulty
| Age Bracket | Male | Female |
| Under 5 Years | 0 (0.0%) | 0 (0.0%) |
| 5 to 17 Years | 0 (0.0%) | 0 (0.0%) |
| 18 to 34 Years | 0 (0.0%) | 0 (0.0%) |
| 35 to 64 Years | 0 (0.0%) | 0 (0.0%) |
| 65 to 74 Years | 0 (0.0%) | 0 (0.0%) |
| 75 Years and over | 0 (0.0%) | 0 (0.0%) |
Disability Class: Vision Difficulty
| Age Bracket | Male | Female |
| Under 5 Years | 0 (0.0%) | 0 (0.0%) |
| 5 to 17 Years | 0 (0.0%) | 0 (0.0%) |
| 18 to 34 Years | 0 (0.0%) | 0 (0.0%) |
| 35 to 64 Years | 0 (0.0%) | 0 (0.0%) |
| 65 to 74 Years | 0 (0.0%) | 0 (0.0%) |
| 75 Years and over | 0 (0.0%) | 0 (0.0%) |
Disability Class: Cognitive Difficulty

| Age Bracket | Male | Female |
| 5 to 17 Years | 0 (0.0%) | 0 (0.0%) |
| 18 to 34 Years | 0 (0.0%) | 0 (0.0%) |
| 35 to 64 Years | 0 (0.0%) | 0 (0.0%) |
| 65 to 74 Years | 0 (0.0%) | 0 (0.0%) |
| 75 Years and over | 0 (0.0%) | 0 (0.0%) |
Disability Class: Ambulatory Difficulty
| Age Bracket | Male | Female |
| 5 to 17 Years | 0 (0.0%) | 0 (0.0%) |
| 18 to 34 Years | 0 (0.0%) | 0 (0.0%) |
| 35 to 64 Years | 0 (0.0%) | 0 (0.0%) |
| 65 to 74 Years | 0 (0.0%) | 0 (0.0%) |
| 75 Years and over | 0 (0.0%) | 0 (0.0%) |
Disability Class: Self-Care Difficulty
| Age Bracket | Male | Female |
| 5 to 17 Years | 0 (0.0%) | 0 (0.0%) |
| 18 to 34 Years | 0 (0.0%) | 0 (0.0%) |
| 35 to 64 Years | 0 (0.0%) | 0 (0.0%) |
| 65 to 74 Years | 0 (0.0%) | 0 (0.0%) |
| 75 Years and over | 0 (0.0%) | 0 (0.0%) |
Technology Access in Bridger
Computing Device Access in Bridger
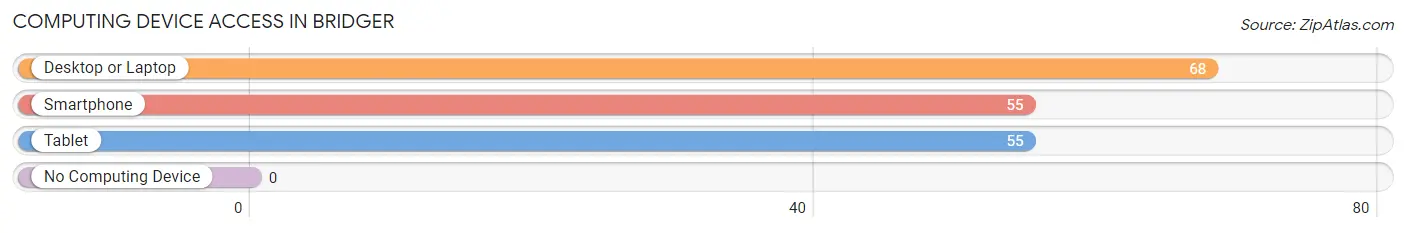
| Device Type | # Households | % Households |
| Desktop or Laptop | 68 | 100.0% |
| Smartphone | 55 | 80.9% |
| Tablet | 55 | 80.9% |
| No Computing Device | 0 | 0.0% |
| Total | 68 | 100.0% |
Internet Access in Bridger
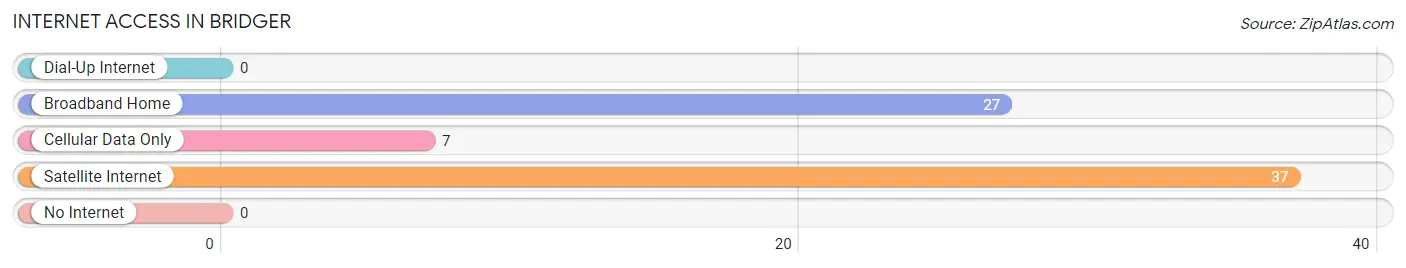
| Internet Type | # Households | % Households |
| Dial-Up Internet | 0 | 0.0% |
| Broadband Home | 27 | 39.7% |
| Cellular Data Only | 7 | 10.3% |
| Satellite Internet | 37 | 54.4% |
| No Internet | 0 | 0.0% |
| Total | 68 | 100.0% |
Bridger Summary
Bridger, Montana is a small town located in Carbon County, Montana. It is situated in the foothills of the Beartooth Mountains, approximately 20 miles south of Red Lodge. The town was founded in 1882 by the Bridger Land and Cattle Company, and was named after the famous mountain man, Jim Bridger. The town has a population of approximately 500 people, and is a popular tourist destination due to its proximity to Yellowstone National Park.
Geography
Bridger is located in the foothills of the Beartooth Mountains, at an elevation of 4,890 feet. The town is situated in a valley surrounded by mountains, and is located approximately 20 miles south of Red Lodge. The town is located in Carbon County, and is bordered by the Stillwater River to the east and the Yellowstone River to the west. The town is located in a semi-arid climate, with hot summers and cold winters.
Economy
Bridger’s economy is largely based on tourism, as the town is located close to Yellowstone National Park. The town is also home to several small businesses, including a grocery store, a hardware store, and a few restaurants. The town is also home to a small ski resort, which attracts visitors from all over the region.
Demographics
As of the 2010 census, the population of Bridger was 498 people. The racial makeup of the town was 97.2% White, 0.2% African American, 0.4% Native American, 0.2% Asian, 0.2% from other races, and 1.9% from two or more races. The median age of the population was 44.7 years, and the median household income was $37,500.
History
Bridger was founded in 1882 by the Bridger Land and Cattle Company. The town was named after the famous mountain man, Jim Bridger. The town was originally a small ranching community, and was home to several small businesses. In the early 1900s, the town began to attract tourists due to its proximity to Yellowstone National Park. The town was incorporated in 1909, and has remained a small, rural community ever since.
Bridger is a small town with a rich history and a unique culture. The town is a popular tourist destination due to its proximity to Yellowstone National Park, and is home to several small businesses. The town has a population of approximately 500 people, and is located in Carbon County, Montana. The town is situated in the foothills of the Beartooth Mountains, and is home to a small ski resort. The town has a semi-arid climate, with hot summers and cold winters. Bridger’s economy is largely based on tourism, and the town is home to several small businesses. The racial makeup of the town is 97.2% White, 0.2% African American, 0.4% Native American, 0.2% Asian, 0.2% from other races, and 1.9% from two or more races. The median age of the population is 44.7 years, and the median household income is $37,500.
Common Questions
What is Per Capita Income in Bridger?
Per Capita income in Bridger is $108,141.
What is the Median Family Income in Bridger?
Median Family Income in Bridger is $130,583.
What is the Median Household income in Bridger?
Median Household Income in Bridger is $116,818.
What is Inequality or Gini Index in Bridger?
Inequality or Gini Index in Bridger is 0.54.
What is the Total Population of Bridger?
Total Population of Bridger is 169.
What is the Total Male Population of Bridger?
Total Male Population of Bridger is 105.
What is the Total Female Population of Bridger?
Total Female Population of Bridger is 64.
What is the Ratio of Males per 100 Females in Bridger?
There are 164.06 Males per 100 Females in Bridger.
What is the Ratio of Females per 100 Males in Bridger?
There are 60.95 Females per 100 Males in Bridger.
What is the Median Population Age in Bridger?
Median Population Age in Bridger is 38.5 Years.
What is the Average Family Size in Bridger
Average Family Size in Bridger is 3.5 People.
What is the Average Household Size in Bridger
Average Household Size in Bridger is 2.5 People.
How Large is the Labor Force in Bridger?
There are 108 People in the Labor Forcein in Bridger.
What is the Percentage of People in the Labor Force in Bridger?
77.7% of People are in the Labor Force in Bridger.